


Urban Quality of Life: A Systematic Literature Review
by
 , , and
Josana Gabriele Bolzan Wesz
1,* ,
,
Luciana Inês Gomes Miron
1,
Ioanni Delsante
2 and
Patricia Tzortzopoulos
2 1
Department of Architecture, Graduate Program in Urban and Regional Planning, Federal University of Rio Grande do Sul, Porto Alegre 90050-170, Brazil
2
School of Arts and Humanities, University of Huddersfield, Huddersfield HD1 3DH, UK
*
Author to whom correspondence should be addressed.
Urban Sci. 2023, 7(2), 56; https://doi.org/10.3390/urbansci7020056
Submission received: 4 April 2023
/
Revised: 15 May 2023
/
Accepted: 16 May 2023
/
Published: 18 May 2023
(This article belongs to the Topic Sustainable Built Environment)
Abstract
:The built environment has great influence over the sustainability of societies as well as over people’s quality of life. Quality of life (QoL) is a broad concept that has different definitions across diverse bodies of knowledge. The social–cultural environment and the characteristics of the built environment influence people’s perception of QoL. This study aims to identify and analyse the factors that impact QoL and sustainable development in the urban context. A systematic literature review was developed to understand QoL concepts and to identify urban indicators that contribute to the multidimensional evaluation of urban QoL. The results include (1) a holistic overview of QoL concepts and indicators; (2) the proposal of a holistic urban QoL concept; (3) the identification of urban QoL dimensions and indicators that contribute to urban QoL evaluation. The main contribution of this study is its discussion of the multidimensional nature of QoL, including objective and subjective dimensions.
1. Introduction
Since the 1970s, global concerns with the environment have increased, especially due to the accelerated urbanisation of cities and their growing socio-environmental problems [1] (p. 2). The global urban population was larger than the rural population for the first time in 2008 [2]. The New Urban Agenda states that urbanisation should promote cities that are environmentally sustainable, resilient, socially inclusive, safe, and economically productive [2]. The Agenda 2030 includes Sustainable Development Goal 11, which is to “make cities and human settlements inclusive, safe, resilient and sustainable”, and it recognises that sustainable urban development and management are crucial to people’s QoL [3]. Well-managed urbanisation fosters social and economic advancement and improved QoL for all [2].
Therefore, monitoring and evaluating urban performance through indicators is fundamental to help improve QoL in urban areas [4] (p. 64). However, QoL is generally evaluated through quantitative measures (i.e., an objective dimension) [5] (p. 277). The literature highlights the need to also adopt qualitative approaches, investigating, for instance, people’s satisfaction with personal relationships and self-realisation (i.e., a subjective dimension), which goes beyond the material conditions of life [5] (p. 276). Thus, appropriate QoL measures need to include a multidimensional range of indicators.
QoL has been the focus of many studies. However, there is no consensus in the literature on its definition [6]. A number of studies discuss this conceptual variation [7] (p. 51). Historically, the concept of QoL is linked to the ideas of social well-being, environmental quality, poverty, social inequality, social exclusion, social vulnerability, sustainable development, and sustainability [1] (p. 2). Consequently, QoL indicators should be formulated based on these areas [1] (p. 2).
Furthermore, there are scant systematic literature reviews on QoL in the urban context. Some of the few existing studies include that of Najafpour, Bigdeli, Lamit, and Fitry [8], who provide an overview on neighbourhoods’ QoL criteria, highlighting security as a critical issue to improve a neighbourhood’s QoL. The study indicates that urban sustainability assessments lack a unifying frame, and that they could be better aligned with common sustainability principles. The SLR presented by Pineo et al. [9] focuses on measuring the urban environment’s impact on health and proposes a taxonomy of urban health indicator tools. It demonstrates the importance of considering users’ needs to ensure indicators can be used by built environment practitioners. The aforementioned studies, however, do not present a unified concept of urban QoL, and they also lack an in-depth evaluation of the assessment methods/tools that were used. Additionally, local governments have come under increased pressure to collect and monitor data in connection with urban planning and the environment. Hence, there is a need to propose public policies that can support decision-making [2].
This study aims to identify and analyse the factors that impact QoL and sustainable development in the urban context. A systematic literature review (SLR) was developed to understand QoL concepts and to identify urban indicators that contribute to the multidimensional evaluation of urban QoL. This SLR review addressed the following research question: How can quality of life be assessed through urban indicators? This paper is structured as follows. In the Section 2, the research method is outlined. In the Section 3, the results of the SLR are presented. The Section 4 presents discussions, highlighting the concept and evaluation of urban QoL. Finally, a set of urban QoL indicators are proposed.
2. Method
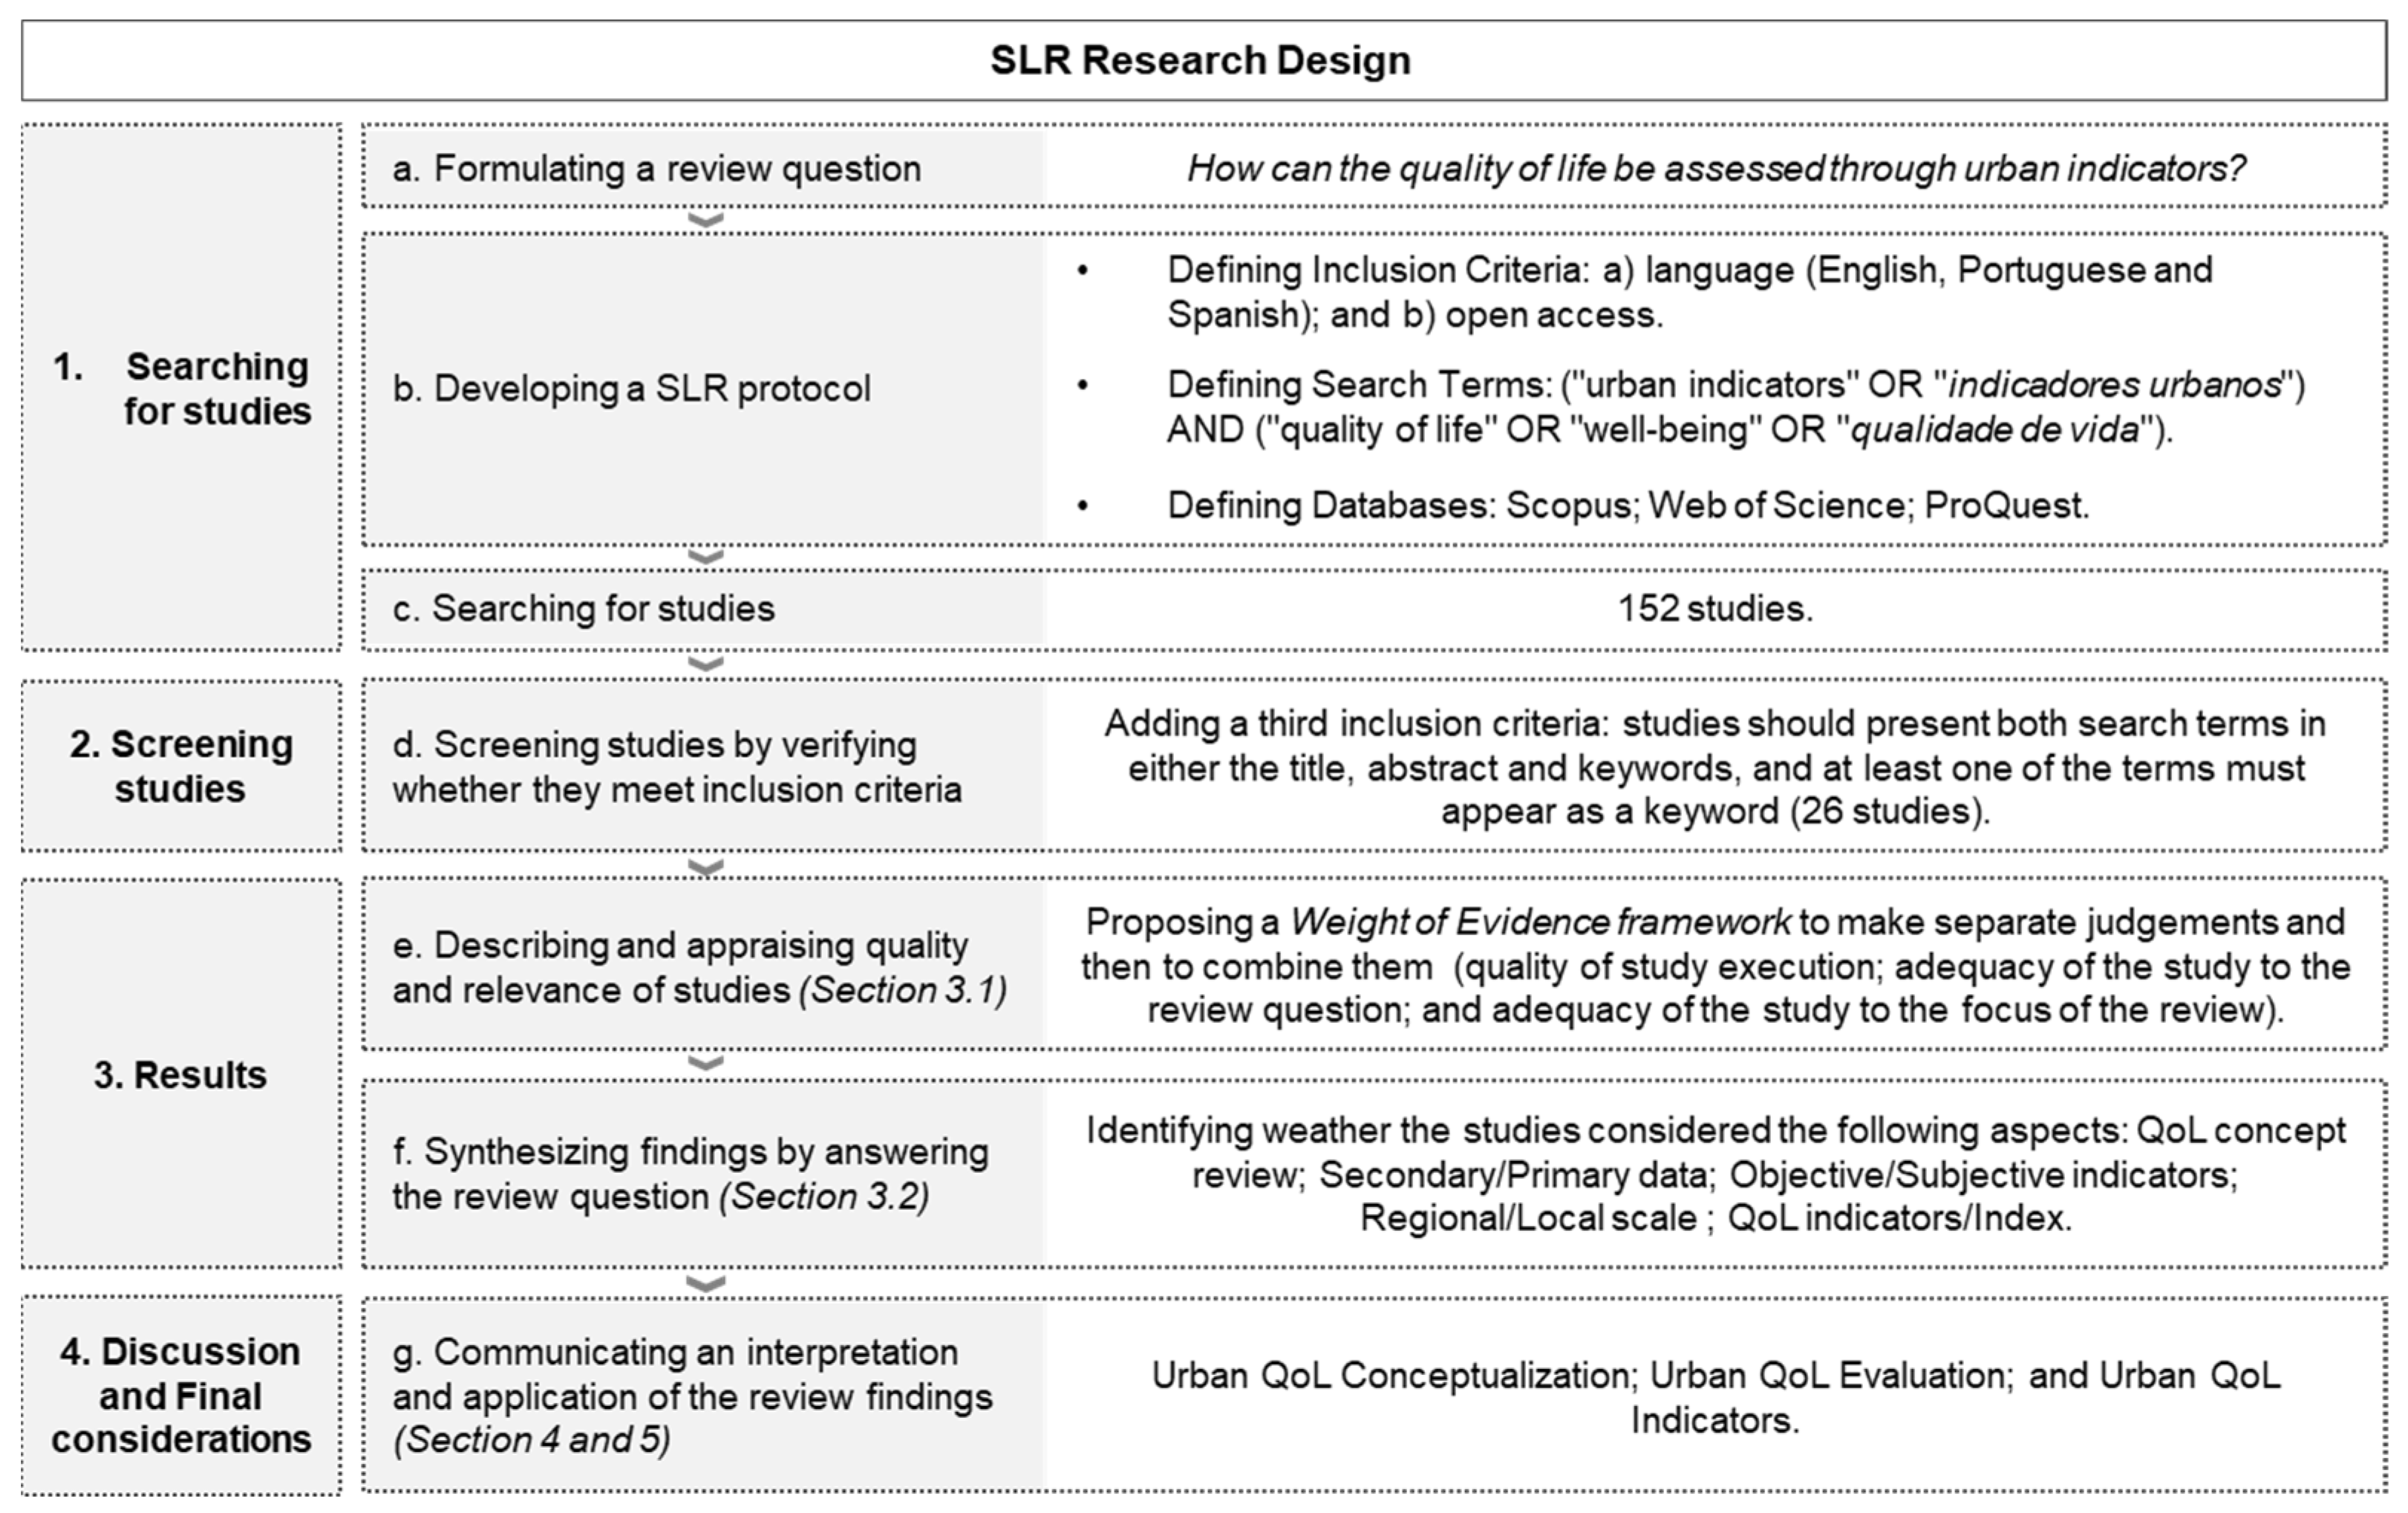
The systematic literature review (SLR) is a method of locating, assessing, and synthesising evidence [10]. It is used to aggregate the results of existing relevant studies around a specific research question. The SLR follows an explicit and planned method and should be accurate, replicable, and updatable [11] (p. 142). It requires judgements of the quality and relevance of the research evidence presented, which are based on specific criteria and purposes [12]. Figure 1 presents the SLR research design adopted here, which is based on the SLR stages proposed by Gough [12]. The steps undertaken in this research are described below.
The review started with the proposal of a SLR protocol adapted from Dresch et al. [11] (p. 155). It includes the SLR question, expected findings, inclusion criteria, search terms, and databases to be used in the search. The search terms used in three databases (Scopus; Web of Science; ProQuest) were: (“urban indicators” OR “indicadores urbanos”) AND (“quality of life” OR “well-being” OR “qualidade de vida”). The databases were chosen according to criteria of breadth of content and existing research on QoL. The studies were selected if they (a) were written in one of the following languages: English, Portuguese, or Spanish, and if they (b) were open-access.
The searching for studies stage included the search for relevant papers. In the first round, 152 papers were identified (Scopus: 21; Web of Science: 15; ProQuest: 116).
In the screening studies stage, abstracts were analysed. Many of the 152 studies were from the health area. Hence, a third inclusion criterion was used: (c) studies should present the search terms in the title, abstract, and keywords, and at least one of the terms must appear as a keyword. In this second round, 37 papers were identified (Scopus: 12; Web of Science: 11; ProQuest: 14), but some were duplicates. Hence, 26 studies were included in this SLR, including 21 papers in English, 1 in Portuguese, and 4 in Spanish. Additional studies, which were referenced in the studies identified in the SLR, were also included [7,13,14,15,16].
In the results stage, the quality and relevance assessment of the papers was carried out. A Weight of Evidence framework was used to make judgements (as suggested by Gough [12]). These were: (a) Weight of Evidence A: a generic judgement of methodological soundness made by analysing whether the proposed method meets the standards required by the subject of study, whether the study rigorously followed the method, and whether the results are based on facts and data; (b) Weight of Evidence B: adequacy of the study to the SLR question as assessed by verifying the relevance of the study (subject and an appropriate method) to the review question; (c) Weight of Evidence C: adequacy of the study to the focus of the SLR as assessed by verifying whether the study was performed in a similar context to that defined by the review; (d) Weight of Evidence D: overall quality assessment, which is based on the three previous items (A, B, and C).
During the SLR, some emergent criteria can be identified. As this SLR aims to understand the different ways of evaluating QoL in a broad way and not limited to a specific context (C), the following emergent criterion was proposed: “A and/or B categories of analysis, but C, could lower the overall quality (D)”. Thus, criteria A and B defined the studies’ overall quality assessment.
During the synthesis of findings, studies were identified considering whether a QoL concept was proposed/reviewed; whether primary or secondary data were used in QoL assessment/indicators; whether objective and subjective indicators were adopted; whether regional and local scales were considered; whether QoL indicators and QoL indices were proposed.
3. Results
3.1. SLR Results: Assessment of Quality and Relevance of the Studies
The five highest quality studies identified according to criterion (D), shown in Table 1, are briefly described as follows [20,21,22,23,24,25,26,27,28,29,30,31,32,33,34,35,36,37,38,39,40,41,42,43].
Sawicki and Flynn [24] discussed the importance of proposing local indicators as a means of identifying neighbourhood improvement opportunities and designing policies to address them, considering people’s perceptions (subjective dimension). The study of Martínez [22] discusses QoL conditions and distributions of opportunities in the urban space. Based on a case study in Argentina, it combined the use of urban indicators and Geographical Information Systems (GIS) as a valid diagnostic to generate policy-relevant information on multidimensional aspects of spatial inequalities. McAslan et al. [23] proposed a QoL index based on economic, social, environmental, and emotional well-being indicators. Their research collected objective and subjective QoL indicators (through household surveys) in eight cities on the US–Mexico border region.
Gomes et al. [21] reviewed the concept of QoL, highlighting the importance of developing QoL indicators that can be measured at a local urban scale both in the objective (i.e., a top-down approach) and subjective dimension (the perception of users at the local level in a bottom-up approach). The study of Berhe et al. [20], carried out in Ethiopia, discusses QoL indicators related to housing, access to public services, and family income. It used the welfare model proposed by Zapf [16] (p. 769), which combines objective living conditions and subjective perceptions of living conditions.
Table 1 also shows the foci and the assessments of quality and relevance of the 26 studies, which were classified as low, medium, or high according to Weights of Evidence A, B, C and D as presented in Section 2. Some findings are as follows: (a) only five studies (19%) achieved high quality in a quality criterion (D), and thus, these are the most relevant studies in this SLR [20,21,22,23,24]; (b) 42% of the studies have high methodological soundness (A); (c) 35% of the studies had adequacy to the review question (B), and 38.5% had high alignment with the focus/context of this study (C). The information in Table 1 enabled the analysis presented as follows.
3.2. The Urban Quality of Life (QoL) Concept
The QoL concept is discussed in five of the 26 papers (19%) analysed. Past research includes a variety of approaches to conceptualise urban QoL. Abbate et al. [5] (p. 276) points to the importance of QoL in social science to summarise the complex economic, social, environmental, and relational problems characterising modern society [5] (p. 276). It discusses that QoL is related, on one hand, to material and non-material aspects, and, on the other hand, to individual and collective living conditions [5] (p. 276). It discusses the evolution of a political debate that moves from a purely economic growth focus to an increased concern with social changes. This points not only to the need of indicators to identify satisfaction levels towards the material conditions of life, but also to non-material ones, such as relationships, achievements, expectations, and needs [5] (p. 277).
Berhe et al. [20] considered that QoL combines both objective living conditions (existent secondary data) and the subjective perception of living conditions (the level of satisfaction of households). The study proposes seven QoL domains (housing, access to public services, family income, access to green space, safety, family life, and neighbourhood satisfaction) and investigates the reasons for inconsistencies (mismatches) between objective and subjective dimensions in the city of Mekelle, Ethiopia. Likewise, Gomes et al. [21] (p. 577) defined QoL as an individual perception of the socio-territorial environment that should consider the subjective (primary data on the perception of users in a bottom-up approach) and objective (secondary data in a top-down approach) dimensions, including individual and collective preferences and behaviours related to the urban environment. This highlights the importance of QoL indicators that can measure both dimensions, especially at the local scale of analysis.
According to Hernández Aja [29] (p. 87), urban QoL is the embodiment of QoL in the urban space, which can be considered a social construct that includes three basic dimensions: environmental quality, well-being (individual satisfaction), and identity (appropriation and participation). It argues that urban QoL links with sustainability, highlighting the importance of renovating and conserving existing neighbourhoods rather than creating new ones [29] (p. 85). It also argues that urban QoL should include environmental aspects and their relationship with human needs [29] (p. 85). Despite not presenting a QoL concept, Labonte et al. [31] (p. 2) made a brief review of urban QoL, highlighting the importance of identifying well-being in the urban space, especially by analysing social phenomena and the attractiveness of places, aiming to give feedback to urban policies. These studies, and the QoL concepts they propose, are summarised in Table 2.
All studies in Table 2 highlight the importance of considering both objective and subjective indicators in assessing QoL. Nonetheless, the lack of a clear definition has led to the interchangeable use of the term QoL with other concepts, such as well-being, welfare, way of life, life satisfaction, and happiness [44] (p. 136). As presented in the extensive study of Sirgy et al. [45] (p. 367), which traces the history of the social indicators and QoL research, early QoL research already connected the concept with the standard of living conditions and people’s satisfaction with them.
Cummins [15] also believes that QoL encompasses both objective and subjective dimensions, each including aspects such as material well-being, health, safety, community (a sense of belonging to one’s local community), productivity, intimacy (relationships), and emotional well-being. The objective dimension, which includes culturally relevant measures of objective well-being [15], is related to facts exogenous to a person’s life (external conditions) [44] and is usually expressed with quantitative data from statistics that evaluate concrete aspects of QoL [38]. Such concrete aspects include the environmental, economic, or social conditions of a specific place of analysis [38]. The subjective dimension comprises the level of satisfaction with these domains, which are weighted by their importance to the individual [15], and is the endogenous perception a person has of these facts and of herself/himself (internal mechanism) [44].
Dissart and Deller [44] reviewed the philosophy, sociology, economics, health, marketing, and management literature for QoL concepts and methods. They added that the objective dimension is related to the exogenous facts of someone’s life, and that the subjective dimension is related to the endogenous perception of these factors. Evans [46] (p. 53) defined objective QoL as an individual’s standard of living represented by verifiable conditions inherent in the given cultural unit, and subjective QoL was defined as the degree to which the individual’s life is perceived to match implicit or explicit internal standards.
Diverse studies argue that QoL is a complex multidimensional concept, and as such, a multidimensional structure is advantageous when measuring it [44,47,48,49,50,51,52]. Hence, the concept of QoL is broader than material aspects, economic production, or living standards: it is a multidimensional concept, as it includes a variety of factors that people value in life [6] (p. 766). The subjective perceptions and judgements of quality for diverse aspects of the built environment are related to individual and collective senses of value [53] (p. 14).
Recent studies point to users’ perception of value as important for the evaluation of urban QoL at the neighbourhood scale [54,55,56,57]. Value perception can be understood as a comparative assessment between benefits, which includes satisfaction in use, and inconveniences (sacrifices) perceived in relation to the built environment [58]. The multidimensional QoL concept is thereby closely aligned with the concepts of perceived value, as highlighted by Rooke et al. [59] (p. 16): “Objective and subjective, rather than being mutually exclusive categories, are more like points on a continuum in which objectivity is socially established from the stream of our perceptions”. Additionally, as pointed out by Thomson et al. [58] (p. 337), value can be subjective if it remains internalised within an individual or an organisation, or it can be objective if it is expressed and negotiated in a common language (universal metrics) by individuals and organisations within a project.
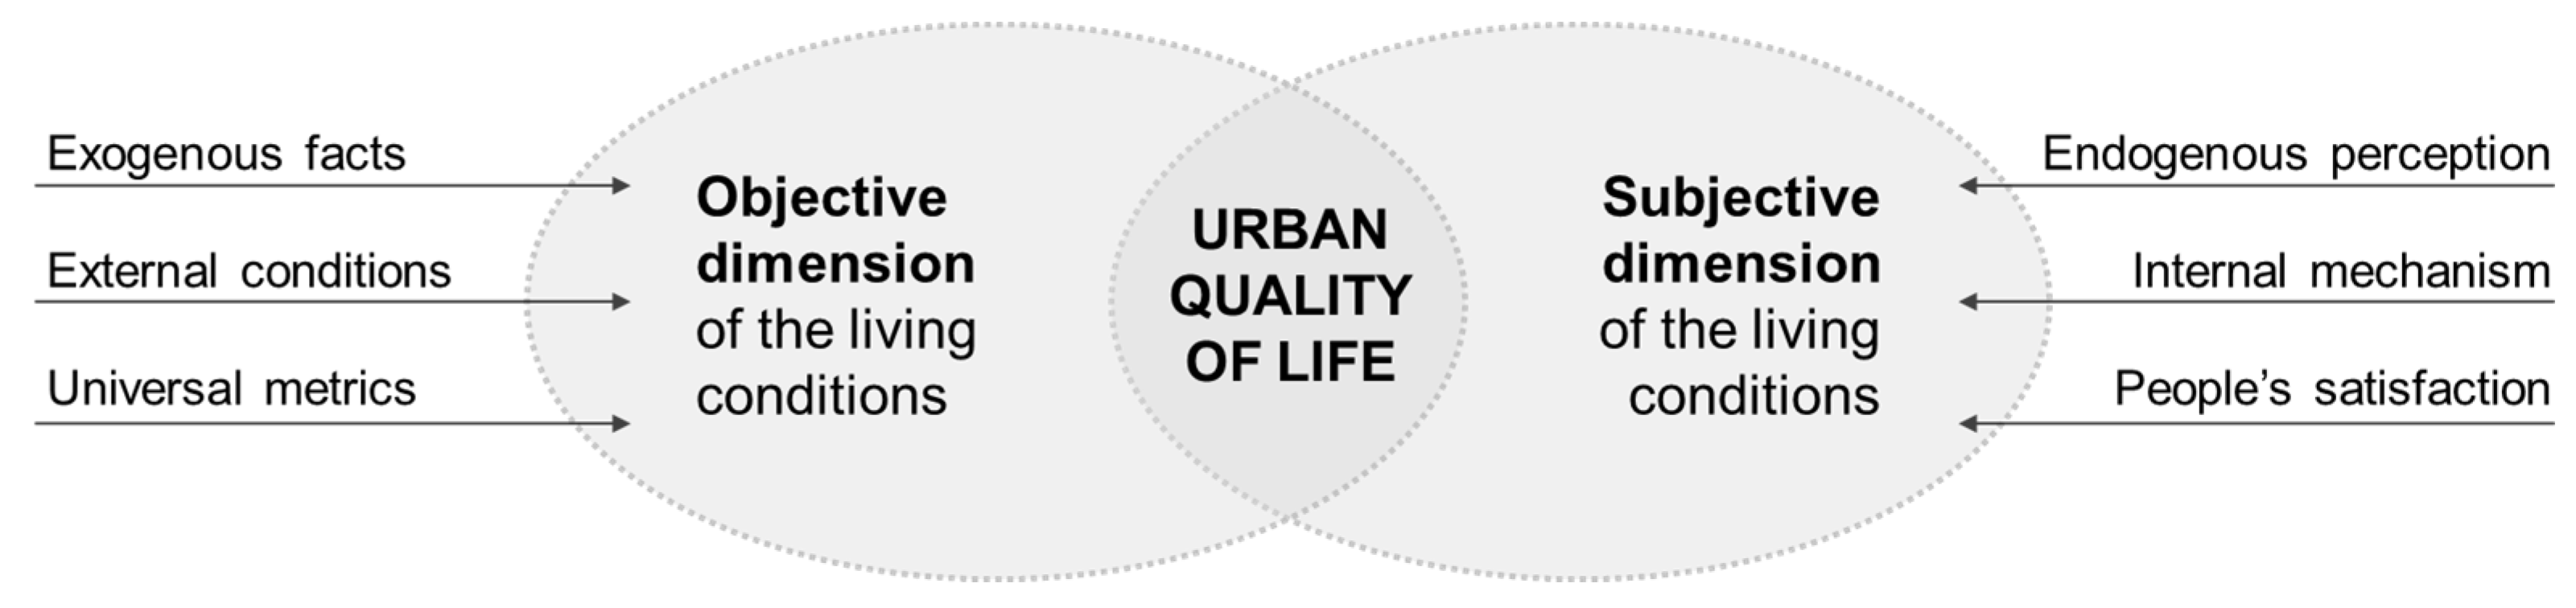
Thus, based on this relation with perceived value in terms of multidimensional urban QoL definition, it can be inferred that:
- Objective urban QoL is related to universal metrics expressed and understood by the individuals of a society–the exogenous living conditions.
- Subjective urban QoL is related to the endogenous perception of these living conditions (level of satisfaction).
These universal metrics can be expressed by QoL indicators, which should be based both on objectively observable facts and on people’s own subjective assessments of their life [60]. Cultural norms and ranges may provide a standard of reference [7] (p. 59). Therefore, an individual’s QoL depends on both objective and subjective dimensions [44] (p. 136). Table 3 presents the concepts identified in the literature related to urban QoL, including objective and subjective dimensions.
Based on the above, this study considers that urban QoL is multidimensional, and that it includes material, non-material, individual and collective life conditions, the objective dimension of living conditions (indicators based on universal metrics), and the subjective dimension of these living conditions (people’s satisfaction), as shown in Figure 2. Furthermore, the objective and subjective dimensions require different assessment methods, as they are different perspectives of the evaluation of living conditions (external and internal evaluations). All dimensions are considered equally relevant in the assessment of urban QoL.
4. Discussion
4.1. Existing Models to Assess Urban Quality of Life (QoL)
Urban QoL refers to the QoL in the living environment, considering the interaction between people and the built environment [61] (p. 299). Urban indicators, in turn, can be defined as parameters used to describe and communicate complex realities regarding individual features and the environmental system [62] (p. 8). Indicators should provide reliable information [63]. According to Diener and Suh [49] (p. 192), social indicators provide societal measures that reflect people’s objective circumstances in a given cultural or geographic unit. The study of Sapena et al. [17] in 31 cities of North Rhine-Westphalia in Germany shows the interrelation of urban spatial structure with QoL dimensions. Its findings show that socio-economic variables (such as education, health, living conditions, labour, and transport) can be partially explained by urban spatial pattern metrics extracted from urban structural types and land covers, which reflect the social and economic indicators of their inhabitants.
As presented in Section 3.2., many studies show the importance of considering both objective and subjective approaches to assess QoL [5,13,15,20,21,23,28,29,36,38,44]. However, urban policies rarely include subjective indicators in the urban planning process and disregard people’s wishes and requirements, and this can lead to shortcomings in decision-making [36]. The study of Mouratidis (2021) [18] provides a framework in which pathways linking the built environment to subjective well-being are organised into seven domains (travel, leisure, work, social relationships, residential well-being, emotional responses, and health). It presents an overview of strategies for improving subjective well-being through urban planning. Conversely, the study of McCrea, Shyy, and Stimson [64] in South East Queensland, Australia, indicates that little work has been done to link objective indicators of the urban environment with subjective urban QoL. Its results show that relationships between objective and subjective indicators of urban QoL can be weak.
Satisfaction should be considered as reliable and valid data, although “the nature of the underlying construct of subjective experience can only ever be inferred” [15]. In addition, QoL can change over time, and it is influenced by external elements such as social, economic, and political variables. Thus, it is important to consider these three elements simultaneously to assess QoL: objective living conditions, satisfaction with living conditions, and the importance of these living conditions in people’s lives [7].
Therefore, a bottom-up approach seems appropriate to evaluate QoL in urban environments [21]. Becerik-Gerber et al. [19] suggested that human–building interaction research, which aims to understand how the built environment affects human experiences, could support the area of urban QoL by improving physical and psychological health, providing higher levels of independence and improved social relationships, environmental factors, and personal beliefs. Residents’ perceptions of the neighbourhood are important indicators of well-being, and they should be considered together with objective indicators that can be obtained from census results and other administrative data sources [28].
Considering these together is problematic both in theory and in practice, especially in relation to the mismatches identified between objective and subjective indicators [13] (p. 767). Wolfgang Zapf [16] (p. 769–771) proposed a welfare model that comprises both objective living conditions and the subjective perception of these living conditions. The combination of both can generate two consistent welfare types: (a) well-being, referring to the person in good objective and subjective conditions; (b) deprivation, referring to the person in bad objective and subjective conditions. It also can generate two inconsistent welfare types: (c) dissonance, referring to the person whose perceived QoL does not correspond to their rather good objective living conditions, that is, a “dissatisfaction dilemma”; (d) resignation, referring to the person whose unfavourable objective living conditions are not subjectively rated equally unfavourably, that is, a “satisfaction paradox”. Table 4 presents these four welfare types proposed by Zapf [16].
The mismatches between objective and subjective indicators have been discussed [5,15,41,65]. A challenging aspect, which was highlighted by Tovar and Bourdeau-Lepage [41], is that subjective perception may lead to overestimating satisfaction in relation to a real and objective situation because individuals tend to adapt their preferences to what they think they can obtain and therefore may be satisfied with lower achievements. Moreover, the worse the living conditions are, the less people can express what they would like in a better situation because they tend to have their peers as a reference group [65]. People tend to maintain normal levels of subjective QoL even in the face of adverse environmental conditions, and this can explain possible low correlations between objective and subjective QoL indicators [15]. However, although humans have a high adaptive capacity, once the adaptation limit is exceeded, poor objective living conditions begin to negatively influence QoL [15].
Table 5 summarises methods to assess QoL. Of the 26 studies considered in the SLR, 15 proposed QoL indicators. Secondary data are considered by 54% (14/26) of the studies, whereas 31% (8/26) of the studies included primary data, especially through interviews and surveys. Objective indicators were included in most existing studies (81%—21/26) and were obtained from census and other administrative data sources. Subjective indicators were included in 54% (14/26) of studies, and two other studies point to the non-identification of subjective indicators as an important limitation. Both objective and subjective indicators were considered in 42% (11/26) of the papers analysed. The unit of analysis “regional scale” was included in 31% (8/26) of the studies, whereas “local scale” was addressed in 46% (12/26) of the papers. QoL indicators were proposed in 58% (15/26) of the studies, whereas QoL index was proposed in 11% (3/26).
4.2. Urban Quality of Life (QoL) Indicators
The International Organisation for Standardisation (ISO) Technical Committee for the Sustainable Development of Communities is developing a new series of international standards for an integrated approach to sustainable development [2] (p. 43). Among them is the International Standard ISO 37120:2018 Sustainable cities and communities—Indicators for city services and quality of life [66] (second edition: 2018; first edition: 2014), the first international standard for standardised city indicators (104 in total) for urban services and QoL. It includes economy, education, energy, the environment and climate change, finance, governance, health, housing, population and social conditions, recreation, safety, solid waste, sport and culture, telecommunications, transportation, urban/local agriculture and food security, urban planning, wastewater, and water. These indicators can be used to measure the performance of city services and QoL and to compare different cities [66] (p. 10).
Table 6 shows themes (19) and indicators of ISO 37120:2018 as well as the number of core (total of 45) and supporting indicators (total of 59). This standard adopts a uniform approach to what is measured and how measurement is performed. However, its application depends on whether its indicators are compatible with the legislation of different countries and whether data is available.
Although ISO 37120 may represent a positive step for standardised QoL assessment, it does not consider subjective indicators. Themes related to social–cultural aspects, which have a great effect on urban QoL, were added in its second edition (sport and culture), as proposed in recent research. Social–cultural indicators could include the number of free cultural events, the number of cultural activities and facilities (international conferences, fairs, exhibitions held per year, etc.), the number of workers in the culture market [19,29,36,38], the number of public libraries and museums [38], and the percentage of budget devoted to cultural activities [32]. Furthermore, Marsal-Llacuna [32] recommend revising ISO 37120 [66] to include ten social–cultural indicators such as “municipal budget to protect vulnerable groups” and “to promote cultural activities” in order to better assess the social sustainability of cities. The second edition of ISO 37120:2018 added the following sports and culture theme indicators: number of cultural institutions and sporting facilities per 100,000 population (core indicator), percentage of municipal budget allocated to cultural and sporting facilities (supporting indicator), and annual number of cultural events per 100,000 population (e.g., exhibitions, festivals, and concerts) (supporting indicator).
Table 7 presents the QoL themes identified in the studies included in the SLR.
Based on the above studies, the most widely considered indicators were identified and grouped by general themes, which were also based on the ISO 37120 [66]. Table 8 presents QoL themes (economy, education, governance, transportation, health, urban planning, shelter/housing, culture, and the environment) and indicators in order of relevance.
Economy (14/15 studies) was the most studied theme. It includes unemployment rate, income, and retail sale area per capita. Education (12/15) includes the number of schools and the percentage of the school-aged population enrolled in school. Governance (12/15) includes voter participation and the possibility of holding political, religious, and artistic demonstrations, which require the existence of formal spaces for popular participation. Transportation (11/15) includes public transport availability and travel time. Health (11/15) includes access to health centres (in metres) and infant mortality. Urban planning (10/15) includes accessibility to green areas, heritage conservation, and quality of urban space (existence of urban facilities/equipment). Shelter (10/15) includes housing affordability and conditions and overcrowding. Culture (9/15) includes the number of free cultural events and the number of cultural facilities. Environment (8/16) includes air quality and noise pollution. Safety (8/16) includes the number of crimes.
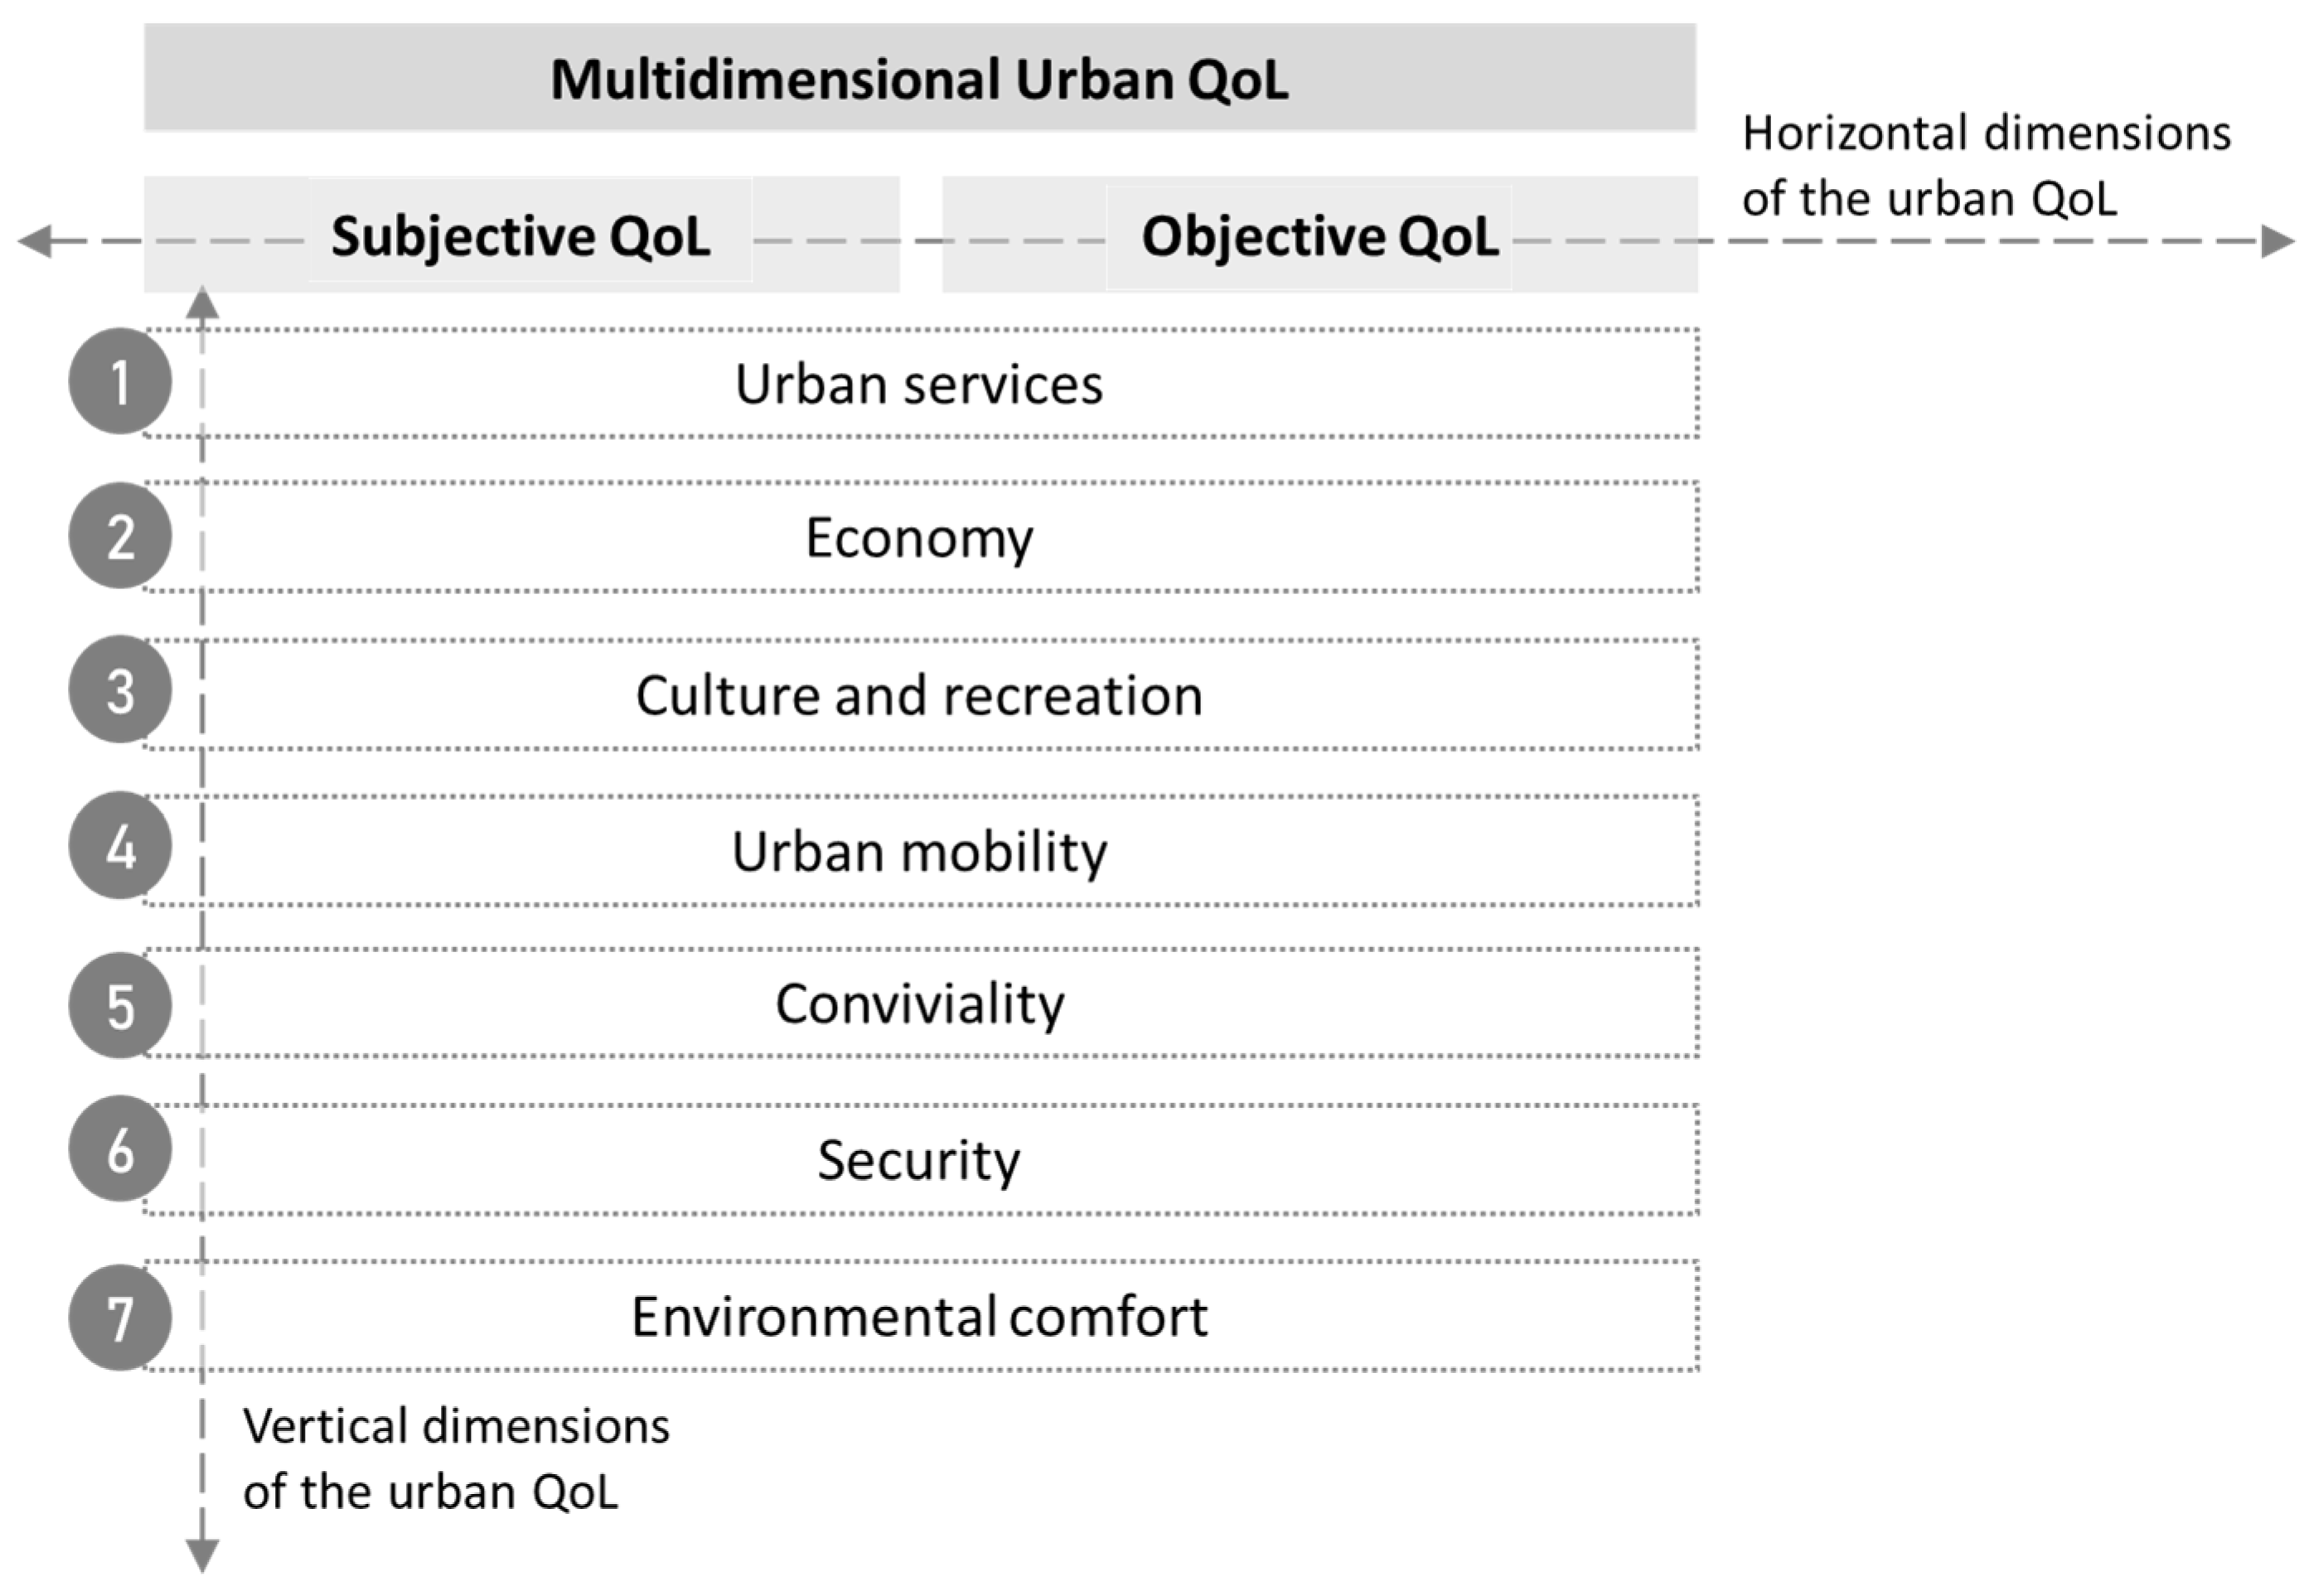
Finally, multidimensional urban QoL encompasses horizontal dimensions (objective and subjective dimensions) and vertical dimensions (themes), which include relevant aspects of the living conditions that should be objectively and subjectively assessed, as shown in Figure 3.
Therefore, based on the literature review and on the ISO 37120 standard [66], which helped to identify the main dimensions used in the assessment of QoL, the following seven vertical dimensions can be highlighted as relevant when assessing multidimensional urban QoL:
- Urban services: solid waste, water and sanitation, energy, telecommunications and innovation, health, and education.
- Economy: employment, cost of living, and economic and tourist activities.
- Culture and recreation: green areas, opportunities to take part in leisure, sports, and cultural activities.
- Urban mobility: means of transport and ease of displacement.
- Conviviality: respect and coexistence between people, and participation in community activities.
- Security: safety, crime, policing, and public lighting.
- Environmental comfort: noise and air pollution, climate comfort, cleanliness, and wastewater.
These are proposed in this study as vertical dimensions of urban QoL. The vertical dimensions should be evaluated through the horizontal dimensions, that is, they should be objectively and subjectively evaluated.
Table 9 presents urban QoL indicators proposed in this study. These can guide not only practitioners, policymakers, and decisionmakers who work on urban planning issues, but also researchers and students.
5. Conclusions
A systematic literature review (SLR) was carried out to understand QoL concepts and to identify dimensions and urban indicators that contribute to the multidimensional evaluation of urban QoL. This review addresses the following research question: How can quality of life be assessed through urban indicators?
In the SLR, multiple definitions for QoL were identified. Various studies argue that QoL is a multidimensional concept, and, as it is a complex concept, a multidimensional structure is advantageous when measuring it [44,47,48,49,50,51,52]. Urban QoL includes material and non-material conditions, individual and collective life conditions, the objective dimension of these living conditions (indicators based on universal metrics), and the subjective dimension of these living conditions (people’s satisfaction). We here propose that:
- Objective urban QoL is related to universal metrics understood by the individuals of a society (e.g., exogenous living conditions).
- Subjective urban QoL is related to the endogenous perception of these living conditions by people (e.g., level of satisfaction).
These universal metrics can be expressed with QoL indicators, which should be based both on objectively observable facts and on people’s own subjective assessments of their life [60].
This study proposes that urban QoL encompasses horizontal dimensions (objective and subjective dimensions) and vertical dimensions, including aspects of living conditions in urban spaces. Therefore, the objective and subjective dimensions have different assessment methods; they are different perspectives of the evaluation of living conditions (external and internal evaluations). All dimensions are considered equally relevant in urban QoL assessment. Thus, it is important to simultaneously assess these three elements to capture urban QoL: objective living conditions, satisfaction with living conditions, and the importance of these living conditions in people’s lives [7].
Another important finding is the seven QoL dimensions (vertical dimensions) proposed (see Section 4.2.): (1) urban services; (2) the economy; (3) culture and recreation; (4) urban mobility; (5) conviviality; (6) security; (7) environmental comfort. For each vertical dimension, six indicators of urban QoL were proposed (forty-two urban QoL indicators in total). However, vertical dimensions can vary according to the specific cultural aspects of each location to be analysed. This study points to the importance of the inclusion of indicators related to social–cultural aspects, which have a great effect on QoL, as important dimensions when assessing urban QoL.
The indicators identified are objective, subjective, or both. Many studies support that QoL encompasses both objective and subjective dimensions [5,13,15,20,21,23,28,29,36,38,44], each including various aspects of living conditions. The objective dimension comprises culturally relevant measures of objective living conditions [15] and is related to facts exogenous to a person’s life (external conditions) [44]. It is usually expressed in quantitative data that evaluate concrete aspects of QoL [38], which include the environmental, economic, or social conditions of a specific place of analysis [38]. The subjective dimension comprises the level of satisfaction with these domains, which are weighted by their importance to the individual [15], and is the endogenous perception a person has of these facts and of herself/himself (internal mechanism) [44]. It is mostly qualitative, including subjective interpretations of living conditions [38].
Finally, despite the large number of studies on QoL, challenges and limitations in QoL research can be highlighted. There is much discussion in the literature about the difficulty in defining QoL due to its complex nature. This may be related to its multidisciplinary nature but also to the fundamental influence of the place of analysis and the different characteristics between cities and countries. However, the continuous identification of dimensions and indicators, as well as the proposal of public policies that include the evaluation of QoL, seems fundamental to promote cities that are environmentally sustainable, resilient, socially inclusive, safe, and economically productive. Urban policies, plans, planning laws, and regulations should be developed and adjusted considering evidence-based knowledge on the links between cities and QoL.
Some limitations of the study can be highlighted: it does not present a global comparison among countries and cities, nor does it emphasise the difference between developed and developing countries. Likewise, it does not include the study of QoL in rural areas. Despite this, it is expected that the study can contribute to QoL research as well as to urban policy. Suggestions for future research are (a) to investigate the QoL literature in a global context, and to consider a global comparison among countries and cities; (b) to propose better defined and applicable QoL indicators and a QoL index, and to further investigate the possibility of establishing a scale of values to monitor these indicators (goals and indexes); (c) to investigate the reasons for mismatches between objective living conditions and people’s subjective perceptions of their living conditions.
Author Contributions
Conceptualisation, J.G.B.W.; method, J.G.B.W.; writing—original draft preparation, J.G.B.W.; writing—review and editing, J.G.B.W., L.I.G.M., I.D. and P.T. All authors have read and agreed to the published version of the manuscript.
Funding
This study was funded by the University of Huddersfield, by the Brazilian Federal Agency Coordination for the Improvement of Higher Education Personnel (Coordenação de Aperfeiçoamento de Pessoal de Nível Superior–CAPES—Process 88881.189280/2018-01), and by the Brazilian National Council for Scientific and Technological Development (Conselho Nacional de Desenvolvimento Científico e Tecnológico–CNPq—Process 152706/2022-4).
Data Availability Statement
Data is available and can be provided by the author.
Acknowledgments
The authors gratefully acknowledge the administrative and technical support given by the University of Huddersfield and by the Graduate Program in Urban and Regional Planning, Federal University of Rio Grande do Sul (UFRGS).
Conflicts of Interest
The authors declare no conflict of interest.
References
- Nahas, M.I.P.; Pereira, M.A.M.; de Avelar Esteves, O.; Gonçalves, É. Metodologia de construção do índice de qualidade de vida urbana dos municípios brasileiros (IQVU-BR). Anais 2016, 1–20. [Google Scholar]
- UN-Habitat. In World Cities Report 2016—Urbanization and Development: Emerging Futures; United Nations Human Settlements Programme: Nairobi, Kenya, 2016. [Google Scholar]
- United Nations Sustainable Development Goals. 17 Goals to Transform Our World: United Nations Sustainable Development 2015; United Nations Press: New York, NY, USA, 2015; Available online: https://sdgs.un.org/goals (accessed on 31 April 2023).
- Alibegović, D.J.; De Villa, Ž.K. The role of urban indicators in city management: A proposal for Croatian cities. Transit. Stud. Rev. 2008, 15, 63–80. [Google Scholar] [CrossRef]
- Abbate, R.; Giambalvo, O.; Milito, A.M. Service and life quality: The case of Palermo. Soc. Indic. Res. 2001, 54, 275–308. [Google Scholar] [CrossRef]
- Serag El Din, H.; Shalaby, A.; Farouh, H.E.; Elariane, S.A. Principles of urban quality of life for a neighborhood. HBRC J. 2013, 9, 86–92. [Google Scholar] [CrossRef]
- Felce, D.; Perry, J. Quality of life: Its definition and measurement. Res. Dev. Disabil. 1995, 16, 51–74. [Google Scholar] [CrossRef] [PubMed]
- Najafpour, H.; Bigdeli Rad, V.; Lamit, H.; Fitry, S.M. The Systematic Review on Quality of life in urban neighborhoods. Life Sci. J. 2014, 11, 355–364. [Google Scholar]
- Pineo, H.; Glonti, K.; Rutter, H.; Zimmermann, N.; Wilkinson, P.; Davies, M. Urban health indicator tools of the physical environment: A systematic review. J. Urban Health 2018, 95, 613–646. [Google Scholar] [CrossRef]
- Petticrew, M. Systematic reviews from astronomy to zoology: Myths and misconceptions. Bmj 2001, 322, 98–101. [Google Scholar] [CrossRef]
- Dresch, A.; Lacerda, D.P.; Júnior, J.A.V.A. Design Science Research: Método de Pesquisa Para Avanço da Ciência e Tecnologia; Bookman Editora: Porto Alegre, Brazil, 2015. [Google Scholar]
- Gough, D. Weight of evidence: A framework for the appraisal of the quality and relevance of evidence. Res. Pap. Educ. 2007, 22, 213–228. [Google Scholar] [CrossRef]
- Clark, N.M. Understanding individual and collective capacity to enhance quality of life. Health Educ. Behav. 2000, 27, 699–707. [Google Scholar] [CrossRef]
- Costanza, R.; Fisher, B.; Ali, S.; Beer, C.; Bond, L.; Boumans, R.; Danigelis, N.L.; Dickinson, J.; Elliott, C.; Farley, J.; et al. Quality of life: An approach integrating opportunities, human needs, and subjective well-being. Ecol. Econ. 2007, 61, 267–276. [Google Scholar] [CrossRef]
- Cummins, R.A. Objective and subjective quality of life: An interactive model. Soc. Indic. Res. 2000, 52, 55–72. [Google Scholar] [CrossRef]
- Zapf, W. Lebensbedingungen und Wahrgenommene Lebensqualität; Campus Verl.: Shippagan, NB, Canada, 1979; pp. 767–790. [Google Scholar]
- Sapena, M.; Wurm, M.; Taubenböck, H.; Tuia, D.; Ruiz, L.A. Estimating quality of life dimensions from urban spatial pattern metrics. Comput. Environ. Urban Syst. 2021, 85, 101549. [Google Scholar] [CrossRef]
- Mouratidis, K. Urban planning and quality of life: A review of pathways linking the built environment to subjective well-being. Cities 2021, 115, 103229. [Google Scholar] [CrossRef]
- Becerik-Gerber, B.; Lucas, G.; Aryal, A.; Awada, M.; Bergés, M.; Billington, S.L.; Boric-Lubecke, O.; Ghahramani, A.; Heydarian, A.; Jazizadeh, F.; et al. Ten questions concerning human-building interaction research for improving the quality of life. Build. Environ. 2022, 226, 109681. [Google Scholar] [CrossRef]
- Berhe, R.T.; Martinez, J.; Verplanke, J. Adaptation and dissonance in quality of life: A case study in Mekelle, Ethiopia. Soc. Indic. Res. 2014, 118, 535–554. [Google Scholar] [CrossRef]
- Gomes, M.C.S.; Pinto, M.L.R.; dos Santos, G.G. Quality of life: A reappraisal. Int. J. Sociol. Soc. Policy 2010, 30, 559–580. [Google Scholar] [CrossRef]
- Martínez, J. The use of GIS and indicators to monitor intra-urban inequalities. A case study in Rosario, Argentina. Habitat Int. 2009, 33, 387–396. [Google Scholar] [CrossRef]
- McAslan, D.; Prakash, M.; Pijawka, D.; Guhathakurta, S.; Sadalla, E. Measuring quality of life in border cities: The border observatory project in the US-Mexico border region. In Community Quality-of-Life Indicators: Best Cases; Springer: Dordrecht, The Netherlands, 2013; Volume VI, pp. 143–169. [Google Scholar]
- Sawicki, D.S.; Flynn, P. Neighborhood indicators: A review of the literature and an assessment of conceptual and methodological issues. J. Am. Plan. Assoc. 1996, 62, 165–183. [Google Scholar] [CrossRef]
- Archibugi, F. City effect and urban overload as program indicators of the regional policy. Soc. Indic. Res. 2001, 54, 209–230. [Google Scholar] [CrossRef]
- Bagstad, K.J.; Shammin, M.R. Can the Genuine Progress Indicator better inform sustainable regional progress?—A case study for Northeast Ohio. Ecol. Indic. 2012, 18, 330–341. [Google Scholar] [CrossRef]
- Bielinskas, V.; Burinskienė, M.; Podviezko, A. Choice of abandoned territories conversion scenario according to MCDA methods. J. Civ. Eng. Manag. 2018, 24, 79–92. [Google Scholar] [CrossRef]
- Coulton, C.J.; Korbin, J.E. Indicators of child well-being through a neighborhood lens. Soc. Indic. Res. 2007, 84, 349–361. [Google Scholar] [CrossRef]
- Hernández Aja, A. Calidad de vida y Medio Ambiente Urbano: Indicadores locales de sostenibilidad y calidad de vida urbana. Rev. Invi 2009, 24, 79–111. [Google Scholar] [CrossRef]
- Kaklauskas, A.; Zavadskas, E.K.; Radzeviciene, A.; Ubarte, I.; Podviezko, A.; Podvezko, V.; Kuzminske, A.; Banaitis, A.; Binkyte, A.; Bucinskas, V. Quality of city life multiple criteria analysis. Cities 2018, 72, 82–93. [Google Scholar] [CrossRef]
- Labonte, R.; Abonyi, S.; Randall, J.E.; Williams, A.M.; Carr, T.; Muhajarine, N.; Klein, G.; Holden, B. Quality of life in Saskatoon [Canadian Assn of Geographers]. Can. J. Urban Res. 2001, 10, 237. [Google Scholar]
- Marsal-Llacuna, M.L. Building Universal Socio-cultural Indicators for Standardizing the Safeguarding of Citizens’ Rights in Smart Cities. Soc. Indic. Res. 2017, 130, 563–579. [Google Scholar] [CrossRef]
- Martínez-Baldares, T.; Cordero-Montero, A. Herramienta de monitoreo del Plan GAM 2013–2030, dimensión Urbano-Regional, Cantón Central de Cartago, Plan GAM 2013–2030 monitoring tool, Regional-Urban Dimension, Cartago, Cantón Central. Rev. Tecnol. En Marcha 2017, 30, 40–51. [Google Scholar] [CrossRef]
- Mohamed, R.S.; Bakr, A.F.; Anany, Y.M. New Urban Indicators for Evaluating Urban Polices in Egypt: City Capacity and Capability (Capa2). Procedia Environ. Sci. 2017, 37, 53–67. [Google Scholar] [CrossRef]
- Oliveira, M.; Bastos-Filho, C.; Menezes, R. The scaling of crime concentration in cities. PLoS ONE 2017, 12, e0183110. [Google Scholar] [CrossRef]
- Páramo, P.; Burbano, A.; Fernández-Londoño, D. Estructura de indicadores de habitabilidad del espacio público en ciudades latinoamericanas. Rev. De Arquit. 2016, 18, 6–26. [Google Scholar] [CrossRef]
- Piovano, J.G.; Mesa, A. Determinación de densidades urbanas sostenibles en base a metodología relativa al acceso solar: Caso área metropolitana de Mendoza, Argentina. Rev. De Urban. 2017, 36, 131–145. [Google Scholar]
- Santos, L.D.; Martins, I. Monitoring urban quality of life: The Porto experience. Soc. Indic. Res. 2007, 80, 411–425. [Google Scholar] [CrossRef]
- Sharifianpur, N.; Faryadi, S. A feasibility study on qualitative indicators in Isfahan city. J. Environ. Stud. 2014, 40, 95–106. [Google Scholar]
- Siche, R.; Agostinho, F.; Ortega, E.; Romeiro, A. Índices versus indicadores: Precisões conceituais na discussão da sustentabilidade de países. Ambiente Soc. 2007, 10, 137–148. [Google Scholar] [CrossRef]
- Tovar, E.; Bourdeau-Lepage, L. Well-being disparities within the paris region: A capabilist spatialised outlook. Urban Stud. 2013, 50, 1575–1591. [Google Scholar] [CrossRef]
- Vaca Ruiz, C.; Quercia, D.; Aiello, L.M.; Fraternali, P. Taking Brazil’s pulse: Tracking growing urban economies from online attention. In Proceedings of the 23rd International Conference on World Wide Web, Seoul, Republic of Korea, 7–11 April 2014; pp. 451–456. [Google Scholar]
- Van Herzele, A.; Wiedemann, T. A monitoring tool for the provision of accessible and attractive urban green spaces. Landsc. Urban Plan. 2003, 63, 109–126. [Google Scholar] [CrossRef]
- Dissart, J.C.; Deller, S.C. Quality of life in the planning literature. J. Plan. Lit. 2000, 15, 135–161. [Google Scholar] [CrossRef]
- Sirgy, M.J.; Michalos, A.C.; Ferriss, A.L.; Easterlin, R.A.; Patrick, D.; Pavot, W. The qualityity-of-life (QOL) research movement: Past, present, and future. Soc. Indic. Res. 2006, 76, 343–466. [Google Scholar] [CrossRef]
- Evans, D.R. Enhancing quality of life in the population at large. Soc. Indic. Res. 1994, 33, 47–88. [Google Scholar] [CrossRef]
- Diener, E.D.; Emmons, R.A.; Larsen, R.J.; Griffin, S. The satisfaction with life scale. J. Personal. Assess. 1985, 49, 71–75. [Google Scholar] [CrossRef] [PubMed]
- Rogge, N.; Van Nijverseel, I. Quality of life in the European Union: A multidimensional analysis. Soc. Indic. Res. 2019, 141, 765–789. [Google Scholar] [CrossRef]
- Diener, E.; Suh, E. Measuring quality of life: Economic, social, and subjective indicators. Soc. Indic. Res. 1997, 40, 189–216. [Google Scholar] [CrossRef]
- Matarrita-Cascante, D. Changing communities, community satisfaction, and quality of life: A view of multiple perceived indicators. Soc. Indic. Res. 2010, 98, 105–127. [Google Scholar] [CrossRef]
- Potter, J.; Cantarero, R.; Wood, H. The multi-dimensional nature of predicting quality of life. Procedia-Soc. Behav. Sci. 2012, 50, 781–790. [Google Scholar] [CrossRef]
- Veenhoven, R. Advances in understanding happiness. Rev. Québécoise De Psychol. 1997, 18, 29–74. [Google Scholar]
- Carmona, M.; Sieh, L. Measuring Quality in Planning: Managing the Performance Process; Routledge: London, UK, 2004. [Google Scholar]
- Delsante, I.; Miron, L.I.G. Urban growth, regeneration and social inclusion in Porto Alegre: The City Entrance Integrated Programme case study. UPLanD-J. Urban Plan. Landsc. Environ. Des. 2004, 2, 239–254. [Google Scholar]
- Formoso, C.T.; Miron, L.I. Understanding value generation in complex urban regeneration projects. In Future Challenges in Evaluating and Managing Sustainable Development in the Built Environment; John Wiley & Sons, Inc.: Hoboken, NJ, USA, 2017; pp. 231–251. [Google Scholar]
- Monteiro, D.A.D.B. Proposta de um Método para Avaliação da Qualidade de Vida Urbana e da Sustentabilidade de Bairros Brasileiros. Ph.D. Thesis, UFRGS, Porto Alegre, Brazil, 2020. [Google Scholar]
- Wesz, J.G.B. Urban Quality of Life: Multidimensional Evaluation in Porto Alegre, Brazil. Ph.D. Thesis, UFRGS, Porto Alegre, Brazil, 2021. [Google Scholar]
- Thomson, D.S.; Austin, S.A.; Devine-Wright, H.; Mills, G.R. Managing value and quality in design. Build. Res. Inf. 2003, 31, 334–345. [Google Scholar] [CrossRef]
- Rooke, J.; Sapountzis, S.; Koskela, L.; Codinhoto, R.; Kagioglou, M. Lean Knowledge Management: The Problem of Value; University of Huddersfield: Huddersfield, UK, 2010. [Google Scholar]
- Szalai, A. The meaning of comparative research on the quality of life. In The Quality of Life: Comparative Studies; Szalai, A., Andrews, F.M., Eds.; Sage: London, UK, 1980. [Google Scholar]
- Das, D. Urban quality of life: A case study of Guwahati. Soc. Indic. Res. 2008, 88, 297–310. [Google Scholar] [CrossRef]
- Delsante, I. Urban environment quality assessment using a methodology and set of indicators for medium-density neighbourhoods: A comparative case study of Lodi and Genoa. Ambiente Construído 2016, 16, 7–22. [Google Scholar] [CrossRef]
- Johnston, D.F.; Carley, M.J. Chapter 11: Social Measurement and Social Indicators. Ann. Am. Acad. Political Soc. Sci. 1981, 453, 237–253. [Google Scholar] [CrossRef]
- McCrea, R.; Shyy, T.K.; Stimson, R. What is the strength of the link between objective and subjective indicators of urban quality of life? Appl. Res. Qual. Life 2006, 1, 79–96. [Google Scholar] [CrossRef]
- Allardt, E. Dimensions of welfare in a comparative Scandinavian study. Acta Sociol. 1976, 19, 227–239. [Google Scholar] [CrossRef]
- ISO 37120:2018; Sustainable Cities and Communities—Indicators for City Services and Quality of Life. International Organization for Standardization (ISO): Geneva, Switzerland, 2018.
Figure 1.
SLR research design, based on the SLR stages proposed by Gough [12].
Figure 1.
SLR research design, based on the SLR stages proposed by Gough [12].

Figure 2.
The concept of urban QoL proposed in this study.

Figure 3.
A conceptual framework to evaluate the multidimensional urban QoL.


Table 1.
Quality and relevance assessment of the 26 studies (low, medium, or high quality).
| Studies | Focus | (A) | (B) | (C) | (D) | |
|---|---|---|---|---|---|---|
| 1 | Abbate et al. [5] | Urban services (QoL) | medium | high | high | medium |
| 2 | Alibegović and Villa [4] | Environmental; Economic; Governance; Management | high | medium | high | medium |
| 3 | Archibugi [25] | City effect point of view (positive/negatives categories) | high | high | low | medium |
| 4 | Bagstad and Shammin [26] | Sustainability indicators: The economy; Environmental; Social | low | low | low | low |
| 5 | Berhe et al. [20] | Housing; Access to public services; and Family income (resignation/dissonance) | high | high | high | high |
| 6 | Bielinskas et al. [27] | Economic; Social; Physical; Environmental | high | medium | high | medium |
| 7 | Coulton and Korbin [28] | Local indicators (child well-being); Subjective indicators | medium | medium | medium | medium |
| 8 | Gomes et al. [21] | QoL: objectives and subjective indicators | high | high | high | high |
| 9 | Hernández Aja [29] | Urban QoL: Environmental quality; Wellness; Identity | high | medium | high | medium |
| 10 | Kaklauskas et al. [30] | Sustainability indicators (QoL): Economic; Environmental; Social | high | medium | low | medium |
| 11 | Labonte et al. [31] | Subjective indicators | low | medium | medium | low |
| 12 | Marsal-Llacuna [32] | ISO 37120 + Subjective indicators | medium | medium | medium | medium |
| 13 | Martínez [22] | Inequality aspects: QoL conditions and distributions of opportunities | high | high | high | high |
| 14 | Martinez-Baldares and Cordero-Montero [33] | Urban indicators; Integral density centralities | medium | low | low | low |
| 15 | McAslan et al. [23] | Objective indicators; Subjective indicators (satisfaction surveys) | high | high | high | high |
| 16 | Mohamed et al. [34] | Urban indicators on an agricultural road | low | low | low | low |
| 17 | Oliveira et al. [35] | Crime | low | low | low | low |
| 18 | Páramo et al. [36] | UN: The economy; Environmental; Social | medium | medium | medium | medium |
| 19 | Piovano and Mesa [37] | Access to sunlight | low | low | low | low |
| 20 | Santos and Martins [38] | QoL: quantitative and qualitative approach | medium | high | high | medium |
| 21 | Sawicki and Flynn [20] | Local indicators | high | high | high | high |
| 22 | Sharifianpur and Faryadi [39] | Environmental quality | low | low | low | low |
| 23 | Siche et al. [40] | Discussion: index and indicator | low | low | low | low |
| 24 | Tovar and Bourdeau-Lepage [41] | Well-being | medium | high | medium | medium |
| 25 | Vaca Ruiz et al. [42] | The economy | low | low | low | low |
| 26 | Van Herzele and Wiedemann [43] | Accessibility; Attractive (green spaces) | high | medium | medium | medium |
Table 2.
QoL concepts discussed in five of the twenty-six papers (19%) analysed in the SLR.
| Studies | QoL Concept | |
|---|---|---|
| 1 | Abbate et al. [5] | “QoL refers to two interconnected concepts: the relationship between material and non-material aspects of welfare and the tie between the individual and collective life conditions” |
| 5 | Berhe et al. [20] | QoL combines both objective living conditions (existent secondary data) and the subjective perception of living conditions (people’s satisfaction) |
| 8 | Gomes et al. [21] | QoL was assumed in this study to be “as an individual perception of the socio-territorial contexts, evaluating quantitatively or qualitatively aspects of a subjective or objective nature which, from a perspective of territorial analysis, is expected to encompass the individual or collective manifestation of preferences and behaviours revealed in the presence of the intrinsic characteristics of the place” |
| 9 | Hernández Aja [29] | QoL introduces environmental aspects into the intersection with human needs. The quality of urban life is the embodiment of QoL in the urban space, which can be considered to be a social construction formed by three basic dimensions: environmental quality, well-being (individual satisfaction), and identity (appropriation and participation) |
| 11 | Labonte et al. [31] | The study makes a brief review of urban QoL, highlighting the importance of the identification of well-being across urban space, especially by analysing social phenomena and the attractiveness of the places, aiming to give feedback to urban policies |
Table 3.
Main urban QoL concepts and its objective and subjective dimensions.
| Main Urban QoL Concepts | |
|---|---|
| Urban quality of life | Material and non-material aspects |
| Individual and collective life conditions | |
| Objective and subjective dimension | |
| Objective dimension of urban QoL | Exogenous facts of a person’s life |
| External conditions | |
| Objective measurement/universal metrics | |
| Subjective dimension of urban QoL | Endogenous individuals’ perceptions |
| Internal mechanisms | |
| Subjective measurement/people’s satisfaction | |
Table 4.
Welfare types, adapted from Zapf.
| Welfare Types | |||
|---|---|---|---|
| Objective Living Conditions | |||
| Good | Bad | ||
| Subjective perception of living conditions | Good | Well-being | Resignation |
| (consistent welfare type) | (satisfaction paradox) | ||
| Bad | Dissonance | Deprivation | |
| (dissatisfaction dilemma) | (consistent welfare type) | ||
Table 5.
Methods to assess QoL identified in the SLR studies.
| Studies | QoL Evaluation Methods | |
|---|---|---|
| 1 | Abbate et al. [5] * | A model to evaluate the quality of services, measuring the judgement of the citizen of the main services (Palermo, Italy) |
| 2 | Alibegović and De Villa [4] * | Focused on the European urban environment, 55 indicators for 51 European cities |
| 3 | Archibugi [25] * | A model (indicators framework) to evaluate the QoL in France, Germany, UK, and Italy (comparable indicators) |
| 4 | Bagstad and Shammin [26] | Secondary data analysis (1990–2005) of the state of Ohio, USA (Sustainability indicators: Economic; Environmental; Social) |
| 5 | Berhe et al. [20] * | A mixed method approach for the city of Mekelle, Ethiopia, to measure objective and subjective QoL and to understand the divergence between them (adaptation and dissonance) |
| 6 | Bielinskas et al. [27] | Evaluation tool: Analysis of 20 neighbourhoods based on the 18 criteria that influence the perception of QoL by citizens (Lithuania) |
| 7 | Coulton and Korbin [28] | Child well-being at the level of the neighbourhood; the importance of considering both objective and subjective indicators was highlighted |
| 8 | Gomes et al. [21] | QoL concept definition for future application in Portugal: selection of social indicators to understand the perception of QoL from the perspective of residents |
| 9 | Hernández Aja [29] * | Analysis of existing indicators in Spain and proposal for new indicators |
| 10 | Kaklauskas et al. [30] | Analysis of comparable data from the 2012–2016 QoL surveys in European Cities |
| 11 | Labonte et al. [31] * | Comparative intra-urban QoL research in Saskatoon, Canada: social/subjective indicators |
| 12 | Marsal-Llacuna [32] * | Proposal to include 10 socio-cultural indicators in ISO 37120 |
| 13 | Martínez [22] * | A framework on how to formulate indicators and proposes interesting cross-analyses considering self-expressed needs |
| 14 | Martinez-Baldares and Cordero-Montero [33] | Urban indicators at regional level. No case study/implementation. Lack of accuracy and specificity |
| 15 | McAslan et al. [23] * | QoL assessment: Collection of objective and subjective data in eight US–Mexico border cities with an index based on economic, social, and environmental indicators and assessments of happiness (satisfaction) and social well-being |
| 16 | Mohamed et al. [34] | Proposed indicators to assess QoL. Method is not clear |
| 17 | Oliveira et al. [35] | A method to assess the spatial concentration of crime (secondary data from US and UK). Lack of accuracy and specificity |
| 18 | Páramo et al. [36] * | A framework that integrates quantitative and qualitative indicators to assess the quality of the public space (based on data available on the web). However, it does not contribute in an innovative way to their implementation |
| 19 | Piovano and Mesa [36] | Despite presenting urban indicators as keywords, this study is not about urban indicators, but rather amounts of sunlight. Lack of transparency, accuracy, and specificity |
| 20 | Santos and Martins [38] * | QoL monitoring system: quantitative (statistical indicators) and qualitative (based on citizens’ perception of QoL) approaches |
| 21 | Sawicki and Flynn [24] * | Discussion on the importance of measuring neighbourhood indicators: local scale, participatory process, and people’s perception |
| 22 | Sharifianpur and Faryadi [39] * | Urban environmental quality evaluation model in the city of Isfahan |
| 23 | Siche et al. [40] | Discussion about the meaning of the words index and indicator and of sustainability |
| 24 | Tovar and Bourdeau-Lepage [41] * | Proposal for a well-being indicator to identify socio-spatial differences between cities. Lack of precision |
| 25 | Vaca Ruiz et al. [42] | Proposed indicators to predict the economic capital of cities. Outdated economic indicators; argues that it is cheaper to estimate from data extracted from social media (than from a census) |
| 26 | Van Herzele and Wiedemann [43] * | Secondary data analysis (maps, existing surveys), accessibility assessment (ArcView 3.2 GIS-model software distances and barriers); evaluation of attractiveness (map and field observation—subjective). No interviews/questionnaires with users |
* Studies that propose sets of QoL indicators (15/26).
Table 6.
ISO 37120:2018 themes and indicators.
| Theme | Main Indicators | Core Indicator | Supporting Indicator | |
|---|---|---|---|---|
| 1 | Economy | City’s unemployment rate | 1 | 7 |
| 2 | Education | Percentage of female school-aged population enrolled in schools | 4 | 2 |
| Percentage of students completing primary/secondary education | ||||
| 3 | Energy | Total end-use energy consumption per capita (GJ/year) | 5 | 2 |
| Percentage of total end-use energy derived from renewable sources | ||||
| 4 | Environment and | Fine Particulate/Particulate Matter (PM2.5/PM10) concentration | 3 | 6 |
| climate change | Greenhouse gas emissions measured in tonnes per capita | |||
| 5 | Finance | Debt service ratio | 2 | 2 |
| 6 | Governance | Women as a percentage of the total elected to city-level office | 1 | 3 |
| 7 | Health | Average life expectancy | 4 | 2 |
| Number of inpatient hospital beds per 100,000 population | ||||
| Suicide rate per 100,000 population | ||||
| 8 | Housing | Percentage of city population living in inadequate housing | 2 | 2 |
| Percentage of population living in affordable housing | ||||
| 9 | Population and social conditions | Percentage of city population living below the international poverty line | 1 | 2 |
| 10 | Recreation | Square meters of public indoor/outdoor recreation space per capita | 0 | 2 |
| 11 | Safety | Number of firefighters/police officers/homicides per 100,000 population | 5 | 5 |
| 12 | Solid waste | Percentage of city population with regular solid waste collection | 5 | 5 |
| Percentage of the city’s solid waste that is recycled | ||||
| 13 | Sport and culture | Number of cultural institutions and sporting facilities per 100,000 population | 1 | 2 |
| 14 | Telecommunication | Number of internet/mobile phone connections per 100,000 population | 0 | 2 |
| 15 | Transportation | Kilometres of public transport system per 100,000 population | 2 | 5 |
| Annual number of public transport trips per capita | ||||
| 16 | Urban/local agriculture and food security | Total urban agricultural area per 100,000 population | 1 | 3 |
| 17 | Urban planning | Green area (hectares) per 100,000 population | 1 | 3 |
| Jobs/housing ratio | ||||
| 18 | Wastewater | Percentage of city population served by wastewater collection | 3 | 1 |
| Percentage of the city’s wastewater receiving centralized treatment | ||||
| 19 | Water | Percentage of city population with potable water supply service | 4 | 3 |
| Total domestic water consumption per capita (litres/day) | ||||
| Average annual hours of water service interruptions per household | ||||
| Total | 45 | 59 | ||
Table 7.
The main QoL themes identified in the SLR studies.
| Studies | QoL Themes | |
|---|---|---|
| 1 | Abbate et al. [5] | Urban services (QoL): Environment; Education and cultural activities; Social activities; Public transportation |
| 2 | Alibegović and De Villa [4] | Environmental indicators; Economic indicators; Governance and Management indicators |
| 3 | Archibugi [25] | City effect indicators: Economy; Social–cultural diversity; Public service; Education; Subjective contentment/degree of satisfaction; Environment; Housing |
| 4 | Bagstad and Shammin [26] | Sustainability indicators: Economic; Environmental; Social |
| 5 | Berhe et al. [20] | Housing; Public services; Adequate family income |
| 6 | Bielinskas et al. [27] | Economic; Social; Physical; Environmental |
| 7 | Coulton and Korbin [28] | Local indicators (child well-being) and subjective indicators |
| 8 | Gomes et al. [21] | Housing; transportation; leisure, media, and culture; social and political participation; education; working conditions; income, health; environment; public safety and total life situation |
| 9 | Hernández Aja [29] | Economic indicators; Environmental indicators; Social indicators; Urban indicators |
| 11 | Labonte et al. [31] | Cluster analysis; Subjective indicators; Social Cohesion; Satisfaction: External Structures, Personal Relationships, and Neighbourhood |
| 12 | Marsal-Llacuna [32] | No. of NGOs dedicated to solidarity per 100,000 inhabitants; % of municipal budget providing means to different beliefs, to cultural activities, and to vulnerable groups (disabled, children, and the elderly); % surface in municipal buildings for citizens to perform civic activities; existence of a “citizens’ inbox”; % of adult population enrolled in training and educational programs; % of population suffering from malnutrition; Transparency of the municipal budget |
| 13 | Martínez [22] | Conditions of QoL; Accessibility |
| 15 | McAslan et al. [23] | Objective indicators of QoL: population, economy, education, health, housing, and public safety. Subjective indicators of QoL: personal quality of life (overall satisfaction) |
| 18 | Páramo et al. [36] | Environmental Quality; Urban Mobility; Public Services; Culture; Public Safety, Government Dynamics; Social Dynamics; Economy; Infrastructure |
| 20 | Santos and Martins [38] | Objective indicators/Quantitative assessment (data): Environmental Conditions; Collective Material Conditions; Economic Conditions; Social Dimensions and the Participation of Citizens. Subjective indicators/Qualitative assessment (open questions) |
| 21 | Sawicki and Flynn [24] | No. of supermarkets, public housing units, employers, jobs, libraries, public elementary schools, and police precincts; Distance to the core of downtown and mayor employment centres; No. of infant deaths |
| 22 | Sharifianpur and Faryadi [39] | Environment; Health, Safety; Education; Economy; Urban Facilities; Transportation; Housing; Culture, Art, Recreation |
| 24 | Tovar and Bourdeau-Lepage [41] | Well-being as freedom: education, social environment, and urban mobility. Choice of freedom: proportion of the population that has the right to vote. Well-being as realisations: income, housing conditions, and employment |
| 26 | Van Herzele and Wiedemann [43] | Parameters for evaluation of the attractiveness of urban green spaces: spaces; culture and history; quietness; facilities |
Table 8.
The main QoL indicators identified in the SLR studies.
| Dimensions | Indicators | ||
|---|---|---|---|
| 1 | Economy | (14/15) | Unemployment rate |
| Income | |||
| Retail sale area per capita | |||
| 2 | Education | (12/15) | Number of schools |
| Percentage of school-aged population enrolled in school | |||
| 3 | Governance | (12/15) | Voter participation |
| Number of formal spaces for popular participation | |||
| 4 | Transportation | (11/15) | Public transportation availability |
| Travel time | |||
| 5 | Health | (11/15) | Access to health centres (in meters) |
| Infant mortality | |||
| 6 | Urban planning | (10/15) | Accessibility to green areas |
| Heritage conservation | |||
| Urban space quality (existence of urban facilities/equipment) | |||
| 7 | Shelter/Housing | (10/15) | Housing affordability |
| Housing conditions | |||
| Housing overcrowding | |||
| 8 | Culture | (9/15) | Number of free cultural events |
| Number of cultural facilities | |||
| 9 | Environment | (8/15) | Air quality |
| Noise pollution | |||
| 10 | Safety | (8/15) | Crime rates |
Table 9.
The seven QoL dimensions and the forty-two urban QoL indicators proposed in this study.
| QoL Dimensions | Urban QoL Indicators | |
|---|---|---|
| 1. | Urban services | Solid waste collection |
| Water supply | ||
| Electricity supply | ||
| Internet services | ||
| Health-related services (hospitals, health centres, etc.) | ||
| Education services (schools, nurseries, universities, etc.) | ||
| 2. | Economy | Employment opportunities |
| Cost of living (expenses on housing, food, etc.) | ||
| Existence of professional courses (computers, crafts, hairdressing, etc.) | ||
| Access to credit (facilitated payment terms in shops and commerce) | ||
| Variety of commercial and service establishments (markets, shops, restaurants, banks, post office, etc.) | ||
| Existence of tourist activities | ||
| 3. | Culture and recreation | Number of green areas and parks |
| Quality and maintenance of green areas and parks | ||
| Existence of places to take part in outdoor sports | ||
| Existence of places for cultural activities (artistic events, museums, theatres, cinemas) | ||
| Opportunities to take part in free cultural and artistic events | ||
| Conservation of historical, artistic, and cultural heritage (buildings, houses, and public spaces) | ||
| 4. | Urban mobility | Quality of public transport (comfort) |
| Availability of public transport (number of lines and itineraries) | ||
| Ease of going from one’s house to other parts of the city (workplace, study, friends’ houses, etc.) | ||
| Ease of displacement on foot (to carry out daily activities) | ||
| Quality and location of cycle paths | ||
| Existence of tourist activities | ||
| 5. | Conviviality | Conviviality and interaction with neighbours |
| Conviviality and interaction with homeless people | ||
| Opportunities to participate in the decisions of your own building | ||
| Opportunities to participate in community activities (associations, artistic and religious groups, etc.) | ||
| Respect for cultural, sexual, religious, and political differences | ||
| Identification with the neighbourhood and people’s pride in living in it | ||
| 6. | Security | Feeling of security in public places (pavement, street, etc.) |
| Feeling of security when accessing one’s building during the day | ||
| Feeling of security when accessing one’s building at night | ||
| Safety for children and teenagers to experience the neighbourhood (walking, playing, etc.) | ||
| Quality of policing | ||
| Quality of public lighting (sidewalks, streets, parks, etc.) | ||
| 7. | Environmental comfort | Noise pollution |
| Air pollution (feeling when breathing) | ||
| Existence of trees on the pavements and in the parks (climate comfort) | ||
| Cleanliness of public spaces (pavements, streets, parks, etc.) | ||
| Drainage and sewage system (floods/odours) | ||
| View from one’s apartment window to the outside space (street/courtyard) | ||
Disclaimer/Publisher’s Note: The statements, opinions and data contained in all publications are solely those of the individual author(s) and contributor(s) and not of MDPI and/or the editor(s). MDPI and/or the editor(s) disclaim responsibility for any injury to people or property resulting from any ideas, methods, instructions or products referred to in the content. |
© 2023 by the authors. Licensee MDPI, Basel, Switzerland. This article is an open access article distributed under the terms and conditions of the Creative Commons Attribution (CC BY) license (https://creativecommons.org/licenses/by/4.0/).
Share and Cite
MDPI and ACS Style
Wesz, J.G.B.; Miron, L.I.G.; Delsante, I.; Tzortzopoulos, P. Urban Quality of Life: A Systematic Literature Review. Urban Sci. 2023, 7, 56. https://doi.org/10.3390/urbansci7020056
AMA Style
Wesz JGB, Miron LIG, Delsante I, Tzortzopoulos P. Urban Quality of Life: A Systematic Literature Review. Urban Science. 2023; 7(2):56. https://doi.org/10.3390/urbansci7020056
Chicago/Turabian StyleWesz, Josana Gabriele Bolzan, Luciana Inês Gomes Miron, Ioanni Delsante, and Patricia Tzortzopoulos. 2023. "Urban Quality of Life: A Systematic Literature Review" Urban Science 7, no. 2: 56. https://doi.org/10.3390/urbansci7020056