Article

Customer Loyalty during Disasters: The Case of Internet Service Providers Amidst Typhoon Odette in Central Philippine Urban Districts

1
College of Education, Cebu Technological University, Corner M. J. Cuenco Ave. & R. Palma St., Cebu City 6000, Philippines
2
College of Technology, Cebu Technological University, Corner M. J. Cuenco Ave. & R. Palma St., Cebu City 6000, Philippines
3
College of Technology, Carmen Campus, Cebu Technological University, R. M. Durano Avenue, Cebu 6005, Philippines
4
Center for Applied Mathematics and Operations Research, Cebu Technological University, Corner M. J. Cuenco Ave. & R. Palma St., Cebu City 6000, Philippines
5
Department of Industrial Engineering and Operations Research, University of the Philippines Diliman, Quezon City 1101, Philippines
6
Department of Business Administration, University of San Carlos, P. del Rosario St., Cebu City 6000, Philippines
7
Department of Tourism Management, Cebu Technological University, Corner M. J. Cuenco Ave. & R. Palma St., Cebu City 6000, Philippines
*
Author to whom correspondence should be addressed.
Urban Sci. 2023, 7(2), 55; https://doi.org/10.3390/urbansci7020055
Submission received: 7 February 2023 / Revised: 10 May 2023 / Accepted: 12 May 2023 / Published: 16 May 2023

Abstract

:
The impact of service disruptions to critical utility services due to natural disasters is evident during delays in emergency responses and humanitarian relief, especially for urban populations with highly interdependent infrastructures. Aside from health and social impacts, failing to address these disruptions would inevitably lead to customer dissatisfaction and switching loyalty, adversely affecting service providers’ profitability. Thus, providers must effectively respond to this service failure resulting from disruptions to retain the loyalty of their existing customers. To this end, a theoretical model to explain customer loyalty to internet service providers amidst a disaster-induced disruption through integrating customer loyalty, customer satisfaction, service quality, service innovation, service recovery, perceived value, and brand image is proposed in this work. This study uses the case of a massive disruption caused by Typhoon Odette (Rai) in central Philippine urban districts to empirically test the efficacy of the proposed structural model. A total of 584 responses were utilized in the partial least squares structural equation modeling (PLS-SEM) to derive significant relationships between the constructs. The findings suggest that customer satisfaction strongly predicts customer loyalty during a disaster. Furthermore, efforts towards service recovery do not translate to customer loyalty, but negatively influence customer satisfaction. Moreover, service innovation significantly affects customer satisfaction but negatively influences customer loyalty. Additionally, perceived value does not support customer loyalty but positively affects customer satisfaction. Lastly, brand image and service quality influence both customer satisfaction and loyalty. These findings offer managerial insights for informing the design of a reliable service recovery system, efficient project management planning, practical service innovation, and comprehensive service design. The future research directions are discussed.

1. Introduction

Globally, natural disasters (e.g., hurricanes, tsunamis, floods, or earthquakes) have risen rapidly, affecting almost all economic sectors [1]. Today’s disaster threats cause considerably more significant damage than before [2]. Kwasinski [3] mapped the failures caused by Hurricane Katrina in 2005, and the damage triggered interruptions in power plant operations, fuel delivery disruption, flooding, security issues, and extensive power-related outages. Nine years ago, Typhoon Haiyan (local name “Yolanda”) devastated the Philippines, causing enormous damage to the eastern part of the country and its other neighboring islands, with 1039 missing individuals, 28,626 injured, and 6245 casualties reported by the authorities [4]. On 16 December 2021, Typhoon Rai (local name “Odette”) damaged essential infrastructures such as road networks, medical and educational institutions, local administration offices, electricity and water facilities, and agricultural production. Additionally, the direct consequence of disasters includes the near or complete collapse of terrestrial telecommunications infrastructures. For instance, in August of 2017, the Category 4 Hurricane Harvey hit the Texas coast, USA, which caused catastrophic flooding in the area and damaged infrastructures. Hurricane Harvey is estimated to have cost USD 125 billion [5]. In October 2019, the Category 5 Typhoon Habigis became one of the strongest typhoons to strike Japan, causing widespread damage to infrastructures, affecting around 135,000 people, and resulting in 80 deaths [6]. The Great East Japan Earthquake in 2011 severely disabled its communication infrastructure, which caused failures in communication systems [7]. The connectivity services that link Asia and North America through submarine cables were disrupted when a 7.1 magnitude earthquake hit southern Taiwan in 2006 [8]. These can be considered as an evidential basis for the large-scale damage and communication service disruptions prevalent during disasters.
The destruction of certain utilities, such as transport and communications, may cause a downfall to any country’s security and public welfare during disasters [9]. The “big one” that disrupted New Orleans and its nearby areas and the 2015 earthquake in Nepal affected their respective utility sectors, hindering their citizens from availing of essential services [10]. In critical industries such as telecommunications, preparedness actions become imperative, as individuals and the private sector depend on their services to support daily consumption, particularly when disaster strikes [11]. The relevance of these actions is amplified in urban districts characterized by more interdependent infrastructures. As such, the preparedness efforts necessary to augment one critical component in large urban districts (e.g., utility services) must be synchronous with those efforts imposed in other components (e.g., road networks). During disasters, as sectors become highly interdependent in supporting urban communities, disruptions from these disasters cause repercussions across the interdependencies, eventually impacting sectors initially far from the source. As opposed to in rural areas, where interdependencies are less prevalent and services remain predominantly decentralized, urban districts demand greater attention. Additionally, communication-supported services, such as the internet, are crucial to supporting communities in recovery [12], especially in cities where government units that support such recovery efforts usually reside. Aside from these services that depend on reliable communication networks, the consequences of service disruptions from telecommunication providers are highly associated with ineffective emergency responses and humanitarian logistics [13].
In the event of disasters, service failures are often unavoidable, inevitably leading to customer dissatisfaction. When customers’ expectations are not satisfied, service providers may suffer serious consequences [14]. The capacity of a service provider to recover from failure may substantially impact customer satisfaction [15]. As a result, the inability to correct their service failures makes it harder for service providers to restore customer satisfaction and gain customer loyalty [16]. While service recovery efforts promote customer satisfaction, the current literature agrees that satisfaction positively affects service loyalty [15]. Sitorus and Yustisia [17] argued that satisfaction could be transformed into loyalty if leveraged and managed appropriately. Loyalty, equally, can dissipate into dissatisfaction when customers repeatedly experience unsatisfactory episodes. The expense of acquiring a new client is five times that of maintaining an existing one [18]; thus, service providers who are losing customers face an enormous challenge. Although it may not directly cause customer unhappiness, the failure to take steps to make consumers happy contributes to customer agitation [19].
However, under extreme events, when the disruptions caused by disasters become widespread, service providers may be severely impacted; thus, efforts to sustain service recovery are almost impossible to implement, especially for urban populations with highly interconnected infrastructures. Under such a scenario, service providers’ physical infrastructures (e.g., buildings, offices, and telecommunication towers) may be damaged and their resources may be insufficient to address all customer requests. On the other hand, this extreme scenario may compel customers to adjust their service expectations, and the service recovery efforts of their providers may not be a priority. For instance, customers would understand that their internet connectivity at home may be unavailable for an extended period immediately following a disaster, as service staff are likewise severely affected. As a result, as customer expectations change, the factors that lead to customer satisfaction and loyalty become important. In this regard, the Serv Qual model, developed by Parasuraman et al. [20], is widely used to understand customer satisfaction. Previous findings have linked Serv Qual to customer satisfaction [21] and customer loyalty [22] in various sectors. Serv Qual is used to identify the perception gap between a company’s beliefs and customer expectations [23]. Despite the popularity of Serv Qual for understanding customer satisfaction and loyalty, its application during disasters resulting in customer loyalty has not yet been explored. Understanding customer loyalty (i.e., during disasters) is vital for service providers (e.g., internet) to establish measures that would eventually prevent their customers from switching brands.
Aside from Serv Qual and service recovery, Borah et al. [24] emphasized other underlying factors linked to customer satisfaction and loyalty during disasters. Several scholars within the field of crisis management (i.e., disasters) argued that it is essential to consider preparation and communication before a crisis [25]. Fearn-Banks [26] reiterated that a crisis could harm companies, their brands, and their stakeholders. It is noteworthy that the brand image meets the expectation and promises of the brand. Thus, the perceived brand image may promote customer loyalty during disasters. On the other hand, Anning-Dorson [27] highlighted that service innovation is associated with customers’ perceived preferences for a product’s performance. Yeh et al. [28] emphasized that successful service innovation will likely influence customer needs, enhance customer satisfaction, and lead to loyalty. Contrastingly, Lemy et al. [29] argued that service innovation does not impact satisfaction. Consequently, the existing works suggest that service innovation positively enhances customer loyalty by upgrading the existing ideas about a product or service [30] and may likely prevail in customer purchase decisions during disasters. With more customers being value-driven, perceived value draws much attention in this domain in the literature [31]. Polas et al. [32] emphasized that improving the perceived value of a service potentially increases customer satisfaction, thus elevating this customer satisfaction and minimizing customer attrition. Appleby-Arnold et al. [33] argued that the response and recovery from various perspectives are important for increasing perceived value during disasters. Hence, during such disasters, perceived value may promote customer loyalty. Despite these crucial insights from the literature, a holistic framework describing customer satisfaction and loyalty, particularly during disasters causing massive disruptions, is missing. It serves as the main departure of this work.
This work bridges such a gap by offering an overarching model that explains the factors that would maintain customer loyalty during disasters, involving service recovery, service innovation, perceived value, brand image, Serv Qual, and customer satisfaction. The proposed structural model expands upon the extant literature by combining these relevant constructs to explain customer loyalty amidst disruptions caused by disasters. This agenda has never been explored in the current literature. With various interplaying factors happening more during disasters than normal operations, an exploratory model seeking to understand customer loyalty better is critical to guide service providers in the design of initiatives that effectively attract customers to stay with the service. A compelling empirical case of a massive disruption caused by Typhoon Odette (Rai) in Philippine urban districts is presented to test the efficacy of the proposed structural model. An estimated 9.9 million people were severely affected by Typhoon Odette in December 2021, wherein 2.4 million needed critical assistance (United Nations Office for the Coordination of Humanitarian Affairs) [34]. National and local authorities, particularly in the Philippines, promptly acted on the search, rescue, emergency relief, and road-clearing operations in the affected areas as soon as the weather conditions improved. However, the overall logistics of the humanitarian relief were disrupted due to the damage sustained by critical infrastructures such as electricity, road networks, mobile signals, and internet access [34]. Furthermore, communication access was limited in 136 cities for several months due to damage to the telecommunication infrastructure [35]. Strikingly, due to dense populations and infrastructures, this massive disruption caused more adverse impacts to those living in the urban districts, as the repair and recovery efforts carried out by internet service providers became extremely complex. Consequently, those populations with a dire need for internet connection for study or work seized every opportunity to connect, including persistently reaching out to their service providers, availing products at premium prices, adding service providers to their existing ones, or even switching brands. To explain the loyalty and satisfaction of customers to telecommunication (i.e., internet) service providers during major disruptions, a partial least squares structural equation modeling (PLS-SEM) is utilized.
PLS-based SEM provides a more robust and complete statistical method for determining structural models [36]. It is best utilized in dealing with complex models, limited sample sizes, non-normally distributed data, formative measures, and predictive and exploratory research [37]. PLS-SEM identifies the best predictors of variable relationships and maximizes the amount of covariance between latent variables to improve the model interpretation [38]. PLS model paths analyze two kinds of linear equations: (1) measurement equations and (2) structural equations [39]. The measurement model (i.e., outer model) presumes the existence of unobserved or latent variables. The structural model (i.e., the inner model) connects the latent and manifest variables (items). PLS-SEM requires the creation of a path model based on theory and logic that connects the variables and constructs [40]. Additionally, PLS is suitable for analyzing a small sample size [41]. Consistent with others in the literature, Serv Qual becomes a second-order construct, and this study utilizes the two-step approach to analyze it [42] with the SmartPLS software version 3.3.9. The two-stage approach enhances the parameter recovery of the paths pointing from the exogenous construct to the higher-order construct and from the higher-order construct to the endogenous construct in the path model. The study utilizes the disjoint two-stage approach, where the lower-order components of the higher-order construct in the path model are only examined. In contrast, the higher-order component is ignored [43]. In performing the disjoint two-stage approach, the following stages are followed. The construct scores are kept in stage one, but only those of the lower-order components. In stage two, the scores are utilized to measure the higher-order construct. The additional constructs in the path model are estimated using standard multi-item measures, as in stage one [43]. The analyses developed from assessing the proposed customer loyalty model will contribute significant insights for service providers in cities to design proper service responses amidst disaster-induced disruptions. Such initiatives contribute to building collective efforts for sustaining more resilient urban communities.
The remainder of the paper is structured as follows. Section 2 discusses the literature review on the impact of natural disasters on utility services and the development of the hypothesized model. The methodological procedure for the PLS-SEM is presented in Section 3. Section 4 provides a discussion of the insights associated with the results. Finally, the concluding remarks, implications, study limitations, and future research agendas are presented in Section 5.

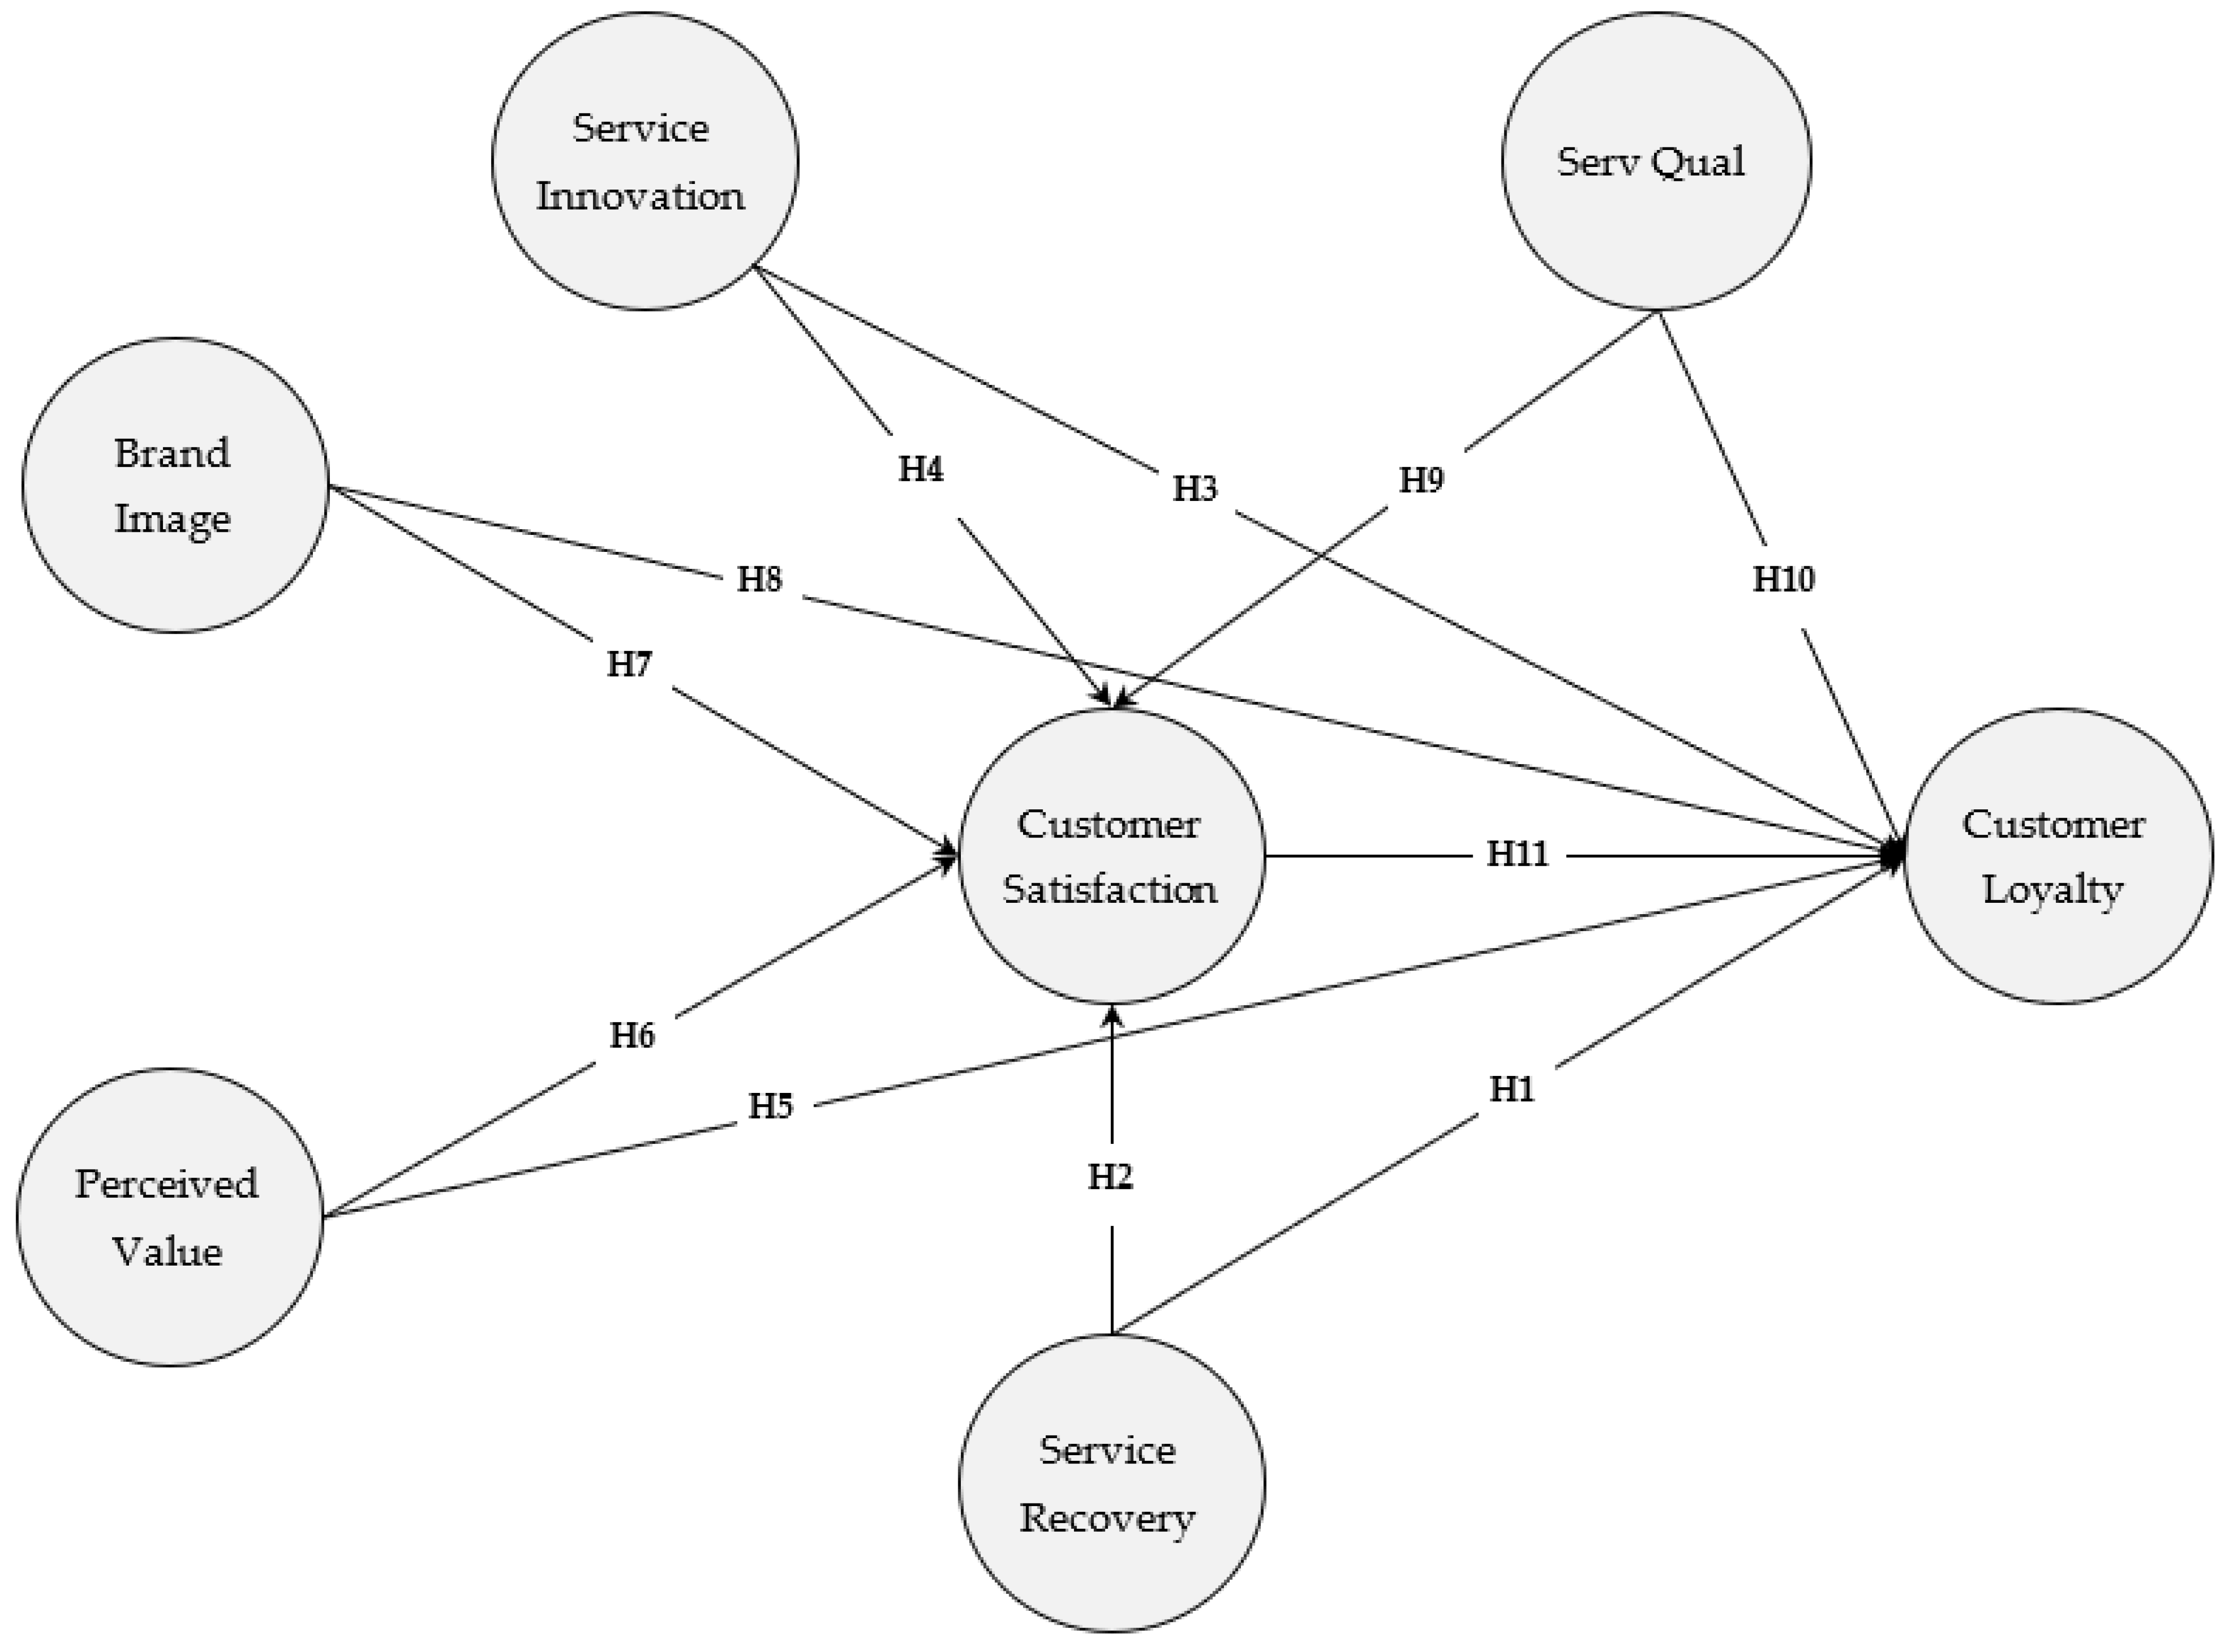
2. Literature Review and Hypotheses Development

2.1. Impact of Natural Disasters on Utility Services

Natural disasters are becoming more common due to global warming and climate change [44]. The World Disaster Report recently indicated an increase in natural disasters (e.g., hurricanes, floods, and earthquakes), from roughly 90 annually in the 1970s to approximately 450 today. The mortality caused by natural disasters was recorded at an estimated 30 million from 2000 to 2020 [45]. Recent growing evidence on the adverse effects of natural disasters has been reported, including their economic, social, physical, and spiritual impacts (e.g., [46]). Specifically, an alarming estimate of $2.25 trillion in economic costs has been incurred due to natural disasters globally [47]. For instance, Typhoon Haiyan, one of the most devastating typhoons to hit the Philippines, ruined over 1 million houses, harmed 16 million people, and resulted in over 6000 deaths [48]. Furthermore, its economic damage was approximately at least $10 billion (i.e., 5% of the gross domestic product). These repercussions caused by natural disasters, both in the short and long run, have urged academics to pay attention to disaster management and response [49]. Fortunately, the response of the academic community has been impressive, with studies that cut across different sectors, including tourism [50], infrastructure [51], and utility [52], among others. Since utility services (i.e., energy, water, electricity, telecommunications, and roads) are considered to be critical elements in a widespread network of risk [53], eventually putting interests associated with customer loyalty to these utility service providers becomes a significant concern [54].
The prompt response of utility services during disasters significantly impacts their operations in restoring critical infrastructures and providing resources and services to other sectors and the general public [55]. Shafei and Tabaa [56] emphasized that excellent customer service, prompt resolutions to problems, and advertising schemes are the keys to maintaining customers in the highly competitive telecommunications industry. Failure to address utility-related problems during a disaster may cause many lost lives. For instance, areas in Miami, USA, suffered heavy rainfall and storm surge flooding, where gale winds uprooted trees, cell towers, signages, and electrical poles. This left millions without electricity for up to a week following the storm, resulting in numerous fatalities among older people [57]. Furthermore, as power restoration is associated with socioeconomic factors, vulnerable communities face higher risks [57]. On the other hand, Ali et al. [58] attributed the significant losses during the earthquake of Muzaffarabad, Pakistan, to the inappropriate communication system, aside from the unavailability of appropriate information pre- and post-disaster. Various studies have proposed disaster mitigation and management plans for utility services, such as a cloud computing infrastructure for the humanitarian network [58], efficient location selection and the reinforcement of telecommunication rigs [11], and disaster mitigation and strategic recovery planning based on model simulation [59].
During disasters, customer satisfaction and loyalty have not yet been studied, especially for internet service providers. As reported in various contexts, a relationship exists between customer satisfaction and loyalty [60]. However, ensuring customer loyalty to the internet service provider has become a considerable challenge [61], particularly during disasters, where disruptions reach the infrastructures and resources of these service providers. Although it has been widely argued that customer satisfaction increases customer loyalty [62], securing the latter via customer retention saves companies (e.g., service providers) from additional expenditures (i.e., advertisements and promotions), as obtaining new customers may cost the company 5 to 25 times more [63]. Thus, customer satisfaction and loyalty are significant considerations for every telecommunication company’s eventual goal [64].

2.2. Service Recovery

According to Grönroos [65], service recovery (SR) is the activity that a particular organization carries out to react to customer complaints if a service is unavailable. If the quality of the service does not satisfy consumer expectations, service failure occurs [66]. Especially in unprecedented events (e.g., natural disasters), some service failures are unavoidable. Thus, service providers should initiate efficient service recovery systems as mitigations to efficiently cope with these problems [67,68]. Aside from turning upset customers into satisfied ones, the existing works in the literature have proved that efficient recovery efforts could also increase customers’ trust and loyalty (e.g., [69]). Moreover, Lastner et al. [70] emphasized the significance of customer service recovery strategies in facilitating customer satisfaction by influencing a customer’s positive experience with the service. Even so, the association of service recovery with preserving customer relations has long been utilized as an efficient strategy for keeping customers satisfied (e.g., [71]). However, this positive relationship may not reflect all service providers. Specifically, in the case of e-banking, Marimon et al. [72] observed that e-service recovery significantly affected e-loyalty. This also holds in the context of low-cost carrier service performance, emphasizing that strategies for recovering service failures affect travelers’ satisfaction and loyalty to a low-cost carrier [73]. These insights are particularly significant in the advent of disasters. Thus, the following hypotheses were established:
H1. 
Service recovery exerts a positive influence on customer loyalty.
H2. 
Service recovery exerts a positive influence on customer satisfaction.

2.3. Service Innovation

Service innovation (SI) relates to customers’ perceived preferences for a product’s performance [27]. It has also evolved into a vast field encompassing the intangible processes and changing interactions between technology and humans [74,75]. In fact, service innovation has gained more attention due to its positive impact on the economy [76]. Successful service innovation is likely to influence customer needs, thus enhancing customer satisfaction, which leads to loyalty [28]. It enables the cascading development of a hierarchy of services based on the quality and value of the associated product [30]. This includes offering new benefits to existing customers and establishing new markets by incrementally adding new service values [77]. Lemy et al. [29] emphasized that service innovation impacts customer loyalty. Innovations offer opportunities to create novel means for managing and improving the customer experience [78]. Continuous innovation is highly encouraged to create new advantages, especially in the advent of disasters not usually emphasized in the domain literature [27]. As a result, the existing works have demonstrated that service innovation improves customer loyalty by upgrading existing ideas [30]. Thus, the following hypotheses were constructed:
H3. 
Service innovation has a positive influence on customer loyalty.
H4. 
Service innovation has a positive influence on customer satisfaction.

2.4. Perceived Value

Perceived value represents customers’ assessments of the quality of a product (and service) relative to its price, which can positively influence their satisfaction levels [79]. It receives much attention in the service marketing literature [31]. For instance, Hanaysha [80] emphasized that a high customer value leads to a high customer retention. Kim et al. [81] pointed out that loyalty is based on how much people think something is worth (i.e., during disasters). Thus, developing strategies for creating customer value is key to attracting the interest of new customers, fostering and sustaining a good relationship with them, and gaining their loyalty [82]. A few opposing findings in the literature found no significant influence of perceived value on customer loyalty (e.g., [83]). However, Cheng et al. [15] emphasized that constant efforts towards good customer service strengthen customer satisfaction and loyalty. Thus, we hypothesized that:
H5. 
Perceived value exerts a positive influence on customer loyalty.
H6. 
Perceived value exerts a positive influence on customer satisfaction.

2.5. Brand Image

Relevant studies have highlighted brand image (BI) as an essential topic in this domain of the literature [84]. Brand image is a fundamental concept in marketing that refers to what customers associate with a brand based on their latest impressions [85]. During a crisis (i.e., a disaster), the projection of a brand’s quality must be reflected in all its customer engagements, emphasizing the importance of attaining consumer happiness. Previous research has demonstrated that brand image has a considerable impact on consumer purchase intention [86] and a favorable impact on customer satisfaction, promoting customer loyalty [87]. Similarly, Wu et al. [88] emphasized that brand image is a predictor of customer satisfaction and positively affects it. On the contrary, Dam and Dam [89] found that brand image had little impact on consumer satisfaction. However, various research has claimed that brand image is still a significant antecedent in determining customer loyalty [87]. These elements should be investigated further to better understand the process linking brand image to consumer satisfaction and loyalty during disasters. Thus, we hypothesized that:
H7. 
Brand image has a positive influence on customer satisfaction.
H8. 
Brand image has a positive influence on customer loyalty.

2.6. Serv Qual

The Serv Qual model, developed by Parasuraman et al. [20], is considered to be the most well-known method for measuring service quality, using concepts associated with the gap theory. Ramanathan and Karpuzcu [90] used Serv Qual to evaluate the disparity between consumers’ pre-service expectations and post-service perceptions of this service quality. It includes five generic service quality dimensions (i.e., responsiveness, reliability, empathy, tangibility, and assurance) that are usually used to quantify the quality of a specific service [91].
  • Responsiveness
Responsiveness refers to a timely and flexible response to customer requirements [20]. According to Alnsour et al. [92], the desire to assist clients and offer quick services significantly impacts customer loyalty and is favorably associated with a company’s responsiveness. Furthermore, these two factors are directly associated with one another. With this, an internet service provider’s ability to promptly provide services is critical to its service quality [93]. Furthermore, due to how telecommunication services are utilized worldwide, it would be imperative that a prompt response or action is necessary when these services are affected by disasters.
  • Reliability
The ability to offer the expected standards, as well as how a firm handles its customer service concerns, executes the proper services the first time, provides its services within the promised time frame, and maintains an error-free record, are all indicators of a company’s reliability [20]. Stiakakis and Georgiadis [94] found reliability to be an essential characteristic of excellent service, which positively affects customer happiness. During catastrophes, difficulties with dependability are exacerbated by significant interruptions.
  • Empathy
Empathy is the attentiveness shown by a service provider toward its customers through providing individualized customer needs and convenient operating hours [95]. Various studies have proven the significant direct effect of empathy on customer satisfaction (e.g., [96]). Additionally, it plays a vital role in enhancing customer value, which assists consumers in making their purchase choices and indirectly promotes greater customer happiness [82]. With the potential loss of property or lives and difficulties in acquiring necessities (e.g., water and food) during disasters, customer empathy is undoubtedly crucial for service providers.
  • Tangibility
Tangibles are the physical infrastructure and equipment used by service providers to create and operate their services [97]. These tangibles enable customers to evaluate the physical performance of a service before and after a purchase [98]. The supporting equipment and appearance of the staff may leave a lasting impression on customers, resulting in psychological responses that affect their attitude toward the service [99]. Thus, the tangibility of services significantly influences the service quality [100]. The presence of tangibles may be encouraging during disasters.
  • Assurance
Assurance was described by Parasuraman et al. [20] as the knowledge and politeness of staff and capacity of their customers to trust and believe in them. In addition, Sam et al. [101] espoused that quality assurance is associated with the sufficient knowledge and courtesy of employees as a direct implication of high customer satisfaction. In the case of telecommunication services, this Serv Qual dimension is vital to building trust and confidence in their aftersales services [102].
Service quality is highly associated with a profitable business, wherein a customer’s positive perception of service quality influences their behavioral intentions [103]. Specifically, service quality has a consistent, positive influence on customer loyalty [104]. As an added benefit, customers who are happy with their purchases are more inclined to suggest the company to others, resulting in increased revenues [105]. Previous empirical studies have suggested that high-quality service positively impacts customer satisfaction and loyalty across several businesses [106,107,108,109]. Thus, the following hypotheses, contextualized during disasters, were derived:
H9. 
Serv Qual has a positive influence on customer satisfaction.
H10. 
Serv Qual has a positive influence on customer loyalty.

2.7. Customer Satisfaction

Customer satisfaction underscores the significance of creating value for customers by understanding their needs, meeting their expectations, and exemplifying an eagerness and sincerity in satisfying such needs [110]. Satisfaction is a “post-consumption” experience that compares perceived and expected quality [111]. According to Ranaweera and Prabhu [112], satisfied and happy customers have a greater retention and higher likelihood of putting forward positive word of mouth, leading to financial benefits for the organization. Consequently, Anderson [113] revealed that customer dissatisfaction in service businesses could have an unpleasant effect that might even be more concerning than the positive effects of customer satisfaction. Customer satisfaction or dissatisfaction has been regarded as a core indicator of customer loyalty [114,115]. While customer satisfaction does not always represent customer loyalty, it particularly leans in that direction, especially during disasters. Thus, the following hypothesis was developed:
H11. 
Customer satisfaction positively influences customer loyalty.

2.8. Customer Loyalty

Loyalty pertains to customers’ intellectual and emotional responses toward the quality and output of a specific service [116], which affect their repurchase decisions with the same service provider [117]. The significance of customer loyalty is closely related to profitable growth [118]. Thus, retaining the loyalty of existing customers is more of a priority than establishing new relationships [119]. Especially in the advent of a disaster, even the most established and experienced service providers must be knowledgeable about initiating prompt strategic actions to retain their loyal customers [119]. Hence, gaining appropriate knowledge about the factors that affect customer loyalty when establishing customer relationships becomes imperative. Consequently, many works have supported the positive influence of customer satisfaction on customer loyalty [120]. Nonetheless, some contradictions exist in the direct link between customer satisfaction and customer loyalty (e.g., [121]. This contradicting relationship between customer satisfaction and customer loyalty can be attributed to several factors, which may be more pronounced during disasters. Thus, this work attempts to evaluate this relationship between customer satisfaction and customer loyalty, considering the effects of massive disruptions caused by disasters (e.g., typhoons). The proposed conceptual model is shown in Figure 1.

3. Methods

3.1. Instrument

The measurement items of the constructs in the proposed model were anchored on a comprehensive literature review (see Appendix A). Service recovery (SR) had five measurement items; service innovation had four; brand image (BI) had five; perceived value (PV) had four; customer loyalty (CL) had five; customer satisfaction (CS) had four; responsiveness (RS) had five; reliability (RY) had four; empathy (E) had four; tangibility (T) had four; and assurance (A) had four measurement items which were adopted from various works. Experts refined these measurement indicators and the wording was revised in the context of customer satisfaction and loyalty during a post-disaster situation. The survey instrument measured all the constructs, utilizing the 7-point Likert scale. The measurement items of all the constructs ranged from “strongly disagree” to “strongly agree.” A pretest was conducted to identify further improvements to the instruction, question content, difficulty, wording, sequence, form, and layout of the questionnaire. The pretest was distributed to a small sample of ten respondents, and all necessary changes based on their feedback were performed before the actual collection was performed.

3.2. Data Collection

The participants of the study were residents in areas that were significantly affected by Typhoon Odette in Cebu, Philippines. Cebu is an important commercial hub located in the central Philippines, second to the Philippine capital Manila. Typhoon Odette dominantly struck the urban districts of Cebu, crippling the capital city (i.e., City of Cebu) and the two largest neighboring highly urbanized cities (i.e., Mandaue and Lapu-Lapu) outside the Philippine capital. The following requirements were set to characterize the study participants: (1) primary subscribers (i.e., payor) of a cabled internet provider, (2) aged 18 years old and above, and (3) residing in Cebu during the duration of Typhoon Odette and its aftermath. The data were collected from the participants through a mix of convenient sampling techniques based on the available networks of the research team and a component of randomized sampling, by posting the link of the questionnaire on publicly available platforms such as social media sites and university websites. Furthermore, an additional effort to randomize the sampling technique was utilized by employing enumerators. Six enumerators hired by the research team were tasked to distribute the questionnaires to participants in pre-defined communities throughout Cebu province (Supplementary File S1). On the other hand, the convenience sampling selected participants who were qualified, accessible, and information-rich sources [122]. The convenient sampling technique used networks spread across the island of Cebu, where the typhoon made landfall on the evening of 16 December 2021. The questionnaire was distributed from 5 April 2022 until 26 April 2022, spanning three weeks. This period is plausible, as the disruption following the typhoon lasted until the end of February 2021. The data were gathered online (e.g., through Google Forms) and from personally administered survey questionnaires. This work utilized online surveys for a more efficient data gathering and analysis. The personally administered questionnaire survey allowed the research team to probe the answers, randomize the sample, and address the weakness of the convenient sampling. The rule of thumb suggests that the minimum sample size should be ten times the maximum number of arrows pointing to the latent variable in the PLS path model [123]. Hence, for this work, the minimum sample size, in adherence to Hair et al. [123], was 110. There were 801 responses collected, 255 of which were from the personally administered questionnaire surveys and 546 of which were from the online surveys. Of the 801, only 584 were valid and used for the final analysis. As Hair et al. [37] suggested, 216 responses were excluded due to unengaged responses, ineligibility issues of the participants, and some incomplete answers. Cross-checking interviews were then conducted with the participants who explicitly expressed their willingness to offer certain views on the study findings. Of the 584 valid responses from distinct participants, only 298 agreed to participate in the cross-checking interviews. Of those 298 who expressed agreement, only 216 were contacted by the research team.

3.3. Profile of the Participants

The survey participants were mostly 18 to 24 years old (44.69%), female (57.36%), and had an income of less than $181.75 (32.02%). The participants had been subscribers of internet service providers for three years or more (30.48%) or 13–24 months (27.91%). They utilized the internet for work (42.12%) and school (41.78%), since most of them were students (30.48%) or in teacher training or education (21.40%). Over half of the participants did not add another internet provider after the typhoon to supplement their cabled internet at home (64.38%). Additionally, most did not switch to a different internet provider after the typhoon (69.35%). The summary of their profiles is shown in Table 1.

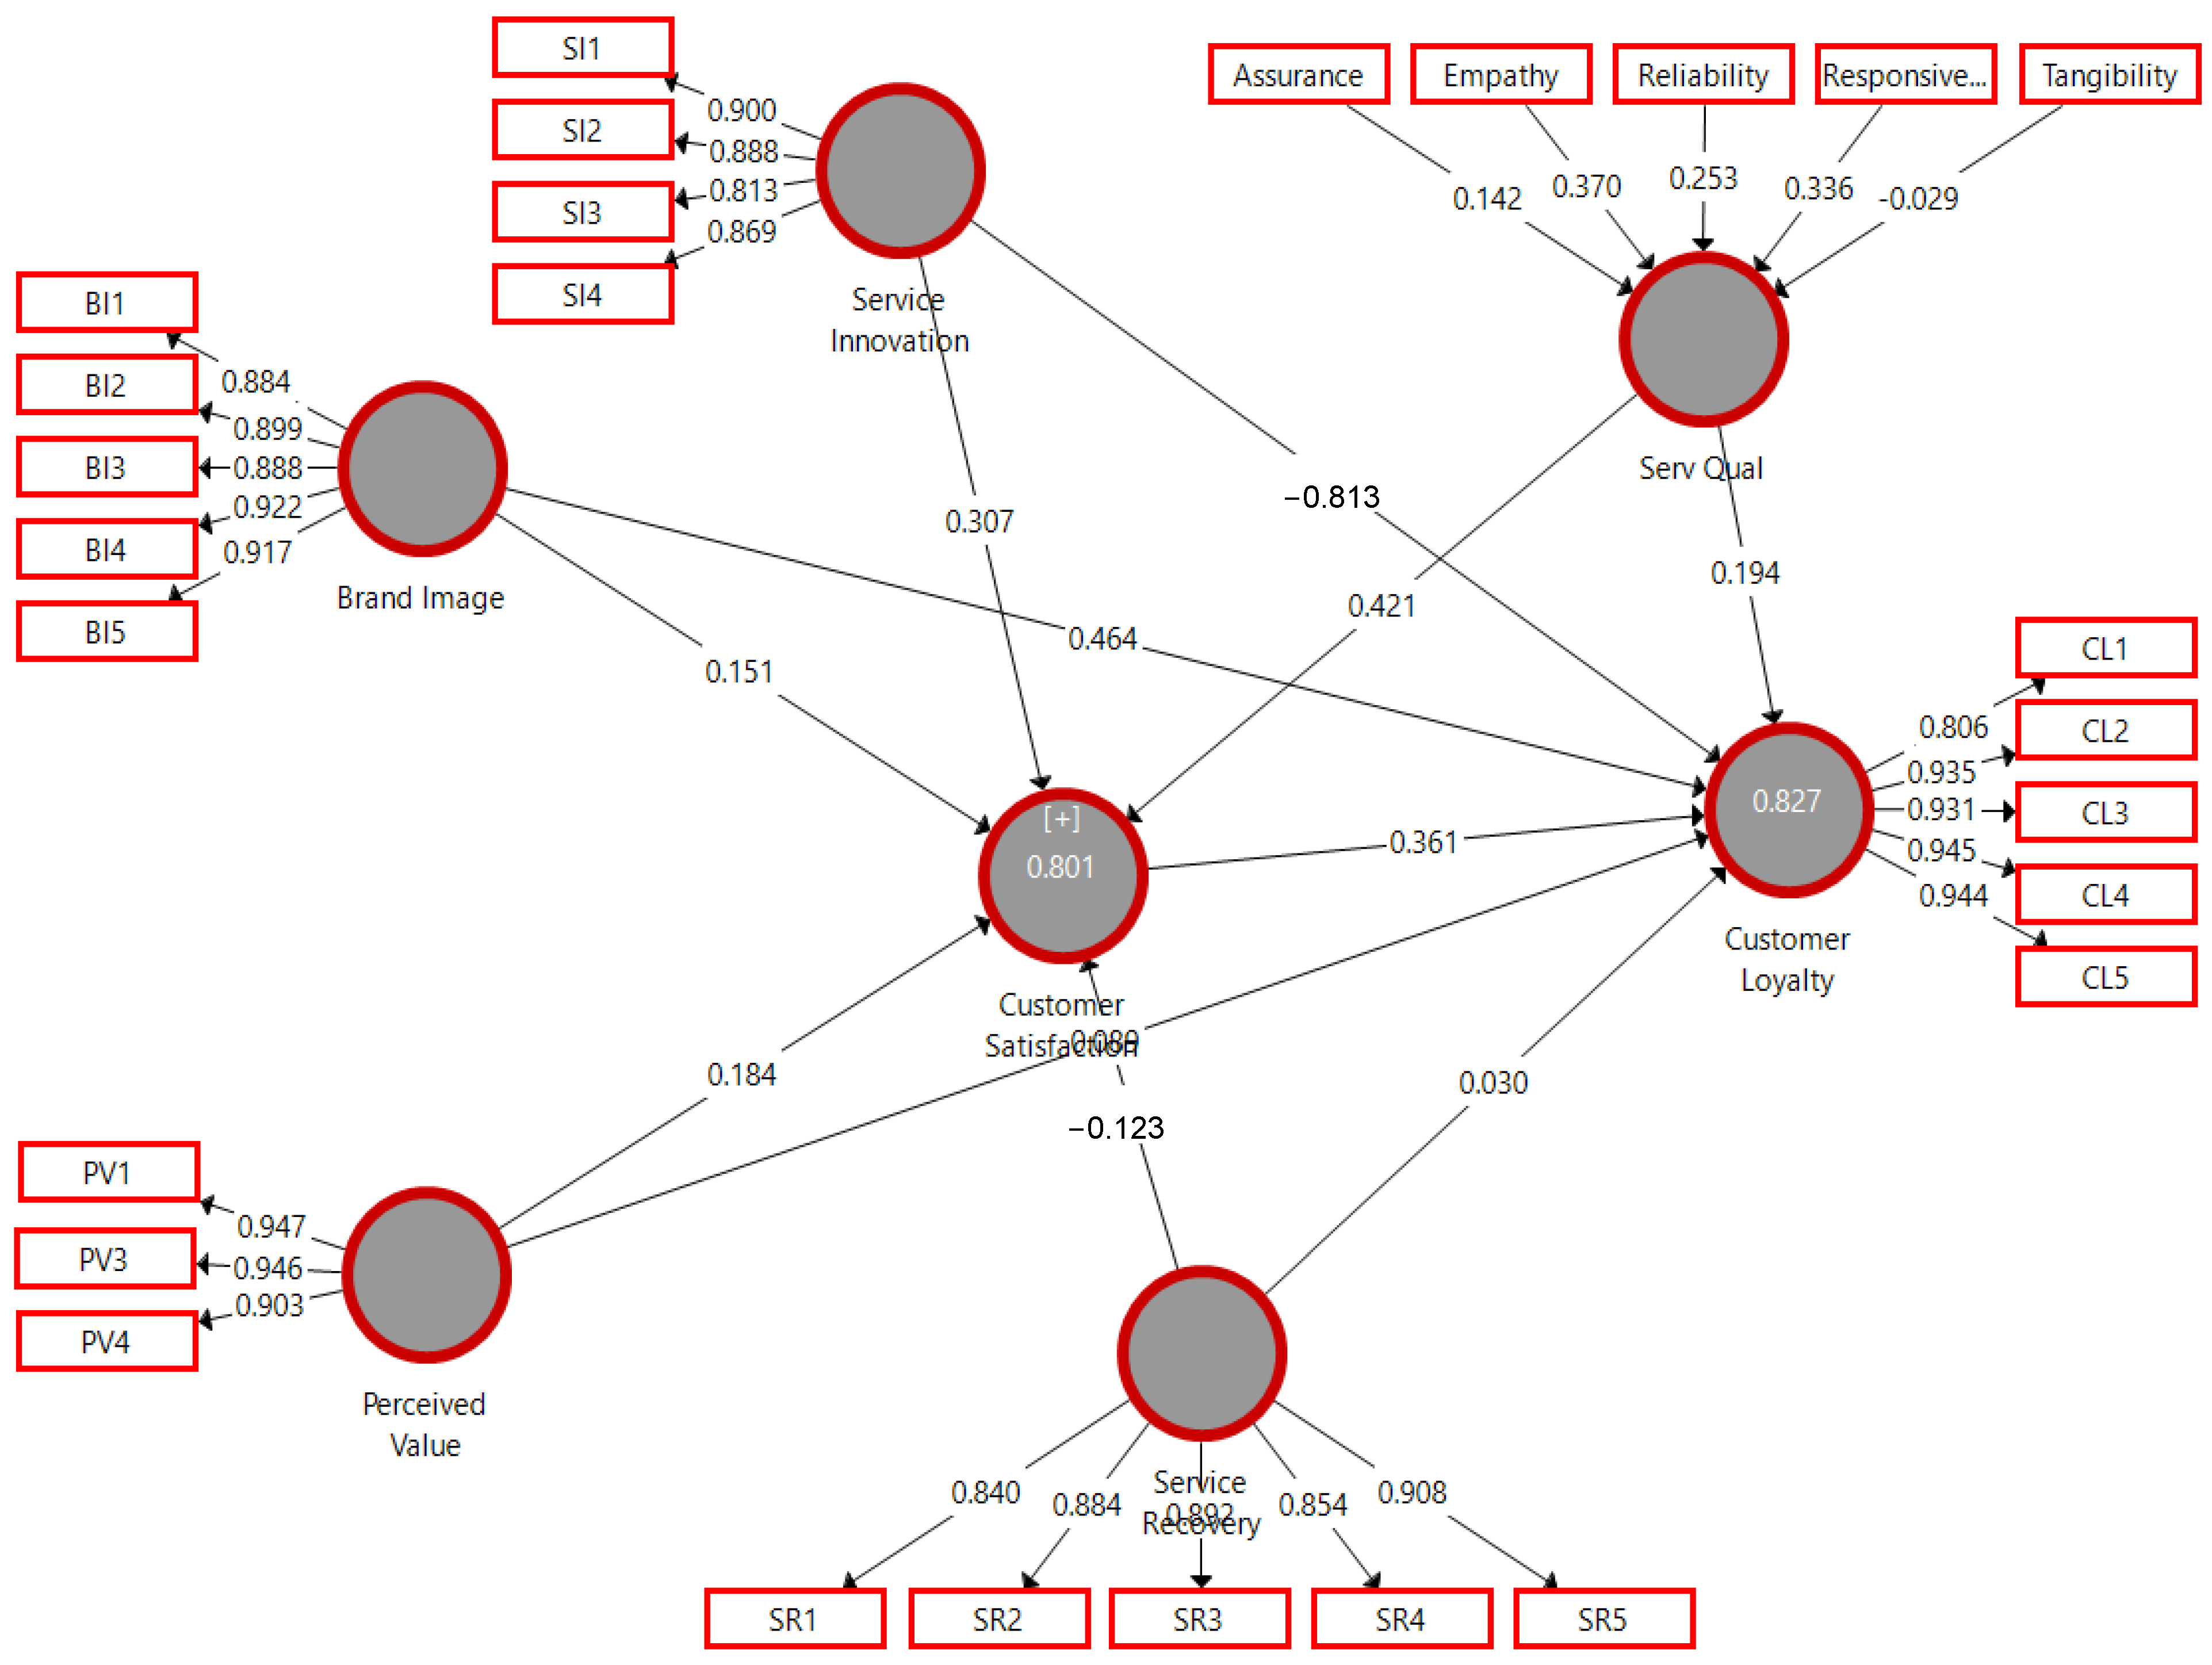
3.4. Data Analysis Results

  • Measurement model assessment
In PLS-SEM, the first criterion for evaluating the model is an assessment of the reliability and validity of the measures [37]. The measurement model assessment result shows that all the indicators were convergent and reliable, as shown in Table 2, where the factor loading for each item is above the threshold value of 0.70 [39]. Additionally, the AVE statistics for each construct range from 0.753 to 0.869, which is higher than the proposed threshold of 0.5 [124]. This indicates that all the constructs in the model had an appropriate convergent validity. In addition, the measures were all reliable, with all the constructs being above the Cronbach’s alpha (α) and composite reliability (CR) threshold value of 0.70 [37].
The AVE of the constructs supported the discriminant validity, which was higher than the squared correlation of each latent variable [124]. The values in bold in Table 3 are the square roots of the AVE, while the values not in bold signify the intercorrelation values between the constructs. The Fornell and Larker’s condition is met with all the off-diagonal values less than the square roots of the AVE.
  • Structural model assessment
The predictive ability of the model’s endogenous variables was tested in this study, which was one of the results of the PLS-SEM [125]. The strength of the path coefficients, R2 values (prediction power), and f2 (effect size) were the main criteria for evaluating the structural model using PLS-SEM [37]. The path coefficient results of the structural model supporting the proposed hypotheses are summarized in Table 4 and presented in Figure 2. Seven of the eleven hypotheses were supported and four (H1, H2, H3, and H5) were not supported.
Figure 2 shows the structural model’s prediction accuracy, as measured by its R2. The rule of thumb for the acceptability of R2 is that 0.75, 0.50, and 0.25 suggest substantial, moderate, and modest levels of prediction accuracy, respectively [39,126]. In the model, the R2 results show that CL was explained as the highest variance with an R2 of 0.827 (83%). Additionally, CS had a high variance explained, with an R2 of 0.801 (80%).
Using the PLS algorithm, effect sizes (f2) of 0.02, 0.15, and 0.35 were calculated, indicating small, medium, or significant effects, respectively, on the relationship between the exogenous and endogenous constructs [37]. A value of less than 0.02 indicates no effect of the exogenous constructs on an endogenous construct. The f2 result showed that BI and CS had medium effects, while SQ and SI had small effects on CL. However, PV and SR did not affect CL. In addition, SQ had a medium effect, while PV, SI, and SR had small effects on CS. However, BI had no effect on CS. The results are summarized in Table 5.

4. Discussion

This work proposed a customer loyalty model for during disasters, utilizing the Serv Qual dimensions to assess the customer satisfaction and customer loyalty to internet service providers in the case of the Typhoon Odette disruption in the urban districts of the southern Philippines. In addition, driven by various insights in the literature, additional constructs of brand image, service recovery, service innovation, and perceived value were integrated into causal relationships. The PLS-SEM path coefficients of the proposed model showed that seven hypotheses were supported and four were not supported. We first highlighted the positive influence of CS on CL (H11), supporting many previous findings (e.g., [113,115]). Once customers are satisfied with the delivery of their services (i.e., internet), they tend to maintain loyalty to their service providers. Walsh et al. 2008 [114] observed that customer satisfaction is fulfilled with the service being delivered with employee attentiveness, courtesy, and promptness. These characteristics are highly relevant in the aftermath of disasters, when customers are experiencing emotional distress at varying degrees.
The findings also showed that SR did not have a significant direct influence on CL (H1). This implies that the efforts of internet service providers to recover from the poor service brought about by typhoons did not influence their loyalty. Similarly, H2 was not supported, contradicting some previous findings (e.g., [70]). Surprisingly, H2 had β = −0.123, implying an inverse relationship between SR and CS. This indicates that the SR manifestations (i.e., apologizing, explaining, making offers of compensation, and being courteous in the process) during Typhoon Odette decreased CS. The cross-checking interviews with 216 study participants regarding this finding revealed some insights. One possible explanation suggests that the repeated SR efforts of the internet service providers were viewed negatively by the customers who were experiencing repeated service failures despite such efforts. Such a scenario of repeated service failures immediately following the disaster was experienced by around 89% (193 out of 216) of the participants who participated in the cross-checking interviews. In effect, due to the failure of the providers to effectively respond to customer complaints, the customers viewed any subsequent SR efforts as other failures, contributing directly to their dissatisfaction. A real-life scenario shared by one of the participants can be considered as an example of how this service recovery led to customer dissatisfaction. After Typhoon Odette hit, the participant visited their internet service provider’s customer hub eight days later to inquire about the possible date of internet access restoration at their home. The provider apologized and explained that extensive road-clearing efforts and the painstaking task of reconnecting the damaged lines would take two weeks to restore the internet access. However, after the two-week promise, the participant was still unable to access the internet, despite making several calls to the provider over the next two weeks. This situation illustrates how service recovery can exacerbate customer dissatisfaction. The provider promised the participant the restoration of internet access, but failed to follow through. Moreover, when the participant tried to reach out to the provider to get an update on the situation, negative responses persisted, which only added to their frustration. In this case, the provider’s attempts to recover the service did not meet the customer’s expectations, leading to further dissatisfaction.
On the other hand, the SI initiatives of internet service providers negatively influenced CL (i.e., not supporting H3, β = −0.183), but positively affected CS (H4). H4 indicates that service enhancements developed for maintenance plans, customer support, information, warranties, and guarantees by internet providers improve customers’ service experience and contribute to their satisfaction; however, surprisingly, this diminishes loyalty (H3) during disasters. Recent findings supported H4 (e.g., [30,127]) but not H3 (e.g., [28]. The cross-checking interviews were also conducted to establish the rationale for this surprising insight into H4. One theoretical implication draws from the possible “mediating” effect of CS. In this case, the presence of CS reverses the initially positive relationship between SI and CL. In some technology-driven services, we can view CS as having minimum and maximum tolerance limits, i.e., CS is satisfied if SI achieves at least a “minimum” threshold and increases until it reaches a “maximum” value. Beyond the maximum, any SI initiatives do not create any more value and, to some extent, may be detrimental to CL. One plausible case is the overshooting of innovations for cars, such that users become overwhelmed with these innovations. In the case of Typhoon Odette, the participants noted that internet service providers added an automated queuing system for queries that frustrated customers, which may have resulted in brand switching. The system exacerbated the long queues of customers who wanted an update on the restoration efforts of their internet service providers. Despite this innovation, customer loyalty degraded and some customers (i.e., less than 35%) added another provider to supplement their cabled internet, as indicated in Table 1. Furthermore, PV had no significant influence on CL (H5), but had a significant influence on CS (H6), suggesting that customer perceptions of the value of an internet service during a disaster situation, in terms of value for money, affects their satisfaction [128], but not their loyalty [83]. Such an apparent “mediating” relationship can be explained by the minimum threshold of CS that must be achieved to affect CL. As Ramseook-Munhurrun et al. [83] explained it, the sole feeling of the value does not create CL.
In addition, the BI of internet service providers significantly influenced both CS (H7) and CL (H8). This indicates that customers’ beliefs and impressions of a brand induce satisfaction and loyalty. Similarly, it has been observed that developing a good BI would lead to an increase in CS, which results in customers giving good recommendations to others [88]. Moreover, a positive BI could influence CL, so that customers would repurchase more services and recommend the brand to others [87]. Combined with our insights on H1, this finding of H8 offers an interesting theoretical implication. These two suggest that, regardless of the absence of SR activities during extreme disruptions caused by a disaster, as long as customers’ perceptions of the reputation of and their experience with an internet service provider are positive, these customers would likely maintain their loyalty. One possible implication is that customers may perceive the poor service they are experiencing immediately after a disaster as temporary and unlikely to happen in the long run. In addition, SQ influenced both CS (H9) and CL (H10). This implies that if a customer receives the level of service they deserve, their loyalty will improve, and consequently, the organization’s reputation will have a significant positive impact. On the contrary, Fraering and Minor [129] suggested that if the service (i.e., internet connection) is unpleasant, customers are more likely to switch to another internet service provider. This observation is supported by a significant number of recent works in this domain in the literature, including Dhingra et al. [130], Khan et al. [131], Tzavlopoulos et al. [132], and Özcan et al. [133], among others. This implies that overall good feelings of customers towards their internet service providers are related to how happy they are with the quality of the services they receive, which may indicate their willingness to stay even after a disaster.
Considering the values of the path coefficients, BI was the strongest predictor of CL (β = 0.464). Thus, internet service providers must create a positive customer brand image. As customers’ perceptions of BI change over time, internet service providers must consistently maintain a strong reputation founded on credibility and equity among their customers. For instance, they may offer equitable services to their customers (i.e., gender and income) during disruptive situations to improve their BI and create a disaster-resilient BI. CS was the second strongest predictor of CL (β = 0.361) and SI was the main antecedent of CS (β = 0.307). Thus, innovation is constantly needed to improve service delivery and affect CS. Disruptive situations may require SI to cater to customers’ abrupt and sudden needs, which may affect their satisfaction. Internet service providers may improve resources (e.g., financial and human), processes, and facilities, reduce service failures, and offer disaster-resilient features. However, this agenda must be implemented with caution, following the insight of H3, as this may result in decreased CL. Finally, several works in the literature have supported the influence of SQ on CS, which was also strongly supported in this case of disaster aftermath (β = 0.421). Internet service providers must plan for consistent service quality delivery, even in a disaster.

5. Conclusions

5.1. Theoretical Implications

Despite the popularity of exploring the factors associated with customer loyalty, understanding such an agenda in the face of extreme disaster-induced disruptions is scarce in the literature. Thus, this work proposes a theoretical model that explains customer loyalty during disasters and empirically tests it in the case of internet service providers in the central Philippine urban districts experiencing the disruptions caused by Typhoon Odette. Such an agenda informs the design of initiatives for service providers to maintain better customer relations. In the process of achieving this, much learning is realized to improve customer welfare, especially given the internet as a critical component in the disaster responses of both the government and communities. Due to the complexities present in urban environments, where disruptions caused by disasters become more pronounced, the model offered in this work supports certain directions toward urban resilience. The proposed model integrates service innovation, service recovery, brand image, perceived value, and service quality to explain customer satisfaction and loyalty. This work offers several theoretical underpinnings. First, the work emphasizes that service recovery during disasters does not always translate to customer satisfaction and loyalty, due to the possible negative customer perceptions of repeated failures in the service recovery efforts carried out by internet service providers. Secondly, service innovation during disasters enhances customer satisfaction with the service provided. However, these service innovations adversely affect customer loyalty following possible instances of overshooting innovations implemented in internet services, which may decrease loyalty. Third, perceived value contributes to customer satisfaction but does not transcend to developing customer loyalty. This work substantiates the vast effects of brand image and service quality even during a disaster, as they influence customer satisfaction and loyalty, supporting similar insights in the literature. Finally, post-disaster customer satisfaction is a strong predictor of customer loyalty. Due to the efficacy of the proposed model in explaining customer loyalty amidst disasters and its subsequent findings, this work advances important gaps in the literature.

5.2. Practical Implications

These insights contribute to the practice of understanding customer loyalty amidst disaster-induced disruptions. Internet service providers must be reliable when offering service recovery efforts, as repeated failures may decrease customer loyalty. Streamlined project management activities may help to ensure that their necessary disaster recovery plan is implemented effectively, given the increasing customer requests during disasters. It is also noteworthy that the direction of the service innovation must be consistent with value creation to avoid overshooting innovations, particularly during disasters where customers require an efficient response. Perceived value does not translate to customer loyalty unless the desired level of customer satisfaction is achieved. Thus, internet service providers must examine their service design in view of customer requirements, especially during disasters, when customer loyalty becomes a goal. This study also suggests that brand image, regardless of the presence of service recovery initiatives, strongly influences customers to retain their internet service providers. Customers are more mindful of a good reputation and consistent service quality in their brand choice and service providers must establish initiatives that enhance these agendas.

5.3. Limitations and Future Research

The empirical findings may be considered in light of some limitations. The data were collected over four months after Typhoon Odette, which may have limited the respondents’ ability to recall and retrieve information, thus affecting the accuracy of the data [134]. The sample was drawn online and supplemented with personally administered surveys. Most of the respondents were 18 to 24 years old and resided in areas significantly affected by typhoons. The samples were limited to the primary subscribers of cabled home internet service providers. Furthermore, this work is contextualized in the case of typhoons. Thus, other types of disasters may be considered for future investigation.
As our findings suggest, BI is the strongest predictor of CL in the context of internet service providers. Thus, internet service providers must focus on creating a positive BI for their customers. The reputation of the internet provider affects their customer loyalty. Future works on the factors that influence BI in the context of internet services are deemed relevant. In addition, CS is the second strongest predictor of CL. The highest antecedent of CS is service innovation. Thus, there is a constant need to innovate in order to improve service delivery. Disruptive situations may require SI to cater to the abrupt and sudden needs of customers during a disaster, affecting their satisfaction. Additionally, SQ influences CS. On the other hand, SR and PV predict customer satisfaction, but indirectly support CL. There were also relatively few works on SI and SR in the literature. Further studies on their influences on SQ and BI may be considered. Additionally, it is worth considering the mediating effect of CS between SR and CL, and PV and CL. Future studies that include non-cabled internet providers could provide a comprehensive and diverse analysis of CS and CL in disaster situations. There were also relatively few works on SI and SR in the literature. Future studies on their influences on SQ and BI must be considered. Further studies on the mediating effect of SI on CS would address the scarce empirical findings in the literature. Finally, investigating the moderating roles of age, gender, and socioeconomic status between the constructs may be considered.

Supplementary Materials

The following supporting information can be downloaded at: https://www.mdpi.com/article/10.3390/urbansci7020055/s1, File S1: Customer loyalty to an internet service provider after Typhoon Odette.

Author Contributions

Conceptualization, R.S., D.M.R., A.A., K.Y. and L.O.; methodology, A.B. and K.Y.; software, A.B. and K.Y.; validation, R.S., D.M.R., A.A., N.M.A., J.L.A., A.B., K.Y. and L.O.; formal analysis, R.S., D.M.R., A.A., N.M.A., J.L.A., A.B., K.Y. and L.O.; investigation, A.B., K.Y. and L.O.; resources, L.O.; data curation, R.S., D.M.R., A.A., N.M.A., J.L.A. and K.Y.; writing—original draft preparation, R.S., D.M.R., A.A., N.M.A., J.L.A., A.B., K.Y. and L.O.; writing—review and editing, R.S., D.M.R., A.A., N.M.A., J.L.A., A.B., K.Y. and L.O.; visualization, N.M.A., J.L.A., K.Y. and L.O.; supervision, L.O.; project administration, L.O.; funding acquisition, L.O. All authors have read and agreed to the published version of the manuscript.

Funding

This research is funded by the 2019 CHED Institutional Development and Innovation Grant entitled “Creation of Interdisciplinary Graduate Program Courses for Applied Mathematics and Operations Research as Tools for Innovation”.

Data Availability Statement

Data will be made available upon request.

Acknowledgments

We acknowledge the financial support provided by the Commission on Higher Education of the Republic of the Philippines through the 2019 CHED Institutional Development and Innovation Grant.

Conflicts of Interest

The authors declare no conflict of interest.

Appendix A. Measurement Indicators

ConstructsIndicatorsReferences
Service recovery
(SR)
SR1. After Typhoon Odette, the home internet service provider responded promptly to resolve my problems (i.e., slow or no connectivity).[135,136,137,138,139,140,141]
SR2. After the destruction of Typhoon Odette, I am satisfied with the way my problem was solved by the home internet service provider.[136,137,138,139,141,142]
SR3. After Typhoon Odette, the customer care service of the home internet service provider explained efficiently what factors may have contributed to the issue or problem.[137,138,140,142,143]
SR4. Considering the inconvenience experienced after Typhoon Odette, the compensation I obtained from the home internet service provider was reasonable.[135,137,138,139,140]
SR5. The home internet service provider has fair policies and practices in handling the problems encountered after Typhoon Odette.[137,143]
Service innovation
(SI)
SI1. After Typhoon Odette, the home internet service provider has improved its service products[144]
SI2. After Typhoon Odette, the home internet service provider has improved its existing service development processes.[144,145]
SI3. After Typhoon Odette, the home internet service provider has reduced the possibility of any of its services failing.[137,145]
SI4. After Typhoon Odette, the home internet service provider offered new features versus competitive services.[144,145,146]
Brand image
(BI)
BI1. The home internet service provider has improved the features of their services after the problems caused by Typhoon Odette.[77,85,147,148,149,150,151]
BI2. Despite the destruction caused by Typhoon Odette, the home internet service provider’s service has better value for money.[151,152]
BI3. After Typhoon Odette, the home internet service provider offers a new broad range of products.[151,152]
BI4. After Typhoon Odette, the home internet service provider continues to provide business in an ethical way.[77,151]
BI5. After Typhoon Odette, the home internet service provider is still maintaining the quality of their services.[77,151,153]
Perceived value
(PV)
PV1. After Typhoon Odette, the service quality of the home internet service provider is adequate considering the price I paid.[136,154]
PV2. After Typhoon Odette, compared with its competitors, this home internet service provider has good prices with better services.[136,154]
PV3. After Typhoon Odette, my previous experiences with this home internet service provider were more positive than negative.[136,155]
PV4. After Typhoon Odette, my relationship with the home internet service provider has become very beneficial to us.[82,155]
Customer loyalty
(CL)
CL1. After Typhoon Odette, I will continue my subscription to the home internet service provider in the future.[128,156,157]
CL2. After Typhoon Odette, I will still recommend this home internet service provider to my friends.[128,157]
CL3. After Typhoon Odette, I will still favor this home internet service provider, by a long way.[102,157]
CL4. After Typhoon Odette, I am pleased with the home internet service provider’s coverage or offers.[154,157]
CL5. After Typhoon Odette, the probability of switching to another home internet service provider is very unlikely.[128,157,158]
Customer satisfaction
(CS)
CS1. After Typhoon Odette, my subscription experience with the home internet service provider made me satisfied.[82,128]
CS2. After Typhoon Odette, my choice to stay with my home internet service provider was a wise one.[128,159,160,161]
CS3. After Typhoon Odette, I feel satisfied with the services offered by the home internet service provider.[82,128,159,160,161]
CS4. After Typhoon Odette, the home internet service provider meets all my needs.[128,158,159,160,161]
Responsiveness
(RS)
RS1. After Typhoon Odette, I receive immediate service from the employees of the home internet service provider.[95]
RS2. After Typhoon Odette, employees of the home internet service provider are always willing to help customers.[102]
RS3. After Typhoon Odette, employees of the home internet service provider respond to customer requests promptly.
RS4. After experiencing Typhoon Odette, the home internet service provider’s helpline is easily accessible.[95]
RS5. After experiencing Typhoon Odette, the employees of the home internet service provider continue to exhibit their supportive nature.
Reliability
(RY)
RY1. After Typhoon Odette, when I have problems, the home internet service provider is sympathetic and reassuring.[102]
RY2. After Typhoon Odette, the home internet service provider continues to be dependable.
RY3. After Typhoon Odette, the home internet service provider provides its services at the time it promises to do so.
RY4. After Typhoon Odette, the home internet service provider continues to keep its customer records (i.e., billing statements) accurately.
Empathy
(E)
E1. After Typhoon Odette, the home internet service provider employees give me proper attention.[82,162]
E2. After Typhoon Odette, the home internet service provider employees are knowledgeable about my specific needs.
E3. After Typhoon Odette, the home internet service provider operates according to business hours convenient to most customers.
E4. After Typhoon Odette, the home internet service provider prioritizes my best interest.
Tangibility
(T)
T1. The physical facilities of the home internet service providers are still structurally sound even after Typhoon Odette.[82,162]
T2. The materials associated with the services provided by the home internet service provider are still visually appealing even afterTyphoon Odette.
T3. Informative materials regarding the services offered by the home internet service provider are visually appealing at their physical facility.
T4. After Typhoon Odette, the employees (i.e., technicians, customer service) of the home internet service provider are properly dressed.
Assurance
(A)
A1. After Typhoon Odette, the employees of the internet service providers instill confidence in their customers.[82,162]
A2. After Typhoon Odette, I feel safe doing transactions (e.g., payments and inquiries) with internet service providers.
A3. After Typhoon Odette, the employees of the internet service providers are consistently courteous.
A4. The employees of the internet service providers have the knowledge to answer my questions regarding the problems caused by Typhoon Odette.

References

  1. Botzen, W.J.W.; Deschenes, O.; Sanders, M. The Economic Impacts of Natural Disasters: A Review of Models and Empirical Studies. Rev. Environ. Econ. Policy 2019, 13, 167–188. [Google Scholar] [CrossRef]
  2. Wijkman, A.; Timberlake, L. Natural Disasters: Acts of God or Acts of Man? Routledge: New York, NY, USA, 2021. [Google Scholar]
  3. Kwasinski, A. Telecommunications outside Plant Power Infrastructure: Past Performance and Technological Alternatives for Improved Resilience to Hurricanes. In Proceedings of the INTELEC 2009—31st International Telecommunications Energy Conference, Incheon, Republic of Korea, 18–22 October 2009; pp. 1–6. [Google Scholar]
  4. Lagmay, A.M.F.; Agaton, R.P.; Bahala, M.A.C.; Briones, J.B.L.T.; Cabacaba, K.M.C.; Caro, C.V.C.; Dasallas, L.L.; Gonzalo, L.A.L.; Ladiero, C.N.; Lapidez, J.P.; et al. Devastating storm surges of Typhoon Haiyan. Int. J. Disaster Risk Reduct. 2015, 111, 1–12. [Google Scholar] [CrossRef]
  5. Kousky, C.; Palim, M.; Pan, Y. Flood Damage and Mortgage Credit Risk: A Case Study of Hurricane Harvey. J. Hous. Res. 2020, 29, S86–S120. [Google Scholar] [CrossRef]
  6. Tay, C.W.J.; Yun, S.-H.; Chin, S.T.; Bhardwaj, A.; Jung, J.; Hill, E.M. Rapid flood and damage mapping using synthetic aperture radar in response to Typhoon Hagibis, Japan. Sci. Data 2020, 7, 100. [Google Scholar] [CrossRef] [PubMed]
  7. Yamamura, H.; Kaneda, K.; Mizobata, Y. Communication problems after the great East Japan earthquake of 2011. Disaster Med. Public Health Prep. 2014, 8, 293–296. [Google Scholar] [CrossRef]
  8. Gomes, T.; Tapolcai, J.; Esposito, C.; Hutchison, D.; Kuipers, F.; Rak, J.; De Sousa, A.; Iossifides, A.; Travanca, R.; André, J.; et al. A Survey of Strategies for Communication Networks to Protect against Large-Scale Natural Disasters. In Proceedings of the 2016 8th International Workshop on Resilient Networks Design and Modeling (RNDM), Halmstad, Sweden, 13–15 September 2016; pp. 11–22. [Google Scholar]
  9. Chang, S.E. Socioeconomic Impacts of Infrastructure Disruptions. In Oxford Research Encyclopedia of Natural Hazard Science; Oxford University Press: Oxford, UK, 2016. [Google Scholar] [CrossRef]
  10. Simpson, D.M.; Lasley, C.B.; Rockaway, T.D.; Weigel, T.A. Understanding critical infrastructure failure: Examining the experience of Biloxi and Gulfport, Mississippi after Hurricane Katrina. Int. J. Crit. Infrastruct. 2010, 6, 246–276. [Google Scholar] [CrossRef]
  11. Goodarzian, F.; Bahrami, F.; Shishebori, D. A new location-allocation-problem for mobile telecommunication rigs model under crises and natural disasters: A real case study. J. Ambient. Intell. Humaniz. Comput. 2022, 13, 2565–2583. [Google Scholar] [CrossRef]
  12. Spialek, M.L.; Houston, J.B. The development and initial validation of the citizen disaster communication assessment. Commun. Res. 2018, 45, 934–955. [Google Scholar] [CrossRef]
  13. Marchetti, N. (Ed.) Telecommunications in Disaster Areas; River Publishers: Gistrup, Denmark, 2011; Volume 12. [Google Scholar]
  14. Jung, N.Y.; Seock, Y.K. Effect of service recovery on customers’ perceived justice, satisfaction, and word-of-mouth intentions on online shopping websites. J. Retail. Consum. Serv. 2017, 37, 23–30. [Google Scholar] [CrossRef]
  15. Cheng, B.L.; Gan, C.C.; Imrie, B.C.; Mansori, S. Service recovery, customer satisfaction and customer loyalty: Evidence from Malaysia’s hotel industry. Int. J. Qual. Serv. Sci. 2018, 11, 187–203. [Google Scholar] [CrossRef]
  16. Maamari, B.E.; Wasfi, H.S. The effects of service recovery on customer satisfaction and customer loyalty in banks. Int. J. Technol. Mark. 2020, 14, 403–424. [Google Scholar] [CrossRef]
  17. Sitorus, T.; Yustisia, M. The influence of service quality and customer trust toward customer loyalty: The role of customer satisfaction. Int. J. Qual. Res. 2018, 12, 639. [Google Scholar]
  18. O’Cass, A.; Heirati, N. Mastering the complementarity between marketing mix and customer-focused capabilities to enhance new product performance. J. Bus. Ind. Mark. 2015, 30, 60–71. [Google Scholar] [CrossRef]
  19. Wen, B.; Chi, C.G.Q. Examine the cognitive and affective antecedents to service recovery satisfaction: A field study of delayed airline passengers. Int. J. Contemp. Hosp. Manag. 2013, 25, 306–327. [Google Scholar] [CrossRef]
  20. Parasuraman, A.; Zeithaml, V.A.; Berry, L.L. A conceptual model of service quality and its implications for future research. J. Mark. 1985, 49, 41–50. [Google Scholar] [CrossRef]
  21. Ji, C.; Li, J.; Nie, Y. Effect of past experience on perceived service quality and customer satisfaction: The case of Chinese casino visitors. J. China Tour. Res. 2017, 13, 65–82. [Google Scholar] [CrossRef]
  22. Ariff, M.S.M.; Yun, L.O.; Zakuan, N.; Ismail, K. The impacts of service quality and customer satisfaction on customer loyalty in internet banking. Procedia Soc. Behav. Sci. 2013, 81, 469–473. [Google Scholar] [CrossRef]
  23. Gebremichael, G.B.; Singh, A.I. Customers’ expectations and perceptions of service quality dimensions: A study of the hotel industry in selected cities of Tigray Region, Ethiopia. Afr. J. Hosp. Tour. Leis. 2019, 8, 1–15. [Google Scholar]
  24. Borah, S.B.; Prakhya, S.; Sharma, A. Leveraging service recovery strategies to reduce customer churn in an emerging market. J. Acad. Mark. Sci. 2020, 48, 848–868. [Google Scholar] [CrossRef]
  25. Hegner, S.M.; Beldad, A.D.; Kraesgenberg, A.L. The impact of crisis response strategy, crisis type, and corporate social responsibility on post-crisis consumer trust and purchase intention. Corp. Reput. Rev. 2016, 19, 357–370. [Google Scholar] [CrossRef]
  26. Fearn-Banks, K. Crisis Communications: A Casebook Approach; Routledge: New York, NY, USA, 2016. [Google Scholar]
  27. Anning-Dorson, T. Interactivity innovations, competitive intensity, customer demand and performance. Int. J. Qual. Serv. Sci. 2016, 8, 536–554. [Google Scholar] [CrossRef]
  28. Yeh, T.M.; Chen, S.H.; Chen, T.F. The relationships among experiential marketing, service innovation, and customer satisfaction. A case study of tourism factories in Taiwan. Sustainability 2019, 11, 1041. [Google Scholar] [CrossRef]
  29. Lemy, D.; Goh, E.; Ferry, J. Moving out of the silo: How service quality innovations can develop customer loyalty in Indonesia’s hotels. J. Vacat. Mark. 2019, 25, 462–479. [Google Scholar] [CrossRef]
  30. Kiumarsi, S.; Isa, S.M.; Jayaraman, K.; Amran, A.; Hashemi, S. The effect of service innovation on service loyalty in post offices. Int. J. Bus. Innov. Res. 2020, 21, 108–127. [Google Scholar] [CrossRef]
  31. El-Adly, M.I.; Eid, R. Measuring the perceived value of malls in a non-Western context: The case of the UAE. Int. J. Retail. Distrib. Manag. 2015, 43, 849–869. [Google Scholar] [CrossRef]
  32. Polas, M.R.H.; Hossain, M.I.; Asheq, A.S.; Hossain, N.; Javed, M.A.; Nianyu, L. Assessing the Perceived Value of Customers for being Satisfied towards the Sustainability of Hypermarket in Malaysia. Int. J. Bus. Econ. Manag. 2019, 62, 248–263. [Google Scholar] [CrossRef]
  33. Appleby-Arnold, S.; Brockdorff, N.; Fallou, L.; Bossu, R. Truth, trust, and civic duty: Cultural factors in citizens’ perceptions of mobile phone apps and social media in disasters. J. Contingencies Crisis Manag. 2019, 27, 293–305. [Google Scholar] [CrossRef]
  34. United Nations Office for the Coordination of Humanitarian Affairs (UNOCHA). The Philippines. 2022. Available online: https://www.unocha.org/philippines (accessed on 15 April 2022).
  35. National Disaster Risk Reduction and Management Council. Situational Report for TC Odette. 2022. Available online: https://ndrrmc.gov.ph (accessed on 15 April 2022).
  36. Henseler, J.; Ringle, C.M.; Sarstedt, M. A new criterion for assessing discriminant validity in variance-based structural equation modeling. J. Acad. Mark. Sci. 2015, 43, 115–135. [Google Scholar] [CrossRef]
  37. Hair, J.F., Jr.; Hult, G.T.M.; Ringle, C.; Sarstedt, M. A Primer on Partial Least Squares Structural Equation Modeling (PLS-SEM); Sage Publications: Thousand Oaks, CA, USA, 2017. [Google Scholar]
  38. Sosik, J.J.; Kahai, S.S.; Piovoso, M.J. Silver bullet or voodoo statistics? A primer for using the partial least squares data analytic technique in group and organization research. Group Organ. Manag. 2009, 34, 5–36. [Google Scholar] [CrossRef]
  39. Henseler, J.; Ringle, C.M.; Sinkovics, R.R. The Use of Partial Least Squares Path Modeling in International Marketing. In New Challenges to International Marketing; Emerald Group Publishing Limited: Bingley, UK, 2009; pp. 277–319. [Google Scholar]
  40. Hair, J.F., Jr.; Sarstedt, M.; Hopkins, L.; Kuppelwieser, V.G. Partial least squares structural equation modeling (PLS-SEM): An emerging tool in business research. Eur. Bus. Rev. 2014, 26, 106–121. [Google Scholar] [CrossRef]
  41. Chin, W.W. The partial least squares approach to structural equation modeling. Mod. Methods Bus. Res. 1998, 29, 295–336. [Google Scholar]
  42. Gerbing, D.W.; Anderson, J.C. An updated paradigm for scale development incorporating unidimensionality and its assessment. J. Mark. Res. 1988, 25, 186–192. [Google Scholar] [CrossRef]
  43. Sarstedt, M.; Hair Jr, J.F.; Cheah, J.H.; Becker, J.M.; Ringle, C.M. How to specify, estimate, and validate higher-order constructs in PLS-SEM. AMJ 2019, 27, 197–211. [Google Scholar] [CrossRef]
  44. Celik, S. The Effects of Climate Change on Human Behaviors. In Environment, Climate, Plant and Vegetation Growth; Springer: New York, NY, USA, 2020; pp. 577–589. [Google Scholar]
  45. Centre for Research on the Epidemiology of Disaster [CRED]. Database (2021) EM-DAT Mapping Tool. Available online: http://www.emdat.be/database. (accessed on 12 May 2021).
  46. Heger, M.P.; Neumayer, E. The impact of the Indian Ocean tsunami on Aceh’s long-term economic growth. J. Dev. Econ. 2019, 14, 1102365. [Google Scholar] [CrossRef]
  47. Wallemacq, P.; Below, R.; McLean, D. UNISDR and CRED Report: Economic Losses, Poverty & Disasters (1998–2017); UNISDR: Geneva, Switzerland, 2018. [Google Scholar]
  48. Acosta, L.A.; Eugenio, E.A.; Macandog, P.B.M.; Magcale-Macandog, D.B.; Lin, E.K.H.; Abucay, E.R.; Cura, A.L.; Primavera, M.G. Loss and damage from typhoon-induced floods and landslides in the Philippines: Community perceptions on climate impacts and adaptation options. Int. J. Glob. Warm. 2016, 9, 33–65. [Google Scholar] [CrossRef]
  49. Yadav, D.K.; Barve, A. Segmenting critical success factors of humanitarian supply chains using fuzzy DEMATEL. Benchmark. Int. J. 2018, 25, 400–425. [Google Scholar] [CrossRef]
  50. Tsai, C.H.; Chen, C.W. The establishment of a rapid natural disaster risk assessment model for the tourism industry. Tour. Manag. 2011, 32, 158–171. [Google Scholar] [CrossRef]
  51. Esmalian, A.; Dong, S.; Coleman, N.; Mostafavi, A. Determinants of risk disparity due to infrastructure service losses in disasters: A household service gap model. Risk Anal. 2021, 41, 2336–2355. [Google Scholar] [CrossRef]
  52. Wang, M.; Burlacu, G.; Truxillo, D.; James, K.; Yao, X. Age differences in feedback reactions: The roles of employee feedback orientation on social awareness and utility. J. Appl. Psychol. 2015, 100, 1296. [Google Scholar] [CrossRef]
  53. Pescaroli, G.; Alexander, D. Critical infrastructure, panarchies and the vulnerability paths of cascading disasters. Nat. Hazards 2016, 821, 175–192. [Google Scholar] [CrossRef]
  54. Solimun, S.; Fernandes, A.A.R. The mediation effect of customer satisfaction in the relationship between service quality, service orientation, and marketing mix strategy to customer loyalty. J. Manag. Dev. 2018, 3, 76–87. [Google Scholar] [CrossRef]
  55. Murray, M.; Watson, P.K. Adoption of natural disaster preparedness and risk reduction measures by business organisations in Small Island Developing States—A Caribbean case study. Int. J. Disaster Risk Reduct. 2019, 39, 101115. [Google Scholar] [CrossRef]
  56. Shafei, I.; Tabaa, H. Factors affecting customer loyalty for mobile telecommunication industry. EuroMed J. Bus. 2016, 11, 347–361. [Google Scholar] [CrossRef]
  57. Helderop, E.; Grubesic, T.H. Streets, storm surge, and the frailty of urban transport systems: A grid-based approach for identifying informal street network connections to facilitate mobility. Transp. Res. Part D Transp. Environ. 2019, 77, 337–351. [Google Scholar] [CrossRef]
  58. Ali, K.; Nguyen, H.X.; Vien, Q.T.; Shah, P. Disaster Management Communication networks: Challenges and Architecture Design. In Proceedings of the 2015 IEEE International Conference on Pervasive Computing and Communication Workshops (PerCom Workshops), St. Louis, MO, USA, 23–27 March 2015; IEEE: New York, NY, USA, 2015; pp. 537–542. [Google Scholar]
  59. He, X.; Cha, E.J. Modeling the damage and recovery of interdependent critical infrastructure systems from natural hazards. Reliab. Eng. Syst. Saf. 2018, 177, 162–175. [Google Scholar] [CrossRef]
  60. Ali, F.; Amin, M.; Ryu, K. The role of physical environment, price perceptions, and consumption emotions in developing customer satisfaction in Chinese resort hotels. J. Qual. Assur. Hosp. Tour. 2016, 17, 45–70. [Google Scholar] [CrossRef]
  61. Ooi, S.K.; Yeap, J.A.; Low, Z. Loyalty towards telco service providers: The fundamental role of consumer brand engagement. Eur. Bus. Rev. 2020, 34, 85–102. [Google Scholar] [CrossRef]
  62. Díaz, G.R. The influence of satisfaction on customer retention in mobile phone market. J. Retail. Consum. Serv. 2017, 36, 75–85. [Google Scholar] [CrossRef]
  63. Gallo, A. The Value of Keeping the Right Customers. Harvard Business Review. 2014. Available online: https://hbr.org/2014/10/the-value-of-keeping-the-rightcustomers (accessed on 3 May 2022).
  64. Nekmahmud, M.; Rahman, S. Measuring the Competitiveness Factors in Telecommunication Markets. In Competitiveness in Emerging Markets; Springer: Cham, Switzerland, 2018; pp. 339–372. [Google Scholar]
  65. Grönroos, C. Service quality: The six criteria of good perceived service quality. Rev. Bus. 1988, 9, 10–13. [Google Scholar]
  66. Chahal, H.; Devi, P. Consumer attitude towards service failure and recovery in higher education. Qual. Assur. Educ. 2015, 23, 67–85. [Google Scholar] [CrossRef]
  67. Cambra-Fierro, J.; Melero-Polo, I.; Sese, J. Does the nature of the relationship really matter? An analysis of the roles of loyalty and involvement in service recovery processes. Serv. Bus. 2015, 9, 297–320. [Google Scholar] [CrossRef]
  68. Park, J.J.; Park, J.W. Investigating the effects of service recovery quality elements on passengers’ behavioral intention. J. Air Transp. Manag. 2016, 53, 235–241. [Google Scholar] [CrossRef]
  69. Hart, C.W.; Heskett, J.L.; Sasser, W.E., Jr. The profitable art of service recovery. Harv. Bus. Rev. 1990, 68, 148–156. [Google Scholar] [PubMed]
  70. Lastner, M.M.; Folse, J.A.G.; Mangus, S.M.; Fennell, P. The road to recovery: Overcoming service failures through positive emotions. J. Bus. Res. 2016, 69, 4278–4286. [Google Scholar] [CrossRef]
  71. Heskett, J.L. Service Breakthroughs; Simon and Schuster: New York, NY, USA, 1990. [Google Scholar]
  72. Marimon, F.; Yaya, L.H.P.; Fa, M.C. Impact of e-Quality and service recovery on loyalty: A study of e-banking in Spain. Total. Qual. Manag. Bus. Excel. 2012, 23, 769–787. [Google Scholar] [CrossRef]
  73. Chou, P.-F. An analysis of the relationship between service failure, service recovery and loyalty for Low Cost Carrier travelers. J. Air Transp. Manag. 2015, 47, 119–125. [Google Scholar] [CrossRef]
  74. Hong, K.S.; Lee, D. Impact of operational innovations on customer loyalty in the healthcare sector. Serv. Bus. 2018, 125, 575–600. [Google Scholar] [CrossRef]
  75. Tai, Y.F.; Wang, Y.C.; Luo, C.C. Technology-or human-related service innovation? Enhancing customer satisfaction, delight, and loyalty in the hospitality industry. Serv. Bus. 2021, 15, 667–694. [Google Scholar] [CrossRef]
  76. Durst, S.; Mention, A.L.; Poutanen, P. Service innovation and its impact: What do we know about? Investig. Eur. Dir. Econ. Empresa 2015, 21, 65–72. [Google Scholar] [CrossRef]
  77. Cheng, C.C.; Krumwiede, D. The role of service innovation in the market orientation—New service performance linkage. Technovation 2012, 32, 487–497. [Google Scholar] [CrossRef]
  78. Bharwani, S.; Mathews, D. Customer service innovations in the Indian hospitality industry. Worldw. Hosp. Tour. Themes 2016, 8, 416–431. [Google Scholar] [CrossRef]
  79. Fornell, C.; Johnson, M.D.; Anderson, E.W.; Cha, J.; Bryant, B.E. The American customer satisfaction index: Nature, purpose, and findings. J. Mark. 1996, 60, 7–18. [Google Scholar] [CrossRef]
  80. Hanaysha, J.R. Customer retention and the mediating role of perceived value in retail industry. World J. Entrep. Manag. Sustain. Dev. 2018, 14, 2–24. [Google Scholar] [CrossRef]
  81. Kim, K.J.; Jeong, I.J.; Park, J.C.; Park, Y.J.; Kim, C.G.; Kim, T.H. The impact of network service performance on customer satisfaction and loyalty: High-speed internet service case in Korea. Expert Syst. Appl. 2007, 32, 822–831. [Google Scholar] [CrossRef]
  82. Wang, Y.; Lo, H.P.; Chi, R.; Yang, Y. An integrated framework for customer value and customer-relationship-management performance: A customer-based perspective from China. Manag. Serv. Qual. Int. J. 2004, 14, 169–182. [Google Scholar] [CrossRef]
  83. Ramseook-Munhurrun, P.; Seebaluck, V.N.; Naidoo, P. Examining the structural relationships of destination image, perceived value, tourist satisfaction and loyalty: Case of Mauritius. Procedia Soc. Behav. Sci. 2015, 175, 252–259. [Google Scholar] [CrossRef]
  84. Lee, H.M.; Lee, C.C.; Wu, C.C. Brand image strategy affects brand equity after M&A. Eur. J. Mark. 2011, 45, 1091–1111. [Google Scholar]
  85. Keller, K.L. Branding Perspectives on Social Marketing. In ACR North American Advances; Alba, J.W., Hutchinson, J.W., Eds.; Association for Consumer Research: Provo, UT, USA, 1998; Volume 25, pp. 299–302. [Google Scholar]
  86. Chen, Y.S.; Chang, C.H. Enhance green purchase intentions: The roles of green perceived value, green perceived risk, and green trust. Manag. Decis. 2012, 50, 502–520. [Google Scholar] [CrossRef]
  87. Jin, N.; Lee, S.; Huffman, L. Impact of restaurant experience on brand image and customer loyalty: Moderating role of dining motivation. J. Travel Tour. Mark. 2012, 29, 532–551. [Google Scholar] [CrossRef]
  88. Wu, C.C.; Liao, S.H.; Chen, Y.J.; Hsu, W.L. Service Quality, Brand Image and Price Fairness Impact on the Customer Satisfaction and Loyalty. In Proceedings of the IEEE International Conference on Industrial Engineering and Engineering Management 2011, Singapore, 6–9 December 2011; pp. 1160–1164. [Google Scholar]
  89. Dam, S.M.; Dam, T.C. Relationships between service quality, brand image, customer satisfaction, and customer loyalty. J. Asian Financ. Econ. Bus. 2021, 8, 585–593. [Google Scholar]
  90. Ramanathan, R.; Karpuzcu, H. Comparing perceived and expected service using an AHP model: An application to measure service quality of a company engaged in pharmaceutical distribution. Opsearch 2011, 48, 136–152. [Google Scholar] [CrossRef]
  91. Parasuraman, A.; Zeithaml, V.A.; Berry, L.L. SERVQUAL: A multiple-item scale for measuring consumer perceptions of service quality. J. Retail. 1988, 64, 12–40. [Google Scholar]
  92. Alnsour, M.S.; Tayeh, B.A.; Alzyadat, M.A. Using SERVQUAL to assess the quality of service provided by Jordanian telecommunications sector. Int. J. Commer. Manag. 2014, 24, 209–218. [Google Scholar] [CrossRef]
  93. Olatokun, W.M.; Ojo, F.O. Influence of service quality on consumers’ satisfaction with mobile telecommunication services in Nigeria. Inf. Dev. 2016, 32, 398–408. [Google Scholar] [CrossRef]
  94. Stiakakis, E.; Georgiadis, C.K. E-service quality: Comparing the perceptions of providers and customers. Manag. Serv. Qual. Int. J. 2009, 19, 410–430. [Google Scholar] [CrossRef]
  95. Hussain, K.; Jing, F.; Parveen, K. How do foreigners perceive? Exploring foreign diners’ satisfaction with service quality of Chinese restaurants. Asia Pac. J. Tour. Res. 2018, 23, 613–625. [Google Scholar] [CrossRef]
  96. Alam, M.S.; Mondal, M. Assessment of sanitation service quality in urban slums of Khulna city based on SERVQUAL and AHP model: A case study of railway slum, Khulna, Bangladesh. J. Urban Manag. 2019, 8, 20–27. [Google Scholar] [CrossRef]
  97. Moon, Y.J. The tangibility and intangibility of e-service quality. Int. J. Smart Home 2013, 7, 91–102. [Google Scholar] [CrossRef]
  98. Rushton, A.M.; Carson, D.J. The marketing of services: Managing the intangibles. Eur. J. Mark. 1989, 23, 23–44. [Google Scholar] [CrossRef]
  99. Makanyeza, C.; Chikazhe, L. Mediators of the relationship between service quality and customer loyalty: Evidence from the banking sector in Zimbabwe. Int. J. Bank Mark. 2017, 35, 540–556. [Google Scholar] [CrossRef]
  100. Grujičić, D.; Ivanović, I.; Jović, J.; Đorić, V. Customer perception of service quality in public transport. Transport 2014, 29, 285–295. [Google Scholar] [CrossRef]
  101. Sam, E.F.; Hamidu, O.; Daniels, S. SERVQUAL analysis of public bus transport services in Kumasi metropolis, Ghana: Core user perspectives. Case Stud. Transp. Policy 2018, 6, 25–31. [Google Scholar] [CrossRef]
  102. Belwal, R.; Amireh, M. Service quality and attitudinal loyalty: Consumers’ perception of two major telecommunication companies in Oman. Arab. Econ. Bus. J. 2018, 13, 197–208. [Google Scholar] [CrossRef]
  103. Chiou, Y.C.; Chen, Y.H. Service quality effects on air passenger intentions: A service chain perspective. Transport Metrica 2012, 8, 406–426. [Google Scholar] [CrossRef]
  104. Meesala, A.; Paul, J. Service quality, consumer satisfaction and loyalty in hospitals: Thinking for the future. J. Retail. Consum. Serv. 2018, 40, 261–269. [Google Scholar] [CrossRef]
  105. Chow, W.S.; Shi, S. Investigating customers’ satisfaction with brand pages in social networking sites. J. Comput. Inf. Syst. 2015, 55, 48–58. [Google Scholar] [CrossRef]
  106. Kuo, N.T.; Chang, K.C.; Cheng, Y.S.; Lai, C.H. The Impact of Service Quality, Customer Satisfaction and Loyalty in the Restaurant Industry: Moderating effect of Perceived Value. In Proceedings of the 2011 IEEE International Conference on Quality and Reliability, Bangkok, Thailand, 14–17 September 2011; IEEE: New York, NY, USA, 2011; pp. 551–555. [Google Scholar]
  107. Dahiyat, S.E.; Akroush, M.N.; Abu-Lail, B.N. An integrated model of perceived service quality and customer loyalty: An empirical examination of the mediation effects of customer satisfaction and customer trust. Int. J. Serv. Oper. Manag. 2011, 9, 453–490. [Google Scholar] [CrossRef]
  108. Fida, B.A.; Ahmed, U.; Al-Balushi, Y.; Singh, D. Impact of service quality on customer loyalty and customer satisfaction in Islamic banks in the Sultanate of Oman. Sage Open 2020, 10, 2158244020919517. [Google Scholar] [CrossRef]
  109. Bello, K.B.; Jusoh, A.; Md Nor, K. Relationships and impacts of perceived CSR, service quality, customer satisfaction and consumer rights awareness. Soc. Responsib. J. 2021, 17, 1116–1130. [Google Scholar] [CrossRef]
  110. Radojevic, T.; Stanisic, N.; Stanic, N. Ensuring positive feedback: Factors that influence customer satisfaction in the contemporary hospitality industry. Tour. Manag. 2015, 51, 13–21. [Google Scholar] [CrossRef]
  111. Cengiz, E. Measuring customer satisfaction: Must or not. J. Nav. Sci. Eng. 2010, 6, 76–88. [Google Scholar]
  112. Ranaweera, C.; Prabhu, J. The influence of satisfaction, trust and switching barriers on customer retention in a continuous purchasing setting. Int. J. Serv. Ind. Manag. 2003, 14, 374–395. [Google Scholar] [CrossRef]
  113. Anderson, E.W. Customer satisfaction and word of mouth. J. Serv. Res. 1998, 1, 5–17. [Google Scholar] [CrossRef]
  114. Walsh, G.; Evanschitzky, H.; Wunderlich, M. Identification and analysis of moderator variables: Investigating the customer satisfaction-loyalty link. Eur. J. Mark. 2008, 42, 997–1004. [Google Scholar] [CrossRef]
  115. Nguyen, H.T.; Nguyen, H.; Nguyen, N.D.; Phan, A.C. Determinants of customer satisfaction and loyalty in Vietnamese life-insurance setting. Sustainability 2018, 10, 1151. [Google Scholar] [CrossRef]
  116. Kiseleva, E.M.; Nekrasova, M.L.; Mayorova, M.A.; Rudenko, M.N.; Kankhva, V.S. The theory and practice of customer loyalty management and customer focus in the enterprise activity. Int. Rev. Manag. Mark. 2016, 6, 95–103. [Google Scholar]
  117. Dimitriades, Z.S. Customer satisfaction, loyalty and commitment in service organizations: Some evidence from Greece. Manag. Res. News 2006, 29, 782–800. [Google Scholar] [CrossRef]
  118. Gonçalves, H.M.; Sampaio, P. The customer satisfaction-customer loyalty relationship: Reassessing customer and relational characteristics moderating effects. Manag. Decis. 2012, 50, 1509–1526. [Google Scholar] [CrossRef]
  119. Ahmad, R.; Buttle, F. Customer retention management: A reflection of theory and practice. Mark. Intell. Plan. 2002, 20, 149–161. [Google Scholar] [CrossRef]
  120. Zakaria, I.; Rahman, B.A.; Othman, A.K.; Yunus, N.A.M.; Dzulkipli, M.R.; Osman, M.A.F. The Relationship between Loyalty Program, Customer Satisfaction and Customer Loyalty in Retail Industry: A Case Study. Procedia Soc. Behav. Sci. 2014, 129, 23–30. [Google Scholar] [CrossRef]
  121. Boohene, R.; Agyapong, G.K. Analysis of the antecedents of customer loyalty of telecommunication industry in Ghana: The case of Vodafone (Ghana). Int. Bus. Res. 2011, 42, 229–240. [Google Scholar] [CrossRef]
  122. Polit, D.F.; Beck, C.T. Generalization in quantitative and qualitative research: Myths and strategies. Int. J. Nurs. Stud. 2010, 47, 1451–1458. [Google Scholar] [CrossRef] [PubMed]
  123. Hair, J.F., Jr.; Hult, G.T.M.; Ringle, C.M.; Sarstedt, M.; Danks, N.P.; Ray, S. Partial Least Squares Structural Equation Modeling (PLS-SEM) Using R: A Workbook; Springer Nature: Berlin/Heidelberg, Germany, 2021; p. 197. [Google Scholar]
  124. Fornell, C.; Larcker, D.F. Evaluating Structural Equation Models with Unobservable Variables and Measurement Error. J. Mark. Res. 1981, 18, 39–50. [Google Scholar] [CrossRef]
  125. Sarstedt, M.; Ringle, C.M.; Smith, D.; Reams, R.; Hair, J.F., Jr. Partial least squares structural equation modeling (PLS-SEM): A useful tool for family business researchers. J. Fam. Bus. Strategy 2014, 5, 105–115. [Google Scholar] [CrossRef]
  126. Hair, J.F., Jr.; Ringle, C.M.; Sarstedt, M. PLS-SEM: Indeed a silver bullet. J. Mark. Theory Pract. 2011, 19, 139–152. [Google Scholar] [CrossRef]
  127. Wu, H.C. The effects of customer satisfaction, perceived value, corporate image and service quality on behavioral intentions in gaming establishments. Asia Pac. J. Mark. Logist. 2014, 26, 540–565. [Google Scholar] [CrossRef]
  128. El-Adly, M.I. Modelling the relationship between hotel perceived value, customer satisfaction, and customer loyalty. J. Retail. Consum. Serv. 2019, 50, 322–332. [Google Scholar] [CrossRef]
  129. Fraering, M.; Minor, M.S. Beyond loyalty: Customer satisfaction, loyalty, and fortitude. J. Serv. Mark. 2013, 27, 334–344. [Google Scholar] [CrossRef]
  130. Dhingra, J.; Srichandan, A.; Kumar, K.A. Smart Green House Gas-Footprint Display with Integrated Smart Power Monitoring and IoT-Actuation. IJRTE 2020, 8, 1243–1247. [Google Scholar] [CrossRef]
  131. Khan, M.A.; Zubair, S.S.; Malik, M. An assessment of e-service quality, e-satisfaction and e-loyalty: Case of online shopping in Pakistan. South Asian J. Bus. Stud. 2019, 8, 283–302. [Google Scholar] [CrossRef]
  132. Tzavlopoulos, Ι.; Gotzamani, K.; Andronikidis, A.; Vassiliadis, C. Determining the impact of e-commerce quality on customers’ perceived risk, satisfaction, value and loyalty. Int. J. Qual. Serv. Sci. 2019, 11, 576–587. [Google Scholar] [CrossRef]
  133. Özcan, S.D. Adolescents Eating Behaviors in the Era of Social Media: The Role of Social Comparison, Body Satisfaction and Need Satisfaction. Master’s Thesis, Lisansüstü Programlar Enstitüsü, Istanbul, Türkiye, 2019. [Google Scholar]
  134. Kjellsson, G.; Clarke, P.; Gerdtham, U.G. Forgetting to remember or remembering to forget: A study of the recall period length in health care survey questions. J. Health Econ. 2014, 35, 34–46. [Google Scholar] [CrossRef] [PubMed]
  135. Kelley, S.W.; Davis, M.A. Antecedents to customer expectations for service recovery. J. Acad. Mark. Sci. 1994, 22, 52–61. [Google Scholar] [CrossRef]
  136. Vázquez-Casielles, R.; Álvarez, L.S.; Martín, A.M.D. Perceived justice of service recovery strategies: Impact on customer satisfaction and quality relationship. Psychol. Mark. 2010, 27, 487–509. [Google Scholar] [CrossRef]
  137. Kuo, Y.F.; Wu, C.M. Satisfaction and post-purchase intentions with service recovery of online shopping websites: Perspectives on perceived justice and emotions. Int. J. Inf. Manag. 2012, 32, 127–138. [Google Scholar] [CrossRef]
  138. Nguyen, D.T.; McColl-Kennedy, J.R.; Dagger, T.S. Matching service recovery solutions to customer recovery preferences. Eur. J. Mark. 2012, 46, 1171–1194. [Google Scholar] [CrossRef]
  139. Balaji, M.S.; Jha, S.; Sengupta, A.S.; Krishnan, B.C. Are cynical customers satisfied differently? Role of negative inferred motive and customer participation in service recovery. J. Bus. Res. 2018, 86, 109–118. [Google Scholar] [CrossRef]
  140. Odoom, R.; Agbemabiese, G.C.; Hinson, R.E. Service recovery satisfaction in offline and online experiences. Mark. Intell. Plan. 2020, 38, 1–14. [Google Scholar] [CrossRef]
  141. Mathew, S.; Jose, A.; Goplakrishnan, R.; Chacko, D.P. Examining the relationship between e-service recovery quality and e-service recovery satisfaction moderated by perceived justice in the banking context. Benchmark. Int. J. 2020, 27, 1951–1980. [Google Scholar] [CrossRef]
  142. Zhou, P.; Yin, B.; Qiu, X.S.; Guo, S.Y.; Meng, L.M. Service reliability oriented cloud resource scheduling method. Acta Electonica Sin. 2019, 47, 1036. [Google Scholar]
  143. Gohary, A.; Hamzelu, B.; Pourazizi, L.; Hanzaee, K.H. Understanding effects of co-creation on cognitive, affective and behavioral evaluations in service recovery: An ethnocultural analysis. J. Retail. Consum. Serv. 2016, 31, 182–198. [Google Scholar] [CrossRef]
  144. Yoon, B.; Kim, S.; Rhee, J. An evaluation method for designing a new product-service system. Expert Syst. Appl. 2012, 39, 3100–3108. [Google Scholar] [CrossRef]
  145. Tsou, H.T.; Chen, J.S. The influence of interfirm codevelopment competency on e-service innovation. Inf. Manag. 2012, 49, 177–189. [Google Scholar] [CrossRef]
  146. Mansury, M.A.; Love, J.H. Innovation, productivity and growth in US business services: A firm-level analysis. Technovation 2008, 28, 52–62. [Google Scholar] [CrossRef]
  147. Dobni, D.; Zinkhan, G.M. In Search of Brand Image: A Foundation Analysis; ACR North American Advances: Chicago, IL, USA, 1990. [Google Scholar]
  148. Alrwashdeh, M.; Emeagwali, O.L.; Aljuhmani, H.Y. The effect of electronic word of mouth communication on purchase intention and brand image: An applicant smartphone brands in North Cyprus. Manag. Sci. Lett. 2019, 505–518. [Google Scholar] [CrossRef]
  149. García, J.A.C.; Galindo, A.D.V.; Suárez, R.M. The effect of online and offline experiential marketing on brand equity in the hotel sector. Span. J. Mark. ESIC 2018, 22, 22–41. [Google Scholar] [CrossRef]
  150. Cretu, A.E.; Brodie, R.J. The influence of brand image and company reputation where manufacturers market to small firms: A customer value perspective. Ind. Mark. Manag. 2007, 36, 230–240. [Google Scholar] [CrossRef]
  151. Vázquez, R.; del Río, A.B.; Iglesias, V. Consumer-based Brand Equity: Development and Validation of a Measurement Instrument. J. Mark. Manag. 2002, 18, 27–48. [Google Scholar] [CrossRef]
  152. De Chernatony, L. Brand Management through Narrowing the Gap between Brand Identity and Brand Reputation. J. Mark. Manag. 1999, 15, 157–179. [Google Scholar] [CrossRef]
  153. Almossawi, M.M. Customer Satisfaction in the Mobile Telecom Industry in Bahrain: Antecedents and Consequences. Int. J. Mark. Stud. 2012, 4, 139. [Google Scholar] [CrossRef]
  154. Morgan, S.; Govender, K. Exploring customer loyalty in the South African mobile telecommunications sector. Cogent Bus. Manag. 2017, 4, 1273816. [Google Scholar] [CrossRef]
  155. Velimirovic, D.; Velimirovic, M.; Stanković, R.; Dragana, V.; Milan, V.; Rade, S. Role and importance of key performance indicators measurement. Serbian J. Manag. 2011, 6, 63–72. [Google Scholar] [CrossRef]
  156. Kamath, P.R.; Pai, Y.P.; Prabhu, N.K. Building customer loyalty in retail banking: A serial-mediation approach. Int. J. Bank Mark. 2019, 38, 456–484. [Google Scholar] [CrossRef]
  157. Shahzad, A.; Yaqub, R.M.S.; Di Vaio, A.; Hassan, R. Antecedents of customer loyalty and performance improvement: Evidence from Pakistan’s telecommunications sector. Util. Policy 2021, 70, 101208. [Google Scholar] [CrossRef]
  158. Mannan, M.; Mohiuddin, F.; Chowdhury, N.; Sarker, P. Customer satisfaction, switching intentions, perceived switching costs, and perceived alternative attractiveness in Bangladesh mobile telecommunications market. South Asian J. Bus. Stud. 2017, 6, 142–160. [Google Scholar] [CrossRef]
  159. Oliver, R.L. Customer satisfaction with service. Handb. Serv. Mark. Manag. 2000, 247254, 339–354. [Google Scholar]
  160. Paul, J.; Mittal, A.; Srivastav, G. Impact of service quality on customer satisfaction in private and public sector banks. Int. J. Bank Mark. 2016, 34, 606–622. [Google Scholar] [CrossRef]
  161. Ibrahim, M.; Abdallahamed, S.; Adam, D.R. Service Recovery, Perceived Fairness, and Customer Satisfaction in the Telecoms Sector in Ghana. Int. J. Serv. Sci. Manag. Eng. Technol. 2018, 9, 73–89. [Google Scholar] [CrossRef]
  162. Loke, S.P.; Taiwo, A.A.; Salim, H.M.; Downe, A.G.; Petronas, U.T. Service quality and customer satisfaction in a telecommunication service provider. In Proceedings of the International Conference on Financial Management and Economics 2011, Hong Kong, 2–3 July 2011; Volume 11, pp. 23–29. [Google Scholar]
Figure 1. The proposed model for customer loyalty towards internet service providers during disasters.
Urbansci 07 00055 g001
Figure 2. Structural model path coefficients.
Urbansci 07 00055 g002
Table 1. Profile of the survey participants.
Frequency% Frequency%
AgeDid you permanently switch to a different internet provider after the typhoon?
18–24 years old26144.69No40569.35
25–34 years old14023.97Yes17429.79
35–44 years old7913.53Not indicated50.86
45–54 years old5910.10Total584100
55–64 years old101.71Occupation
65 years old and above40.68Student17830.48
Not indicated315.31Teacher training or education12521.40
Total584100Sales528.90
GenderUnemployed345.82
Male22939.21Business, consultancy, or management305.14
Female33557.36Retail274.62
Not indicated203.42Computing or IT274.62
Total584100Engineering or manufacturing152.57
Monthly Income (PhP) Public services or administration142.40
Less than 952018732.02Property or construction142.40
Between 9520–19,04016428.08Accountancy, banking, or finance101.71
Between 19,040–38,08012721.75Others508.56
Not indicated569.59Not indicated81.37
Between 38,080–66,640315.31Total584100
Between 66,640–114,240142.40The primary reason for internet utilization
Between 114,240–190,40050.86Work24642.12
Total584100School24441.78
Years associated with the current service providerEntertainment7813.36
3 years above17830.48Others81.37
13–24 months16327.91Not indicated81.37
7–12 months12220.89Total584100
Less than 6 months11419.52Added internet provider after the typhoon to supplement your cabled internet
Not indicated71.20No37664.38
Total584100Yes20334.76
Not indicated50.86
Total584100
Table 2. Measurement model assessment results.
Convergent ValidityDiscriminant
Validity
Convergent ValidityDiscriminant
Validity
LoadingsAVEαCR LoadingsAVEαCR
SR10.840.7670.9240.943CL10.8070.8350.9500.962
SR20.884 CL20.935
SR30.892 CL30.930
SR40.854 CL40.945
SR50.908 CL50.944
SI10.9000.7530.8910.924CS10.9480.8690.9500.964
SI20.888 CS20.938
SI30.813 CS30.941
SI40.869 CS40.901
BI10.8840.8140.9430.956RS0.939
BI20.899 RY0.908
BI30.888 E0.957
BI40.922 T0.893
BI50.917 A0.886
PV10.9470.8690.9240.952
PV30.946
PV40.903
Note: α = Cronbach’s alpha; CR = construct reliability; AVE = average variance; SR = service recovery; SI = service innovation; BI = brand image; PV = perceived value; CL = customer loyalty; CS = customer satisfaction; RS = responsiveness; RY = reliability; E = empathy; T = tangibility; and A = assurance.
Table 3. Correlation and testing discriminant validity.
BICLCSPVServ QualSISR
BI0.902
CL0.8670.914
CS0.8330.8560.932
PV0.8990.8350.8350.932
Serv Qual0.820.8320.8450.828
SI0.8820.7820.8320.8580.7950.868
SR0.8030.7350.7210.7820.7800.8180.876
Note: The square root of AVE is shown on the diagonal of the matrix in bold; inter-construct correlation is shown off the diagonal.
Table 4. Path coefficients and hypothesis test results.
Hypothesesβp-ValuesDecision
H1: Service Recovery → Customer Loyalty0.0300.462 nsNot supported
H2: Service Recovery → Customer Satisfaction−0.1230.005 **Not supported
H3: Service Innovation → Customer Loyalty−0.1830.002 **Not supported
H4: Service Innovation → Customer Satisfaction0.3070.000 ***Supported
H5: Perceived Value → Customer Loyalty0.0890.187 nsNot supported
H6: Perceived Value → Customer Satisfaction0.1840.004 **Supported
H7: Brand Image → Customer Satisfaction0.1510.012 **Supported
H8: Brand Image → Customer Loyalty0.4640.000 ***Supported
H9: Service Quality → Customer Satisfaction0.4210.000 ***Supported
H10: Service Quality → Customer Loyalty0.1940.002 **Supported
H11: Customer Satisfaction → Customer Loyalty0.3610.000 ***Supported
Note: *** p < 0.001; ** p < 0.05; ns not significant.
Table 5. Effect size (f2) results.
Relationshipf2Effect Size
BI → CL0.168Medium
BI → CS0.016No Effect
CS → CL0.15Medium
PV → CL0.007No Effect
PV → CS0.027Small
SQ → CL0.046Small
SQ → CS0.229Medium
SI → CL0.031Small
SI → CS0.083Small
SR → CL0.001No Effect
SR → CS0.021Small
Disclaimer/Publisher’s Note: The statements, opinions and data contained in all publications are solely those of the individual author(s) and contributor(s) and not of MDPI and/or the editor(s). MDPI and/or the editor(s) disclaim responsibility for any injury to people or property resulting from any ideas, methods, instructions or products referred to in the content.

