Article

Formulating a Railway Station Accessibility (RsAI) Model for Station Hierarchy Classification

Department of Transport Planning, School of Planning and Architecture, New Delhi 110002, India
*
Author to whom correspondence should be addressed.
Urban Sci. 2023, 7(2), 48; https://doi.org/10.3390/urbansci7020048
Submission received: 16 February 2023 / Revised: 29 April 2023 / Accepted: 2 May 2023 / Published: 8 May 2023

Abstract

:
The accessibility of railway stations plays a crucial role in assessing service quality, predicting travel patterns, and developing infrastructure in the surrounding areas. This paper proposes a railway station accessibility index (RsAI) (external) that incorporates various parameters, including network performance, into a weighted measure. We reviewed different methods for measuring accessibility levels for transit systems to identify the most suitable models for this study. The primary objective of this paper is to classify railway stations into different hierarchies based on their accessibility levels and to develop an external accessibility index to measure their performance. With increasing urbanization and congestion, accessing railway stations has become more challenging, impacting railway efficiency and leading to modal shifts to other transportation systems. This paper not only identifies critical parameters but also emphasizes the need to measure and improve last-mile network performance to enhance station accessibility, thereby benefiting both passengers and the railway industry.

1. Introduction

Railways are the key components of a sustainable transport system that enhances mobility and serves to alleviate the economic and environmental impacts of road and air transport systems. A public transit system must be well connected to its surroundings. Railway stations play a vital role in transporting passengers from their origin to their destination, and rail is the cheapest mode of travel in India compared to any other inter-regional mode of travel. In India, railway stations are categorized based on the volume of passengers they handle and the income they generate through miscellaneous services. However, this system does not consider infrastructure capability, accessibility, or the importance of the station in the network. Thus, it is important to identify stations and their accessibility levels to understand the station’s performance. The last-mile connectivity modes are a pivotal part of the accessibility to stations; these modes together help in identifying the performance of the network. For this study, six different measures of accessibility were taken into consideration.
During this study, 21 models were identified based on 6 accessibility measures. These models were then segregated in three steps: number of indicators, decision support instrument segregation, and planning-oriented segregation, based on which models and parameters were selected for this study.
For identifying the composite accessibility index for the railway stations, the study was conducted in sections: the first section was ‘external accessibility’, i.e., from the origin to the station, and the second was ‘internal accessibility’, i.e., from the station entrance to the platform. This article talks about external accessibility.

2. Literature

2.1. Accessibility

The effort to develop a composite accessibility index has been ongoing since the 1950s and is an important component of assessing the transit sector [1]. During this study, six accessibility measures were identified and categorized as follows: Spatial Separation Measure, Contour Measure, Cumulative Opportunities Accessibility Measure, Gravity Measure, Utility Measure, and Time–Space Measure. These measures were further studied to identify 21 accessibility models commonly deployed in the present world. To fully understand the topic, it is necessary to study all of the measures initially.

2.1.1. Spatial Separation Measure

Earlier interest in understanding network structure has been restricted to geographers who view the spatial nature of the transportation network as a vital input to regional development. Transportation planners recognize the importance of the transport system’s influence on urban form. Bhat et al. emphasizes the extent of integration between land development and transportation systems that can be used to identify the low accessibility zones and enhance the existing situation [2]. The measure of the distance or the separation is the simplest kind of accessibility measurement. Distance is the only unit that is used, since these measures do not take into consideration the degree of attraction. The weighted average travel time to all the other zones that are considered is the most generic and generalizable indicator for measuring network accessibility.
  A I ˙ = j d ij b
d ij represents the distance that exists between zones i and j, and b is the weighted average travel time that is used in the broad formulation of this accessibility measure A I ˙ .

Application of Spatial Separation Measure

Dupuy et al. defines 190 European cities using graph theory and spatial isolation. Links are characterized by their length, carrying capacity, and average speed [3]. This enables categorization into strong and weak categories. Their methodology is adequate for this macro-scale research with a restricted number of locations and numerous natural boundaries. It does not, however, lend itself to the finer scale of a metropolitan region comprising thousands of zones. Muraco applied the abstract version of a spatial measure to evaluate planned improvements to the motorway system in two major metropolitan areas. Comparing before and after accessibility measurements for the entire metropolitan region, he utilized a distance-based metric and simulated flows [4]. Another researcher, Leake et al., produced a measure that is specifically directed toward assessing accessibility since several studies have shown that the influence of accessibility on trip creation is important [5].

2.1.2. Contour Measure

The contour measure of accessibility is a widely used method for evaluating the accessibility of transit systems. This approach involves measuring the number of destinations that are reachable within a given travel time from a particular location using public transit. The contour measure of accessibility can be used to assess the effectiveness of transit systems in connecting people to jobs, education, healthcare, and other essential services. It is the most generic and generalizable indicator for measuring network accessibility.
C A M =   ( D i j H J )
Here, C A M is the contour accessibility measure for a location, and D i j is the Euclidean distance from the location to each surrounding geographic feature (such as roads, railroads, etc.). H J is the magnitude of the influence of each geographic feature on the accessibility of the location.

Application of Contour Measure

Contour measures found that the accessibility of the transit system varied widely across different neighborhoods, with some areas having much better access to transit than others. A study by Tang et al. used the contour measure of accessibility to evaluate the impact of the adoption of on-demand ride services on accessibility [6]. The study found that the new transit line significantly improved accessibility for many residents in the region. Overall, the contour measure of accessibility is a powerful tool for evaluating transit systems and assessing the impact of new transit investments. By providing a quantitative measure of transit accessibility, this approach can help policymakers and planners make more informed decisions about transit investments and improve the accessibility of public transit for all residents.

2.1.3. Cumulative Opportunities Accessibility Measure

The cumulative opportunity measure is the method of determining accessibility since it takes into consideration both the travel distance and the purpose of a journey. This metric establishes a threshold for trip time or distance, and the accessibility of a spatial unit is determined by the number of possible activities that may be performed within the threshold.
A t = t O t
Here, ‘t’ is the threshold and ‘ O t ’ is an opportunity that can be reached within that threshold. When making an isochronic map, it is common practice to employ several different time or distance intervals. The only information needed for this measure is the location of all the destinations within the desired threshold (e.g., jobs or hospitals). An argument for this method is that it bypasses the zonal aggregation problem of other methods. The most complex variations of this measure resemble gravity-type measurements where the weighting of the attractions is determined by a value associated with transportation. Weibull assigned weights to attractions based on the amount of employment in each area as well as factors such as automobile ownership and journey duration [7], while Handy et al. weighed up the opportunities using a distance–decay function [8].

Application of Cumulative Opportunities Accessibility Measure

Cumulative possibilities are frequently used to measure employment accessibility. The number of work opportunities in this case is used as the attraction [9,10]. To evaluate impacts on different sub-populations, researchers have disaggregated the data by income [11], employment type [10], gender [10,12], and sociodemographic parameters [13]. This measure has been used to monitor changes in accessibility due to changes in land use, the transportation system, or growth in general [14]. For example, Mowforth shows how accessibility to employment declined in London over a decade, especially for unskilled males [10].

2.1.4. Gravity Measure of Accessibility

In 1956, Carrothers advocated for the application of physical mathematical equations that might be applied to interactions between cities. More specifically, he referred to the gravity model of interaction. The word “possibility of interaction” is something that is often seen in the accessibility literature, and extensive research (it cites eighty-three publications) contains it. In his work, he addresses a force that attracts and the friction that comes from having an intervening space. There have been prior applications of gravity equations to social circumstances, some of which date back to the 1930s [15]. On the other hand, Hansen is the author who is traditionally credited with making the first application of the gravity model to accessibility [16]. The gravity measurement considers both an attraction and a separation factor in its calculations. The cumulative opportunities measure takes a discrete measurement of time or distance and then tallies up the number of attractions, whereas the gravity-based measure takes a continuous measure of time or distance and then reduces the number of opportunities based on how far they are from the starting point in either direction. The general form of the model has an attraction factor weighted by the travel time or distance raised to some exponent.
A i = j D j T ijt α
Here, D j is the number of trips attracted by zone j on all the modes, and T ijt is the overall journey time, and α is some exponent.

Application of Gravity Measure of Accessibility

Using accessibility criteria to assess access to certain types of activities, researchers have compared various transit designs using gravity measurements. Zhang et al. compare the current urban environment to the environment with the inclusion of a projected light-rail system [17]. The graphical representations of their results reveal vast differences in accessibility across research regions. Handy used gravity-based accessibility indices for two pairs of communities in a recent case study (old and new). In examining the relationship between local accessibility and shopping behavior, Handy discovered a significant disparity between the minimal distance to shopping places and the number of potential shopping places. This disparity is concealed by most accessibility measures [18].

2.1.5. Utility Measure

A utility-based measure is yet another method that may be used to evaluate accessibility. This form of measurement considers an individual’s perspective on the utility of various travel options.
A n = E ( Max U I ˙ n ) = ln   exp ( V in ) ; i ε C
That is, for individual n , accessibility is defined as the expected value of the maximum of the utilities’ overall alternative spatial destination i in the choice set C . This is called the log sum of the discrete choice model. Here Max U I ˙ n = maximum of the utility, V in = residual utility that varies with both i and n , and A n is the accessibility for individuals.

Application of Utility Measures of Accessibility

The accessibility metric that Ben-Akiva et al. developed is applied to models of mobility and travel [19]. They define “mobility” as an overall quality that a decision maker has, and that may be determined by factors such as where they work, where they live, whether they own a car, and how they commute to work. Destination, method of transportation, route, and time of day are short-term travel considerations. In their modeling of travel behavior, they assume that a decision-maker goes through a series of decisions.

2.1.6. Time–Space Measure

The conceptual framework of accessibility receives an additional facet in the form of time–space measurements, which are metrics that relate to the temporal restrictions of the individuals who are being considered [19]. Swedish researchers Hägerstrand et al. are credited with pioneering early research in this field [20]. They analyzed the space and time that are accessible to an individual so that they may participate in activities, using a prism with three dimensions. The fact that people have only certain periods in which to participate in activities served as the impetus for developing this strategy to improve accessibility. The size of their prisms decreases if there is an increase in the amount of time spent traveling.

Application of Time–Space Measure

Burns evaluates several case studies using a time–space accessibility metric. Several of these deal with how modifications to the transit network and the attractions affect people’s accessibility. Others have thought about the impact of clustering activities and the effect of discounting distance (in a gravity-type application). Burns’s research suggests that to increase accessibility, temporal strategies such as schedule flexibility should be prioritized above velocity approaches [21]. A similar optimum size of clustered activities was discovered by Hall. This is dependent on the kind of attraction and mostly pertains to difficult-to-find objects [22]. Due to their high degree of disaggregation, space–time measurements are mostly criticized for being difficult to aggregate and for making it challenging to examine the consequences of changes on a broader scale, such as in land use and the transportation system. For instance, the time restriction for people in a zone is one challenging element to calculate.
Marshall used a different form of configuration analysis called space syntax. According to his research, “link” parts in a layout may have a sizable spatial presence. Roads and land use zones may be represented individually in an urban structure as nodes and linkages, but in a classic urban network, streets are important spatial units [23]. Accessibility indices of locales are often calculated differently based on several metrics. Pirie and Kwan concentrated on individual accessibility [24,25], whereas many other researchers focused on location accessibility [8,26,27]. Handy et al. reported that there is no ideal method for gauging accessibility and that various contexts and goals need different methods [8]. They highlighted four interconnected concerns that must be addressed, namely the degree and kind of disaggregation, the characterization of sources and destinations, the assessment of travel impediments, and the evaluation of attractions. Combinational topology’s branch of graph theory is a flexible language that allows for the fundamental structure of untangling transportation networks [28]. The topology of the network was defined by Xie et al. as the arrangement and connectivity of nodes and links in a network. There has been a long-standing interest in measuring the spatial structure of road networks because network structure has an inherent impact on the performance of transportation systems, which has an impact on land use and urban form [29]. Earlier studies that only focused on topologic metrics using graph-theoretic network analysis were restricted by the amount of data available, the computing power available, and the modeling tools available [30,31,32]. Later work investigated the impacts of different geometric network architectures on traffic flows and travel patterns, and travel demand models were widely used.
The study further involves the identification of accessibility models based on the six measures discussed earlier. These models were further analyzed to identify the appropriate model to leverage in this study; during the study, 21 accessibility models were identified from which parameters were selected. The models are presented in Table 1.

2.2. Travel Time Reliability

Several types of research in the last few decades led to the conclusion that travel time reliability plays an important role in route choice user behavior [53,54]. Travel time reliability can also be considered a measure of the amount of congestion or delay the users of the road network experience at any given time. Measures of travel time reliability aim to assess the variability of travel time across days or weeks. It is also an aspect that measures the extent to which external events can influence the network [55]. Research related to reliability measures, such as capacity reliability and travel time reliability, which quantify the impact of these disruptive events has been evaluated. Several researchers have used simulation-based algorithms such as the Monte Carlo method to calculate reliability influenced by different origin–destination demand patterns and road link capacities [56,57,58].

2.2.1. Travel Time

Travel time is an aspect that is defined as the time taken by the user from origin to destination for a trip regarding any purpose. The variability in the values of travel time that is observable forms the basis to calculate the travel time reliability. For the individual decision-making process for the user of the road network, both values of travel time and travel time reliability are essential elements. While travel time values are typically a determining criterion for trip route and mode choices, travel time reliability is perceived more as a mix of qualitative and quantitative factors to describe the transport network and system [59].

2.2.2. Travel Time Variability

Emam et al. concluded from the research that the travel time for any trip can be highly variable [60]. In addition to that, travel time values for any trip also vary depending on the following: the time of day, for example, as travel time values are higher during the peak time of the day as compared to the non-peak period of the day; the day of the week, for example, as the travel time values are higher during the working days as compared to the weekends; and over months, for example, as during the holiday season, the travel time values are higher [61]. Disruptions and variations can also happen occasionally and can be caused by demonstrations, road construction, etc. To plan any trip, users of the transportation network must deal with this range of travel time values. Furthermore, this leads transport network users to undergo complex decision processes including the consideration of delay risk evaluation, and variation regarding the time of arrival or departure, route, or transport mode [62]. Transport network users experience the variability in travel times and have difficulties estimating travel time values for specific routes. Therefore, travel time reliability is a highly relevant qualitative and quantitative criterion that describes transport networks and transport systems and is of determining importance for the individual route and mode choices of transport network users, as concluded by Wanjek et al. [59].

2.2.3. Travel Time Reliability

To define travel time reliability, it is important to differentiate between the expected travel time, which is an estimate before the journey, and the actual travel time taken, which is the elapsed time after the journey. The deviation between expected travel time and actual travel time is used to estimate the travel time reliability. The results of deviation can be delays or arriving early at the destination.
Chang used the difference between the actual and planned travel times to determine the travel time reliability [63]. Yang et al. used kernel density and the Hasofer–Lind–Rackwitz–Fiessler algorithm on freeway corridors to determine the travel time reliability [64]. Zhang et al. determined the distinct elements of travel time in a mass transit system [65]. It was concluded that all time-related elements followed a truncated normal distribution. The shortcoming of this model is that they did not calculate travel times for different periods or evaluate the travel time reliability of the whole network. Woodard et al. included the travel time reliability measure and projection methods to estimate the probability distribution of travel time in a transport road network at any given point in time using GPS (Global Positioning System) data [66]. Ma et al. used AVL (automatic vehicle location) data to estimate the reliability of the transit service. They used three indicators for evaluation, which were planning journey time, connectivity reliability, and the value of travel time [67]. Kaparias et al. indicated that travel time reliability is defined by travel time distributions [68]. The indicators can be categorized into indicators concerning statistical range, skew-width indicators, and tardy trip indicators. Similarly, the variance and standard deviation of the travel time are defined as statistical range indicators. These indicators indicate the degree of variation in the travel time of the trip. Where buffer time measures look at the trip time effects of unreliable system performance, tardy trip measures can represent the unreliability impacts using the number of late trips. These indicators can provide specific reliable travel time from origin–destination station pairs; thus, it becomes unreasonable to use independent extreme values to estimate the travel time reliability. Skew-width indicators that include buffer time index, planning time index, and travel time index estimate travel time reliability based on ‘percentiles’ of trip travel time. The first level is to identify the parameters.

3. Identifying Parameters for the Railway Station Accessibility Index Model

From the 21 accessibility models studied in Table 1, an appropriate model selection is required for this study, which can be used for the preparation of the RsAI model. Parameters are then further identified from the selected model. The model selection is based on the 3 levels:
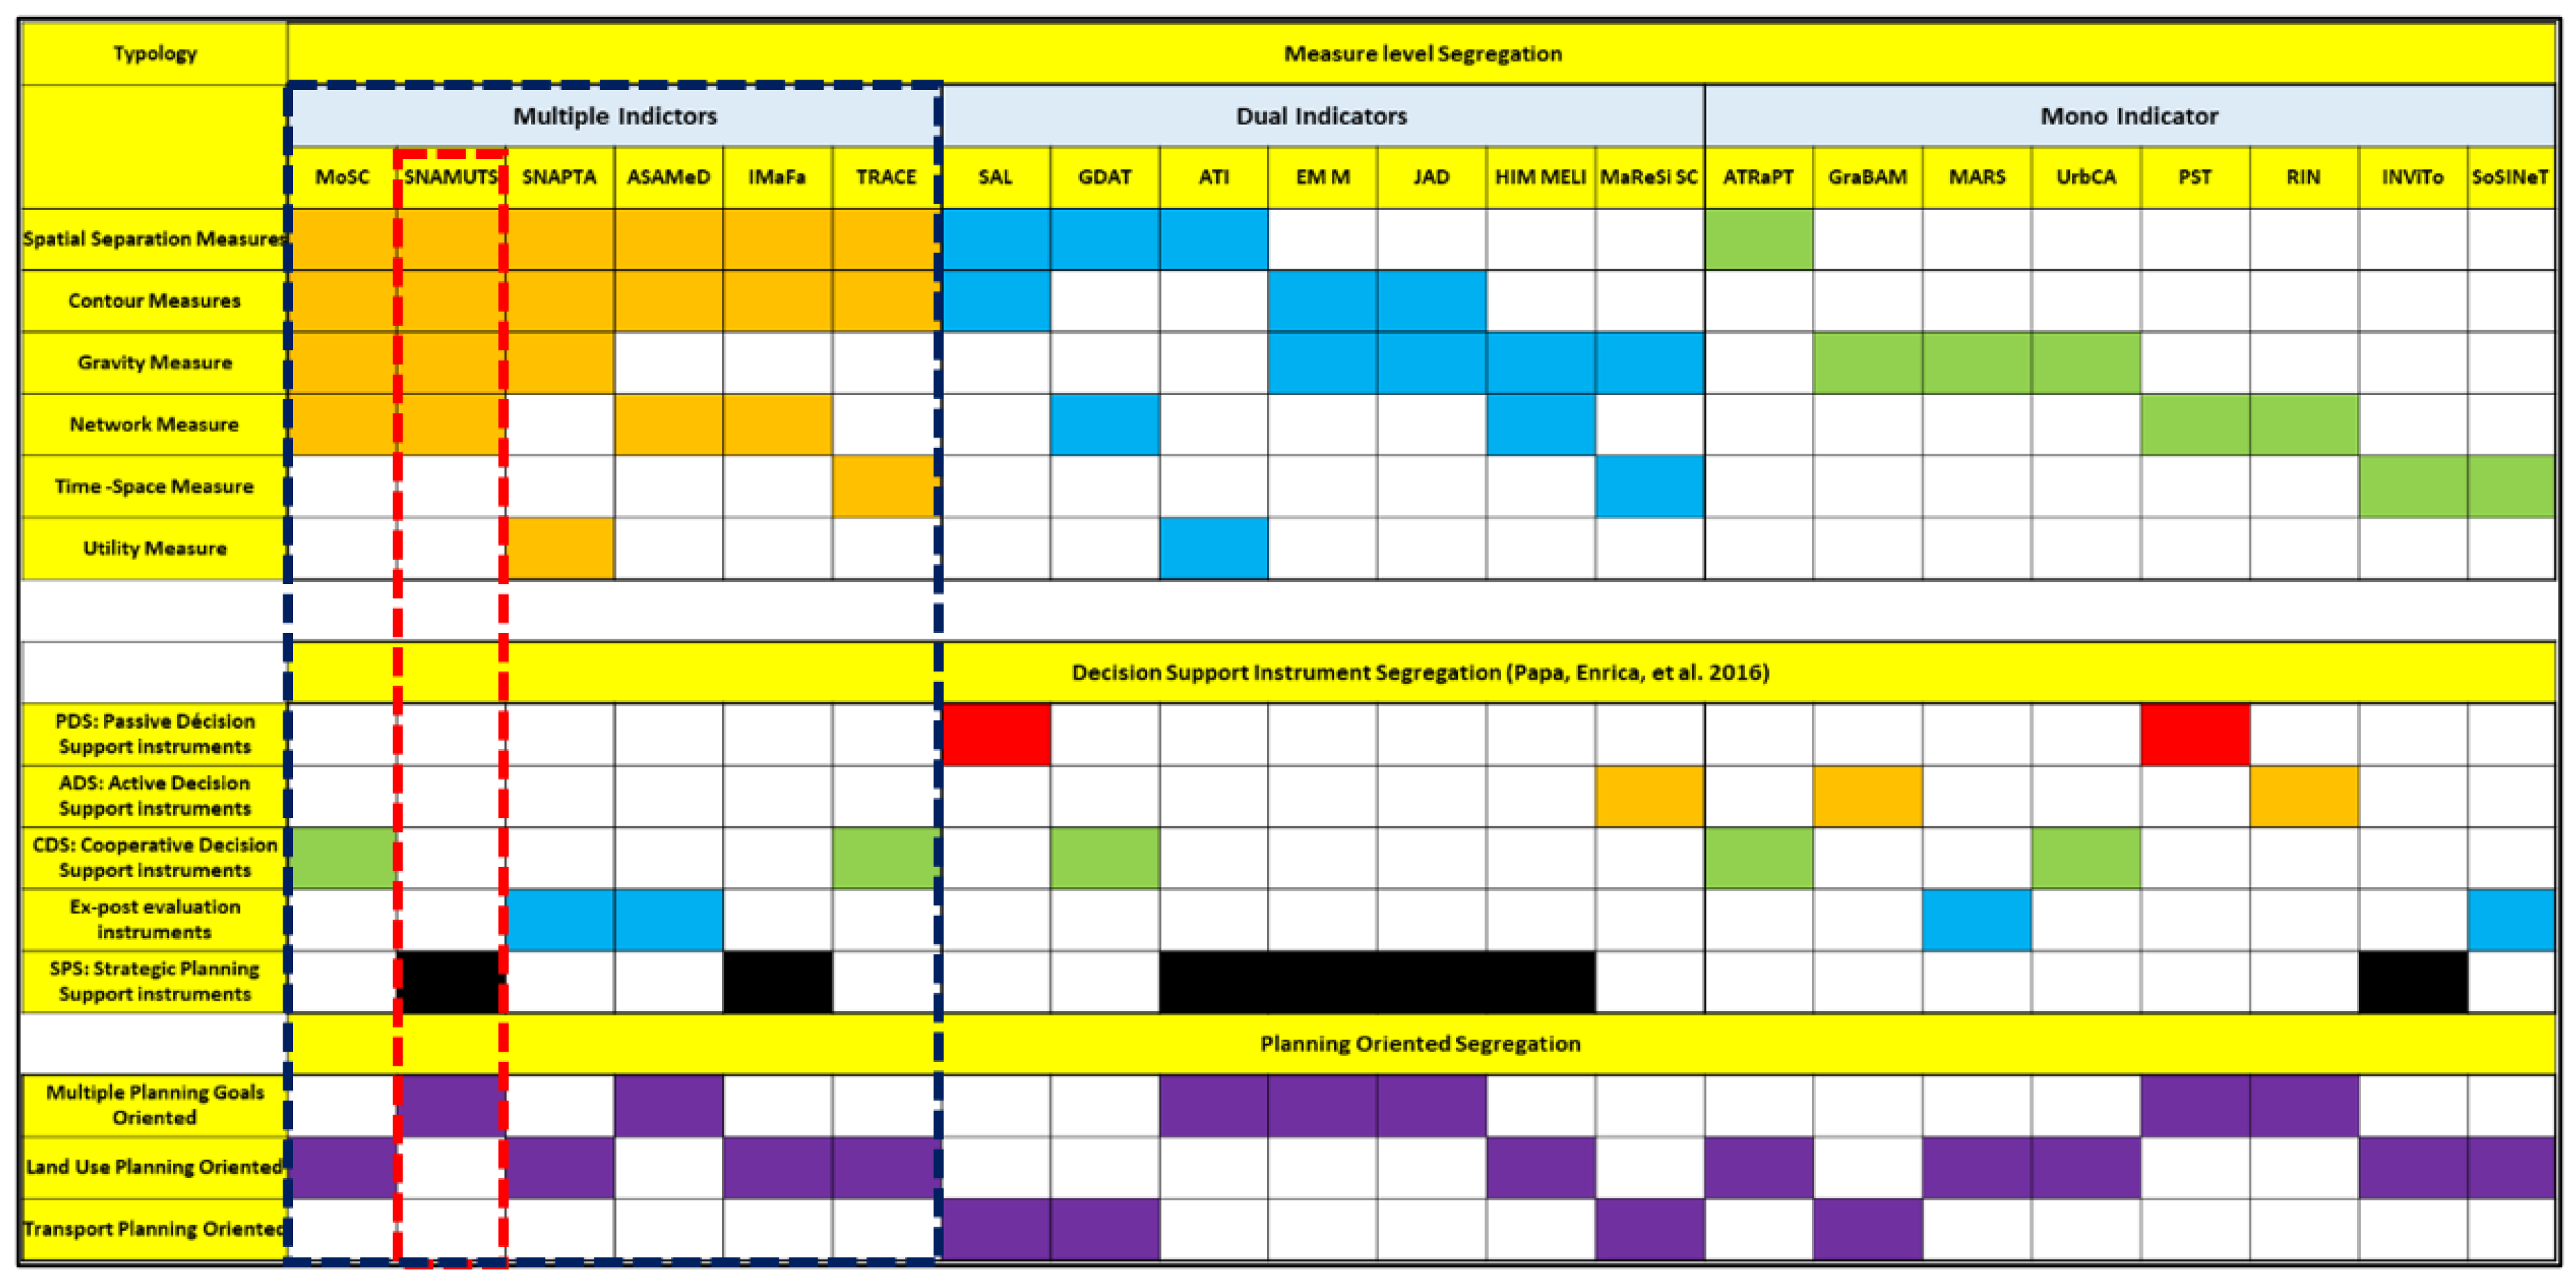
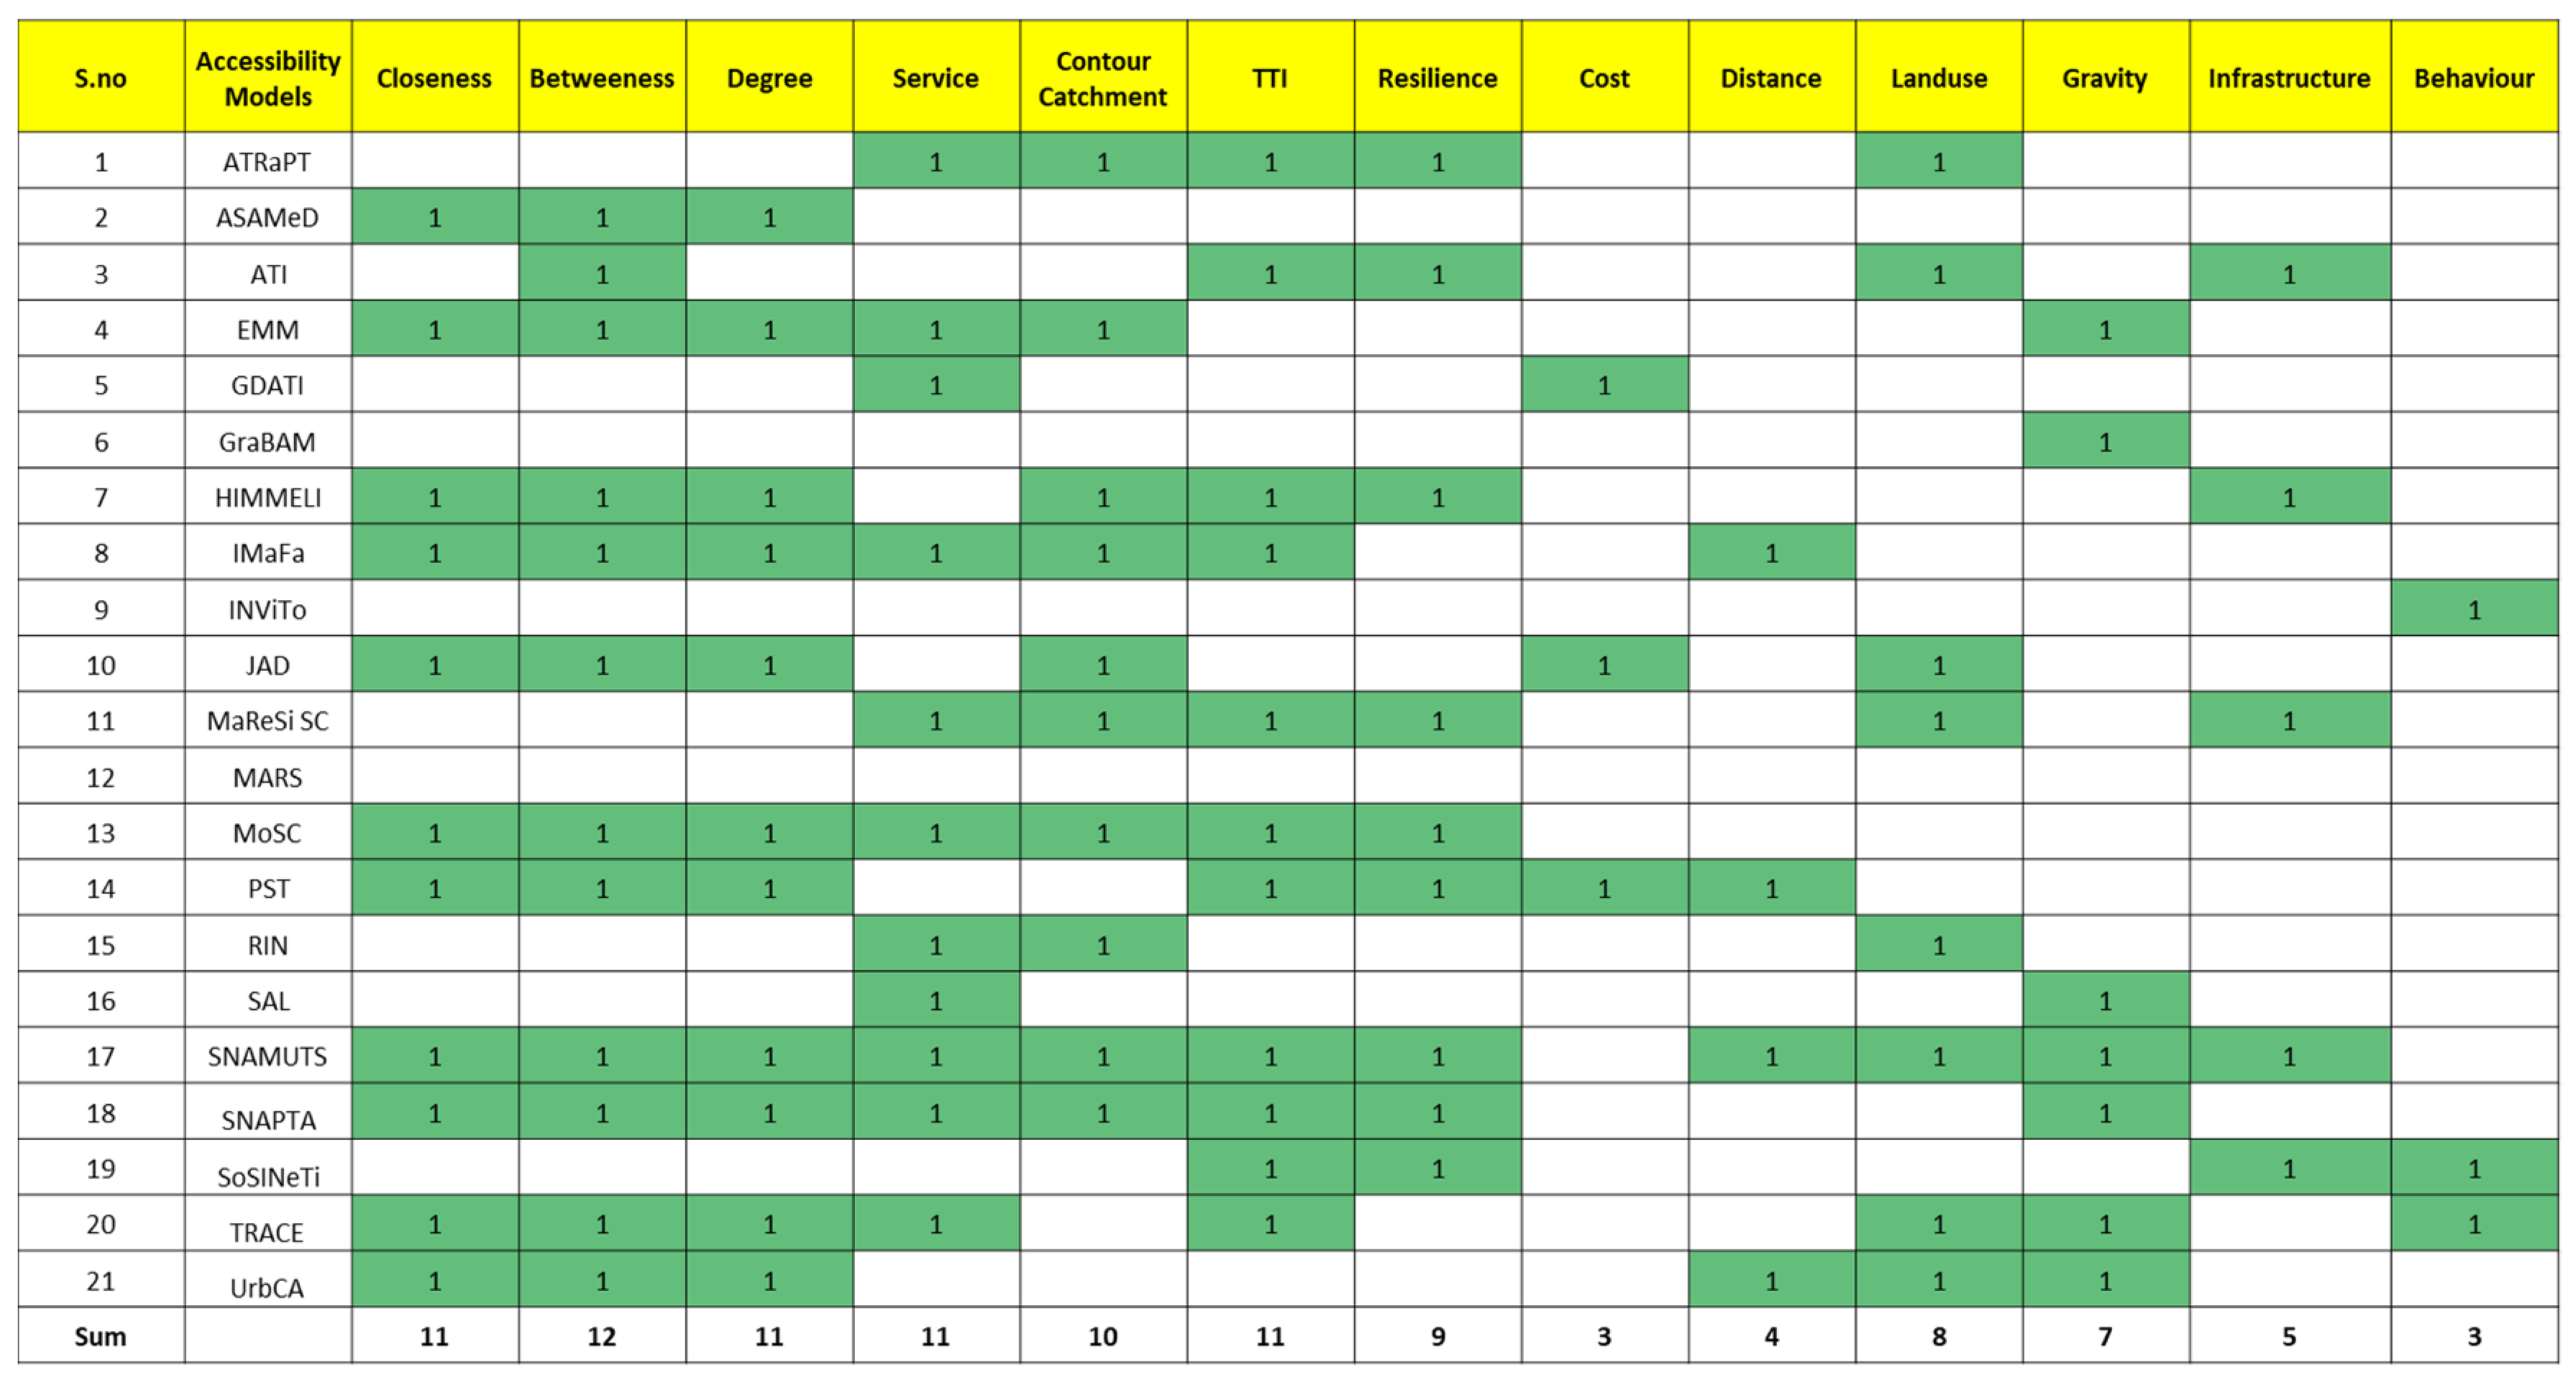
  • Level 1 Segregation: Measure level segregation—this is segregated in models with multiple indicators, dual indicators, and mono indicators. A distinguishing characteristic of accessibility models is the type of accessibility measures they employ (as discussed in Table 1 about measures). Several researchers have attempted to classify these metrics, as evidenced by a review of the relevant literature [69,70,71,72]. The attempt here is to identify the models that employ the maximum number of measures. In Figure 1, under the measure level of segregation, eight accessibility models are related to only one of these metrics, whereas the remaining analyses use combinations of accessibility measures. Notable is the progression of accessibility indices that evaluate solely the physical and morphological characteristics of space and define accessibility in terms of the topological network qualities of urban space, utilizing transportation and other networks based on visual perception. An analysis of accessibility indices reveals that geographical separation and cumulative accessibility measures are the most often employed types of metrics. According to a study by Papa et al., the use of more complicated indicators such as time–space measures appears too difficult to convey to stakeholders and to compare longitudinally [73]. In the first level, six models have been identified that employ multiple measures (MoSC, SNAMUTS, SNAPTA, ASAMeD, IMaFa, and TRACE).
  • Level 2 Segregation: Decision support instrument segregation, based on [73], evaluates the models based on the following parameters:
  • PDS: Passive Decision Support instruments
Instruments of Passive Decision Support, which enhance the decision-making process but cannot identify specific decision suggestions or answers (PST and SAL).
  • ADS: Active Decision Support instruments
Active Decision Support instruments, which can identify decision suggestions or solutions (such as GraBAM, MaReSi SC, and RIN).
  • CDS: Cooperative Decision Support instruments
Cooperative Decision Support instruments, which help the decision maker to amend, complete, or refine the system’s decision recommendations before sending them back to the system for validation (UrbCA, ATRaPT, GDATi, MoSC, TRACE)
  • Ex-post evaluation instruments
Ex-post evaluation instruments (MARS, ASAMeD, SNAPTA, SoSINeTi) used in undertaking a review of a land-use and transport planning.
  • SPS: Strategic Planning Support instruments
Strategic Planning Support instruments (ATI, EMM, HIMMELI, IMaFa, INViTo, JAD, and SNAMUTS) have been created to establish strategic interventions for long-term planning. Strategic planning support instruments are tools used to facilitate the process of strategic planning. These instruments can help organizations to identify their strengths, weaknesses, opportunities, and threats, set strategic goals, and develop action plans to achieve those goals. For this study, we identified SPS as a choice for the models as they help in developing and implementing strategic plans. They include techniques such as SWOT analysis, scenario planning, and trend analysis. These tools are used to identify opportunities and risks, assess organizational strengths and weaknesses, and develop strategies to achieve goals. The new model will help researchers in the strategic planning of railway station accessibility.
3.
Level 3 Segregation: Planning-Oriented Segregation
This paper defines accessibility models as strategic planning tools that include transport planning and spatial planning elements by employing accessibility concepts and indicators. Depending on the objective of the accessibility analysis, the spatial component may predominate over the transport planning component in some instances and vice versa. Based on this primary distinction, the investigated accessibility models were classified into three groups, with Figure 1 showing the planning-oriented segregation.
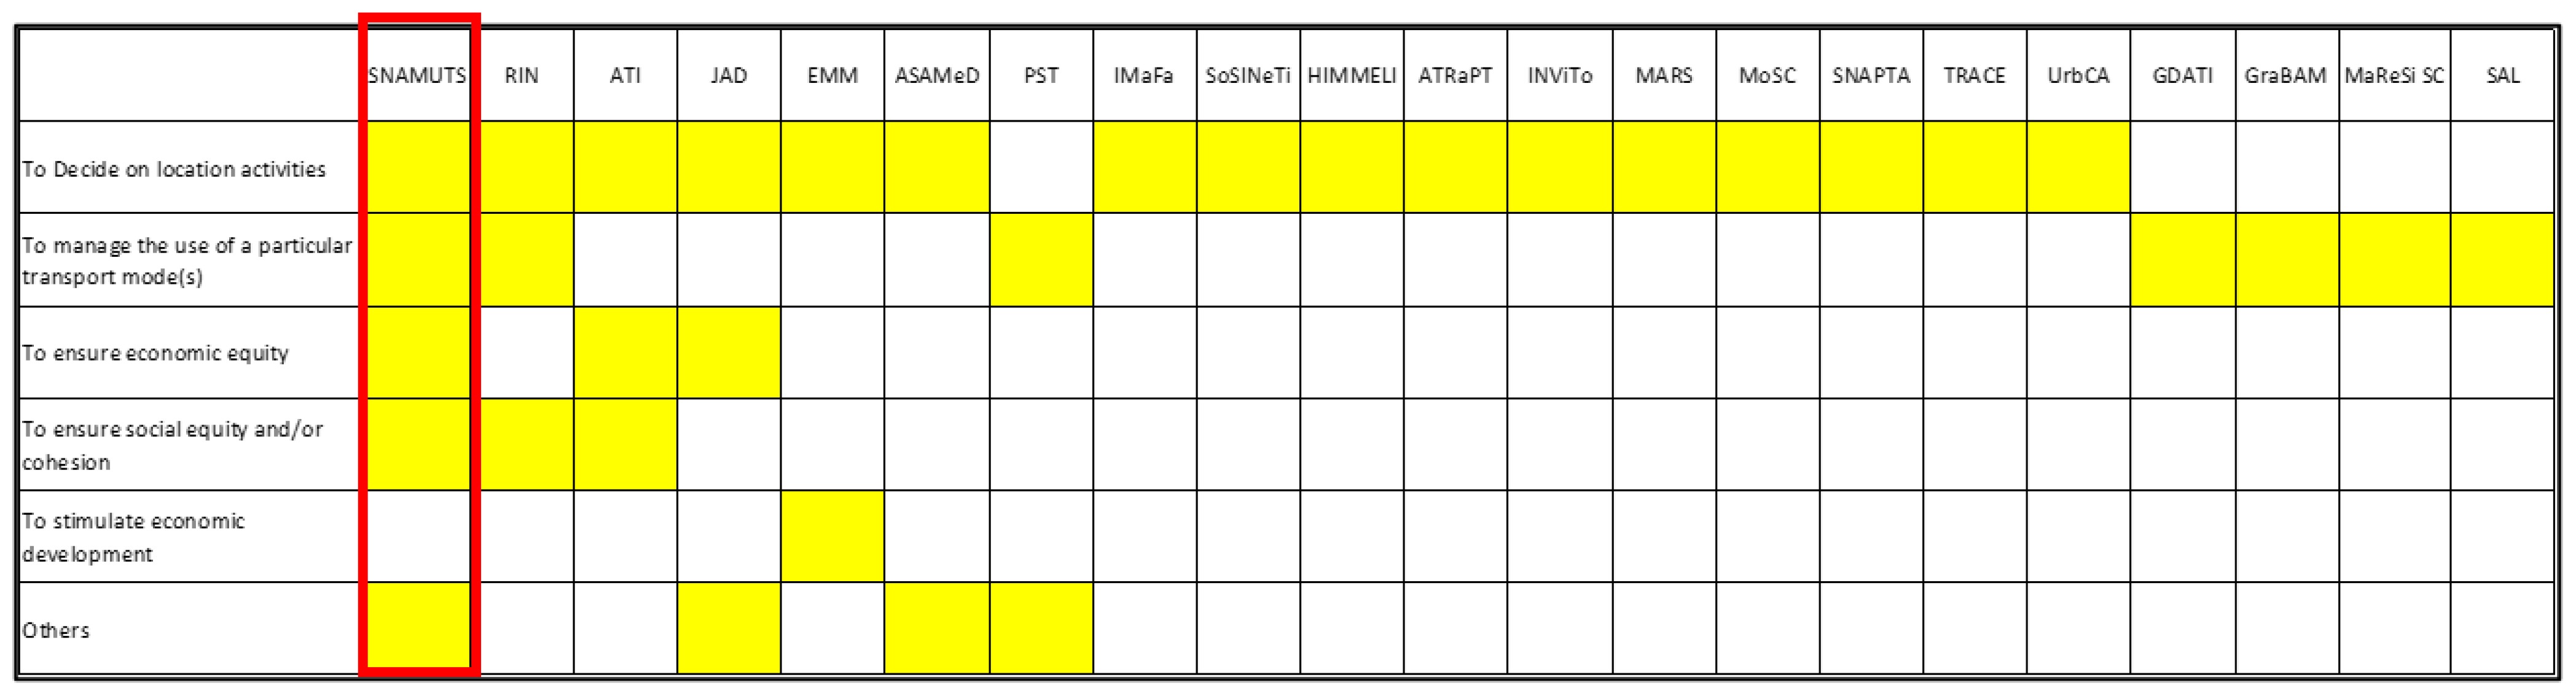
  • Multiple Planning Goals-oriented—this category comprises the accessibility models that can be utilized for various purposes, such as land use planning and transport planning.
  • Land Use Planning-oriented—the second group consists of accessibility models that are primarily concerned with answering spatial planning questions, for example, determining the location of a particular activity and assisting providers, such as public transport operators, retailers, and educational or health service organizations, with strategic planning by analyzing the perceived needs of potential customers within defined catchment areas. Among this group, certain AIs (TRACE and IMaFa) were designed to support policies or decisions in specific industries, such as retail, education, health, or leisure services, while others (SAL and GraBAM) were established to account for a variety of activities.
  • Transport Planning-oriented—the second type consists of accessibility models for which the primary objective is to manage, encourage, or reduce the use of a particular transport mode (i.e., they are transport planning-oriented). This category of accessibility models consists of public transportation or road trip planners that calculate the time required to reach a given destination, such as SAL, GDAT, MaReSISC, or GraBAM.
Based on the study, the following analysis is conducted for identifying the model:
Based on the study [73], planning-oriented segregation was further subdivided to obtain the models in Figure 2. SNAMUTS satisfied the maximum number of purposes of accessibility.
From Figure 1 and Figure 2, one model was identified, SNAMUTS. SNAMUTS is composed of multiple parameters with multiple planning goals. After identifying the model, the next stage is to identify the parameters; these parameters will be part of the new RsAI model. For this study, all the parameters were selected from the 21 models that were discussed before. Further PCA (principal component analysis) is conducted to identify the key variables and to remove the outlier parameters for streamlining the model.
The accessibility tool selection criteria identify all the parameters which are utilized in the 21 models (Table 1). The list was prepared, and various parameters were studied based on them.
From Figure 3, we tried to identify the number of parameters that were employed by various models.

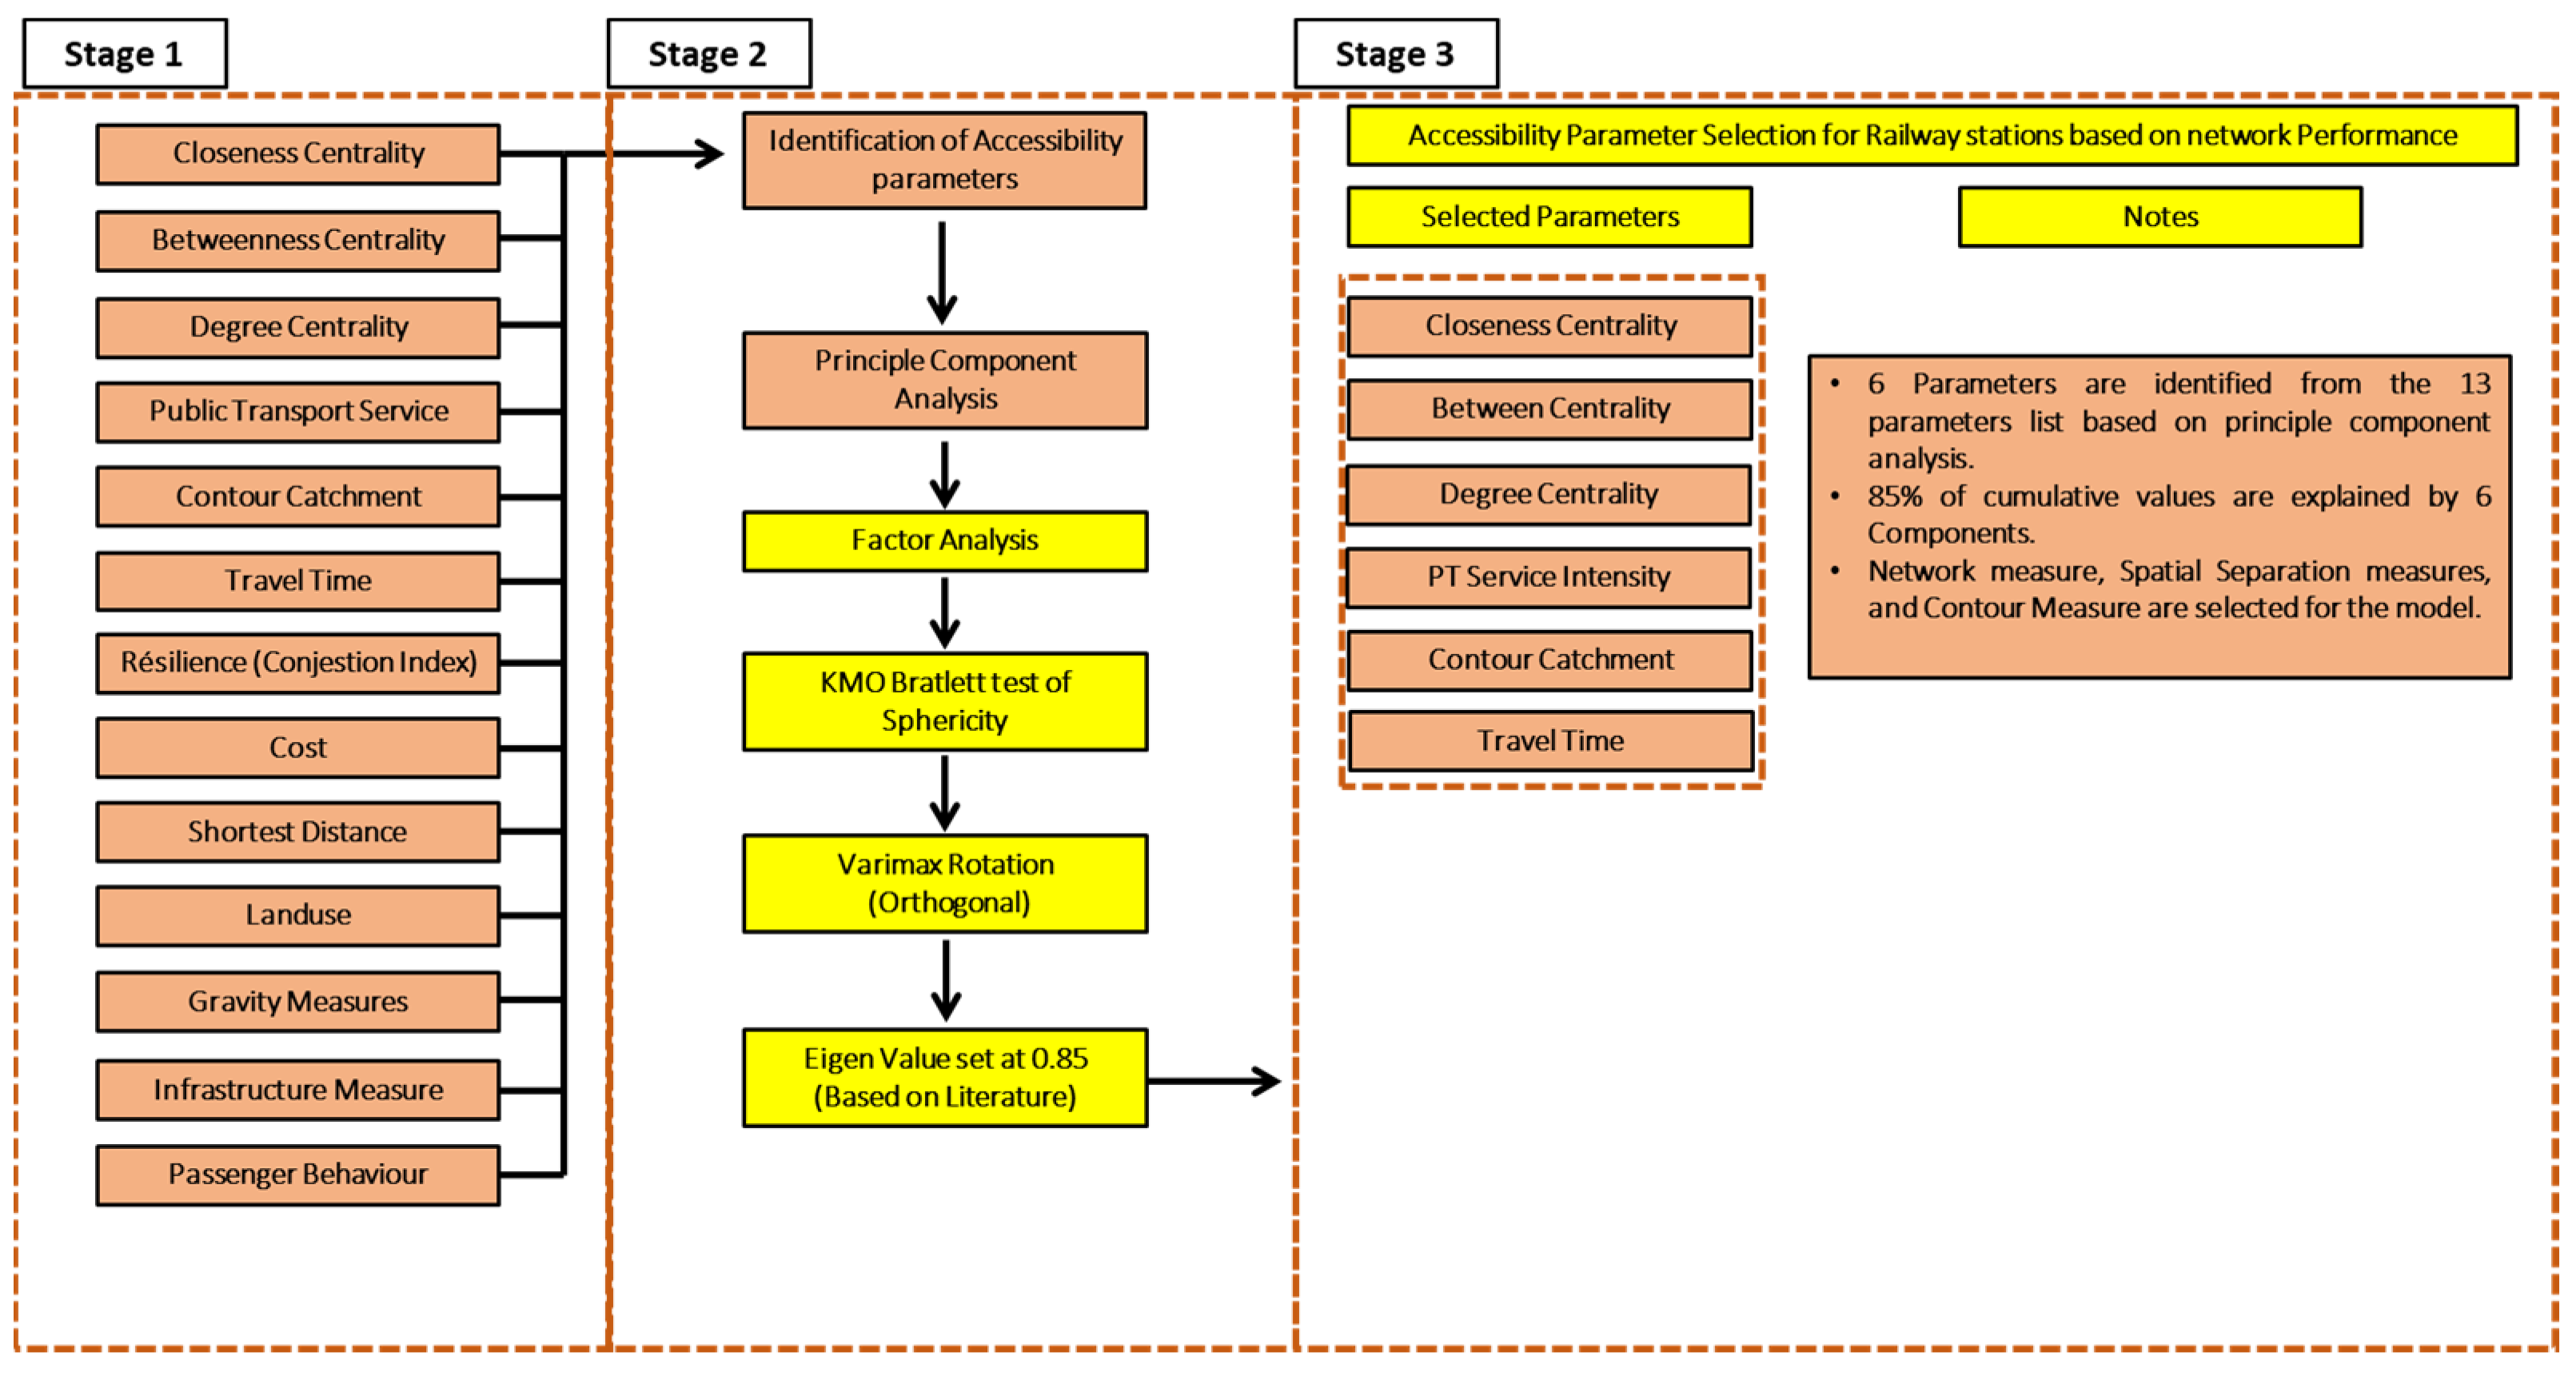
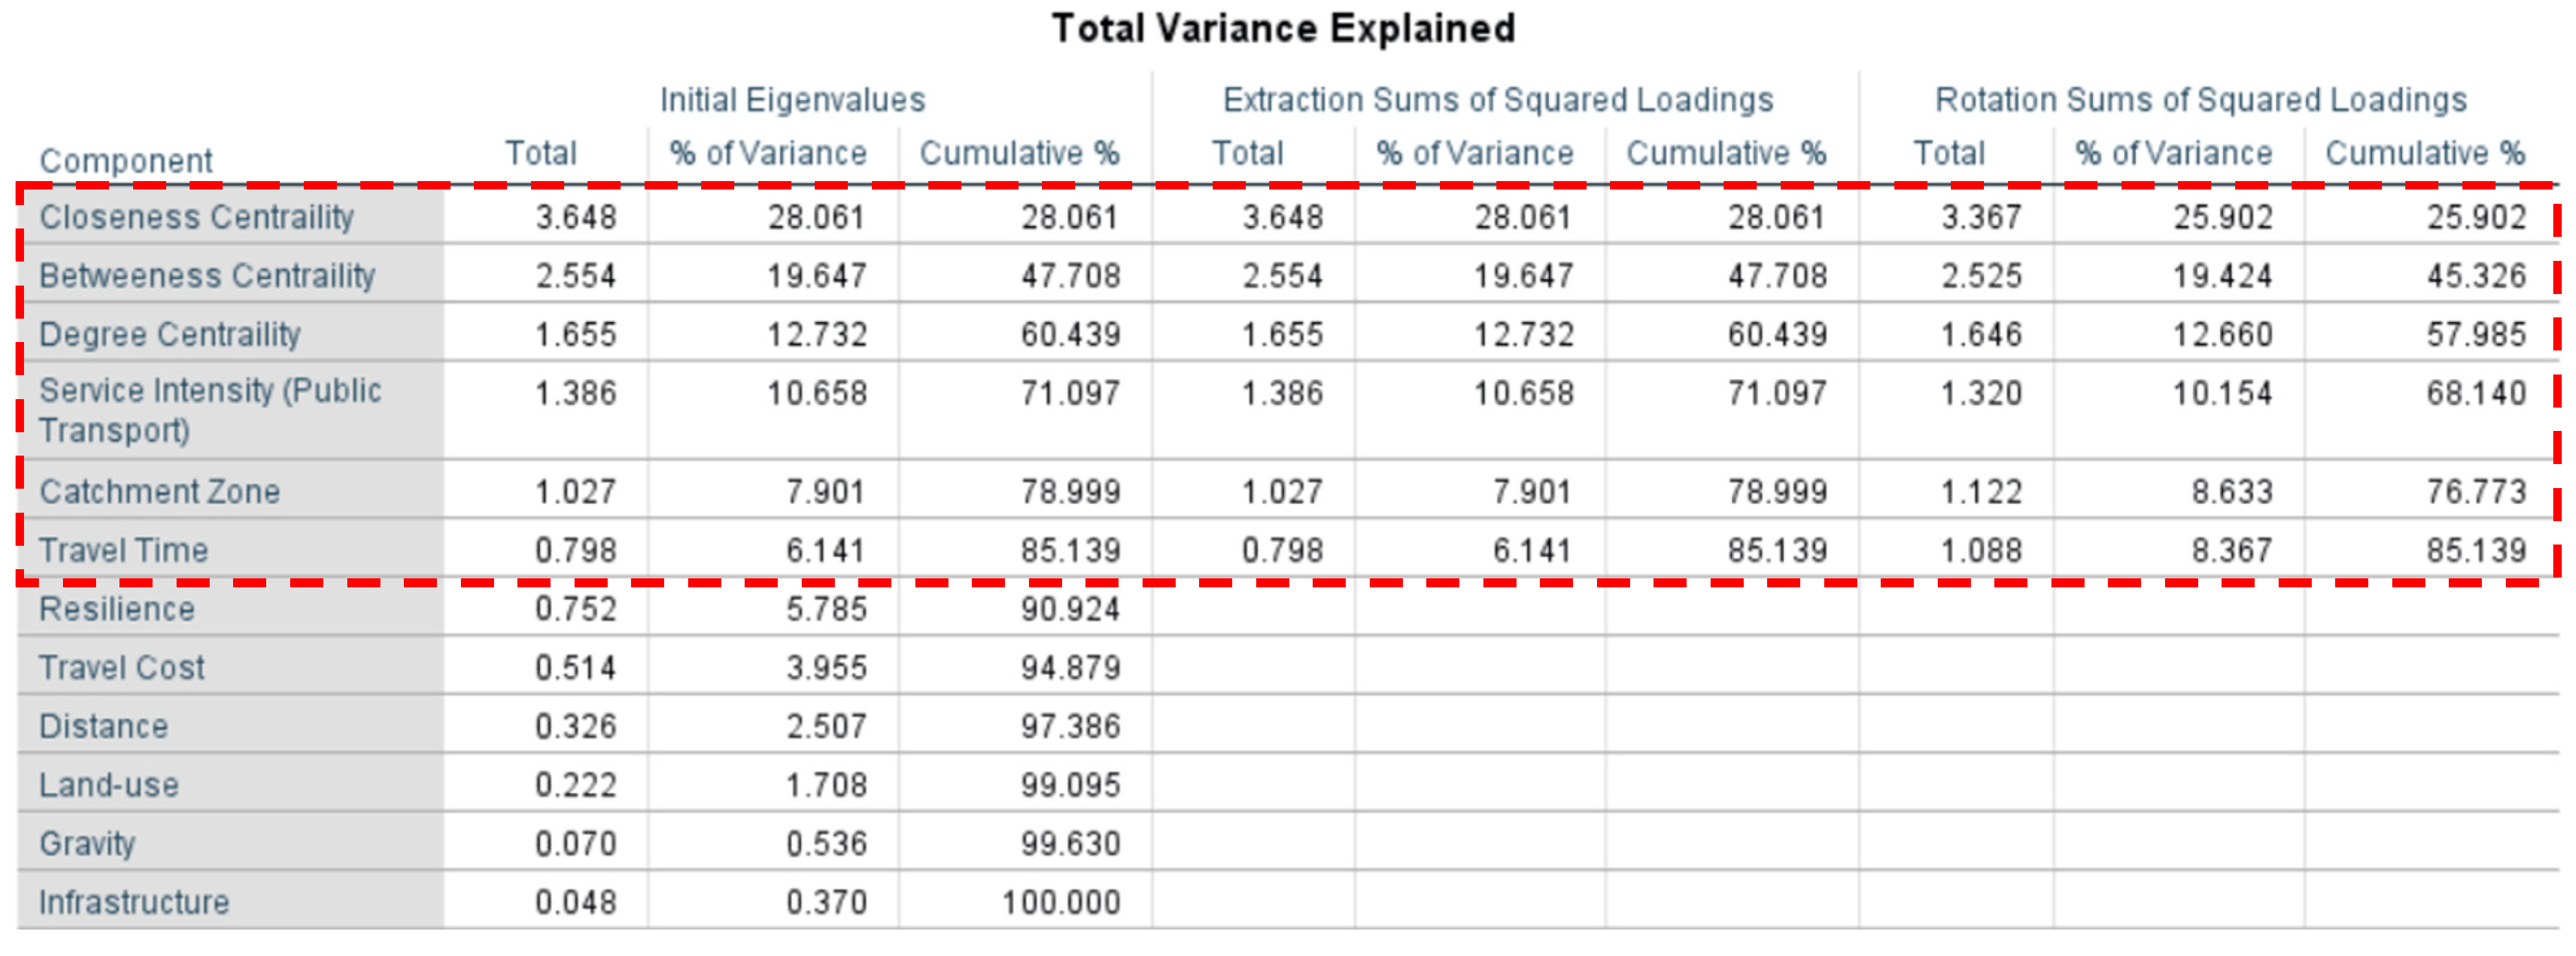
4. Selected Parameters

Figure 4 presents a methodology chart for identifying parameters using three steps:
Step 1. Parameters identified from the literature study as mentioned in Figure 3.
Step 2. Identifying accessibility parameters using PCA (principal component analysis) where factor analysis was conducted to find the components explaining the 0.85 eigenvalue. An eigenvalue of 0.85 signifies that the principal component explains 85% of the total variance in the data. This means that this particular principal component can capture a large portion of the variability present in the data and can be considered an important component in the analysis.
Step 3. Through Figure 5, selected parameters for formulating the model based on an eigenvalue set at 0.85 were identified. Six parameters were identified from the test:
  • Closeness Centrality;
  • Betweenness Centrality;
  • Degree Centrality;
  • PT service Intensity;
  • Contour Catchment;
  • Travel time (travel time reliability).

5. Railway Station Accessibility Index Model (RsAI) (External)

The RsAI model comprises all the parameters mentioned above. During our study, it was observed that travel time reliability is an important instrument for assessing the accessibility of the region. The formula for each variable is modified and discussed.
I
Closeness Centrality: In terms of speed and travel-time reliability, closeness centrality reflects the ease of transit along a transport network. It measures the minimal cumulative hindrance value between each pair of nodes in each direction. Closeness centrality is shown as an average for the whole network and each node.
C i = J = 1 N N 1 L min iJ
where
C i = Closeness centrality of node I;
L min i J   = Minimum cumulative impediment between nodes I and j;
N = Number of activity nodes in the network.
L min iJ = 4   x f ij
where
L min i J = Impediment value of route segment between nodes i and j;
f i j ˙ = Travel Time Reliability;
Weighted Measure.
II. 
Betweenness Centrality: Betweenness centrality describes the geographical distribution of desirable travel pathways between the shortest pair of network nodes. This indicator is weighted by activity node catchment size. It indicates the degree to which an activity node is placed “at the crossroads” of network supply. This value is weighted by the catchment size and travel time reliability of activity nodes (travel impediment).
C B k = (   s i j ( K ) / N ) / T T I
where
C B k = Betweenness centrality;
s i j ( K ) = Paths between nodes i and j that pass-through node kj;
N = Number of activity nodes in the network;
TTI = Travel Time reliability as a weight measure.
III. 
Degree centrality: This indicator describes the directness of journeys along the transport network. It is a topological network indicator, measuring the minimum number of transfers between each pair of nodes. Degree centrality is shown as an average across the network and as an average for each node. Lower values indicate greater centrality.
C D = Σ a i ˙ j / ( N 1 )
where
C D = Degree centrality;
a i ˙ j = Transfer-free link between nodes i and j;
N = Number of activity nodes in the network.
IV. 
PT Service Intensity: This indicator, derived from the network analysis, measures the operational input used to provide the service levels across the system. The number of vehicles for each mode that is in simultaneous revenue service during the weekday inter-peak period is counted. The index is expressed relative to the metropolitan population (vehicles or train sets per 100,000 residents).
V. 
Contour Catchment: The influence of network speed intensity is quantified using contour catchments. This index indicates the station’s reachability; the higher quartile of 75% is used as the cutoff value. OD surveys were conducted on the stations to identify the catchment zones. The lower quartile (25%), middle quartile (55%), and upper quartile (75%) were selected to identify different zones. Speed isochrones for 30 min are observed on these contours.
VI. 
Planning Time Index: The planning time index is calculated by dividing the trip time of the 95th percentile by the free-flow travel time. The planning time index compares near-worst-case trip time with travel time under light or free-flowing traffic conditions.
p T I = T T 95 % T T F R E E
where
p T I = Planning Time Index;
T T 95 % = Travel time at 95%;
T T F R E E = Travel time during free flow.

6. The Final RsAI (Railway Station Accessibility Model) (External) Is Derived as

The combined normalized score of the R s A I of all the six parameters should be equal to or lesser than six. The final score was then again normalized to obtain the final index.
RsAI = C i + C B k + C D i + P T S + CC + PTI = < 6
R s A I = J = 1 N N 1 L min i J + (   s i j ( K ) / N ) T T I + Σ a i j / ( N 1 ) + P T S + C C + T T 95 % T T F R E E

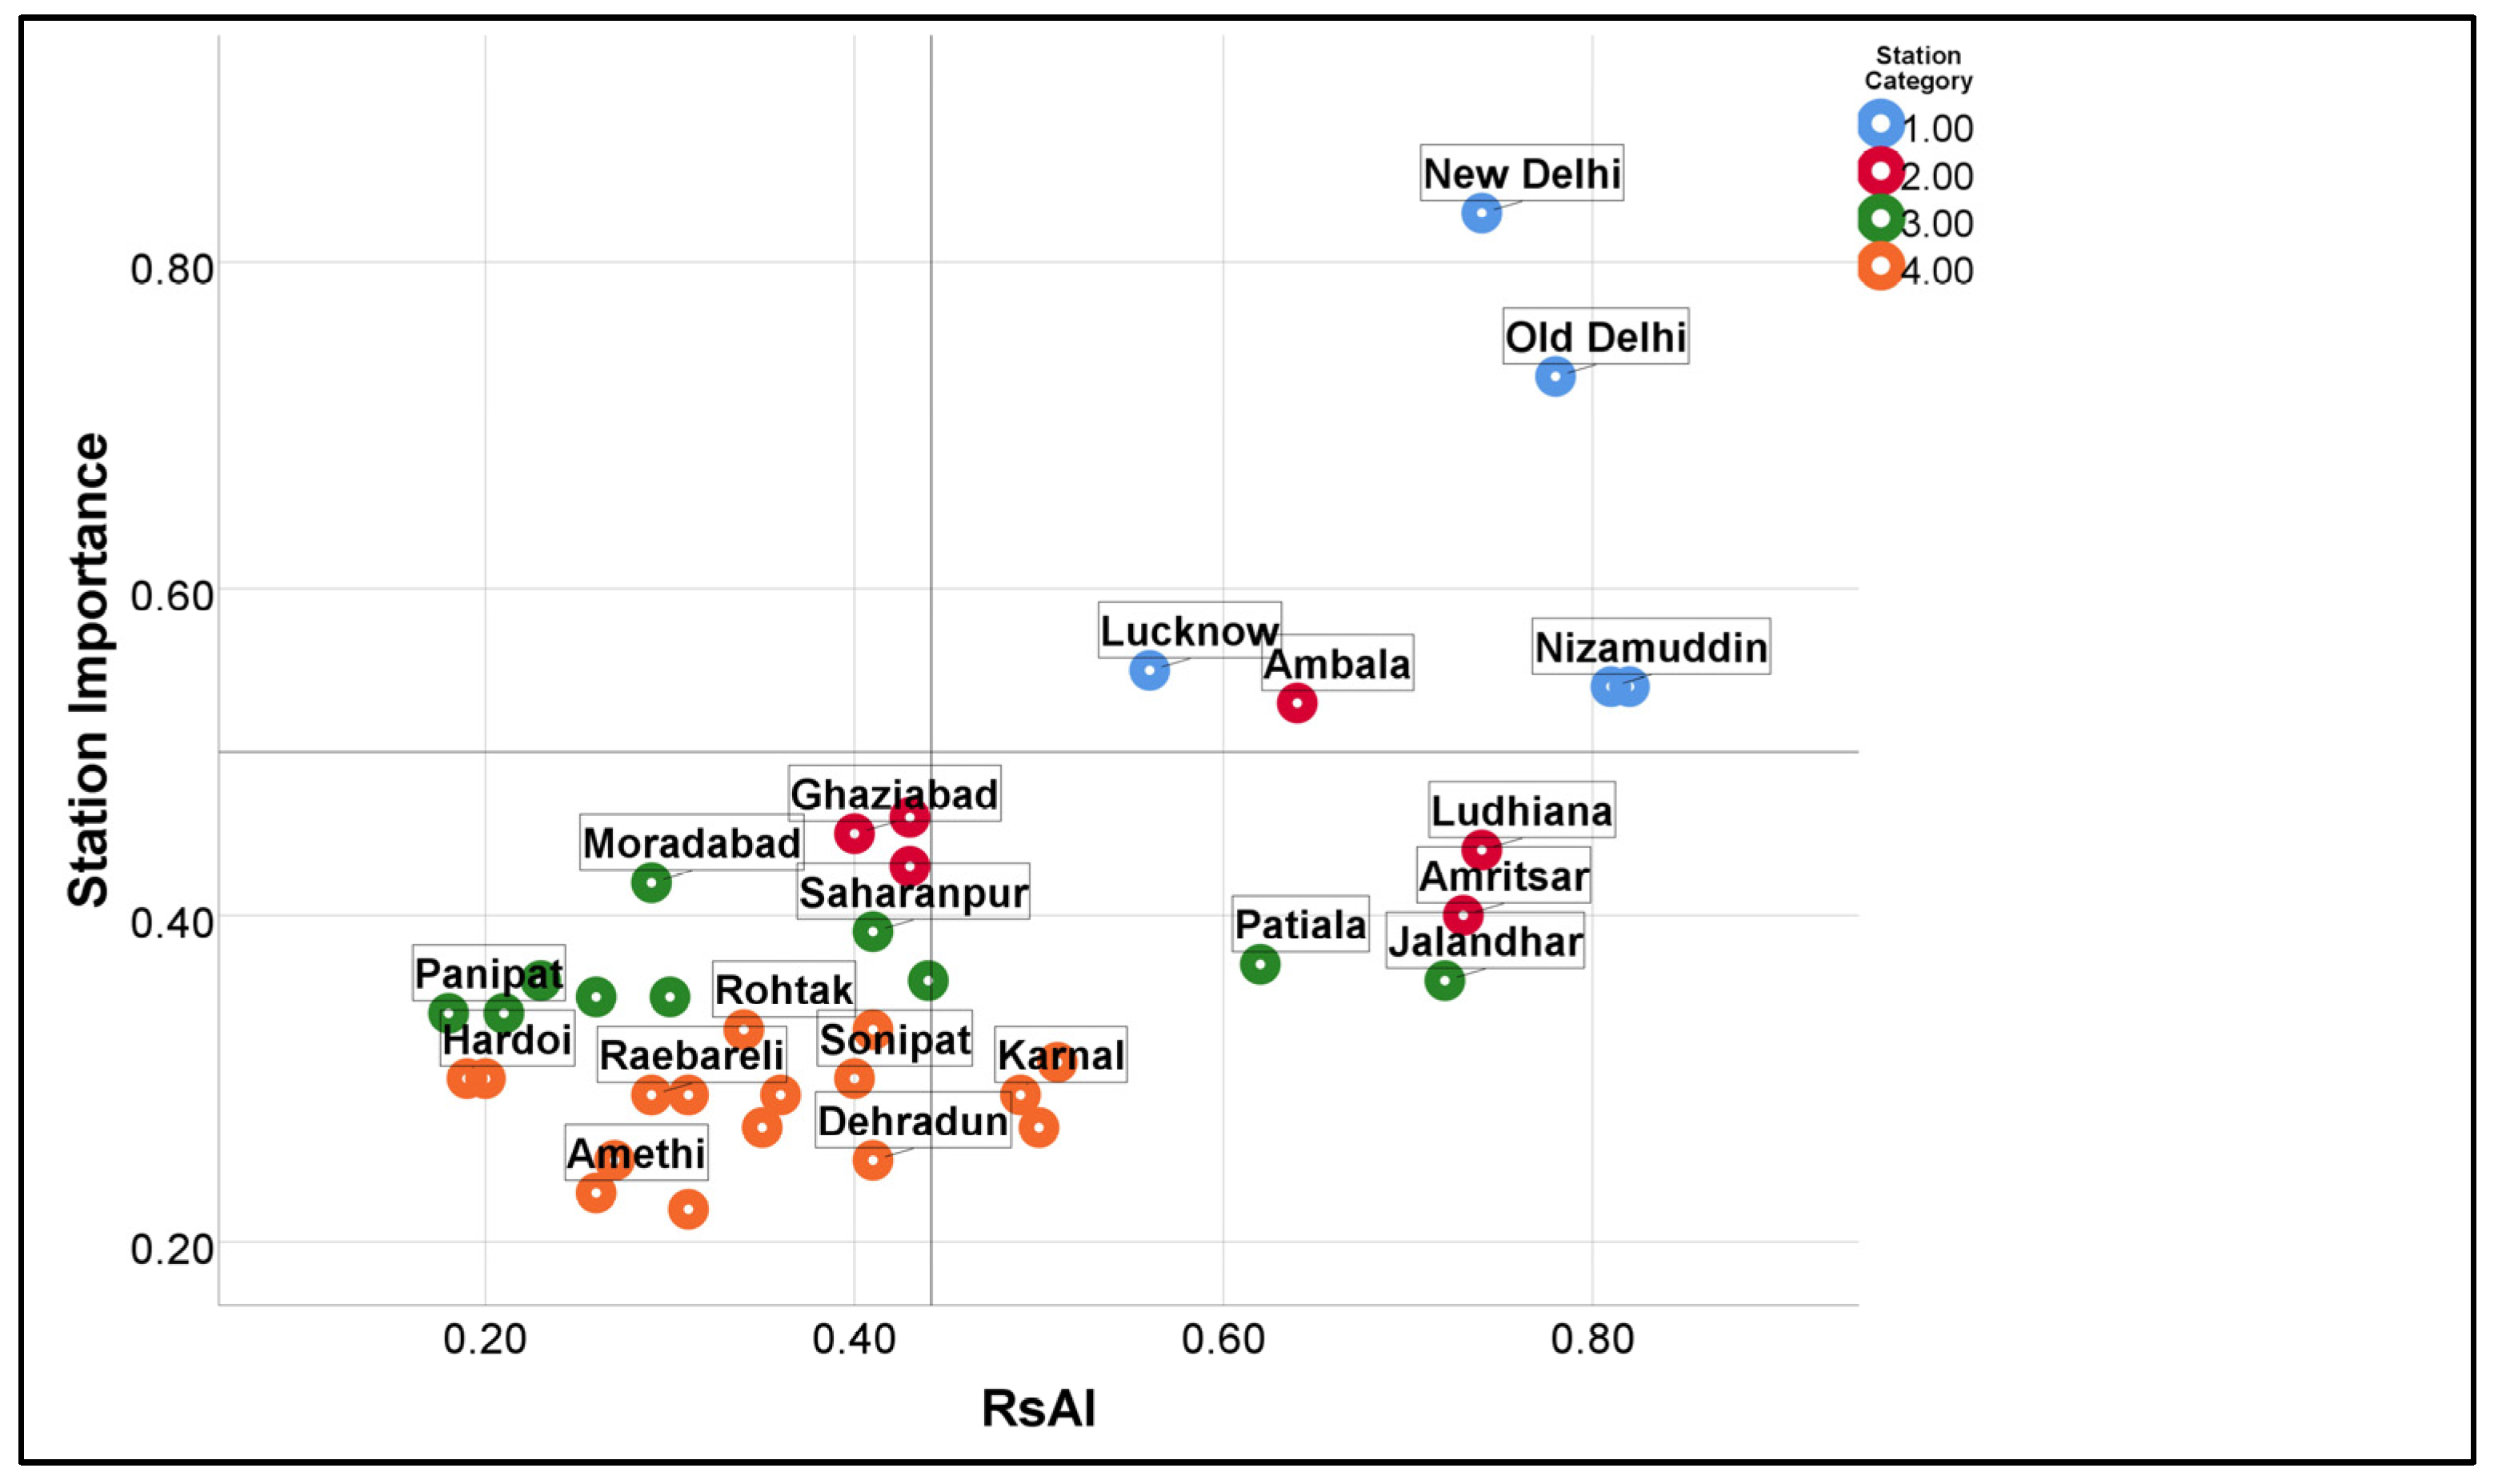
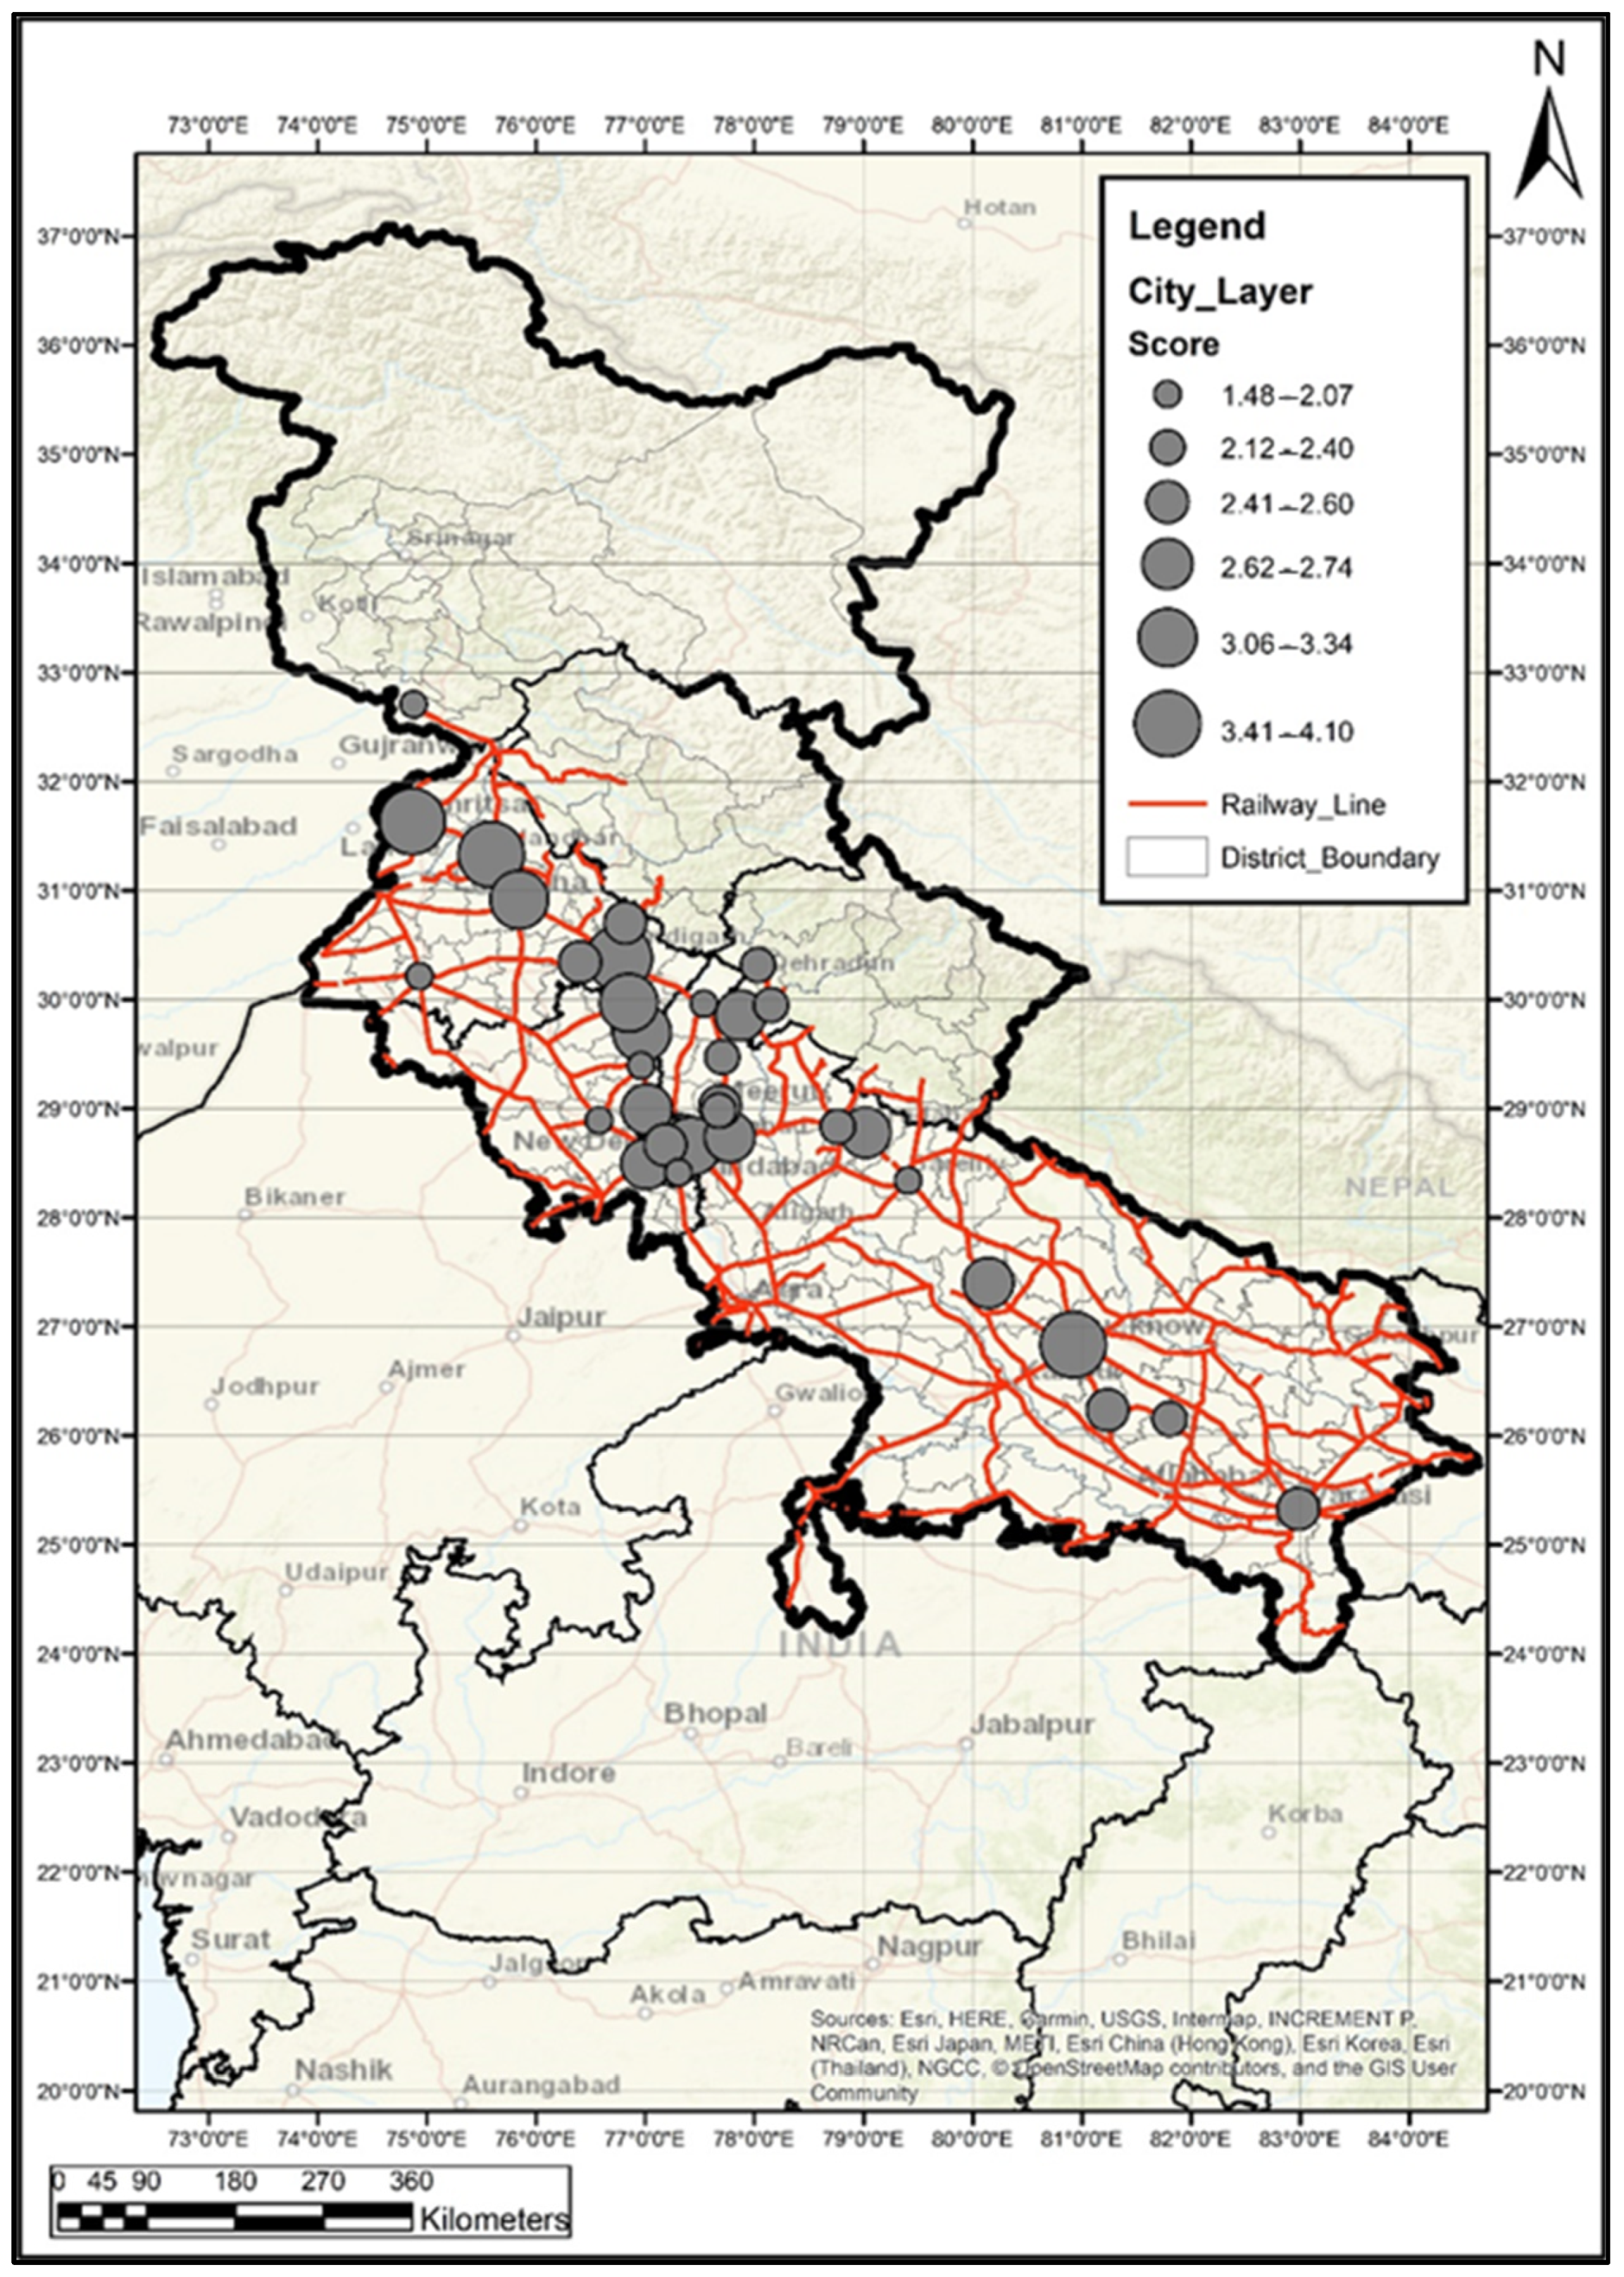
7. Ranking Railway Stations Based on RsAI (External)

For the study, 40 railway stations from the Northern Indian division were selected using AHP analysis, where these stations were ranked based on the importance of the station within the region. Based on the study by Bhatnagar et. al, the stations were identified and surveys were conducted for data collection [74]. The data are presented in Table 2. For the data collection, speed delay surveys were undertaken to determine travel time, origin, and destination surveys in order to determine the number of passengers and the mode of transportation. The data were then plotted in GIS for each station. Nodes and linkages were established, and data were entered. Lastly, the data for each parameter were fed into Equation (11).
After the collection and analysis of the data for all the parameters under all the station categories, each value is normalized before being added up using the formula given above. The goal is to enforce a level of consistency in operations within the selected environment. The normalized values are presented in Table 3.

8. Results

The station accessibility ranking (RsAI) is compared with the ranking of the stations based on the importance of the station in the region as per the research by Bhatnagar et al. [74] presented in Table 4. The importance of the station is based on the following parameters: number of platforms, area of the station, annual passengers, number of train stops per day, types of trains, and importance of the station as a public transport node. The following data were collected through the RTI Act (right to information), where Indian Railways furnished the data and analysis was conducted to identify the importance of the data. The Final RsAI score is generated using Equation (10).

9. Discussion

The aim of the study is to identify stations with poor accessibility in different categories; the ranking is dynamic in nature, and this will encourage different urban local bodies to work on enhancing accessibility to railway stations for sustainable operations. Enhancing accessibility also helps stations to operate at their optimal design capacities. A relationship is studied between station importance and RsAI using the Pearson correlation technique (Table 5), and it is inferred that there is a strong positive correlation and that the results are highly significant.
The position of the railway station within the network, the position of the railway station relative to settlements (attractiveness), and the railway station’s infrastructure and its importance to passengers are related to the accessibility of the station. The more important the station is in the region, the better connected it is to the surrounding transport network.
Figure 6 represents railway stations of different hierarchies ranked with regard to RsAI on the x-axis and station importance on the y-axis; this provides an important observation of the accessibility of stations of different hierarchies. The stations’ accessibilities can be observed in Figure 7.
It has been inferred that a number of higher-importance stations score lower in the accessibility index; this is a major issue when passengers are switching to alternative modes of travel.
Figure 8 represents the ranges of RsAI within different categories of the station; it can be inferred (Table 6) that as a station’s importance decreases in the network, the accessibility to that station also decreases. Category 1 stations show the highest accessibility index compared to other categories and Category 4 show the lowest.
The observations across the station group for various parameters help in identifying the parameter which is impacting the accessibility of a particular station.

10. Conclusions

The following conclusions are drawn from the above study.
The model RsAI is applicable to all railway systems around the world, as this model will help different categories of stations in evaluating their current accessibility. The position of the railway station within the network, the position of the railway station relative to settlement (attractiveness), and the railway station’s infrastructure and its importance to passengers are all related to the accessibility of the station. The higher the importance of the station in the region, the better it relates to the surrounding transport network. As station importance increases in the region and on the transport network, its accessibility is also observed to increase. The public transport intensity parameter is also a decisive indicator for ranking stations, and we observed the absence of a public transport system in many of the category 3 and 4 stations. Urban local bodies and railway organizations can identify stations with lower accessibility and suggest improvements; this will give rise to better accessibility to stations within this category. The ranking is dynamic in nature and periodic studies will help in improving the accessibility situations.

Author Contributions

Conceptualization, S.R. and R.V.B.; methodology, R.V.B.; software, R.V.B.; validation, S.R., R.V.B.; formal analysis, R.V.B.; investigation, R.V.B.; resources, R.V.B.; data curation, R.V.B.; writing—original draft preparation, R.V.B.; writing—review and editing, S.R.; visualization, R.V.B.; supervision, S.R.; project administration, S.R. All authors have read and agreed to the published version of the manuscript.

Funding

This research received no external funding.

Conflicts of Interest

The authors declare no conflict of interest.

References

  1. Schoon, J.G.; McDonald, M.; Lee, A. Accessibility Indices: Pilot Study and Potential Use in Strategic Planning. Transp. Res. Rec. 1999, 1685, 29–38. [Google Scholar] [CrossRef]
  2. Bhat, C.; Handy, S.; Kockelman, K.; Mahmassani, H.; Chen, Q.; Weston, L. Development of an Urban Accessibility Index: Literature Review; University of Texas at Austin: Austin, TX, USA, 2000. [Google Scholar]
  3. Dupuy, G.; Stransky, V. Cities and Highway Networks in Europe. J. Transp. Geogr. 1996, 4, 107–121. [Google Scholar] [CrossRef]
  4. Muraco, W.A. Intraurban Accessibility. Econ. Geogr. 1972, 48, 388–405. [Google Scholar] [CrossRef]
  5. Leake, G.R.; Huzayyin, A. Accessibility Measures and Their Suitability for Use in Trip Generation Models. Traffic Eng. Control 1979, 20, 566–572. [Google Scholar]
  6. Tang, J.; Zhen, F.; Cao, J.; Mokhtarian, P.L. How Do Passengers Use Travel Time? A Case Study of Shanghai–Nanjing High Speed Rail. Transportation 2018, 45, 451–477. [Google Scholar] [CrossRef]
  7. Weibull, J.W. An Axiomatic Approach to the Measurement of Accessibility. Reg. Sci. Urban Econ. 1976, 6, 357–379. [Google Scholar] [CrossRef]
  8. Handy, S.L.; Niemeier, D.A. Measuring Accessibility: An Exploration of Issues and Alternatives. Environ. Plan. A 1997, 29, 1175–1194. [Google Scholar] [CrossRef]
  9. Levinson, D.M.; Kumar, A. A Multi-Modal Trip Distribution Model. Transp. Res. Rec. 1994, 1466, 124–131. [Google Scholar]
  10. Mowforth, M.R.N. Trends in Accessibility to Employment in Greater London, 1971–1981. Transp. Plan. Technol. 1989, 13, 85–110. [Google Scholar] [CrossRef]
  11. Wachs, M.; Kumagai, T.G. Physical Accessibility as a Social Indicator. Socio-Econ. Plan. Sci. 1973, 7, 437–456. [Google Scholar] [CrossRef]
  12. Black, J.; Conroy, M. Accessibility Measures and the Social Evaluation of Urban Structure. Environ. Plan. A 1977, 9, 1013–1031. [Google Scholar] [CrossRef]
  13. Hanson, S.; Schwab, M. Accessibility and Intraurban Travel. Environ. Plan. A 1987, 19, 735–748. [Google Scholar] [CrossRef]
  14. Barber, B.; Sherman, L.; Kondo, W. Method for Evaluating Metropolitan Accessibility. Transp. Res. Rec. 1974, 499, 70–82. [Google Scholar]
  15. Carrothers, G.A.P. An Historical Review of the Gravity and Potential Concepts of Human Interaction. J. Am. Inst. Plan. 1956, 22, 94–102. [Google Scholar] [CrossRef]
  16. Hansen, W.G. How Accessibility Shapes Land Use. J. Am. Plan. Assoc. 1959, 25, 73–76. [Google Scholar] [CrossRef]
  17. Zhang, M.; Shen, Q.; Sussman, J. Job Accessibility in the San Juan Metropolitan Region: Implications for Rail Transit Benefit Analysis. Transp. Res. Rec. 1998, 1618, 22–31. [Google Scholar] [CrossRef]
  18. Handy, S.L. Regional versus Local Accessibility: Neo-Traditional Development and Its Implications for Non-Work Travel. Built Environ. 1992, 18, 253–267. [Google Scholar]
  19. Ben-Akiva, M.; Lerman, S.R. Disaggregate Travel and Mobility-Choice Models and Measures of Accessibility. In Behavioural Travel Modelling; Routledge: Abingdon, UK, 2021; pp. 654–679. ISBN 1003156053. [Google Scholar]
  20. Hägerstrand, T.; Pred, A. Space and Time in Geography: Essays Dedicated to Torsten Hägerstrand; CWK Gleerup, Centre for Digital Philosophy at the University of Western Ontario (Canada): London, ON, USA, 1981. [Google Scholar]
  21. Burns, L.D. Transportation, Temporal, and Spatial Components of Accessibility; Lexington Books: Washington, DC, USA, 1980. [Google Scholar]
  22. Hall, R.W. Travel Outcome and Performance: The Effect of Uncertainty on Accessibility. Transp. Res. Part B Methodol. 1983, 17, 275–290. [Google Scholar] [CrossRef]
  23. Marshall, S. Streets and Patterns; Routledge: Abingdon, UK, 2004; ISBN 1134370768. [Google Scholar]
  24. Pirie, G.H. Measuring Accessibility: A Review and Proposal. Environ. Plan. A 1979, 11, 299–312. [Google Scholar] [CrossRef]
  25. Kwan, M. Space-time and Integral Measures of Individual Accessibility: A Comparative Analysis Using a Point-based Framework. Geogr. Anal. 1998, 30, 191–216. [Google Scholar] [CrossRef]
  26. Geertman, S.C.M.; Ritsema Van Eck, J.R. GIS and Models of Accessibility Potential: An Application in Planning. Int. J. Geogr. Inf. Syst. 1995, 9, 67–80. [Google Scholar] [CrossRef]
  27. Song, S. Some Tests of Alternative Accessibility Measures: A Population Density Approach. Land Econ. 1996, 72, 474–482. [Google Scholar] [CrossRef]
  28. Lowe, J.C.; Moryadas, S. The Geography of Movement; Houghton Mifflin: Boston, MA, USA, 1975. [Google Scholar]
  29. Xie, F.; Levinson, D. Topological Evolution of Surface Transportation Networks. Comput. Environ. Urban Syst. 2009, 33, 211–223. [Google Scholar] [CrossRef]
  30. Garrison, W.L. Connectivity of the Interstate Highway System. Pap. Reg. Sci. 1960, 6, 121–137. [Google Scholar] [CrossRef]
  31. Kansky, K.J. Structure of Transportation Networks: Relationships between Network Geometry and Regional Characteristics; The University of Chicago: Chicago, IL, USA, 1963; ISBN 9798834034513. [Google Scholar]
  32. Haggett, P.; Chorley, R.J. Network Analysis in Geography; St. Martin’s Press: New York, NY, USA, 1969. [Google Scholar]
  33. Larsson, A.; Elldér, E. Accessibility Tool for Road and Public Transport Travel Time Analysis in Västra Götaland; COST Action TU 1002 Collect. Access. Instruments Improvement for Their Usability Planning Practice; Technical University of Munich: Munich, Germany, 2014; pp. 1–10. [Google Scholar]
  34. Charalambous, N.; Mavridou, M. Space Syntax: Spatial Integration Accessibility and Angular Segment Analysis by Metric Distance (ASAMeD). In Accessibility Instruments for Planning Practice; COST Office: Brussels, Belgium, 2012; pp. 57–62. [Google Scholar]
  35. Kovač, M.Š.; Pergar, P.; Sitar, M. From Accessibility to the Land Development Potential (ATI). Accessibility Instruments for Planning Practice; COST Office: Brussels, Belgium, 2012. [Google Scholar]
  36. Büttner, B.; Keller, J.; Wulfhorst, G. Erreichbarkeitsatlas Der Europäischen Metropolregion München (EMM). In Accessibility Instruments for Planning Practice; COST Office: Brussels, Belgium, 2012. [Google Scholar]
  37. Zakowska, L.; Starowicz, W.; Pulawska, S. Geographic/Demographic Accessibility of Transport Infrastructure (GDATI). In Accessibility Instruments for Planning Practice; COST Office: Brussels, Belgium, 2012. [Google Scholar]
  38. Papa, E.; Coppola, P. Gravity-Based Accessibility Measures for Integrated Transport-Land Use Planning (GraBAM). Access. Instrum. Plan. Pract. 2012, 117, 124. [Google Scholar]
  39. Arce-Ruiz, R.; Calderón, E.; Condeço-Melhorado, A.; Ortega, E. Isochrone Maps to Facilities. Shopping Centres in the Metrosur Influence Area (IMaFa). In Accessibility Instruments for Planning Practice; COST Office: Brussels, Belgium, 2012. [Google Scholar]
  40. Pensa, S.; Masala, E. InViTo: An Interactive Visualisation Tool to Support Spatial Decision Processes. In Technologies for Urban and Spatial Planning: Virtual Cities and Territories; IGI Global: Hershey, PA, USA, 2014; pp. 135–153. [Google Scholar]
  41. Straatemeier, T. Joint-Accessibility Design (JAD). In Accessibility Instruments for Planning Practice; COST Office: Brussels, Belgium, 2012. [Google Scholar]
  42. Tennøy, A. Method for Arriving at Maximum Recommendable Size of Shopping Centres (MaReSi SC). In Accessibility Instruments for Planning Practice; COST Office: Brussels, Belgium, 2012. [Google Scholar]
  43. Jaensirisak, S.; Jittrapirom, P.; Emberger, G.; Thiengburanathum, P.; Fukuda, T. Metropolitan Activity Relocation Simulator (Mars) Model for Chiang Mai City. In Proceedings of the New Binh Duong City, International Conference on Modeling the Future of Ho Chi Minh City Metropolitan Area (HCMCFuture 2015), Binh Duong New City, Vietnam, 24–25 September 2015; pp. 9–24. [Google Scholar]
  44. Trova, V. Measures of Street Connectivity: Spatialist Lines (MoSC). In Accessibility Instruments for Planning Practice; COST Office: Brussels, Belgium, 2012; pp. 103–109. [Google Scholar]
  45. Ståhle, A.; Marcus, L.; Karlström, A. Place Syntax: Geographic Accessibility with Axial Lines in GIS. In Proceedings of the Fifth International Space Syntax Symposium, Delft, The Netherlands, 13–17 June 2005; Techne Press: Amsterdam, The Netherlands, 2005; pp. 131–144. [Google Scholar]
  46. Gerlach, J. The German Guidelines for Integrated Network Design—Binding Accessibility Standards (RIN). In Accessibility Instruments for Planning Practice; COST Office: Brussels, Belgium, 2012. [Google Scholar]
  47. Silva, C.; Pinho, P. The Structural Accessibility Layer (SAL): Revealing How Urban Structure Constrains Travel Choice. Environ. Plan. A 2010, 42, 2735–2752. [Google Scholar] [CrossRef]
  48. Curtis, C.; Scheurer, J. Planning for Sustainable Accessibility: Developing Tools to Aid Discussion and Decision-Making. Prog. Plan. 2010, 74, 53–106. [Google Scholar] [CrossRef]
  49. Hull, A.; Karou, S. Spatial Network Analysis of Public Transport Accessibility (SNAPTA). In Accessibility Instruments for Planning Practice; COST Office: Brussels, Belgium, 2012. [Google Scholar]
  50. Höemke, M. Social Spatial Influences of New Transport Infrastructure (SoSINeTi). In Accessibility Instruments for Planning Practice; COST Office: Brussels, Belgium, 2012. [Google Scholar]
  51. Verhetsel, A.; Cant, J.; Vanoutrive, T. Retail Cluster Accessibility (TRACE). In Accessibility Instruments for Planning Practice; COST Office: Brussels, Belgium, 2012. [Google Scholar]
  52. Pinto, N.N.; Santos, B. Cellular Automata Modeling for Accessibility Appraisal in Spatial Plans (UrbCA). In Accessibility Instruments for Planning Practice; COST Office: Brussels, Belgium, 2012. [Google Scholar]
  53. Bates, J.; Polak, J.; Jones, P.; Cook, A. The Valuation of Reliability for Personal Travel. Transp. Res. Part E Logist. Transp. Rev. 2001, 37, 191–229. [Google Scholar] [CrossRef]
  54. Tseng, Y.; Rietveld, P.; Verhoef, E. A Meta-Analysis of Valuation of Travel Time Reliability. In Proceedings of the Colloquium Vervoersplanologisch Speurwerk, Antwerpen, Belgium, 24–25 November 2005; Department of Spatial Economics, Vrije Universiteit Amsterdam: Rotterdam, The Netherlands, 2005. [Google Scholar]
  55. Lomax, T.; Margiotta, R. Selecting Travel Reliability Measures; Citeseer: Pennsylvania, PA, USA, 2003. [Google Scholar]
  56. Asakura, Y. Reliability Measures of an Origin and Destination Pair in a Deteriorated Road Network with Variable Flows. In Proceedings of the Transportation Networks: Recent Methodological Advances, Selected Proceedings of the 4th EURO Transportation Meeting Association of European Operational Research Societies, Newcastle, UK, 9 September 1996. [Google Scholar]
  57. Bell, M.G.H.; Iida, Y. Transportation Network Analysis; Wiley (John) & Sons, Limited: Chichester, UK, 1997. [Google Scholar]
  58. Yang, H.; Bell, M.G.H.; Meng, Q. Modeling the Capacity and Level of Service of Urban Transportation Networks. Transp. Res. Part B Methodol. 2000, 34, 255–275. [Google Scholar] [CrossRef]
  59. Wanjek, M.; Hauger, G. Reliability of Travel Time: Challenges Posed by a Multimodal Transport Participation. IOP Conf. Ser. Mater. Sci. Eng. 2017, 245, 42029. [Google Scholar] [CrossRef]
  60. Emam, E.B.; Al-Deek, H. Using Real-Life Dual-Loop Detector Data to Develop New Methodology for Estimating Freeway Travel Time Reliability. Transp. Res. Rec. 2006, 1959, 140–150. [Google Scholar] [CrossRef]
  61. Rakha, H.; El-Shawarby, I.; Arafeh, M. Trip Travel-Time Reliability: Issues and Proposed Solutions. J. Intell. Transp. Syst. 2010, 14, 232–250. [Google Scholar] [CrossRef]
  62. Kumar, P.P.; Parida, M.; Swami, M. Performance Evaluation of Multimodal Transportation Systems. Procedia-Social Behav. Sci. 2013, 104, 795–804. [Google Scholar] [CrossRef]
  63. Chang, J.S. Assessing Travel Time Reliability in Transport Appraisal. J. Transp. Geogr. 2010, 18, 419–425. [Google Scholar] [CrossRef]
  64. Yang, S.; Malik, A.; Wu, Y.-J. Travel Time Reliability Using the Hasofer–Lind–Rackwitz–Fiessler Algorithm and Kernel Density Estimation. Transp. Res. Rec. 2014, 2442, 85–95. [Google Scholar] [CrossRef]
  65. Zhang, Y.-S.; Yao, E.-J. Splitting Travel Time Based on Afc Data: Estimating Walking, Waiting, Transfer, and in-Vehicle Travel Times in Metro System. Discret. Dyn. Nat. Soc. 2015, 2015, 539756. [Google Scholar] [CrossRef]
  66. Woodard, D.; Nogin, G.; Koch, P.; Racz, D.; Goldszmidt, M.; Horvitz, E. Predicting Travel Time Reliability Using Mobile Phone GPS Data. Transp. Res. Part C Emerg. Technol. 2017, 75, 30–44. [Google Scholar] [CrossRef]
  67. Ma, Z.; Ferreira, L.; Mesbah, M. A Framework for the Development of Bus Service Reliability Measures. In Proceedings of the Proceedings of the 36th Australasian Transport Research Forum (ATRF), Brisbane, QLD, Australia, 2–4 October 2013. [Google Scholar]
  68. Kaparias, I.; Bell, M.G.H.; Belzner, H. A New Measure of Travel Time Reliability for In-Vehicle Navigation Systems. J. Intell. Transp. Syst. 2008, 12, 202–211. [Google Scholar] [CrossRef]
  69. Geurs, K.T.; Ritsema van Eck, J.R. RIVM Report 408505006; Accessibility Measures: Review and Applications. Evaluation of Accessibility Impacts of Land-Use Transportation Scenarios, and Related Social and Economic Impact; Universiteit Utrecht-URU: Utrecht, The Netherlands, 2001. [Google Scholar]
  70. Geurs, K.T.; Van Wee, B. Accessibility Evaluation of Land-Use and Transport Strategies: Review and Research Directions. J. Transp. Geogr. 2004, 12, 127–140. [Google Scholar] [CrossRef]
  71. Halden, D. Accessibility Analysis Concepts and Their Application to Transport Policy, Programme and Project Evaluation. In Transport Projects, Programmes and Policies; Routledge: Abingdon, UK, 2017; pp. 227–242. ISBN 1315198541. [Google Scholar]
  72. Curl, A.; Nelson, J.D.; Anable, J. Same Question, Different Answer: A Comparison of GIS-Based Journey Time Accessibility with Self-Reported Measures from the National Travel Survey in England. Comput. Environ. Urban Syst. 2015, 49, 86–97. [Google Scholar] [CrossRef]
  73. Papa, E.; Silva, C.; Te Brömmelstroet, M.; Hull, A. Accessibility Instruments for Planning Practice: A Review of European Experiences. J. Transp. Land Use 2016, 9, 57–75. [Google Scholar] [CrossRef]
  74. Bhatnagar, R.V.; Ram, S. Classifying Indian Railway Passenger Stations Using a Multi-Criteria Framework. Transp. Dev. Econ. 2023, 9, 3. [Google Scholar] [CrossRef]
Figure 1. Model segregation.
Urbansci 07 00048 g001
Figure 2. Accessibility model clusters according to the purpose of accessibility analysis and the nature of the planning issue.
Urbansci 07 00048 g002
Figure 3. Parameter selection.
Urbansci 07 00048 g003
Figure 4. Stage-wise methodology for parameter selection using PCA.
Urbansci 07 00048 g004
Figure 5. Total variance.
Urbansci 07 00048 g005
Figure 6. Station importance vs. RsAI for all the selected stations.
Urbansci 07 00048 g006
Figure 7. RsAI score for all selected stations, where the values are out of 6.
Urbansci 07 00048 g007
Figure 8. Railway station importance vs. RsAI.
Urbansci 07 00048 g008
Table 1. Accessibility models.
CountryAcronymModel—NameReferences
SwedenATRaPTAccessibility Tool for Road and Public Transport Travel Time Analysis[33]
GreeceASAMeDSpace Syntax: Spatial Integration Accessibility and Angular
Segment Analysis by Metric Distance
[34]
SloveniaATIFrom Accessibility to Land Development Potential[35]
DenmarkEMMErreichbarkeitsatlas der Europäischen Metropolregion
Muenchen
[36]
PolandGDATIGeographic/Demographic Accessibility of Transport Infrastructure[37]
ItalyGraBAMGravity-Based Accessibility Measures for Integrated Transport-Land Use Planning[38]
FinlandHIMMELIHeuristic Three-level Instrument Combining Urban Morphology, Mobility, and Service Environment[37]
SpainIMaFaIsochrone Maps to Facilities[39]
ItalyINViToInteractive Visualization Tool[40]
NetherlandsJADJoint-Accessibility Design[41]
NorwayMaReSi SCMethod for Arriving at Maximus Recommendable Size of Shopping Centers[42]
ThailandMARSMetropolitan Activity Relocation Simulator[43]
GreeceMoSCMeasures of Street Connectivity: Spatiality Lines[44]
SwedenPSTPlace Syntax Tool[45]
DenmarkRINGerman Guidelines for Integrated Network Design-Binding
Accessibility Standards
[46]
PortugalSALStructural Accessibility Layer[47]
AustraliaSNAMUTSSpatial Network Analysis for Multimodal Urban Transport Systems[48]
United KingdomSNAPTASpatial Network Analysis of Public Transport Accessibility[49]
SwitzerlandSoSINeTiSocial Spatial Changes because of New Transport Infrastructure[50]
BelgiumTRACERetail Cluster Accessibility[51]
PortugalUrbCACellular Automata Modelling for Accessibility Appraisal in Spatial Plans[52]
Table 2. Railway station data for various parameters.
StationsRailway Station CategoryCloseness CentralityBetweenness CentralityDegree CentralityService IntensityContour CatchmentPTI
Anand Vihar174.6967.63229.835406.335.15
Nizamuddin1102.8967.06113.861405.856.11
Old Delhi1112.1745.897.7274076.57
New Delhi184.6541.8998.5214078.57
Lucknow121.6436.2941.6679.715.94.27
Ludhiana279.9382.9981.498254.253.17
Amritsar269.4872.7460.564214.753.02
Ambala272.261.8542.729203.52.15
Ghaziabad223.123.3130.125.783.754.08
Sarai Rohilla226.0415.5931.691404.756.81
Varanasi240.8329.6637.349273.94.74
Jalandhar366.8170.5654.828254.783.01
Patiala356.8116.0690.71203.53.14
Chandigarh334.7529.3638.5323.654.65
Saharanpur349.4843.2748.49702.93.99
Moradabad326.7625.1130.65803.254.15
Bathinda339.3622.8239.70203.856.72
Jammu Tawi320.4914.7522.0404.254.91
Panipat318.511.7526.32903.357.47
Bareilly311.399.5625.90703.654.95
Haridwar3151416.72203.353.99
Faridabad44023.07117.647113.57.15
Kurukshetra446.2456.4242.57503.22.43
Karnal449.4853.5932.30202.852.39
Dehradun432.4822.2257.471173.14.91
Sonipat431.4441.0934.1303.23.13
Meerut419.0519.6842.55382.83.39
Gurgaon418.8715.9821.277253.44.65
Rohtak429.7825.1663.65403.494.56
Roorkee421.6522.8721.09602.753.45
Meerut Cantt422.8515.2122.65283.25.51
Amethi415.514.3128.3402.853.43
Hapur416.2611.8513.02102.854.11
Hardoi412.859.819.17402.94.11
Rampur418.2817.0216.3103.153.42
Muzaffarnagar424.7923.9622.57803.353.41
Raebareli424.0421.9519.70403.23.45
Table 3. Normalized railway station data.
StationsRailway Station CategoryCloseness CentralityBetweenness CentralityDegree CentralityService IntensityContour CatchmentPTI
Anand Vihar10.910.9110.90.980.25
Nizamuddin10.990.910.940.90.960.14
Old Delhi110.670.880.9910.11
New Delhi10.960.610.880.9410.05
Lucknow10.240.520.430.760.960.43
Ludhiana20.940.980.780.350.620.79
Amritsar20.870.940.610.350.770.85
Ambala20.890.860.440.320.361
Ghaziabad20.260.320.320.590.440.48
Sarai Rohilla20.30.210.330.850.770.1
Varanasi20.520.410.390.450.50.32
Jalandhar30.850.930.550.350.780.85
Patiala30.7410.8400.360.81
Chandigarh30.420.410.40.650.410.33
Saharanpur30.650.630.4900.190.51
Moradabad30.310.340.3300.280.46
Bathinda30.490.310.4100.480.11
Jammu Tawi30.230.20.2500.620.29
Panipat30.210.170.2900.310.08
Bareilly30.140.150.2800.410.28
Haridwar30.170.190.2100.310.51
Faridabad40.50.310.950.80.360.09
Kurukshetra40.60.810.4400.260.98
Karnal40.650.780.3400.170.98
Dehradun40.390.30.580.690.240.29
Sonipat40.370.60.3600.260.81
Meerut40.210.260.430.690.160.71
Gurgaon40.210.220.250.80.330.34
Rohtak40.350.340.6400.350.36
Roorkee40.240.310.2500.170.69
Meerut Cantt40.260.210.260.690.260.2
Amethi40.180.20.3100.170.7
Hapur40.180.170.1900.170.47
Hardoi40.150.150.1600.190.47
Rampur40.20.230.2100.250.7
Muzaffarnagar40.280.330.2600.310.71
Raebareli40.270.30.2400.260.69
Table 4. Final external RsAI.
N.R—Selected StationsRailway Station CategoryRailway Station Accessibility—Value out of 6Station ImportanceRsAI
Anand Vihar14.950.540.82
Nizamuddin14.840.540.81
Old Delhi14.650.730.78
New Delhi14.440.830.74
Lucknow13.330.550.56
Ludhiana24.460.440.74
Amritsar24.390.40.73
Ambala23.870.530.64
Varanasi22.410.460.43
Sarai Rohilla22.570.430.43
Ghaziabad22.580.450.4
Jalandhar34.310.360.72
Patiala33.750.370.62
Chandigarh32.620.360.44
Saharanpur32.460.390.41
Bathinda31.710.350.3
Moradabad31.790.420.29
Jammu Tawi31.590.350.26
Haridwar31.050.360.23
Bareilly31.260.340.21
Panipat31.40.340.18
Kurukshetra43.010.310.51
Faridabad43.090.270.5
Karnal42.920.290.49
Dehradun42.480.250.41
Meerut42.40.330.41
Sonipat42.480.30.4
Gurgaon42.140.290.36
Roorkee42.040.270.35
Rohtak42.110.330.34
Muzaffarnagar41.880.290.31
Meerut Cantt41.550.220.31
Raebareli41.190.290.29
Rampur41.120.250.27
Amethi41.60.230.26
Hapur41.880.30.2
Hardoi41.760.30.19
Table 5. Pearson correlation test.
Correlations
RsAIStation Importance
RsAIPearson Correlation10.721
Sig. (2-tailed) 0.000
N3737
Station ImportancePearson Correlation0.721 1
Sig. (2-tailed)0.000
N3737
Table 6. Category-wise variation with RsAI.
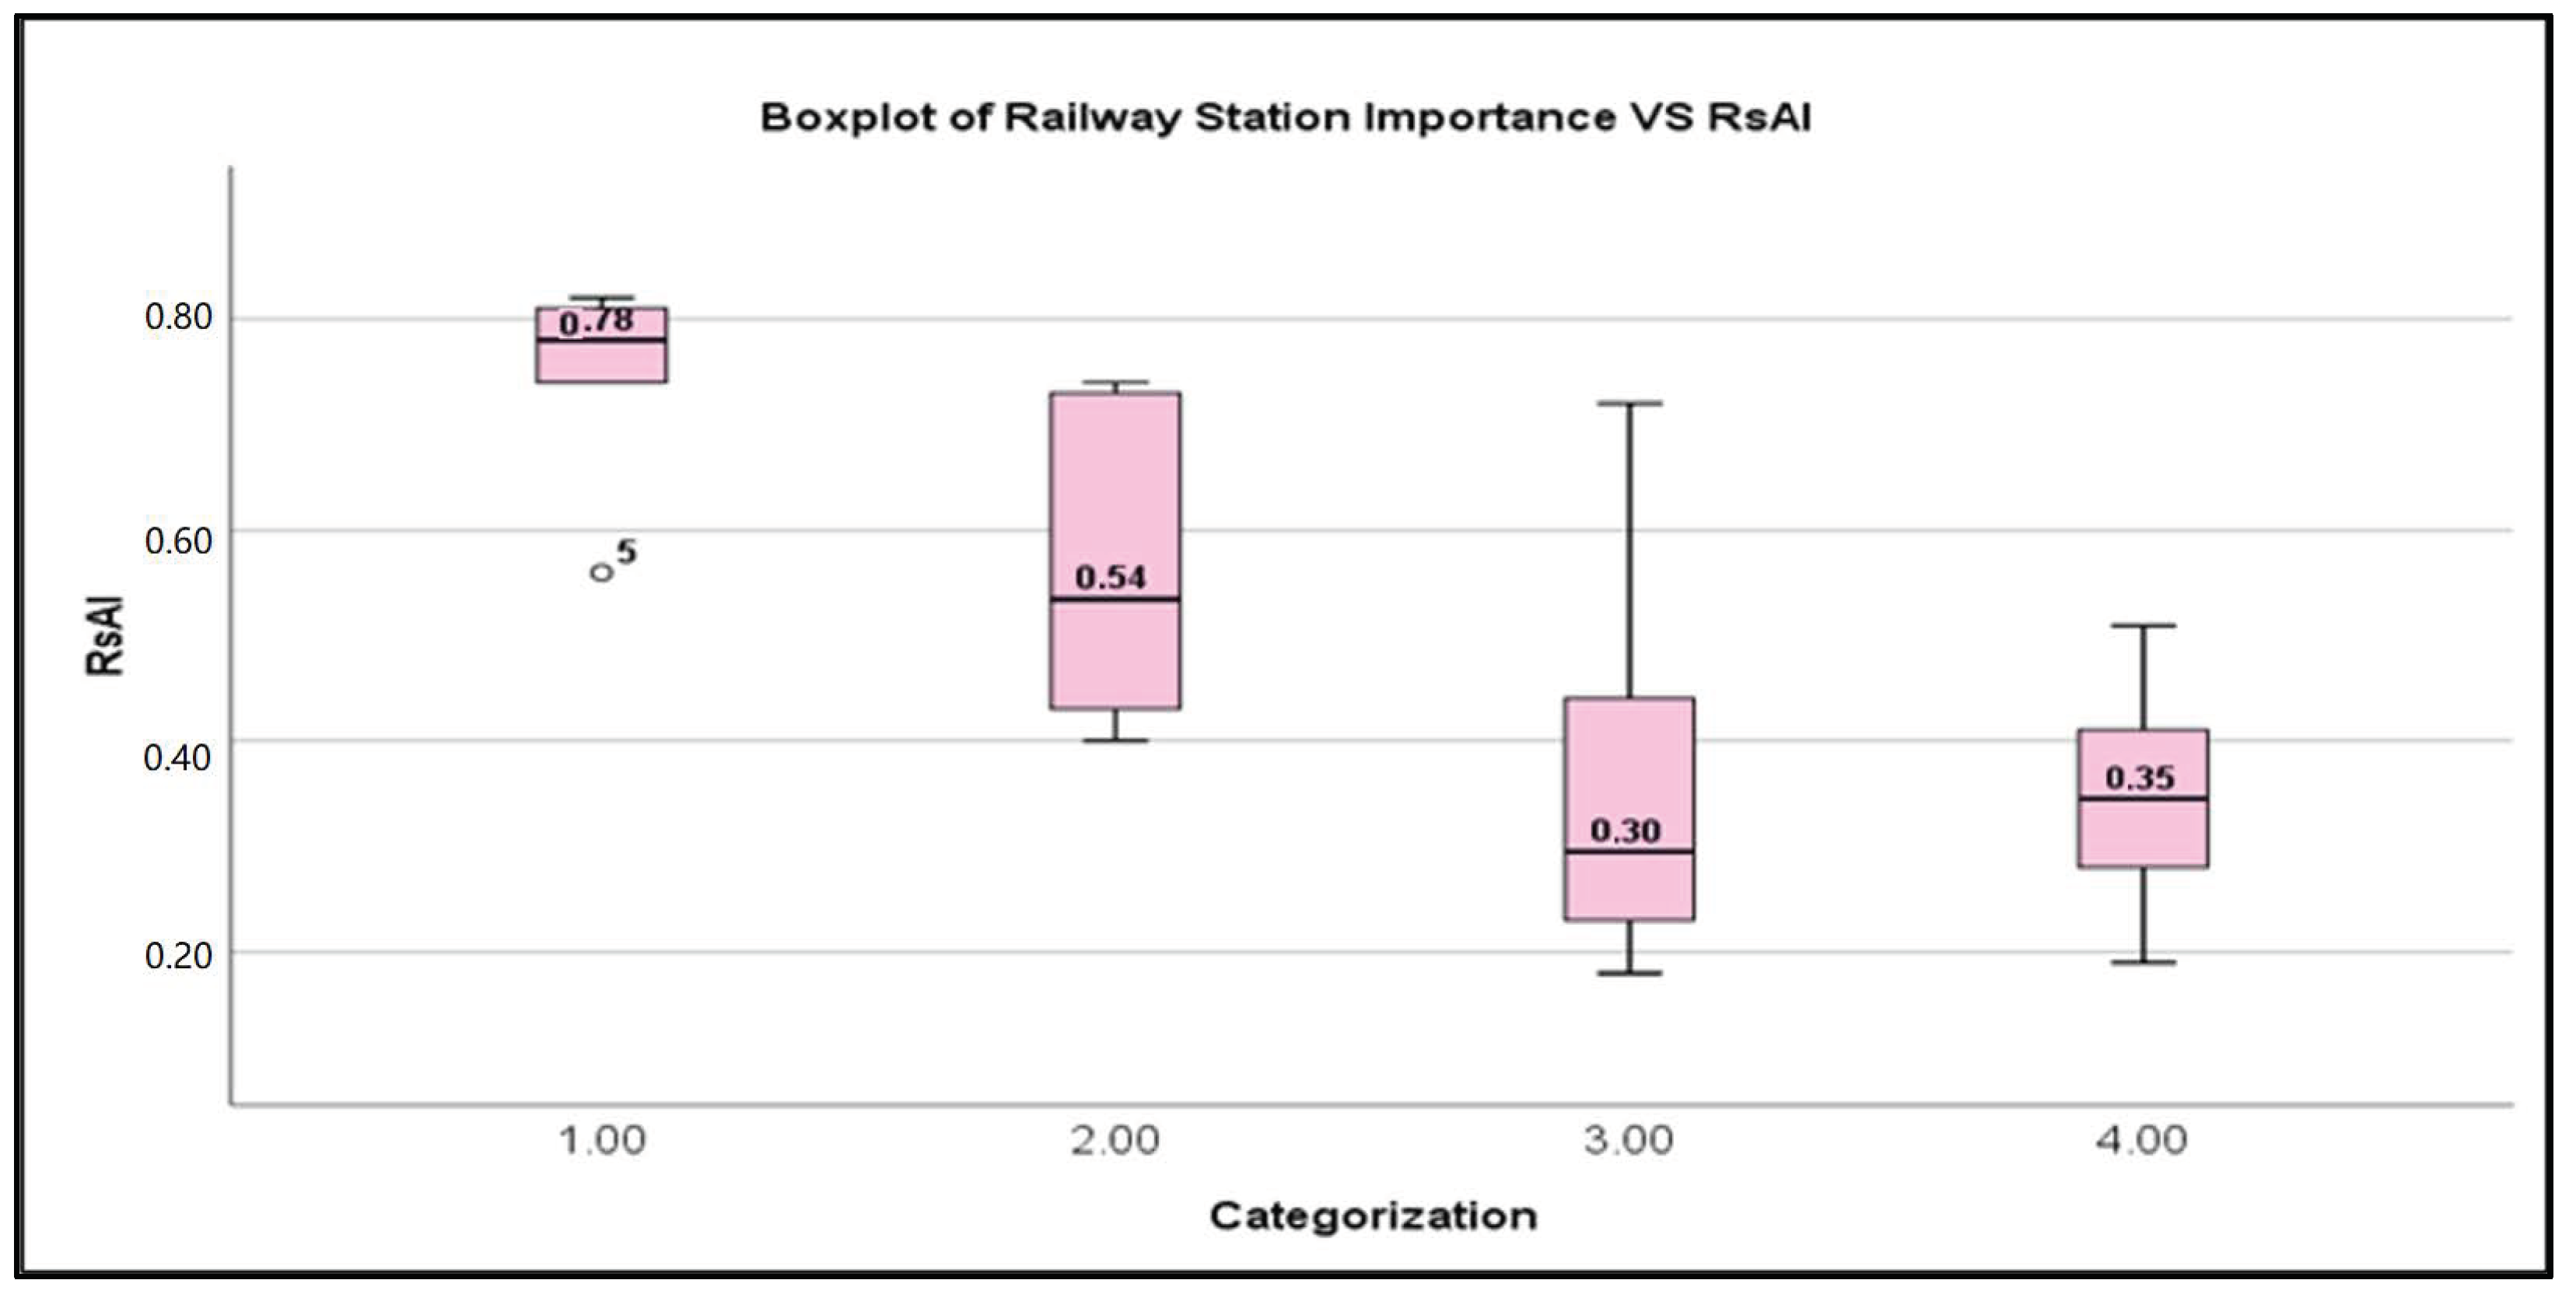
Category-Wise Variation with RsAI
MinimumLower QuartileMedianUpper QuartileMaximumIQRVariation
Category 10.560.740.780.810.820.070.26
Category 20.40.430.540.710.740.280.34
Category 30.180.240.300.430.720.200.54
Category 40.190.290.350.410.510.130.32
Disclaimer/Publisher’s Note: The statements, opinions and data contained in all publications are solely those of the individual author(s) and contributor(s) and not of MDPI and/or the editor(s). MDPI and/or the editor(s) disclaim responsibility for any injury to people or property resulting from any ideas, methods, instructions or products referred to in the content.

