1. Introduction
Walking is the most ancient and the easiest mode of travel. However, in the last century, little importance has been given to walking, favoring motorized forms of travel and the use of private vehicles. More recently, however, there has been a trend reversal. The problems related to air pollution caused by vehicular traffic are leading to a new concept of mobility aimed at environmental sustainability.
With a view to achieving sustainable mobility, walking in the urban environment can be considered as the mode of movement with zero carbon footprint. In addition, walking has other positive impacts on individuals with regards to health and sociability [
1]. However, if pedestrians are not in a suitable environment, they could decide to use another mode of transport for their trips. Therefore, a walkable urban environment is necessary to achieve sustainable urban mobility [
2].
To develop a walkable urban environment, it is crucial to understand the attitudes and perceptions of the pedestrians regarding walking and the urban environment [
3]. Considering only the physical characteristics of pedestrian infrastructure could lead to a superficial analysis of walking. Therefore, some other aspects concerning the environmental context and the services offered by the paths should be taken into account.
The first studies about pedestrian mobility appeared in the 1970s, with the definition of the pedestrian level of service (PLOS), which included the flow and geometric characteristics of the pedestrian path [
4]. Over the years, there were several attempts to introduce some other characteristics into the analyses. As an example, the work of Talavera-Garcia and Soria-Lara [
5] provides a literature review in which a classification of the pedestrian factors according to four categories of walking needs is reported. The four categories are as follows: accessibility, security, comfort, and attractiveness. Another classification is proposed by Singh [
6]. These most recent studies, which introduced several attributes characterizing pedestrian paths, based the analyses on the collection of pedestrian perceptions in terms of ratings expressed according to different evaluation scales. Other examples are the work by Choi et al. [
7], Kang and Fricker [
8], Bivina and Parida [
9], and Vallejo-Borda et al. [
10,
11]. The main objective of these studies was the identification of the factors that mostly influence pedestrians’ satisfaction with the walked paths, with the final aim to identify the better strategies to improve the pedestrian environment and increase pedestrian mobility. As an example, Choi et al. [
7] conducted a study to examine the characteristics of human-centered design and pedestrians’ perceptions of street design features, in order to find empirical evidence that a human-centered design increases pedestrian satisfaction levels; an ordered logistic regression analysis was adopted as a tool for analyzing data. Kang and Fricker [
8] investigated pedestrian attitudes regarding sharing sidewalks with bicycles under different sidewalk configurations through a random parameters ordered probability model, while Bivina and Parida [
9] adopted a structural equation modelling (SEM) approach to analyze pedestrian satisfaction and qualitative PLOS of sidewalks. Finally, the studies by Vallejo-Borda et al. [
10,
11] are the studies that inspired our research. They proposed a structured questionnaire designed for investigating several aspects evaluated through levels of comfort, as well as aspects representing elements of nuisance or elements of protection along the path. More specifically, they proposed an ordered probit multiple indicator and multiple cause (MIMIC) model [
10] and an SEM approach [
11]. Like all of these above-mentioned studies, our paper aims to provide useful and valuable information to planners and experts to discover the walkway characteristics that are more relevant for the pedestrians. In this perspective, the proposed research can help to plan new strategies and future interventions to improve the pedestrian environment.
The above-mentioned studies refer to the urban environment. The path considered as a case study in our work is located in a university campus. Even if the context could seem particular and not very representative, in the literature, there are many studies on pedestrian mobility in university campuses. As an example, Attard et al. [
12] propose a study aimed to assess the walkability and bikeability around a campus in Malta, with the final aim of promoting active travel in the vicinity of the university. This study refers to the mobility to and from the place of study, while our work analyzes the mobility within the campus. On the other hand, the study by Kellstedt et al. [
13] focuses on the bikeability on and around the campus, but they do not investigate pedestrian mobility, like our study. The study by Sgarra et al. [
14] analyzes the case of the Sapienza university; the final aim of the study is to develop and implement an action plan for mobility in order to control and optimize flows and develop strategies for the creation of sustainable spaces.
Our study provides a contribution to the literature concerning two main aspects: (1) the proposal of a novel method (Chi-square test combined with an ordered logit (OL)) against baseline alternatives and (2) the introduction of the pleasantness of the path as the dependent variable, which is traditionally the overall quality of the path.
Firstly, the above-mentioned studies applied models similar to the proposed one, but different from the other studies we preliminary wanted to investigate on the independency between the variables, in order to identify the variables to be included in the OL model. We retain that it is an important step of the methodology that could improve the validity of the model. Secondly, unlike the cited studies, the present work does not focus specifically on the quality of the pedestrian path and on the identification of aspects mostly influencing pedestrians’ satisfaction, but the particular aim of the paper is identifying the factors that make pleasant a pedestrian path. In other words, we focus on the pleasantness of the pedestrian environment rather than their quality level in terms of satisfaction; we want to verify which aspects make pleasant a walkway and make it pleasurable for pedestrians to walk, as opposed to the aspects that satisfy pedestrians. We certainly want to explore a different perception that people can feel while walking, that is, the sense of pleasantness. This is surely an innovative element in the literature of the sector. To achieve this, pedestrians’ perceptions about a specific pedestrian path were collected through a survey. The chosen pedestrian path is the main path located within the Campus of the University of Calabria. This path connects all the university structures to the parking lots and public transport stops. As a result, pedestrians are forced to take this path to reach their destinations, regardless of the characteristics of the path.
The proposed methodology is divided into two steps. The first step consists of applying the Chi-square test for evaluating the independence between the factors related to the pedestrian path and the condition of the pleasantness of the path. Then, the factors for which the condition of independence is not verified are included as variables in an OL model to evaluate to what extent the variables contribute to determining a pleasant pedestrian path.
The rest of the paper is organized as follows. In
Section 2, the case study and the methodology are presented.
Section 3 describes the results, which are then discussed in
Section 4. Finally,
Section 5 presents the concluding remarks.
2. Materials and Methods
2.1. Case Study
The study was carried out starting from the perceptions of users collected along a pedestrian path located within the University Campus in the city of Rende (Italy).
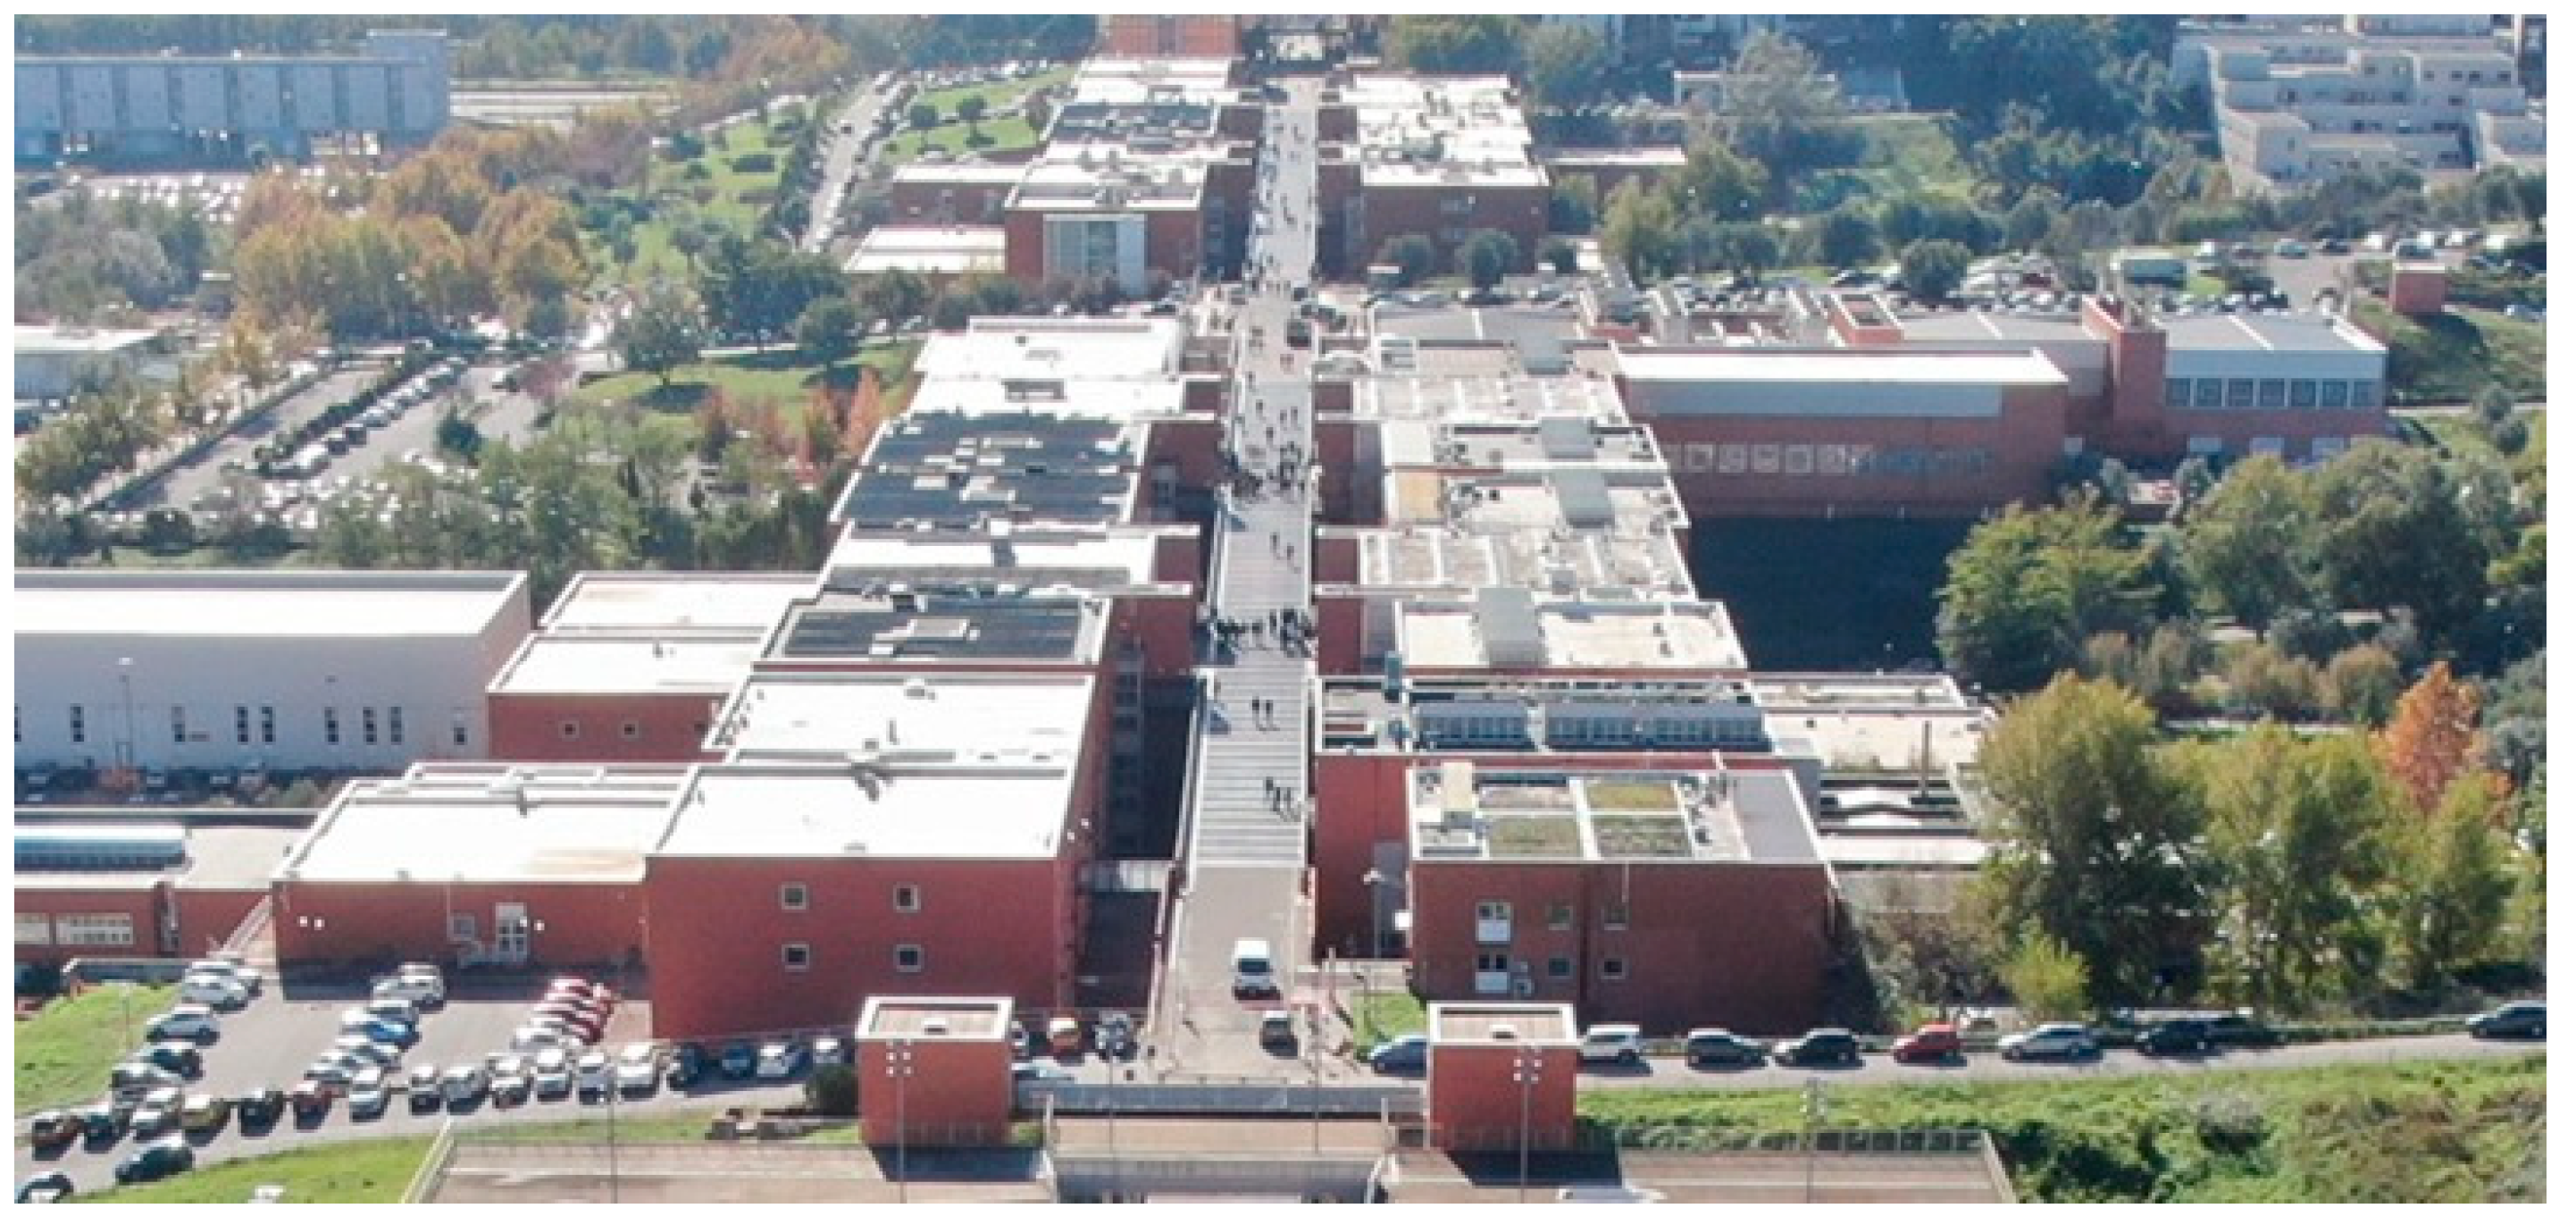
The campus is located in a hilly area not far from the urban center of Rende. Inside, there are administrative buildings, university classrooms, libraries, student residences, canteens, a theater, and several parking areas. The University of Calabria has a particular conformation. The buildings were built on a hilly terrain and have different levels. To overcome the differences in level, a linear structure was created, known as “Pietro Bucci bridge”, which connects the buildings at the penultimate floor level (
Figure 1).
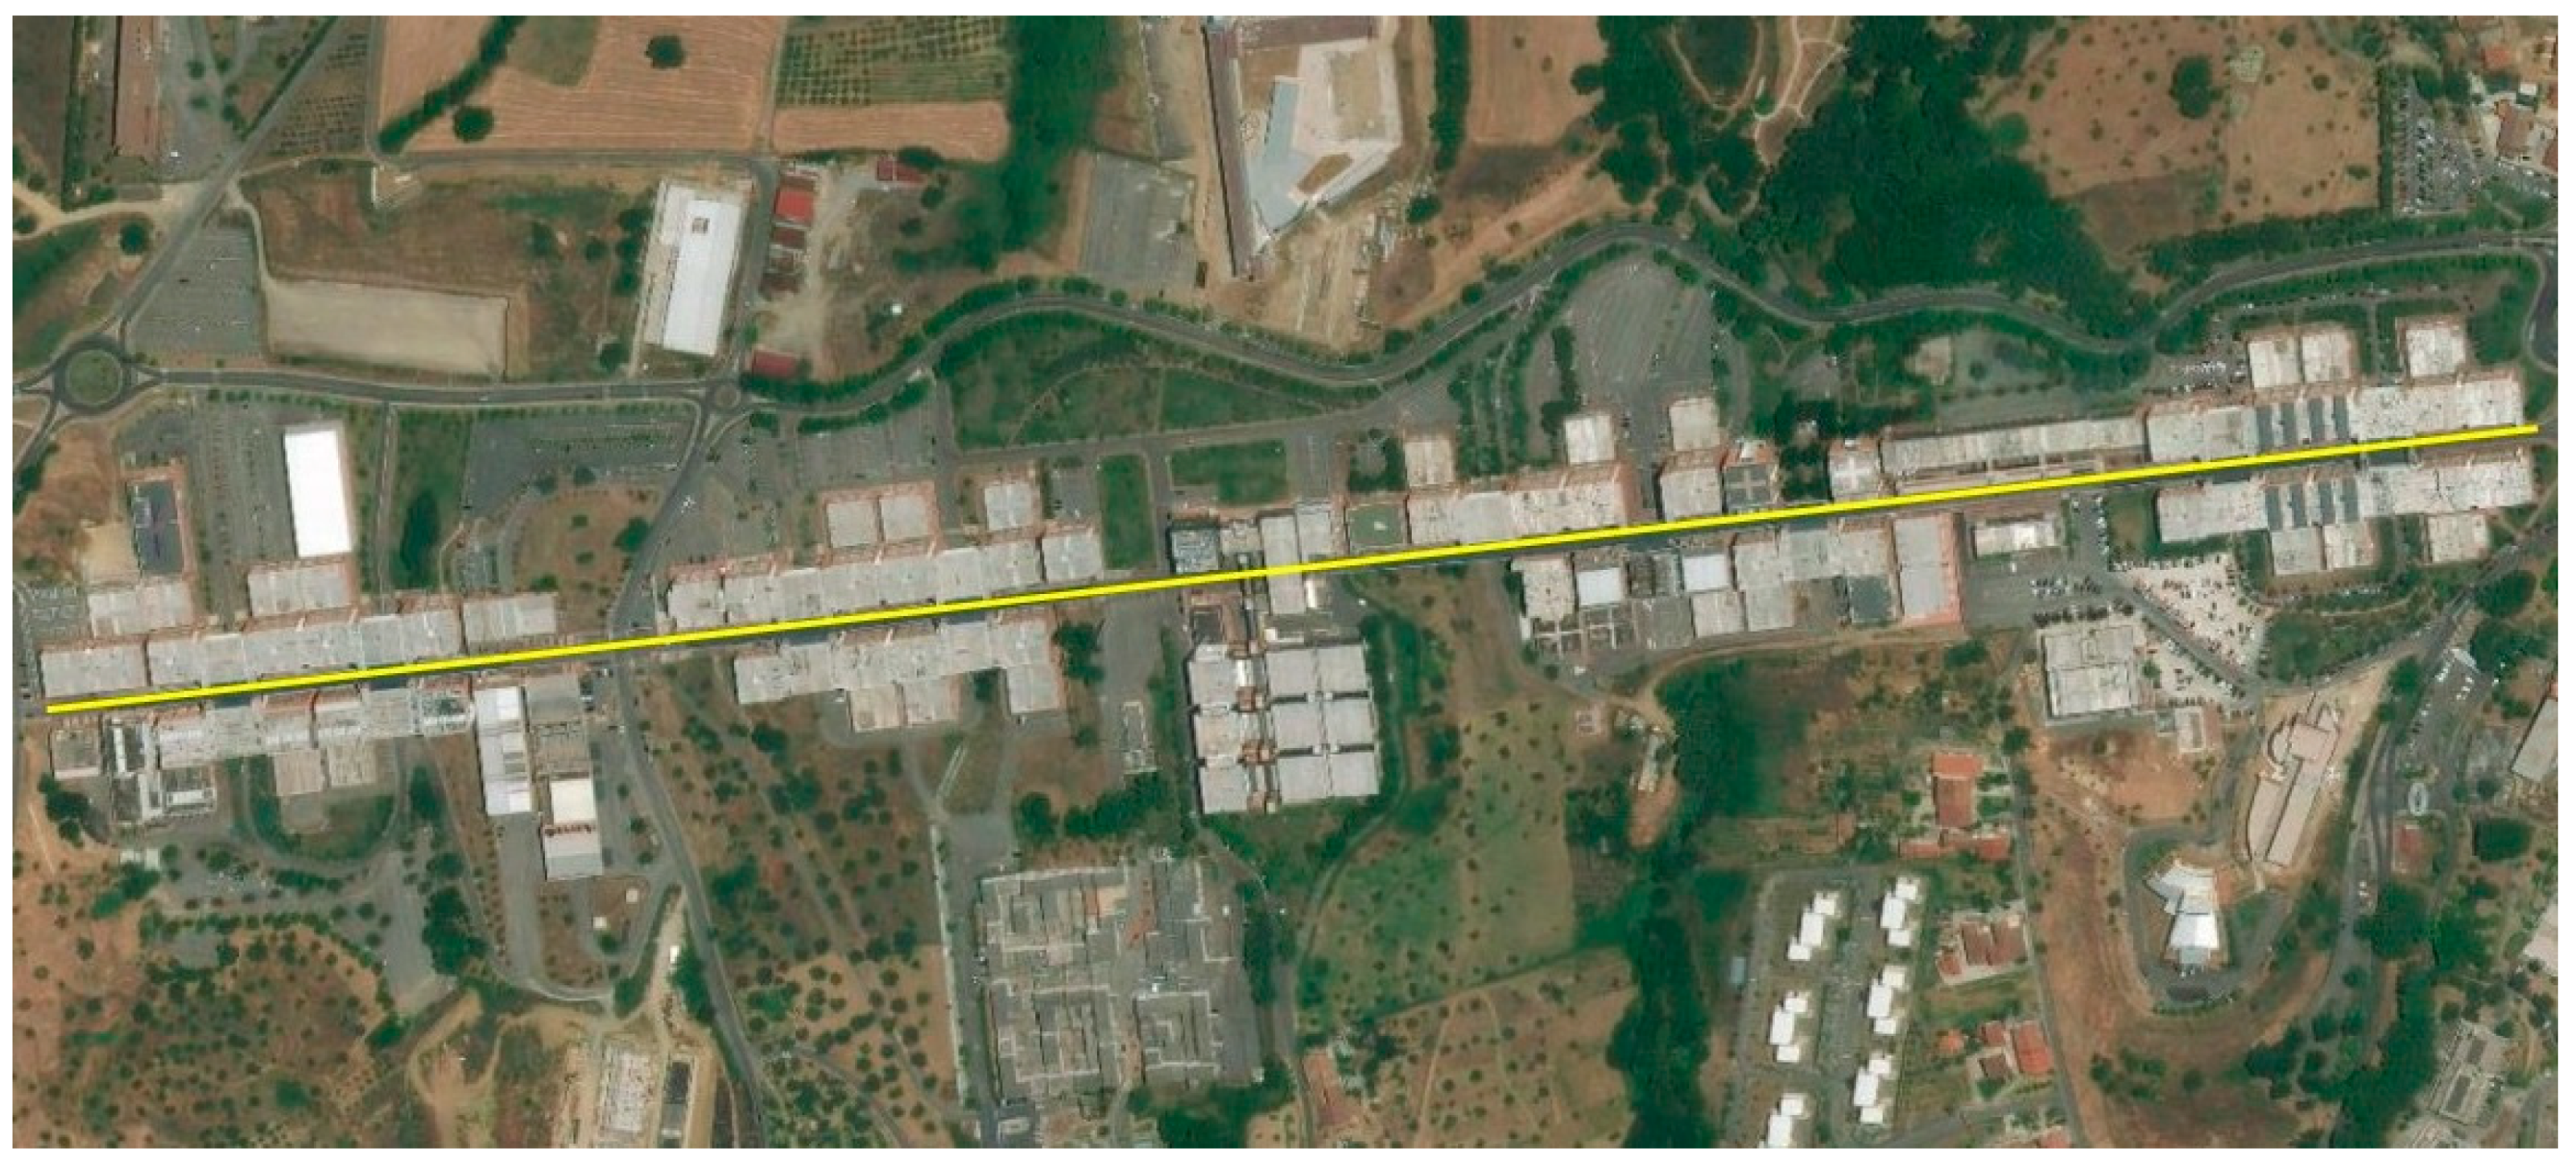
Classrooms and departments are located parallel to the Pietro Bucci bridge, which represents the connection between all of the buildings; it is approximately 1500 m long (
Figure 2). It consists of reinforced concrete structures and includes a shared-use lane for pedestrians, vehicles, and bicycles. The various paths interconnected to the bridge lead to the campus facilities.
The bridge is the main pedestrian path inside the campus and one has to use it to reach the university facilities.
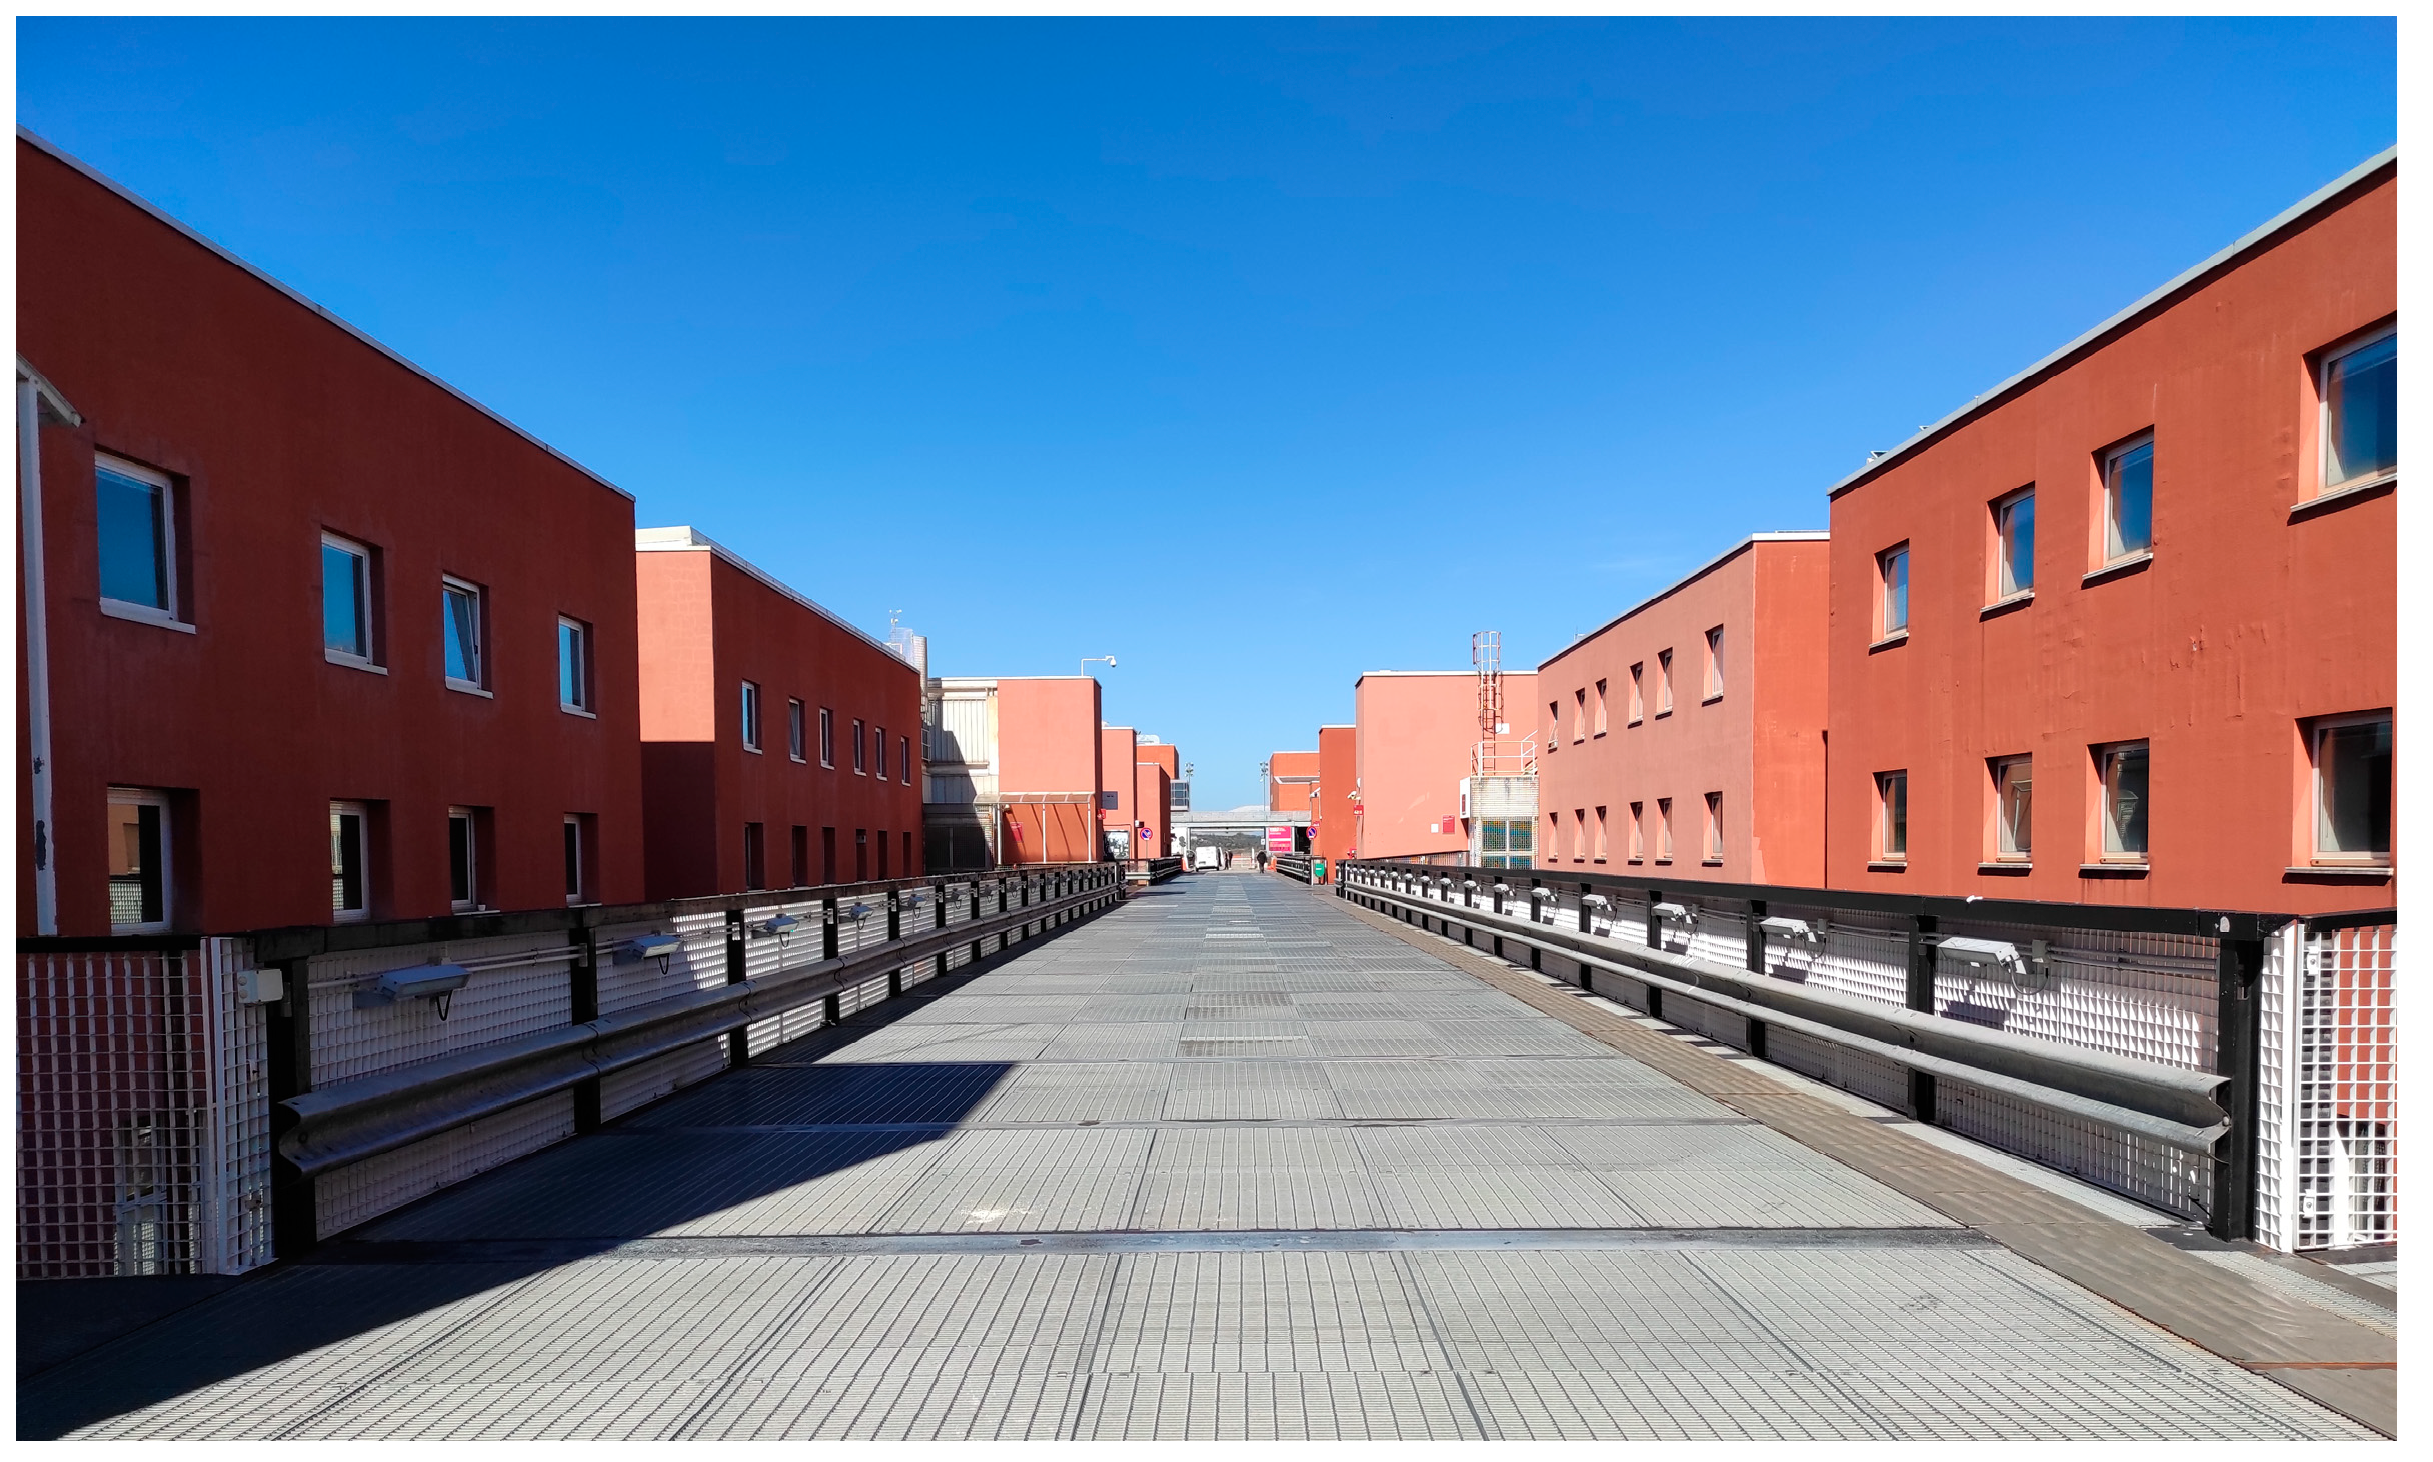
From a constructive point of view, the bridge has a few characteristics that can be considered as peculiar of a pedestrian path. Specifically, the walking surface was realized using a metal grid and the path is not equipped with benches and other facilities (
Figure 3).
2.2. Survey
The survey was conducted in November and December 2019. A total of 477 people were stopped to be interviewed; 261 of them agreed to answer the questionnaire, with an acceptance rate of 55%. The interviews were conducted face-to-face along Pietro Bucci bridge, in the respect of the ethics guidelines of the University of Calabria to guarantee protection of anonymity and confidentiality. The sample is almost totally composed of students (99%) under 25 years and is spread equally between males (51%) and females (49%). About 87% of the sample participants walk along this pedestrian path at least once a day.
Our work and specifically the adopted questionnaire was inspired by recent studies proposed by Vallejo-Borda et al. [
10,
11], who analyzed pedestrians’ perceptions about pedestrian path characteristics. Specifically, the questionnaire is composed of 65 questions and is structured in different sections. In addition to information about the socio-economic characteristics of the interviewee, the general perceptions of the whole path and the perceptions at a specific point of the path were requested. Firstly, the overall satisfaction about the pedestrian path was investigated using an 11-point Likert scale ranging from 0 (totally unsatisfied) to 10 (totally satisfied). The successive questions concerned the comfort level regarding some aspects (section A and E), the degree of nuisance due to the presence of certain elements (sections B and C), the degree of protection towards certain aspects (section F), and other path characteristics (section G). The comfort level was evaluated according to a scale from 0 (totally uncomfortable) to 10 (totally comfortable), while the degree of nuisance was evaluated by a scale from 0 (absence of nuisance) to 10 (high degree of nuisance). The degree of protection of the path was assessed using an 11-point Likert scale ranging from 0 (absence of protection) to 10 (high degree of protection).
In another section (section D), the interviewees were asked to associate the agreement value with a series of statements regarding the perception of comfort or discomfort. The rating scale is an 11-point Likert scale ranging from 0 (totally disagree) to 10 (totally agree).
The last group of questions requires to evaluate some aspects of the path on an 11-level Likert scale, where 0 corresponds to very bad and 10 to excellent (section G).
2.3. Methodology
To identify the factors that make a pedestrian path pleasant, a two-step methodology is proposed.
The first step consists of the application of Chi-square test to verify the independence between the variables. The second step involves the development of an ordered logit (OL) model to evaluate to what extent the variables contribute to determining a pleasant pedestrian path. The OL model is not developed to determine the probabilities of the categories of the dependent variable, but only to identify which variables are perceived by users as pleasant aspects of the pedestrian path.
In the Chi-square test for independence between two categorical variables X and Y, the null hypothesis H0 to be rejected and the alternative hypothesis H1 are as follows:
H0: X and Y are independent (there are no relationships between the two variables);
H1: X and Y are dependent (there is a relationship between the two variables).
The Chi-square test is based on the following formula:
where
f0 is the observed frequency and
fe is the expected frequency.
The decision rule consists of rejecting H0 if the observed value of the Chi-square statistic is greater than the critical value χ2U of the distribution χ2 with (r − 1) × (c − 1) degrees of freedom, with r and c being the number of categories of each variable.
In this study, X variables are all the questions of the survey, with the exception of those in the D group. Y variable corresponds to question D-10 (Walking on this pedestrian path is pleasant).
The ordered logit (OL) model is an extension of the logistic regression applied when the dependent variable
Y is categorical and has a meaningful order with more than two categories (or levels). The ordinal variable
Y is a function of another variable
Y* that is continuous and not measured and has various threshold points. The value
Yi of the observed variable depends on whether or not it crossed a particular threshold, as shown by the following formulas:
The continuous latent variable
Y* is equal to the following:
where
εi is a random disturbance term that is normally distributed, which reflects the fact that the variables may not be perfectly measured, and some relevant variables may be not introduced in the equation. The vector of
β parameters is estimated by the maximum likelihood method [
15]. The goodness-of-fit of the OL model is verified by the likelihood ratio (LR), which is the difference between the values −2log
l for the model to test and for the most complex model possible. If the model is valid, the statistic has approximately the Chi-squared distribution [
16].
In the proposed model, the independent variables are the factors for which there are statistically significant differences between the means, while the dependent variable is the pleasantness of the pedestrian path (question D-10), as specified above. The calibration of the models was effected by Stata statistical software through the
ologit procedure [
17].
3. Results
3.1. Preliminary Descriptive Statistics Results
The preliminary descriptive statistics (
Table 1) show that young pedestrians are overall quite satisfied with the pedestrian path. Walking with other pedestrians is well evaluated, whereas the presence of toilets, shaded areas, and street vendors have negative average scores. The degree of nuisance with respect to various aspects is low, also because the pedestrian path is wide enough and pedestrians do not perceive a nuisance due to traffic or pollution or noise, because they are not in the proximity of vehicular traffic. From the analysis of the average marks relating to section D, it appears that the pedestrian path is positively evaluated by users. In particular, concerning the statements that the path is comfortable and pleasant, we can observe that users agree with these concepts. The level of comfort relating to the various aspects of the environment surrounding the route was rated close to sufficient on average. On the contrary, the level of protection was rated on average as low values, especially concerning protection from theft and robbery, weather, and stray animals. Indeed, the walkway does not provide protection from meteorological phenomena, and there are often stray dogs around. Regarding some aspects at a specific point of the path, the width and continuity are the aspects most appreciated by users, while equipment and tree planting are those that registered the lowest average scores.
3.2. Chi-Square Test Results
The aim of the Chi-square test is to compare the responses regarding the pleasantness of the path to the responses given to the other questions of the survey, as well as to identify the factors that show a statistically significant dependence on the peasantness of the path.
Table 2 reports the results. According to the
p-values, we selected the variables that show a dependence on the pleasantness of the path (
Table 2).
Among the variables related to the level of comfort perceived on the whole path, the attribute expressing comfort due to the presence of pedestrians, toilets, and shops shows dependence on statement D-10 (Walking on this pedestrian path is pleasant). Nuisance of objects obstructing the pedestrian passage and of traffic volume are the only conditions of nuisance that are not independent from D-10. All of the variables included in section E show dependence on the pleasantness of the pedestrian path. The hypothesis of independence is not verified for degree of protection from theft or robbery and accidents involving vehicles either. The condition of a pleasant pedestrian path also has dependence on aspects of the path such as width, continuity, condition of the walking surface, equipment, tree planting, facade architecture, and access to public transport.
3.3. OL Model Results
The ordered logit model was performed through the ologit procedure of Stata statistical software. The dependent variable Y is variable D-10 (Walking on this pedestrian path is pleasant). This variable can assume values from 0 to 10. The independent variables are the factors that show a statistically significant dependence on the peasantness of the path. In order to elaborate the model, these variables were reclassified and can assume the values 0 and 1. The value 0 corresponds to the scores from 0 to 5, while the value 1 corresponds to those from 6 to 10. The choice of this classification was made considering the value 6 as a passing grade.
More attempts were made before arriving at the final model proposed in this work, in which only six variables are involved (
Table 3).
The baseline category, or “reference case”, is represented by the variable when it takes the value 0. As a consequence of the choice of the reference case, the coefficients (β) of the variables regarding comfort, protection, and evaluation have positive signs, whereas the variable regarding level of nuisance has a negative sign. The negative sign means that the path is less pleasant when the level of nuisance assumes higher values. The statistics of the goodness of fit of all of the models are adequate (LR(6) = 85.24; p-value = 0.000).
Some considerations can be made on the coefficients of the variables. G-6 seems to have the greatest impact on the dependent variable. This means that the presence of buildings with decent facades increases the perception of a pleasant path among pedestrians. The odds calculated for G-6 (e0.2346 = 1.26) indicates that the probability of having higher values for the dependent variable increases by just over a quarter when the score of facade architecture is more than sufficient (value 1). Similar considerations can be made for variable G-2. Continuity of the pedestrian path represents another factor that increases the perception of a pleasant path. When the variable assumes the value 1, the probability of having higher values of pleasantness increases by about a quarter (e0.1984 = 1.22). The variables A-1, E-1, and F-1 contribute positively to the perception of the pleasantness of the route, meaning that comfort due to the presence of other pedestrians, comfort linked to temperature, and protection from theft or robbery represent factors that increase the perception of a pleasant path. Even these variables, when they assume the value 1, produce probabilities of having higher values than the dependent variable (the odds calculated for the variables are as follows: e0.0750 = 1.08; e0.1185 = 1.13; e0.1392 = 1.15). However, the effect of these variables is not very relevant because there is little difference between the effects produced by the variables when they assume the values 0 and 1.
As expected, C-3 is the only variable that has a coefficient with a negative sign, representing a nuisance element. More specifically, when the degree of nuisance perceived for traffic volume assumes the value 1, it produces an increase in the probability of having lower values of the dependent variable. However, the effect is not significant; there is little difference between the values 0 and 1 assumed by the variable, because the odds are e−0.0762 = 0.93.
4. Discussion
Interesting considerations can be made from both of the analyses proposed in the work. Specifically, through the Chi-square test, we verified the independence between the variables and, consequently, it was possible to establish which the aspects show dependence on the pleasantness of the path, which is our crucial variable. Many of the aspects that present a certain dependence on the path pleasantness are aspects that objectively make a place pleasant, such as the presence of shops, landscape, tree planting, facade architecture, lighting, cleanliness, odor, and temperature. Other aspects, on the other hand, would seem less linked to the concept of pleasantness, such as aspects more related to the geometric and functional characteristics of the path (e.g., width and continuity of the pedestrian path, walking surface, access to public transport, presence of pedestrians or traffic volume, toilets, and equipment). However, the observed dependency suggests that more functional aspects can also provide to pedestrians a sense of pleasantness while walking, because they can feel at ease and thus feel pleasure. On the other hand, the aspects concerning the protection from some events, such as theft or robbery and road accidents, also show a certain dependence on the pleasantness of the path, meaning that feeling more secure can help to feel pleasure while walking. Finally, the presence of objects obstructing the pedestrian passage also presents a dependence on the pleasantness of the path.
In addition, through the proposal of the ordered logit (OL) model, it was possible to evaluate to what extent some variables contribute to determining a pleasant pedestrian path. The main findings suggest that the presence of buildings with good facades and the continuity of the pedestrian path have the greatest impact on path pleasantness and, successively, comfort due to the presence of other pedestrians, comfort in terms of temperature, protection from theft or robbery, and degree of nuisance perceived from traffic volume.
Although our study investigated the pleasantness of the path instead of overall satisfaction or quality of the path, similar evidence from other literature studies can be highlighted. As an example, concerning the aspect linked to the presence of planting along the path, the study by Choi et al. [
7] showed that pedestrians perceived planting strips as the most important design element that would increase the satisfaction scores; similarly, we discovered a dependency between the presence of tree planting and the pleasantness of the path. A similar finding is also reported in [
5]. The study by Choi et al. [
7] also suggests that access to public transport has an impact on a sidewalk satisfaction. This same aspect is among the attributes discovered as having a certain dependence on the pleasantness of the path. Similar findings are reported in [
10,
11].
Moreover, the study by Bivina and Parida [
9] shows similarities to our work. More specifically, they identified parameters such as street lighting, cleaner sidewalks, sidewalk obstructions, sidewalk surface, and traffic volume as having an evident impact on the quality of the sidewalk. These same parameters are aspects discovered as influencing pedestrians’ perception of pleasantness while walking through the Chi-square test. Bivina and Parida [
9] also verified that pedestrians are particularly concerned with security against crime or theft while walking. We also discovered this aspect as influencing path pleasantness.
As we verified a dependency between an equipped pedestrian path and a pleasant path, Motamed and Bitaraf [
18] discovered that the presence of good furniture improves pedestrians’ pleasure when walking.
5. Conclusions
This paper analyzed pedestrian environments based on the perceptions of young pedestrians (i.e., university students) that use a specific path for reaching various destinations for their activities. More specifically, the paper aimed to investigate the influence of several characteristics of the path on an overall feature of the path, which is its pleasantness. In other words, through the proposed analysis, we want to provide a useful tool for discovering which aspects influence the sense of pleasure of pedestrians while walking. Thanks to the application of a methodology organized into two distinct steps, the application of the Chi-square test and the development of an ordered logit (OL) model, we found interesting results that can contribute to the literature of the sector. Aspects such as the presence of buildings with good facades along the path and continuity of the path had the greatest impact on the pleasantness of the path. However, characteristics that seem like less direct determinants of pleasantness also have a certain influence, such as protection from theft or robbery; this means that the sense of pleasure also depends on the sense of security. We can conclude that applying this kind of model that allows the identification of the path characteristics considered as most important by pedestrians can be very useful to identify the right strategies for offering pleasant pedestrian environments. Planners and practitioners could benefit from such findings.
One limitation of this study could lie in the category of involved pedestrians, who are only young people. However, it also true that there are many paths in the world prevalently frequented by students, especially in university campuses; consequently, there are many studies in the literature analyzing pedestrian environments situated in university campuses, as shown in the introduction section of the paper. A future development of this work is surely a possible involvement of other categories of users in order to have a more representative study case. In this case, it would be interesting to investigate the differences in perceptions among the various categories.
Finally, a brief consideration has to be made regarding the threats to internal and external validity in our study. Generally, threats to internal validity arise when factors affect the dependent variables without the evaluators’ knowledge, while threats to external validity occur when the evaluation results cannot be generalized. Concerning this aspect, although we verified that the assumptions made were true in our data, we can conclude that our specific findings cannot necessarily be generalized to other areas, although our methodology can be applied to other cities [
19].


