
Impact of Topography on Rural Cycling Patterns: Case Study of Bugesera District, Rwanda
by
 , , ,
, , ,
Jean-Claude Baraka Munyaka
1,*,
Jérôme Chenal
1,2,
Alexis Gatoni Sebarenzi
3,
Rim Mrani
1,4 and
Akuto Akpedze Konou
1 
1
EPFL ENAC IIE CEAT Bâtiment BP – Station 16, 1015 Lausanne, Switzerland
2
UM6P CUS, Ben Guerir 43150, Morocco
3
SABE, College of Science and Technology, University of Rwanda, Kigali KN7, Rwanda
4
UM6P SAP+D, Ben Guerir 43150, Morocco
*
Author to whom correspondence should be addressed.
Urban Sci. 2023, 7(1), 8; https://doi.org/10.3390/urbansci7010008
Submission received: 22 November 2022
/
Revised: 5 January 2023
/
Accepted: 9 January 2023
/
Published: 13 January 2023
Abstract
:Rural mobility in Africa is an under-researched issue. Rural communities have often suffered from reduced mobility that has hampered their access to essential services and facilities such as education, health care, food, and clean water. In many rural communities, a more affordable mobility option, such as non-motorized mobility (cycling and walking), is the preferred way for people to travel. Apart from its well-known advantages, little is known about the impact of topography and routes on the mobility options adopted by rural communities. Therefore, this study aims to use Digital Elevation Models (DEMs) to analyze the impact of topography and routes on rural mobility patterns at the level of formal and informal cycle track networks in the Bugesera District, focusing on the Nyamata and Mayange sectors, Rwanda. This study used GPS devices given to 50 participants to collect mobility patterns in the two previously mentioned sectors. Then, the study imposed a 30-m buffer on the official road networks of Rwanda collected by the Rwanda Transport Development Agency (RTDA). These data were joined to GPS tracks to highlight official and unofficial roads (tracks that did not fall within the 30-m buffer). In addition, Digital Elevation Models were applied to analyze the SRTM (30 m resolution) and ALOS PALSAR (12.5 m resolution) elevation data of the Bugesera region. The findings revealed an elevation range of 1333 to 1535 for SRTM and 1323 to 1641 for ALOS PALSAR. The study calculated the slope to find the slope percentage (m) and length (m). The findings from the DEMs and the slope calculation revealed that Bugesera has a relatively flat surface, favorable for cycling. The slope percentage was further classified into five levels of slope ranging from steep to very steep. And the Van Zuidam classification results confirmed that Bugesera has “a flat or nearly flat surface, without significant denudation processes”. With a favorable topography and a higher bicycle ownership ratio, residents of the Bugesera district favor cycling in their daily activities more than any district in Rwanda. Cycling in Nyamata or Mayange links residents to areas with higher social, educational, administrative, and economic activities.
1. Introduction
Routing is a common task when using digital maps and planning infrastructures. According to Silbernagl et al. [1], most existing routing engines are limited to car travel routes, and little is offered for non-motorized transportation modes such as a bicycles or walking. For infrastructure planning, Oskarbski et al. [2] find that many cities have developed their road transport networks to improve the efficiency of car traffic and reduce congestion. Few researchers have sought to understand the problems related to rural mobility. Research has shown that the lack of mobility hinders rural communities’ access to essential services and facilities such as education, health care, food, and clean water [3]. In the previous state, improving traffic efficiency and reducing city congestion to cope with increasing urbanization has overshadowed the effort to deal with mobility challenges in rural communities.
As Oskarbski et al. [2] pointed out, most infrastructure planning in Africa revolves around increasing the capacity of existing road networks in urban centers to accommodate more cars rather than considering the construction of new road networks capable of accommodating various modes of transport, including walking and cycling. An aspect often neglected in infrastructure planning is the integration of rural mobility, usually related to walking and cycling, into the overall plan. To do this, it is necessary to examine those aspects of mobility that directly impact rural mobility and community. Among those aspects, Garvican-Lewis et al. [4] believe that the increase in altitude reduces oxygen availability and leads to an attenuation of cycling power output, similarly affecting heart rate, speed, and cadence.
In many parts of the sub-Saharan region, including Rwanda, the most available means of mobility in rural areas are walking and cycling [5]. Despite the current recent trends towards urbanization, Rwanda is among the few countries with a predominantly rural population with approximately 81.55% of the population living in rural areas [6]. Given the high population density and the remote and limited access to public services in rural areas, the research investigated how topography impacts rustic cycling patterns. First, this investigation used Digital Elevation Models (DEMs) to identify the elevation factor in cycling mobility patterns. This analysis calculated the elevation range that characterizes Bugesera district topography. The findings assisted in further analyzing rural mobility patterns at the level of formal and informal cycle track networks. Two DEMs, namely the Shuttle Radar Topography Mission (SRTM) DEM and the Advanced Land Observation Satellite Phased Array L-band Synthetic Aperture Radar (ALOS PALSAR) DEM, were downloaded and analyzed taking into account the accuracy of their image resolutions. The research in the second objective collected GPS tracks to identify cycling patterns in Nyamata and Mayange. Each track collected by participants using the Columbus V990 GPS device was merged and geo-processed using QGIS.
Furthermore, slope level calculation is a critical objective to determine topography influences on rustic cycling patterns. In the third objective, the rural cycling patterns in official and non-official roads linked to GPS tracks were imposed with the raster data (SRTM and ALOS PALSAR) to determine the area slope level. Finally, the slope level finding was applied to Van Zuidam’s classification to establish which instincts Bugesera is impacted by in terms of topography and to what types of roads.
2. Literature Review
Digital Elevation Models (DEMs) are a quantitative representation of the Earth’s surface, with detailed spatial data information on terrain elevation for scientific investigations and researchers [7]. Other DEMs include orientations (aspect), insolation, drainage networks, visual, and watershed analysis, etc. [8]. Utility cycling (used as a mode of transport) is the world’s original and most common type of bicycle [9]. Bicycle routing, however, presents several unique challenges. In contrast to car drivers, Hrncir et al. [9] believe that the decision on cycle routes takes into account a much more comprehensive range of factors. Broach et al. [10] and Winters et al. [11] employed questionnaires and GPS tracking. The research findings revealed that cyclists have sensitive elements such as trip distance, turn frequency, elevation, junction control, noise, pollution, scenery, and traffic volumes.
Furthermore, the relative importance of these factors varies considerably from one cyclist to another. It can also depend on the weather, the purpose of the journey, and the attenuation of cycling power output [4,9]. Finding routes that take all the above factors into account is not easy, especially when it involves rural areas with little infrastructure and access to essential services by car. Cyclists, as assumed in most cases, choose the minimum-distanced path between origins and destinations using a fixed travel speed without consideration of network attributes [12]. These shorter paths are more often affected by the elevation factor. In the DEMs, the physical terrain, which represents the natural world, is conceptualized and abstracted into a nominal landscape modeled as an empirical grid, matrix, array data structure, or formal mathematical model [13]. According to Jalal et al. [7], DEM is a very convenient and efficient way to store and analyze digitized elevation data for the whole terrain instead of keeping elevations as vector/coordinate lists. Various techniques are applicable to produce Digital Elevation Models. These techniques include LiDAR, radar interferometry, aerial photogrammetry, airborne laser scanning, or satellite remote sensing [14,15,16,17,18,19,20].
Open-source datasets are downloaded and applied when the DEM is used via satellite remote sensing. In search of a more accurate dataset, Rexer et al. [21] compared the accuracy of freely available global models, namely: (1) the Advanced Spaceborne Thermal Emission Reflectometer DEMs (ASTER GDEM2) and (2) two DEMs based on the Shuttle Radar Topography Mission (SRTM). The authors’ investigation concluded that SRTM has a higher accuracy than the two [21]. The Shuttle Radar Topography Mission (SRTM), a joint operation between the National Geospatial-Intelligence Agency (NGA), the National Aeronautics and Space Administration (NASA), the German and Italian space agencies, provides a near-global elevation dataset after processing radar information [1]. SRTM also scans near-global land surfaces from different angles. According to D’Ozouville et al. [18,22,23,24,25], a Shuttle Radar Topographic Mission (SRTM) of 1″ × 1″ resolution (Approximately 30 × 30 m) is the most popular Global Digital Elevation Map. Apart from the SRTM DEM discussed prior, Halim et al. [26] believe that the Advanced Land Observation Satellite Phased Array L-band Synthetic Aperture Radar (ALOS PALSAR 12.5 m) is the most precise GDEM in the world and opened for free to the public since 2015.
Other processes include cleaning up the models for correct use by removing noisy elevation values that cause unrealistic slopes and applying smoothing algorithms before the elevation profiles are projected onto the edge of the routing graph [1]. Before using the dataset, this pre-processing step is necessary to remove noisy and erroneous information, thus allowing access to a more suitable cycle path and accurate route planning.
3. The Study Area
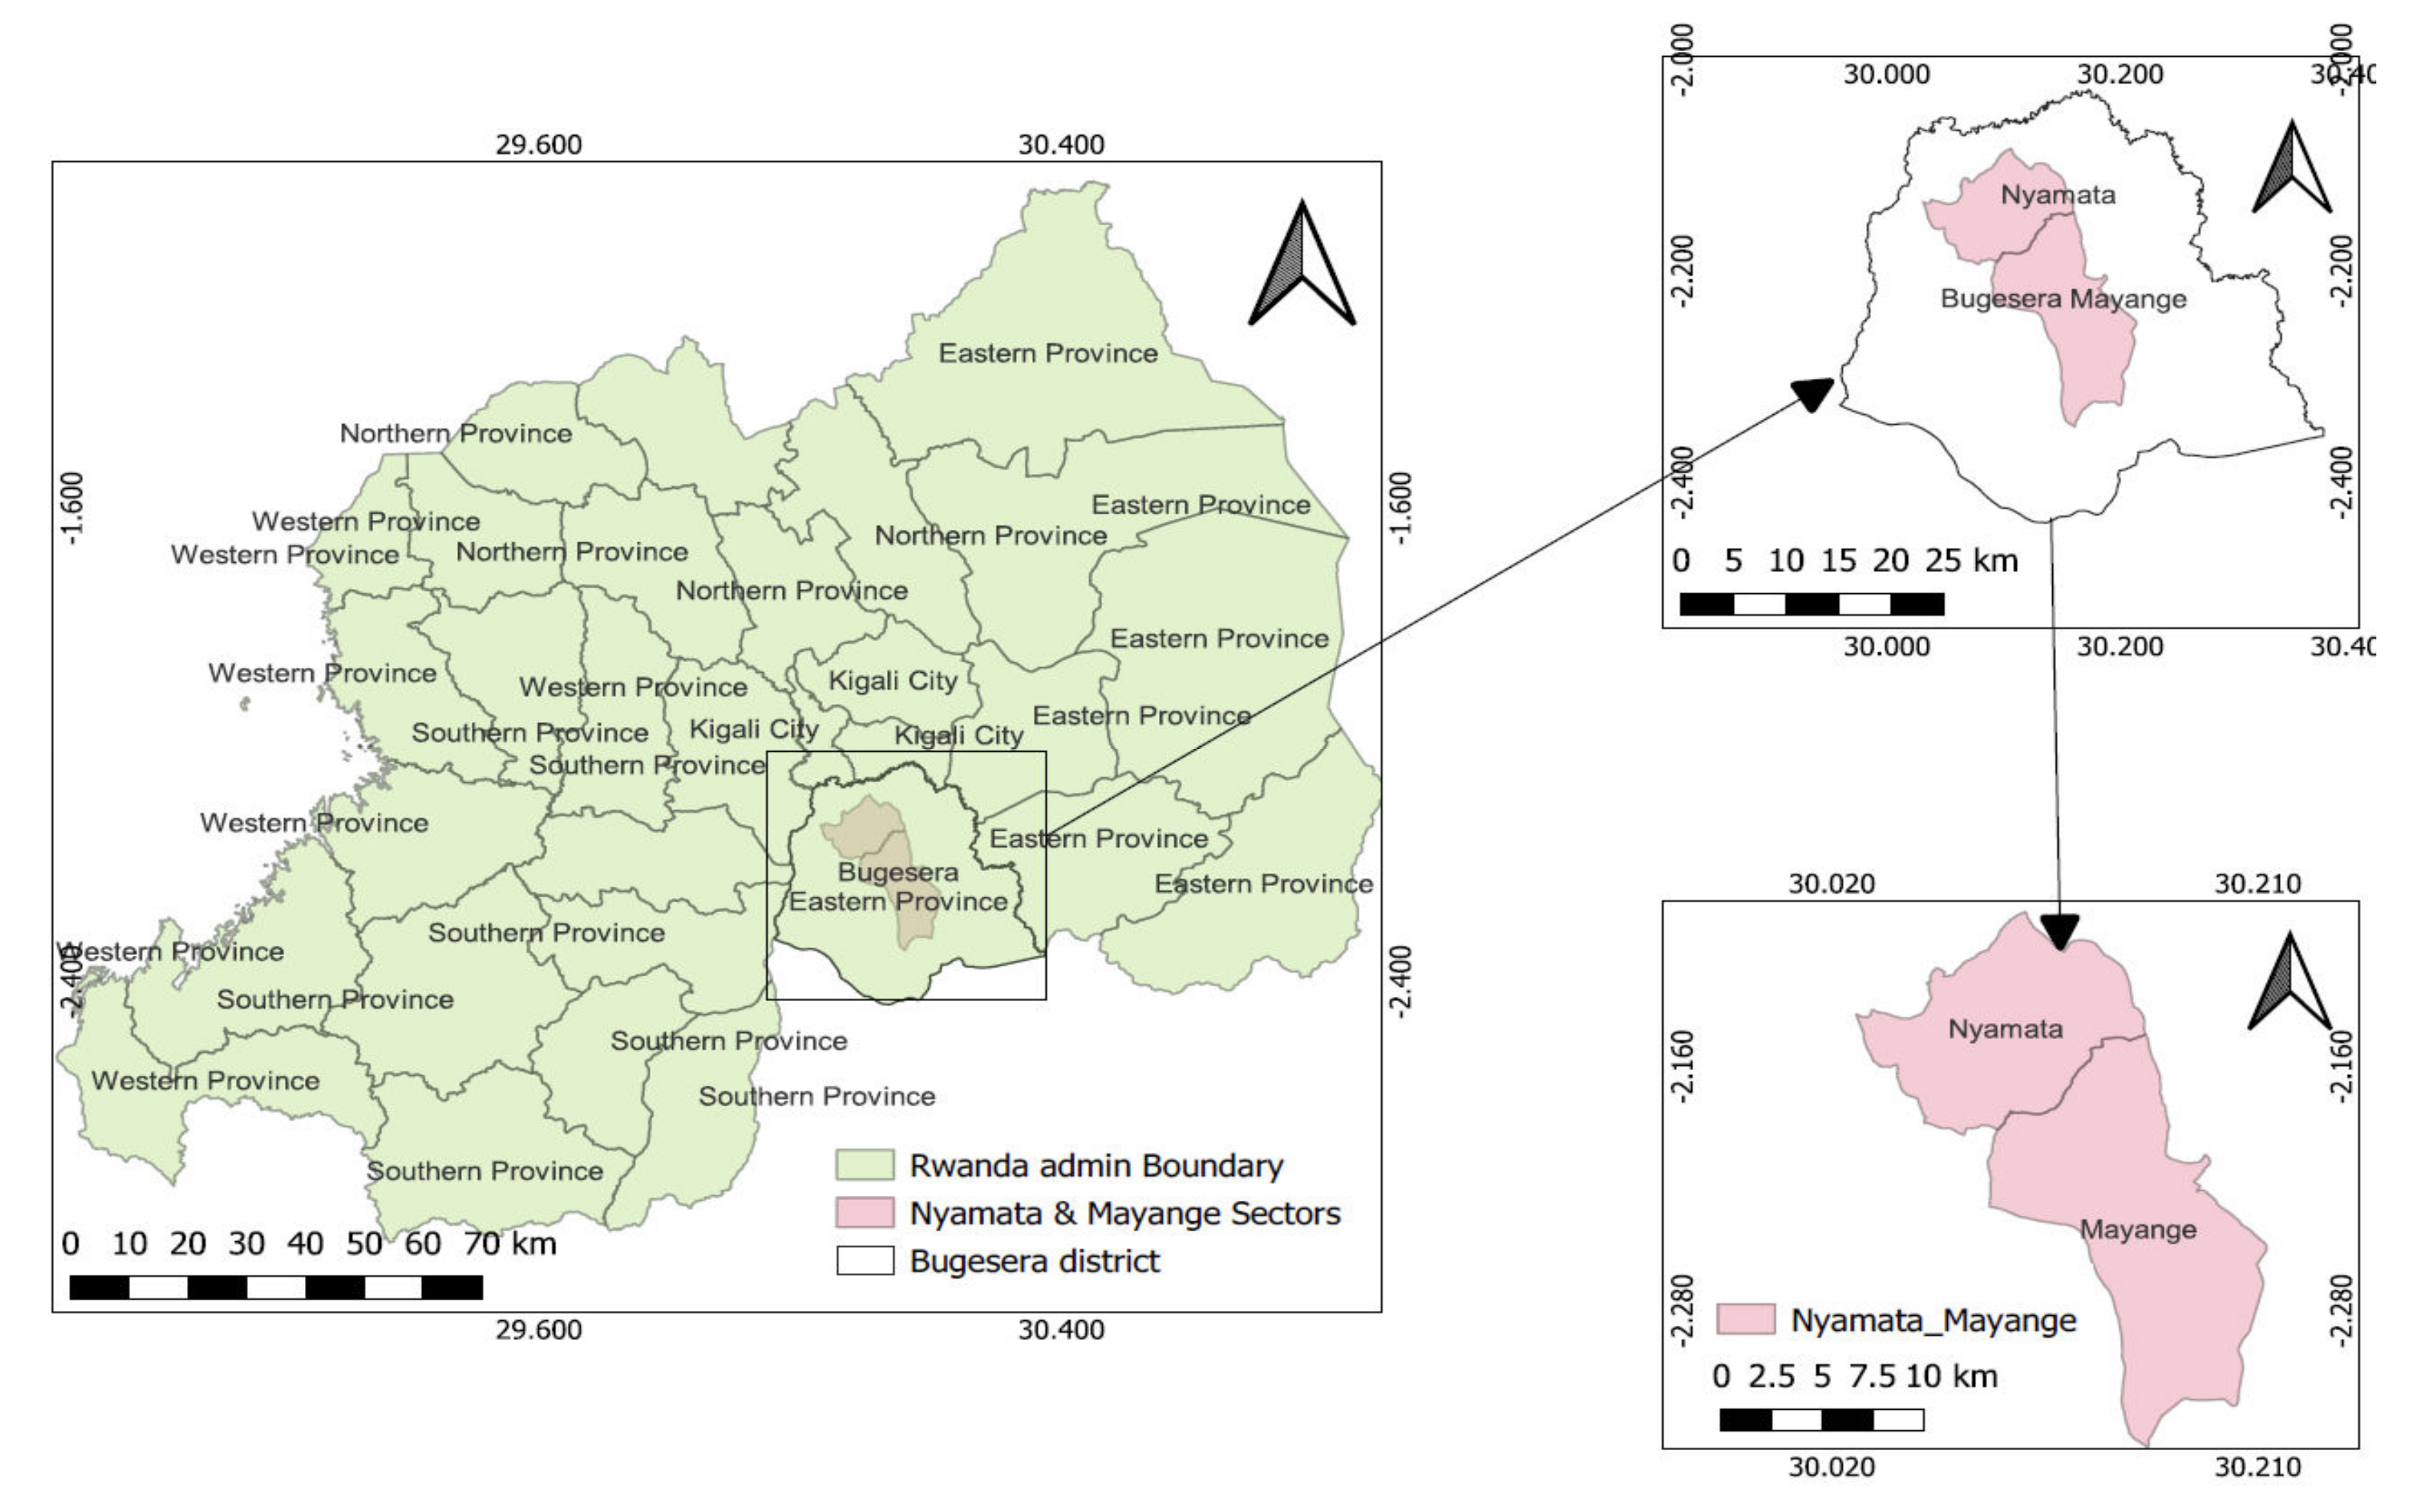
The study area is the Nyamata and Mayange sectors, which are part of the Bugesera district, Eastern Province of Rwanda. Bugesera is one of the six districts that make up the Eastern Province. The area is located in the Universal Transverse Mercator (UTM) zone 36 M and surrounded by latitudes −2.231532 (2°13′53.52″ S) and longitudes 30.112735 (30°6′45.85″ E). The elevation in Bugesera averaged 1417 Meters (4648.9501 Feet). The whole area is estimated to be 1288 km2, accounting for 4.9% of the total area of Rwanda [27].
The Elevation Map (GDEM) is freely available from NASA, covers latitudes between 56° S and 60° N [7], and is most suitable for rural and less populated areas. Despite its popularity, SRTM does not produce GDEM at the highest resolution as ALOS PALSAR.
The Bugesera district, like most areas in Rwanda, is considered rural. According to the Food and Agriculture Organization of the United Nations (FAO) [28], agriculture is the main economic activity in Rwanda, with over 70% of the population engaged in this sector. About 72% of the working population is employed in agriculture. The map in Figure 1 shows Bugesera district and Nyamata and Mayange locations on Rwanda’s map. Furthermore, the National Institute of Statistics of Rwanda [27] surveyed 280 participants living in Bugesera. The study estimated that about 30.5% of households in Bugesera own at least one bicycle for transport, making Bugesera the district in Rwanda with the highest number of bicycle owners. With bicycle ownership more often linked with the social and economic status in Sub-Saharan Africa, analyzing bicycle mobility patterns in rural areas will ensure a more practical application of transport policies.
With GPS technology, this study intends to collect geographic data on rural cycling mobility in Bugesera. The collected data will (1) make the often-scarce data available, (2) assist in understanding rural mobility challenges and the lack thereof, particularly for the most vulnerable members, finally, (3) influence policy makers developing well thought of and inclusive transportation policies for rural areas. Bugesera offers the opportunity to determine whether the higher number of bicycle owners and mobility in this district is influenced by more favorable topography or simply by the lack of means to switch to other available transport modes.
4. Method
4.1. GPS Tracking Survey
In recent years, GPS tracking has been useful in complex transport studies in Africa, especially with the rise of informal means of transport such as motorbike transport (commonly called boda boda). Jaligot et al. [29] and Kemajou et al. [30], for example, assessed mobility patterns using GPS trackers in Haiti and Cameroon, respectively. The method used by Jaligot et al. [29] and Kemajou et al. [30], although mixed with qualitative tools, included (1) identifying the conditions that led to the expansion of bike taxi practices, (2) understanding in detail how much of the travel demand is met, and (3) collecting data (quantitative, cartographic, and socio-economic) on the individual transport mode. In this study, GPS analyzes topography’s impact on cyclists’ route choices. The data collected included GPS coordinates of cyclists and elevation data. Fifty Columbus V-990’s GPS trackers were handed to 50 cyclists in the Nyamata and Mayange areas. The collected trackers were merged in QGIS and joined as vectors with Rwanda road network data obtained from the Rwanda Transport Development Agency (RTDA). The research contributed to determining cyclists’ mobility patterns.
4.2. Routing Data Collection
The routing data collected includes secondary and primary data. Data collected for secondary means included road network data from Open Street Maps (OSM) and Rwanda Transport Development Agency (RTDA). Other essential data collected included points of interest (POI) from Nyamata and Mayange (schools, health facilities, government offices, commercial sites, religious sites, sports facilities, financial institutions, etc.). The study collected these POIs from the National Institute of Statistics Rwanda (NISR), GPS tracker devices, and Kobo collect. As these areas are predominantly rural, little is known about their mobility patterns. The study recruited fifty bicycle owners from Bugesera, with 25 participants in Nyamata and the remaining 25 participants in Mayange. In both areas, bicycle mobility data were collected using GPS devices. The training helped participants know what data to collect and how to use the GPS device. With each of these GPS devices, participants turn on every bike ride they undertake. During the journey, except for the tracks collected, each participant stopped to mark the point of interest (POIs). The research assistants then used Kobo collect toolkit to confirm the location and obtain additional details on the collected POIs. Apart from POIs, Kobo collect was also helpful in collecting participant demographic information that included gender, age category, participant sector (2), cell (9), and villages (27). Kobo also collected information on the participants’ bike ownership (I own the bike, the bike belongs to a relative, the bike belongs to someone who is not a relative). Kobo also collected participants’ daily cycling mobility habits, such as “the use of the bike for professional purposes (bike taxi, agriculture, etc.) or personal purposes (study, fetching water, shopping, fetching grass for animals)”.
4.3. Bicycle Mobility Patterns Analysis
In total, the 50 participants collected 580 tracks in the two towns of Nyamata and Mayange for the 5 days of the study. As shown in Table 1 below, the participants were demographically diverse with 9 cells and 27 villages. Of the 50 participants, 38 cycled for business and personal purposes, seven cycled strictly for business purposes (14%), and 5 for personal purposes (10%).
The 580 Tracks collected in 5 days were merged in QGIS from data management tools using the ‘merge vector layers’ algorithm. The QGIS-created project imported the merged GPS layer into the project along with Points of Interest, Rwanda road networks, OSM networks, contours, etc.
4.4. GDEMs Analysis
Digital Elevation Models (DEMs) allow certain Rasters to gain more insight into the terrain. To ensure optimal cycling mobility, it is essential to use accurate elevation data. Some elevation data examined in the paper include the Shuttle Radar Topographic Mission (SRTM) with a resolution of 1″ × 1″ (approximately 30 × 30 m). Other elevation data examined included the Advanced Land Observation Satellite Phased Array L-band Synthetic Aperture Radar (ALOS PALSAR) with a resolution of 12.5 m. Both have two different profiles, one being the most popular Global Digital Elevation Map (GDEM), while the other is the most accurate GDEM. The study identified the topography of the two areas by joining one of these elevation data to the GPS vectors and assigning elevation variables to the segments between the points.
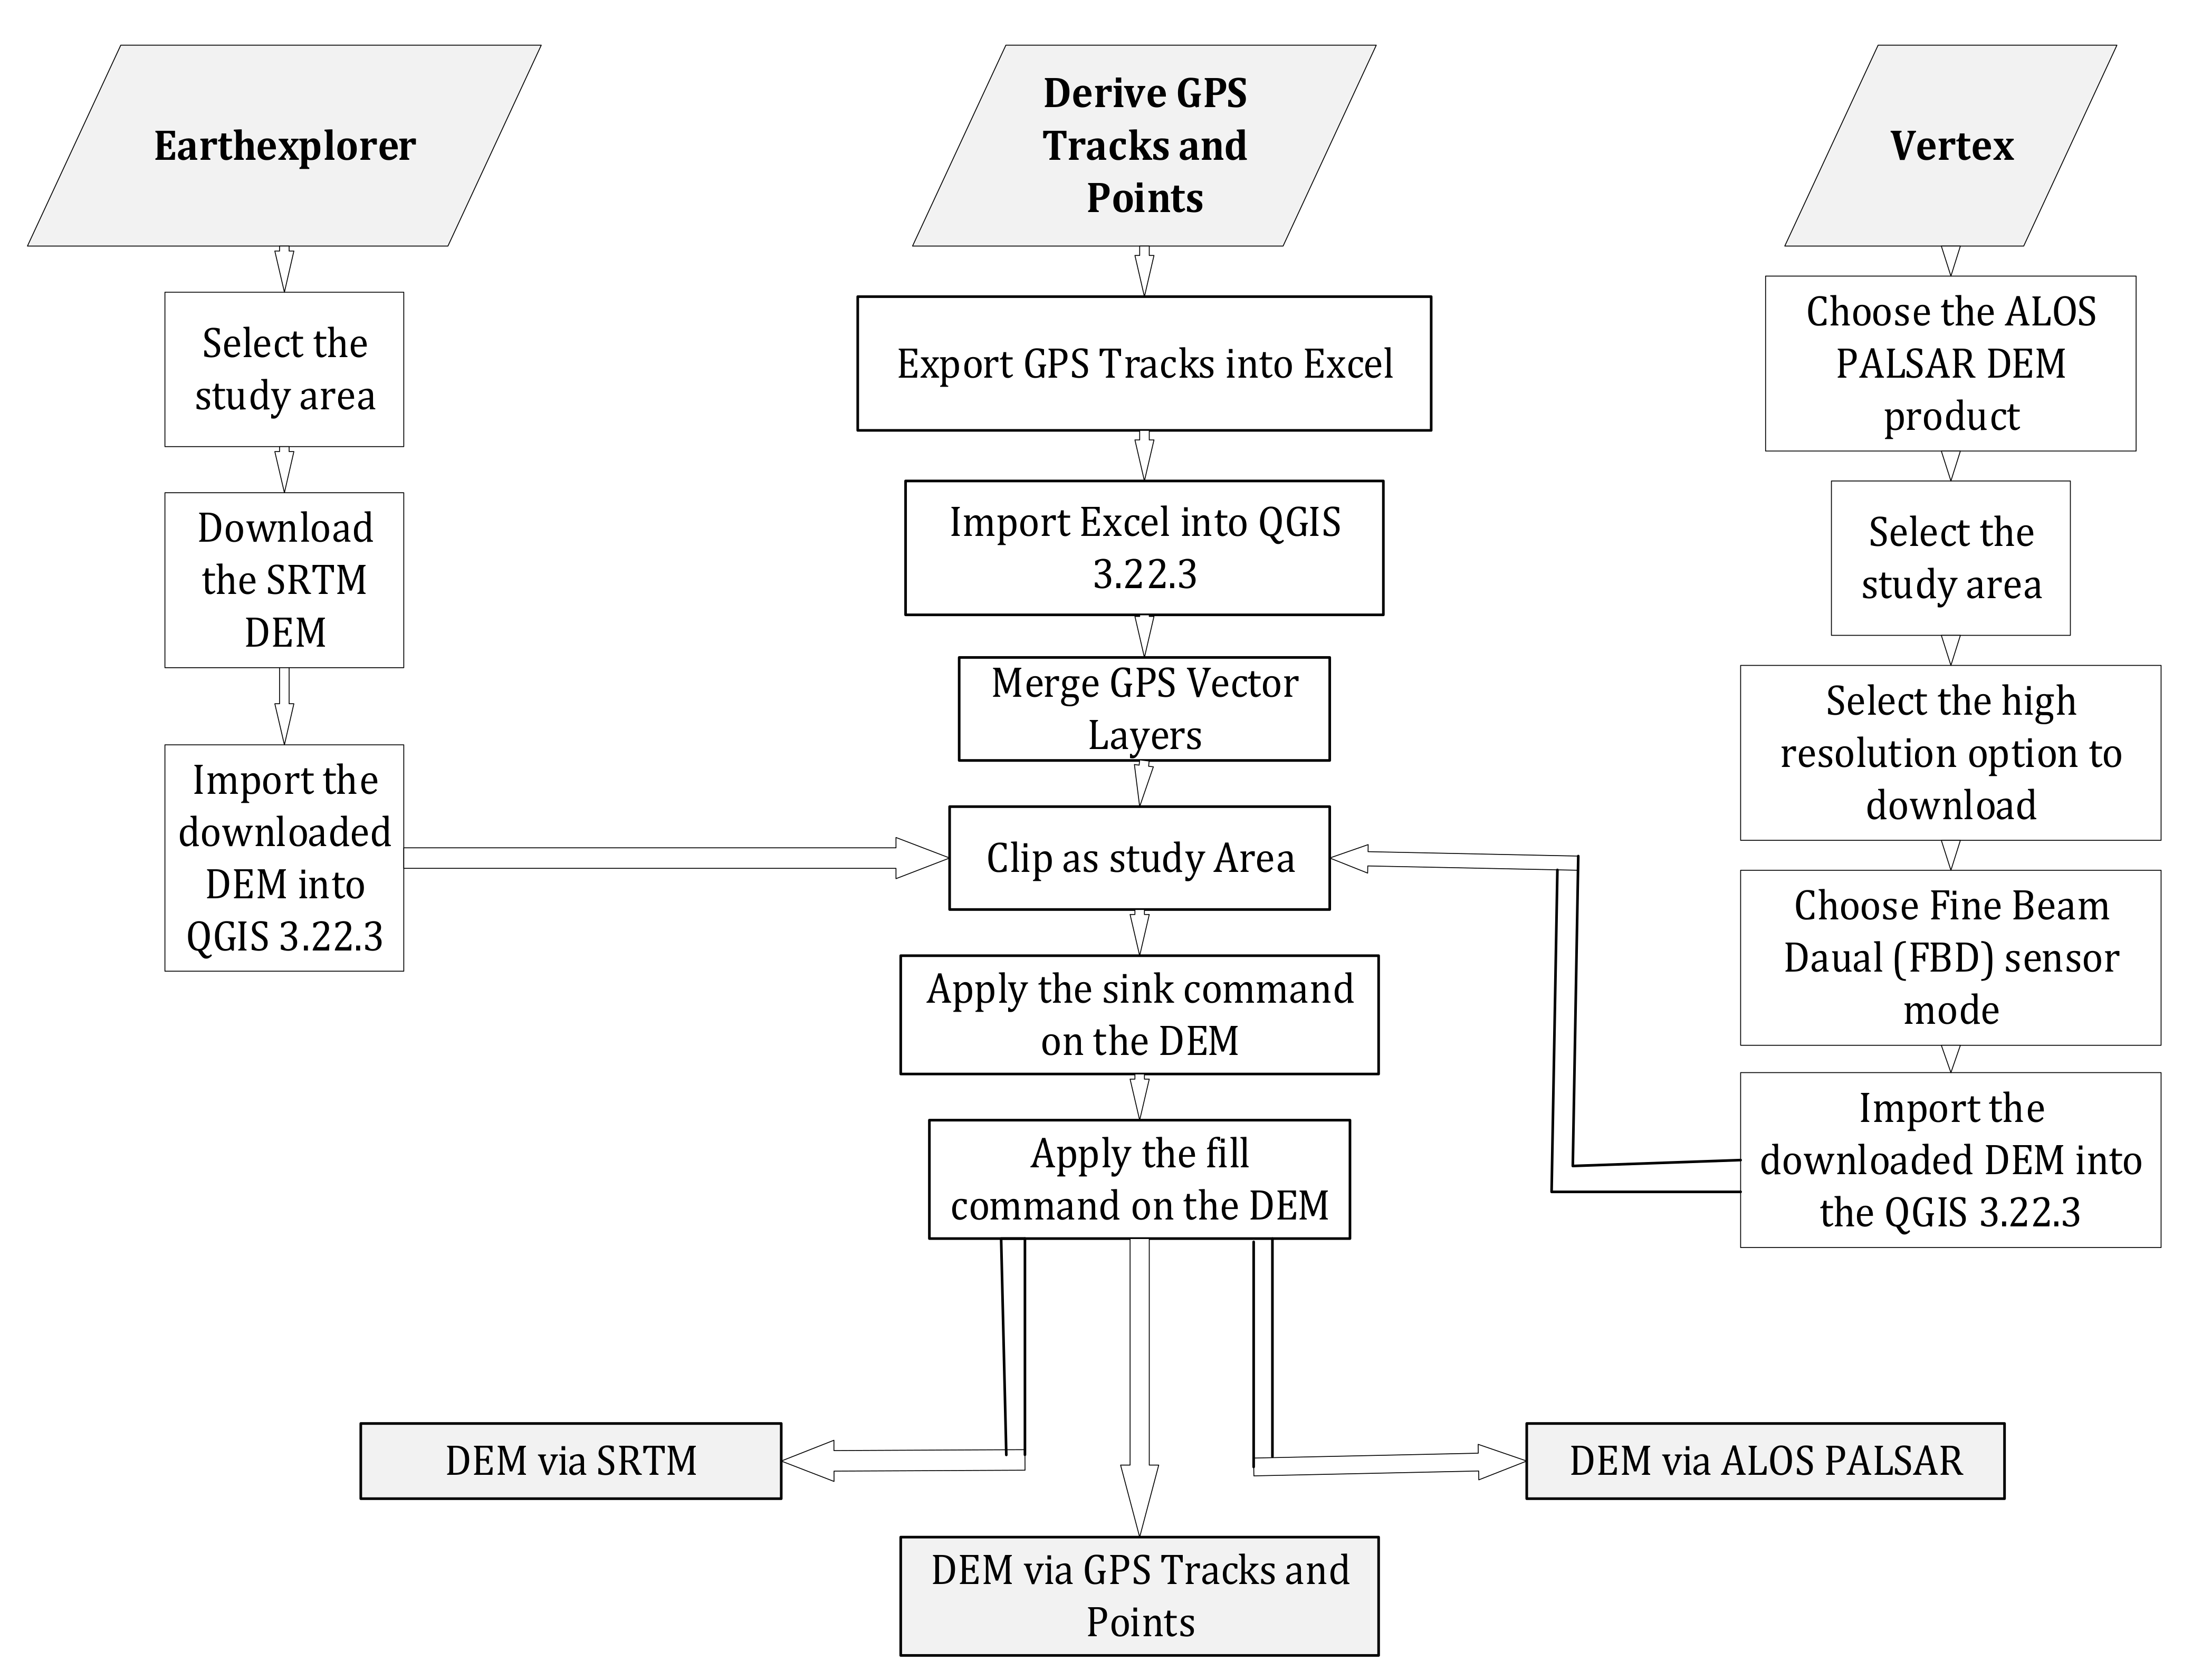
Different datasets and methods are used to extract the GDEMs and derive the DEMs from the GPS points for the studied areas. Figure 2 below schematically summarizes the extraction method of ALOS PALSAR DEM as SRTM DEM from the GPS points from Nyamata and Mayange. The process explained by Jalal et al. [7] is as follows:
- For extracting ALOS PALSAR DEM:
- Selection of the project study area to download the Advanced Land Observation Satellite (ALOS PALSAR) Phased Array Synthetic Aperture Radar at long frequency and spatial resolution of 12.5 × 12.5 m from the Vertex website (http://vertex.daac.asf.alaska.edu/, accessed on 05 November 2022).
- Choose Dual Beam Fine (DBF) sensor. Then, select the high-resolution option to download the DEM.
- Export the downloaded DEM to the QGIS 3.22.3
- Extracting SRTM DEM:
- Select the study area to download the SRTM with an average frequency and spatial resolution of 1″ × 1″ (approximately 30 × 30 m) from the Agency’s database: EarthExplorer website (https://earthexplorer.usgs.gov/, accessed on 22 October 2022).
- Extracting GPS points DEM:
- Export the coordinates of points and their elevations from the Excel sheet to QGIS 3.22.3.
- Merge Vector layers as per the study areas.
4.5. Slope Line Segment Calculation
For the study, the Digital Elevation Model (DEM) used had a spatial resolution of 30 m for SRTM and 12.5 m for ALOS PALSAR and was used to delineate slopes in Bugesera and to calculate the Slope Line Segment Length (L). Tracks cover different environments and road surfaces. The y-axis shows the meters above sea level, while the x-axis is the distance cycled in meters. Figure 3 graphically illustrates the gradient analysis conducted.
Given points (X1, Y1), (X2, Y2) as shown in Figure 3, Slope is, in essence, the change in height (vertical distance), also referred to as ‘rise’ over the change in horizontal distance, also referred to as ‘run.’ The ‘rise’ refers, in road surfaces, to the change in altitude. Meanwhile, ‘run’ is associated with the difference between a point of origin and a point of destination for no-factor distance. The Slope is calculated mathematically as follows:
represents the vertical change (line segments), while represents the Horizontal change (line segments), where,
- m: slope;
- Δ: A difference or a change;
Both and line segments form a right triangle with hypotenuse L, with L being the points (X1, Y1) and (X2, Y2). It is possible to calculate L using the Pythagorean theorem.
There are two common ways of describing the slope of a road. One is the angle between 0° and 90° (in degrees), and the other is the slope in percentage. The angled slope represents the angle formed between the horizontal plane and the angular deviation of your ascent from this idealized flat surface (3). Using trigonometry, the slope m of a line is related to its angle of inclination by the tangent function.
where,
Percentage slope is a simple way to determine the inclination of a road, but it does not take into account the actual distance traveled when there is a change in altitude.
The slope calculation describes the direction and the steepness of a line. The absolute value of the slope measures the steepness, inclination, or slope of a line. A slope with a larger absolute value indicates a steeper line. While the direction of a line is either increasing, decreasing, horizontal or vertical. To know the direction of a line on a slope, describes it taking into account the following sign or numerical value:
- Positive slope direction with m > 0, describes an increasing line is increasing going up from left to right.
- Negative slope direction with m < 0, describes a decreasing line going down from left to right.
- Constant function slope with m = 0, describing a horizontal line.
- Undefined Slope, describing vertical line.
5. Results
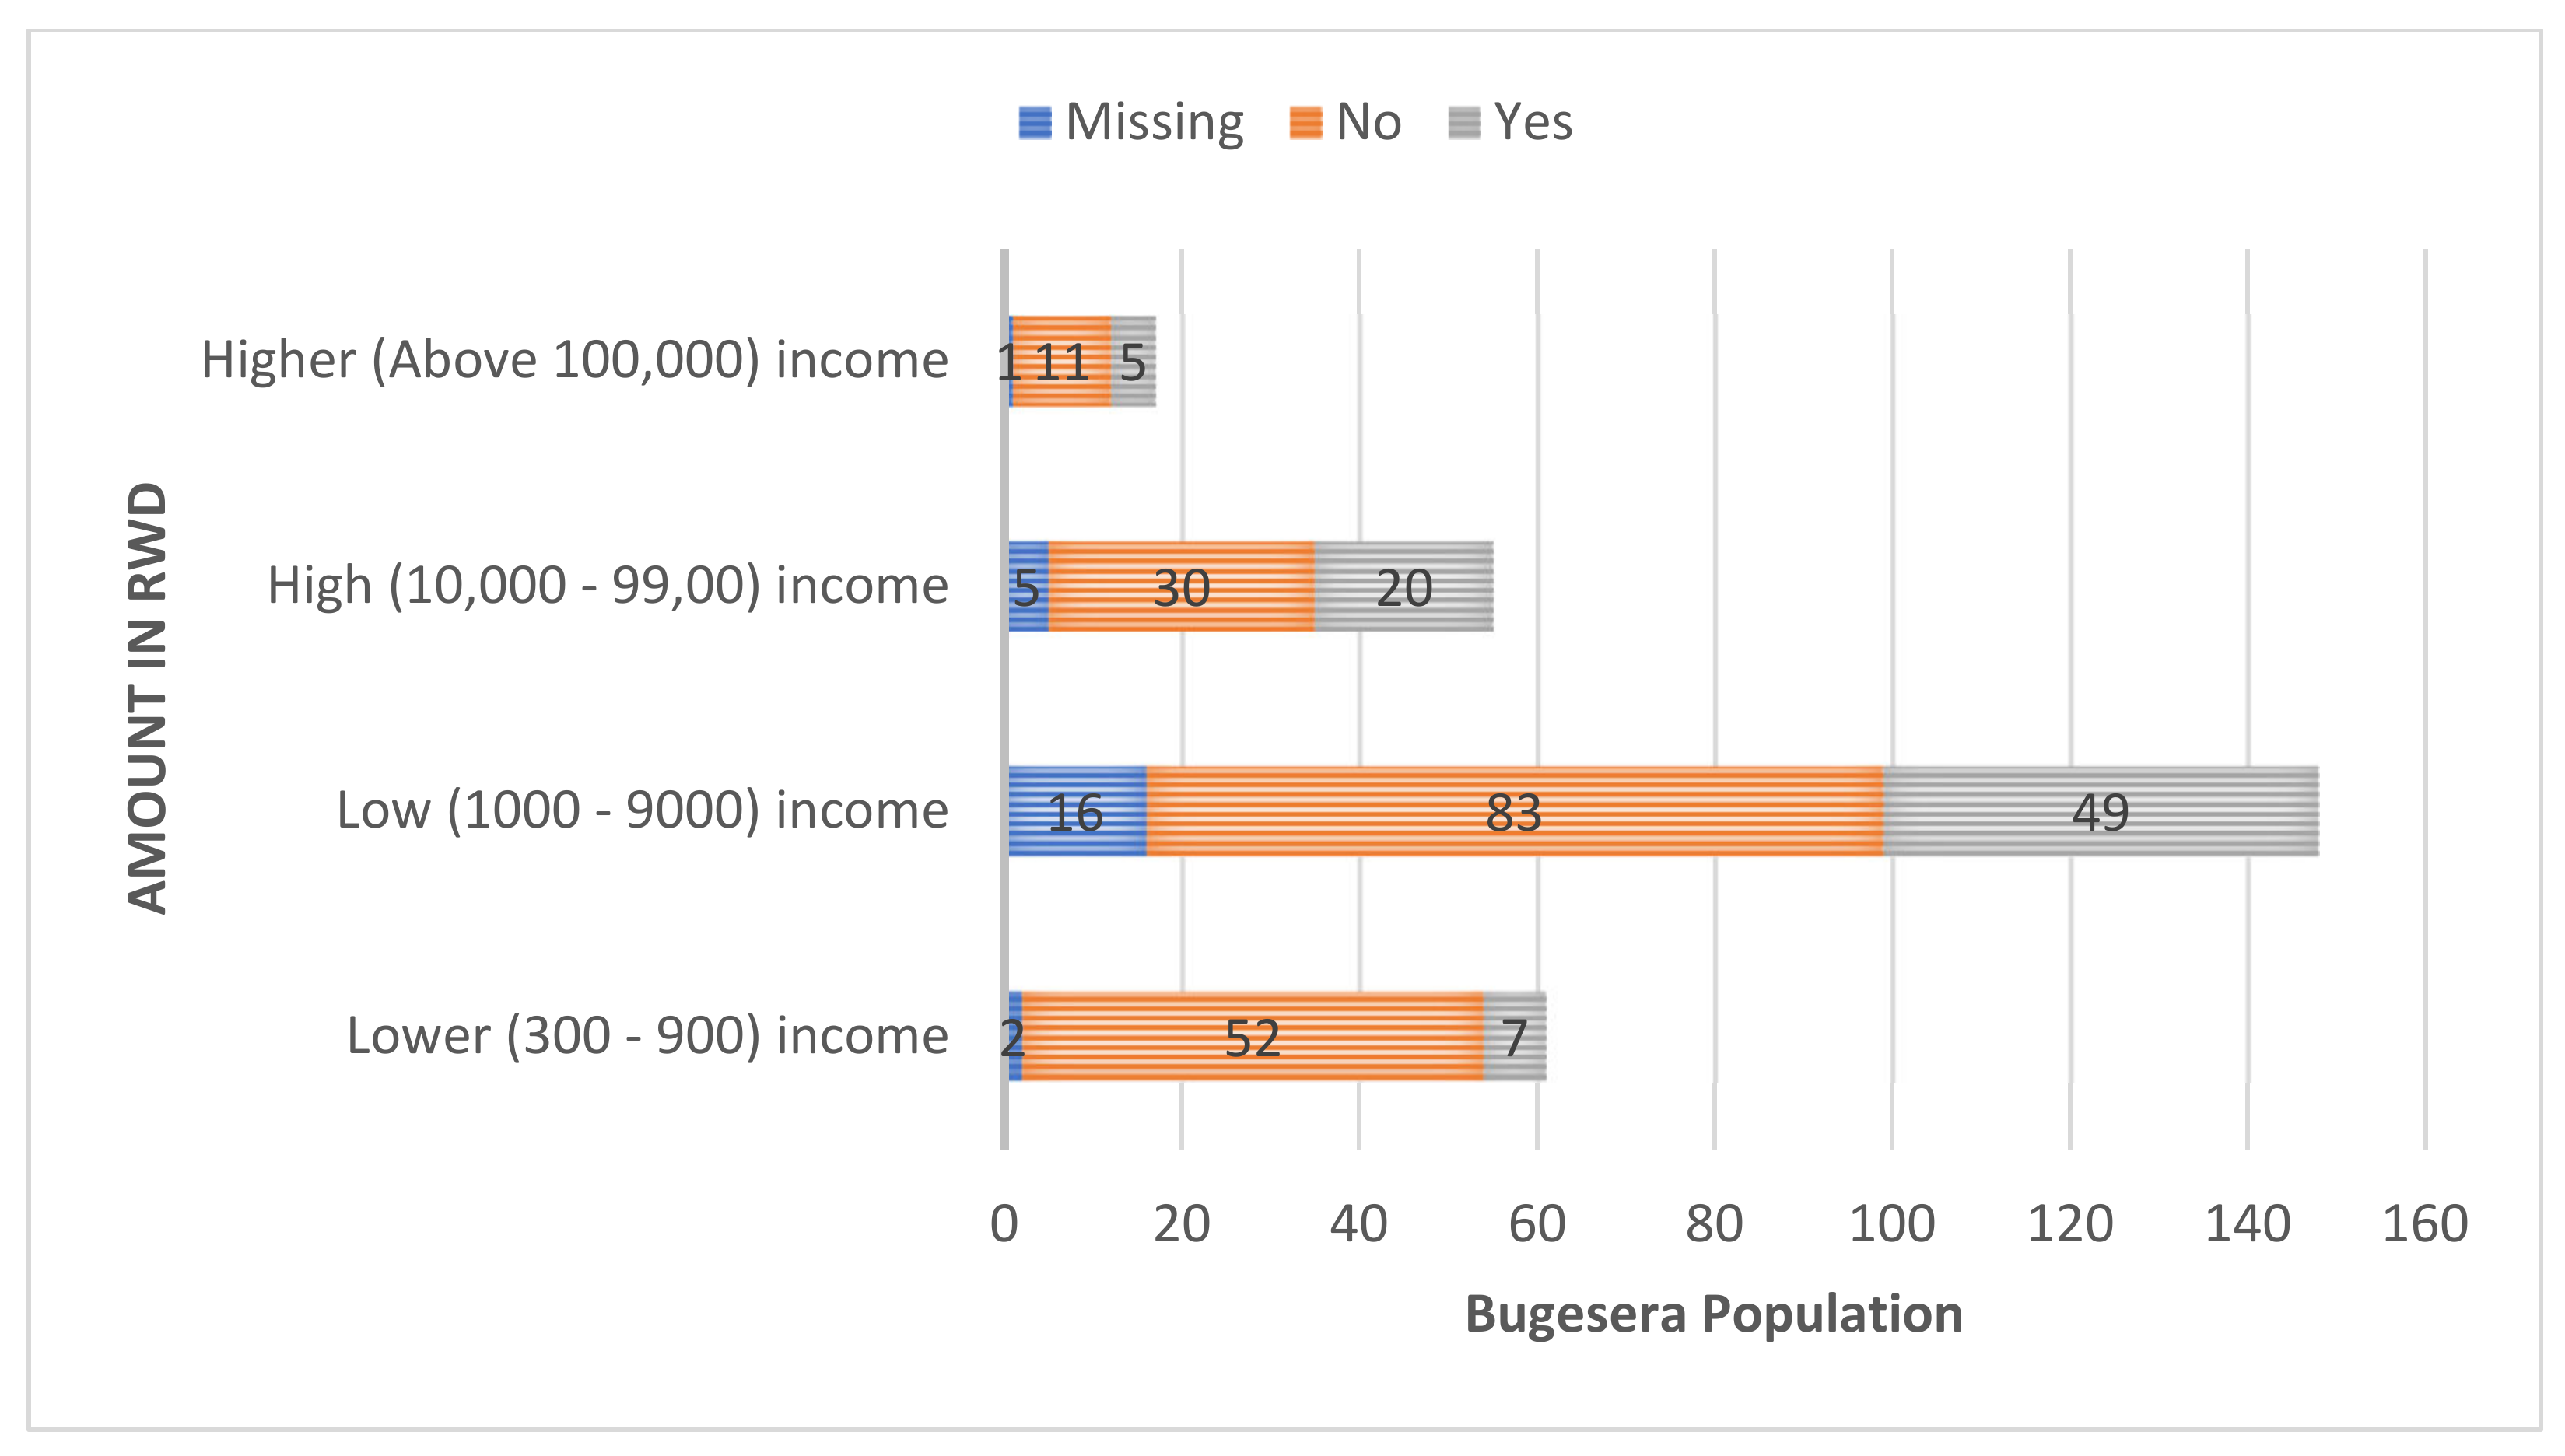
The survey conducted by the National Institute of Statistics revealed that low-income earners, with incomes between 1000 and 9000 Rwandan francs (Rwf), are the most likely to own a bicycle. In addition, the higher the income of participants, the less interest they have in owning a bike (Figure 4).
Figure 5 cross-tabulates the participant’s income and their type of work category as shown from the survey data list. The result shows that most low and lower (Rwf 300–900) income earners are involved in private businesses, which often implies that they are engaged in subsistence activities.
The application of DEMs was useful for the analysis, modeling, and decision-making activities [10]. The results discuss Bugesera mobility models’ findings. As detailed in the flow chart in Figure 4, GPS trackers placed on 50 participants recorded cyclists’ mobility tracks from all walks of life in Mayange and Nyamata. Joining elevation data to GPS vertices analysis was carried out. Further analysis of attribute elevation variation to segments between points allows the research to identify elevation cells in the target area. Finally, the study performed QGIS 3.22.3 geoprocessing tools to conduct slope analysis.
5.1. Bugesera Mobility Patterns
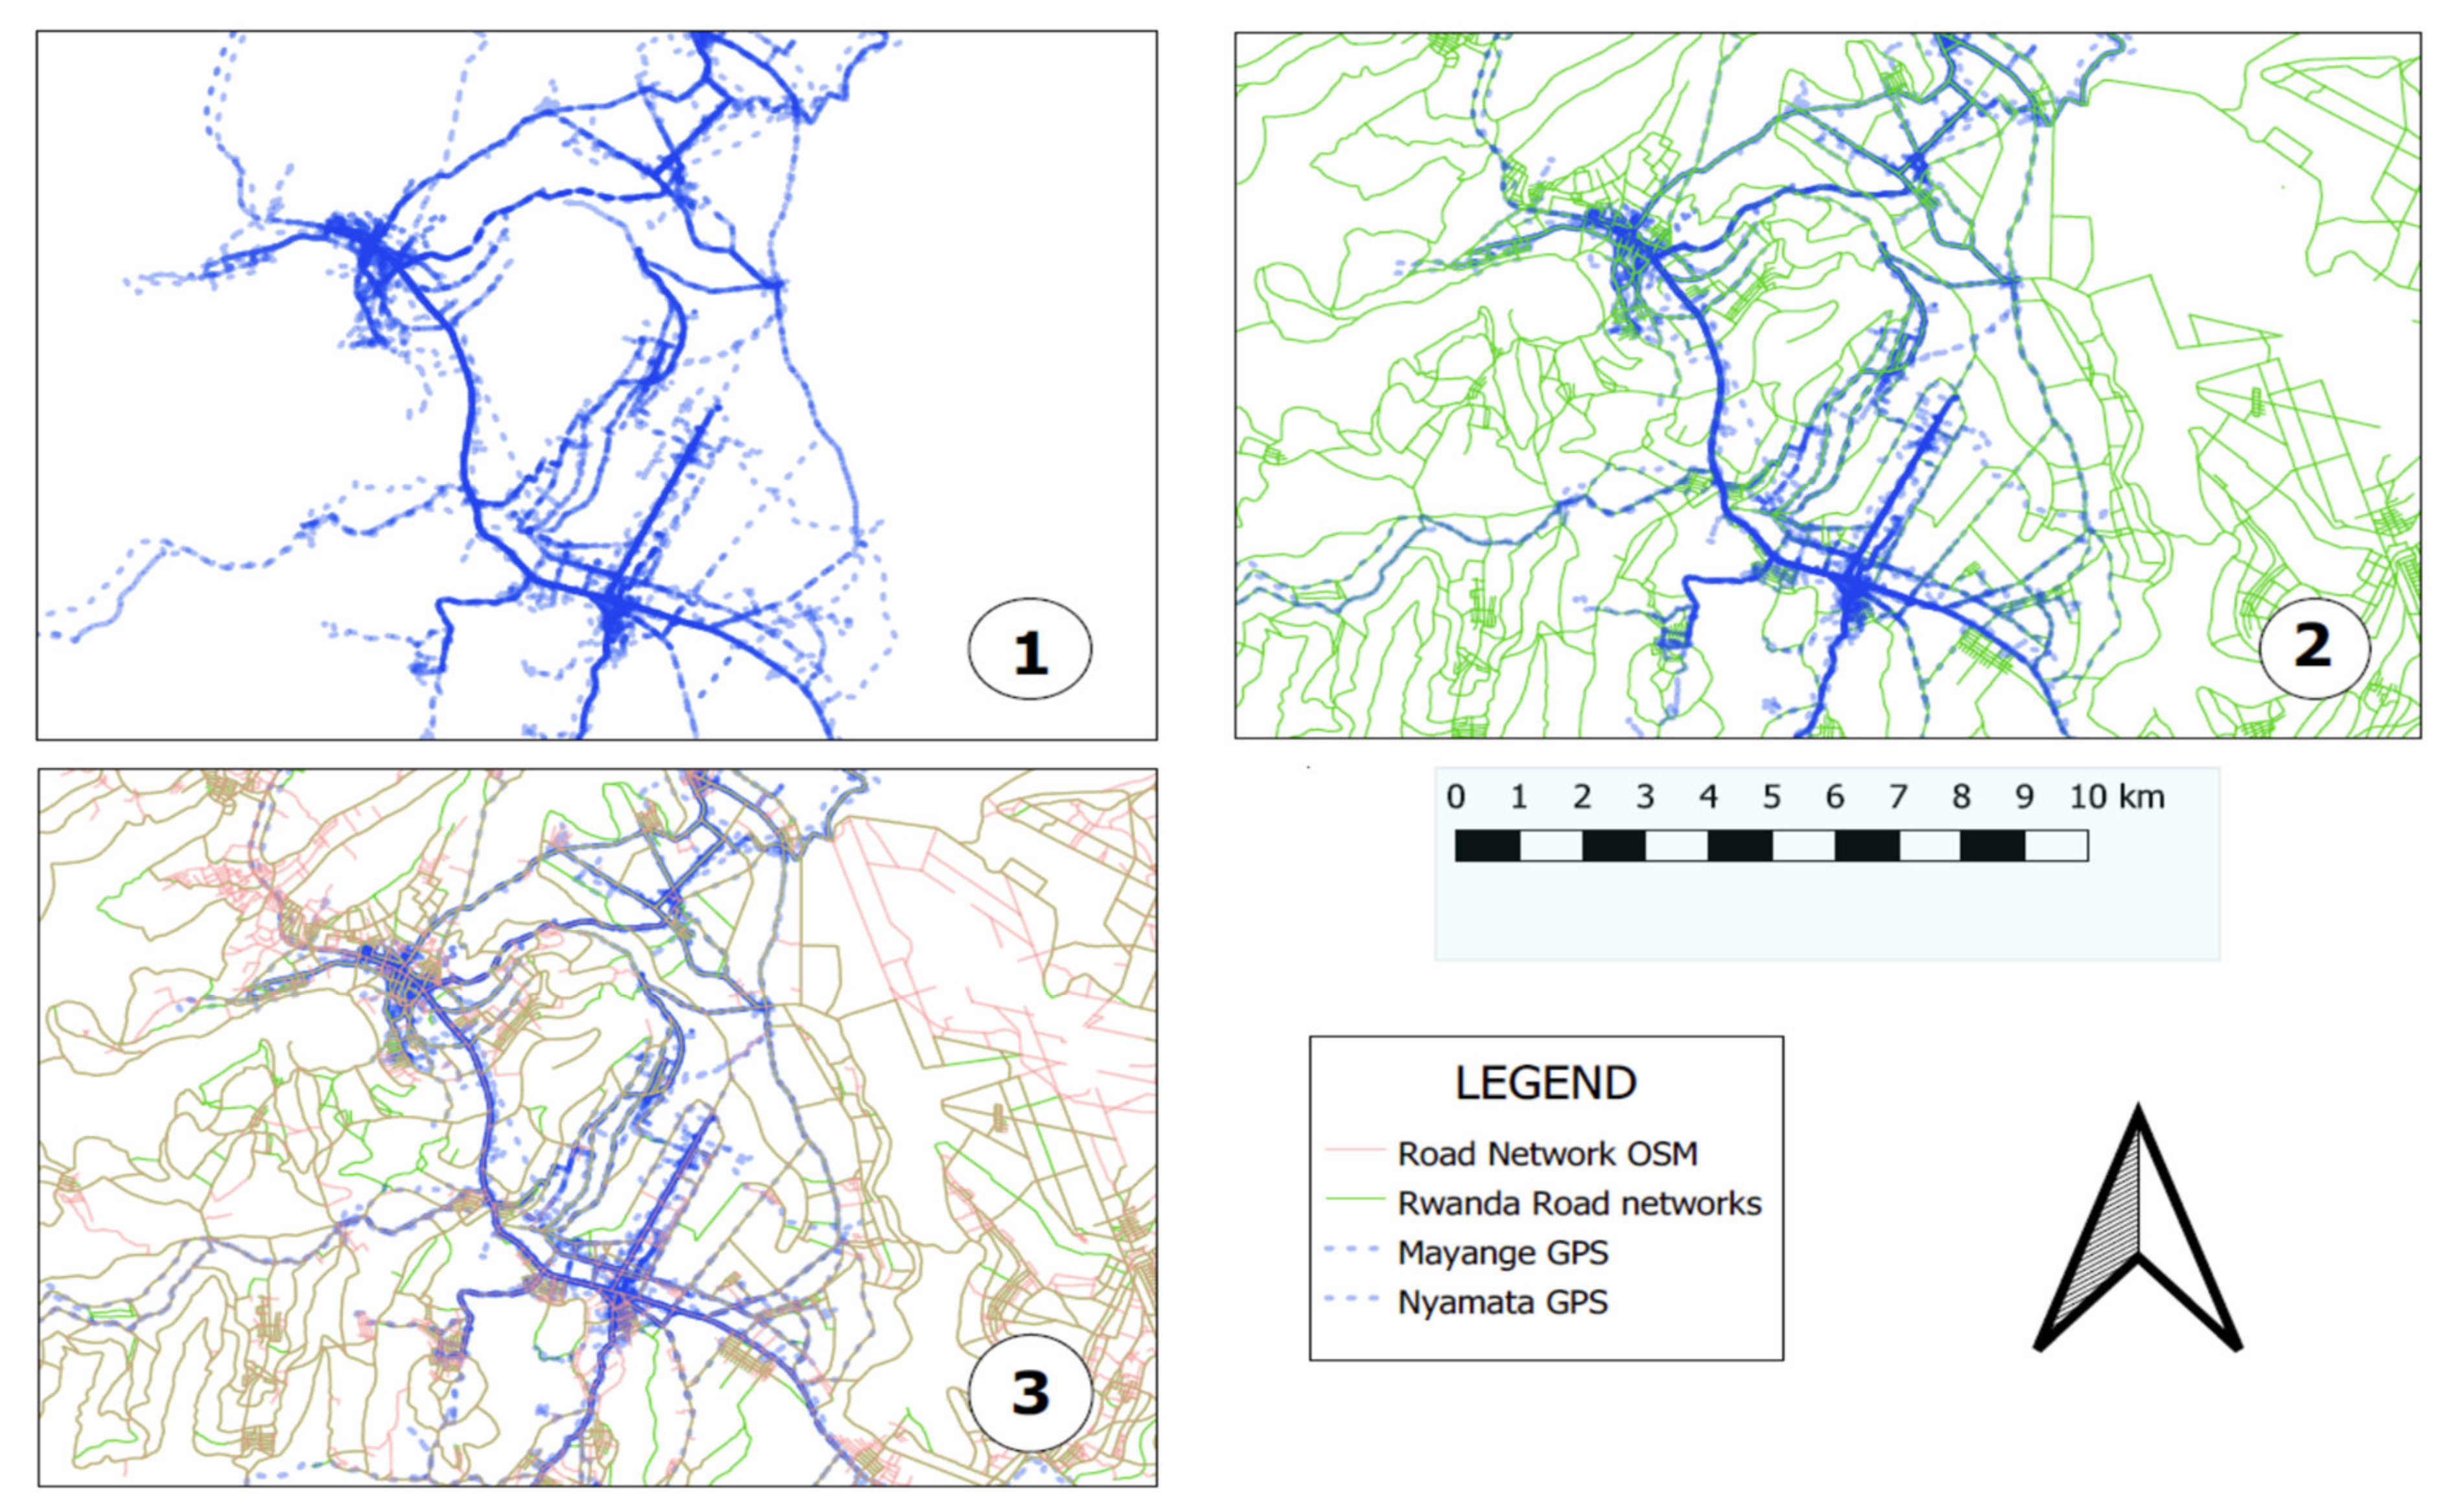
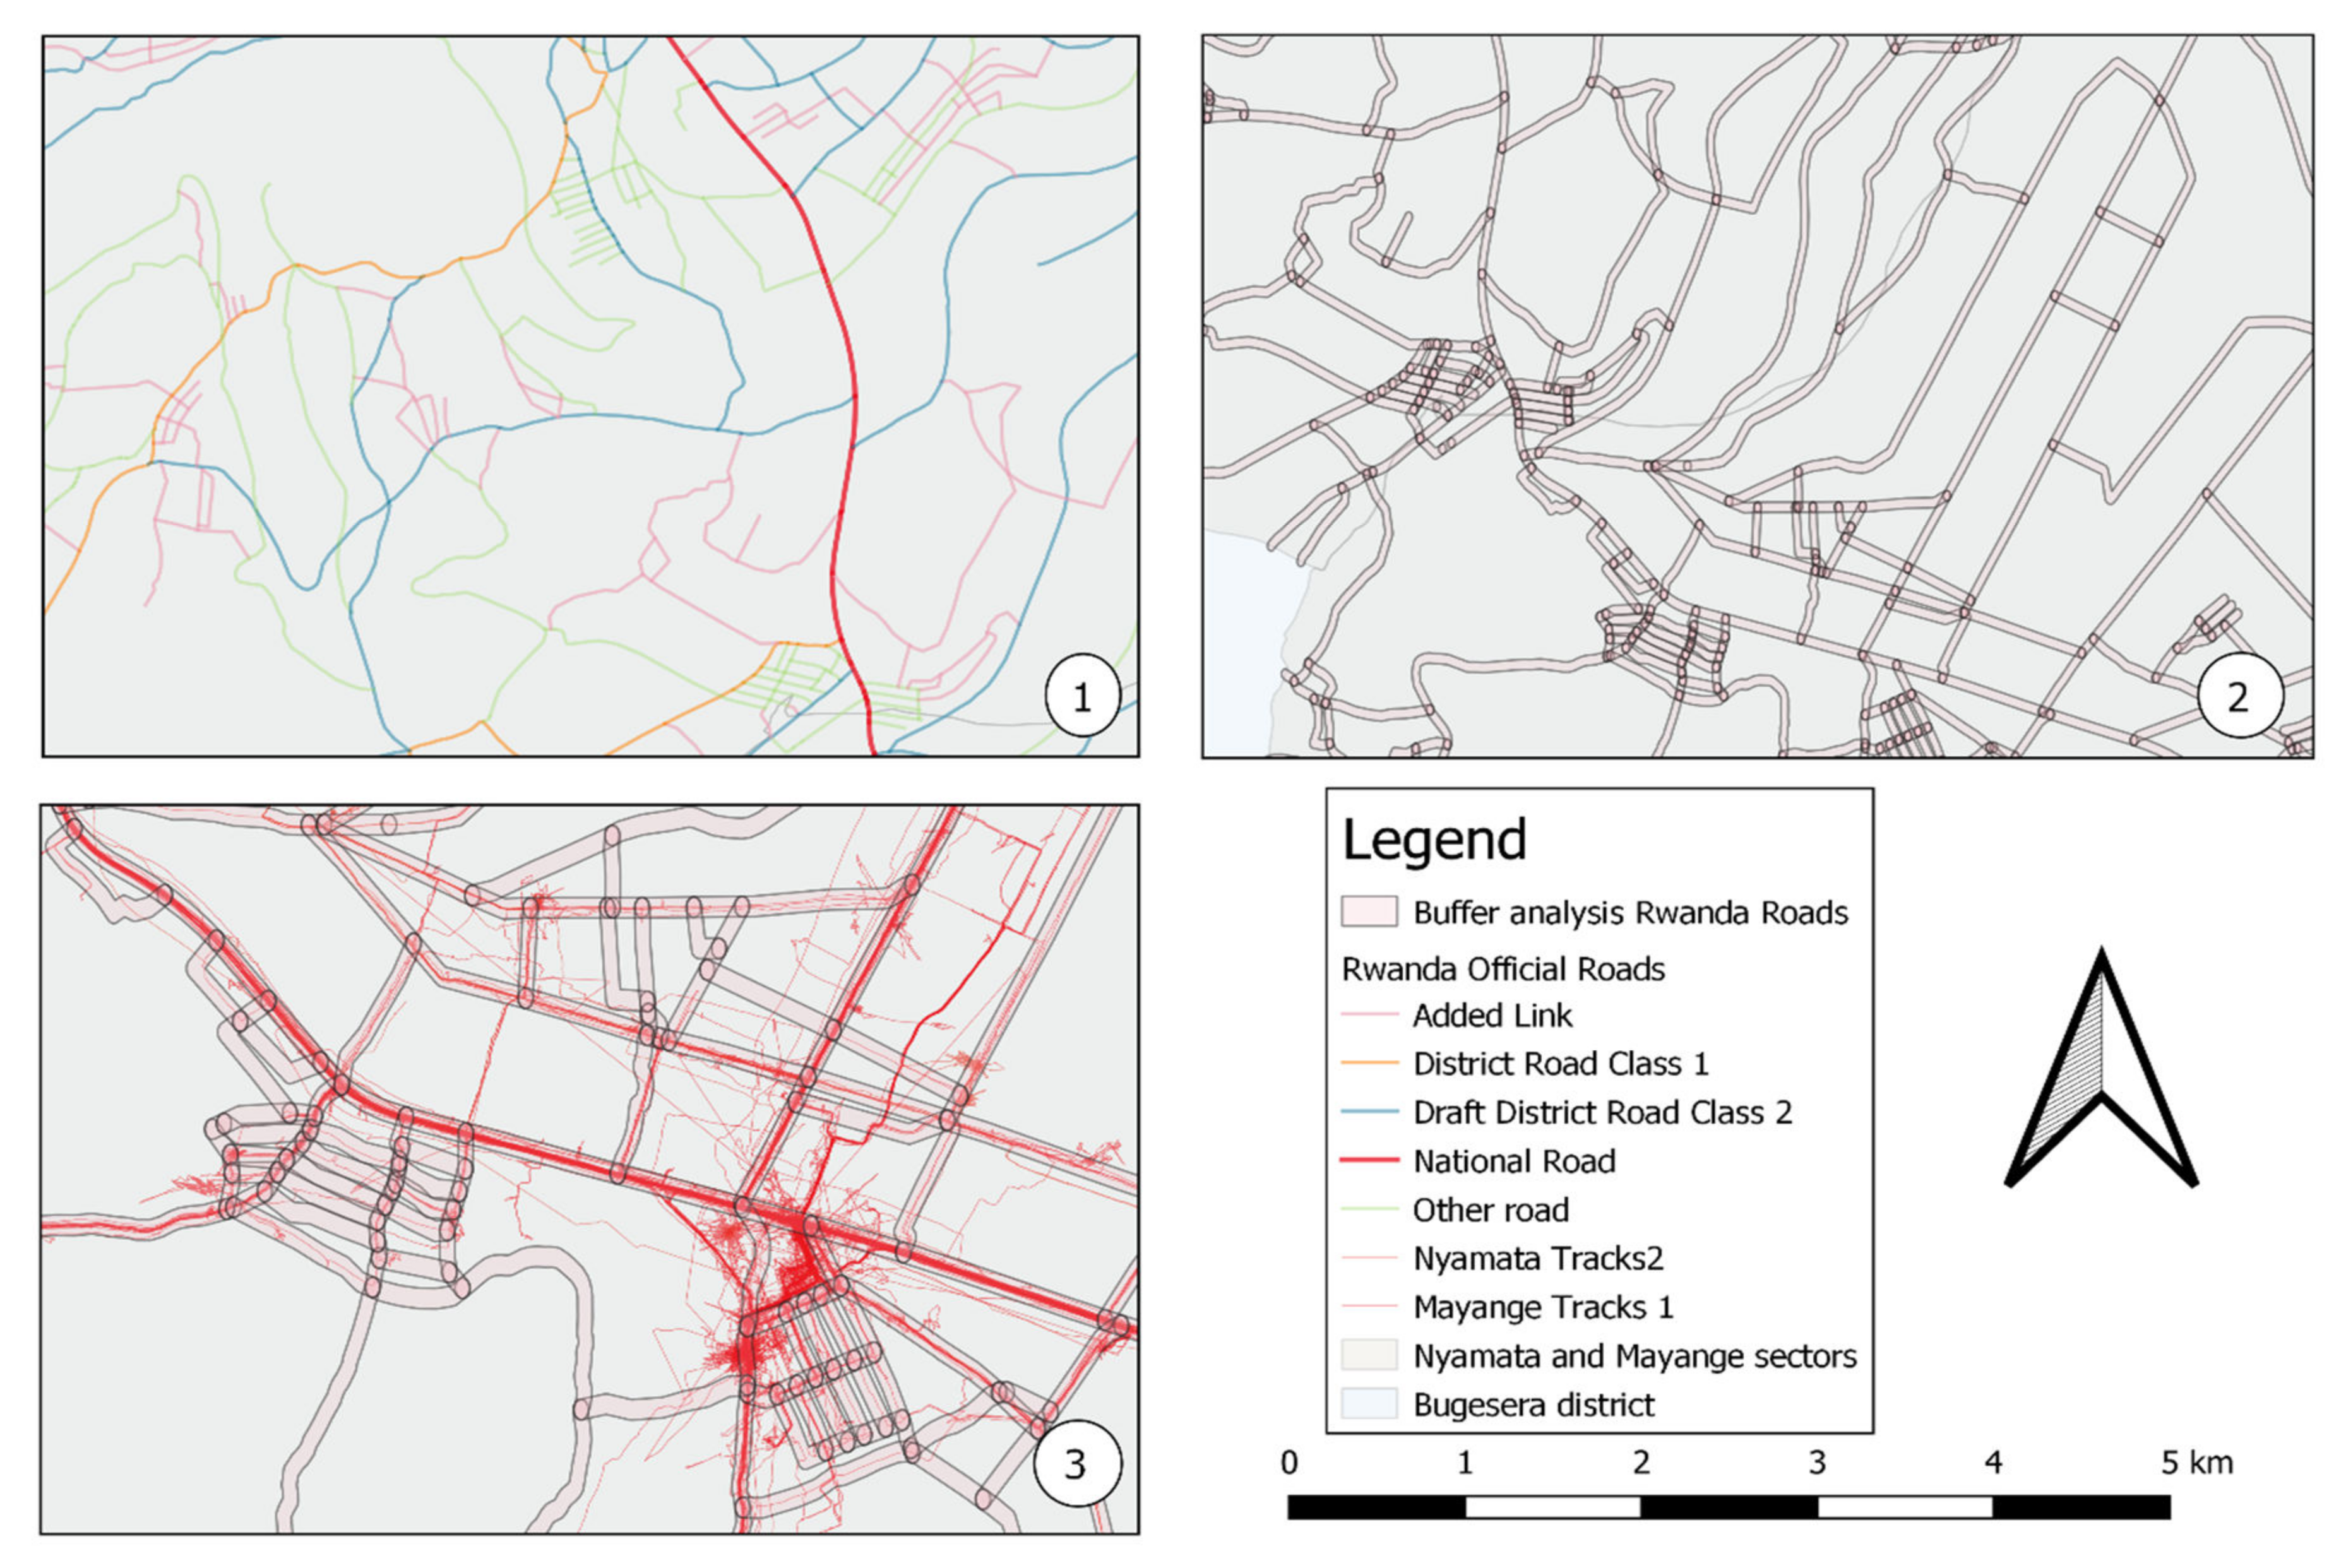
Mobility patterns consist of bicycle routes connecting two points. Using 50 GPS trackers, Map 1 (Figure 6) highlight the bicycle mobility patterns in the Nyamata and Mayange. In addition, the study compared the collected bicycle tracks with open-source data from OSM and the road network data from the Rwanda Transport Development Agency (RTDA). The maps in Figure 6 also reveal mobility patterns in the Nyamata and Mayange GPS tracks (blue lines), aligned with OSM and the Rwandan network, as well as autonomous tracks (from unidentified roads), as highlighted in Maps 2 and 3 in Figure 6. Table 2 describes the symbology used in Figure 6.
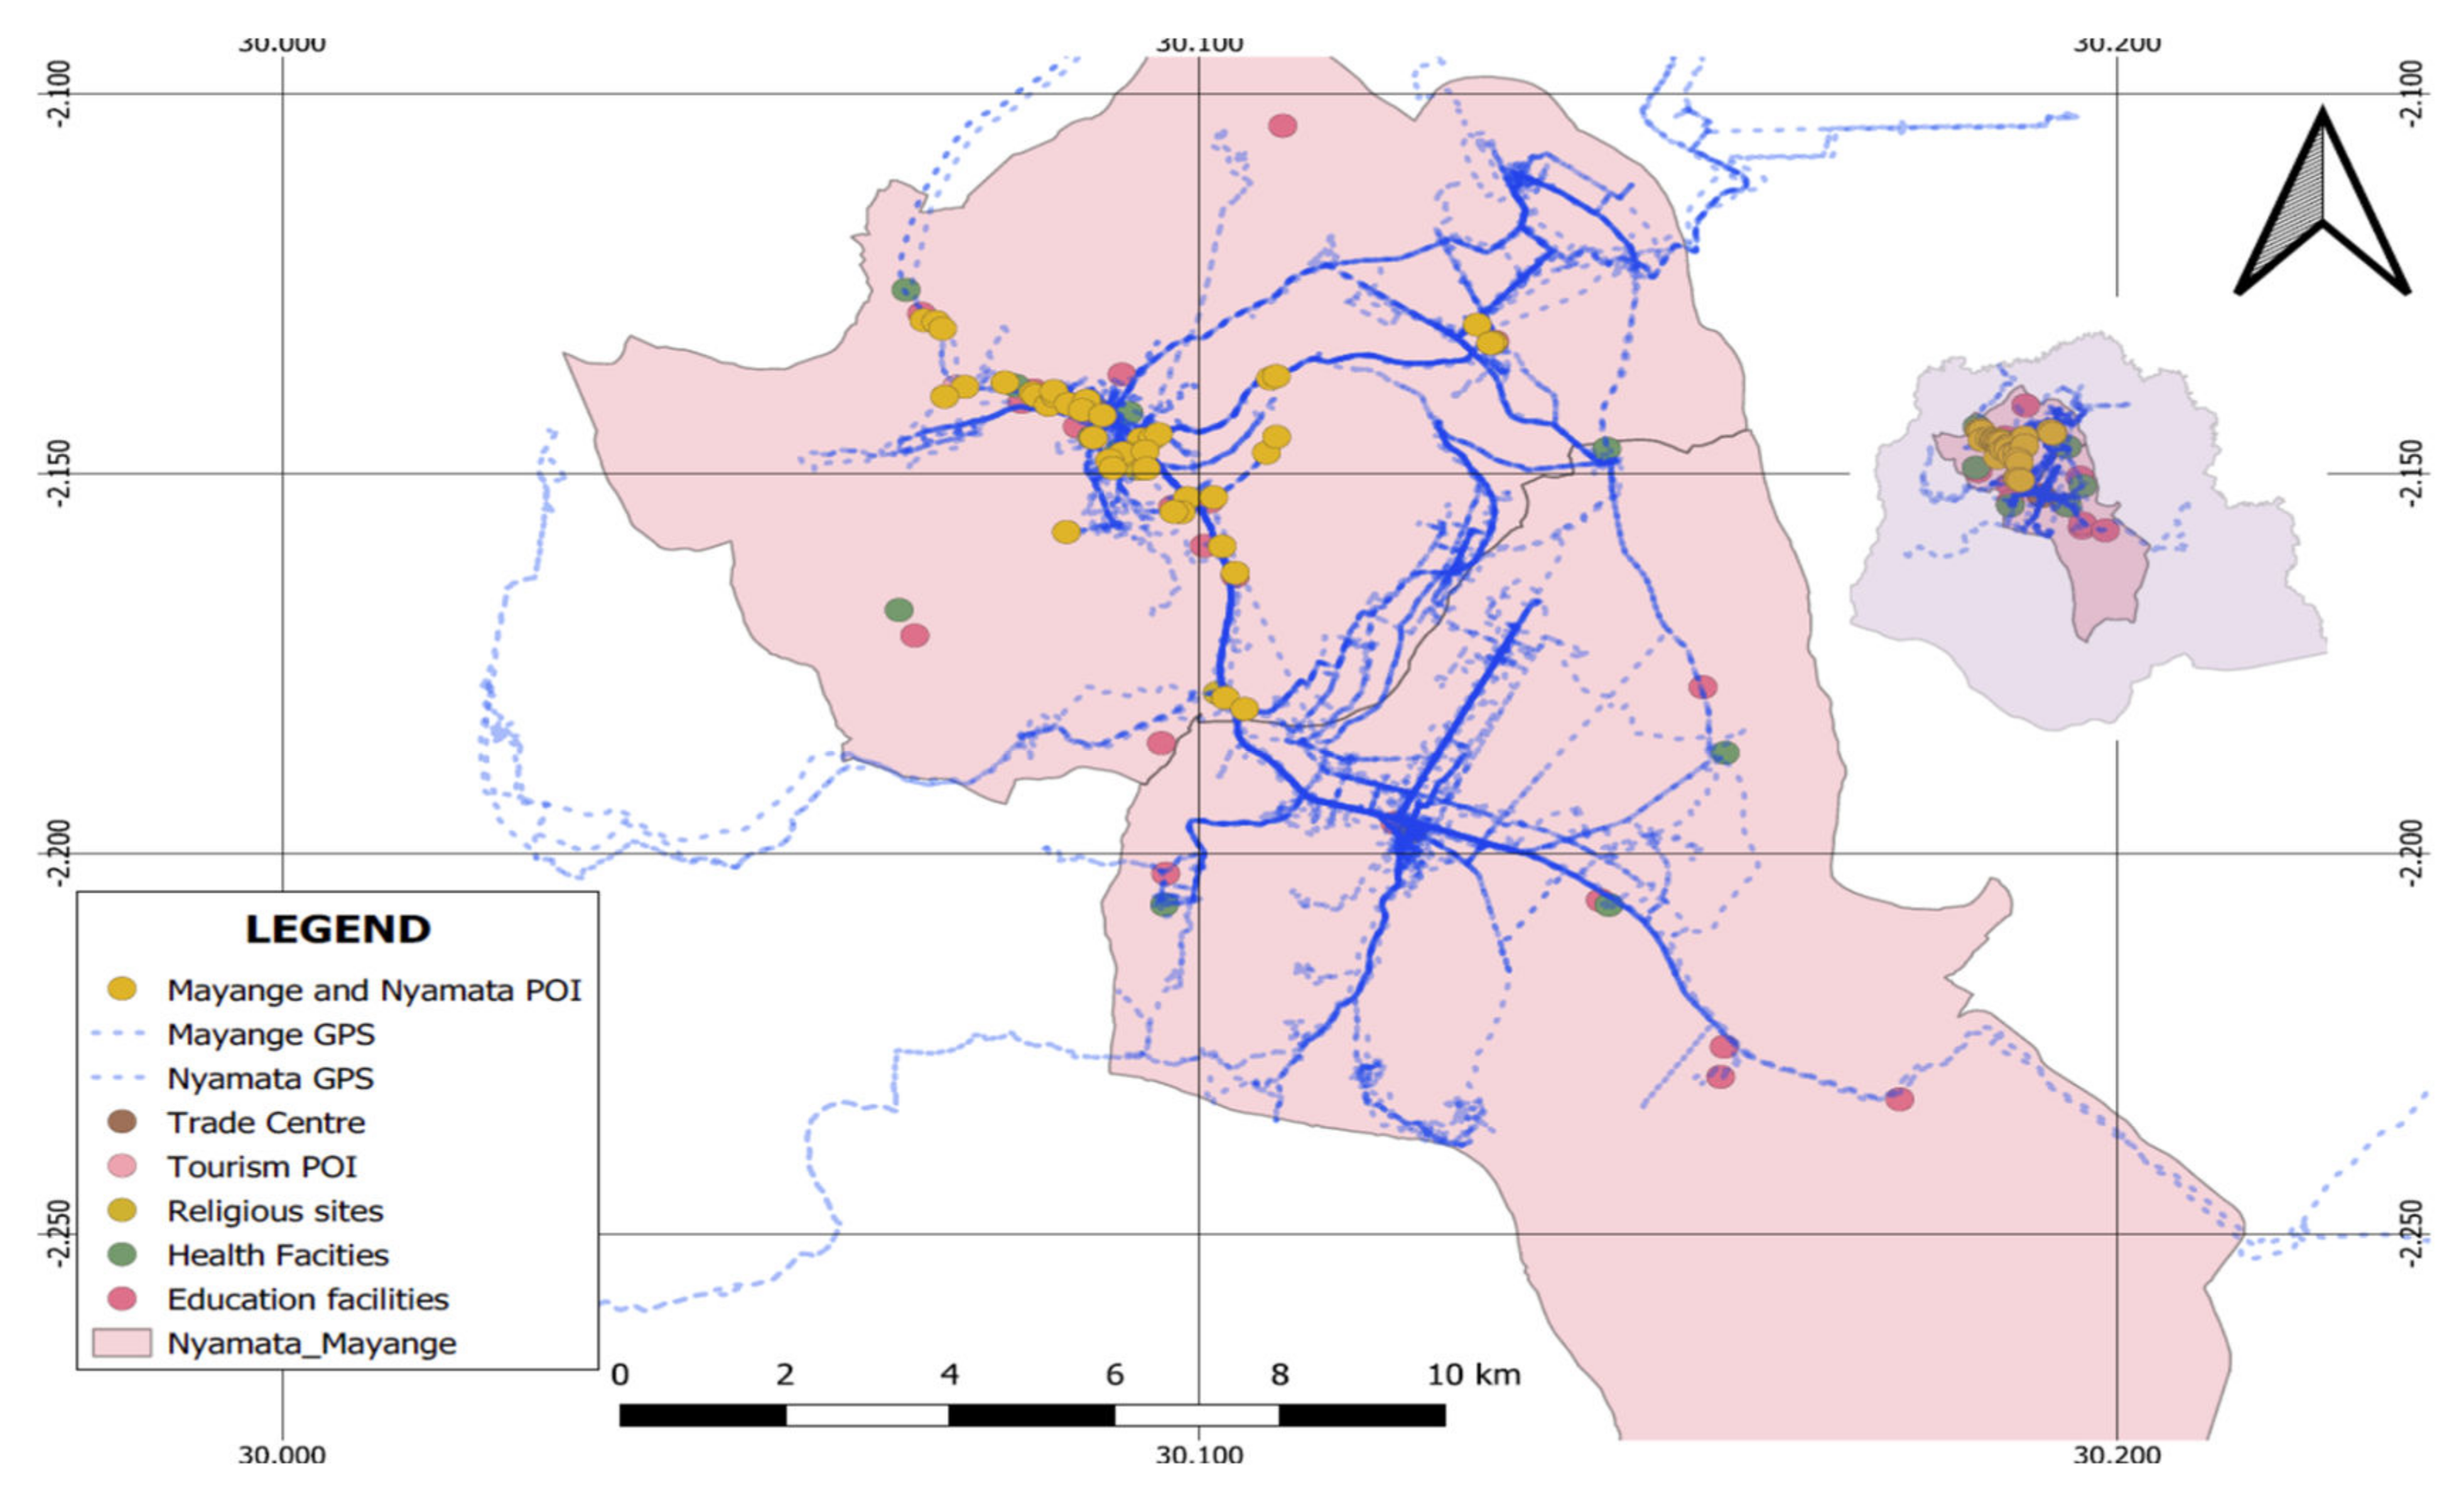
Due to limited rural access to public services, especially in sub-Saharan Africa, cycling mobility patterns are also linked to areas with higher social, educational, administrative, and economic activities. As for Nyamata and Mayange, the concentration of the most significant mobility patterns is along a portion of the national road where most activities are conducted (Figure 7).
The study conducted further analysis shown in Figure 8 to identify road types and their impact on mobility patterns.
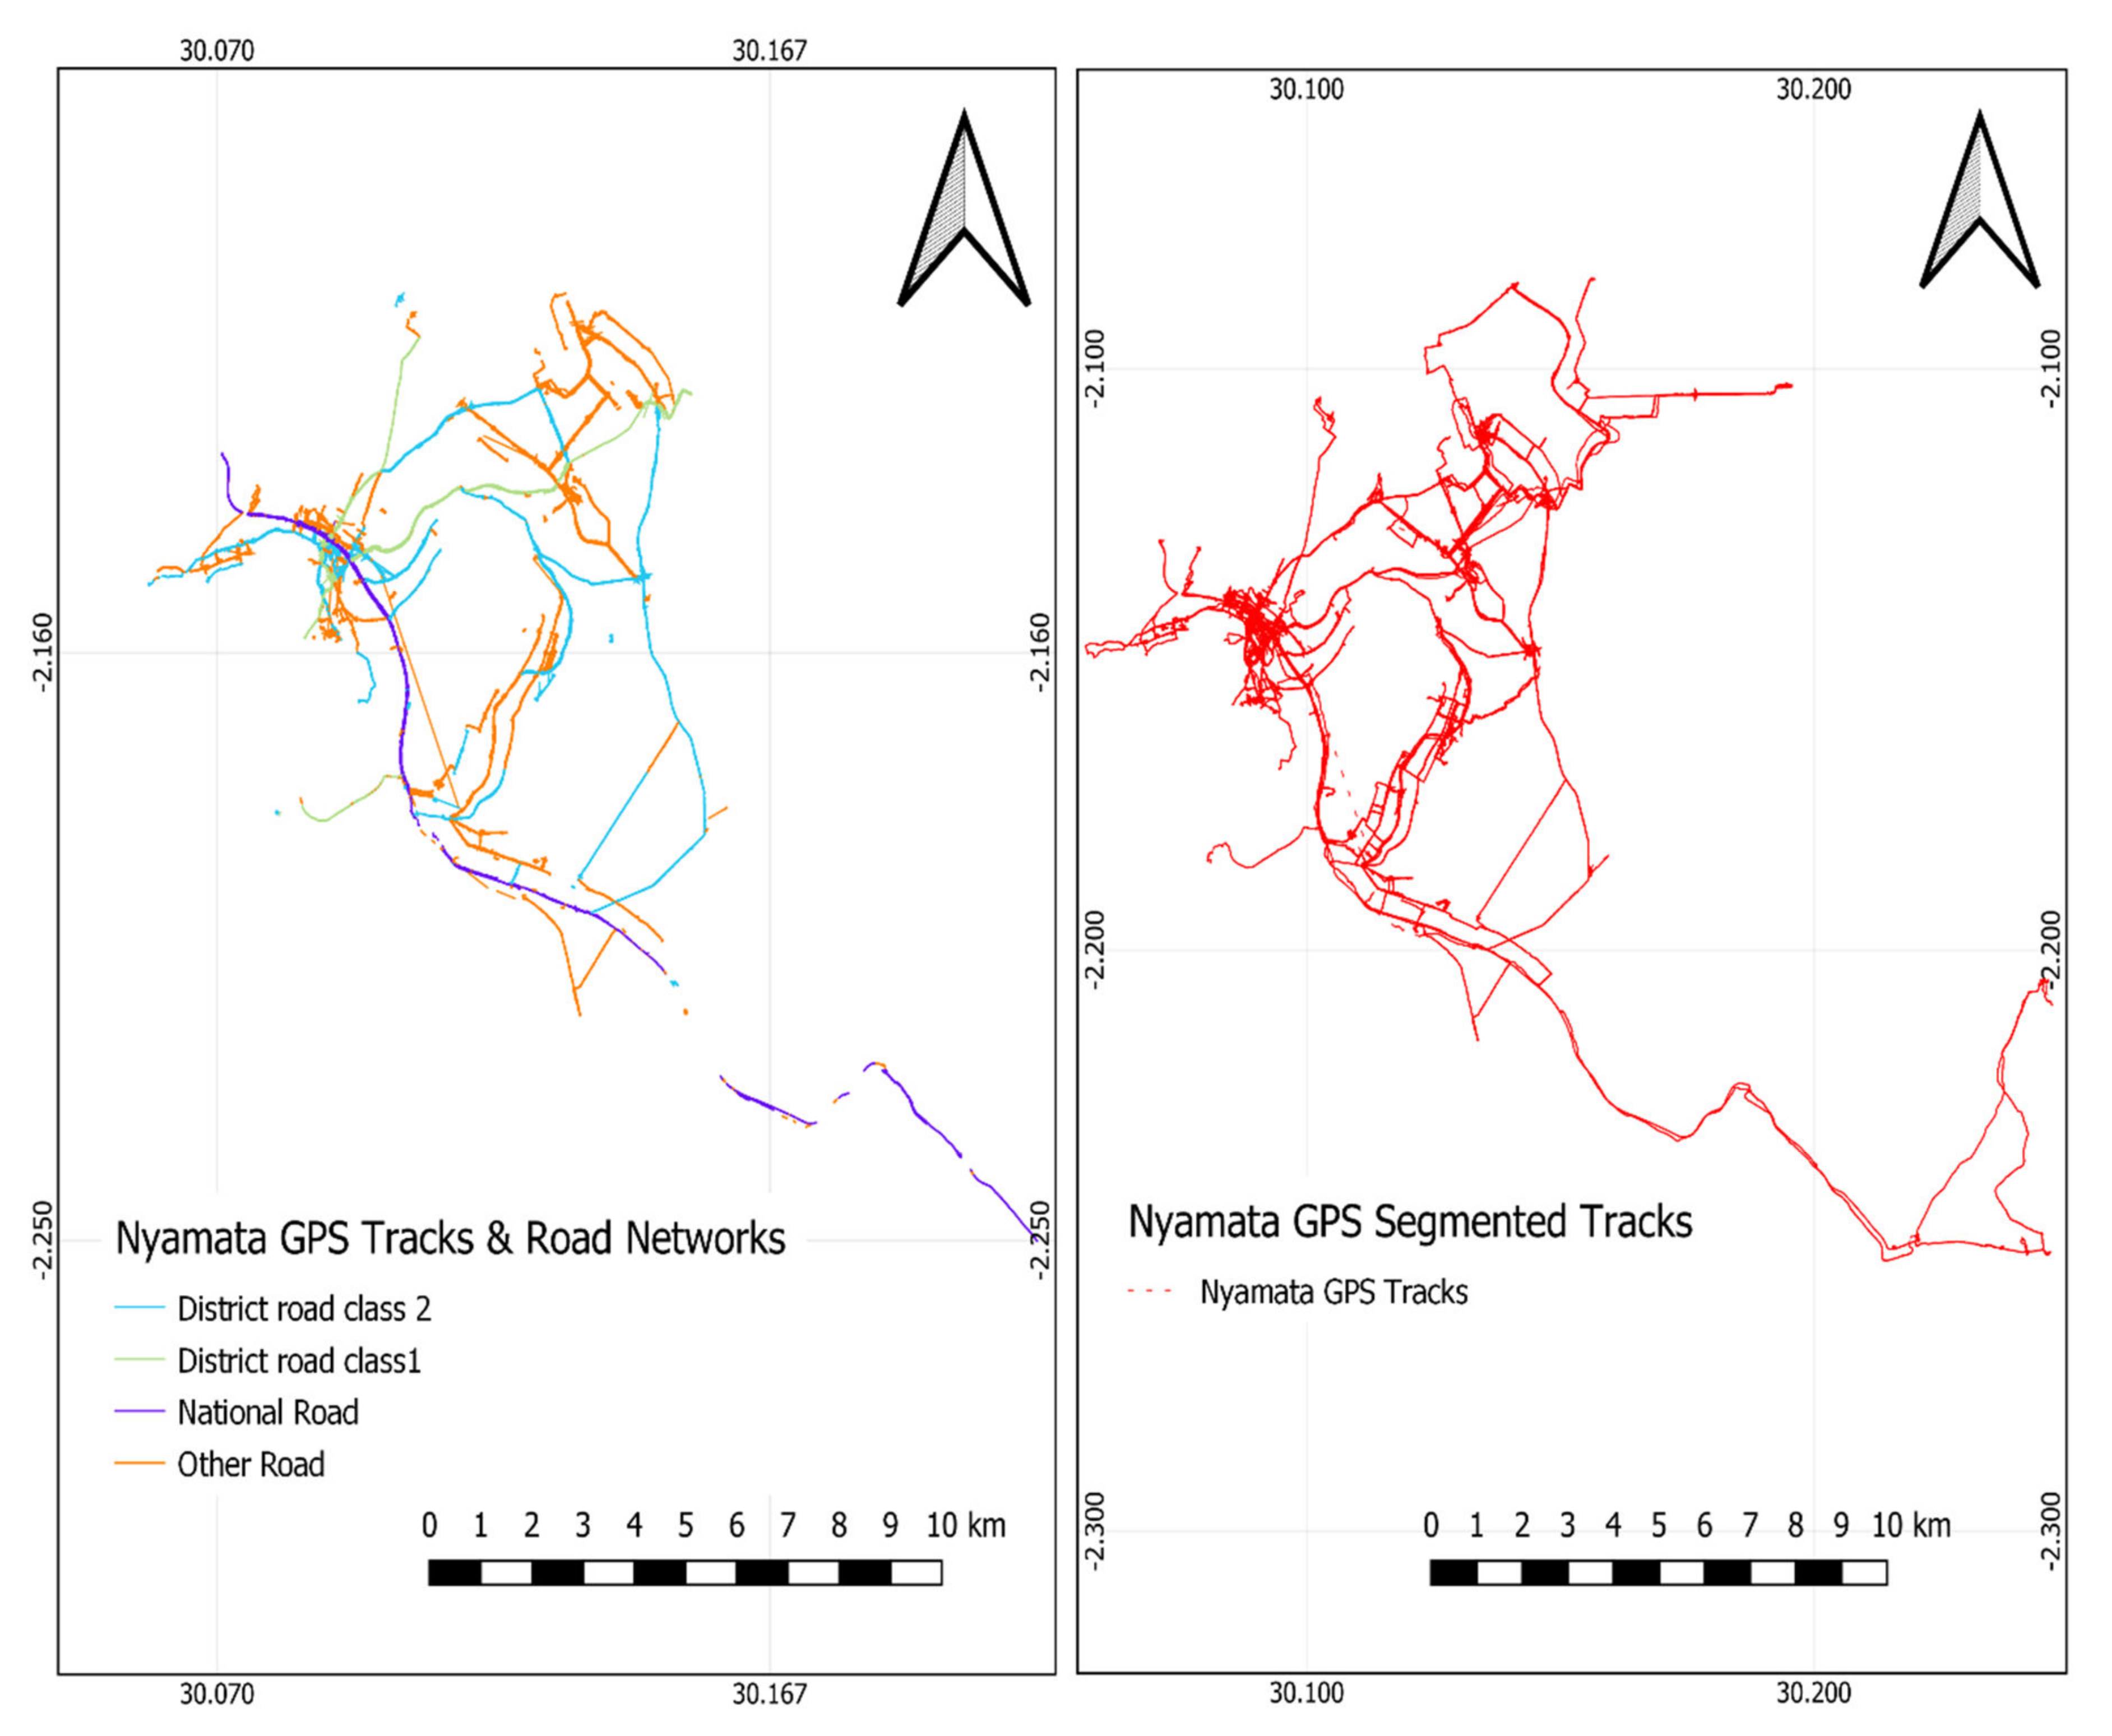
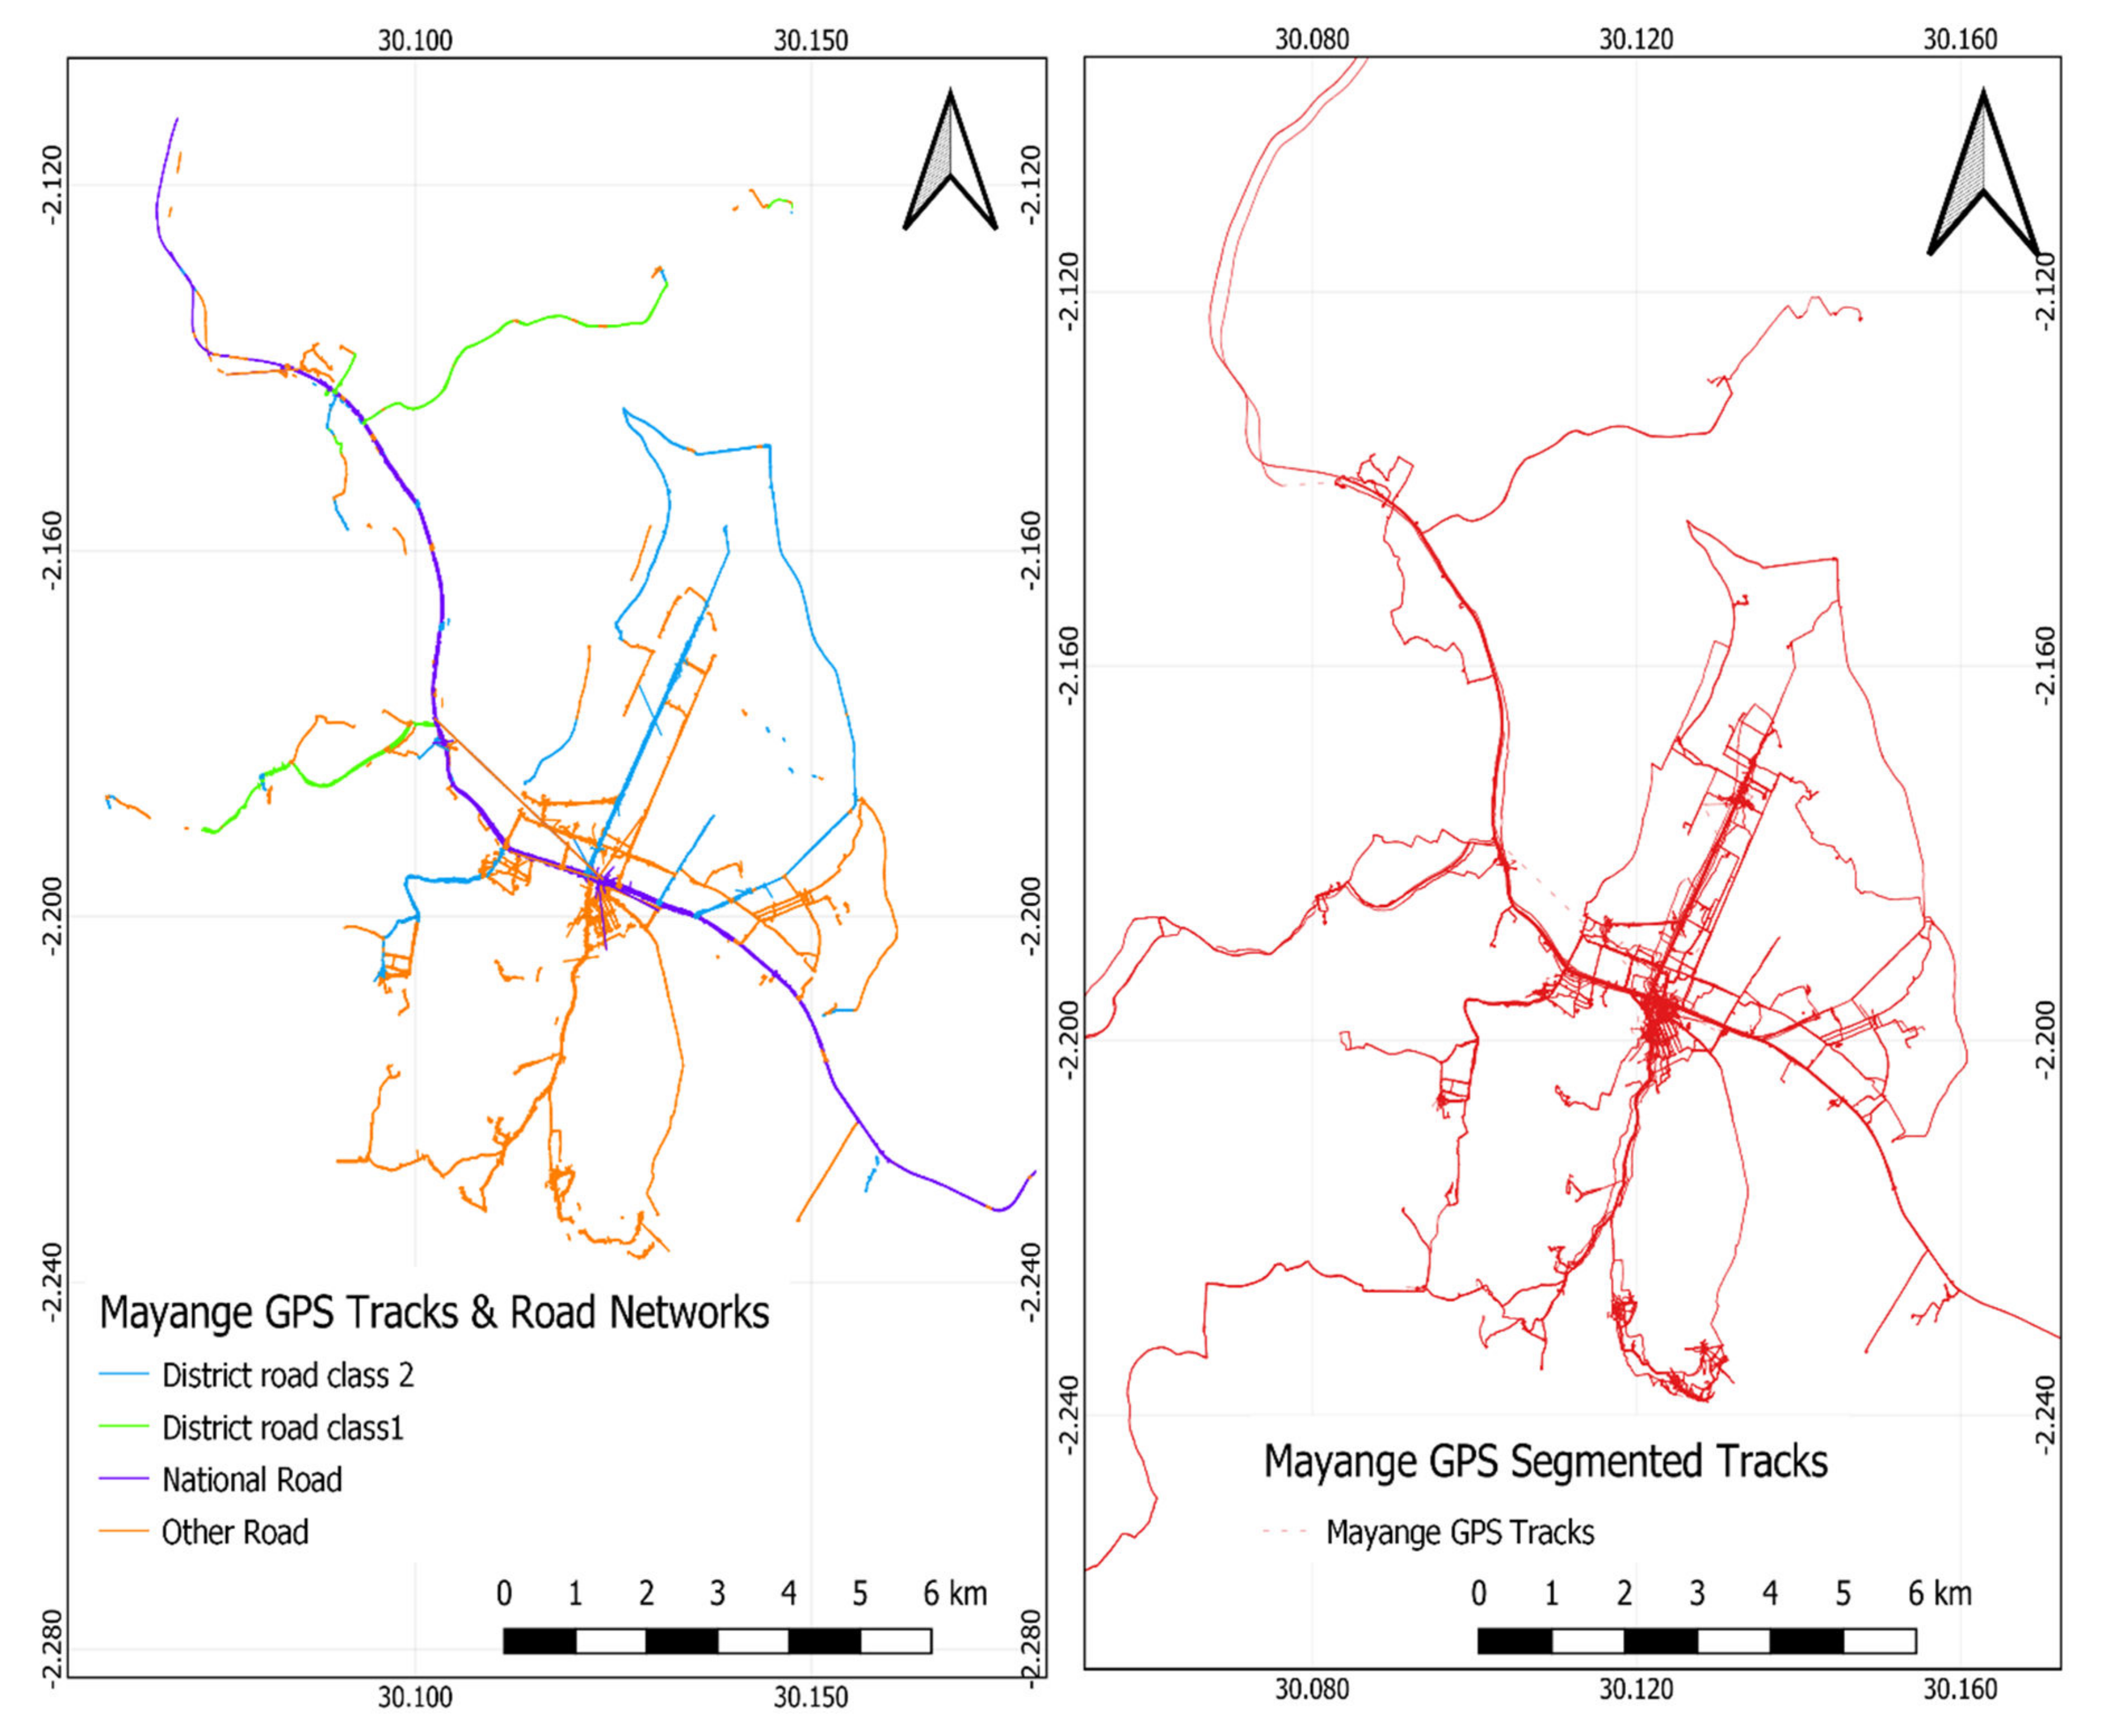
The data on the Rwandan road networks in the Bugesera areas (as shown in Map 1 of Figure 8) is composed of four types of roads (national road, class 1 district roads, class 2 district roads, and other roads) plus the “added links” (unofficial roads). Considering the average accuracy of GPS signals of about 7.8 m under perfect conditions, the study performed a buffer analysis of 30 m for each official road segment in Rwanda (Map 2 in Figure 8). By selecting the two merged GPS tracks (Nyamata and Mayange) with the buffer analyzed from the official Rwanda road networks (as shown in Map 3 of Figure 8), the figure indicates whether the GPS tracks fall on the official roads or not. In addition, Figure 9 shows that the segmented merged GPS tracks collected from Nyamata joined the official Rwanda road data buffer. The goal was to highlight the mobility of cyclists (tracks) on official roads (with all the road type symbologies) and one on unofficial roads (blank). Similar geoprocessing was executed in Mayange (see Figure 10), revealing parallel road GPS tracks that fall under the existing official road networks and those that are not (blank).
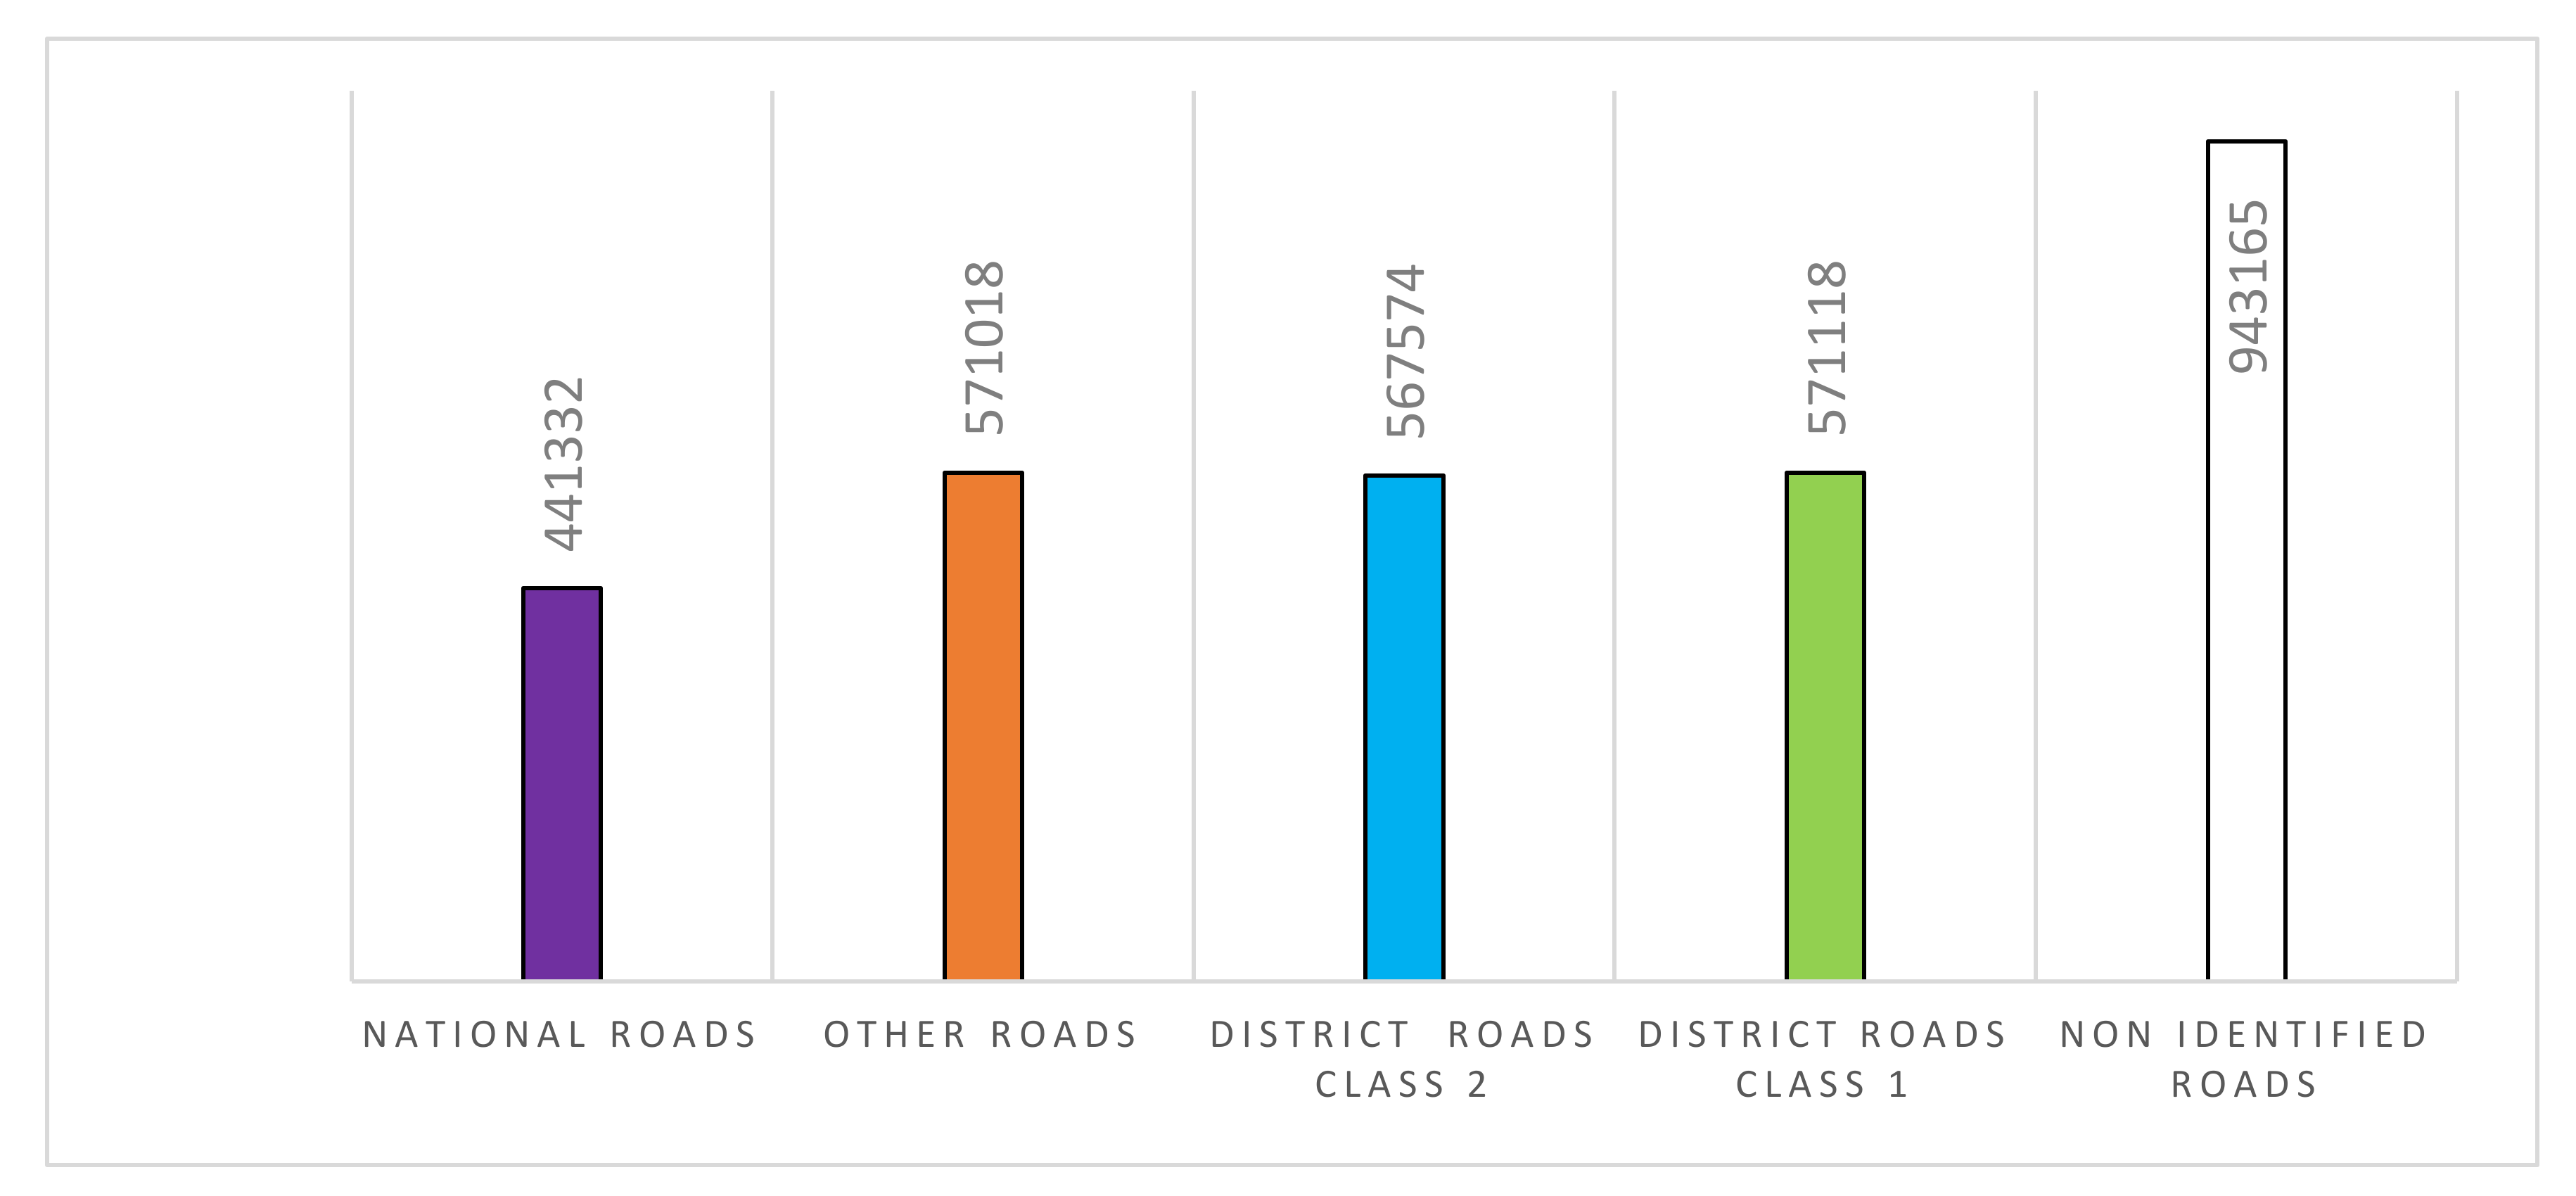
Figure 9 and Figure 10 show that there are roads used by cyclists but are not official roads listed on the official Rwanda networks or OSM. In Nyamata, according to the GPS tracks collected, 30% of the routes used by cyclists are roads not listed by the Rwanda Transport Development Agency (RTDA). In contrast, the remaining 70% are official roads (national roads, other roads, district roads class 1, district roads class 2) (Figure 11).
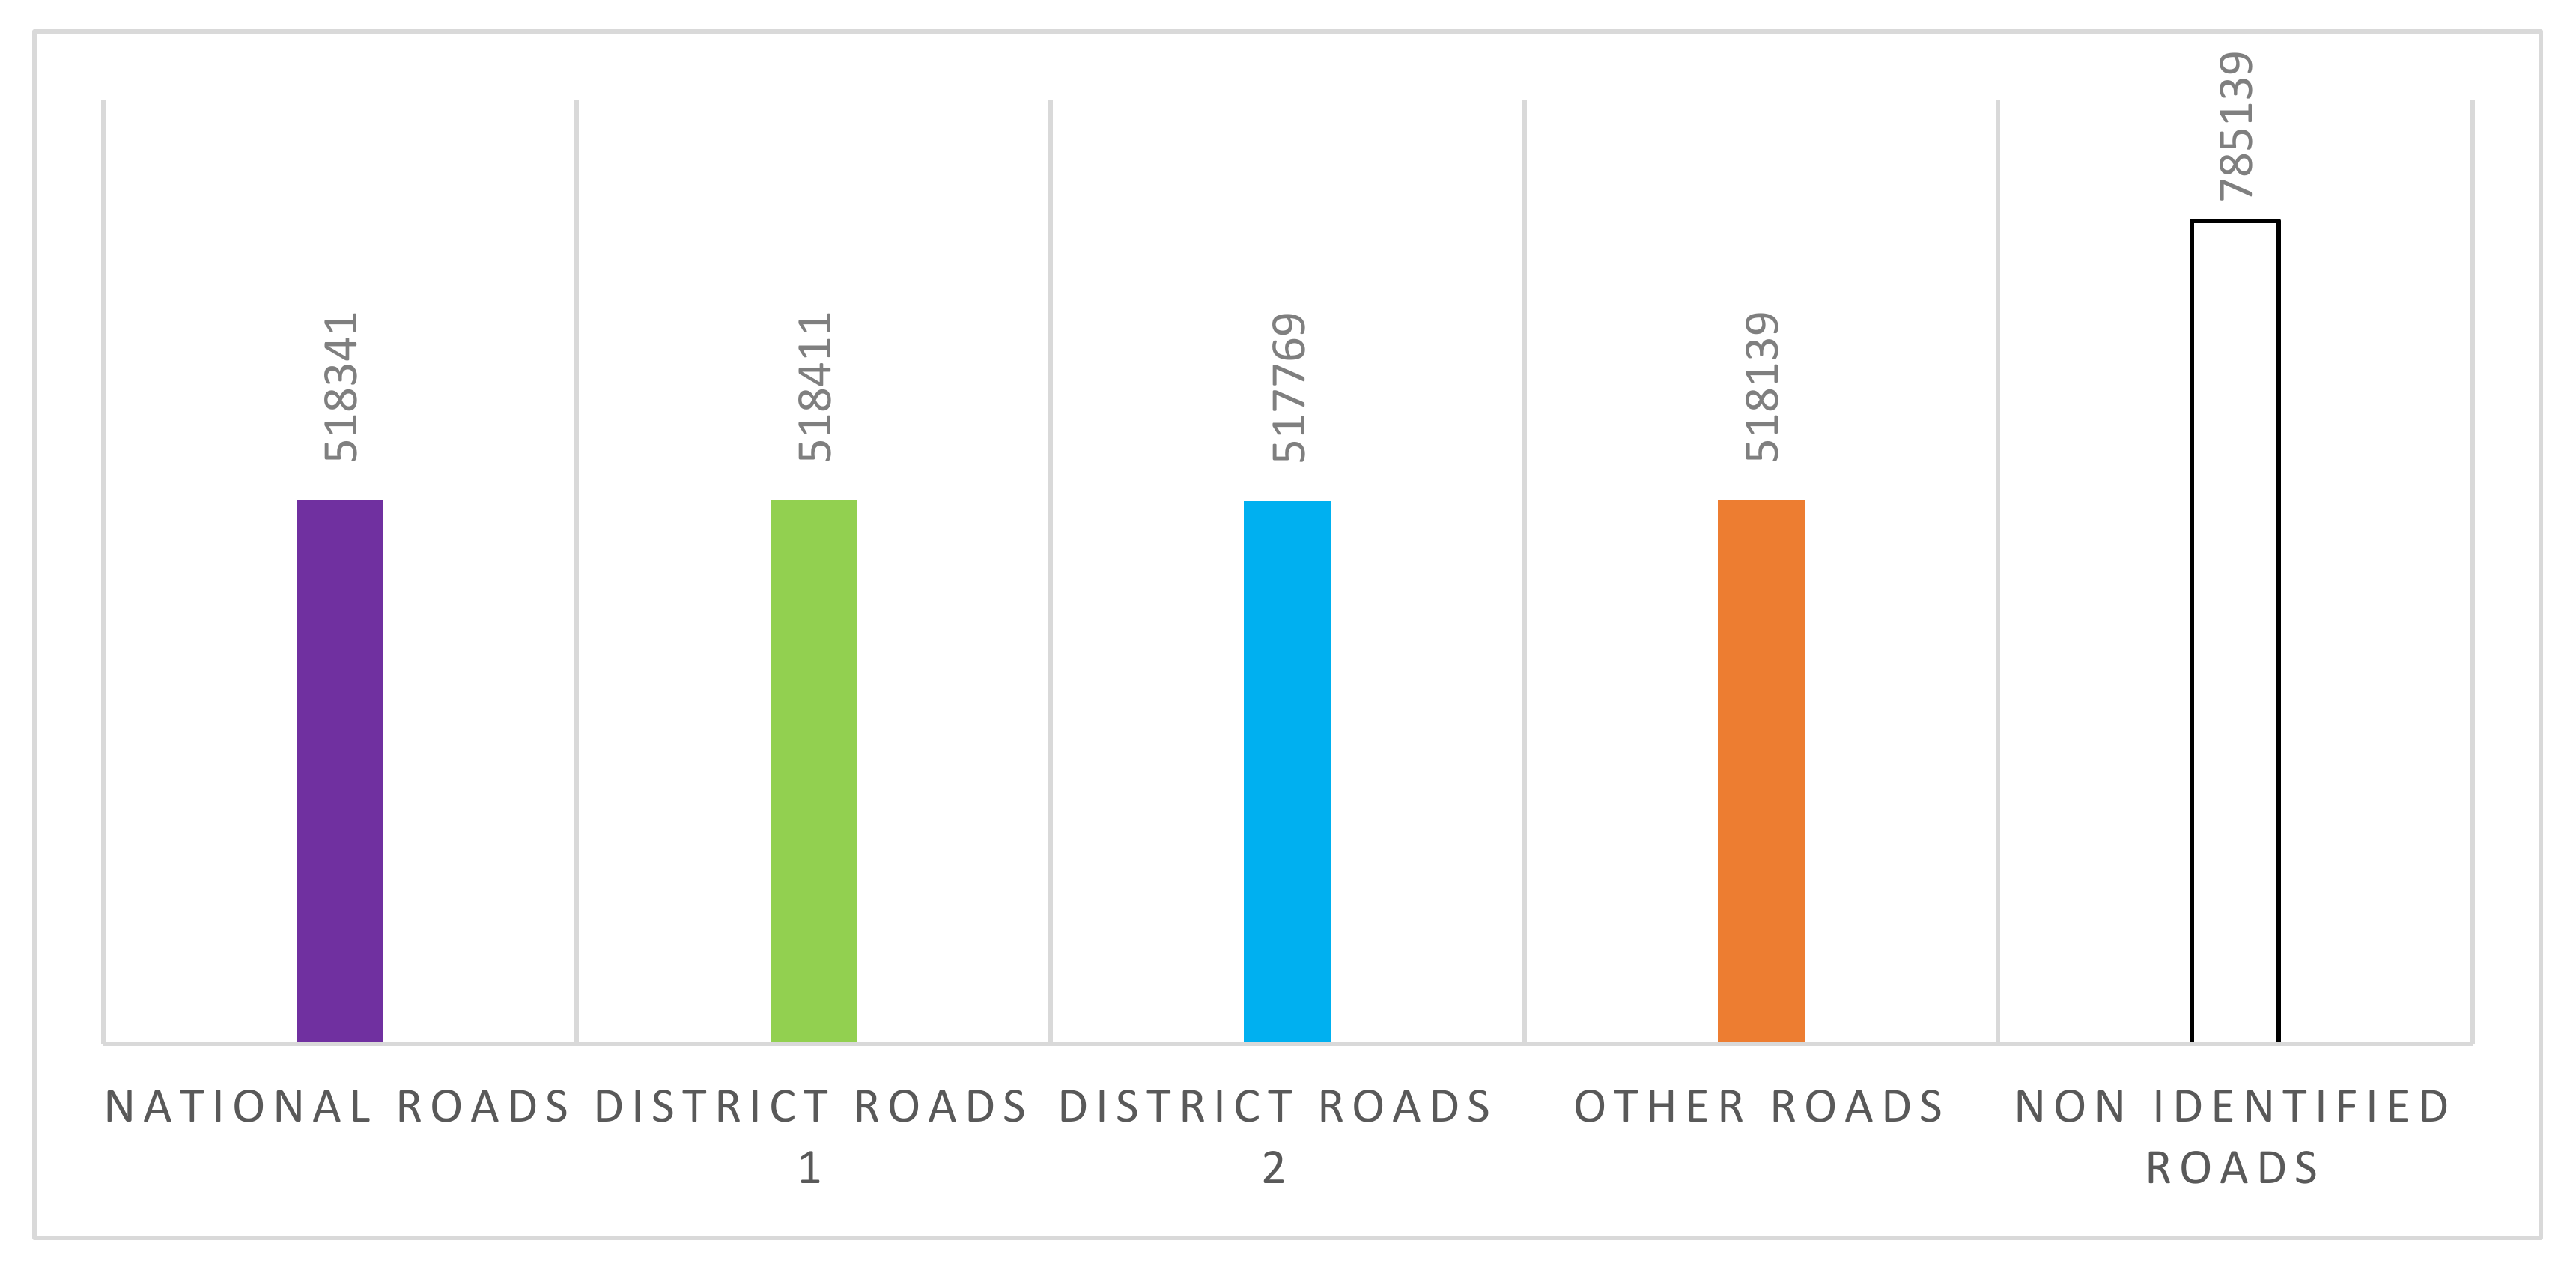
Similarly, 38% of the GPS road segments collected in Mayange (Figure 12) were from unofficial roads (unidentified roads), while 62% were from official roads (national roads, other roads, district roads class 1, district roads class 2). The higher figure in unofficial road segments is explainable by Mayange being more rural than Nyamata, with fewer services provided in the area, leading to people improvising shorter routes to travel to the main town located in Nyamata.
5.2. Raster Data Analysis
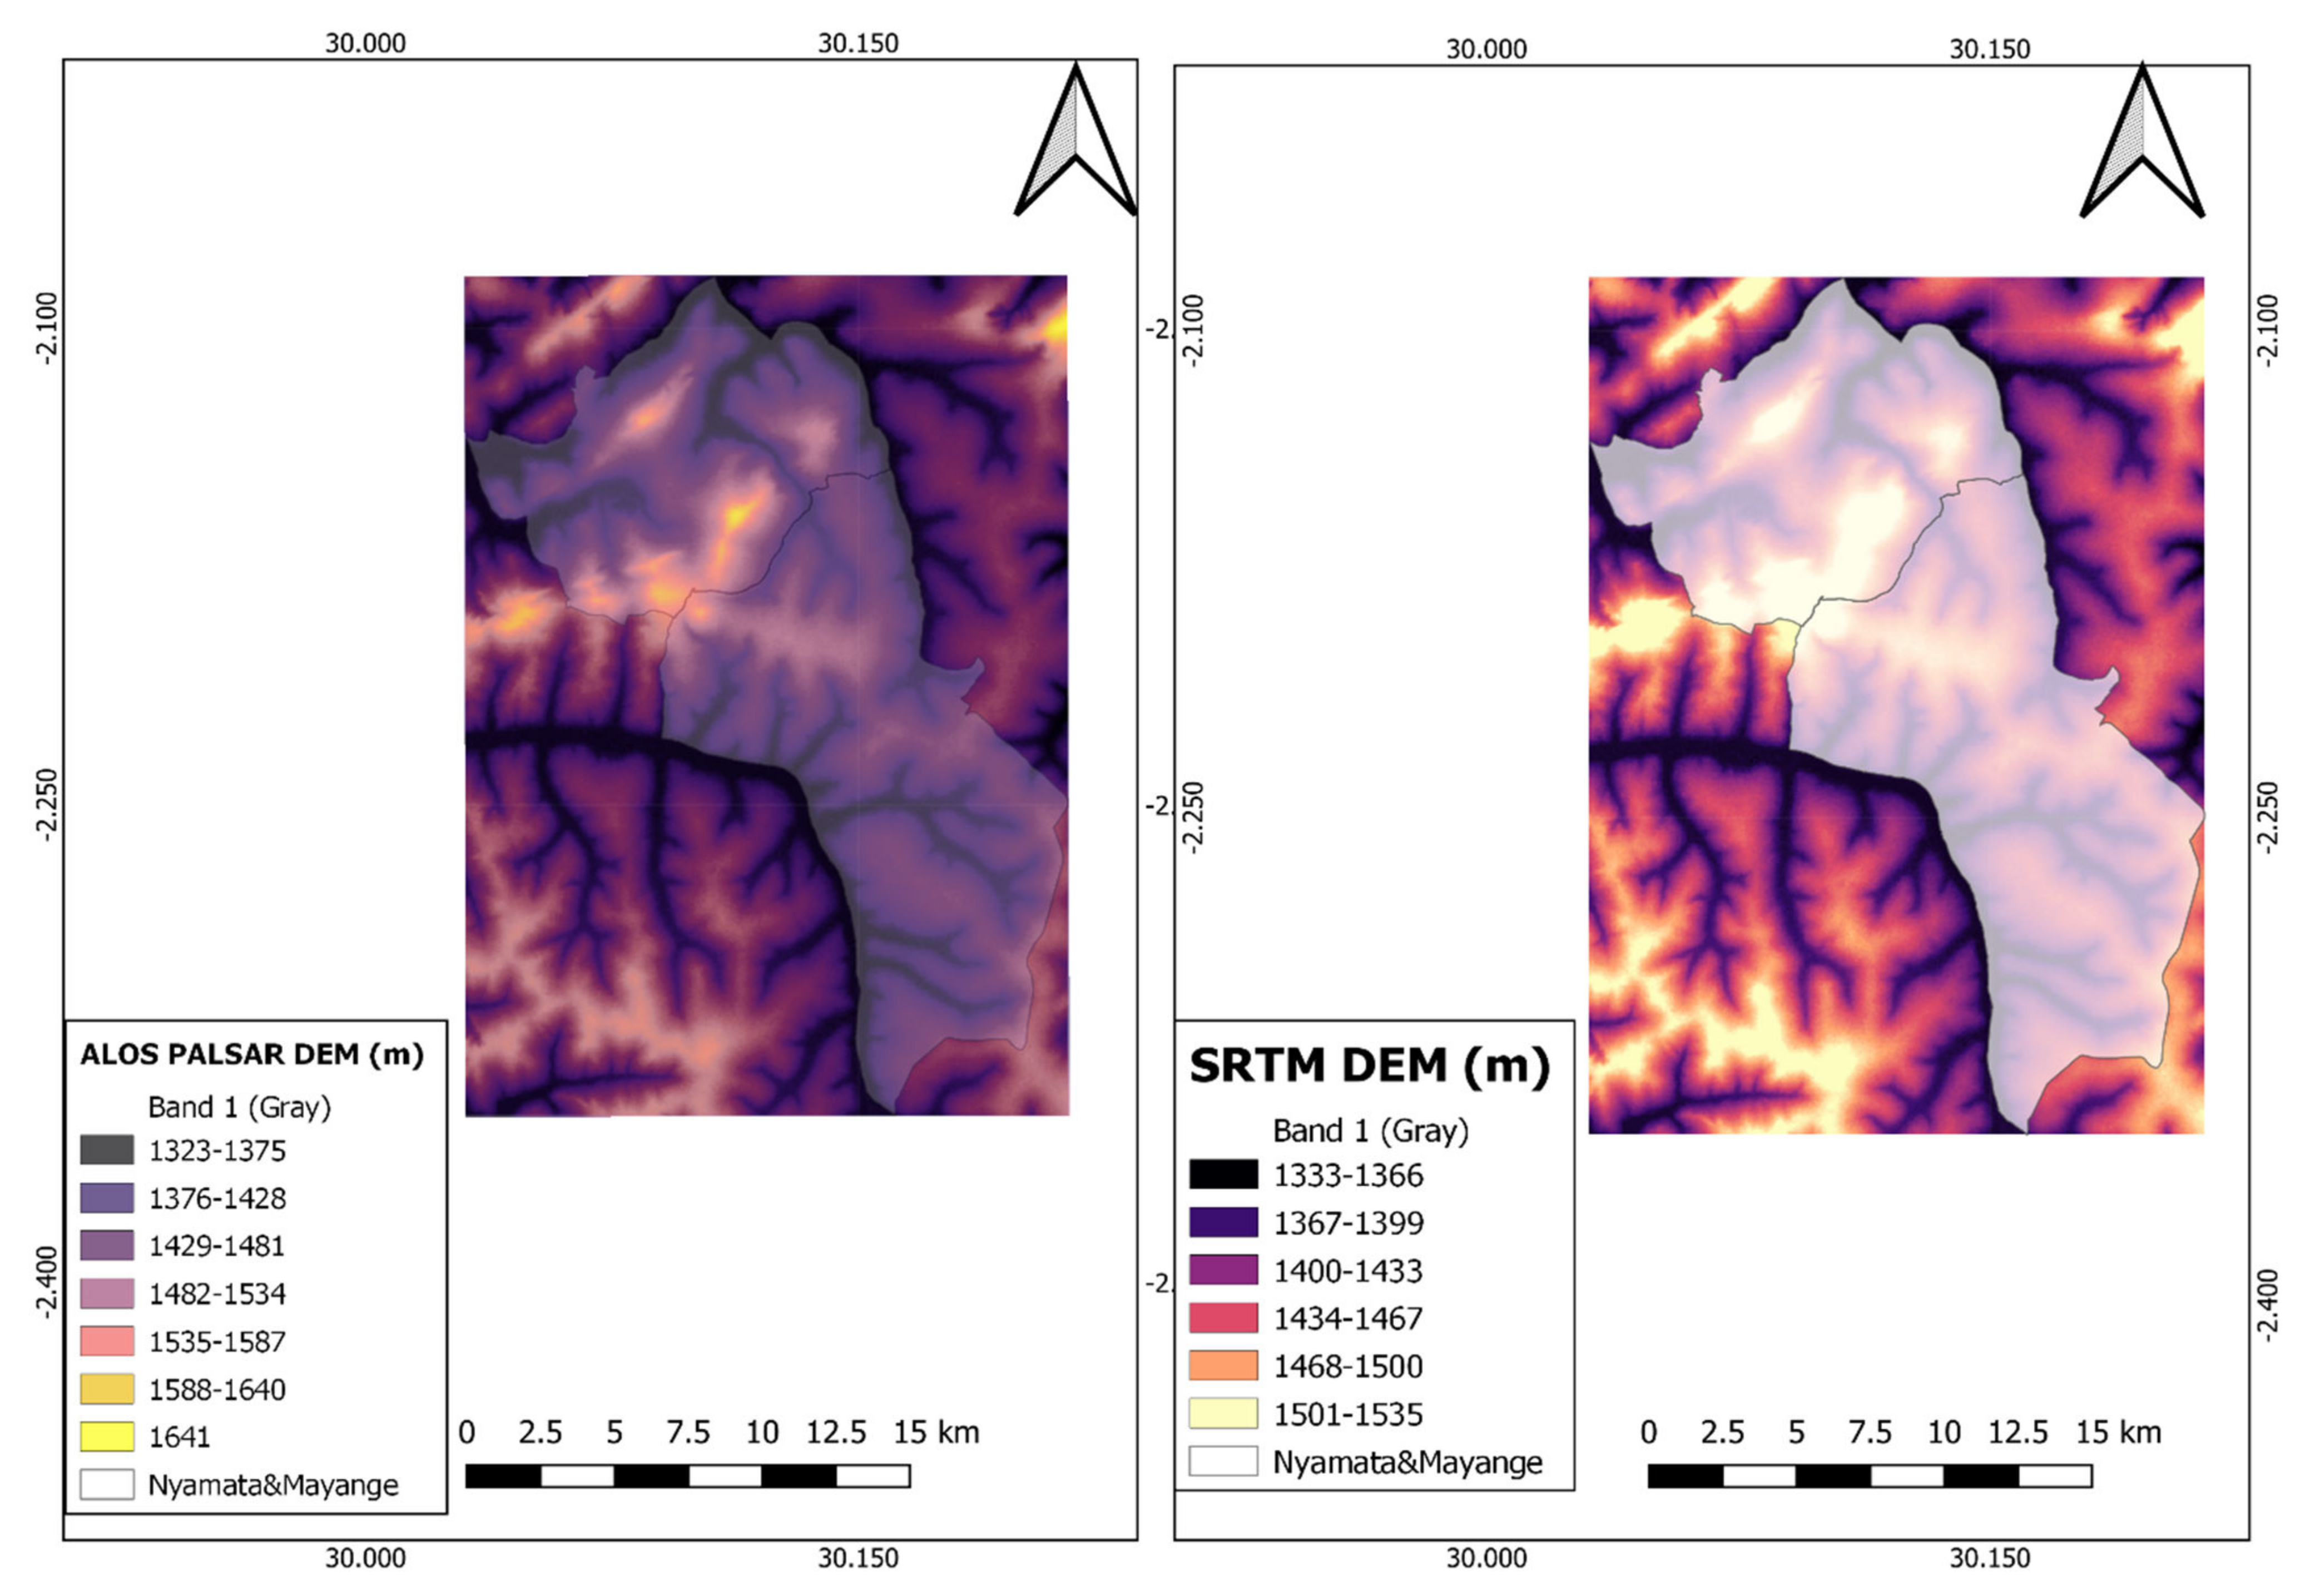
Figure 13 shows the outcome of DEMs applied over the Eastern Province of Rwanda, Bugesera District, Mayange, and Nyamata sectors. The terrain extracted from the ALOS PALSAR DEM, with a resolution of 12.5 m, was based on the World Geodetic System 1984 (EPSG:6326), which is limited to an accuracy of 2 m at best. ALOS PALSAR used EPSG:32735-WGS 84/UTM zone 35S Coordinate Reference Systems (CRS) with the Universal Transverse Mercator (UTM) method. The terrain extracted from the SRTM DEM, with a resolution of 30 m, was based on the World Geodetic System 1984 (EPSG:6326), limited to an accuracy of 2 m. The SRTM DEM used the EPSG:4326-WGS 84 Coordinate Reference Systems (CRS) with the Lat/long method (geodetic alias).
Furthermore, Figure 13 and Table 3 highlight the minimum and maximum elevation ranges obtained from each GDEM, considering the resolution. The results show that ALOS PALSAR DEM, with its resolution of 12.5 m, has the lowest minimum elevation of 1323 m and the highest maximum elevation of 1641 m with a range of 318 m for the Nyamata and Mayange study area. While SRTM DEM, with its resolution of 30 m, has a minimum elevation of 1333 m and a maximum elevation of 1535 m with a range of 202 m.
5.3. Slope Analysis
Cycling power output is directly affected by an elevation often attenuated, and the speed decreases the higher the slope. After Bugesera elevation analysis, the study calculated the slope level. Slope level varies, ranging from am x slope to a very steep slope. The research findings in Figure 14 revealed the slope going between 0% to 23.13% in both Nyamata and Mayange districts.
Van Zuidam’s classification [31] was then used in Table 4 to classify the percentage slope illustrated in Figure 14. The classification of Van Zuidam [31] is based either on the percentage of slope or the degree of slope. There are seven slope classification classes (sections) defined by Van Zuidam’s classification, ranging from flat to very steep slopes. Based on the map calculated and revealed in Figure 14, the Nyamata and Mayange areas are definable, according to Van Zuidam’s as essentially flat cycling and walking zone.
Looking at the classification of Van Zuidam [31], the majority of the road data collected in Bugesera fall into the “slope class [0–2%]”, which encompasses the slope percentages [0–0.64%] and [0.64–1.6%]. This correspondence between the research results in Figure 14 and the classification of Van Zuidam [31] implies that most of the roads in Bugesera are “flat or almost flat surface, no significant denudation process”.
6. Discussion
According to the findings from the survey conducted by the National Institute of Statistics of Rwanda [26], the Bugesera district has the highest bicycle ownership in Rwanda, with 30.5%. Apart from riding for their respective activities, residents in Nyamata and Mayange use bicycle taxi. Fifty participants were recruited, trained, and deployed to collect bicycle mobility patterns using GPS tracks from Columbus V990. Among the fifty participants used, ten were bicycle taxi riders. Figure 11 and Figure 12 revealed that the study collected most bicycle tracks on official roads (national roads, other roads, district roads class 1, and district roads class 2) according to Rwanda Road Networks from Rwanda Transport Development Agency (RTDA). Meanwhile, non-official roads (non-identified roads) had the highest number of tracks from the 580 tracks collected in Nyamata and Mayange. Official roads were mostly used by bicycle owners and bicycle taxi riders heading to activities connected to the public services. Non-official roads relate to GPS tracks not linked to either OSM or Rwanda Road Networks. These are due to many reasons, including the following: (1) being a new road, therefore not yet updated into Open Street Maps or in the official road networks. (2) the route used by the cyclist being a non-official road. Unofficial routes are often a common way for rural cyclists to avoid traffic, save time, and avoid unsafe and topographically challenging roads. The activities connecting cycling to no official roads in rural areas includes farming and retail (Figure 4). Cycling mobility patterns are also linked to areas with higher social, educational, administrative, and economic activities. Figure 7 shows that most cycling activities between Nyamata and Mayange are concentrated along the National Road. Applying DEMs over Nyamata and Mayange sectors, the study extracted the terrain from ALOS PALSAR DEM (12.5 m resolution) and SRTM DEM (30 m resolution). ALOS PALSAR DEM has proven more accurate in terms of elevation results, with the lowest minimum elevation at 1323 m and the highest maximum elevation at 1641 m. Meanwhile, SRTM’s minimal elevation is 1333 m and the maximums elevation is 1535 m. Both terrain elevation ranges are relatively low. The results in Figure 13, therefore, shows that Bugesera terrain is favorable for bicycle activities as it needs to be higher. The slope calculation in Figure 14 shows that most GPS tracks collected by cyclists had little to no exposure to higher slope percentages, explaining the higher rate of bicycle ownership in Bugesera and its use as a bicycle taxi by many people. Higher slopes are also available in Bugesera, but mainly on the periphery of the district, outside the Nyamata and Mayange areas. This result implies that the more cyclists exposed to steep roads, the less cycling is conducted, especially for bicycle taxis.
7. Conclusions
This research investigated the impact of topography and routes on rural mobility patterns at formal and informal cycling track networks in Africa. In order to have a clear understanding of rural mobility patterns in Africa, Rwanda offered a fitting profile, the fact that over 80% of its population lives in a rural environment. Among the objectives to reach the research aim, first, the research used Digital Elevation Models (DEMs) in the predominantly rural district of Bugesera, with statistically the highest household bicycle ownership in Rwanda (30.5%) and over 70% of activities are connected to farming. Digital Elevation Models were applied to analyze the SRTM (30 m resolution) and ALOS PALSAR (12.5 m resolution) elevation data of the Bugesera region. The elevation investigation reveals an elevation range of 1333 to 1535 for SRTM and 1323 to 1641 for ALSO PALSAR. Both DEMs revealed higher and lower elevation areas in the Bugesera terrain. For the second objective, the research collected GPS tracks for bicycle owners and taxis in Nyamata and Mayange sectors to analyze cycling mobility patterns. A GPS device was placed on 50 participants in the mentioned areas, and the study collected points of interest and the GPS tracks connecting two points.
Both sectors have a particularity of one being more rural than the other (Nyamata is the more urban area in the Bugesera district, and Mayange is the more rural area). The study merged these tracks using QGIS tools, and a geoprocessing algorithm was applied to identify high-mobility road types. The study revealed a higher mobility concentration in Nyamata, with district habitants travelling to Nyamata for economic, health, educational, and administrational purposes. Furthermore, cycling on Nyamata and Mayange occurred on roads not identified by either Rwanda Transport Development Agency (RTDA) or by Open Street Map (OSM). Such a finding proves that cyclists only sometimes use existent and official routes for mobility. Cycling routes are constantly being created in rural areas based on factors such as the route’s surface suitability for cycling, safety and security, and the absence of mobility barriers such as missing or broken bridges, open sewers, unmaintained infrastructures, or waterlogging. Another critical point motivating the need for a cyclist to use non-identified roads is topography. In its third objective, the research geo-processed DEMS terrains from the study area and the routes collected by participants using GPS devices to identify the impact of slopes in cycling decisions. The slope length and percentage (%) finding revealed that most roads used by the cyclists in Bugesera are between 0 and 1.6%, while the slope length (m) is mainly between 255 and 49,065 m. The results were classified with Van Zuidam [31] classification, revealing that slope class (0°–2° or 0–2%) are “Flat or almost flat surface, no significant denudation process”. This finding confirms that cyclists try to avoid topographically challenging routes and choose routes with a relatively flat surface when possible. The higher the slope percentage, the fewer bicycles are used because of cyclists’ required efforts on steep roads.
Further research could analyze each participant’s GPS track collection based on their demographic and working time to identify its impact on mobility decisions.
Author Contributions
Conceptualization, J.C. and J.-C.B.M.; methodology, J.-C.B.M. and A.G.S.; software, J.-C.B.M.; validation, J.C. and A.G.S.; formal analysis, J.-C.B.M.; investigation, R.M.; resources, J.C.; data curation, A.A.K.; writing—original draft preparation, J.-C.B.M.; writing—review and editing, J.C., A.G.S. and R.M.; visualization, J.-C.B.M.; supervision, J.C.; project administration, J.-C.B.M.; funding acquisition, J.C. All authors have read and agreed to the published version of the manuscript.
Funding
This research received no external funding or This research was funded by Swiss TPH for Leading House Africa 2022 funding scheme.
Institutional Review Board Statement
The study was conducted in accordance with the Declaration of Helsinki, and approved by the Institutional Review Board (or Ethics Committee) of Swiss Federal Institute of Technology Lausanne (protocol code HREC000233 and 29.06.2022).
Informed Consent Statement
Informed consent was obtained from all subjects involved in the study.
Data Availability Statement
The data presented in this study are available on request from the corresponding author. The data are not publicly available due to privacy or ethical restrictions.
Conflicts of Interest
The authors declare no conflict of interest.
References
- Silbernagl, D.; Krismer, N.; Malfertheiner, M.; Specht, G. Optimization of Digital Elevation Models for Routing. In Proceedings of the 28th GI-Workshop on Foundations of Databases (Grundlagen von Datenbanken), Nörten-Hardenberg, Germany, 24–27 May 2016; Available online: http://www.geo-airbusds.com/worlddem/ (accessed on 19 October 2022).
- Oskarbski, J.; Birr, K.; Żarski, K. Bicycle Traffic Model for Sustainable Urban Mobility Planning. Energies 2021, 14, 5970. [Google Scholar] [CrossRef]
- Murei, A.; Mogane, B.; Mothiba, D.P.; Mochware, O.T.W.; Sekgobela, J.M.; Mudau, M.; Musumuvhi, N.; Khabo-Mmekoa, C.M.; Moropeng, R.C.; Momba, M.N.B. Barriers to Water and Sanitation Safety Plans in Rural Areas of South Africa—A Case Study in the Vhembe District, Limpopo Province. Water 2022, 14, 1244. [Google Scholar] [CrossRef]
- Garvican-Lewis, L.A.; Clark, B.; Martin, D.T.; Schumacher, Y.O.; McDonald, W.; Stephens, B.; Ma, F.; Thompson, K.; Gore, C.J.; Menaspà, P. Impact of Altitude on Power Output during Cycling Stage Racing. PLoS ONE 2015, 10, e0143028. [Google Scholar] [CrossRef] [PubMed]
- Riverson, J.D.N.; Carapetis, S. Intermediate Means of Transport in Sub-Saharan Africa. In Its Potential for Improving Rural Travel and Transport; World Bank Technical Paper Number 161 Africa Technical Department Series; World Bank: Washington, DC, USA, 1991. [Google Scholar]
- Saddier, S.; Patterson, Z.; Johnson, A.; Chan, M. Mapping the Jitney Network with Smartphones in Accra, Ghana: The Accra Mobile Experiment. Transp. Res. Rec. J. Transp. Res. Board 2016, 2581, 113–122. [Google Scholar] [CrossRef]
- Jalal, S.J.; Musa, T.A.; Ameen, T.H.; Din, A.H.M.; Aris, W.A.W.; Ebrahim, J.M. Optimizing the Global Digital Elevation Models (GDEMs) and accuracy of derived DEMs from GPS points for Iraq’s mountainous areas. Geod. Geodyn. 2020, 11, 338–349. Available online: http://www.keaipublishing.com/geog (accessed on 25 October 2022). [CrossRef]
- Felicísimo, M.A. Modelos Digitales Del Terreno: Introducción y Aplicaciones En Las Ciencias Ambientales; Pentalfa Ediciones: Oviedo, Spain, 1994; ISBN 84-7848-475-2. [Google Scholar]
- Hrncir, J.; Song, Q.; Zilecky, P.; Nemet, M.; Jakob, M. Bicycle Route Planning with Route Choice Preferences. In Proceedings of the Prestigious Applications of Intelligent Systems. Prestigious Applications of Intelligent Systems, Prague, Czech Republic, 18–22 August 2014; Schaub, T., Friedrich, G., O´Sullivan, B., Eds.; IOS Press: Amsterdam, The Netherlands, 2014; pp. 1149–1154, ISBN 978-1-61499-418-3. [Google Scholar] [CrossRef]
- Broach, J.; Dill, J.; Gliebe, J. Where do cyclists ride? A route choice model developed with revealed preference GPS data. Transp. Res. Part A Policy Pract. 2012, 46, 1730–1740. [Google Scholar] [CrossRef]
- Winters, M.; Davidson, G.; Kao, D.; Teschke, K. Motivators and deterrents of bicycling: Comparing influences on decisions to ride. Transportation 2011, 38, 153–168. [Google Scholar] [CrossRef]
- Broach, J.; Gliebe, J.; Dill, J. Bicycle route choice model developed using revealed preference GPS data. In Proceedings of the Paper Submitted for Presentation and Publication at the 90th 34 Annual Meeting of the Transportation Research Board January, Washington, DC, USA, 23–27 January 2011. [Google Scholar]
- Guth, P.L.; Van Niekerk, A.; Grohmann, C.H.; Muller, J.-P.; Hawker, L.; Florinsky, I.V.; Gesch, D.; Reuter, H.I.; Herrera-Cruz, V.; Riazanoff, S.; et al. Digital Elevation Models: Terminology and Definitions. Remote Sens. 2021, 13, 3581. [Google Scholar] [CrossRef]
- Wang, X.; Holland, D.; Gudmundsson, H. Accurate coastal DEM generation by merging ASTER GDEM and ICESat/GLAS data over Mertz glacier, Antarctica. Remote Sens. Environ. 2018, 206, 218. [Google Scholar] [CrossRef]
- Mohammadi, A.; Ahmad, B.; Shahabi, H. Extracting digital elevation model (DEM) from sentinel-1 satellite imagery: Case study a part of Cameron highlands, Pahang, Malaysia. Int. J. Appl. Manag. Sci. 2018, 4, 109–114. [Google Scholar]
- Ouedraogo, M.; Degre, A.; Debouche, C.; Lisein, J. The evaluation of unmanned aerial system-based photogrammetry and terrestrial laser scanning to generate DEMs of agricultural watersheds. J. Geomorphol. 2014, 214, 339–355. [Google Scholar] [CrossRef]
- Arun, P. A comparative analysis of different DEM interpolation methods. Egypt. J. Remote Sens. Space Sci. 2013, 16, 133. [Google Scholar]
- Mukherjeea, S.; Joshi, P.; Ghoshb, A.; Gargc, R.; Mukhopadhyayd, A. Evaluation of vertical accuracy of open-source digital elevation model (DEM). Int. J. Appl. Earth Obs. Geoinf. 2013, 21, 205. [Google Scholar] [CrossRef]
- D’Ozouville, N.; Deffontaines, B.; Benveniste, J.; Wegmüller, U.; Violette, S.; De Marsily, G. DEM generation using ASAR (ENVISAT) for addressing the lack of freshwater ecosystems management, Santa Cruz Island, Galapagos. Remote Sens. Environ. 2008, 112, 4131. [Google Scholar] [CrossRef]
- Maune, D.F. Digital Elevation Model Technologies and Applications: The Dem User’s Manual; American Society for Photogrammetry and Remote Sensing: Bethesda, MD, USA, 2007; ISBN 978-1-57083-082-2. [Google Scholar]
- Rexer, M.; Hirt, C. Comparison of free high resolution digital elevation data sets (ASTER GDEM2, SRTM v 2.1/v4.1) and validation against accurate heights from the Australian National Gravity Database. Aust. J. Earth Sci. 2014, 61, 213–226. [Google Scholar] [CrossRef] [Green Version]
- Tarquini, S.; Vinci, S.; Favalli, M.; Doumaz, F.; Fornaciai, A.; Nannipieri, L. 2012 Release of a 10m resolution DEM for the Italian territory: Comparison with global coverage DEMs and an aglyph-mode exploration via the web. J. Comput. Geosci. 2012, 38, 168–170. [Google Scholar] [CrossRef] [Green Version]
- Rosi, C.; Gernhardt, S. Urban DEM generation, analysis and enhancement using TanDEM-X. ISPRS J. Photogramm. Remote Sens. 2013, 85, 120. [Google Scholar] [CrossRef]
- Ai, T.; Li, J. A DEM generalization by minor valley branch detection and grid filling. ISPRS J. Photogramm. Remote Sens. 2010, 65, 198. [Google Scholar]
- Pa’suya, M.; Bakar, A.; Din, A.; Aziz, M.; Samad, M.; Mohamad, M. Accuracy assessment of the Tandem-X DEM in the northwestern of peninsular Malaysia using GPS leveling. ASM Sci. J. 2019, 12, 100–106. [Google Scholar]
- Halim, M.A.; Pa’suya, G.; Narashid, R.; Din, A. Accuracy assessment of TanDEM-X 90m digital elevation model in the east of Malysia using GNSS/leveling. In Proceedings of the IEEE 10th Control and System Graduate Research Colloquium (ICSGRC 2019), Shah Alam, Malaysia, 2–3 August 2019; pp. 88–93. [Google Scholar]
- National Institute of Statistics of Rwanda (NISR). EICV3 DISTRICT PROFILE East—Bugesera, 2010. 2011. Available online: https://www.statistics.gov.rw (accessed on 21 August 2022).
- Food and Agriculture Organization of the United Nations (FAO). Available online: https://www.fao.org/rwanda/our-office-in-rwanda/rwanda-at-a-glance/en/ (accessed on 1 September 2022).
- Jaligot, R.; Kemajou, A.; Chenal, J. A new approach to spatial analysis of motorcycle taxis activities—The case of Port-au-Prince, Haiti. Urban Plan. Transp. Res. 2017, 5, 78–91. [Google Scholar] [CrossRef] [Green Version]
- Kemajou, A.; Jaligot, R.; Bosch, M.; Chenal, J. Assessing motorcycle taxi activity in Cameroon using GPS devices. J. Transp. Geogr. 2019, 79, 102472. [Google Scholar] [CrossRef]
- Van Zuidam, R.A. Terrain Analysis and Classification Using Aerial Photographs: A Geomorphological Approach; ITC Textbook of Photo-Interpretation; International Institute for Aerial Survey and Earth Sciences: Enschede, The Netherlands, 1979. [Google Scholar]
Figure 1.
Maps of Nyamata and Mayange sectors, Bugesera district, Eastern Province of Rwanda (Software: QGIS).
Figure 1.
Maps of Nyamata and Mayange sectors, Bugesera district, Eastern Province of Rwanda (Software: QGIS).

Figure 2.
Flowchart of extracting SRTM and ALOS PALSAR DEMS and derived DEMs from the handheld GPS tracks and points for the Study Area.
Figure 2.
Flowchart of extracting SRTM and ALOS PALSAR DEMS and derived DEMs from the handheld GPS tracks and points for the Study Area.

Figure 3.
Slope Line Segment Length (L) expressed in a graphical format.

Figure 4.
Bugesera Income Category in relation to Household Bicycle ownership (%) [27] (Modelling method: histogram, Software: Stata).
Figure 4.
Bugesera Income Category in relation to Household Bicycle ownership (%) [27] (Modelling method: histogram, Software: Stata).

Figure 5.
Bugesera Income in relation to available Work category (modelling method: Cross-Tabulation, Software: Stata) [27].
Figure 5.
Bugesera Income in relation to available Work category (modelling method: Cross-Tabulation, Software: Stata) [27].

Figure 6.
Map (1) represents the mobility patterns of GPS Tracks collected, Map (2) the mobility patterns of GPS Tracks collected in Nyamata and Mayange, while Map (3) represents the Overlaying Nya-mata and Mayange Mobility patterns in merged GPS Trackers, OSM and Rwanda road Network.
Figure 6.
Map (1) represents the mobility patterns of GPS Tracks collected, Map (2) the mobility patterns of GPS Tracks collected in Nyamata and Mayange, while Map (3) represents the Overlaying Nya-mata and Mayange Mobility patterns in merged GPS Trackers, OSM and Rwanda road Network.

Figure 7.
Area of concentration of bicycle mobility patterns and activities in Nyamata and Mayange.

Figure 8.
Map (1) Rwanda road network data in the Bugesera, Map (2) Buffer analysis of Rwanda road networks, Map (3) Joint of Buffered Rwanda Roads Networks and merged GPS tracks.
Figure 8.
Map (1) Rwanda road network data in the Bugesera, Map (2) Buffer analysis of Rwanda road networks, Map (3) Joint of Buffered Rwanda Roads Networks and merged GPS tracks.

Figure 9.
Spatial Joint of Nyamata GPS Tracks and Rwanda Road networks with buffer.

Figure 10.
Spatial Joint of Mayange GPS Tracks and Rwanda Road networks with buffer.

Figure 11.
Nyamata’s official roads and non-identified roads (non-official roads).

Figure 12.
Mayange’s four official roads and no identified roads (no official roads).

Figure 13.
ALOS PALSAR vs. SRTM elevation ranges of the GDEMs in the study.

Figure 14.
Slope percentages and Slope length of collected bicycle routes in Bugesera.


Table 1.
Demographic Information of collected data in Bugesera District.
| Attributes | Frequency | Description | ||
|---|---|---|---|---|
| 1 | Sectors | 2 | Nyamata & Mayange | |
| GEOGRAPHY OF STUDIED AREA | Cells | 9 | Kagenge, Murama, Maranyundo, Kibenga, Gakamba, Nyamata ville, Nyamata Ville, Muramo, Gakamba | |
| Villages | 27 | Biryogo, Rusagara, Kamugenzi, Rukora, Gatare, Rutukura, Kiruhura, Gatare 3, Rugarama, Rugarama 2, Ruhanga, Nyabivumu, Muyange, Gataraga, Taba, Gahwiji B, Gitaramuka, Kavumu, Gahwiji A, Rwarusaku, Ruhorobero, Ragarama, Rwakibirizi 2, Kivugiza, Gashwiji A, Kindonyi, Murambi | ||
| 2 | PARTICIPANTS USE OF BIKE | Bicycle used for Business only | 7 | Bike taxi, Wholesale for food products |
| Bicycle used for Business & Personal Use | 38 | Bike taxi, Wholesale for food products and fetching water, looking for grass for animals | ||
| Bicycle used for Personal Use only | 5 | Student and fetching water, looking for grass for animals, going to buy groceries and other home needs and movement |
Table 2.
Description of symbology used at Figure 6.
Table 2.
Description of symbology used at Figure 6.
| No | Symbology | Description |
|---|---|---|
| 1 | Blue dash | The blue dashed lines in all maps in Figure 6 represent areas with low cycling mobility. |
| 2 | Blue line | The blue lines in all maps, which are the accumulation of dark blue, represent the areas with the highest mobility. |
| 3 | Green line | The green lines on Map 2 in Figure 6 represent the road networks collected by the Rwanda Transport Development Agency (RTDA). |
| 4 | Pink line | The pink lines on Map 3 in Figure 6 represent the Open Street Maps (OSM) road networks. |
| 5 | Brown line | The brown lines on Map 3 in Figure 6 represent the merging of the Rwanda road networks with the OSM road network. |
Table 3.
Specifications and elevation ranges of the GDEMs in the study.
| No | Name of the GDEM | Projected Coordinate System | Spatial Resolution (m) | Minimum and Maximum Elevation (m) | Range (m) |
|---|---|---|---|---|---|
| 1 | ALOS PALSAR | EPSG:32735-WGS 84/UTM zone 35S | 12.5 | 1323–1641 | 318 |
| 2 | SRTM | EPSG:4326-WGS 84 | 30 | 1333–1535 | 202 |
Table 4.
Slope classes with the nature of processes and natural conditions [31].
Table 4.
Slope classes with the nature of processes and natural conditions [31].
| Slope Class | Nature, Process and Natural Conditions |
|---|---|
| 0°–2° (0–2%) | Flat or almost flat, no significant denudation process |
| 2°–4° (2–7%) | Gentle, low-velocity land movement, sheet, and soil erosion (sheet and wind erosion), marsh erosion. |
| 4°–8° (7–15%) | Softer, the same as above, but with a higher magnitude. |
| 8°–16° (15–30%) | Slightly steep, lots of ground movement and erosion, especially landslides which are flat. |
| 16°–35° (30–70%) | Denudation processes and land movements are frequent and intensive. |
| 35°–55° (70–140%) | Very steep, the rocks generally begin to unfold, a very intensive denudation process, have begun to produce reworking material. |
| >55 >140% | Very steep, exposed rocks, a very strong denudation process and prone to rock falls, rarely cultivated plants (limited). |
Disclaimer/Publisher’s Note: The statements, opinions and data contained in all publications are solely those of the individual author(s) and contributor(s) and not of MDPI and/or the editor(s). MDPI and/or the editor(s) disclaim responsibility for any injury to people or property resulting from any ideas, methods, instructions or products referred to in the content. |
© 2023 by the authors. Licensee MDPI, Basel, Switzerland. This article is an open access article distributed under the terms and conditions of the Creative Commons Attribution (CC BY) license (https://creativecommons.org/licenses/by/4.0/).
Share and Cite
MDPI and ACS Style
Munyaka, J.-C.B.; Chenal, J.; Sebarenzi, A.G.; Mrani, R.; Konou, A.A. Impact of Topography on Rural Cycling Patterns: Case Study of Bugesera District, Rwanda. Urban Sci. 2023, 7, 8. https://doi.org/10.3390/urbansci7010008
AMA Style
Munyaka J-CB, Chenal J, Sebarenzi AG, Mrani R, Konou AA. Impact of Topography on Rural Cycling Patterns: Case Study of Bugesera District, Rwanda. Urban Science. 2023; 7(1):8. https://doi.org/10.3390/urbansci7010008
Chicago/Turabian StyleMunyaka, Jean-Claude Baraka, Jérôme Chenal, Alexis Gatoni Sebarenzi, Rim Mrani, and Akuto Akpedze Konou. 2023. "Impact of Topography on Rural Cycling Patterns: Case Study of Bugesera District, Rwanda" Urban Science 7, no. 1: 8. https://doi.org/10.3390/urbansci7010008