
Do Socially Vulnerable Urban Populations Have Access to Walkable, Transit-Accessible Neighborhoods? A Nationwide Analysis of Large U.S. Metropolitan Areas
Department of Geography/Geology, University of Nebraska at Omaha, 6001 Dodge Street, Durham Science Center 263, Omaha, NE 68182, USA
Urban Sci. 2023, 7(1), 6; https://doi.org/10.3390/urbansci7010006
Submission received: 2 November 2022
/
Revised: 3 January 2023
/
Accepted: 4 January 2023
/
Published: 11 January 2023
(This article belongs to the Special Issue Walkable Metropolis: Opportunities and Challenges in the 21st Century)
Abstract
:Walkable and transit-accessible neighborhoods that may offer residents numerous health, social, and economic benefits are, in many places, becoming increasingly exclusive. This equity-mapping analysis sought to determine whether socially vulnerable (SV) populations within America’s largest (pop. ≥ 500 k) metropolitan areas have equitable access to walkable and transit-accessible neighborhoods. The results suggest an equitable overlap between high-SV and highly walkable neighborhoods in many cities, yet there was significant variability in both the availability and equity in accessibility of these neighborhoods to SV populations. Concerningly, high-SV populations living in more walkable neighborhoods are also likely to contend with higher levels of personal crime (i.e., homicide, rape, robbery, assault), poorer-performing schools, and lower transit accessibility. While the primary challenge in some cities, including many in the South and Southeast, is a general lack of walkable and transit-accessible neighborhoods, in others a dearth of affordable housing is likely the main barrier to ensuring broad and equitable accessibility.
1. Introduction
The environmental justice (EJ) literature suggests that strong spatial inequities exist within urban environments, with low-income and marginalized populations often unfairly burdened with disamenities and hazards such as environmental pollution [1,2,3], traffic and aviation noise [4,5], and flooding [6], while having reduced access to beneficial amenities such as high-quality parks and greenery [7,8,9], specialized medical facilities and care [10,11], grocery stores [12,13], and high-performing schools [14]. As the EJ literature has evolved and expanded over the past two decades [15], increased attention has been paid to potential inequities in the quality and structure of the built environment (e.g., [16,17,18,19]).
Given that transportation and mobility affects nearly every facet of one’s life, from physical health to educational and employment opportunities [20,21,22], the equitable distribution of high-quality pedestrian and transit infrastructure is often cited as particularly crucial to meeting environmental/social justice and other sustainability goals [23,24]. Residents that live in walkable urban environments are more likely to engage in “purposive” walking; i.e., walking to reach a particular destination [25,26,27], and therefore have a better chance of accessing amenities such as retail destinations, employment centers, schools, and entertainment venues without the need of an automobile [26,28,29,30]. Reduced automobile dependency and greater reliance on active (i.e., walking and cycling) and public transportation is associated with numerous economic, social, and environmental benefits to both individuals and society, such as lower medical costs as a result of more active lifestyles and improved air quality due to lower tailpipe emissions [31,32,33,34,35]. Safe, walkable, and economically vibrant urban environments are also expected to enhance social interaction and civic participation by providing the spaces and conditions for both planned and chance encounters [36,37].
With these benefits in mind, it is worth considering whether disadvantaged groups have equal access to walkable and transit-accessible urban neighborhoods. Access to multi-modal environments (i.e., those conducive to walking, cycling, and transit in addition to private transportation) may be particularly important for disadvantaged groups, including low-wage workers, immigrants, and certain ethno-racial minorities, whose rates of car ownership are lower than average [38]. Although the evidence thus far is mixed, inequities may be common and widespread. Koshinksy and Talen [39], for example, found that accessibility to walkable neighborhoods was disproportionally compromised for public housing tenants in U.S. urban areas, while Riggs [40] observed that black residents were more likely to live in less walkable neighborhoods in the San Francisco Bay area. In a walking audit of 76 census tracts in New York City, Neckerman et al. [41] observed that higher-income areas had significantly more street trees, sidewalk cafés, cleaner streets, and lower rates of crime and vehicular crashes. Bereitschaft [17] noted similar differences in the quality of the pedestrian environment in Pittsburgh, PA, with higher SV neighborhoods scoring lower in terms of streetscape enclosure, transparency (i.e., presence of windows), complexity, and tidiness. More recently, Ermagun and Tilahun [42] documented that minorities, low-wage workers, the elderly, and the less educated in Chicago live in areas with lower transit accessibility. Low-income workers appeared to be particularly disadvantaged, with limited access to crucial amenities such as jobs, parks, grocery stores, hospitals, and libraries. These inequities are especially problematic given that low-income groups often experience longer commute times [43] and are likely to benefit the most from improvements in transit accessibility [44].
Though concerning, there appears to be some inter-urban variability in access to transit-accessible and walkable neighborhoods, with some studies finding non-significant or even positive associations between disadvantaged groups and walkability or transit accessibility. Cutts et al. [45], for example, were surprised to find significant positive associations between accessibility to both parks and walkable neighborhoods in Phoenix, AZ, and minority populations while controlling for traffic fatalities, crime rates, and park size. However, they also found a significant negative relationship between the proportion of younger residents (age < 18 years) and walkability, and noted that crime rates were highest among walkable neighborhoods with large Latino and African-American populations. Duncan et al. [46] did not find any significant correlations between neighborhood-level sociodemographic variables (i.e., minority composition, poverty rate) and walkability in Boston, MA. Additionally, they observed significant spatial clustering for sociodemographic variables but not walkable neighborhood amenities. In a comparative analysis of three large U.S. cities, Bereitschaft [18] found that the quickly growing “Sun Belt” city of Charlotte, NC had the most “walk vulnerable” neighborhoods; i.e., those with a high proportion of socially vulnerable residents but low walkability. Portland, OR, by contrast, had relatively few “walk vulnerable” neighborhoods.
While most studies have taken a primarily case study approach to investigating potential inequities in neighborhood walkability, King and Clarke [47] gathered data on neighborhood walkability and demographics for some 65,000 census tracts across 48 states in the United States. They found that neighborhoods with more disadvantaged, as well as more educated, residents tend to be more walkable. Importantly, however, they also found that children and older adults tend to live in less walkable neighborhoods, suggesting that at least some populations that could benefit the most from walkable urban environments may be among the least likely to live in them.
Similar to King and Clarke [47], this study takes a primarily extensive approach to examining whether socially vulnerable groups have equal access to walkable and transit-accessible neighborhoods across a large number (106) of U.S. metropolitan statistical areas (MSAs). In addition to examining the statistical relationship between neighborhood walkability and social vulnerability (SV), this investigation is the first to identify the proportion of high-SV neighborhoods that overlap with highly walkable and transit-accessible neighborhoods by MSA, as well as examine the equity of this overlap; i.e., whether someone residing in a high-SV census tract is as likely to live in a highly walkable/transit accessible tract as a resident chosen at random from within the same MSA. The statistical analysis will focus on urban census tracts (i.e., those within U.S. Census Bureau-defined “urbanized areas”), and include additional variables not included in the regression models developed by King and Clarke [47] such as distance from the city center, crime, and grade school quality. Finally, the geography of equity in neighborhood walkability and transit accessibility, particularly regional variations and their potential causes, are considered as well.
2. Background
In the United States, urban development in the last half of the 20th century was largely dominated by low-density, automotive-dependent patterns often described as urban or suburban sprawl [48,49]. Over the past few decades, however, demand has grown for more walkable, transit-oriented development common to traditional urban typologies prior to the mass adoption of the automobile. There are likely several intertwined economic, demographic, and cultural reasons for this shift including declining family sizes, rising education, falling crime rates, economic restructuring, and neoliberal policies that support gentrification (e.g., formation of development corporations, property-based tax incentives, place branding and marketing, etc.), and changing preferences among younger generations [50,51,52,53,54,55].
Compared with their suburban counterparts, more traditional urban neighborhoods typically include a mix of residential and commercial land uses, which provides better accessibility to employment, retail, entertainment, and other amenities. Though housing costs are often higher in more walkable and transit-accessible urban neighborhoods [56,57,58] transportation savings resulting from fewer and shorter trips by car, and more by foot, bicycle, or public transit, are expected to offset some of the additional cost [59,60]. There are also likely to be health-related savings as well, with residents of more walkable neighborhoods found to suffer from fewer obesity and cardiopulmonary related disorders such as diabetes, heart disease, and cancer [61,62,63]. Walkable environments may even have psychological benefits. Greater land-use mix and street-network accessibility, for example, have been associated with reduced psychological distress and depression in men [64,65], while older Chinese adults who perceived their neighborhood to be more walkable reported less loneliness and higher life satisfaction and happiness [66].
Although we know more about the benefits of walkability today than ever before, the many social and economic advantages offered by dense, mixed-use development patterns were readily apparent decades ago. In The Death and Life of Great American Cities [67], the urban theorist and activist Jane Jacobs argued eloquently in favor of using short blocks, mixed residential and commercial land use, moderate density, and diversity of building ages to stimulate liveliness and diversity in urban neighborhoods. Much of this vitality, she argued, would arise out of a fine-grained mix of mutually supportive land uses that spread pedestrian activity throughout the day and into the night. Though frequently praised for her influence on contemporary urban planning, including serving as inspiration for the New Urbanism and Smart Growth urban planning and design movements [68], Jacobs has been criticized for not addressing the darker side of urban revitalization; the tendency of successful urban neighborhoods to become increasingly exclusive, potentially to the detriment of existing residents [69,70].
With demand for walkable, transit-accessible neighborhoods on the rise, thousands of urban neighborhoods have experienced some degree of gentrification, which the U.S. Department of Housing and Urban Development (HUD) defines as “a form of neighborhood change that occurs when higher-income groups move into low-income areas, potentially altering the cultural and financial landscape of the original neighborhood” [71]. In addition to raising housing costs, gentrification can result in a dramatically altered retail landscape, with corner grocery stores, for example, replaced with upscale cafés and boutiques that may be of little interest or utility to lower-income groups [72]. These changes may lead to the displacement of long-time residents and businesses, disrupting communities and potentially subjecting the displaced to less desirable conditions elsewhere [73,74].
Several studies and reports over the past two decades have chronicled an increase in poverty and share of minority households within suburban areas e.g., [75,76,77]. Although the extent to which this change may be attributable to gentrification and displacement remains unclear [78], the suburbanization of poverty and disadvantage is likely to exacerbate long-standing inequities in mobility. McLafferty and Preston [79], for example, found that Blacks, Asians, and Hispanics in the New York region were more likely than Whites to have relatively low-paying jobs with long commute times. Additionally, the overrepresentation of Blacks and Hispanics among workers with low pay and long commutes grew between 2000 and 2010. Antipova [80] similarly observed that disadvantaged workers in the Memphis area were more likely than high-earning workers to commute extreme distances of 50 miles or more. Among high-cost coastal cities, such as Los Angeles, CA, a mismatch between the availability of affordable housing and low-wage jobs is also likely to result in longer commute distances for disadvantaged groups [81]. Potentially more concerning than a long commute is that some disadvantaged households are unable to afford a single vehicle, while others must share a vehicle between two or more working adults [82]. When combined with a dearth of high-quality public transit systems in suburban areas, this can make it challenging to access employment opportunities, social events, medical care, and other critical amenities and resources [83,84]. “Forced” car ownership may also place considerable financial strain on low-income households who may then not be able to spend adequate resources on housing, food, and other needs [85]).
Given that less auto-dependent, walkable, and transit-accessible areas may carry with them housing cost premiums as well as amenity trade-offs [39,56,86], it is worth considering in detail how accessible and affordable walkable and transit-accessible neighborhoods are, particularly for disadvantaged or socially vulnerable groups. This study aims to build upon and extend previous analyses including those of Bereitschaft [18] and King and Clarke [47] by (1) examining the relationship between SV and both neighborhood walkability and transit accessibility across nearly 37,000 urban census tracts in the United States while controlling for additional variables of concern including crime rates and grade school quality, (2) determining whether SV populations have equitable access to neighborhoods with high walkability/transit accessibility by comparing census tracts to the encompassing urbanized area, and (3) identifying specific MSAs and regions where socially vulnerable populations may have particularly low access to walkable and transit-oriented neighborhoods and could thus benefit most from targeted policy interventions.
3. Methods
The geographic scope of this study included the 106 most populous U.S. MSAs with estimated populations of 500,000 or more as of 2018. This population threshold was chosen because larger metros are typically home to a variety of neighborhood typologies (including those with high and low walkability), and are also more likely to have extensive public transit systems, including fixed rail lines. Many metropolitan areas also have substantial quantities of rural land within their boundaries. Therefore, only “urban” census tracts, located within U.S. census-defined urbanized areas (UAs), were included in the analysis. Nearly all tracts outside these boundaries are characterized by walkability scores of zero. Although census tracts vary in size, urban tracts are generally considered good proxies for neighborhood-scale spatial units [87]. With an average area of 5 km2, census tracts in urbanized areas also align well with the Walk Score® walkability metric used in this study, which considers features within a distance of 1.5 miles (2.4 km) of a given location [88].
Data on neighborhood walkability were obtained from Walk Score®, transit data were collected from both Walk Score® and the Homeland Infrastructure Foundation-Level Data (HIFLD) database, and social vulnerability was assessed using the Social Vulnerability Index (SVI) developed by the U.S. Centers for Disease Control and Prevention (CDC). All data were available at, or were aggregated to, U.S. census tracts, which approximate the size and population of urban neighborhoods [89].
The spatial association between neighborhood walkability, transit accessibility, and social vulnerability (SV) was evaluated for each MSA by addressing three questions. First, what proportion of residents living in neighborhoods classified as “high-SV” (i.e., those with an SVI at or above the 80th percentile) also live in neighborhoods designated as having “high” walkability (i.e., those with walk scores of 70 out of 100 or higher; Walk Score® [88]) or “high” transit accessibility (i.e., those with a transit score of 50 out of 100 or higher, or located in close proximity to a fixed rail station)? Second, how do these percentages compare with the metropolitan areas as a whole; that is, what are the odds that someone living in a high-SV census tract will also live in a high-walkability or high-transit accessibility tract relative to a resident chosen at random from within the same urban area? Third, what is the statistical correlation between SV and both walkability and transit accessibility when controlling for distance from the city center, grade school proficiency, and neighborhood crime rates? The first question seeks to determine whether residents of census tracts characterized by high levels of social vulnerability have access to walkable and transit-accessible environments, while the second question addresses whether these locational amenities are equitably distributed. The third question recognizes that not all walkable or transit accessible neighborhoods are equal, and that high-SV/disadvantaged populations clustered in relatively walkable inner-city areas may also experience higher crime rates and low-performing schools [39]. In such a case, the benefits of neighborhood walkability and transit accessibility may be offset by these disamenities, which tend to amplify economic and health inequities [90,91].
Below we consider in more detail how the social vulnerability index, Walk Score® metric, and transit accessibility were calculated for use in this study. The section then concludes with an overview of the modeling procedure used to address question three.
3.1. Social Vulnerability
SV at the neighborhood level was determined using the CDC’s Social Vulnerability Index (SVI), which estimates the relative vulnerability of U.S. census tracts and counties by ranking 15 variables that represent four related themes: “socioeconomic status”, “household composition and disability”, “minority status and language”, and “housing and transportation” [92]. “Socioeconomic status” includes the variables percentage below poverty, percentage unemployed, per capita income, and percentage with no high school diploma. The “household composition and disability” theme includes the variables percentage aged 65 and older, percentage aged 17 or younger, percentage of civilians with a disability, and percentage single-parent households. The “minority status and language” theme includes percentage minority and percentage of residents that speak English “less than well”. Lastly, the “housing and transportation” theme includes the variables percentage multi-unit structures, percentage mobile homes, percentage crowding, percentage no vehicle access, and percentage group quarters. These data were collected as part of the U.S. Census Bureau’s annual American Community Survey (ACS), collected and averaged over the 2014–2018 five-year period.
The CDC’s SVI was calculated by ordering all tracts with a non-zero population from highest to lowest (except per capita income, which was ordered from high to low) for each variable, and then calculating an overall percentile ranking by summing individual variable rankings. This was also done for each of the four themes by summing the percentiles of the associated variables. Percentile ranking values were expressed on a scale from 0 to 1, with higher values indicating higher overall levels of social vulnerability. For the present analysis, census tracts are considered to have “high” SV if they fall within the top 20% (i.e., SVI ≥ 0.8) of values nationwide.
3.2. Walkability
Neighborhood walkability was assessed using the popular online Walk Score® metric (http://www.walkscore.com (accessed on 15 February 2022)). Walk scores range from 0 to 100, with higher values indicative of more walkable environments [88]. The metric is based primarily on the density of local destinations and amenities such as coffee shops, restaurants, grocery stores, drug stores, parks, schools, and bars, though it also considers other local features such as population density, block length, and intersection density. Based on these elements, Walk Score® recognizes four “levels” of walkability: “car-dependent” (walk scores 0–49), “somewhat walkable” (walk scores 50–69), “very walkable” (walk scores 70–89), and “walker’s paradise” (walk scores 90–100). Walk scores may be calculated for any given address; amenities within a five-minute walk, or 0.25 miles, receive full weight in the calculation, while those further away receive less weight, out to a maximum of 1.5 miles. Walk scores were obtained in 2018 for all census tracts located within U.S. metropolitan areas using Walk Score’s® API. In alignment with Walk Score’s® rating system, census tracts were classified as having “high walkability” if the walk score at their centroid was greater or equal to 70.
Walk Score® has been used as a quantitative measure of walkability in numerous studies over the past decade (e.g., [40,93,94,95,96]). The metric does have limitations, however. Most notably, Walk Score® does not account for micro-scale elements of the built environment that may impact walking behavior such as the condition of the sidewalks, building setbacks, presence of trees and planters, lighting, benches, and crosswalks [97,98,99,100,101]. It also does not consider neighborhood crime rates or local traffic conditions, which can have a significant impact on pedestrians’ sense of safety and willingness to walk [102,103]. Locations with similar walk scores may vary widely in terms of the quality of the pedestrian environment, with lower-income areas often having more street litter, broken windows, vacant properties, and absent or outdated crosswalk infrastructure relative to higher-income neighborhoods [17]. Though not a limitation of Walk Score® specifically, endogenous characteristics (e.g., gender, race, income, education, age) of individuals, households, and groups may influence walking behavior even among areas with similar infrastructure, safety, and other qualities of the urban environment expected to affect walkability [97,104,105,106,107].
Despite these limitations, Walk Score® has been broadly recognized as an efficacious standardized measure of walkability [108,109,110,111] that aligns well overall with residents’ perceptions [112]. While other walkability indices and methodologies exist (e.g., [113,114,115]) Walk Score® is well suited to the present analysis in which a standardized and current assessment of walkability at the neighborhood level is needed for several thousand census tracts spread across 106 U.S. metropolitan areas. While detailed micro-scale analyses of the built environment are also helpful in identifying inequities, detailed walking audits of streetscape features and quality across a large sample of MSAs is simply impractical at this time. Machine learning algorithms in combination with Google Street View imagery, however, hold promise as a means of assessing these micro-scale elements of the built environment efficiently over a large area [116,117].
3.3. Transit Accessibility
Transit accessibility was assessed in part using Walk Score’s® Transit Score. Transit Score® is said to describe the “usefulness” of nearby transit routes, which is based on three measures: the distance to the nearest stop on the route, the weekly frequency of the route, and the type of route [118]. Relative to bus stops, rail stops are weighted twice (2×) as much, while “ferry/cable car/other” are weighted 1.5×. Transit Score® also uses the same distance decay function as Walk Score® to give additional weight to closer transit stops. Like walk scores, transit scores range from 0 to 100 with 100 indicating high levels of transit accessibility. Due to substantial differences in transit availability between large and small U.S. cities, transit score was normalized to a logarithmic scale in which the highest value of 100 represents the averaged transit scores of downtown San Francisco, Chicago, Boston, Portland, OR, and Washington, D.C. About the same proportion (~15%) of census tracts that had walk scores of 70 or higher also had transit scores of 50 or higher (described by Walk Score® as having “good transit” or better). These census tracts were therefore classified in this study as “high-transit” tracts. After a close inspection of transit scores and rail stops across several U.S. cities, it was observed that some 2000 urban census tracts that contained, or were in close proximity to, a rail station did not quite meet the threshold set for high-transit accessibility. This may be due to a number of reasons such as a limited number of transit options (e.g., rail but not bus, etc.) or less frequent transit service. A decision was made to add to the “high-transit” list those tracts with a rail transit stop within 1 km of their center. Given the roughly neighborhood-scale size of urban census tracts, most residents within these tracts would be within walking distance of a rail station [119]. Although the frequency of service may not be as high as at some other locations, the close proximity of a light or heavy rail station should link the neighborhood to a wider transit network, providing access to a variety of destinations.
4. Modeling
A series of linear regression models were developed to further examine the potential relationships between the degree of SV and neighborhood walkability and transit accessibility, while controlling for confounding factors. Also considered was whether these relationships might vary across the four SV themes (i.e., “socioeconomic status”, “household composition and disability”, “minority status and language”, and “housing type and transportation”). Control variables included the distance from the city center, crime levels, the quality of local grade schools, MSA population, and U.S. Census region. Each of these variables is considered in more detail below.
The distance from the city center was calculated using the Euclidean distance between the centroid of each census tract and the city hall of the encompassing UA’s most populous city. This variable was included to control for the fact that more walkable and transit-accessible neighborhoods tend to be clustered in the denser, more central areas of cities. Euclidean (i.e., straight-line) distance was deemed sufficiently accurate for this analysis since the estimate applied to the entire census tract rather any specific location within.
All other factors being equal, higher crime rates are expected to reduce neighborhood desirability and discourage walking and other outdoor activities [90,120,121]. Additionally, disadvantaged groups may be subjected to higher crime rates than their more advantaged counterparts when residing in neighborhoods with similarly high levels of walkability [41]. Given this disparity, it is perhaps not unexpected that Black residents in particular may be migrating to less walkable neighborhoods with lower crime rates [122]. Data on crime rates were obtained from Applied Geographic Solutions (AGS) (http://www.appliedgeographic.com (accessed on 4 March 2022)), which gathers data from the FBI’s Uniform Crime Report (UCR) and from individual cities, counties, and metropolitan areas where available. These data are combined and standardized into a nationwide index with a mean score of 100 (indicating average crime), available for all crime, property crime (i.e., burglaries, motor vehicle theft, larceny) alone, and personal crime (i.e., murder, rape, robbery, assault) alone. A recent study comparing the AGS crime index to crime rates obtained from the Los Angeles Police Department suggests that the personal crime index is the more accurate proxy for urban crime [123], and is therefore the measure used in this analysis. The crime index for 2018 was used to best align with the SV and Walk Score® data.
In addition to potentially being exposed to higher crime rates, socially vulnerable groups living in more walkable or transit-accessible areas may also contend with lower-performing schools [39,124]. Ellen et al. [124], for example, concluded that poor and minority residents living in federally subsidized Low-Income Housing Tax Credit (LIHTC) developments had better access to public transit, but were also more likely to live in more polluted neighborhoods with weak labor markets and lower-performing schools. Grade school quality was therefore assessed using the School Proficiency Index developed by HUD. The index “is a function of the percentage of 4th grade students proficient in reading and math on state test scores for up to three schools within 1.5 miles of the block-group centroid” [125]. Data were obtained by HUD from a number of sources for the 2013–2014 school year. Index values were ranked and standardized to a 0–100 scale, with higher values indicating higher proficiency. To align spatially with the other data used in this study, these block group level data were averaged and aggregated to census tracts. Grade school proficiency data were not available for the state of Kansas, necessitating that the 271 census tracts within the state (all located within either the Wichita or Kansas City metropolitan area) be eliminated from the regression analysis.
Lastly, four additional variables were added to the models to account for variations in SV and urban development patterns across metropolitan areas and regions: MSA population (2016) and three dummy variables representing the U.S. Census Bureau-defined regions Northeast, Midwest, and South. The fourth major U.S. region, the West, was used as the base of comparison as it exhibited the highest average SV.
Prior to running each model, all independent variables were examined for outliers and tested for pairwise correlations that might introduce collinearity. Extreme outliers (i.e., ≥3.0 times the interquartile range) were identified among the personal crime and distance to city center variables. Census tracts with crime indices ≥600 or distance to the city center of ≥76.5 km were removed from the dataset, reducing the number of tracts from 38,008 to 36,829. Pairwise correlations between independent variables were deemed sufficiently low at r2 ≤ 0.6.
5. Results
5.1. Overall Accessibility
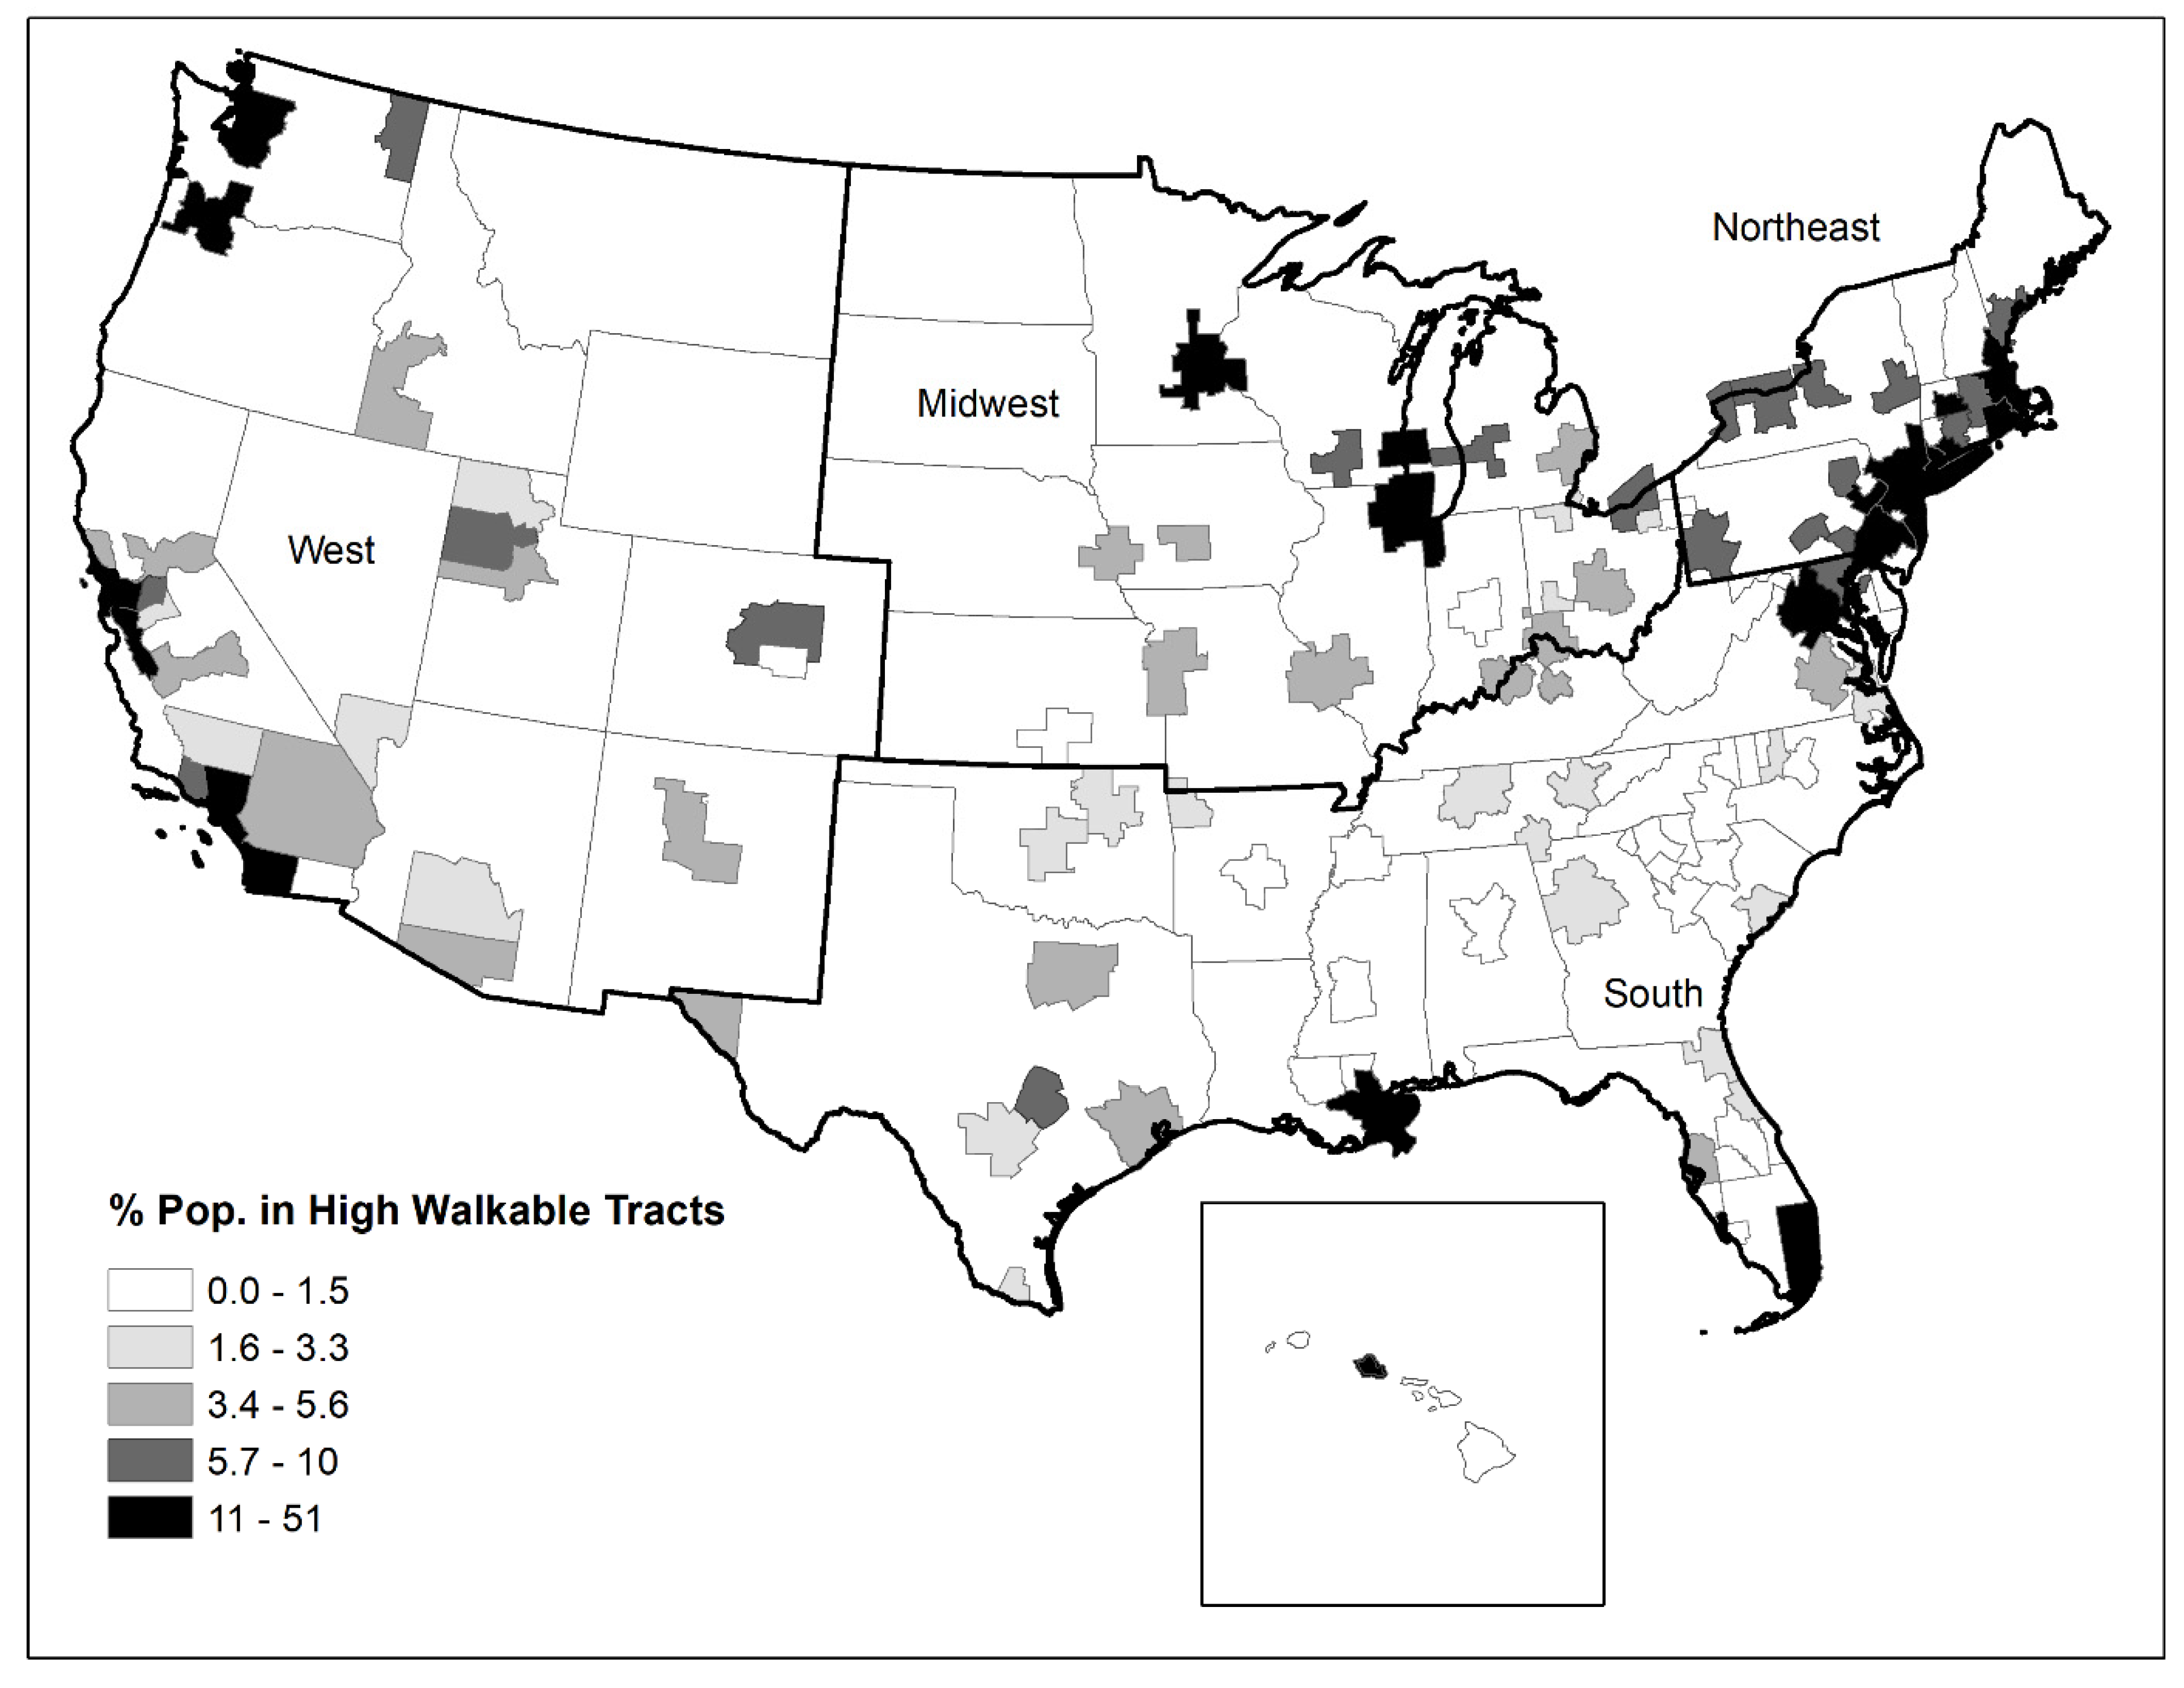
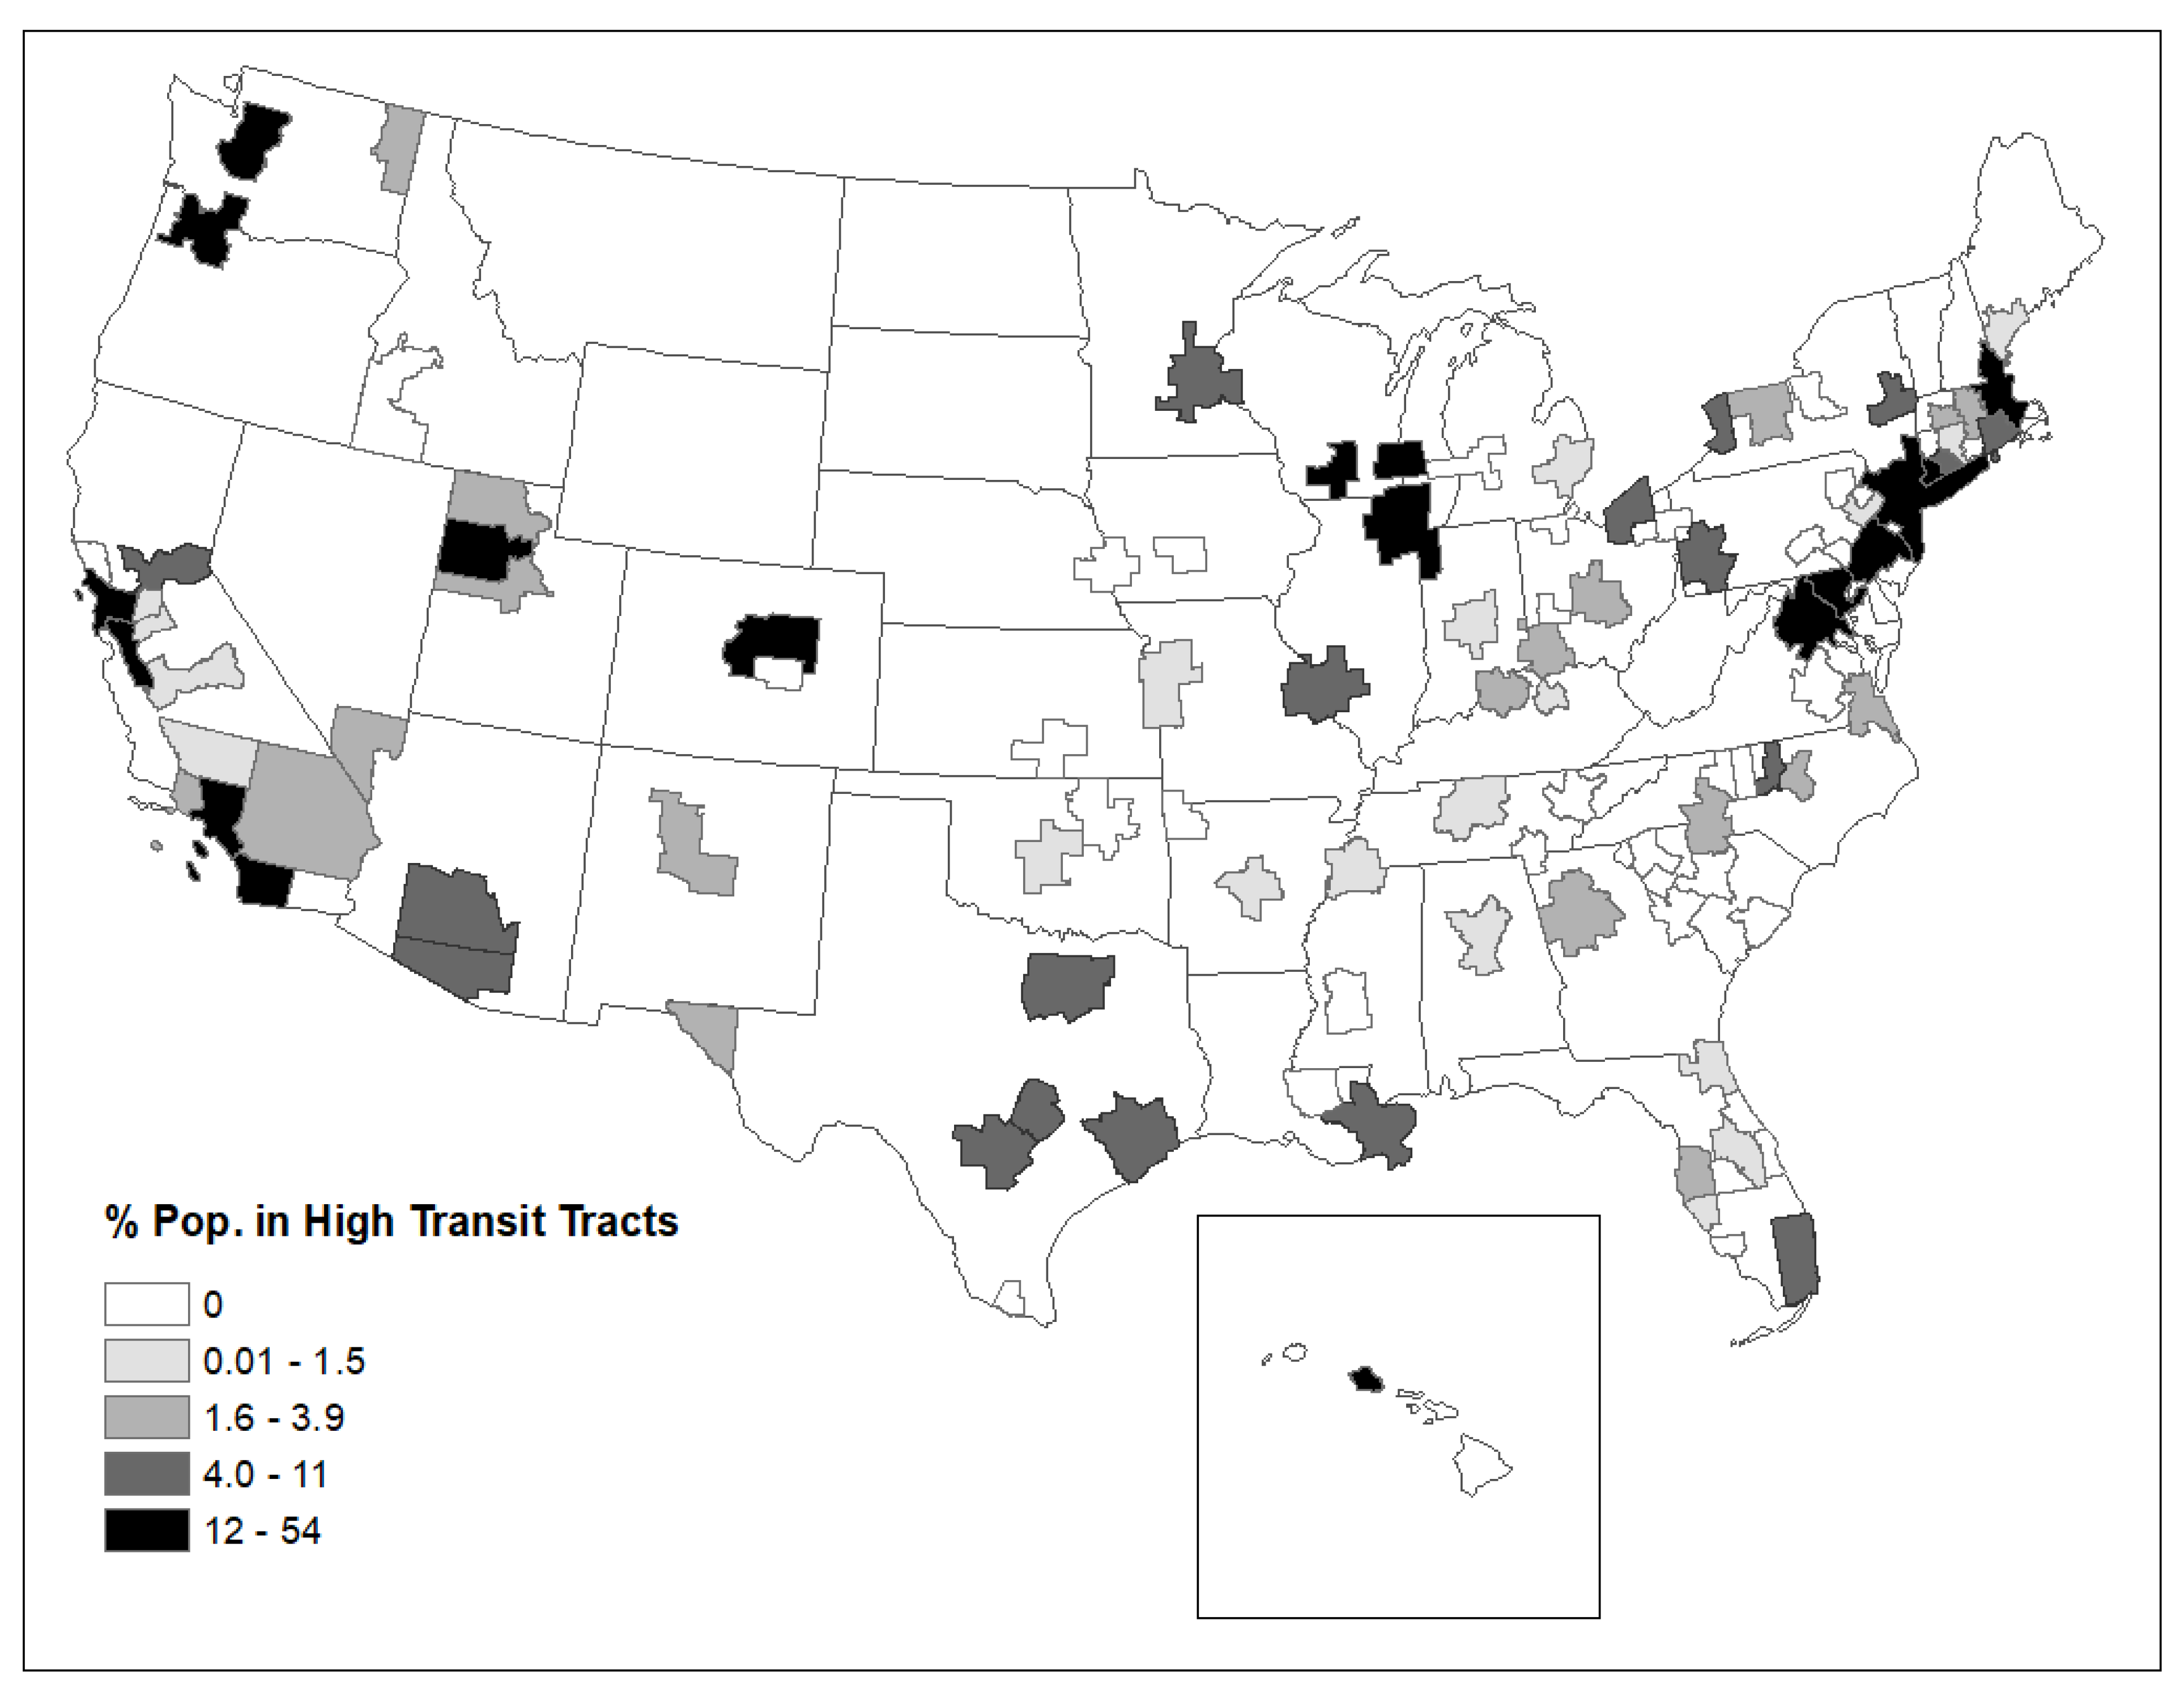
Among large U.S. metropolitan areas, the proportion of all urban residents (i.e., those within census-defined UAs) living in census tracts with high walkability (walk score ≥ 70) ranged from zero in Augusta, GA and Cape Coral-Fort Myers, FL, to 51% in New York City (Appendix A, Figure 1). Other metros with particularly high proportions included San Francisco at 38%, Los Angeles at 34%, and Boston at 28%. The average across all metros was 7.3% with a standard deviation of 8.3%. Geographically, metros with a relatively high proportion of urban residents living in high-walkability tracts were found mainly in the Northeast, Upper Midwest, and West Coast, while those with relatively few were concentrated in the Midwest and Southeast (Figure 1). Several cities in the Southeast, such as Charlotte, NC, Atlanta, GA, and Baton Rouge, LA, have relatively high levels of low-density urban sprawl [126] and proportionally few highly walkable neighborhoods. A similar geographic pattern was observed for the proportion of urban residents living in census tracts with high-transit accessibility (Figure 2). Larger, denser metros in the Northeast corridor from Washington D.C. to Boston, MA had particularly high transit accessibility, while smaller metros in the Midwest and Southeast had some of the lowest. On average, 5.7% of metro residents lived in “high-transit” census tracts, with a maximum of 54% in New York City and a minimum of zero in 33 metros (Appendix B).
5.2. SV and Accessibility
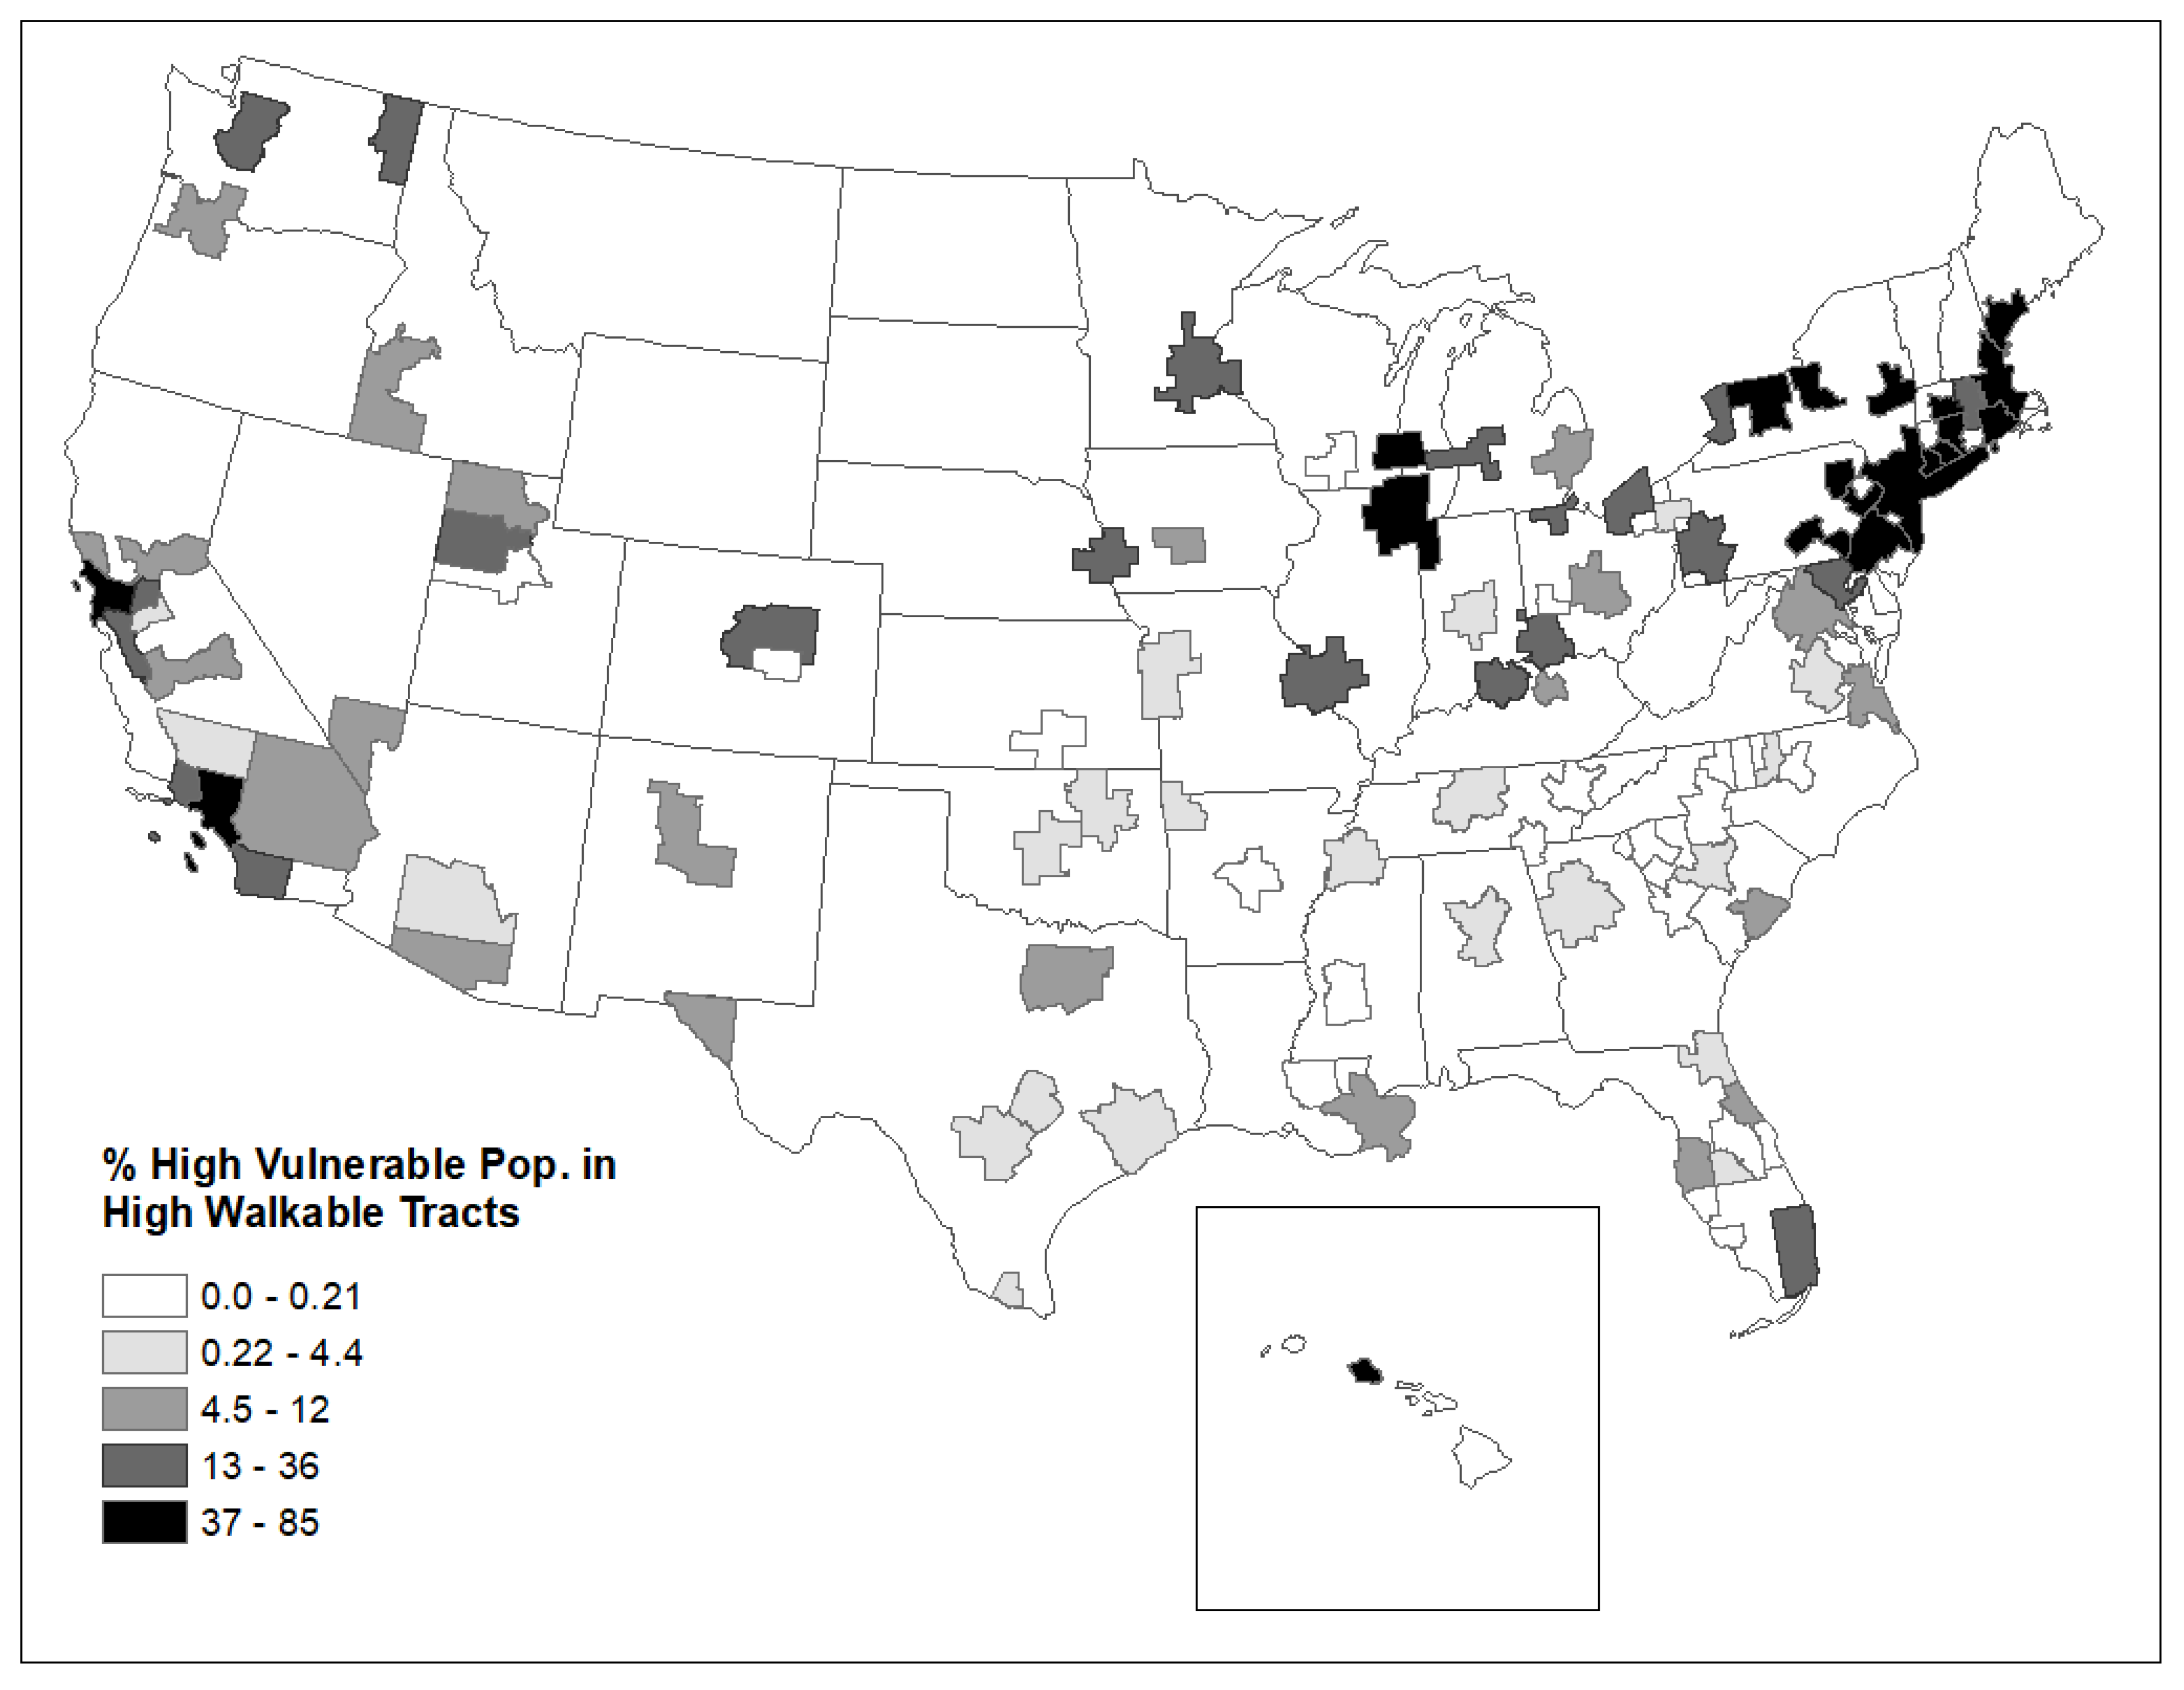
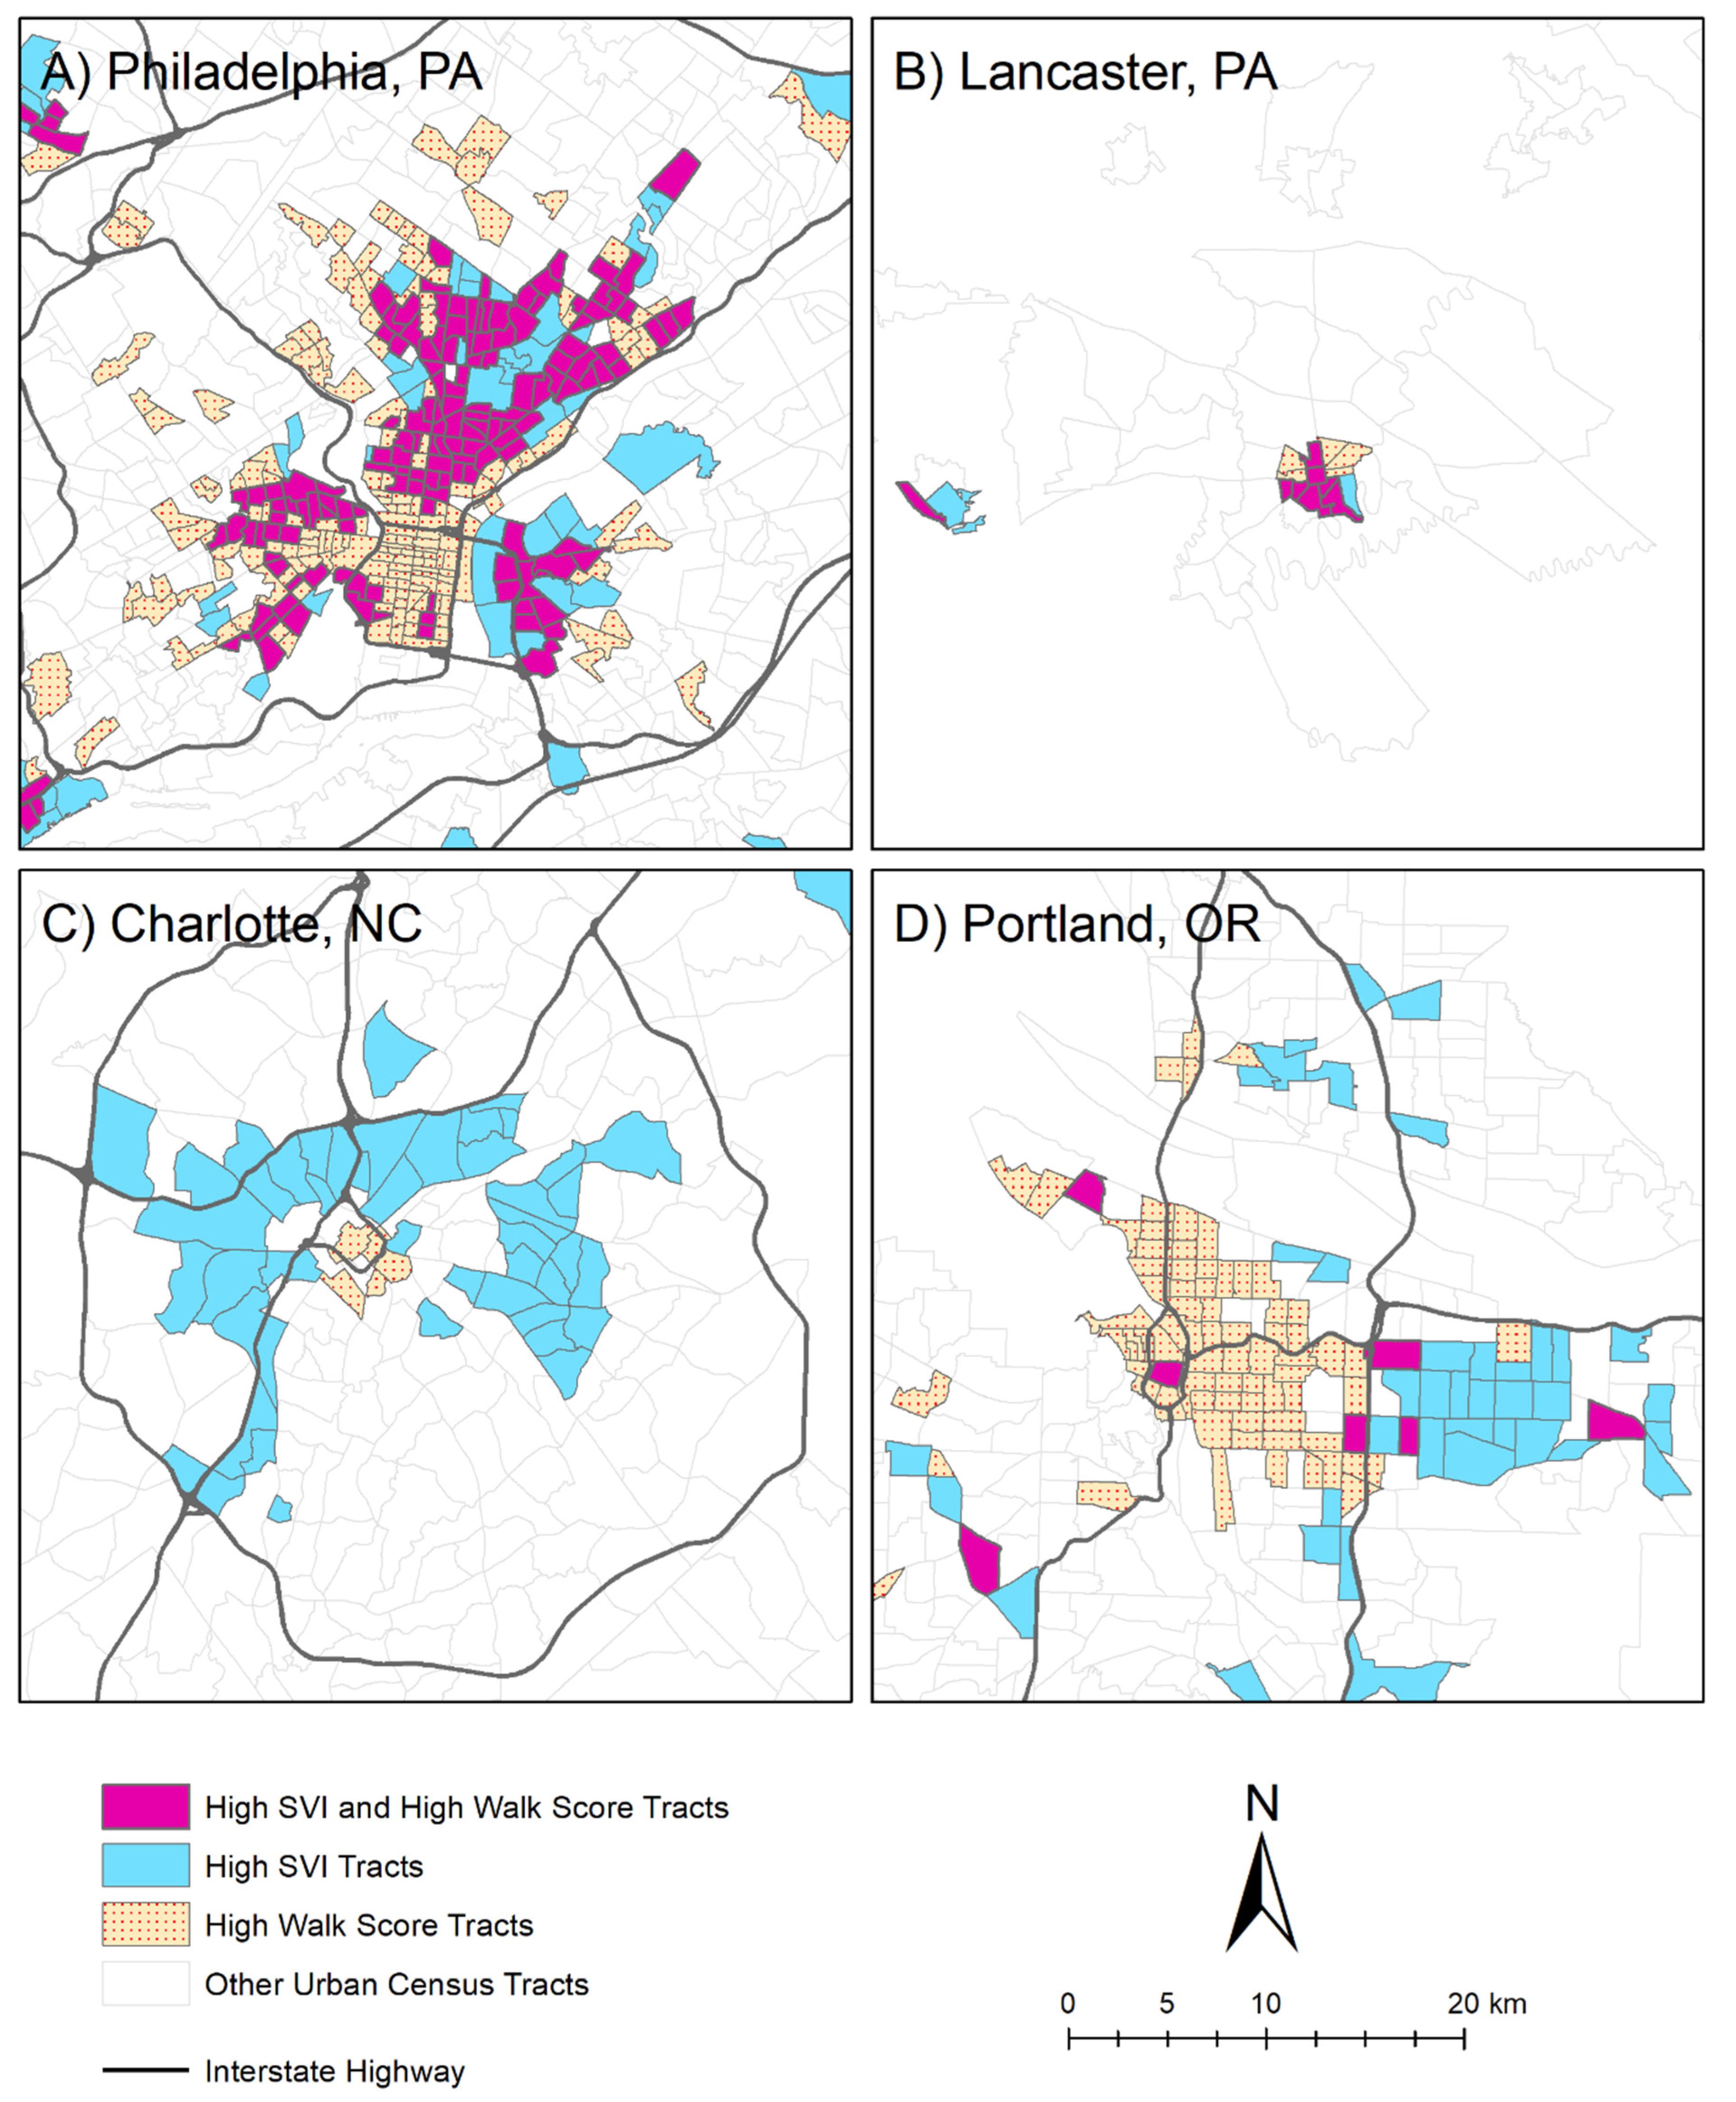
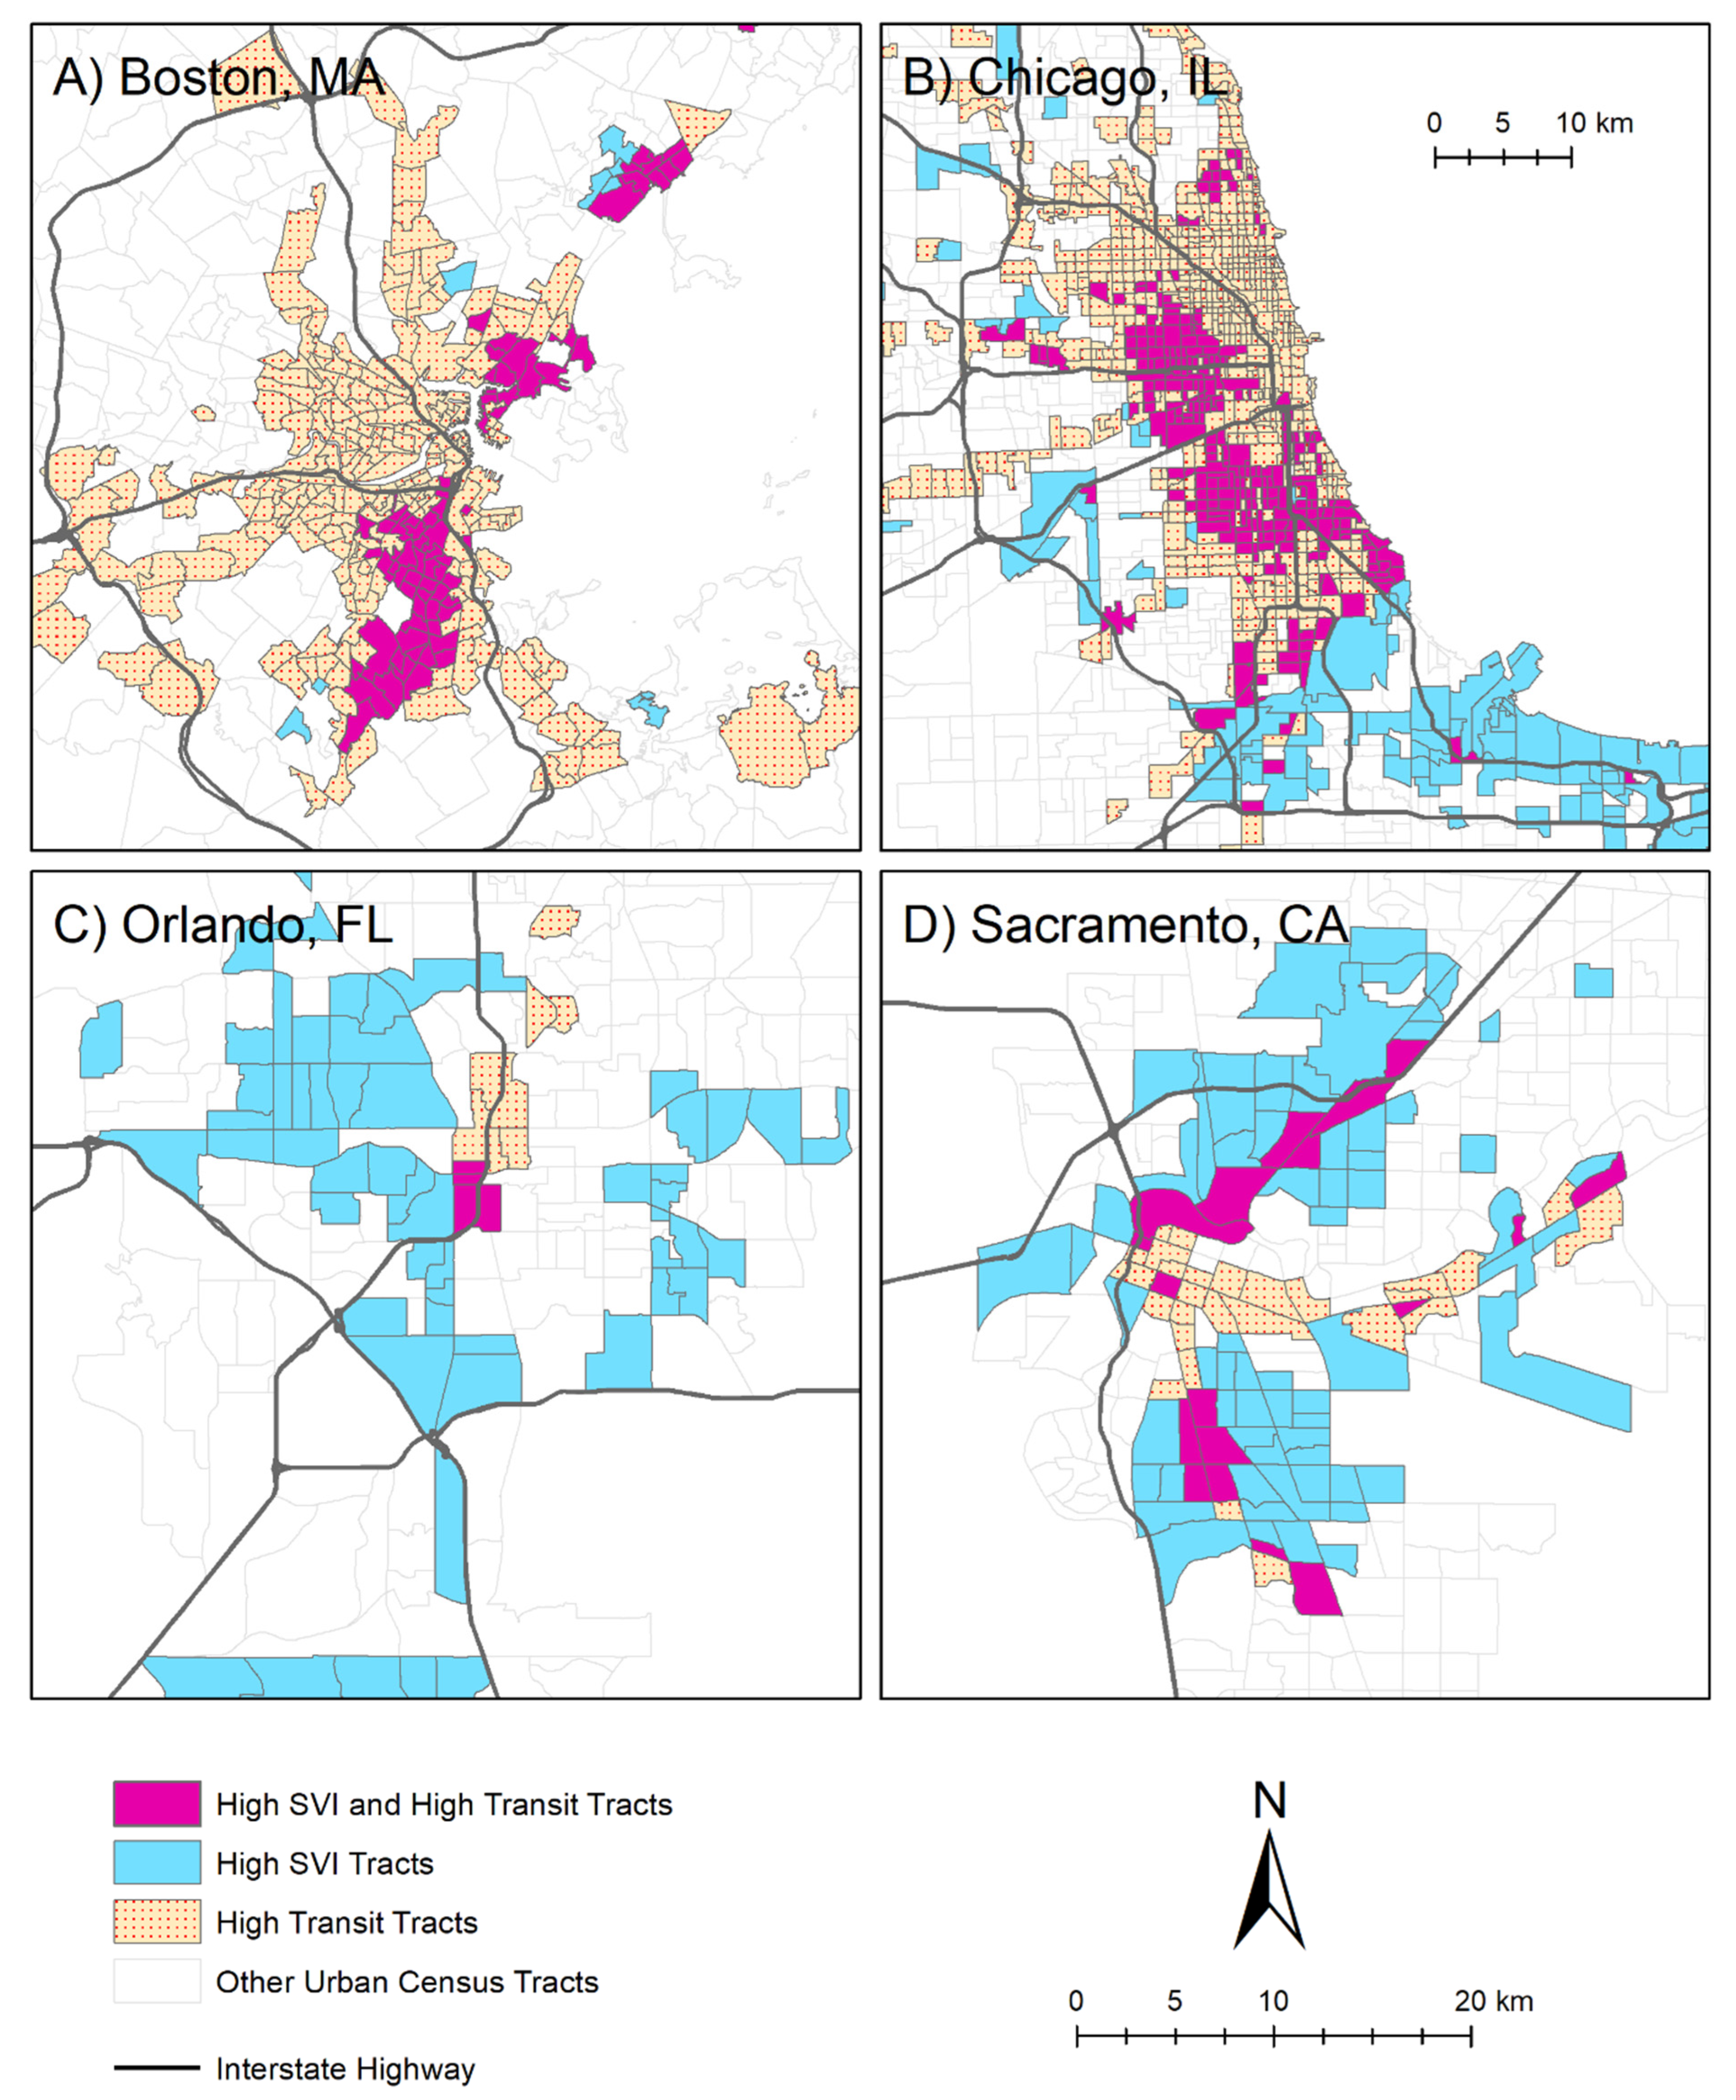
The proportion of metro residents classified as high-SV (i.e., those residing in high-SV census tracts) living in an urban census tract with high walkability ranged from a low of zero in 21 metros concentrated mainly in the Southeast (e.g., Baton Rouge, LA, Charlotte, NC, Little Rock, AR), to a high of 85% in New York, NY (Appendix A; Figure 3). Metros with the highest proportion of SV residents living in high-walkability tracts were again concentrated in the Northeast, Upper Midwest, and West Coast. Eight of the top ten metros were located in the Northeast and include some of the largest cities in the country with particularly dense urban cores such as New York City, Philadelphia (Figure 4A), and Boston, as well as more modestly sized “Rust Belt” metros such as Lancaster, PA (Figure 4B), Allentown, PA, and Syracuse, NY. Metros with relatively low proportions of SV residents in highly walkable neighborhoods were found clustered to a similar degree, with eight of the bottom ten metros located in the Southeast. As mentioned, these “Sun Belt” cities, including the rapidly growing but predominately low-density Charlotte, NC-SC metro area (Figure 4C), tend to have higher levels of urban sprawl. A simple correlation analysis confirmed that MSAs with higher levels of urban sprawl [126] had lower proportions of SV residents in highly walkable neighborhoods (r2 = 0.469, p < 0.001).
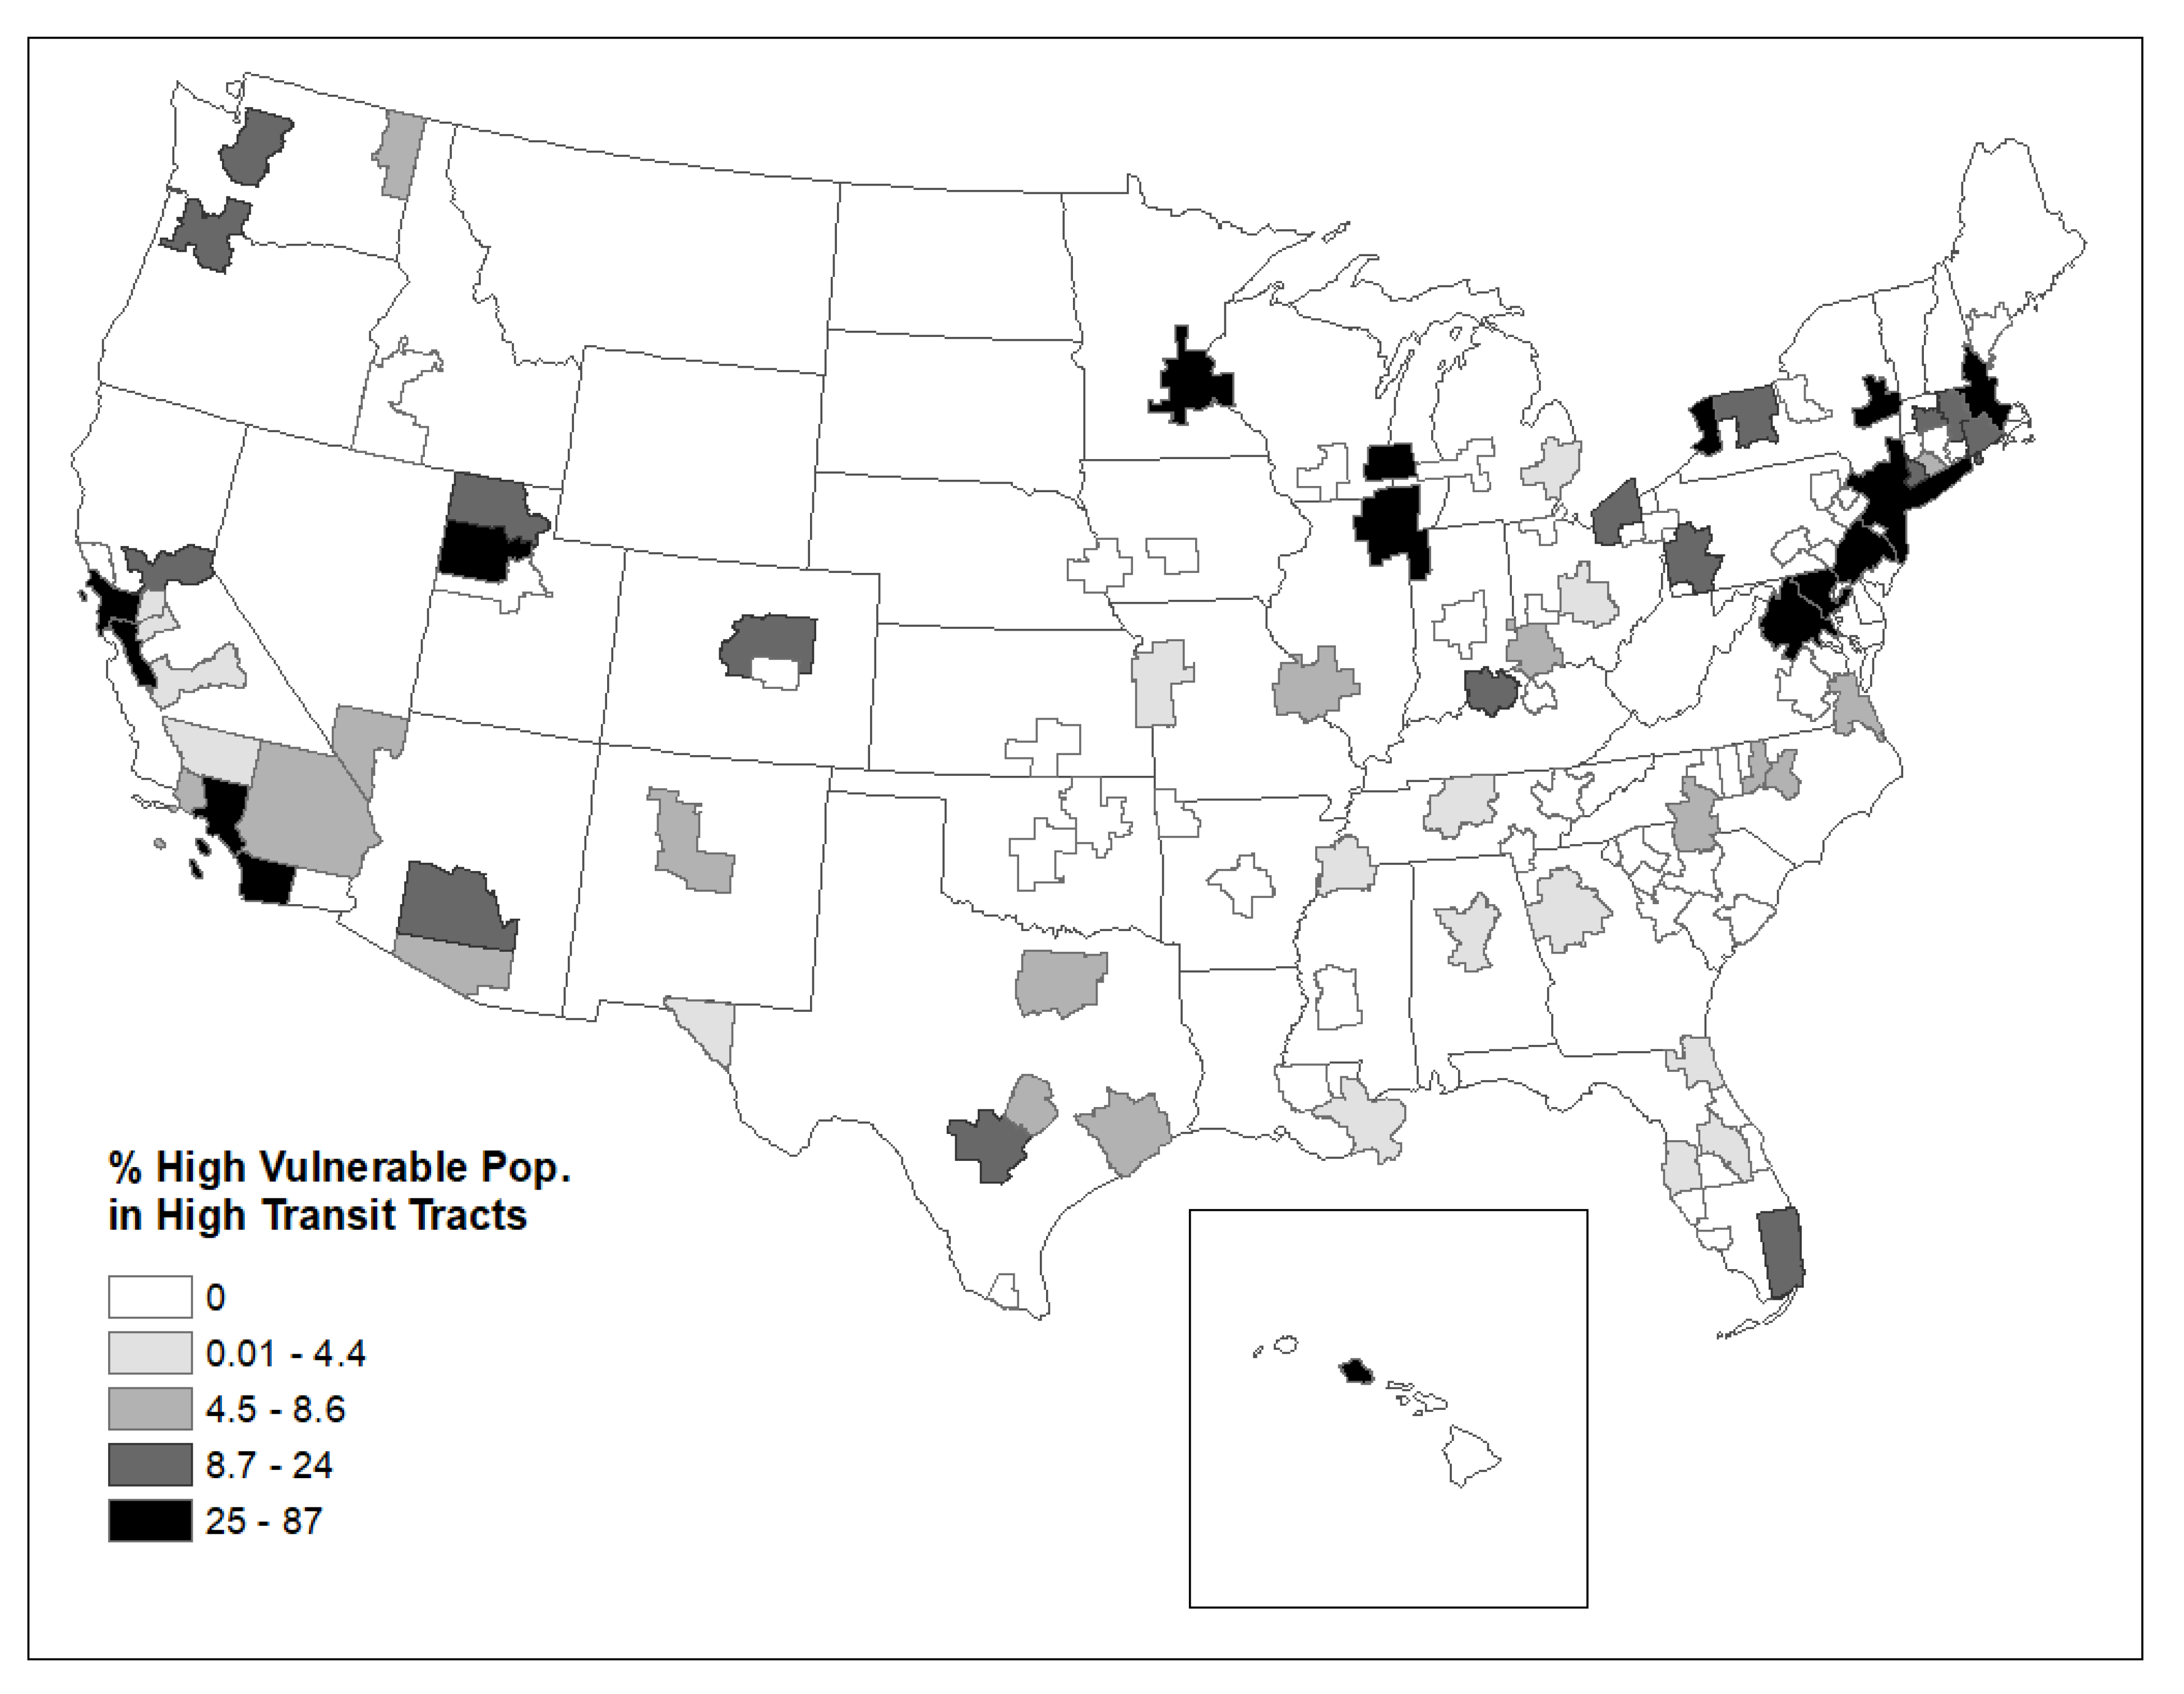
The average proportion of residents by MSA living in high-SV tracts also living in high-transit tracts was 10.8%; nearly twice the average proportion of all residents living in high-transit tracts (Appendix B, Figure 5). New York, Philadelphia, and Boston again had the highest proportions of residents living in high-SV/high-transit census tracts at 87, 82, and 69%, respectively. These metros have extensive rail systems that include subway lines and dense, historical urban centers that support walking and frequent transit service. Though many, including Boston (Figure 6A), contain concentrated areas with high-SV, these areas tend to be well served by transit. Outside the Northeast corridor, Milwaukee and Chicago had relatively high proportions as well at 61 and 59%, respectively. In Chicago there is a clear intra-urban spatial pattern to the SV-transit accessibility nexus, with much of the southeastern portion of the metro (including Gary, IN) designated high-SV but not high-transit (Figure 6B). A large proportion of the MSAs in the study, 43 in total, did not have any census tracts classified as both high-SV and high-transit. Thirty-three of these metros did not contain a single high-transit census tract.
5.3. Equity in Accessibility
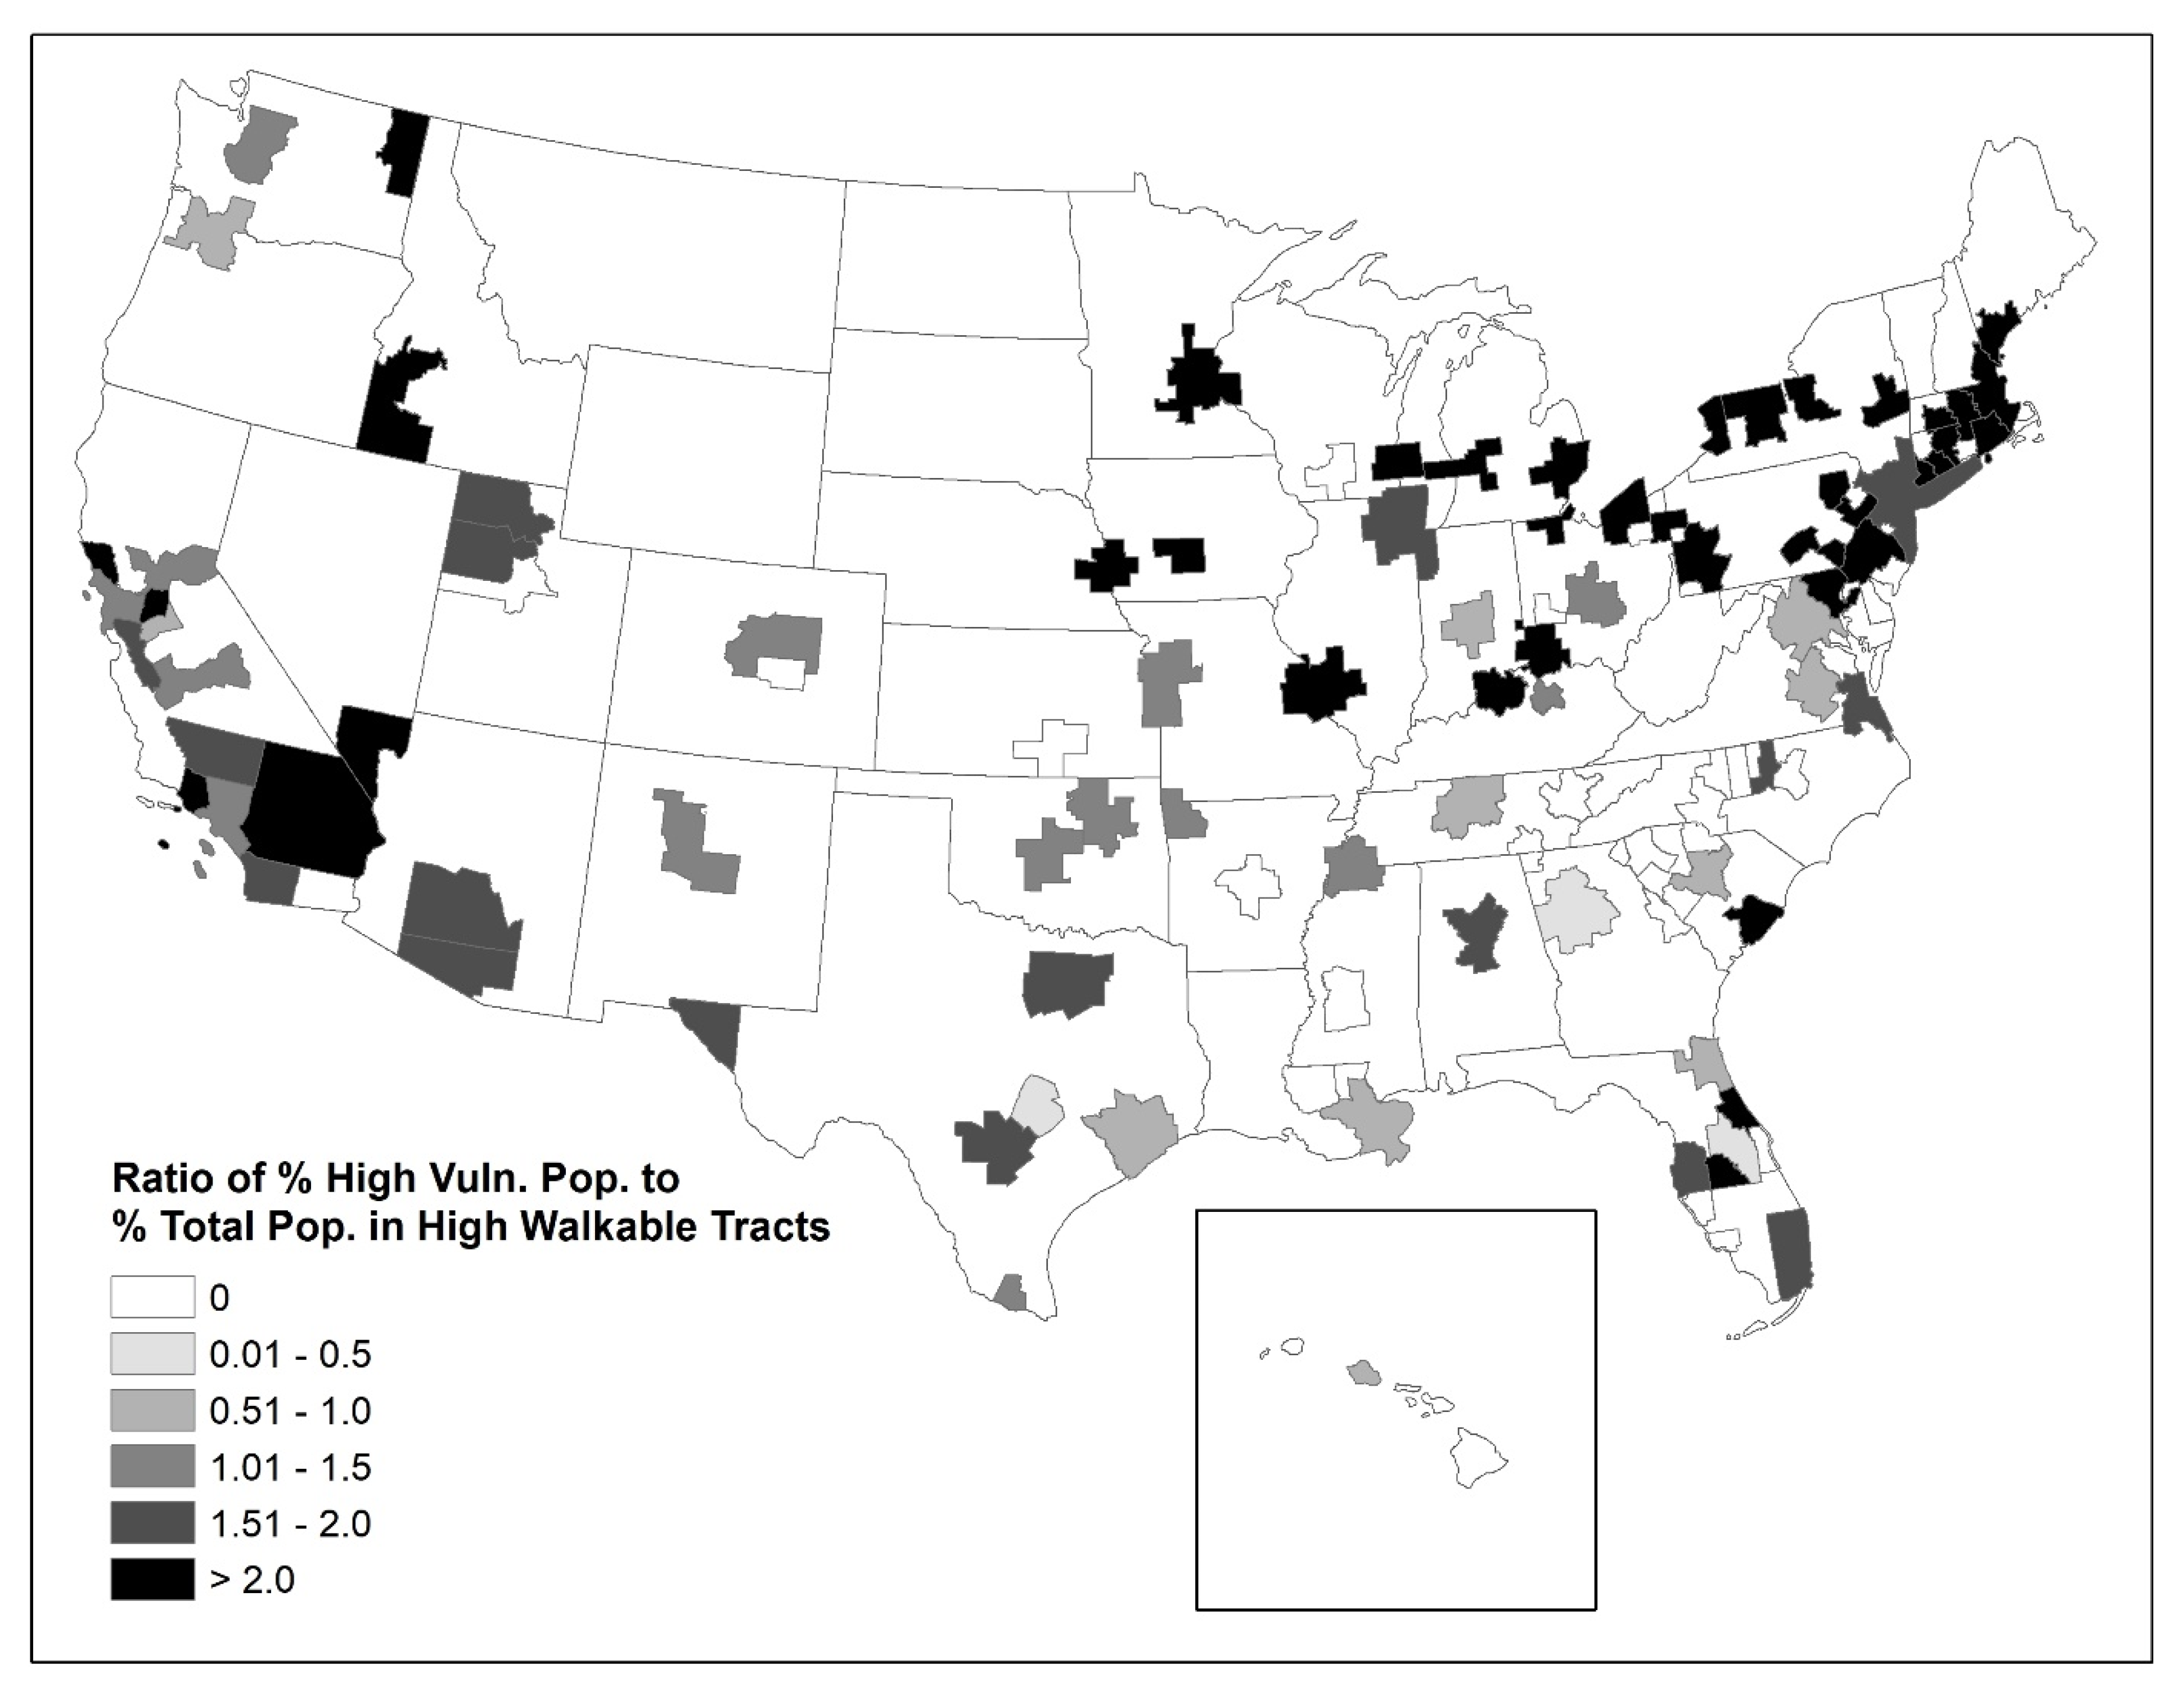
Across all metropolitan areas in the study, urban residents living in high-SV neighborhoods were, on average, twice as likely as all urban residents combined to also live in a census tract with high walkability (Appendix A; Figure 7), and about 1.2 times as likely to live in a census tract with high-transit accessibility (Appendix B; Figure 8). Overall this suggests that SV populations have equitable access to walkable and transit accessible neighborhoods, though again there were variations across MSAs and regions. The correlation between the proportion of SV population versus total population living in highly walkable census tracts by MSA was strong for both walkability (r2 = 0.646, p < 0.001) and transit accessibility (r2 = 0.858, p < 0.001). Lancaster, PA had a particularly high equity ratio with 79% of high-SV residents but only 9% of all residents living in highly walkable census tracts (a “walk equity ratio” of nearly 9:1). Youngtown, OH had the same ratio but much lower accessibility overall with 4.3% of high-SV residents, and only 0.5% of all residents, living in highly walkable tracts. All ten metros with the highest ratios of high-SV population in highly walkable tracts to total population in highly walkable tracts can be found in the Northeast or adjacent Ohio River Valley region (i.e., the “Rust Belt”). They also tend to be smaller metros such as Harrisburg, PA, and Portland, ME, rather than the larger metros in the region such as New York or Boston.
Metropolitan areas with equity ratios less than one indicate that urban residents living in high-SV neighborhoods were, on average, less likely (or equally likely if there were no walkable neighborhoods; the case for Augusta, GA, and Cape Coral, FL, only) than the average urban resident to live in a census tract with high walkability or high-transit accessibility. For walkability this included 32 metros, mostly clustered in the South and Southeast. Many of these metros had few highly walkable or high-transit neighborhoods (e.g., Greensboro, NC, Knoxville, TN, Orlando, FL; Figure 6C), resulting in few residents—either high-SV or low—having access to these amenities. Other metros, including Washington, D.C., New Orleans, LA, Austin, TX, Madison, WI, and Portland, OR (Figure 4D), are particularly notable because they have equity ratios of less than one for walkability yet contain several highly walkable neighborhoods and have near or above the average proportion (~7%) of all urban residents living in highly walkable census tracts. Thus, we can discern two categories of “low equity” metros in regard to walkability: (1) those with few highly walkable neighborhoods available to low- and high-SV households alike, and (2) those with several highly walkable neighborhoods but SV populations are underrepresented and thus may have difficulty affording, or otherwise accessing, these areas. Although less common, high-transit-accessible neighborhoods appear to be more equitably distributed than highly walkable neighborhoods; only four metros with at least one high-transit-accessible neighborhood had equity ratios less than one: Jacksonville, FL, Ogden, UT, Riverside-San Bernardino, CA, and Sacramento, CA (Figure 6D).
5.4. Model Results
The first regression model, with the combined SVI index as the dependent variable, had good predictive capability; the nine independent variables accounted for approximately 48% of the variability in the dependent variable (Table 1). There was some variability in the predictive capability of the models when breaking the SVI into its four constituent themes, however, with 27 to 52% of the variability accounted for (Table 2). Each model met the assumptions of homoscedasticity and low multicollinearity (CI < 15, VIF < 2).
In agreement with the results presented above, the regression models confirm a statistically significant positive relationship between neighborhood walkability and overall SV (Table 1). This positive association held across three of the four individual SV themes; all except the second SV theme, “household composition and disability” (Table 2). The binary variable representing high-transit accessibility was significant and negatively associated with the combined SVI index and SV themes one (e.g., “socioeconomic status”) and two, but positively associated with SV themes three (e.g., “minority status and language”) and four (e.g., “housing type and transportation”).
The relationship between SV and most of the control variables was largely consistent across models. There was a significant positive association between SV and the personal crime index, and a significant negative association between SV and the school proficiency index, across all five models (Table 1 and Table 2). SV was positively associated with distance from the city center with the exception of the third SV theme, “minority status and language”, which decreased significantly with increasing distance. Similarly, SV was positively associated with MSA population with the exception of the second theme, “household composition and disability”, which exhibited a significant negative relationship. The second SV theme was also the only one of the four positively associated with the three U.S. Census regions, indicating that most measures of SV, and including overall SV, was higher in the West relative to the other regions.
6. Discussion
This investigation sought to determine whether socially vulnerable populations within America’s largest cities have equitable access to walkable and transit-accessible neighborhoods. In agreement with King and Clarke [47], the regression models suggest a statistically significant positive relationship between social vulnerability, broadly defined, and neighborhood walkability. The results of this analysis, however, identified at least two crucial caveats to this encouraging association. First, the models suggest that high-SV areas may be more walkable, but they are also associated with higher levels of crime, lower grade school performance, and—potentially—less transit accessibility. Each of these conditions may further disadvantage high-SV populations as well as undermine the potential benefits of living in a walkable community. Bereitschaft [122] recently observed that Blacks were increasingly underrepresented in walkable and transit-accessible urban neighborhoods in the U.S., while at the same time gaining ground in neighborhoods with more affordable housing and lower crime rates, but poorer-performing schools. Some disadvantaged groups may therefore be forced to make trade-offs between neighborhood walkability and/or transit accessibility and other crucial quality of life amenities.
Second, the relationship between SV and both neighborhood walkability and transit accessibility varied by type of social vulnerability. Neighborhood walkability was positively associated with three of the four SVI themes; the only negative association was with the second theme, “household composition and disability”. High-transit accessibility was also negatively associated with this theme, as well as the first, “socioeconomic status”. The “household composition and disability” theme includes the percentage of older (age ≥ 65) and younger (age ≤ 17) residents, as well the proportion of those with disabilities and single-parent households. Given that older and younger residents, and those with disabilities, are less able and likely to drive, these results raise concern about equity in mobility. They also echo the results of King and Clarke [47] while adding that younger and older populations may be further disadvantaged due to a lack of transit accessibility. Recent research on the inter-urban mobility and migration of older adults suggests a distinct preference for less, rather than more, walkable communities [127,128,129]. The result may be less physical activity and poorer health outcomes for older adults [130,131].
While the results indicate significant overlap and correlation between high overall SV and highly walkable neighborhoods, the significant inter-metropolitan variation in access to walkable spaces suggested by Bereitschaft [18] was also apparent. In particular, the more sprawling “Sun Belt” cities in the U.S. South and Southeast stand out for having walk equity ratios less than one, indicating that high-SV urban neighborhoods were less likely than all urban neighborhoods combined to have walk scores ≥ 70. Many cities in the Southeast and Midwest underwent a period of suburban growth and expansion in the mid-to-late 20th century following mass adoption of the automobile, resulting in a predominately low-density suburban landscape [132,133]. Although cities like Atlanta, GA and Charlotte, NC have added light rail lines and densified their urban core with new residential and mixed-use development in recent years [134,135], they are still among the least dense and most auto-centric of large U.S. cities [126]. Thus, in many U.S. cities, the primary cause of poor accessibility to both walkable and transit-accessible areas is likely a lack of walkability and/or transit [122,136]. This is especially true for transit, with nearly a third of all metros in this study lacking fixed-rail service. Other metros, such as Kansas City, MO, offer intra-urban rail service but only along a single line confined mainly to the urban center.
In addition to a dearth of walkable areas and transit service/infrastructure, low overall accessibility and equity in accessibility to walkable and transit-accessible neighborhoods among SV groups may be attributable to economic exclusion due to rising land values and neoliberal policies that promote gentrification, particularly within central city areas [58,74,137]. The supply and affordability of walkable and transit-accessible neighborhoods must be considered jointly to advance equitable access. Form-based zoning codes and tax-increment financing (TIFs), for example, can be used to promote and fund mixed-use development and improve walkability, while the expansion of light rail and bus rapid transit (BRT) systems can broaden and increase transit ridership [138,139]. Yet, new mixed-use and transit-oriented developments (TODs) are often built and marketed toward high-wealth businesses and households [140]. Affordable, below-market rate housing is seldom a component of these developments, which can also catalyze gentrification and potentially lead to the displacement of lower-income groups in surrounding neighborhoods [141,142,143]). It is crucial then that local governments take steps to ensure affordable housing (through requirements or incentives) while taking steps to enhance walkability and transit accessibility [144,145].
Among the primary strengths of this study was the ability to compare a large number of MSAs and identify cohorts with shared challenges and potential solutions. In regard to SV access to walkable and transit-accessible areas, perhaps the most obvious grouping of metros includes those already discussed; sprawling, “Sun Belt” cities with few walkable/transit-accessible neighborhoods that are likely to benefit significantly from urban planning, design, and development strategies such as new urbanism, brownfield/infill, complete streets, and TOD. Another cohort includes those metros with above average walkability or transit accessibility but SV equity ratios <1, such as Portland, OR, Seattle, WA, and Washington, D.C. In these cities, the primary challenge is to ensure affordable housing in walkable neighborhoods, and more generally [144,146]. Although Bereitschaft [18] reported that Portland, OR had the fewest “walk vulnerable” neighborhoods (i.e., neighborhoods with low walkability but high-SV) when compared to Charlotte, NC and Pittsburgh, PA, the author notes that the most significant cluster of highly walkable neighborhoods, located around the urban center, had relatively low SV, while several high-SV neighborhoods in the eastern portion of the city were more than one kilometer from a rail station. The same pattern was observed here. With an urban growth boundary (UGB) focusing development inward around an increasingly desirable urban core, low-income households are finding it difficult to afford “location efficient” and accessible neighborhoods in Portland even with housing vouchers [147]. Among other strategies, local governments should consider implementing inclusionary housing programs that require developers to incorporate affordable housing in market-rate projects [148,149].
Ranking all metros by their walk equity ratio reveals additional potential groupings, but also showcases the diversity among metros, including some located within the same geographic region. Youngstown, OH, and Lancaster, PA, for example, both have walk equity ratios of 8.7, but in Youngstown only 4.3% of the population living in high-SV tracts also lives in highly walkable tracts; in Lancaster it is 79%. Lancaster has a much larger share of the population in highly walkable tracts at 9.1% compared to just 0.5% in Youngstown. Walk Score® indicates that Lancaster is much more walkable overall than Youngtown, with walk scores of 81 and 37, respectively. Both Lancaster and Youngstown are smaller (<1 million) metros located within the U.S. “Rust Belt”, a region of the Midwest and Northeast that has experienced periods of significant economic hardship since the 1960s, primarily as a result of deindustrialization [150]. Lancaster, however, is one of a number of cities in the region that has experienced economic and population growth in recent years. The urban core, in particular, has benefited from strong public–private partnerships that have worked to restore historic architecture, reduce poverty, and promote tourism [151,152].
Youngstown, along with Toledo, OH, Las Vegas, NV, Deltona-Daytona Beach, FL, St. Louis, MO, Omaha, NE, and Cleveland, OH, may benefit from similar revitalization efforts centered on enhanced walkability. Although these metros have relatively high walk equity ratios (≥3) the proportion of all residents living within highly walkable neighborhoods is below average. There is therefore a need within these metros to extend walkability more broadly throughout the urban fabric, which, when combined with affordable housing measures, should give high-SV and low-SV populations alike more choice and more opportunities to benefit from walkable and transit-accessible environments. Enhancing walkability and transit accessibility may also reduce “brain drain” by attracting and retaining young, college-educated residents, which in turn can help drive economic growth and expand employment opportunities [153,154].
While this study does not address the effects of the COVID-19 pandemic directly, the results highlight the spatial inequity in neighborhood walkability and transit accessibility among and within U.S. metropolitan areas that recent research suggests has contributed to socially vulnerable groups facing additional mobility-related challenges. Particularly during the early stages of the pandemic when many businesses, schools, and social services closed or dramatically reduced their hours of operation, poor and other disadvantaged groups experienced high levels of social isolation, deprivation, loneliness, and depression [155,156]. These effects may have been exacerbated in a number of ways including the heightened reliance of high-SV groups on public transit systems that subsequently reduced service during the pandemic [157], a more limited capability and/or capacity to engage in professional and social activities remotely via the internet [158,159], and lower access to, and/or familiarity with, smartphone apps and other digital tools used by transit networks to inform riders of shifting schedules, occupancy restrictions, station closures, and real-time network conditions [160]. The effects of these transit equities—particularly social isolation—appear to have been mitigated to some extent for residents of more walkable neighborhoods, who could still visit friends and access services and amenities that remained open and within walking distance during the pandemic [161]. Thus, metros identified in this study with a low proportion of SV residents in highly walkable neighborhoods, or those with walk-equity ratios less than one, should consider prioritizing the expansion of pedestrian spaces and infrastructure to enhance resiliency in anticipation of future pandemics.
There is much opportunity for future work to expand upon the present analysis. The spatial scope of the study could be extended to include, or focus specifically on, smaller metropolitan or micropolitan areas in the United States or elsewhere, particularly in regard to the accessibility and equity in accessibility to walkable neighborhoods. Additionally, the concepts walkability and social vulnerability can be measured in a variety of ways; future research could consider using alternative measures or indices of walkability and SV to determine how sensitive these results may be to the way in which these concepts are operationalized. It would also be worthwhile to consider how the accessibility of SV populations (beyond the ethno-racial change explored by Bereitschaft [122]) to walkable and transit-accessible neighborhoods has changed over time, and whether various strategies to improve walkability, enhance transit access, and ensure affordable housing have been effective. Such an analysis may require an alternative assessment of neighborhood walkability and transit accessibility given that the Walk Score® and Transit Score® metrics have evolved over time and in ways that are not entirely transparent [161]. Walkability could be assessed using a variety of alternative methodologies that utilize the latest deep-learning and GIS technologies [162], some of which may be efficiently deployed at a national scale using readily available open-source datasets like OpenStreetMap [163]. Furthermore, the individual elements of the Walk Score® metric, including intersection density, block length, and the density of local amenities, could be considered independently as well as jointly in future analyses. Additional quantifiable features of the urban streetscape environment expected to influence walking behavior, yet which are not currently included in the Walk Score® metric, such as building setbacks, continuity of building frontage, adjacent street traffic volume, and presence of pedestrian infrastructure including sidewalks and crosswalks [164,165], should also be considered when possible.
7. Conclusions
Do U.S. urban neighborhoods with high-SV have an equal or better chance than average of being a walkable neighborhood? The results of this study suggest that in most metropolitan areas this is currently the case. However, there are numerous exceptions, and those with access to walkable neighborhoods may have to contend with lower transit accessibility, higher crime rates, and poorer-performing schools. Particularly those cities identified here to have either walk or transit equity ratios less than one should consider prioritizing improvements in the availability and accessibility of these amenities to better serve disadvantaged groups. Crucially, a large proportion of metros, particularly in the U.S. South, appear to have few or no highly walkable and/or transit-accessible census tracts, making it difficult for both SV and non-SV populations to access resources without an automobile. In other cities, especially larger metros with competitive housing markets such as Seattle, Portland, and Washington, D.C., the primary challenge is likely the paucity of affordable housing in areas that are both walkable and transit-accessible. Cities and metropolitan jurisdictions should consider implementing a two-pronged strategy to maximize the accessibility of SV populations to walkable and transit-accessible neighborhoods: First, increase the number and proportion of walkable and transit-accessible neighborhoods using infill development, progressive zoning regulations, and investments in intra-urban transit systems (particularly fixed-rail and BRT systems). Second, ensure that both new and existing walkable/transit accessible neighborhoods are affordable by utilizing mandatory inclusionary zoning, particularly in “location efficient”, high-demand areas. These measures are likely to not only result in a more equitable city, but a more competitive and prosperous one as well.
Funding
This research received no external funding.
Data Availability Statement
Data is available from the author upon request.
Conflicts of Interest
The authors declare no conflict of interest.
Appendix A

Table A1.
Metropolitan areas ranked by proportion of urban population in high-SV census tracts also living in highly walkable (walk score ≥ 70) tracts.
Table A1.
Metropolitan areas ranked by proportion of urban population in high-SV census tracts also living in highly walkable (walk score ≥ 70) tracts.
| Metropolitan Area | % SV in High Walk Tracts | % Total in High Walk Tracts | Ratio |
|---|---|---|---|
| New York, NY | 85.3 | 50.8 | 1.7 |
| Lancaster, PA | 79.4 | 9.1 | 8.7 |
| Philadelphia, PA | 73.1 | 25.3 | 2.9 |
| Boston, MA | 71.0 | 28.2 | 2.5 |
| Providence, RI | 68.6 | 21.7 | 3.2 |
| Bridgeport, CT | 61.7 | 19.9 | 3.1 |
| Allentown, PA | 56.6 | 14.1 | 4.0 |
| Springfield, MA | 49.2 | 13.4 | 3.7 |
| Los Angeles, CA | 48.2 | 33.6 | 1.4 |
| Syracuse, NY | 47.7 | 7.9 | 6.0 |
| Portland, ME | 47.2 | 5.9 | 8.0 |
| Harrisburg, PA | 46.3 | 7.5 | 6.2 |
| Milwaukee, WI | 44.4 | 19.5 | 2.3 |
| Chicago, IL | 43.5 | 25.3 | 1.7 |
| Scranton, PA | 39.5 | 9.5 | 4.1 |
| New Haven, CT | 38.9 | 12.7 | 3.1 |
| Hartford, CT | 37.6 | 7.6 | 5.0 |
| Albany, NY | 37.5 | 10.4 | 3.6 |
| Rochester, NY | 37.5 | 9.1 | 4.1 |
| Urban Honolulu, HI | 37.0 | 19.6 | 1.9 |
| Baltimore, MD | 36.2 | 9.5 | 3.8 |
| Minneapolis-St. Paul, MN | 33.4 | 10.9 | 3.1 |
| Buffalo, NY | 32.1 | 10.1 | 3.2 |
| Worcester, MA | 30.9 | 8.1 | 3.8 |
| Grand Rapids, MI | 29.1 | 8.6 | 3.4 |
| San Diego, CA | 28.4 | 15.3 | 1.9 |
| San Jose, CA | 23.3 | 15.3 | 1.5 |
| Miami, FL | 22.9 | 13.1 | 1.7 |
| Pittsburgh, PA | 20.5 | 8.9 | 2.3 |
| Stockton, CA | 20.0 | 9.6 | 2.1 |
| Cleveland, OH | 19.4 | 6.2 | 3.1 |
| Oxnard, CA | 18.7 | 6.9 | 2.7 |
| Seattle, WA | 17.2 | 16.8 | 1.0 |
| St. Louis, MO | 16.9 | 5.3 | 3.2 |
| Spokane, WA | 16.1 | 6.2 | 2.6 |
| Salt Lake City, UT | 15.9 | 8.2 | 1.9 |
| Omaha, NE | 15.2 | 4.9 | 3.1 |
| Toledo, OH | 14.8 | 2.4 | 6.2 |
| Denver, CO | 14.7 | 9.8 | 1.5 |
| Cincinnati, OH | 13.8 | 5.2 | 2.6 |
| Louisville, KY | 13.5 | 4.8 | 2.8 |
| Portland, OR | 11.8 | 15.4 | 0.8 |
| New Orleans, LA | 11.6 | 14.3 | 0.8 |
| Detroit, MI | 11.6 | 4.6 | 2.5 |
| Boise City, ID | 11.5 | 5.6 | 2.1 |
| Washington, DC | 11.4 | 13.3 | 0.9 |
| Des Moines, IA | 10.1 | 4.4 | 2.3 |
| Santa Rosa, CA | 9.9 | 4.9 | 2.0 |
| Las Vegas, NV | 9.5 | 2.8 | 3.4 |
| Columbus, OH | 8.2 | 5.6 | 1.5 |
| Riverside-San Bernardino, CA | 8.1 | 3.6 | 2.2 |
| Tucson, AZ | 7.8 | 5.1 | 1.5 |
| Charleston, SC | 6.8 | 3.1 | 2.2 |
| Sacramento, CA | 6.8 | 4.9 | 1.4 |
| Dallas-Fort Worth, TX | 6.5 | 4.0 | 1.6 |
| Albuquerque, NM | 6.5 | 4.9 | 1.3 |
| Virginia Beach-Norfolk, VA | 6.5 | 3.3 | 1.9 |
| Tampa-St. Petersburg, FL | 6.2 | 3.5 | 1.8 |
| Fresno, CA | 6.1 | 4.4 | 1.4 |
| Deltona-Daytona Beach, FL | 6.0 | 1.8 | 3.3 |
| El Paso, TX | 5.4 | 3.6 | 1.5 |
| Lexington, KY | 5.2 | 5.2 | 1.0 |
| Ogden, UT | 5.1 | 3.1 | 1.7 |
| Durham-Chapel Hill, NC | 4.4 | 2.2 | 2.0 |
| Youngstown, OH | 4.3 | 0.5 | 8.7 |
| Kansas City, MO | 4.2 | 3.6 | 1.2 |
| Houston, TX | 4.0 | 4.1 | 1.0 |
| San Antonio, TX | 3.9 | 2.4 | 1.6 |
| Richmond, VA | 3.6 | 5.0 | 0.7 |
| Phoenix, AZ | 3.5 | 1.8 | 2.0 |
| Bakersfield, CA | 3.2 | 1.8 | 1.8 |
| Oklahoma City, OK | 3.0 | 2.2 | 1.3 |
| McAllen, TX | 3.0 | 2.6 | 1.2 |
| Fayetteville, AR | 2.5 | 2.0 | 1.2 |
| Tulsa, OK | 2.4 | 1.6 | 1.5 |
| Austin, TX | 2.2 | 6.2 | 0.4 |
| Lakeland-Winter Haven, FL | 2.0 | 0.8 | 2.5 |
| Nashville, TN | 2.0 | 2.8 | 0.7 |
| Birmingham, AL | 1.9 | 1.2 | 1.6 |
| Jacksonville, FL | 1.8 | 2.4 | 0.8 |
| Modesto, CA | 1.7 | 2.7 | 0.6 |
| Memphis, TN | 1.5 | 1.4 | 1.1 |
| Columbia, SC | 1.4 | 1.5 | 0.9 |
| Indianapolis, IN | 1.1 | 1.5 | 0.7 |
| Atlanta, GA | 0.7 | 2.3 | 0.3 |
| Orlando, FL | 0.2 | 1.5 | 0.1 |
| Madison, WI | 0.0 | 10.0 | 0.0 |
| Provo-Orem, UT | 0.0 | 5.2 | 0.0 |
| Dayton, OH | 0.0 | 2.6 | 0.0 |
| Knoxville, TN | 0.0 | 1.9 | 0.0 |
| Akron, OH | 0.0 | 1.6 | 0.0 |
| Chattanooga, TN-GA | 0.0 | 1.6 | 0.0 |
| Raleigh, NC | 0.0 | 1.5 | 0.0 |
| Greensboro, NC | 0.0 | 1.2 | 0.0 |
| North Port-Sarasota, FL | 0.0 | 1.2 | 0.0 |
| Greenville, SC | 0.0 | 1.1 | 0.0 |
| Little Rock, AR | 0.0 | 1.1 | 0.0 |
| Wichita, KS | 0.0 | 1.0 | 0.0 |
| Palm Bay, FL | 0.0 | 0.9 | 0.0 |
| Colorado Springs, CO | 0.0 | 0.8 | 0.0 |
| Winston-Salem, NC | 0.0 | 0.7 | 0.0 |
| Baton Rouge, LA | 0.0 | 0.7 | 0.0 |
| Jackson, MS | 0.0 | 0.7 | 0.0 |
| Charlotte, NC | 0.0 | 0.6 | 0.0 |
| Augusta, GA | 0.0 | 0.0 | -- |
| Cape Coral-Fort Myers, FL | 0.0 | 0.0 | -- |
Appendix B
Table A2.
Metropolitan areas ranked by proportion of urban population in high-SV census tracts also living in high-transit-accessible tracts.
Table A2.
Metropolitan areas ranked by proportion of urban population in high-SV census tracts also living in high-transit-accessible tracts.
| Metropolitan Area | % SV in High-Transit Tracts | % Total in High-Transit Tracts | Ratio |
|---|---|---|---|
| New York, NY | 86.8 | 54.4 | 1.5 |
| Philadelphia, PA | 82.1 | 34.7 | 2.4 |
| Milwaukee, WI | 68.6 | 31.1 | 2.2 |
| San Jose, CA | 61.4 | 18.4 | 3.3 |
| San Diego, CA | 60.9 | 16.5 | 3.7 |
| Boston, MA | 58.6 | 34.5 | 1.7 |
| Urban Honolulu, HI | 50.0 | 24.2 | 2.1 |
| Baltimore, MD | 47.3 | 30.4 | 1.6 |
| Washington, DC | 40.9 | 25.6 | 1.6 |
| Buffalo, NY | 40.3 | 17.8 | 2.3 |
| Chicago, IL | 39.6 | 25.6 | 1.5 |
| Portland, OR | 39.4 | 11.5 | 3.4 |
| Miami, FL | 34.7 | 10.1 | 3.5 |
| Salt Lake City, UT | 34.2 | 18.6 | 1.8 |
| Louisville, KY | 24.8 | 5.3 | 4.7 |
| Albany, NY | 24.3 | 15.6 | 1.6 |
| Worcester, MA | 24.0 | 8.1 | 3.0 |
| Los Angeles, CA | 22.4 | 19.4 | 1.2 |
| Minneapolis-St. Paul, MN | 19.5 | 18.1 | 1.1 |
| Seattle, WA | 18.0 | 10.4 | 1.7 |
| Denver, CO | 17.9 | 13.1 | 1.4 |
| Durham-Chapel Hill, NC | 15.3 | 3.1 | 5.0 |
| Pittsburgh, PA | 14.4 | 7.8 | 1.8 |
| Virginia Beach-Norfolk, VA | 14.1 | 3.4 | 4.1 |
| Bridgeport, CT | 13.7 | 9.8 | 1.4 |
| Spokane, WA | 12.4 | 2.5 | 4.9 |
| Springfield, MA | 11.8 | 5.5 | 2.1 |
| Charlotte, NC | 10.8 | 2.4 | 4.4 |
| St. Louis, MO | 10.0 | 5.0 | 2.0 |
| New Orleans, LA | 9.6 | 2.2 | 4.3 |
| Raleigh, NC | 9.4 | 4.3 | 2.2 |
| Cincinnati, OH | 8.6 | 5.0 | 1.7 |
| Oxnard, CA | 8.2 | 2.8 | 2.9 |
| Phoenix, AZ | 7.9 | 5.4 | 1.5 |
| Houston, TX | 7.0 | 3.6 | 2.0 |
| Rochester, NY | 6.5 | 6.0 | 1.1 |
| Providence, RI | 6.3 | 5.2 | 1.2 |
| Atlanta, GA | 6.2 | 2.2 | 2.9 |
| Austin, TX | 5.9 | 3.1 | 1.9 |
| El Paso, TX | 5.8 | 2.1 | 2.8 |
| San Antonio, TX | 5.6 | 5.6 | 1.0 |
| Sacramento, CA | 5.5 | 8.9 | 0.6 |
| Las Vegas, NV | 5.2 | 2.4 | 2.1 |
| Dallas-Fort Worth, TX | 4.8 | 4.5 | 1.1 |
| Albuquerque, NM | 4.7 | 3.1 | 1.5 |
| Tampa-St. Petersburg, FL | 4.7 | 2.0 | 2.3 |
| Tucson, AZ | 4.4 | 2.7 | 1.6 |
| Ogden, UT | 4.4 | 9.7 | 0.5 |
| New Haven, CT | 4.3 | 4.0 | 1.1 |
| Memphis, TN | 2.8 | 1.7 | 1.6 |
| Kansas City, MO | 2.6 | 1.9 | 1.4 |
| Modesto, CA | 2.5 | 1.5 | 1.7 |
| Columbus, OH | 2.2 | 1.6 | 1.4 |
| Provo-Orem, UT | 1.9 | 0.8 | 2.4 |
| Riverside-San Bernardino, CA | 1.8 | 3.4 | 0.5 |
| Lexington, KY | 1.8 | 0.7 | 2.4 |
| Madison, WI | 1.8 | 0.8 | 2.2 |
| Fresno, CA | 1.7 | 0.9 | 1.9 |
| Bakersfield, CA | 1.7 | 0.8 | 2.1 |
| Nashville, TN | 1.5 | 1.2 | 1.2 |
| Jacksonville, FL | 1.0 | 1.6 | 0.6 |
| North Port-Sarasota, FL | 0.6 | 0.4 | 1.6 |
| Little Rock, AR | 0.4 | 0.2 | 1.8 |
| Cleveland, OH | 0.0 | 12.0 | 0.0 |
| Birmingham, AL | 0.0 | 1.7 | 0.0 |
| Stockton, CA | 0.0 | 1.6 | 0.0 |
| Detroit, MI | 0.0 | 1.3 | 0.0 |
| Orlando, FL | 0.0 | 1.0 | 0.0 |
| Portland, ME | 0.0 | 0.7 | 0.0 |
| Indianapolis, IN | 0.0 | 0.6 | 0.0 |
| Oklahoma City, OK | 0.0 | 0.6 | 0.0 |
| Allentown, PA | 0.0 | 0.4 | 0.0 |
| Hartford, CT | 0.0 | 0.2 | 0.0 |
| Akron, OH | 0.0 | 0.0 | -- |
| Augusta, GA | 0.0 | 0.0 | -- |
| Baton Rouge, LA | 0.0 | 0.0 | -- |
| Boise City, ID | 0.0 | 0.0 | -- |
| Cape Coral-Fort Myers, FL | 0.0 | 0.0 | -- |
| Charleston, SC | 0.0 | 0.0 | -- |
| Chattanooga, TN-GA | 0.0 | 0.0 | -- |
| Colorado Springs, CO | 0.0 | 0.0 | -- |
| Columbia, SC | 0.0 | 0.0 | -- |
| Dayton, OH | 0.0 | 0.0 | -- |
| Deltona-Daytona Beach, FL | 0.0 | 0.0 | -- |
| Des Moines, IA | 0.0 | 0.0 | -- |
| Fayetteville, AR | 0.0 | 0.0 | -- |
| Grand Rapids, MI | 0.0 | 0.0 | -- |
| Greensboro, NC | 0.0 | 0.0 | -- |
| Greenville, SC | 0.0 | 0.0 | -- |
| Harrisburg, PA | 0.0 | 0.0 | -- |
| Jackson, MS | 0.0 | 0.0 | -- |
| Knoxville, TN | 0.0 | 0.0 | -- |
| Lakeland-Winter Haven, FL | 0.0 | 0.0 | -- |
| Lancaster, PA | 0.0 | 0.0 | -- |
| McAllen, TX | 0.0 | 0.0 | -- |
| Omaha, NE | 0.0 | 0.0 | -- |
| Palm Bay, FL | 0.0 | 0.0 | -- |
| Richmond, VA | 0.0 | 0.0 | -- |
| Santa Rosa, CA | 0.0 | 0.0 | -- |
| Scranton, PA | 0.0 | 0.0 | -- |
| Syracuse, NY | 0.0 | 0.0 | -- |
| Toledo, OH | 0.0 | 0.0 | -- |
| Tulsa, OK | 0.0 | 0.0 | -- |
| Wichita, KS | 0.0 | 0.0 | -- |
| Winston-Salem, NC | 0.0 | 0.0 | -- |
| Youngstown, OH | 0.0 | 0.0 | -- |
References
- Boer, J.T.; Pastor, M., Jr.; Sadd, J.L.; Snyder, L.D. Is there environmental racism? The demographics of hazardous waste in Los Angeles. Soc. Sci. Q. 1997, 78, 793–810. [Google Scholar]
- Clark, L.P.; Millet, D.B.; Marshall, J.D. National patterns in environmental injustice and inequality in outdoor NO2 air pollution in the United States. PLoS ONE 2014, 9, e94431. [Google Scholar] [CrossRef] [PubMed] [Green Version]
- Chakraborty, J. Unequal proximity to environmental pollution: An intersectional analysis of people with disabilities in Harris County, Texas. Prof. Geogr. 2020, 72, 521–534. [Google Scholar] [CrossRef]
- Sobotta, R.R.; Campbell, H.E.; Owens, B.J. Aviation noise and environmental justice: The barrio barrier. J. Reg. Sci. 2007, 47, 125–154. [Google Scholar] [CrossRef]
- Carrier, M.; Apparicio, P.; Seguin, A.-M. Road traffic noise in Montreal and environmental equity: What is the situation for the most vulnerable population groups? J. Transp. Geogr. 2016, 51, 1–8. [Google Scholar] [CrossRef]
- Debbage, N. Multiscalar spatial analysis of urban flood risk and environmental justice in the Charlanta megaregion, USA. Anthropocene 2019, 28, 100226. [Google Scholar] [CrossRef]
- Wolch, J.; Wilson, J.P.; Fehrenbach, J. Parks and park funding in Los Angeles: An equity-mapping analysis. Urban Geogr. 2005, 26, 4–35. [Google Scholar] [CrossRef] [Green Version]
- Rigolon, A.; Browning, M.; Jennings, V. Inequities in the quality of urban park systems: An environmental justice investigation of cities in the United States. Landsc. Urban Plan. 2018, 178, 156–169. [Google Scholar] [CrossRef]
- Nesbitt, L.; Meitner, M.J.; Girling, C.; Sheppard, S.R.J.; Lu, Y. Who has access to urban vegetation? A spatial analysis of distributional green equity in 10 US cities. Landsc. Urban Plan. 2019, 181, 51–79. [Google Scholar] [CrossRef]
- Mukamel, D.B.; Murphy, A.S.; Weimer, D.L. Racial differences in access to high-quality cardiac surgeons. Am. J. Public Health 2000, 90, 1774–1777. [Google Scholar]
- Onega, T.; Duell, E.J.; Shi, X.; Wang, D.; Demidenko, E.; Goodman, M.D. Geographic access to cancer care in the US. Cancer 2008, 112, 909–918. [Google Scholar] [CrossRef] [PubMed]
- Beaulac, J.; Kristjansson, E.; Cummins, S. A systematic review of food deserts 1966–2007. Prev. Chronic Dis. 2009, 6, A105. [Google Scholar]
- McKenzie, B.S. Access to supermarkets among poorer neighborhoods: A comparison of time and distance measure. Urban Geogr. 2014, 35, 133–151. [Google Scholar] [CrossRef]
- Rothwell, J. Housing Costs, Zoning, and Access to High-Scoring Schools; Metropolitan Policy Program; Brookings Institution: Washington, DC, USA, 2012; Available online: https://www.brookings.edu/wp-content/uploads/2016/06/0419_school_inequality_rothwell.pdf (accessed on 1 December 2021).
- Nelson, J.R.; Grubesic, T.H. Environmental justice: A panoptic overview using scientometrics. Sustainability 2018, 10, 1022. [Google Scholar] [CrossRef] [Green Version]
- Bullard, R. (Ed.) Growing Smarter: Achieving Livable Communities, Environmental Justice, and Reginal Equity; MIT Press: Cambridge, MA, USA, 2007. [Google Scholar]
- Bereitschaft, B. Equity in microscale urban design and walkability: A photographic survey of six Pittsburgh streetscapes. Sustainability 2017, 9, 1233. [Google Scholar] [CrossRef] [Green Version]
- Bereitschaft, B. Equity in neighborhood walkability? A comparative analysis of three large U.S. cities. Local Environ. 2017, 22, 859–879. [Google Scholar] [CrossRef]
- Wang, J.; Lindsey, G. Equity of bikeway distribution in Minneapolis, Minnesota. Transp. Res. Rec. 2017, 2605, 18–31. [Google Scholar] [CrossRef]
- Matas, A.; Raymond, J.-L.; Roig, J.-L. Job accessibility and female employment probability: The cases of Barcelona and Madrid. Urban Stud. 2010, 47, 769–787. [Google Scholar] [CrossRef]
- Mueller, N.; Rojas-Rueda, D.; Cole-Hunter, T.; de Nazelle, A.; Dons, E.; Gerike, R.; Gotschi, T.; Int Panis, L.; Kahlmeier, S.; Nieuwenhuijsen, M. Health impact assessment of active transportation: A systematic review. Prev. Med. 2015, 76, 103–114. [Google Scholar] [CrossRef]
- Preis, D. Transportation access in U.S. suburban schools: A tool for equity or a revelation of race, class and privilege disparity? Race Ethn. Educ. 2022, 1–21. [Google Scholar] [CrossRef]
- Jabareen, Y.R. Sustainable urban forms: Their typologies, models, and concepts. J. Plan. Educ. Res. 2006, 26, 38–52. [Google Scholar] [CrossRef]
- Pereira, R.H.M.; Schwanen, T.; Banister, D. Distributive justice and equity in transportation. Transp. Rev. 2017, 37, 170–191. [Google Scholar] [CrossRef] [Green Version]
- Gehl, J. Life between Buildings: Using Public Space; Van Nostrand Reinhold: New York, NY, USA, 1987. [Google Scholar]
- Speck, J. Walkable City: How Downtown Can Save America, One Step at a Time; Farrar, Straus and Giroux: New York, NY, USA, 2012. [Google Scholar]
- Forsyth, A. What is a walkable place? The walkability debate in urban design. Urban Des. Int. 2015, 20, 274–292. [Google Scholar] [CrossRef]
- Frank, L.D.; Engelke, P. Impacts of the built environment on health: Walkable places and the exposure to air pollution. Int. Reg. Sci. Rev. 2005, 28, 193–216. [Google Scholar] [CrossRef]
- Lovasi, G.S.; Neckerman, K.M.; Quinn, J.W.; Weiss, C.C.; Rundle, A. Effect of individual or neighborhood disadvantage on the association between neighborhood walkability and body mass index. Am. J. Public Health 2009, 99, 279–284. [Google Scholar] [CrossRef]
- Sallis, J.F.; Saelens, B.; Frank, L.; Conway, T.L.; Slymen, D.J.; Cain, K.L.; Chapman, J.E.; Kerr, J. Neighborhood built environment and income: Examining multiple health outcomes. Soc. Sci. Med. 2009, 68, 1285–1293. [Google Scholar] [CrossRef] [Green Version]
- Giles-Corti, B.; Foster, S.; Shilton, T.; Falconer, R. The co-benefits for health of investing in active transportation. NSW Public Health Bull. 2010, 21, 122–127. Available online: https://www.phrp.com.au/wp-content/uploads/2014/10/NB10027.pdf (accessed on 15 December 2021). [CrossRef] [Green Version]
- Rissel, C.; Curac, N.; Greenawar, M.; Bauman, A. Physical activity associated with public transport use—A review and modelling of potential benefits. Int. J. Environ. Res. Public Health 2012, 9, 2454–2478. [Google Scholar] [CrossRef] [Green Version]
- Beaudoin, J.; Farzin, Y.H.; Lawell, C.Y.C.L. Public transit investment and sustainable transportation: A review of studies of transit’s impact on traffic congestion and air quality. Res. Transp. Econ. 2015, 52, 15–22. [Google Scholar] [CrossRef]
- Zapata-Diomedi, B.; Herrera, A.M.M.; Veerman, J.L. The effects of built environment attributes on physical activity-related heal and health care costs outcomes in Australia. Health Place 2016, 42, 19–29. [Google Scholar] [CrossRef] [Green Version]
- Litman, T. Evaluating Public Transportation Heath Benefits; Victoria Transport Policy Institute: Victoria, BC, Canada, 2020; Available online: https://www.vtpi.org/tran_health.pdf (accessed on 15 December 2021).
- Leyden, K.M. Social capital and the built environment: The importance of walkable neighborhoods. Am. J. Public Health 2003, 93, 1546–1551. [Google Scholar] [CrossRef] [PubMed]
- French, S.; Wood, L.; Foster, S.A.; Giles-Corti, B.; Frank, L.; Learnihan, V. Sense of community and its association with the neighborhood built environment. Environ. Behav. 2013, 46, 677–697. [Google Scholar] [CrossRef]
- Smart, M.J.; Klein, N.J. A Longitudinal Analysis of Cars, Transit, and Employment Outcomes; Mineta Transportation Institute Publications, San José University: San José, CA, USA, 2015; Available online: https://scholarworks.sjsu.edu/cgi/viewcontent.cgi?referer=https://www.google.com/&httpsredir=1&article=1198&context=mti_publications (accessed on 10 January 2022).
- Koschinsky, J.; Talen, E. Affordable housing and walkable neighborhoods: A national urban analysis. Cityscape 2015, 17, 13–56. [Google Scholar] [CrossRef]
- Riggs, W. Inclusively walkable: Exploring the equity of walkable housing in the San Francisco Bay Area. Local Environ. 2016, 21, 527–554. [Google Scholar] [CrossRef]
- Neckerman, K.M.; Lovasi, G.S.; Davies, S.; Purciel, M.; Quinn, J.; Feder, E.; Raghunath, N.; Wasserman, B.; Rundle, A. Disparities in urban neighborhood conditions: Evidence from GIS measures and field observation in New York City. Built Soc. Environ. 2009, 30, S264–S285. [Google Scholar] [CrossRef]
- Ermagun, A.; Tilahun, N. Equity of transit accessibility across Chicago. Transp. Res. Part D Transp. Environ. 2020, 86, 102461. [Google Scholar] [CrossRef]
- Shen, Q. Spatial and social dimensions of commuting. J. Am. Plan. Assoc. 2000, 66, 68–82. [Google Scholar] [CrossRef]
- Cui, B.; Boisjoly, G.; El-Geneidy, A.; Levinson, D. Accessibility and the journey to work through the lens of equity. J. Transp. Geogr. 2019, 74, 269–277. [Google Scholar] [CrossRef]
- Cutts, B.B.; Darby, K.J.; Boone, C.G.; Brewis, A. City structure, obesity, and environmental justice: An integrated analysis of physical and social barriers to walkable streets and park access. Soc. Sci. Med. 2009, 69, 1314–1322. [Google Scholar] [CrossRef] [PubMed]
- Duncan, D.T.; Aldstadt, J.; Whalen, J.; White, K.; Castro, M.C.; Williams, D.R. Space, race, and poverty: Spatial inequities in walkable neighborhood amenities? Demogr. Res. 2012, 26, 409–448. [Google Scholar] [CrossRef] [Green Version]
- King, K.E.; Clarke, P.J. A disadvantaged advantage in walkability: Findings from socioeconomic and geographical analysis of national built environment data in the United States. Am. J. Epidemiol. 2015, 181, 17–25. [Google Scholar] [CrossRef] [PubMed] [Green Version]
- Squires, G.D. Urban Sprawl: Causes, Consequences & Policy Responses; The Urban Institute Press: Washington, DC, USA, 2002. [Google Scholar]
- Nechyba, T.J.; Walsh, R.P. Urban Sprawl. J. Econ. Perspect. 2004, 18, 177–200. [Google Scholar] [CrossRef] [Green Version]
- Harvey, D. From managerialism to entrepreneurialism: The transformation in urban governance in late capitalism. Geogr. Ann. Ser. B Hum. Geogr. 1989, 71, 3–17. [Google Scholar] [CrossRef]
- Van Criekingen, M. Towards a geography of displacement. Moving out of Brussels’ gentrifying neighbourhoods. J. Hous. Built Environ. 2008, 23, 199–213. [Google Scholar] [CrossRef]
- MacLeod, G. Urban politics reconsidered: From growth machine to post-democratic city? Urban Stud. 2014, 48, 2629–2660. [Google Scholar] [CrossRef]
- Moos, M. ‘Generationed’ space: Societal restructuring and young adults’ changing residential location patterns. Can. Geogr. 2014, 58, 11–33. [Google Scholar] [CrossRef]
- Schwartz, S. Street Smart: The Rise of Cities and the Fall of Cars; Public Affairs: New York, NY, USA, 2015. [Google Scholar]
- Lauermann, J. Municipal statecraft: Revisiting the geographies of the entrepreneurial city. Prog. Hum. Geogr. 2018, 42, 205–224. [Google Scholar] [CrossRef]
- Washington, E. Role of walkability in driving home values. Leadersh. Manag. Eng. 2013, 13, 123–130. [Google Scholar] [CrossRef]
- Li, W.; Joh, K.; Lee, C.; Kim, J.-H.; Park, H.; Woo, A. From car-dependent neighborhoods to walkers’ paradise: Estimating walkability premiums in the condominium housing market. Transp. Res. Rec. 2014, 2453, 162–170. [Google Scholar] [CrossRef]
- Immergluck, D.; Balan, T. Sustainable for whom? Green urban development, environmental gentrification, and the Atlanta Beltline. Urban Geogr. 2018, 39, 546–562. [Google Scholar] [CrossRef]
- Greenlee, A.J.; Wilson, B.K. Where does location affordability drive residential mobility? An analysis of origin and destination communities. Hous. Policy Debate 2016, 26, 583–606. [Google Scholar] [CrossRef]
- Hartell, A.M. Evaluating the concept of location affordability: Recent data on the relationship between transportation, housing, and urban form. Hous. Policy Debate 2017, 27, 356–371. [Google Scholar] [CrossRef]
- Glazier, R.H.; Creatore, M.I.; Weyman, J.T.; Fazli, G.; Matheson, F.I.; Gozdyra, P.; Moineddin, R.; Kaufman Shriqui, V.; Booth, G.L. Density, destinations or both? A comparison of measures of walkability in relation to transportation behaviors, obesity, and diabetes in Toronto, Canada. PLoS ONE 2014, 9, e91485. [Google Scholar] [CrossRef] [PubMed]
- Howell, N.A.; Tu, J.V.; Moineddin, R.; Chu, A.; Booth, G.L. Association between neighborhood walkability and predicated 10-year cardiovascular disease risk: The CANHEART (Cardiovascular Health in Ambulatory Care Research Team) cohort. J. Am. Heart Assoc. 2019, 8, e013146. [Google Scholar] [CrossRef] [PubMed]
- Keats, M.R.; Cui, Y.; DeClercq, V.; Grandy, S.A.; Sweeney, E.; Dummer, T.J.B. Associations between neighborhood walkability, physical activity, and chronic disease in Nova Scotian adults: An Atlantic PATH cohort study. Int. J. Environ. Res. Public Health 2020, 17, 8643. [Google Scholar] [CrossRef]
- Berke, E.M.; Gottlieb, L.M.; Vernez Moudon, A.; Larson, E.B. Protective association between neighborhood walkability and depression in older men. J. Am. Geriatr. Soc. 2007, 55, 526–533. [Google Scholar] [CrossRef]
- Sarkar, C.; Gallacher, J.; Webster, C. Urban built environment configuration and psychological distress in older men: Results from the Caerphilly study. BMC Public Health 2013, 13, 695. [Google Scholar] [CrossRef] [Green Version]
- Yu, R.; Cheung, O.; Lau, K.; Woo, J. Associations between perceived neighborhood walkability and walking time, wellbeing, and loneliness in community-dwelling older Chinese people in Hong Kong. Int. J. Environ. Res. Public Health 2017, 14, 1199. [Google Scholar] [CrossRef]
- Jacobs, J. The Death and Life of Great American Cities; Random House, Inc.: New York, NY, USA, 1961. [Google Scholar]
- Hebbert, M. New urbanism—The movement in context. Built Environ. 2003, 29, 193–209. [Google Scholar] [CrossRef]
- Alexiou, A.S. Jane Jacobs: Urban Visionary; Rutgers University Press: New Brunswick, NJ, USA, 2006. [Google Scholar]
- McClay, W.M.; McAllister, T.V. (Eds.) Why Place Matters: Identity and Civic Life in Modern America; New Atlantis Books: New York, NY, USA, 2014. [Google Scholar]
- U.S. Department of Housing and Urban Development (HUD). Ensuring Equitable Neighborhood Change: Gentrification Pressures on Housing Affordability; Insights into Housing and Community Development Policy; U.S. HUD, Office of Policy Development and Research: Washington, DC, USA, 2016. Available online: https://www.huduser.gov/portal/sites/default/files/pdf/Insights-Ensuring-Equitable-Growth.pdf (accessed on 12 January 2022).
- Zukin, S.; Trujillo, V.; Frase, P.; Jackson, D.; Recuber, T.; Walker, A. New retail capital and neighborhood change: Boutiques and gentrification in New York City. City Community 2009, 8, 47–64. [Google Scholar] [CrossRef]
- Van Criekingen, M.; Decroly, J.-M. Revisiting the diversity of gentrification: Neighbourhood renewal processes in Brussels and Montreal. Urban Stud. 2003, 40, 2451–2468. [Google Scholar] [CrossRef]
- Weller, S.; van Hulten, A. Gentrification and displacement: The effects of a housing crisis on Melbourne’s low-income residents. Urban Policy Res. 2012, 30, 25–42. [Google Scholar] [CrossRef]
- Kneebone, E.; Garr, E. The Suburbanization of Poverty: Trends in Metropolitan America, 2000–2008; The Brooking Institution: Washington, DC, USA, 2010. [Google Scholar]
- Howell, A.; Timberlake, J.M. Racial and ethnic trends in the suburbanization of poverty in U.S. metropolitan areas, 1980–2010. J. Urban Aff. 2013, 36, 79–98. [Google Scholar] [CrossRef]
- Terbeck, F.J. The suburbanization of poverty and minority populations in the 2000s: Two parallel or interrelated processes? J. Urban Aff. 2021, 1–18. [Google Scholar] [CrossRef]
- Terbeck, F.J. The impact of regional and local population trends on suburban poverty and ethnoracial composition change: A shift-share analysis of the Chicago metropolitan area in the 2000s. Popul. Space Place 2022, 28, e2549. [Google Scholar] [CrossRef]
- McLafferty, S.; Preston, V. Who has long commutes to low-wage jobs? Gender, race, and access to work in the New York region. Urban Geogr. 2019, 40, 1270–1290. [Google Scholar] [CrossRef]
- Antipova, A. Analysis of commuting distances of low-income workers in Memphis Metropolitan Area, TN. Sustainability 2020, 12, 1209. [Google Scholar] [CrossRef] [Green Version]
- Blumenberg, E.; Wander, M. Housing affordability and commute distance. Urban Geogr. 2022, 1–20. [Google Scholar] [CrossRef]
- King, D.A.; Smart, M.J.; Manville, M. The poverty of the carless: Toward universal auto access. J. Plan. Educ. Res. 2022, 42, 464–481. [Google Scholar] [CrossRef]
- Paez, A.; Mercado, R.G.; Farber, S.; Morency, C.; Roorda, M. Mobility and Exclusion in Canadian Communities: An Empirical Investigation of Opportunity Access and Deprivation from the Perspective of Vulnerable Groups; Policy Research Directorate: Hamilton, ON, Canada, 2009; Available online: https://www.researchgate.net/publication/233997689_Mobility_and_Social_Exclusion_in_Canadian_Communities_An_Empiric (accessed on 4 February 2022).
- Morris, E.A.; Bloomberg, E.; Guerra, E. Does lacking a car put the brakes on activity participation? Private vehicle access and access to opportunities among low-income adults. Transp. Res. Part A Policy Pract. 2020, 136, 375–397. [Google Scholar] [CrossRef]
- Froud, J.; Sukhdev, J.; Leaver, A.; Williams, K. Not enough money: The resources and choices of the motoring poor. Compet. Change 2002, 6, 95–111. [Google Scholar] [CrossRef]
- Duncan, D.T.; Aldstadt, J.; Whalen, J.; Melly, S.J.; Gortmaker, S.L. Validation of Walk Score® for estimating neighborhood walkability: An analysis of four US metropolitan areas. Int. J. Environ. Res. Public Health 2011, 8, 4160–4179. [Google Scholar] [CrossRef] [PubMed]
- Sperling, J. The tyranny of census geography: Small-area data and neighborhood statistics. Cityscape 2012, 14, 219–223. [Google Scholar]
- Walk Score®. Walk Score® Methodology. 2022. Available online: https://www.walkscore.com/methodology.shtml (accessed on 15 February 2022).
- Coulton, C.J.; Jennings, M.Z.; Chan, T. How big is my neighborhood? Individual and contextual effects on perceptions of neighborhood scale. Am. J. Community Psychol. 2013, 51, 140–150. [Google Scholar] [CrossRef]
- Tita, G.E.; Petras, T.L.; Greenbaum, R.T. Crime and residential choice: A neighborhood level analysis of the impact of crime on housing price. J. Quant. Criminol. 2006, 22, 299–317. [Google Scholar] [CrossRef]
- Garcy, A.M.; Berliner, D.C. A critical review of the literature on the relationship between school quality and health inequities. Rev. Educ. 2018, 6, 40–66. [Google Scholar] [CrossRef] [Green Version]
- Centers for Disease Control and Prevention (CDC). CDC/ATSDR Social Vulnerability Index. 2021. Available online: https://www.atsdr.cdc.gov/placeandhealth/svi/index.html (accessed on 20 February 2022).
- Duncan, D.T.; Meline, J.; Kestens, Y.; Day, K.; Ebel, B.; Trasande, L.; Basile, C. Walk score, transportation mode choice, and walking among French adults: A GPS, accelerometer, and mobility survey study. Int. J. Environ. Res. Public Health 2016, 13, 611. [Google Scholar] [CrossRef] [Green Version]
- Towne, S.D., Jr.; Won, J.; Lee, S.; Ory, M.G.; Forjuoh, S.N.; Wang, S.; Lee, C. Using Walk ScoreTM and neighborhood perceptions to assess walking among middle-aged and older adults. J. Community Health 2016, 41, 977–988. [Google Scholar] [CrossRef] [PubMed]
- Bereitschaft, B. Neighborhood walkability and housing affordability among U.S. urban areas. Urban Sci. 2019, 3, 11. [Google Scholar] [CrossRef] [Green Version]
- Hall, C.M.; Ram, Y. Measuring the relationship between tourism and walkability? Walk Score and English tourist attractions. J. Sustain. Tour. 2019, 27, 223–240. [Google Scholar] [CrossRef]
- Clifton, K.; Livi, A. Gender differences in walking behavior, attitudes about walk-ing, and perceptions of the environment in three Maryland communities. In Research on Women’s Issues in Transportation; Report of a Conference; Technical Papers; Transportation Research Board: Washington, DC, USA, 2005; Volume 2, pp. 79–88. [Google Scholar]
- Saelens, B.E.; Handy, S.L. Built environment correlates of walking: A review. Med. Sci. Sport. Med. 2008, 40, 550–566. [Google Scholar] [CrossRef] [PubMed] [Green Version]
- Ewing, R.; Hajrasouliha, A.; Neckerman, K.M.; Purciel-Hill, M.; Greene, W. Streetscape features related to pedestrian activity. J. Plan. Educ. Res. 2016, 36, 5–15. [Google Scholar] [CrossRef] [Green Version]
- Harvey, C.; Aultman-Hall, L. Measuring urban streetscapes for livability: A review of approaches. Prof. Geogr. 2016, 68, 149–158. [Google Scholar] [CrossRef]
- Yang, Y.; He, D.; Gou, Z.; Wang, R.; Liu, Y.; Lu, Y. Association between street greenery and walking behavior in older adults in Hong Kong. Sustain. Cities Soc. 2019, 51, 101747. [Google Scholar] [CrossRef]
- Mason, P.; Kearns, A.; Livingston, M. ‘Safe going’: The influence of crime rates and perceived crime and safety on walking in deprived neighbourhoods. Soc. Sci. Med. 2013, 91, 15–24. [Google Scholar] [CrossRef]
- McMillan, T.E. The relative influence of urban form on a child’s travel mode to school. Transp. Res. Part A 2007, 41, 69–79. [Google Scholar] [CrossRef]
- Berrigan, D.; Troiano, R.P. The association between urban form and physical activity in U.S. adults. Am. J. Prev. Med. 2002, 23, 74–79. [Google Scholar] [CrossRef]
- Kerr, J.; Frank, L.; Sallis, J.F.; Chapman, J. Urban form correlates of pedestrian travel in youth: Differences by gender, race-ethnicity and household attributes. Transp. Res. Part D Transp. Environ. 2007, 12, 177–182. [Google Scholar] [CrossRef]
- Freeman, L.; Neckerman, K.; Schwartz-Soicher, O.; Quinn, J.; Richards, C.; Bader, M.D.; Lovasi, G.; Jack, D.; Weiss, C.; Konty, K.; et al. Neighborhood walkability and active travel (walking and cycling) in New York City. J. Urban Health 2013, 90, 575–585. [Google Scholar] [CrossRef] [Green Version]
- Riggs, W.; Sethi, S.A. Multimodal travel behavior, walkability indices, and social mobility: How neighborhood walkability, income, and household characteristics guide walking, biking & transit decisions. Local Environ. 2020, 25, 57–68. [Google Scholar]
- Carr, L.J.; Dunsiger, S.I.; Marcus, B.H. Walk ScoreTM as a global estimate of neighborhood walkability. Am. J. Prev. Med. 2010, 39, 460–463. [Google Scholar] [CrossRef] [PubMed] [Green Version]
- Duncan, M. The impact of transit-oriented development on housing prices in San Diego, CA. Urban Stud. 2011, 48, 101–127. [Google Scholar] [CrossRef] [PubMed]
- Duncan, D.T.; Aldstadt, J.; Whalen, J.; Melly, S.J. Validation of walk scores and transit scores for estimating neighborhood walkability and transit availability: A small area analysis. GeoJournal 2013, 78, 407–416. [Google Scholar] [CrossRef]
- Hirsch, J.A.; Moore, K.A.; Evenson, K.R.; Rodriguez, D.A.; Diez Roux, A.V. Walk Score® and Transit Score® and walking in the multi-ethnic study of atherosclerosis. Am. J. Prev. Med. 2013, 45, 158–166. [Google Scholar] [CrossRef] [PubMed] [Green Version]
- Bereitschaft, B. Walk Score(R) versus residents’ perceptions of walkability in Omaha, NE. J. Urban. 2018, 11, 412–435. [Google Scholar] [CrossRef]
- Krambeck, H.; Shah, J.J. The Global Walkability Index; Massachusetts Institute of Technology (MIT): Cambridge, MA, USA, 2006. [Google Scholar]
- Frank, L.D.; Sallis, J.F.; Saelens, B.E.; Leary, L.; Cain, K.; Con-way, T.L.; Hess, P.M. The Development of a walkability index: Application to the neighborhood quality of life study. Br. J. Sport. Med. 2010, 44, 924–933. [Google Scholar] [CrossRef]
- Park, S.; Deakin, E.; Lee, J.S. Perception-based walkability index to test impact of microlevel walkability on sustainable mode choice decisions. Transp. Res. Rec. 2014, 2464, 126–134. [Google Scholar] [CrossRef]
- Yin, L.; Wang, Z. Measuring visual enclosure for street walkability: Using machine learning algorithms and Google Street View imagery. Appl. Geogr. 2016, 76, 147–153. [Google Scholar] [CrossRef]
- Nagata, S.; Nakaya, T.; Hanibuchi, T.; Amagasa, S.; Kikuchi, H.; Inoue, S. Objective scoring of streetscape walkability related to leisure walking: Statistical modeling approach with semantic segmentation of Google Street View image. Health Place 2020, 66, 102428. [Google Scholar] [CrossRef]
- Walk Score®. Transit Score® Methodology. 2022. Available online: https://www.walkscore.com/transit-score-methodology.shtml (accessed on 1 March 2022).
- Agrawal, A.W.; Schlossberg, M.; Irvin, K.K. How far, by which route and why? A spatial analysis of pedestrian preference. J. Urban Des. 2008, 13, 81–98. [Google Scholar] [CrossRef]
- Hong, J.; Chen, C. The role of the built environment on perceived safety from crime and walking: Examining direct and indirect impacts. Transportation 2014, 41, 1171–1185. [Google Scholar] [CrossRef]
- Rees-Punia, E.; Hathaway, E.D.; Gay, J.L. Crime, perceived safety, and physical activity: A meta-analysis. Prev. Med. 2018, 111, 307–313. [Google Scholar] [CrossRef]
- Bereitschaft, B. The changing ethno-racial profile of ‘very walkable’ urban neighborhoods in the US (2010–2020): Are minorities under-represented? Urban Stud. 2022, 1–17. [Google Scholar] [CrossRef]
- Nau, C.; Sidell, M.; Clift, K.; Koebnick, C.; Desai, J.; Rohm-Young, D. A commercially available crime index may be a reliable alternative to actual census-tract crime in an urban area. Prev. Med. 2020, 17, 100996. [Google Scholar] [CrossRef] [PubMed]
- Ellen, I.G.; Horn, K.M.; Kuai, Y. Gateway to opportunity? Disparities in neighborhood conditions among low-income housing tax credit residents. Hous. Policy Debate 2018, 28, 572–591. [Google Scholar] [CrossRef]
- U.S. Department of Housing and Urban Development (HUD). School Proficiency Index; U.S. HUD, Office of Policy Development and Research: Washington, DC, USA, 2020; Available online: https://hudgis-hud.opendata.arcgis.com/datasets/HUD::school-proficiency-index/about (accessed on 6 March 2022).
- Hamidi, S.; Ewing, R. A longitudinal study of changes in urban sprawl between 2000 and 2010 in the United States. Landsc. Urban Plan. 2014, 128, 72–82. [Google Scholar] [CrossRef]
- Atkins, M.T.; Tonts, M. Exploring cities through a population ageing matrix: A spatial and temporal analysis of older adult population trends in Perth, Australia. Aust. Geogr. 2016, 47, 65–87. [Google Scholar] [CrossRef]
- Walker, K.E. Baby boomer migration and demographic change in US metropolitan areas. Migr. Stud. 2016, 4, 347–372. [Google Scholar] [CrossRef]
- Bereitschaft, B. Older adult population and neighborhood walkability by metropolitan area size and degree of urban sprawl. Pap. Appl. Geogr. 2022, 8, 249–267. [Google Scholar] [CrossRef]
- King, A.C.; Sallis, J.F.; Frank, L.D.; Saelens, B.E.; Cain, K.; Conway, T.L.; Chapman, J.E.; Ahn, D.K.; Kerr, J. Aging in neighborhoods differing in walkability and income: Associations with physical activity and obesity in older adults. Soc. Sci. Med. 2011, 73, 1525–1533. [Google Scholar] [CrossRef] [Green Version]
- Cauwenberg, J.V.; Van Holle, V.; Boudeaudhuij, I.D.; Van Dyck, D.; Deforche, B. Neighborhood walkability and health outcomes among older adults: The mediating role of physical activity. Health Place 2016, 37, 16–25. [Google Scholar] [CrossRef] [PubMed]
- Radeloff, V.C.; Hammer, R.B.; Stewart, S.I. Rural and suburban sprawl in the U.S. Midwest from 1940 to 2000 and its relation to forest fragmentation. Conserv. Biol. 2005, 19, 793–805. [Google Scholar] [CrossRef]
- Lopez, R. Urban sprawl in the United States: 1970–2010. Cities Environ. (CATE) 2014, 7, 7. [Google Scholar]
- Wachs, M. Turning cities inside out: Transportation and the resurgence of downtowns in North America. Transportation 2013, 40, 1159–1172. [Google Scholar] [CrossRef]
- Delmelle, E.C.; Zhou, Y.; Thill, J.-C. Densification without growth management? Evidence from local land development and housing trends in Charlotte, North Carolina, USA. Sustainability 2014, 6, 3975–3990. [Google Scholar] [CrossRef] [Green Version]
- Yan, X. Evaluating household residential preferences for walkability and accessibility across three U.S. regions. Transp. Res. Part D Transp. Environ. 2020, 80, 102255. [Google Scholar] [CrossRef]
- Kramer, A. The unaffordable city: Housing and transit in North American cities. Cities 2018, 83, 1–10. [Google Scholar] [CrossRef]
- Brown, J.; Thompson, G.; Battacharya, T.; Jaroszynski, M. Understanding transit ridership demand for the multidestination, multimodal transit network in Atlanta, GA: Lesson for increasing rail transit choice ridership while maintaining transit dependent bus ridership. Urban Stud. 2014, 51, 938–958. [Google Scholar] [CrossRef]
- Talen, E. Zoning for and against sprawl: The case for form-based codes. J. Urban Des. 2013, 18, 175–200. [Google Scholar] [CrossRef]
- Talen, E. Affordability in new urbanist development: Principle, practice and strategy. J. Urban Aff. 2010, 32, 489–510. [Google Scholar] [CrossRef]
- Davidson, M.; Lees, L. New-build gentrification: Its histories, trajectories, and critical geographies. Popul. Space Place 2010, 16, 395–411. [Google Scholar] [CrossRef] [Green Version]
- Benson, E.M.; Bereitschaft, B. Are LEED-ND developments catalysts of neighborhood gentrification? Int. J. Urban Sustain. Dev. 2019, 12, 73–88. [Google Scholar] [CrossRef]
- Padeiro, M.; Louro, A.; Marques da Costa, N. Transit-oriented development and gentrification: A systematic review. Transp. Rev. 2019, 39, 733–754. [Google Scholar] [CrossRef] [Green Version]
- Anthony, J. Economic prosperity and housing affordability in the United States: Lessons from the booming 1990s. Hous. Policy Debate 2018, 28, 325–341. [Google Scholar] [CrossRef]
- Tehrani, S.O.; Wu, S.J.; Roberts, J.D. The color of health: Residential segregation, light rail transit development, and gentrification in the United States. Int. J. Environ. Res. Public Health 2019, 16, 3683. [Google Scholar] [CrossRef] [Green Version]
- Addison, C.; Zhang, S.; Coomes, B. Smart growth and housing affordability: A review of regulatory mechanisms and planning practices. J. Plan. Lit. 2012, 28, 215–257. [Google Scholar] [CrossRef]
- Tremoulet, A.; Dann, R.J.; Adkins, A. Moving to location affordability? Housing choice vouchers and residential relocation in the Portland, Oregon, region. Hous. Policy Debate 2016, 26, 692–713. [Google Scholar] [CrossRef]
- Lerman, B.R. Mandatory inclusionary zoning—The answer to affordable housing problem. Boston Coll. Environ. Aff. Law Rev. 2006, 33, 383–416. [Google Scholar]
- Mukhija, V.; Regus, L.; Slovin, S.; Das, A. Can inclusionary zoning be an effective and efficient housing policy? Evidence from Los Angeles and Orange Counties. J. Urban Aff. 2010, 32, 229–252. [Google Scholar] [CrossRef]
- Hobor, G. Surviving the era of deindustrialization: The new economic geography of the urban rust belt. J. Urban Aff. 2012, 35, 417–434. [Google Scholar] [CrossRef]
- Hollingsworth, T.; Goebel, A. Revitalizing America’s Smaller Legacy Cities: Strategies for Postindustrial Success from Gary to Lowell; Lincoln Institute of Land Policy: Cambridge, MA, USA, 2017. [Google Scholar]
- Vanek Smith, S. The Lancaster, Pa., Puzzle. The Indicator from Planet Money (Podcast). National Public Radio (NPR). 2019. Available online: https://www.npr.org/transcripts/777804090 (accessed on 1 June 2022).
- Yigitcanlar, T.; Baum, S.; Horton, S. Attracting and retaining knowledge workers in knowledge cities. J. Knowl. Manag. 2007, 11, 6–17. [Google Scholar] [CrossRef] [Green Version]
- Cortright, J. City Report: The Young and Restless and the Nation’s Cities; City Observatory: Portland, OR, USA, 2014; Available online: https://www.pschousing.org/files/PSC_IForum_2-25-15_PostIndustrialCities_cityobservatory_article_YNR-Report-Final_fulltext.pdf (accessed on 1 June 2022).
- Liu, Q.; Liu, Y.; Zhang, Z.; Zhao, P. Elderly mobility during the COVID-19 pandemic: A qualitative exploration in Kumming, China. J. Transp. Geogr. 2021, 96, 103176. [Google Scholar] [CrossRef]
- Patulny, R.; Bower, M. Beware the “loneliness gap”? Examining emerging inequalities and long-term risks of loneliness and isolation emerging from COVID-19. Aust. J. Soc. Issues 2022, 57, 562–583. [Google Scholar] [CrossRef]
- Gkiotsalitis, K.; Cats, O. Public transport planning adaption under the COVID-19 pandemic crisis: Literature review of research needs and directions. Transp. Rev. 2021, 41, 374–392. [Google Scholar] [CrossRef]
- Caballini, C.; Agostino, M.; Dalla Chiara, B. Physical mobility and virtual communication in Italy: Trends, analytical relationships and policies for the post COVID-19. Transp. Policy 2021, 110, 314–334. [Google Scholar] [CrossRef]
- Dubois, E.; Yuan, X.; Bennett Gayle, D.; Khurana, P.; Knight, T.; Laforce, S.; Turetsky, D.; Wild, D. Socially vulnerable populations adoption of technology to address lifestyle changes amid COVID-19 in the US. Data Inf. Manag. 2022, 6, 100001. [Google Scholar] [CrossRef] [PubMed]
- Liu, Q.; An, Z.; Ying, W.; Zhao, P. Smartphone-based services, perceived accessibility, and transport inequity during the COVID-19 pandemic: A cross-lagged panel study. Transp. Res. Part D Transp. Environ. 2021, 97, 102941. [Google Scholar] [CrossRef]
- Hall, C.M.; Ram, Y. Walk score® and its potential contribution to the study of active transport and walkability: A critical and systematic review. Transp. Res. Part D Transp. Environ. 2018, 61, 310–324. [Google Scholar] [CrossRef]
- Li, Y.; Yabuki, N.; Fukuda, T. Integrating GIS, deep learning, and environmental sensors for multicriteria evaluation of urban street walkability. Landsc. Urban Plan. 2023, 230, 104603. [Google Scholar] [CrossRef]
- Telega, A.; Telega, I.; Bieda, A. Measuring walkability with GIS—Methods overview and new approach proposal. Urban Sci. 2021, 13, 1883. [Google Scholar] [CrossRef]
- Koschinsky, J.; Talen, E.; Alfonzo, M.; Lee, S. How walkable is Walker’s paradise? Environ. Plan. B Urban Anal. City Sci. 2017, 44, 343–363. [Google Scholar] [CrossRef]
- Knapskog, M.; Hagen, O.E.; Tennoy, A.; Rynning, M.K. Exploring ways of measuring walkability. Transp. Res. Procedia 2019, 41, 264–282. [Google Scholar] [CrossRef]
Figure 1.
Percentage of urban population residing within highly walkable (walk score ≥ 70) census tracts by metropolitan area. Note the four U.S. Census regions used in the regression analysis.
Figure 1.
Percentage of urban population residing within highly walkable (walk score ≥ 70) census tracts by metropolitan area. Note the four U.S. Census regions used in the regression analysis.

Figure 2.
Percentage of urban population residing within high-transit (transit score ≥ 50 or within 1 km of a rail stop) census tracts by metropolitan area.
Figure 2.
Percentage of urban population residing within high-transit (transit score ≥ 50 or within 1 km of a rail stop) census tracts by metropolitan area.

Figure 3.
Percentage of urban population residing in high (80th percentile) socially vulnerable (SV) census tracts also residing within highly walkable (walk score ≥ 70) census tracts by metropolitan area.
Figure 3.
Percentage of urban population residing in high (80th percentile) socially vulnerable (SV) census tracts also residing within highly walkable (walk score ≥ 70) census tracts by metropolitan area.

Figure 4.
Spatial distribution and overlap of high-SV and highly walkable (walk score ≥ 70) census tracts in (A) Philadelphia, PA, (B) Lancaster, PA, (C) Charlotte, NC, and (D) Portland, OR.
Figure 4.
Spatial distribution and overlap of high-SV and highly walkable (walk score ≥ 70) census tracts in (A) Philadelphia, PA, (B) Lancaster, PA, (C) Charlotte, NC, and (D) Portland, OR.

Figure 5.
Percentage of urban population residing in high (80th percentile)-socially vulnerable (SV) census tracts also residing within high-transit (transit score ≥ 50 or within 1 km of a rail stop) census tracts by metropolitan area.
Figure 5.
Percentage of urban population residing in high (80th percentile)-socially vulnerable (SV) census tracts also residing within high-transit (transit score ≥ 50 or within 1 km of a rail stop) census tracts by metropolitan area.

Figure 6.
Spatial distribution and overlap of high-SV and high-transit (transit score ≥ 50 or within 1 km of a rail stop) census tracts in (A) Boston, MA, (B) Chicago, IL, (C) Orlando, FL, and (D) Sacramento, CA.
Figure 6.
Spatial distribution and overlap of high-SV and high-transit (transit score ≥ 50 or within 1 km of a rail stop) census tracts in (A) Boston, MA, (B) Chicago, IL, (C) Orlando, FL, and (D) Sacramento, CA.

Figure 7.
Ratio of the percentage of urban population residing in high (80th percentile)-socially vulnerable (SV) census tracts also residing within highly walkable (walk score ≥ 70) census tracts to the percentage of all urban population living in highly walkable tracts (i.e., “walk equity”) by metropolitan area.

Figure 8.
Ratio of the percentage of urban population residing in high (80th percentile)-socially vulnerable (SV) census tracts also residing within high-transit (transit score ≥ 50 or within 1 km of a rail stop) census tracts to the percentage of all urban population living in high-transit tracts (i.e., “transit equity”) by metropolitan area.

Table 1.
Regression results with the social vulnerability (SV) index as the dependent variable.
| MSA Pop. | B Coeff. | Std. B Coeff. | Std. Error | p-Value |
|---|---|---|---|---|
| Intercept | 55.59 | 0.488 | <0.001 | |
| Dist. City Hall | 0.061 | 0.029 | 0.010 | <0.001 |
| Crime Index | 0.086 | 0.345 | 0.001 | <0.001 |
| School Proficiency | −0.432 | −0.405 | 0.005 | <0.001 |
| Walk Score | 0.148 | 0.139 | 0.005 | <0.001 |
| High-Transit | −3.221 | −0.048 | 0.329 | <0.001 |
| MSA Pop. | 0.583 | 0.112 | 0.027 | <0.001 |
| Northeast Region | −9.145 | −0.129 | 0.343 | <0.001 |
| Midwest Region | −10.13 | −0.131 | 0.345 | <0.001 |
| South Region | −3.486 | −0.053 | 0.311 | <0.001 |
| Model Adj. r2 | 0.483 |
Table 2.
Regression results with the four constituent social vulnerability (SV) themes as dependent variables.
Table 2.
Regression results with the four constituent social vulnerability (SV) themes as dependent variables.
| SV Theme | 1 | 2 | 3 | 4 |
|---|---|---|---|---|
| Intercept | 54.75 ** | 51.73 ** | 69.14 ** | 42.87 ** |
| Dist. City Hall | 0.060 (0.029) ** | 0.168 (0.086) ** | −0.083 (−0.047) ** | 0.018 (0.009) |
| Crime Index | 0.093 (0.371) ** | 0.075 (0.322) ** | 0.030 (0.143) ** | 0.048 (0.195) ** |
| School Proficiency | −0.469 (−0.438) ** | −0.283 (−0.284) ** | −0.269 (0.297) ** | −0.180 (−0.173) ** |
| Walk Score | 0.124 (0.115) ** | −0.122 (−0.121) ** | 0.087 (0.096) ** | 0.315 (0.300) ** |
| High-Transit | −5.321 (−0.079) ** | −5.161 (−0.082) ** | 0.764 (0.013) * | 2.041 (0.031) ** |
| MSA Pop. | 0.430 (0.082) ** | −0.590 (−0.121) ** | 1.738 (0.392) ** | 0.160 (0.031) ** |
| Northeast Region | −6.113 (−0.086) ** | 6.476 (0.098) ** | −20.88 (−0.347) ** | −7.497 (−0.108) ** |
| Midwest Region | −4.716 (−0.061) ** | 4.721 (0.065) ** | −20.37 (−0.309) ** | −11.99 (−0.157) ** |
| South Region | −1.171 (−0.018) ** | 0.107 (0.002) | −4.203 (−0.075) ** | −5.035 (−0.078) ** |
| Model Adj. r2 | 0.521 | 0.272 | 0.390 | 0.281 |
* Sig. at p < 0.05, ** Sig. at p < 0.01. Standardized B coefficients in parentheses.
Disclaimer/Publisher’s Note: The statements, opinions and data contained in all publications are solely those of the individual author(s) and contributor(s) and not of MDPI and/or the editor(s). MDPI and/or the editor(s) disclaim responsibility for any injury to people or property resulting from any ideas, methods, instructions or products referred to in the content. |
© 2023 by the author. Licensee MDPI, Basel, Switzerland. This article is an open access article distributed under the terms and conditions of the Creative Commons Attribution (CC BY) license (https://creativecommons.org/licenses/by/4.0/).
Share and Cite
MDPI and ACS Style
Bereitschaft, B. Do Socially Vulnerable Urban Populations Have Access to Walkable, Transit-Accessible Neighborhoods? A Nationwide Analysis of Large U.S. Metropolitan Areas. Urban Sci. 2023, 7, 6. https://doi.org/10.3390/urbansci7010006
AMA Style
Bereitschaft B. Do Socially Vulnerable Urban Populations Have Access to Walkable, Transit-Accessible Neighborhoods? A Nationwide Analysis of Large U.S. Metropolitan Areas. Urban Science. 2023; 7(1):6. https://doi.org/10.3390/urbansci7010006
Chicago/Turabian StyleBereitschaft, Bradley. 2023. "Do Socially Vulnerable Urban Populations Have Access to Walkable, Transit-Accessible Neighborhoods? A Nationwide Analysis of Large U.S. Metropolitan Areas" Urban Science 7, no. 1: 6. https://doi.org/10.3390/urbansci7010006