
Are Soil and Geology Characteristics Considered in Urban Planning? An Empirical Study in Izmir (Türkiye)


1
Laboratorio Piani Paesaggio Territorio Ecosistemi, Department of Architecture and Urban Studies (DAStU), Politecnico di Milano, 20133 Milan, Italy
2
Geothermal Energy Research and Application Center, Izmir Institute of Technology, 35430 Urla, Türkiye
*
Author to whom correspondence should be addressed.
Urban Sci. 2023, 7(1), 5; https://doi.org/10.3390/urbansci7010005
Submission received: 31 October 2022
/
Revised: 25 December 2022
/
Accepted: 26 December 2022
/
Published: 29 December 2022
Abstract
:It is well acknowledged that sustainable soil management can play a crucial role in reducing the vulnerability of urban areas, but are soil characteristics properly evaluated in the decision-making process concerning urbanization? Within this work, we conducted an analysis of the land-use change trends in the city of Izmir (Turkey). We made an extended and detailed analysis of the urbanization processes between 2012 and 2018 in a geographic information system environment (Esri ArcGIS 10.8.1 and ArcGIS Pro 3.0). Then, we superimposed by spatial overlay different soil characteristics: land capability, hydraulic conductibility, soil groups, and fault lines. We discovered that although there is a joint agreement on soil and its geological importance in reducing urban vulnerabilities to flooding, urban heat islands, agricultural production, or earthquakes, there is scarce knowledge of its characteristics to inform land-use planning. This work sheds some light on how newly developed areas are planned without proper consideration of soil properties, following a fuzzy and irrational logic in their distribution. Results encourage the utilization and inclusion of soil knowledge to support the decision-making process concerning urban transformation to achieve more resilient and less vulnerable urban systems.
1. Introduction
Although soil is acknowledged as a finite, non-reproducible resource [1,2], its utilization for new urbanization processes is still happening at fast rates [3,4,5]. Furthermore, the soil is the most important pool of biodiversity [6]. It provides a large variety of ecosystem services (supporting, regulative, provisioning, and aesthetic/cultural) [7,8,9] while being a primary resource to be considered in adapting cities against multiple hazards [10,11].
Recent studies have claimed how the deep knowledge of soil characteristics (pedogenesis) could inform decision-making during urban planning [12,13]. It has been demonstrated that if well estimated, the soil characteristics play a vital role in diminishing the vulnerability of socio-ecological and technological systems [14]. If new urban areas are built without consideration of soil characteristics (e.g., soil texture, composition, slope, depth, capability, and hydraulic conductibility), the probability is that urban systems will become more sensitive to multiple hazards (e.g., earthquakes, liquefaction, cloudburst, drought, landslides, urban heat island) [15,16,17].
Moreover, some recent works on urban ecosystems show how soil typology significantly affects ecosystem performance in urban areas [18]. To clarify this concept, it is essential to understand how the preliminary knowledge of soil can play a vital role both in limiting the ecological impacts in the processes of sealing (adding new urban areas) [19] or, on the other hand, maximizing the biophysical performance while de-sealing [20,21]. For example, suppose an urban system is already vulnerable to pluvial flooding (cloudburst) [22]; the impermeabilization of new areas on soil with good drainage can dramatically impact it. In contrast, sealing the same quantity of land in soil with limited infiltration can reduce the impact [23,24,25]. The same is valid for the contrary situation: the de-sealing of already urbanized land is strongly influenced by hydraulic conductibility. Some modeling results show, for example, that when the de-sealing process occurs in soils with bad hydraulic conductibility, the results in terms of run-off containment can be dramatically limited or not perceptible at all [26]. That is why soil knowledge can support so-called “performance-based solutions” [27,28,29], which indeed can guide decision-makers while understanding exactly where the de-permeabilization can achieve its maximum efficiency in run-off containment [30,31]. Therefore, urbanization and greening processes can generate different degrees of vulnerability to urban systems.
The same concept can be applied to other hazards, such as earthquakes [32,33]. The construction of new anthropic areas near fault lines can exponentially increase the possibility of structural collapses and damages during an earthquake event with surface ruptures and seismic waves [34]. Parameters such as fault lines, groundwater, lithology, and hydraulic conductivity are essential for cities in first-degree earthquake zones located in coastal areas. The damage and loss of life caused by the earthquake waves of the Samos earthquake, the epicenter of which was about 70 km away from the city center of Izmir in 2020, has been revealed in many studies. However, this earthquake caused a lot of damage even though it was far from the city center of Izmir. As a result of the rapid urban transformation campaign in the last two years, many buildings have been demolished, and new buildings are being built in the same places or newly opened settlements. In addition to the importance of parameters such as the structural features of the buildings and the number of floors, the main issue to be considered is the choice of location.
Another example can be applied to the reduction in biodiversity: the knowledge of soil chemical composition and physical structure can support green infrastructure design that maximizes the ecological connections in urban catchments [35,36].
With the introduction of advanced GIS techniques, land-use change (LUC) assessment becomes a fundamental tool to support analyzing the causes and consequences of land-use dynamics [35]. LUC can be studied using geoprocessing treatment of digital spatial data and is applied in scientific research on land-use environmental effects at different scales [36,37,38,39]. Right after 1980, when the European Union launched a program aimed at monitoring land use and land-use change named “Corine Land Cover” (CLC), there was a flourishing utilization of LUC assessment for environment observation.
The 2004 special issue of the Journal of Environmental Management dedicated to “modelling land use change” (Veldkamp and Verburg 2004) demonstrated that after CLC implementation, LUC has been strongly employed in the academic and scientific literature to create site-specific land pattern analyses. LUC can be studied by geoprocessing analysis based on two methods:
In the study by Verburg et al. [45], the authors show how the LUC models based on the flow method are useful to empirically detect the trend, variations and alterations of land which can generate different impacts on the urban landscape [35,46,47]. Verburg concludes that among others, three factors of LUC analysis can lead the development of supporting decision-making tools: (i) the multi-scalar approach to analysis; (ii) the need for proximity/interaction of data within the context of the study, and (iii) the temporal dynamic as a fundamental approach to measuring fluxes rather than stock data. According to these factors, within this work we wanted to use a multidisciplinary, innovative approach, that allowed us to (i) deal the multi-scalarity of multiple datasets produced at different acquisition scales, (ii) address the interaction between local and metropolitan data while intersecting LUC features with different land characteristics and (iii) employ a cross-tabulation analysis approach that helps us to understand beyond potential future trends in land changes. Once extracted, the new urbanization features were superimposed with different soil layers, and then the soil characteristics were evaluated in the light of each anthropization process. Within this process, we wanted to check whether the urbanization process between 2012 and 2018 in the city of Izmir (Turkey) has taken place in favorable or unfavorable soils while employing spatial land-use change (LUC) analysis based on different geoprocessing phases [48].
Even though a lot of studies have already explored Izmir’s characteristics of land [49,50], soil [51,52,53], and plans or projects [54,55,56], in this work these different domains are analyzed simultaneously and by interaction, thus furnishing a comprehensive picture of how geology information is used to steer land transformations in cities located in first-degree earthquake zones and coastal areas.
Our research hypothesis is that the quantity of information related to soil and geology characteristics nowadays are overall widespread and publicly accessible, but their systematic utilization in planning is still negligible and scarce, thus affecting the environmental sustainability and the vulnerability of urban areas to different typologies of hazards. Our assumption is that revealing the impact of past land-use changes through soil and geological features can shed some light on the importance of including this knowledge in the land transformation process, especially forwarding a more environmentally compatible urban system.
The paper is structured as follow: after the introduction (Section 1) in Section 2 (Material and Method) we introduced the catchment and defined the dataset and geoprocessing phases that shaped our geographic information system-based (GIS) methodology. Then, in Section 3 (Results), we analytically reported the empirical results and some examples of our GIS analysis. In Section 4 (Discussion), we discussed the results in light of the potential land-use policy implications. We outlined a list of possible actions to reduce the vulnerability of future urban systems, including a broad utilization of land-use change analysis to support landscape policies. Finally, Section 5 (Conclusions) recalled the research question and briefly synthesized this study’s main innovations.
2. Materials and Methods
2.1. The Study Area
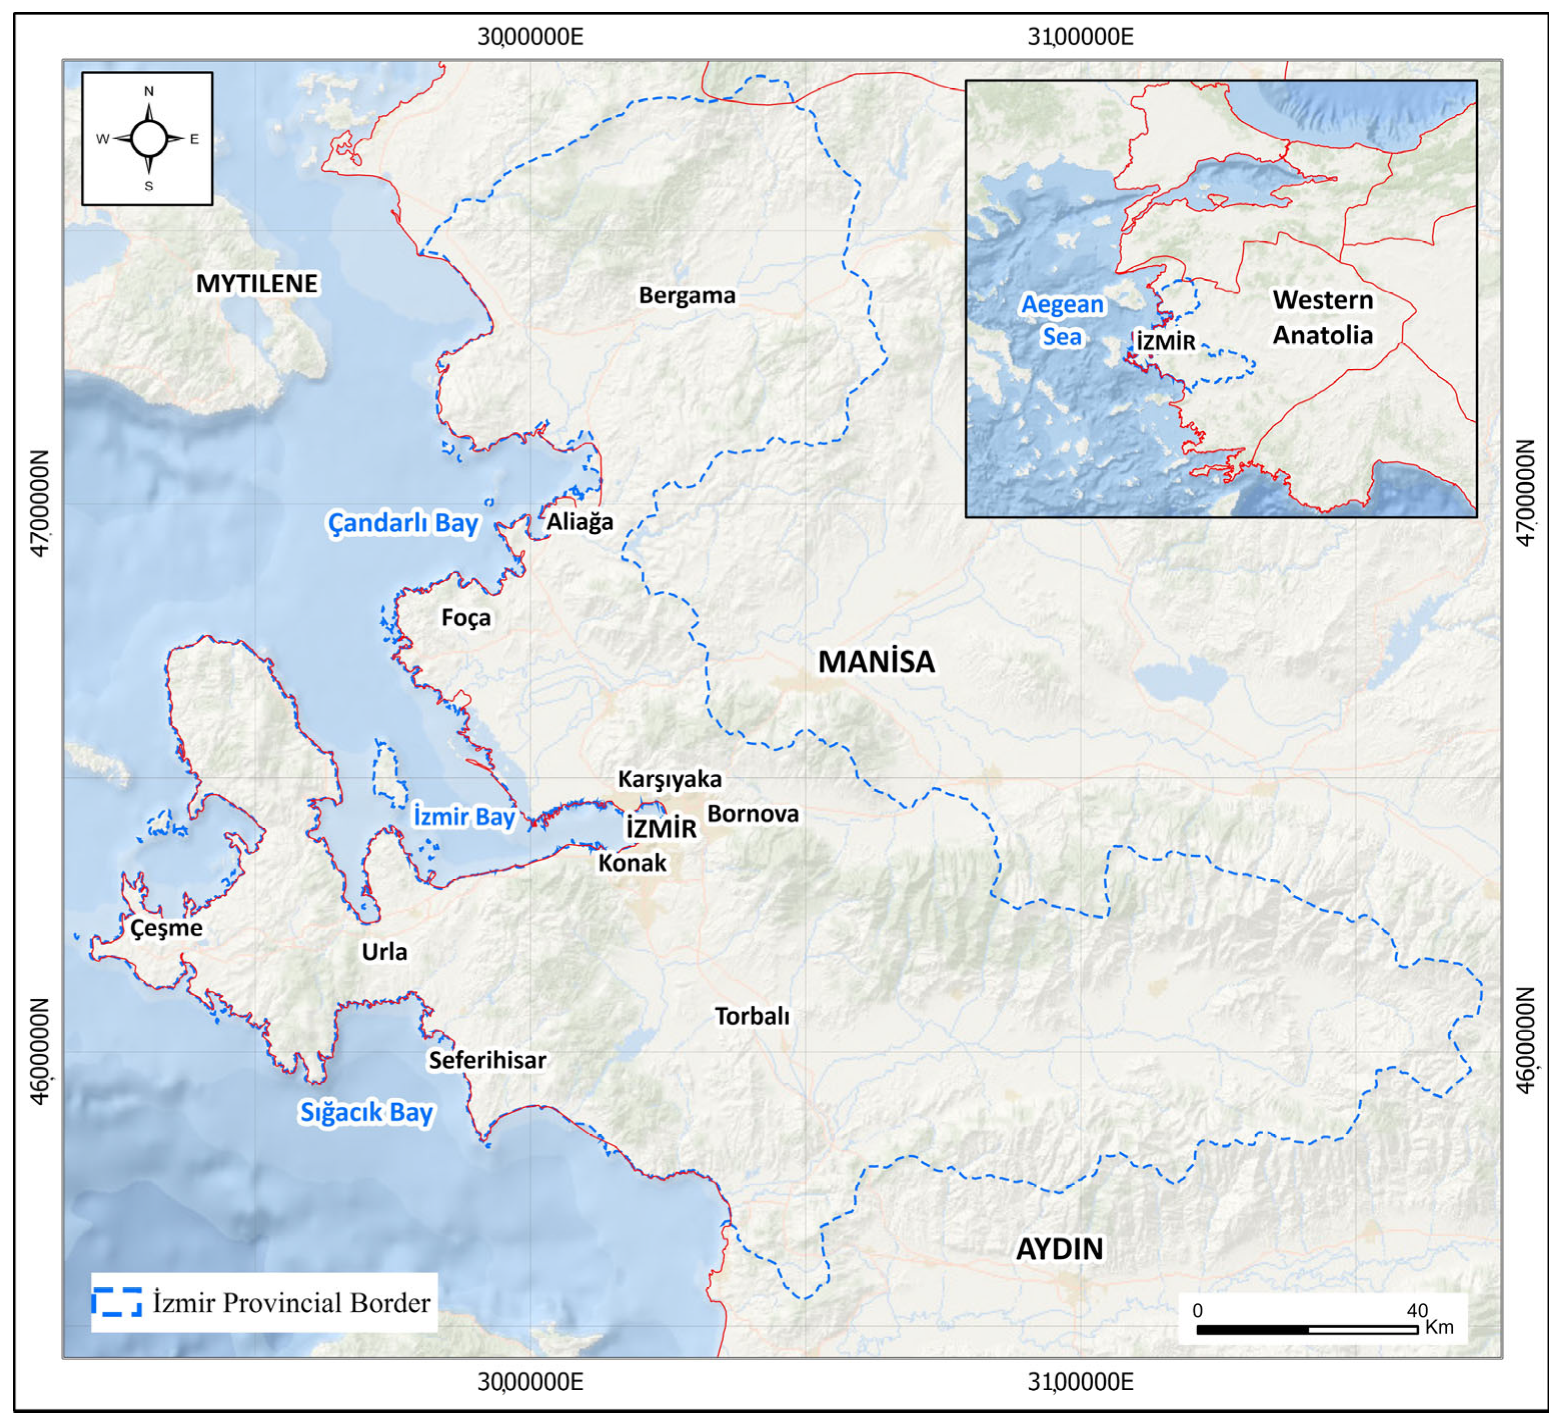
The İzmir Province is located in the Aegean region and spans 11,878 km2 (Figure 1). It is located on the western coast of Turkey while creating a peninsula in the Aegean Sea. The altitude ranges between 0 and 1200 m, and the climate is typically the Mediterranean, with a hot and dry summer and a rainy winter.
The average yearly precipitation recorded between 1991 and 2000 amounts to 675 mm, and is most concentrated during the wet, fall season. The average monthly temperature ranges from 3.8 degrees (°C) in January and 20.8 degrees (°C) in July and August [57].
The landform is heterogenous, with high mountainous peaks directly surrounding Izmir’s gulf, where the dense urban settlement is distributed.
In recent years, urbanization occurred at the expense of plain, fertile agricultural areas (26 thousand hectares). Nonetheless, natural and seminatural Mediterranean soils (more than 10 thousand hectares) were also urbanized in the last 28 years (1990–2018) [58].
The Aegean region, also located east of the Mediterranean earthquake belt, is one of Anatolia’s riskiest regions regarding earthquake potential [59]. İzmir, the largest city in Western Anatolia in terms of population (4,425,789 in 2021) [60], has been affected by earthquakes in its history and has witnessed a loss of life and property. When the historical and instrumental period records are examined [61,62,63,64,65], in addition to the earthquakes that took place within the provincial borders of İzmir, many earthquakes in the surrounding provinces, basins, and even the Aegean Sea caused damage to the city. As can be seen especially in the 2020 Samos earthquake, damages occurred as a result of liquefaction in the alluvial soils in the structures in the city center, and in some districts, the earthquake intensity affected the buildings more strongly for a longer period of time with the amplification effect in the earthquake waves due to the basin structure and groundwater levels. For this reason, it is essential to consider seismicity and proximity of existing fault segments when examining soil properties in terms of urbanization. To properly analyze the region, we employed different datasets presented hereafter.
2.2. Data Structure: Urban Atlas
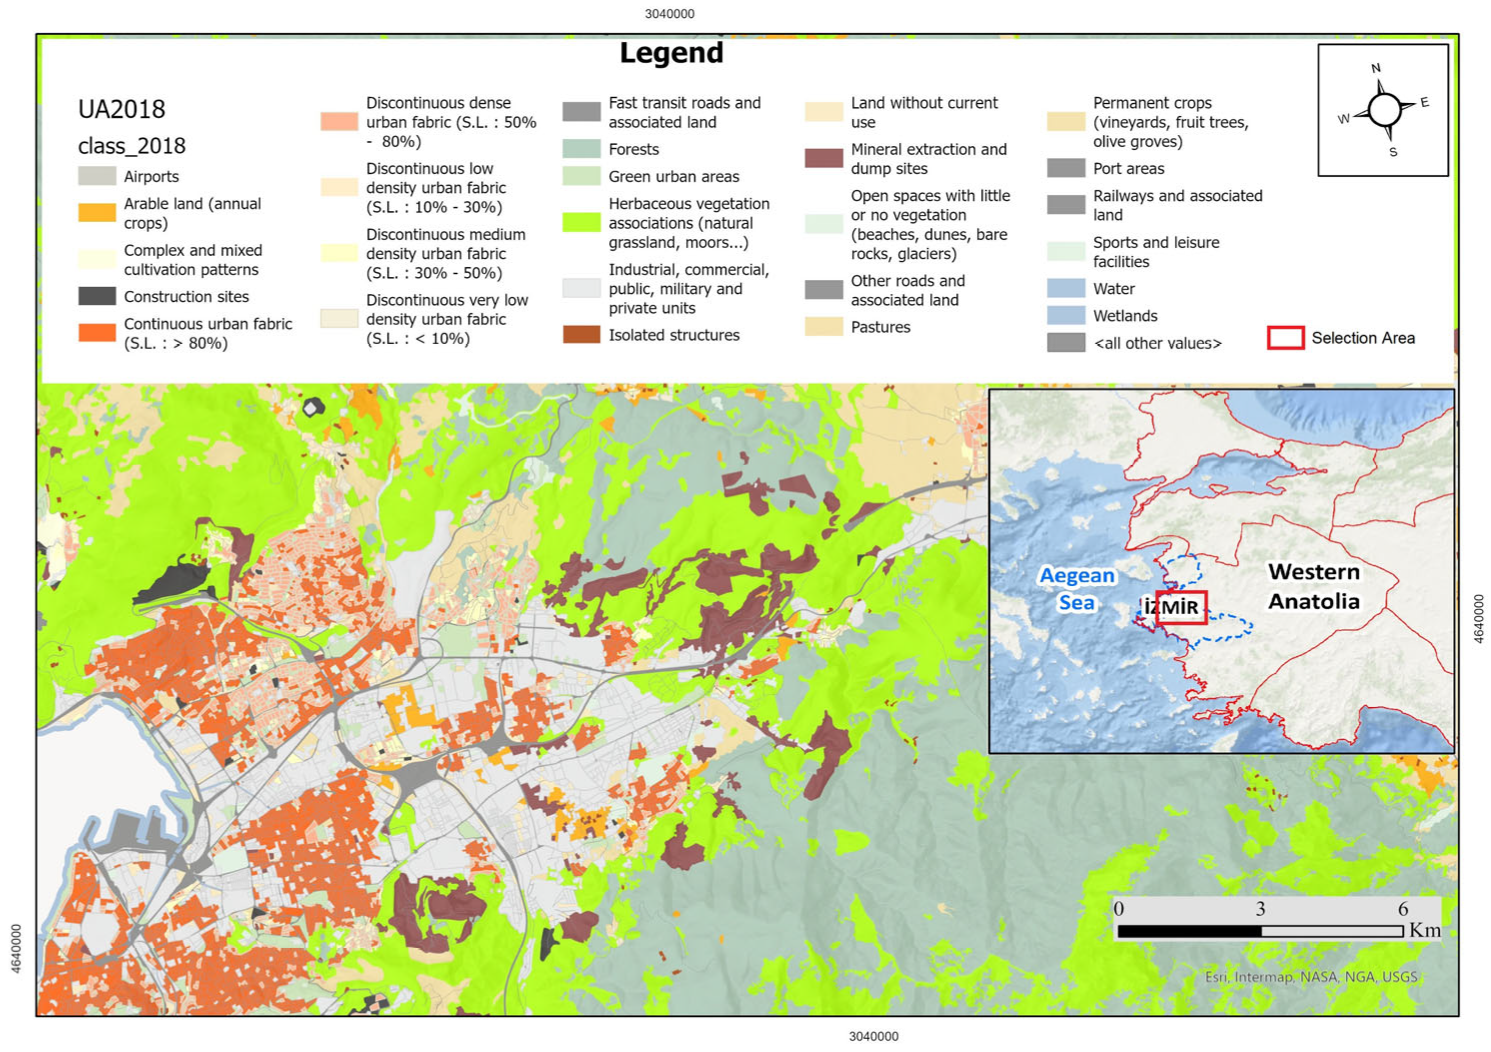
We employed the Urban Atlas database [40] to analyze the most recent urbanization trend in Izmir (Figure 2). The dataset results from a joint initiative of the Commission Directorate-General for Regional and Urban Policy and the Directorate-General for Enterprise and Industry in the EU Copernicus program (European Space Agency and the European Environment Agency) [66].
Urban Atlas provides open-access pan-European comparable land-cover and land-use data that include all major functional urban areas (FUA) [67,68], including Turkey and the West Balkans. The Urban Atlas 2012 release contains 785 FUAs with more than 50,000 inhabitants, and the data can be downloaded in vector format (shapefile) together with the metadata for all the necessary information [69]. Urban Atlas is mainly based on combining (statistical) image classification and visual interpretation of high-resolution satellite imagery. Multispectral SPOT 5 and 6 and Formosat-2 pan-sharpened imagery with a 2 to 2.5 m spatial resolution is used as input data. Built-up classification was conducted while employing the imperviousness layer and enriched by ancillary local sources [19,66]. The legend is articulated in 27 land-use and land-cover classes, and the minimum mapping units range from 0.25 ha for class one to 1 ha for classes two, three, and five (see Table 1).
2.3. Data Structure: Soil Hydraulic Conductibility
The second dataset we employed is the map of saturated hydraulic conductibility (Ksat, mm/h, see Table 2), defined as the soil’s ability to be vertically crossed by fluids according to the fundamental lithological, hydrogeological and geological data [71].
Hydrological soil are generally examined in four main groups according to their approximate infiltration rate, considering their flow and run-off and flooding potentials with their vegetation and lithological characteristics [72].
Group A: Soils (from over-drained sands or gravelly sands) have a high infiltration rate and permeability (low run-off potential) during precipitation.
Group B: Soils with moderate infiltration rate and permeability when saturated with groundwater. These mainly correspond to drainage units but contain more lithologically different materials.
Group C: These are generally impermeable, poorly conductive soils (clay content is present) with a slow infiltration rate when saturated with groundwater.
Group D: This group consists of almost impermeable, shallow soils on material with very high clay content. When saturated with groundwater, it has a very slow infiltration rate (high flow potential). The water transmission of these soils is prolonged.
Hydraulic conductibility is a function of soil porosity and, in turn, soil texture [73,74]: clay soils generally have a lower conductibility than sandy and gravel soils [75] (see the relationship between geological units and hydrological characterization in Table 3). Quaternary alluvium deposits (recent alluvium, talus, delta, and shoreline deposits) have the highest infiltration rate and lowest run-off potential because of included sand and gravel materials. With increasing clay content and small grain size, volcanic, volcano-sedimentary, and flysch units have relatively slow infiltration rates, so this situation causes unexpected surface run-off and flooding events. In addition, similar problems in the soils will be formed by the alteration and physical deformation of these units, which are predominantly in rock type (carbonates, andesite, dacite, etc.) in the field.
As it is known, there is an essential relationship between hydraulic conductivity and groundwater. Whether the soil is saturated with water and its relationship with the slope are parameters that should be considered in terms of engineering applications. Within the scope of this study, topographically inclined and high regions are observed as the areas where rock units are dominant. In addition, stream beds in these regions have been rehabilitated or taken into reinforced concrete channels. This situation directly affects the infiltration and conductivity processes.
Saturated hydraulic conductivity is significantly affected by surface infiltration on the slope. When the saturated soil hydraulic conductivity is high, the safety factor is significantly reduced as surface infiltration appears rapid [75]. Permeability is a measure of the ability of water to pass through units. In situ saturated hydraulic conductivity means implicitly saturated permeability, considering the trapped air in the soil. This value is considered more appropriate than a valid unsaturated region’s fully saturated permeability coefficient.
For this reason, we see that the permeability values of Quaternary alluvial units may differ (detailed soil classification maps according to sand, clay, and silt material size have not been prepared yet), but the presence of water-bearing capacity is seen from the existing wells and groundwater levels. In volcanic (andesite, dacite) and carbonate units, the permeability parameter comes to the fore rather than hydraulic conductivity. Also, fracture-crack systems and faults can cause high permeability and conductivity values in these units. In Table 3, these rock units were included in the classification by considering the characteristics of the altered and relatively low-thickness soil formations associated with the rock. In addition, when the relationship between seismicity and groundwater is analyzed based on rock units, there is no liquefaction in rock units. In this context, it seems that the Quaternary-aged alluvial deposits are the part that needs to be examined and paid attention to primarily for the province of İzmir.
2.4. Data Structure: Major Fault Segments
The active fault map database of Turkey on a 1:250,000 scale [76] was revised as the last version of the tectonic structures within the country’s borders. In that study, active faults were used for faults that formed at least one surface rupture and offset in the Quaternary in geological times. Earthquake surface rupture, Holocene fault, and Quaternary fault definitions corresponding to the Quaternary time were mapped as neotectonic period faults indicating younger activity in geological times. Other faults, which are older and thought to be inactive, were evaluated as probable Quaternary faults or lineaments [76].
Although there are no sharp definition boundaries in all these fault types, there are some limits in applications of real life. It is sometimes a common idea in academia and engineering practices that inactive faults are risk-free. However, mapping these faults with some morphological anomalies, lineaments, contours, and surface manifestations was possible. In addition, surface fractures/ruptures that occur after the earthquake can quickly disappear with surface erosion and atmospheric conditions in a short time. In other words, it cannot be determined today (unless paleoseismological studies are carried out) that these faults may have created surface ruptures in the past. For this reason, these undefined and undifferentiated faults should still be considered risk factors.
Furthermore, it is commonly thought that faults transfer their existing energy by triggering other fault segments near them during/after earthquakes. In this context, it is known that inactive fault segments already have deformation and fracture zones, and that these weak zones will become active again in the event of an energy–stress transfer, and this situation should not be ignored. For this reason, the active–inactive fault distinction was not made in this study, and it was considered that all kinds of faults and fractures could be re-activated in engineering studies.
The essential fault segments around İzmir and their types are given in Table 4. While most faults have a normal fault character, others have a strike-slip character. The faults, which are thought to be located in the Izmir metropolitan area, the gulf, and especially the alluvial ground, have not been extensively investigated yet. These studies will be detailed in the coming years with the microzonation projects that started in 2022 under the execution of the İzmir Metropolitan Municipality. In this context, the critical fault segments (Table 4) found in the 1/100,000 (personal data for earthquake prevention/avoidance zone example) and 1/250,000 scale maps are indicated in this study, and it is suggested they be considered in soil interactions for future studies with more detailed scales.
2.5. Data Structure: Land Capability Classification
A third dataset we employed is the map of land capability classification (LCC, see Table 5), defined as the soil’s propensity to be used for agricultural purposes [77,78]. LCC is based on the 1/25,000 scale national soil database of Turkey based on large soil groups.
According to the physical and chemical characteristic, the LCC divides the soil into seven classes, ranging from one—a high propensity to use the soil for agricultural production to eight—no propensity for agricultural production [69,79]. According to the most common interpretation of the LCC, classes that range between one and four are considered generally “good” soils in terms of potential agricultural production (no specific limitation, from good to medium characterization). Classes five to seven represent soils with some or severe limitations for agricultural purposes, and while class eight presents several restrictions for productive purposes. From a perspective of sustainability, soils one, two or three are extremely precious [80,81]: they are the plainest, most fertile, deep, and biodiverse soils. At the same time, they are more favorable to being urbanized for the same reasons [5,82]: agricultural land represents the most suitable and cheap solution for new urban expansion. Therefore the trade-off between farm productivity and demand for urban land is always conflicting [83,84,85].
2.6. Data Processing
The land-use change analysis was performed by using ESRI ArcGIS (ver. 10.8.1) [86]. The geoprocessing phases included the intersection of vector polygons UA 2012 and 2018. Once intersected, the urbanization process was characterized by all the transitions from agricultural and natural or seminatural classes into urban areas (including the new urban green areas and green/sports facilities) [43].
Once extracted, the quantitative evaluation of the urbanization was processed employing MS-Excel and a land-use change matrix was created using the pivot function. Then, the empirical analysis of the quantity and distribution of the most relevant changes was completed.
The impact of urbanization on soil hydraulic conductibility was processed by a spatial intersection between the features of the land-use changes with the hydrological soil group classification (Table 3). Then the areas were recalculated, and the statistics were extracted using a MS Excel pivot table and analyzed.
Analogously, the impact of urbanization on LCC was processed by a spatial intersection between the features of the land-use changes with the large soil group map (Table 5). The land capability classification layer only partially covered the land-use and land-cover catchment; thus, the spatial intersection between the land-use change and the LCC map accounted for only 73% of the features. Statistics were analyzed and extracted using a MS Excel pivot table.
3. Results
3.1. Land-Use Changes in the Metropolitan Area
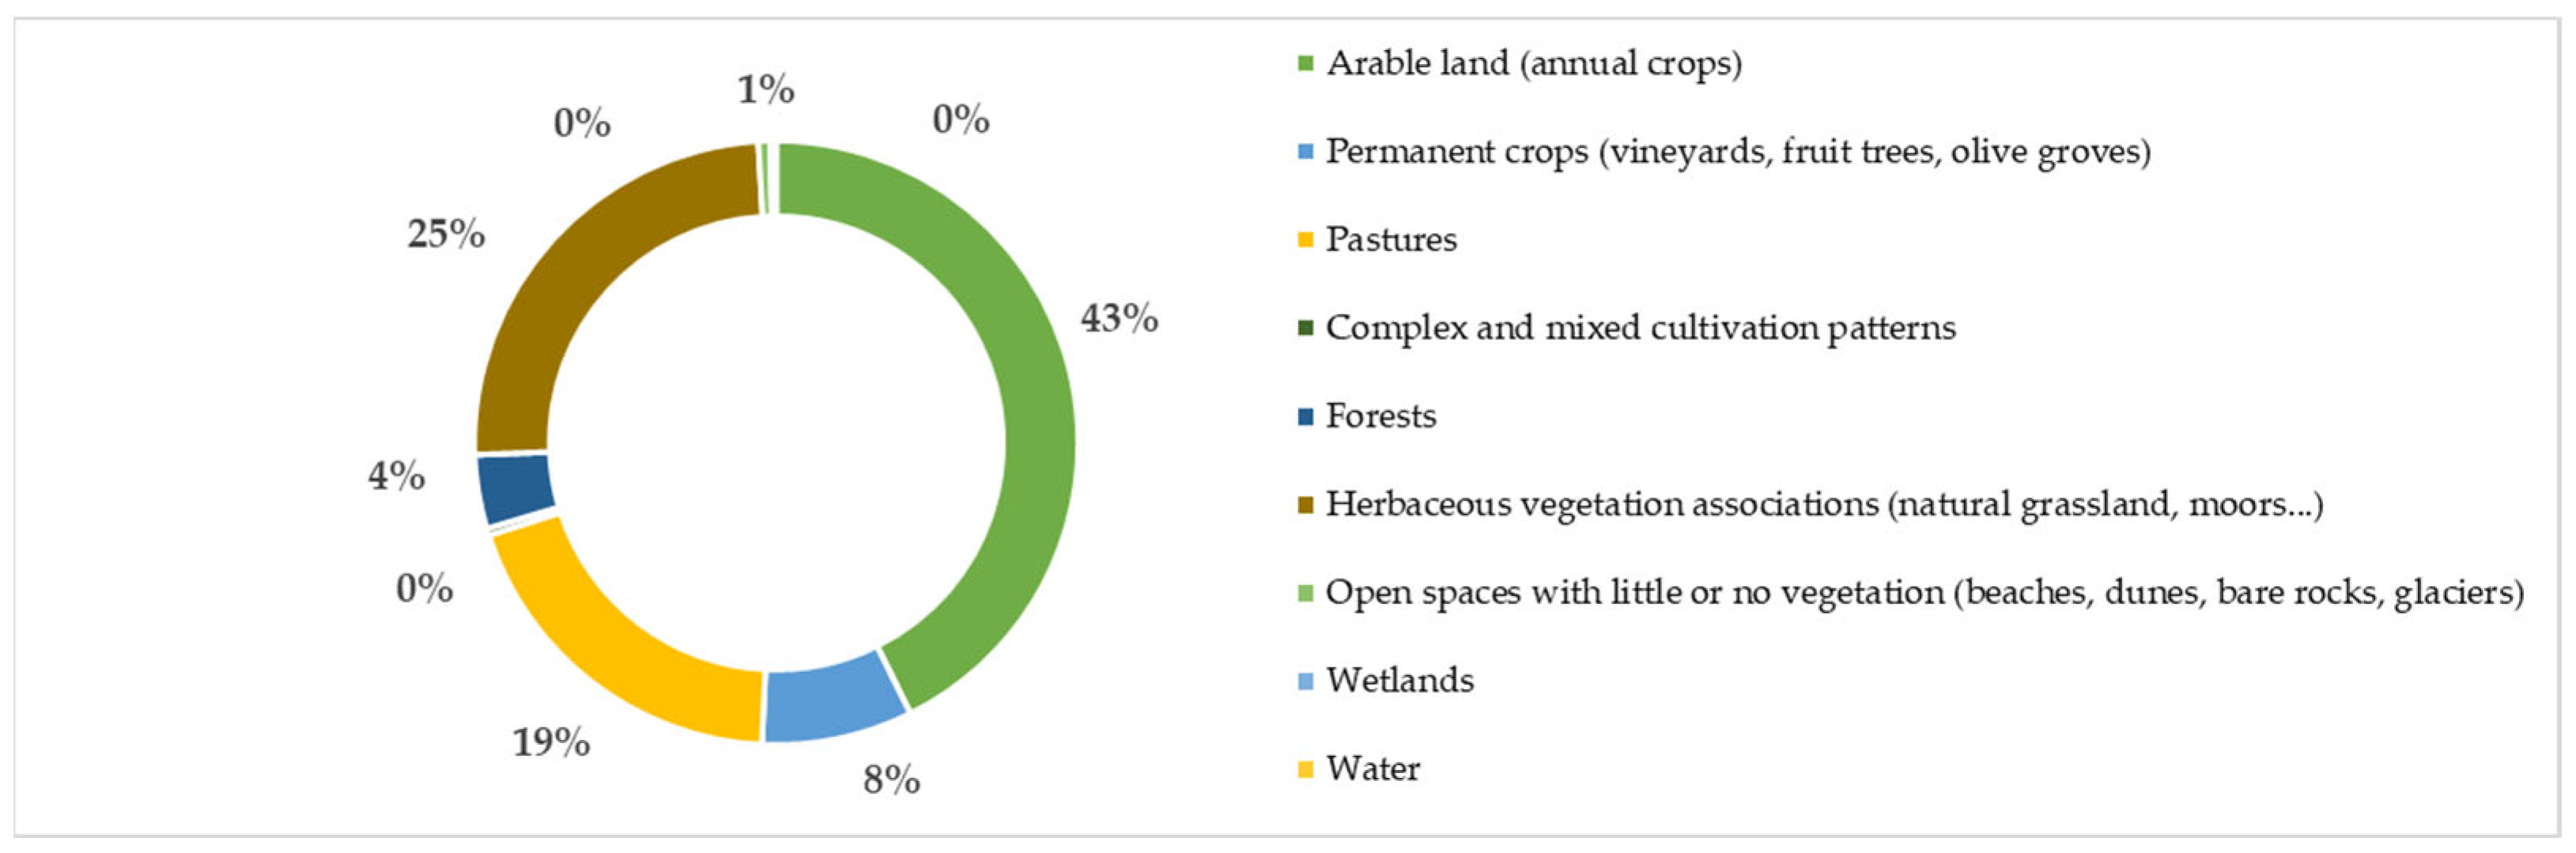
Between 2012 and 2018, the process of urbanization occupied 6074.33 ha.
This process mainly happened at the expense of (see Figure 4):
- Arable land (annual crops) (2592.38 ha);
- Herbaceous vegetation associations (natural grassland, moors...) (1498.71 ha);
- Pastures (1171.06 ha);
- Permanent crops (vineyards, fruit trees, olive groves) (491.35 ha);
- Forests (239.85 ha).
Specifically, arable land (annual crops) has been mainly transformed into industrial, commercial, public, military, and private units. Herbaceous vegetation associations have been mainly transformed into construction sites. Pastures have been mostly converted into industrial or commercial areas, and herbaceous vegetation associations have been mainly transformed into mineral extraction and dump sites.
Industry or commercial areas, construction sites, or quarries/dump sites occupy the most abundant part of the urbanization process, which happens in agricultural or pasture land and herbaceous vegetation.
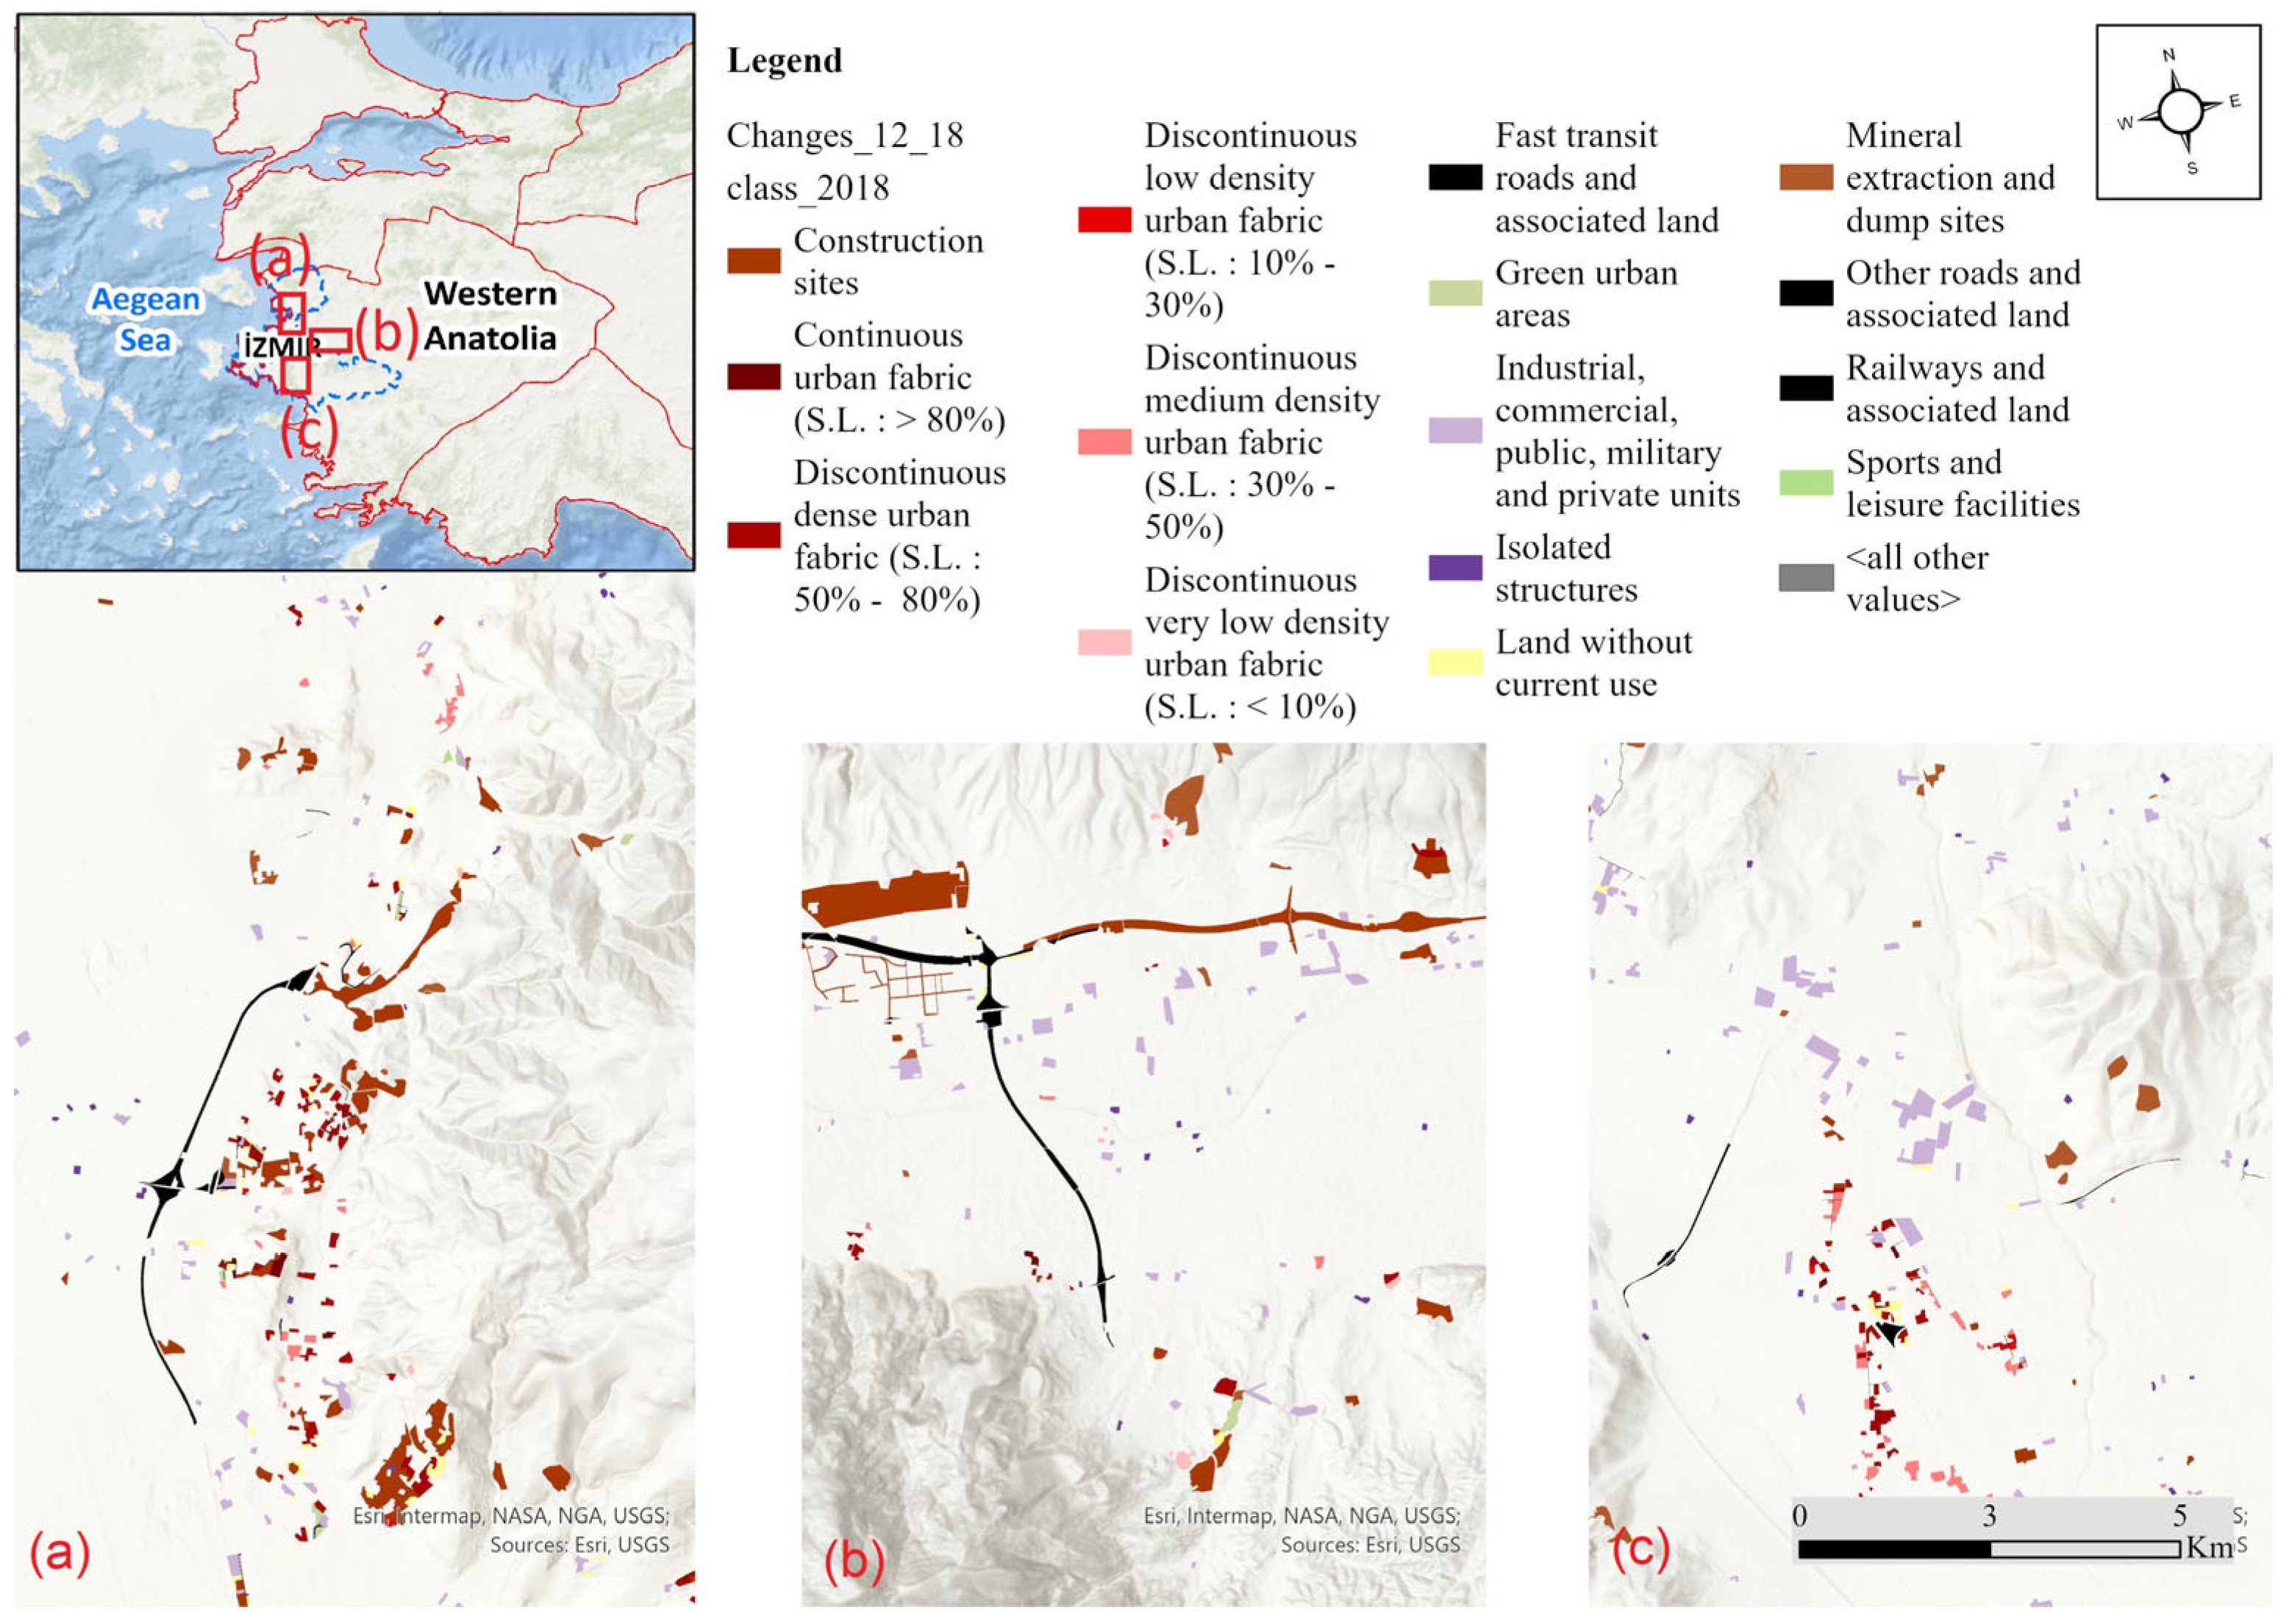
Figure 5 focuses on three different land take typologies. An abundant, spatially clustered amount of new transformation sites are distributed in the Menemen neighborhood (Gediz Delta urbanization Figure 3A). Here, the construction of a new primary road network has been accompanied by the exponential growth of many residential blocks. In this northern cluster, the new construction sites occupy, on average, more than 4 ha. In comparison, the new residential areas occupy less than 2 ha, the average dimension of the new industrial and commercial sites.
Another spatially clustered land take concentration is distributed in the plain eastern corridor of the city, where, similarly to what happened in Menemen, the primary road construction created the precondition for higher accessibility of the industrial zone in the neighborhood (Figure 3B). Here, the average dimension of construction sites is much higher (50 ha), and is dominated by the saturation and expansion of the vast industrial area of the city. The average size of the new production plants is 4 ha, thus emphasizing the massive impact of this extended kind of urbanization.
Finally, a third land take’s spatial cluster was recognized in the south-eastern corridor of the metropolitan area (Figure 3C). Here, there is a mix of different land take patterns: a diffuse expansion of new high- and low-density residential built-up areas surrounding the city of Torbali with an average dimension of 1.5 ha, while there is a concentration of new industrial and commercial areas in the northern catchment, where the average dimension is over 5 ha.
Overall, the spatial characterization and distribution of the land take recorded during the five years demonstrate the heterogeneous character of the phenomena: the polarization of new residential and industrial/commercial areas often happened along the construction of new primary road networks, which, in turn, generated a higher real-estate attractiveness for land transformation. The size and dimension of the new urbanization varies according to the position, proximity with the existent settlement, and land take typology. Nevertheless, it is noteworthy that the major urban expansions are placed on the outskirts of the existing city, at the interface between urban and rural or natural land.
3.2. Impacts on Soil Hydraulic Conductibility
The land-use change impact matrix with hydrological soil group classification clarifies that more than 53% (4076 ha) of the total land take happened on A-type soil, thus causing the most problematic impact in terms of run-off control. It is followed by 13% for B-type, 14% for C-type, and 20% for D-type (Table 7).
Impressively, the land-use classes that had the most significant impact on A-type soil is the industrial, commercial, public, military, and private units. More than 1673 ha of agricultural, natural, or seminatural soils with the highest hydrological capabilities in water absorption were urbanized and sealed mainly through new industries or commercial centers. Analogously, more than 800 ha of A-type soils were urbanized by new construction sites, and this means that the trajectories of transformation sites critically intercept the most hydraulically conductible. Finally, more than 356 ha of A-type soils were urbanized by new mineral extraction and dump sites.
It is worth mentioning that among the new urban development for new residential areas, the discontinuous dense urban fabric had the highest impact on A-type soils (289 ha). Again, this means that most of the new peripheral residential areas built during the last years are placed on highly hydraulically compatible soils. Furthermore, this type of soil degradation also affects the coastline while generating seawater intrusion and the consequent salinization of groundwater [54,56].
3.3. Impacts on Land Capability
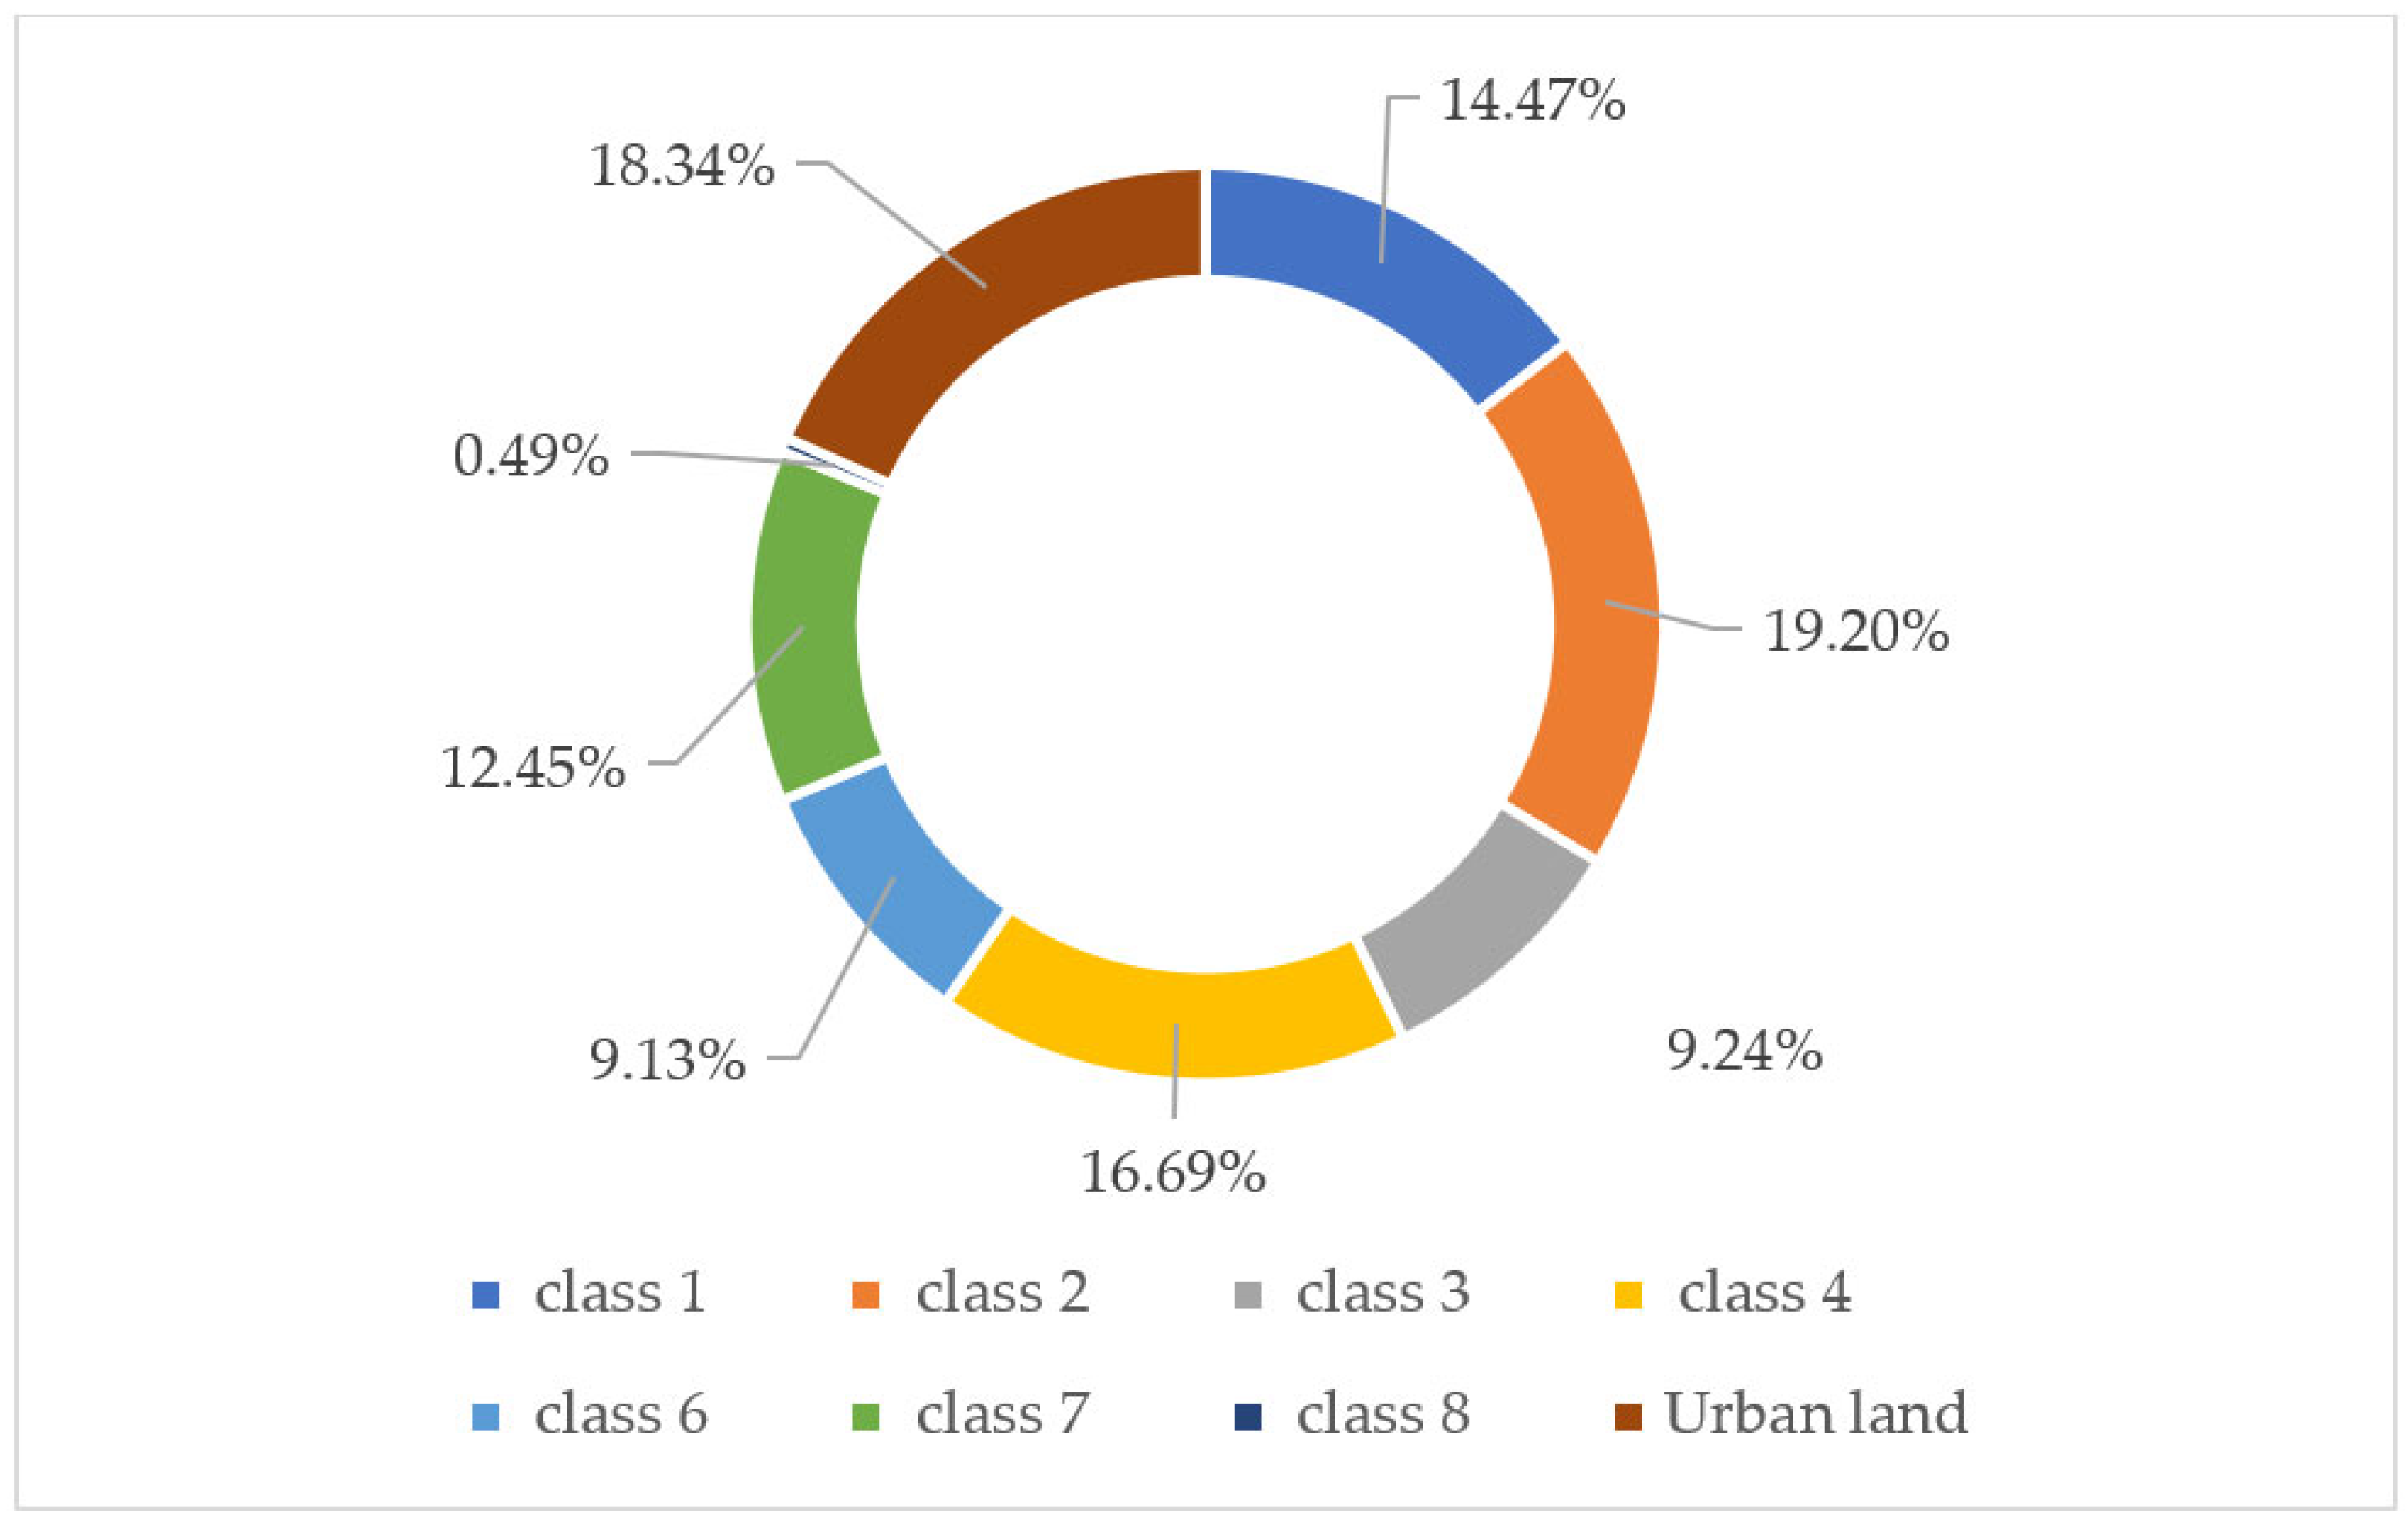
The land-use change impact matrix with LCC shows that of the total amount of land taken by 2012–2018 which intersected the LCC dataset (4414 ha), 14.47% (638 ha) was in class one, 19.20% (847 ha) in class two, 9.24% (407 ha) in class three, 6.69% (736 ha) in class four, 9.13% (402 ha) in class six, 12.45% (549 ha) in class seven, 0.49% (21 ha) in class eight and 18.34% (809 ha) was located in urban land (no land capability classification, see Figure 6).
In absolute terms, the class two soils were abundantly affected by urbanization, followed by urban soils and class four soils. It is worth mentioning that more than 638 ha of urbanized land was in class one, representing the most optimal and suitable location for agricultural purposes.
Looking at the land-use change impact matrix on LCC (Table 8), it can be recognized that 406 ha of the land urbanized on class one soils were isolated structures, while 374 ha were on class two soils. This means that the new detached, peripheral structures located on the city’s border, without continuity and contiguity with the adjacent built-up land, are located on the better soils in terms of potential productivity, thus exacerbating the trade-off between competitive uses of the soil (urban vs. rural/productive) [85,87,88].
Another relevant category is the mineral extraction and dumps sites, which occupied more than 178 ha of class two soil and 342 ha of class four soil. This result must also be interpreted in light of the landscape impact of extraction sites, which according to this data, are located in averagely good land in terms of potential productivity.
3.4. Impacts on Geological Units and Fault Lines
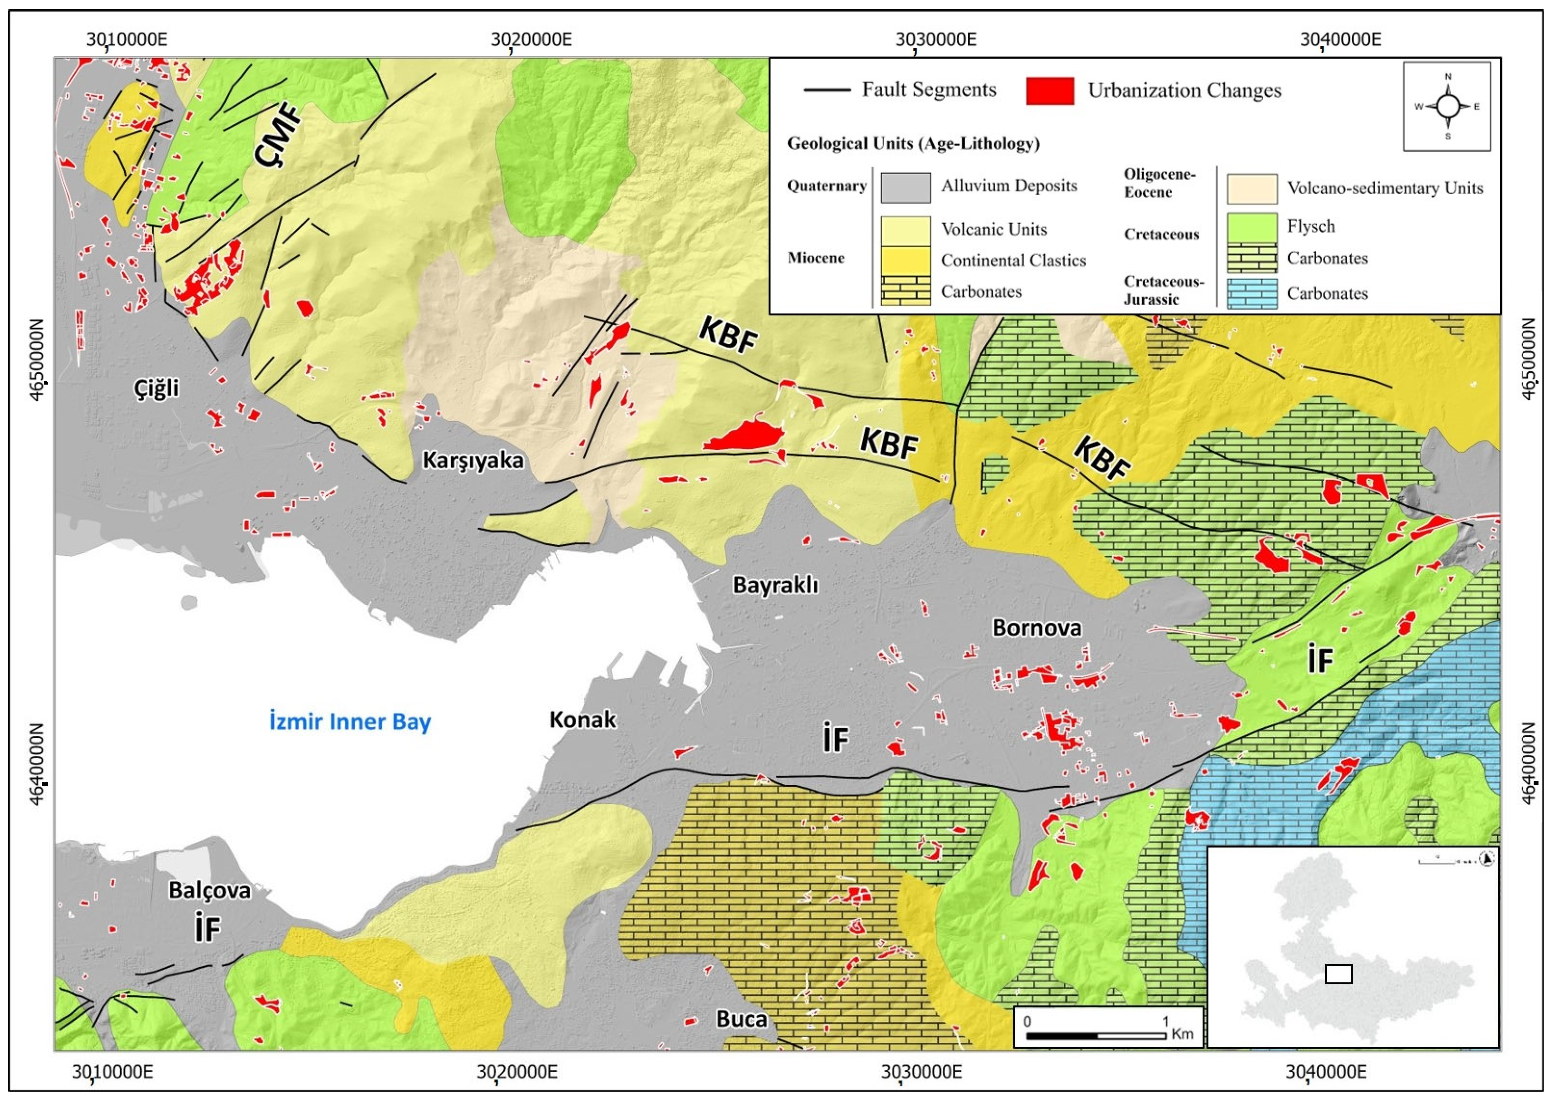
Figure 7 shows the distribution of urbanization changes (red polygons) on geological data. According to this data, most new areas are located on alluvium, volcanic units, and carbonates. In addition, newly built settlements are concentrated in the region between the İzmir Fault (IF) and Karşıyaka-Bornova faults (KBF). Faults, fractures, and crack systems also affect the hydrological characteristics of the units in this area. Especially in the areas of volcanic and carbonate rock, fissure and crack systems may accelerate the infiltration from the surface in the soil and the rock units below. For this reason, it is thought that there is infiltration at medium-slow levels in carbonate and volcanic units, mainly due to the fracture and fissure systems seen in field studies.
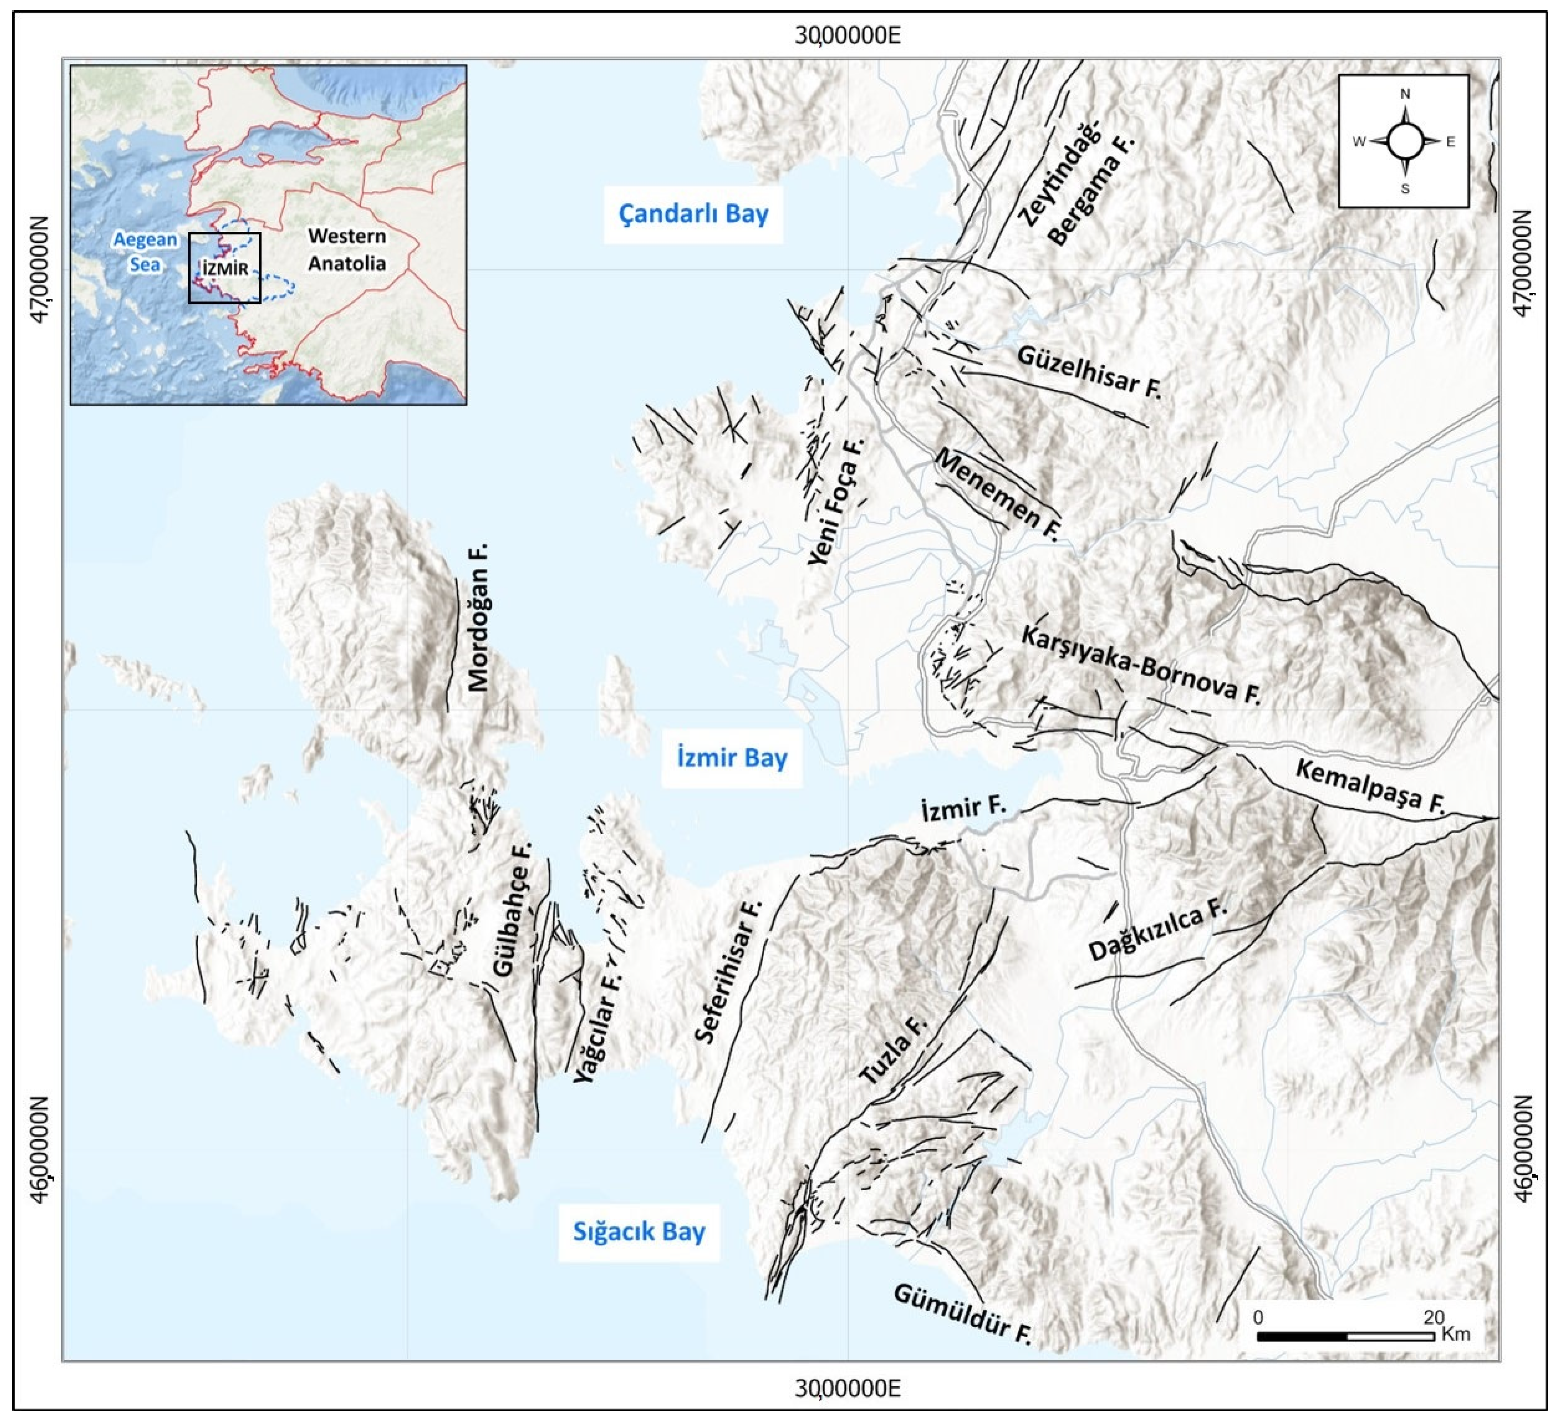
There are vital N–S, NE–SW, NW–SE, and E–W trending fault segments in the city of İzmir, located in a seismically very active region (Figure 8).
As seen in Figure 9, the regions with the lowest Vs30, the average shear wave velocity (Vs30: usually the average seismic shear wave velocity in the upper 30 m), coincide with the distributions of Quaternary alluvial soils around Bayraklı, Karşıyaka, and Konak [52]. It is known that the basin/alluvium effects before, during, and after the earthquake in İzmir Bay and its surroundings cause more than expected deformations on the structures with groundwater level changes and soil amplification [52]. As in the location distribution of the damaged buildings in the 2020 Samos earthquake, tremors affect rock masses and alluvium units differently on either side of the fault planes. For example, buildings in the hanging wall of normal faults are subject to more severe stress than the locations in the footwall. This situation is critical for buildings where the fault surface deformation has the maximum effect on the fault surface rupture. For this reason, some of the literature suggests earthquake prevention/avoidance zones [90,91].
4. Discussion
4.1. Soil Discussion
According to the analysis of land-use change, urbanization is happening regardless of the soil characteristics and the associated seismicity risk. Urbanization is constantly growing, especially in alluvial soils and where groundwater is near the surface.
As demonstrated by this comprehensive analysis, the shrinking of arable land is due to the uncontrolled diffusion of new infrastructure and commercial, productive, and residential areas, which creates spatial agglomerations of different sizes and forms while exposing the new settlements to vulnerable situations [93,94,95].
The massive, uncontrolled utilization of land for the above mentioned uses is problematic for the following reasons [96,97,98]:
- The first is that without a proper metropolitan structural scheme for urban development, the massive diffusion of new anthropic areas is going to seal the most fertile soils in terms of potential biomass production while increasing, in the long term, the problem of food security at the local level;
- The second is that, according to results, the reduction in biodiversity is accompanied by a significant impact on highly hydraulically conductible soils (A-type), which, in turn, generate a high risk of pluvial flooding in the newly developed urban areas [99];
- The third is that the reduction in the most fertile and hydraulically compatible soil is shrinking the cropland managed by extensive sustainable farming. The intensification of crop production in the remaining plain land is causing a change in the landscape management of rural land.
For the first two points, ecosystem vulnerability classifications based on soil characterization can be widely used in different study contexts to set policy targets and define site-specific regulations [100,101,102]. By following comprehensive environmental recommendations, soil and geology characteristics can be used to determine new conservation areas through specific regulatory zoning and local planning activity.
- If planned, land take should be limited, mitigated, or compensated [103,104]. The impact of land transformation on the ecosystem can be minimized while adopting green mitigation or compensative solutions. The new design and nature-based or technological solutions can drastically reduce the impermeabilization of the soil, increase the green areas, the shadow, and the vegetated biomass;
- Compensation measures for the land take process can be considered at the landscape/metropolitan scale while designing specific public areas to host biodiversity [105]. Land taxation can pay for new afforestation projects on public land in new development areas and re-balance the system’s ecosystem capability [106]. Also, agroforestry projects can be optimal for connecting ecological corridors and existent biodiversity core sites.
- Re-naturing solutions can also be considered in the existent built-up stock to reduce the anthropic pressure through ecological interventions, which include: de-sealing, building replacement, reduction in the urban footprint, and the adoption of nature-based solutions [107].
The coupled integration of the above-mentioned recommendations (green mitigative solutions, compensation and afforestation, and re-naturing solutions) are all based on deep soil characterization, thus confirming the crucial role of soil knowledge in urban planning.
As for the impoverishment, shrinking, and consumption of rural areas described in Section 3.1 (land-use change analysis), the situation is even more complicated, since the reduction in arable land (2592.38 ha), herbaceous vegetation associations (1498.71 ha) and mainly in pastures (1171.06 ha) is significantly affecting the entire primary production economy of the region, shifting from extensive local farm products to the massive plantation of monocultures such as corn production. Unfortunately, this trend has been evidenced by broad LUC analysis based on an extended temporal time-series (1990–2018) in Izmir’s metropolitan area [58], where more than 34 thousand hectares of non-irrigated arable land became permanently irrigated land in less than thirty years.
The coupled action of the new city’s expansion at the expense of the most fertile land is generating tangible biophysical effects on ecosystems and social and ecological abandonment of more local, sustainable, extensive agriculture. These activities are based on mixed-use land (agroforestry), triggering people’s migration from inner farmland to the city center. In this case, alternative farming practices based on a stepwise introduction of more resilient, local, and less hydro-demanding farm production can be made possible only by long-term policies that envision the abandonment of intensive corn production and the shift to perennial cultivations. This requires an extensive vulnerability analysis of the water yield in each sub-catchment that supports the development of schemes and contracts with local farmers to favor sustainable, local productions.
Once more, the study of soil characteristics and the spatial evaluation of the ecosystem’s capacity can make a significant difference in planning. Indeed, land suitability analysis can immediately support the identification of different kinds of more sustainable rural products such as wheat, vegetables, and orchards while, in the long term, the introduction of perennial cultivations can represent optimal solutions also for the biodiversity of the region: olives, almonds, figs, grapes, pears, and chestnuts [108].
The knowledge of the soil’s characteristics can play a significant role in planning for many reasons. For example, alluvial soils offer a perfect location for new buildings, but, at the same time, they are critical in terms of seismicity when considering geological and hydrogeological features. Important metropolitan cities such as Kathmandu (Nepal), Istanbul (Turkey), Mexico City (Mexico), and Los Angeles (USA) located on weak soils and fault lines in the world, have been exposed to loss of life and property due to repeated destructive earthquakes at specific periods. As viewed in the İzmir Earthquake Master Plan [92], the average shear wave velocity Vs30 (usually the average seismic shear wave velocity in the upper 30 m) is the leading parameter for selecting the soil type (See Figure 6). This parameter is also directly related to the expected amplification of the seismic shaking. Soil types A to D (vs. 30 more than 180 m/s), described in detail in [109], range from rock or other rock-like formations to sandy clay soils. Type D and E soils are characterized by loose cohesionless soils and sharp contrast of hardness between a loose surface layer and a much more massive underlying foundation. In addition, potential liquefaction and wave amplification events during the earthquake threaten the existing structures as well as pose a risk factor in the expansion areas where new settlements are located.
4.2. Geologic Discussion
Earthquake surface rupture, another risk factor, is the appearance of the movement of the fault on the ground surface. Generally, these displacements occur as a result of destructive earthquakes along active faults. The probability of surface faulting and the amount of slip are related to earthquake magnitude, depth, fault geometry, and lithological features.
It is common for soil properties to have a destructive effect, such as earthquake wave amplification, and to rupture and damage directly under the structures [52]. In this context, safety zones are defined at certain distances on both sides of the fault planes called earthquake prevention/avoidance zones. These zones at different distances have been proposed for different fault types worldwide. In addition, there are important studies on this subject in Turkey and the province of Izmir, but this protection method has not been applied much, except for a few certain regions [110,111].
While E–W trending fault segments are related to the major graben–horst systems of Western Anatolia [59], approximately NE–SW trending fault segments are connected to the strike-slip-dominated İzmir-Balıkesir transfer zone [51]. The critical fault segments are Gülbahçe, Seferihisar, Tuzla, and İzmir (Figure 7). When we look around the city center, two critical tectonic zones affect the morphology of Izmir Bay. While the İzmir Fault bordered the Çatalkaya and Nif mountain elevations in the south, the Karşıyaka-Bornova faults bordered the volcanic Yamanlar Mountain in the north. Along these two fault segments, the ground forming the inner gulf of İzmir collapsed, and the waters of the Aegean Sea advanced to the internal parts [51]. In these areas, the drainages are usually perpendicular to the faults. At the same time, these faults physically deformed the surrounding rocks. As a result of this deformation, soil formation in the character of permeable, unstable talus has occurred around the bay.
There were some studies conducted for the Izmir metropolitan area on earthquakes and soil liquefaction, and some risk mapping has been completed according to the results of this study [52,92]. Figure 10 shows a GIS application example of the region where one of the urbanization change areas determined in this study intersects with faults around Karşıyaka-Bornova. With this visualization, which is based on the principle of choosing a buffer zone on both sides of the fault in the range of 20 to 50 m (which may vary depending on the fault type: normal faults, strike-slip faults), we aim to limit destruction and casualties from potential surface ruptures while containing the urbanization [112,113]. Just as in this example, at many areas determined in the study area, fault segments, Quaternary alluvium, and areas with new urbanization spatially intersect, so there is a very risky situation in terms of surface rupturing.
4.3. Limits and Novelties
This study is mainly based on digital datasets (even though corrected/customized by direct field surveys), which were used to produce a large-scale assessment of the land take impacts on soil. This means that, in the case of hydraulic conductibility, the classification is based on a parametric association between soil types (materials) and conductivity. Even though this association is widely used for water run-off parametrization, it is well known that parametrization does not represent reality, especially in understanding the coupled integration between soil and vegetation, which can influence hydraulic characterization.
Also, the slope is another parameter that critically influences the infiltration capacity but also the urban expansion, which is limited in the mountain region. Indeed, the surface flow is dominant in high-sloping lands, while in the areas with flat topography, infiltration occurs at a higher rate compared to the sloping lands. Furthermore, not only the degree of the slope but also the kind of slope (concave, convex, etc.) affects infiltration, demonstrating that these parameters should be analyzed through a comprehensive characterization of the site. However, when we look at the findings of our field studies and the spread of geological formations in the region, permeability parameters are controlled by fracture-crack systems rather than soil hydraulic conductivity, since more rock units are located in the sloped regions.
We are aware that site-specific studies on environmental impact assessments of newly developed areas should be based on direct field observation and soil analysis developed at the local scale. Nevertheless, this study was not aimed at defining a new methodology for environmental impact assessment but rather demonstrating how much the past development trend has significantly impacted the most favorable soil in terms of water absorption and agricultural productivity, also resulting in deep contrast with the fault lines. In this context, GIS-based analysis revealed how the newly made site selections should be made by considering the soil characteristics. In this context, many important parameters not mentioned in this article based on engineering and architecture must be first investigated and then integrated into urban planning studies. Thus, it will be possible to create cities that are more resilient and less affected by future natural disasters. Furthermore, even though the economic benefit were not investigated here, the monetarization of the potential urbanization’s impact can play a vital role in easing the land transformations.
At the same time, the methodology adopted here can suggest essential changes in the urban planning decision-making phases. The dataset we employed is commonly diffused among different regions/countries; thus, we believe this approach can be easily replicated elsewhere. Specifically, during the preliminary phase of metropolitan planning, various development alternatives can support a suitability or conflict analysis while finding the less impacting and more resilient scenario for local communities. In light of climate change conditions, this assessment should be made before the final prefiguration of plans and projects to drastically reduce urban systemic vulnerability.
5. Conclusions
Are soil and geology characteristics considered in urban planning? This rhetorical question shaped the research article, where the competencies of geography, urban planning, topography, and soil science were simultaneously used to build a geodatabase for Izmir’s urban area.
First, we conducted a spatial analysis of the land-use change trends between 2012 and 2018 by employing a cross-tabulation matrix. We discovered the distribution and extension of the major land-use alterations in recent years. Then, to understand the impact of newly developed areas, new urbanizations were qualitatively analyzed by intersection with four ancillary datasets: the soil hydraulic conductibility, the land capability classification, the geological units, and fault lines.
The results confirmed a huge underestimation of the soil’s characteristics in urbanization processes: more than 53% of the total land take happened on A-type soil, thus causing the most problematic impact in terms of run-off control. Moreover, more than the 34% of new urbanizations were located on highly fertile soil, in terms of potential agricultural production (LCC). We discovered that new detached, peripheral structures were located on the city’s border, without continuity and contiguity with the adjacent built-up land.
Thirdly, we verified that new urban areas were built without considering the problem of soil liquefaction or on top of active fault lines.
All these limits were discussed while trying to address some policy recommendations, which included the effects of uncontrolled urban planning not only at the expense of the natural environment and the relative ecosystem services but also the long-term landscape degradation processes in the rural areas and the most problematic aspects of the exposure of citizens to earthquake effects.
Some specific recommendations were designed to address the problem of land take (green mitigative solutions, compensation or afforestation, and re-naturing areas), while other comprehensive solutions were discussed to reduce the intensification of corn cultivation in intensive farm productions.
However, in the current situation, it would be unrealistic to say that these measures can be immediately introduced to standard planning procedures in Turkey due to many procedural, bureaucratic and legal procedures that are not investigated by this study. Nevertheless, even though we know this practical limit, we demonstrated how geological characteristics can be employed to develop more rational and resilient urban planning.
Author Contributions
Conceptualization, S.S. and T.U.; methodology, S.S. and T.U.; validation, S.S. and T.U.; formal analysis, S.S. and T.U.; resources, S.S. and T.U.; writing—original draft preparation, S.S. and T.U.; writing—review and editing, S.S. and T.U.; supervision, S.S. and T.U. All authors have read and agreed to the published version of the manuscript.
Funding
This research received no external funding.
Data Availability Statement
Not applicable.
Conflicts of Interest
The authors declare no conflict of interest.
References
- Jeffery, S.; Gardi, C.; Jones, A.; Montanarella, L.; Marmo, L.; Miko, L.; Ritz, K.; Peres, G.; Römbke, J.; van der Putten, W.H. (Eds.) European Atlas of Soil Biodiversity; Publications Office of the European Union: Luxemburg, 2010; ISBN 9789279158063. [Google Scholar]
- Lugato, E.; Panagos, P.; Bampa, F.; Jones, A.; Montanarella, L. A new baseline of organic carbon stock in European agricultural soils using a modelling approach. Glob. Chang. Biol. 2014, 20, 313–326. [Google Scholar] [CrossRef]
- Estoque, R.C.; Murayama, Y. Intensity and spatial pattern of urban land changes in the megacities of Southeast Asia. Land Use Policy 2015, 48, 213–222. [Google Scholar] [CrossRef]
- United Nations—Department of Economic and Social Affairs—Population Division. The World ’s Cities in 2018—Data Booklet; United Nations: New York, NY, USA, 2018. [Google Scholar]
- Vaz, E.; Nijkamp, P. Gravitational forces in the spatial impacts of urban sprawl: An investigation of the region of Veneto, Italy. Habitat Int. 2015, 45, 99–105. [Google Scholar] [CrossRef]
- Orgiazzi, A.; Ballabio, C.; Panagos, P.; Jones, A.; Fernández-Ugalde, O. LUCAS Soil, the largest expandable soil dataset for Europe: A review. Eur. J. Soil Sci. 2018, 69, 140–153. [Google Scholar] [CrossRef] [Green Version]
- Lafortezza, R.; Davies, C.; Sanesi, G.; Konijnendijk, C.C.C. Green Infrastructure as a tool to support spatial planning in European urban regions. Iforest—Biogeosci. For. 2013, 6, 102–108. [Google Scholar] [CrossRef] [Green Version]
- Childers, D.L.; Bois, P.; Hartnett, H.E.; Mcphearson, T.; Metson, G.S.; Sanchez, C.A. Urban Ecological Infrastructure: An inclusive concept for the non-built urban environment. Elem. Sci. Anthr. 2019, 7, 46. [Google Scholar] [CrossRef] [Green Version]
- Carolina, G.; Dafne, R.; Stefano, S. Integrated process of Ecosystem Services evaluation and urban planning. The experience of LIFE SAM4CP project towards sustainable and smart communities. In Proceedings of the 9th International Conference Improving Energy Efficiency in Commercial Buildings and Smart Communities, Frankfurt am Main, Germany, 16–18 March 2016; pp. 43–54. [Google Scholar]
- Moser, S.; Meerow, S.; Arnott, J.; Jack-Scott, E. The turbulent world of resilience: Interpretations and themes for transdisciplinary dialogue. Clim. Chang. 2019, 153, 21–40. [Google Scholar] [CrossRef]
- Meerow, S.; Newell, J.P. Spatial planning for multifunctional green infrastructure: Growing resilience in Detroit. Landsc. Urban Plan. 2017, 159, 62–75. [Google Scholar] [CrossRef]
- Xu, C.; Rahman, M.; Haase, D.; Wu, Y.; Su, M.; Pauleit, S. Surface runoff in urban areas: The role of residential cover and urban growth form. J. Clean. Prod. 2020, 262, 121421. [Google Scholar] [CrossRef]
- Geitner, C.; Baruck, J.; Freppaz, M.; Godone, D.; Grashey-Jansen, S.; Gruber, F.E.; Heinrich, K.; Papritz, A.; Simon, A.; Stanchi, S.; et al. Soil and Land Use in the Alps—Challenges and Examples of Soil-Survey and Soil-Data Use to Support Sustainable Development. In Soil Mapping and Process Modeling for Sustainable Land Use Management; Elsevier: Amsterdam, The Netherlands, 2017; pp. 221–292. [Google Scholar] [CrossRef]
- Maragno, D.; Dall’omo, C.F.; Pozzer, G.; Musco, F. Multi-risk climate mapping for the adaptation of the venice metropolitan area. Sustainability 2021, 13, 1334. [Google Scholar] [CrossRef]
- Ronchi, S. Ecosystem Services for Planning: A Generic Recommendation or a Real Framework? Insights from a Literature Review. Sustainability 2021, 13, 6595. [Google Scholar] [CrossRef]
- Maes, J.; Egoh, B.; Willemen, L.; Liquete, C.; Vihervaara, P.; Schägner, J.P.; Grizzetti, B.; Drakou, E.G.; La Notte, A.; Zulian, G.; et al. Mapping ecosystem services for policy support and decision making in the European Union. Ecosyst. Serv. 2012, 1, 31–39. [Google Scholar] [CrossRef]
- Sala, S.; Farioli, F.; Zamagni, A. Progress in sustainability science: Lessons learnt from current methodologies for sustainability assessment: Part 1. Int. J. Life Cycle Assess. 2013, 18, 1653–1672. [Google Scholar] [CrossRef]
- Wang, Y.; Chang, Q.; Fan, P. A framework to integrate multifunctionality analyses into green infrastructure planning. Landsc. Ecol. 2020, 36, 1951–1969. [Google Scholar] [CrossRef]
- Morabito, M.; Crisci, A.; Georgiadis, T.; Orlandini, S.; Munafò, M.; Congedo, L.; Rota, P.; Zazzi, M. Urban imperviousness effects on summer surface temperatures nearby residential buildings in different urban zones of Parma. Remote Sens. 2018, 10, 26. [Google Scholar] [CrossRef] [Green Version]
- Kabisch, N.; Haase, D. Green spaces of European cities revisited for 1990–2006. Landsc. Urban Plan. 2013, 110, 113–122. [Google Scholar] [CrossRef]
- Duarte, G.T.; Ribeiro, M.C.; Paglia, A.P.; Csuti, B.; Fackler, P.; Lonsdorf, E. Ecosystem Services Modeling as a Tool for Defining Priority Areas for Conservation. PLoS ONE 2016, 11, e0154573. [Google Scholar] [CrossRef] [Green Version]
- Rosenzweig, B.; Ruddell, B.L.; McPhillips, L.; Hobbins, R.; McPhearson, T.; Cheng, Z.; Chang, H.; Kim, Y. Developing knowledge systems for urban resilience to cloudburst rain events. Environ. Sci. Policy 2019, 99, 150–159. [Google Scholar] [CrossRef]
- Sjöman, J.D.; Gill, S.E. Residential runoff—The role of spatial density and surface cover, with a case study in the Höjeå river catchment, southern Sweden. Urban For. Urban Green. 2014, 13, 304–314. [Google Scholar] [CrossRef]
- Davis, M.; Naumann, S. Making the Case for Sustainable Urban Drainage Systems as a Nature-Based Solution to Urban Flooding. In Theory and Practice of Urban Sustainability Transitions; Springer: Cham, Switzerland, 2017; pp. 123–137. [Google Scholar]
- Pistocchi, A.; Calzolari, C.; Malucelli, F.; Ungaro, F. Soil sealing and flood risks in the plains of Emilia-Romagna, Italy. J. Hydrol. Reg. Stud. 2015, 4, 398–409. [Google Scholar] [CrossRef]
- Keys, P.W.; Porkka, M.; Wang-Erlandsson, L.; Fetzer, I.; Gleeson, T.; Gordon, L.J. Invisible water security: Moisture recycling and water resilience. Water Secur. 2019, 8, 100046. [Google Scholar] [CrossRef]
- Dorst, H.; van der Jagt, S.; Raven, R.; Runhaar, H. Urban greening through Nature-Based Solutions—Key characteristics of an emerging concept. Sustain. Cities Soc. 2019, 49, 101620. [Google Scholar] [CrossRef]
- Raymond, C.M.; Frantzeskaki, N.; Kabisch, N.; Berry, P.; Breil, M.; Nita, M.R.; Geneletti, D.; Calfapietra, C. A framework for assessing and implementing the co-benefits of nature-based solutions in urban areas. Environ. Sci. Policy 2017, 77, 15–24. [Google Scholar] [CrossRef]
- Cortinovis, C.; Geneletti, D. Ecosystem services in urban plans: What is there, and what is still needed for better decisions. Land Use Policy 2018, 70, 298–312. [Google Scholar] [CrossRef]
- Brunetta, G.; Salata, S. Mapping Urban Resilience for Spatial Planning—A First Attempt to Measure the Vulnerability of the System. Sustainability 2019, 11, 2331. [Google Scholar] [CrossRef] [Green Version]
- Carpignano, A.; Golia, E.; Di Mauro, C.; Bouchon, S.; Nordvik, J.P. A methodological approach for the definition of multi-risk maps at regional level: First application. J. Risk Res. 2009, 12, 513–534. [Google Scholar] [CrossRef]
- O’Rourke, T.D. Infrastructure Interdependencies and Resilience. Bridg. Acad. Eng. 2007, 37, 22–29. [Google Scholar] [CrossRef]
- Takagi, J.; Wada, A. Recent earthquakes and the need for a new philosophy for earthquake-resistant design. Soil Dyn. Earthq. Eng. 2017, 119, 499–507. [Google Scholar] [CrossRef]
- Uenishi, K. Physics of Earthquake Disaster: From Crustal Rupture to Building Collapse. Annu. Rev. Earth Planet. Sci. 2018, 46, 387–408. [Google Scholar] [CrossRef]
- Veldkamp, A.; Verburg, P.H. Modelling land use change and environmental impact. J. Environ. Manag. 2004, 72, 1–3. [Google Scholar] [CrossRef]
- Tan, M.; Li, X.; Xie, H.; Lu, C. Urban land expansion and arable land loss in China—A case study of Beijing–Tianjin–Hebei region. Land Use Policy 2005, 22, 187–196. [Google Scholar] [CrossRef]
- Burton, C.G. A Validation of Metrics for Community Resilience to Natural Hazards and Disasters Using the Recovery from Hurricane Katrina as a Case Study. Ann. Assoc. Am. Geogr. 2015, 105, 67–86. [Google Scholar] [CrossRef]
- Saravanan, S.; Jegankumar, R.; Selvaraj, A.; Jacinth Jennifer, J.; Parthasarathy, K.S.S. Chapter 20—Utility of Landsat Data for Assessing Mangrove Degradation in Muthupet Lagoon, South India. In Coastal Zone Management; Ramkumar, M., James, R.A., Menier, D., Kumaraswamy, K., Eds.; Elsevier: Amsterdam, The Netherlands, 2019; pp. 471–484. ISBN 978-0-12-814350-6. [Google Scholar]
- Mahiny, A.S.; Clarke, K.C. Guiding SLEUTH land-use/land-cover change modeling using multicriteria evaluation: Towards dynamic sustainable land-use planning. Environ. Plan. B Plan. Des. 2012, 39, 925–944. [Google Scholar] [CrossRef]
- Marraccini, E.; Debolini, M.; Moulery, M.; Abrantes, P.; Bouchier, A.; Chéry, J.P.; Sanz Sanz, E.; Sabbatini, T.; Napoleone, C. Common features and different trajectories of land cover changes insix Western Mediterranean urban regions. Appl. Geogr. 2015, 62, 347–356. [Google Scholar] [CrossRef]
- Peng, J.; Wang, Y.; Zhang, Y.; Wu, J.; Li, W.; Li, Y. Evaluating the effectiveness of landscape metrics in quantifying spatial patterns. Ecol. Indic. 2010, 10, 217–223. [Google Scholar] [CrossRef]
- Weng, Q. Land use change analysis in the Zhujiang Delta of China using satellite remote sensing, GIS and stochastic modelling. J. Environ. Manag. 2002, 64, 273–284. [Google Scholar] [CrossRef] [Green Version]
- Aldwaik, S.Z.; Pontius, R.G. Intensity analysis to unify measurements of size and stationarity of land changes by interval, category, and transition. Landsc. Urban Plan. 2012, 106, 103–114. [Google Scholar] [CrossRef]
- Disperati, L.; Virdis, S.G.P. Assessment of land-use and land-cover changes from 1965 to 2014 in Tam Giang-Cau Hai Lagoon, central Vietnam. Appl. Geogr. 2015, 58, 48–64. [Google Scholar] [CrossRef]
- Verburg, P.H.; Schot, P.P.; Dijst, M.J.; Veldkamp, A. Land use change modelling: Current practice and research priorities. GeoJournal 2004, 61, 309–324. [Google Scholar] [CrossRef]
- Pontius, R.G.; Boersma, W.; Castella, J.-C.; Clarke, K.; de Nijs, T.; Dietzel, C.; Duan, Z.; Fotsing, E.; Goldstein, N.; Kok, K.; et al. Comparing the input, output, and validation maps for several models of land change. Ann. Reg. Sci. 2008, 42, 11–37. [Google Scholar] [CrossRef] [Green Version]
- Stürck, J.; Schulp, C.J.E.; Verburg, P.H. Spatio-temporal dynamics of regulating ecosystem services in Europe—The role of past and future land use change. Appl. Geogr. 2015, 63, 121–135. [Google Scholar] [CrossRef]
- Antrop, M. Landscape change and the urbanization process in Europe. Landsc. Urban Plan. 2004, 67, 9–26. [Google Scholar] [CrossRef]
- Cive, Y.Ö.; Avar, A.A. Neoliberal Governance and Accumulation by Dispossession in Karaburun Peninsula, Izmir, Turkey. In Planning, Law and Property Right: In the Face of Transitions, Proceedings of the AESOP, Venice, Italy, 9–13 July 2019; AESOP: Reading, UK, 2019; Volume 13. [Google Scholar]
- Salata, S.; Ozkavaf-Senalp, S.; Velibeyoğlu, K.; Elburz, Z. Land Suitability Analysis for Vineyard Cultivation in the Izmir Metropolitan Area. Land 2022, 11, 416. [Google Scholar] [CrossRef]
- Uzel, B.; Sözbilir, H.; Özkaymak, Ç. Neotectonic evolution of an actively growing superimposed basin in Western Anatolia: The inner bay of İzmir, Turkey. Turk. J. Earth Sci. 2012, 21, 439–471. [Google Scholar] [CrossRef]
- Uzelli, T.; Bilgiç, E.; Öztürk, B.; Baba, A.; Sözbilir, H.; Tatar, O. Effects of seismic activity on groundwater level and geothermal systems in İzmir, Western Anatolia, Turkey: The case study from October 30, 2020 Samos Earthquake. Turk. J. Earth Sci. 2021, 30, 758–778. [Google Scholar] [CrossRef]
- Nuhoğlu, A.; Erener, M.F.; Hızal, Ç.; Kıncal, C.; Erdoğan, D.Ş.; Özdağ, Ö.C.; Akgün, M.; Ercan, E.; Kalfa, E.; Köksal, D.; et al. A reconnaissance study in Izmir (Bornova Plain) affected by October 30, 2020 Samos earthquake. Int. J. Disaster Risk Reduct. 2021, 63, 102465. [Google Scholar] [CrossRef]
- Velibeyoğlu, K.; Özdemir, S.; Baba, A.; Arsan, Z.D.; Yazdani, H.; Hazar, D.; Kaplan, A.; Boyacı, M.; Kurucu, Y.; Erdoğan, N.; et al. ‘Urla-Çeşme-Karaburun’ Peninsula Sustainable Development Strategy 2014–2023; İZKA (İzmir Development Agency): Izmir, Tureky, 2014. [Google Scholar]
- Coskun Hepcan, C. Quantifying landscape pattern and connectivity in a Mediterranean coastal settlement: The case of the Urla district, Turkey. Environ. Monit. Assess. 2013, 185, 143–155. [Google Scholar] [CrossRef] [PubMed]
- Saricam, S.Y.; Erdem, U. Planning of Izmir-Karaburun Peninsula as Biosphere Reserve Area. Ekoloji 2010, 19, 42–50. [Google Scholar] [CrossRef]
- Mersin, D.; Tayfur, G.; Vaheddoost, B.; Safari, M.J.S. Historical Trends Associated with Annual Temperature and Precipitation in Aegean Turkey, Where Are We Heading? Sustainabiliy 2022, 14, 13380. [Google Scholar] [CrossRef]
- Salata, S.; Özkavaf-Şenalp, S.; Velibeyoğlu, K. Integrating Ecosystem Vulnerability in the Environmental Regulation Plan of Izmir (Turkey)—What Are the Limits and Potentialities? Urban Sci. 2022, 6, 19. [Google Scholar] [CrossRef]
- Bozkurt, E. Neotectonics of Turkey—A synthesis. Geodin. Acta 2001, 14, 3–30. [Google Scholar] [CrossRef] [Green Version]
- TURKSTAT Turkish Statistical Institute. Address Based Population Registration System. Available online: https://www.tuik.gov.tr/Home/Index (accessed on 24 September 2022).
- Calvi, W.S. Erdbebenkatalog der Turkei und Einiger Benachbarter Gebiete; MTA Enstitüsü Ankara: Ankara, Tureky, 1941. [Google Scholar]
- Ambraseys, N. Earthquakes in the Mediterranean and Middle East: A Multidisciplinary Study of Seismicity Up to 1900; Cambridge University Press: Cambridge, UK, 2009; ISBN 9781139195430. [Google Scholar]
- Başarır Baştürk, N.; Özel, N.; Altınok, Y.; Duman, T. Türkiye ve yakın çevresi için geliştirilmiş tarihsel dönem (MÖ 2000-MS 1900) deprem kataloğu. In Türkiye Sismotektonik Haritası Açıklama Kitabı; Duman, T., Ed.; Özel Yayınlar Serisi; Maden Tetkik ve Arama Genel Müdürlüğü: Ankara, Turkey, 2017; pp. 34–239. [Google Scholar]
- Onur, T.; Tapirdamaz, M.C.; Yörük, A. The Earthquake Catalogues for Turkey. Turk. J. Earth Sci. 2008, 17, 405–418. [Google Scholar]
- Tepe, Ç.; Sözbilir, H.; Eski, S.; Sümer, Ö.; Özkaymak, Ç. Updated historical earthquake catalog of İzmir region (western Anatolia) and its importance for the determination of seismogenic source. Turk. J. Earth Sci. 2021, 30, 779–805. [Google Scholar] [CrossRef]
- Congedo, L.; Sallustio, L.; Munafò, M.; Ottaviano, M.; Tonti, D.; Marchetti, M. Copernicus high-resolution layers for land cover classification in Italy. J. Maps 2016, 12, 1195–1205. [Google Scholar] [CrossRef] [Green Version]
- Gavrilidis, A.A.; Niţă, M.R.; Onose, D.A.; Badiu, D.L.; Năstase, I.I. Methodological framework for urban sprawl control through sustainable planning of urban green infrastructure. Ecol. Indic. 2017, 96, 67–78. [Google Scholar] [CrossRef]
- Inostroza, L.; Hamstead, Z.; Spyra, M.; Qhreshi, S. Beyond urban–rural dichotomies: Measuring urbanisation degrees in central European landscapes using the technomass as an explicit indicator. Ecol. Indic. 2019, 96, 466–476. [Google Scholar] [CrossRef]
- Benini, L.; Bandini, V.; Marazza, D.; Contin, A. Assessment of land use changes through an indicator-based approach: A case study from the Lamone river basin in Northern Italy. Ecol. Indic. 2010, 10, 4–14. [Google Scholar] [CrossRef]
- European Commission. Mapping Guide for a European Urban Atlas Regional Policy; European Commission: Bruxelles, Belgium, 2016. [Google Scholar]
- Muñoz-Carpena, R.; Zajac, Z.; Kuo, Y. Global sensitivity and uncertainty analyses of the water quality model VFSMOD-W. Trans. ASABE 2007, 50, 1719–1732. [Google Scholar] [CrossRef] [Green Version]
- USDA—United States Department of Agriculture. Soil Survey Manual. In USDA Handbook, 18th ed.; Government Printing Office: Washington, DC, USA, 2017. [Google Scholar]
- Panagos, P.; Borrelli, P.; Poesen, J.; Ballabio, C.; Lugato, E.; Meusburger, K.; Montanarella, L.; Alewell, C. The new assessment of soil loss by water erosion in Europe. Environ. Sci. Policy 2015, 54, 438–447. [Google Scholar] [CrossRef]
- Panagos, P.; Ballabio, C.; Lugato, E.; Jones, A. Condition of Agricultural Soil: Factsheet on Soil Erosion Agricultural Soils; Publications Office of the European Union: Luxemburg, 2017; ISBN 9789279773280. [Google Scholar]
- Seok, Y.; Seung-Rae, L.; Yun-Tae, K.; Gyu-Hyun, G. Estimation of saturated hydraulic conductivity of Korean weathered granite soils using a regression analysis. Geomech. Eng. 2015, 9, 101–113. [Google Scholar]
- Emre, O.; Duman, T.Y.; Ozalp, S.; Elmacı, H.; Olgun, S.; Saroglu, F. Acıklamalı Türkiye Diri Fay Haritası Olcek 1:250.000; Maden Tetkik ve Arama Genel Müdürlüğü: Ankara, Tureky, 2013. [Google Scholar]
- Rodarmel, C.; Shan, J. Principal component analysis for hyperspectral image classification. Surv. Land Inf. Sci. 2002, 62, 115–122. [Google Scholar]
- Setälä, H.; Bardgett, R.D.; Birkhofer, K.; Brady, M.; Byrne, L.; de Ruiter, P.C.; de Vries, F.T.; Gardi, C.; Hedlund, K.; Hemerik, L.; et al. Urban and agricultural soils: Conflicts and trade-offs in the optimization of ecosystem services. Urban Ecosyst. 2014, 17, 239–253. [Google Scholar] [CrossRef]
- Lugato, E.; Bampa, F.; Panagos, P.; Montanarella, L.; Jones, A. Potential carbon sequestration of European arable soils estimated by modelling a comprehensive set of management practices. Glob. Chang. Biol. 2014, 20, 3557–3567. [Google Scholar] [CrossRef] [Green Version]
- Miras-Avalos, J.M.; Araujo, E.S. Optimization of vineyard water management: Challenges, strategies, and perspectives. Water 2021, 13, 746. [Google Scholar] [CrossRef]
- Prăvălie, R.; Patriche, C.; Bandoc, G. Quantification of land degradation sensitivity areas in Southern and Central Southeastern Europe. New results based on improving DISMED methodology with new climate data. Catena 2017, 158, 309–320. [Google Scholar] [CrossRef]
- Mosammam, H.M.; Nia, J.T.; Khani, H.; Teymouri, A.; Kazemi, M. Monitoring land use change and measuring urban sprawl based on its spatial forms: The case of Qom city. Egypt. J. Remote Sens. Space Sci. 2016, 20, 103–116. [Google Scholar] [CrossRef] [Green Version]
- Artmann, M. Urban gray vs. urban green vs. soil protection—Development of a systemic solution to soil sealing management on the example of Germany. Environ. Impact Assess. Rev. 2016, 59, 27–42. [Google Scholar] [CrossRef]
- Geneletti, D. Assessing the impact of alternative land-use zoning policies on future ecosystem services. Environ. Impact Assess. Rev. 2013, 40, 25–35. [Google Scholar] [CrossRef]
- Yu, M.; Yang, Y.; Chen, F.; Zhu, F.; Qu, J.; Zhang, S. Response of agricultural multifunctionality to farmland loss under rapidly urbanizing processes in Yangtze River Delta, China. Sci. Total Environ. 2019, 666, 1–11. [Google Scholar] [CrossRef] [PubMed]
- Dupras, J.; Marull, J.; Parcerisas, L.; Coll, F.; Gonzalez, A.; Girard, M.; Tello, E. The impacts of urban sprawl on ecological connectivity in the Montreal Metropolitan Region. Environ. Sci. Policy 2016, 58, 61–73. [Google Scholar] [CrossRef] [Green Version]
- Quinlan, A.E.; Berbés-Blázquez, M.; Haider, L.J.; Peterson, G.D. Measuring and assessing resilience: Broadening understanding through multiple disciplinary perspectives. J. Appl. Ecol. 2016, 53, 677–687. [Google Scholar] [CrossRef] [Green Version]
- Albert, C.; Galler, C.; Hermes, J.; Neuendorf, F.; Von Haaren, C.; Lovett, A. Applying ecosystem services indicators in landscape planning and management: The ES-in-Planning framework. Ecol. Indic. 2016, 61, 100–113. [Google Scholar] [CrossRef]
- Akbaş, B.; Akdeniz, N.; Aksay, A.; Altun, İ.E.; Balcı, V.; Bilginer, E.; Bilgiç, T.; Duru, M.; Ercan, T.; Gedik, İ.; et al. 1: 1.250.000 Scaled Geological Map of Turkey; Directorate of Mineral Research and Exploration Publication: Ankara, Turkey, 2011. [Google Scholar]
- Zhang, Y.; Shi, J.; Sun, P.; Yang, W.; Yao, X.; Zhang, C.Z.; Xiong, T. Surface ruptures induced by the Wenchuan earthquake: Their influence widths and safety distances for construction sites. Eng. Geol. 2013, 166, 245–254. [Google Scholar] [CrossRef]
- He, X.; Xu, C.; Xu, X.; Yang, Y. Advances on the avoidance zone and buffer zone of active faults. Nat. Hazards Res. 2022, 2, 62–74. [Google Scholar] [CrossRef]
- Erdik, M.; Ansal, A.; Aydınoglu, N.; Barka, A.; Işıkara, A.M.; Yüzügüllü, O.; Avci, J.; Ozel, O.; Biro, Y.; Birgoren, G. RADIUS, Izmir Earthquake Scenario and Master Plan; Izmir Metropolis Municipality: Izmir, Turkey, 1999. [Google Scholar]
- Xiao, R.; Su, S.; Zhang, Z.; Qi, J.; Jiang, D.; Wu, J. Dynamics of soil sealing and soil landscape patterns under rapid urbanization. CATENA 2013, 109, 1–12. [Google Scholar] [CrossRef]
- Salvati, L.; Munafo, M.; Morelli, V.G.; Sabbi, A. Low-density settlements and land use changes in a Mediterranean urban region. Landsc. Urban Plan. 2012, 105, 43–52. [Google Scholar] [CrossRef]
- Schneider, A.; Woodcock, C.E. Compact, Dispersed, Fragmented, Extensive? A Comparison of Urban Growth in Twenty-five Global Cities using Remotely Sensed Data, Pattern Metrics and Census Information. Urban Stud. 2008, 45, 659–692. [Google Scholar] [CrossRef]
- Ali, R.; Kuriqi, A.; Kisi, O. Human-environment natural disasters interconnection in China: A review. Climate 2020, 8, 48. [Google Scholar] [CrossRef] [Green Version]
- Weichselgartner, J.; Kelman, I. Geographies of resilience: Challenges and opportunities of a descriptive concept. Prog. Hum. Geogr. 2015, 39, 249–267. [Google Scholar] [CrossRef] [Green Version]
- Mitchell, J.K. Megacities and natural disasters: A comparative analysis. GeoJournal 1999, 49, 137–142. [Google Scholar] [CrossRef]
- Wübbelmann, T.; Bouwer, L.; Förster, K.; Bender, S.; Burkhard, B. Urban ecosystems and heavy rainfall—A Flood Regulating Ecosystem Service modelling approach for extreme events on the local scale. One Ecosyst. 2022, 7, e87458. [Google Scholar] [CrossRef]
- Malgwi, M.B.; Schlögl, M.; Keiler, M. Expert-based versus data-driven flood damage models: A comparative evaluation for data-scarce regions. Int. J. Disaster Risk Reduct. 2021, 57, 102148. [Google Scholar] [CrossRef]
- Krueger, E.H.; McPhearson, T.; Levin, S.A. Integrated assessment of urban water supply security and resilience: Towards a streamlined approach. Environ. Res. Lett. 2022, 17, 075006. [Google Scholar] [CrossRef]
- Schwarz, A.M.; Béné, C.; Bennett, G.; Boso, D.; Hilly, Z.; Paul, C.; Posala, R.; Sibiti, S.; Andrew, N. Vulnerability and resilience of remote rural communities to shocks and global changes: Empirical analysis from Solomon Islands. Glob. Environ. Chang. 2011, 21, 1128–1140. [Google Scholar] [CrossRef]
- European Commission. Guidelines on Best Practice to Limit, Mitigate or Compensate Soil Sealing; Publications Office of the European Union: Luxemburg, 2012; ISBN 9789279262104. [Google Scholar]
- European Commission. FUTURE BRIEF: No Net Land Take by 2050? European Environment Agency: Copenhagen, Denmark, 2016. [Google Scholar]
- Gastineau, P.; Mossay, P.; Taugourdeau, E. Ecological compensation: How much and where? Ecol. Econ. 2021, 190, 107191. [Google Scholar] [CrossRef]
- Turner, M.G. Landscape ecology: What is the state of the science? Annu. Rev. Ecol. Evol. Syst. 2005, 36, 319–344. [Google Scholar] [CrossRef]
- Arias-Arévalo, P.; Gómez-Baggethun, E.; Martín-López, B.; Pérez-Rincón, M. Widening the evaluative space for ecosystem services: A taxonomy of plural values and valuation methods. Environ. Values 2018, 27, 29–53. [Google Scholar] [CrossRef]
- Krauß, R.; Marinova, E.; De Brue, H.; Weninger, B. The rapid spread of early farming from the Aegean into the Balkans via the Sub-Mediterranean-Aegean Vegetation Zone. Quat. Int. 2018, 496, 24–41. [Google Scholar] [CrossRef]
- Philippe, B.; Eduardo, C.S.; Hervé, D.; Peter, F.; Michael, F.; Paolo, F.; Maja, K.; Alain, P.; Paolo, P.; Andre, P.; et al. Eurocode 8: Seismic Design of Buildings—Worked examples. In Proceedings of the Eurocode 8 Seismic Design of Buildings, Lisbon, Portugal, 10–11 February 2011; Publication Office of the European Union: Luxemburg, 2012. [Google Scholar]
- Gokce, O.; Tufekci, M.K.; Gurboga, S. Yüzey Faylanması Tehlikesinin Değerlendirilmesi ve Fay Sakınım Bantlarının Oluşturulması; AFAD Başkanlığı: Ankara, Turkey, 2014; pp. 636–637. [Google Scholar]
- Sözbilir, H.; Özkaymak, Ç.; Uzel, B.; Sümer, Ö. Criteria for surface rupture microzonation of active faults for earthquake hazards in urban areas in. In Handbook of Research on Trends and Digital Advances in Engineering Geology; Ceryan, N., Ed.; IGI Global: Hershey, PA, USA, 2017; p. 756. [Google Scholar]
- King, A.B.; Kerr, J.E.; Dissen, R.J. Van Building Adjacent to Active Faults: A Risk-based Approach. In Proceedings of the PCEE 2003 7th Pacific Conference on Earthquake Engineering, Christchurch, New Zealand, 13–15 February 2003; New Zealand Earthquake Commission: Christchurch, New Zealand, 2003; pp. 1–8. [Google Scholar]
- Langridge, R.M.; Trayes, M.; Ries, W. Designing and Implementing a Fault Avoidance Zone strategy for the Alpine Fault in the West Coast region. In Proceedings of the Ninth Pacific Conference on Earthquake Engineering: Building an Earthquake-Resilient Society, Auckland, New Zealand, 14–16 April 2011; NZSEE: Auckland, New Zealand, 2011; pp. 202–210. [Google Scholar]
Figure 1.
Izmir City and Metropolitan Area—Area of Interest (Source: author’s elaboration using the official administrative boundary of the İzmir City. UTM Zone 35S, Datum WGS 84).
Figure 1.
Izmir City and Metropolitan Area—Area of Interest (Source: author’s elaboration using the official administrative boundary of the İzmir City. UTM Zone 35S, Datum WGS 84).

Figure 2.
Urban Atlas 2018 of the Izmir metropolitan area (source: author’s elaboration using Urban Atlas 2018 vector file, UTM Zone 35S, Datum WGS 84).
Figure 2.
Urban Atlas 2018 of the Izmir metropolitan area (source: author’s elaboration using Urban Atlas 2018 vector file, UTM Zone 35S, Datum WGS 84).

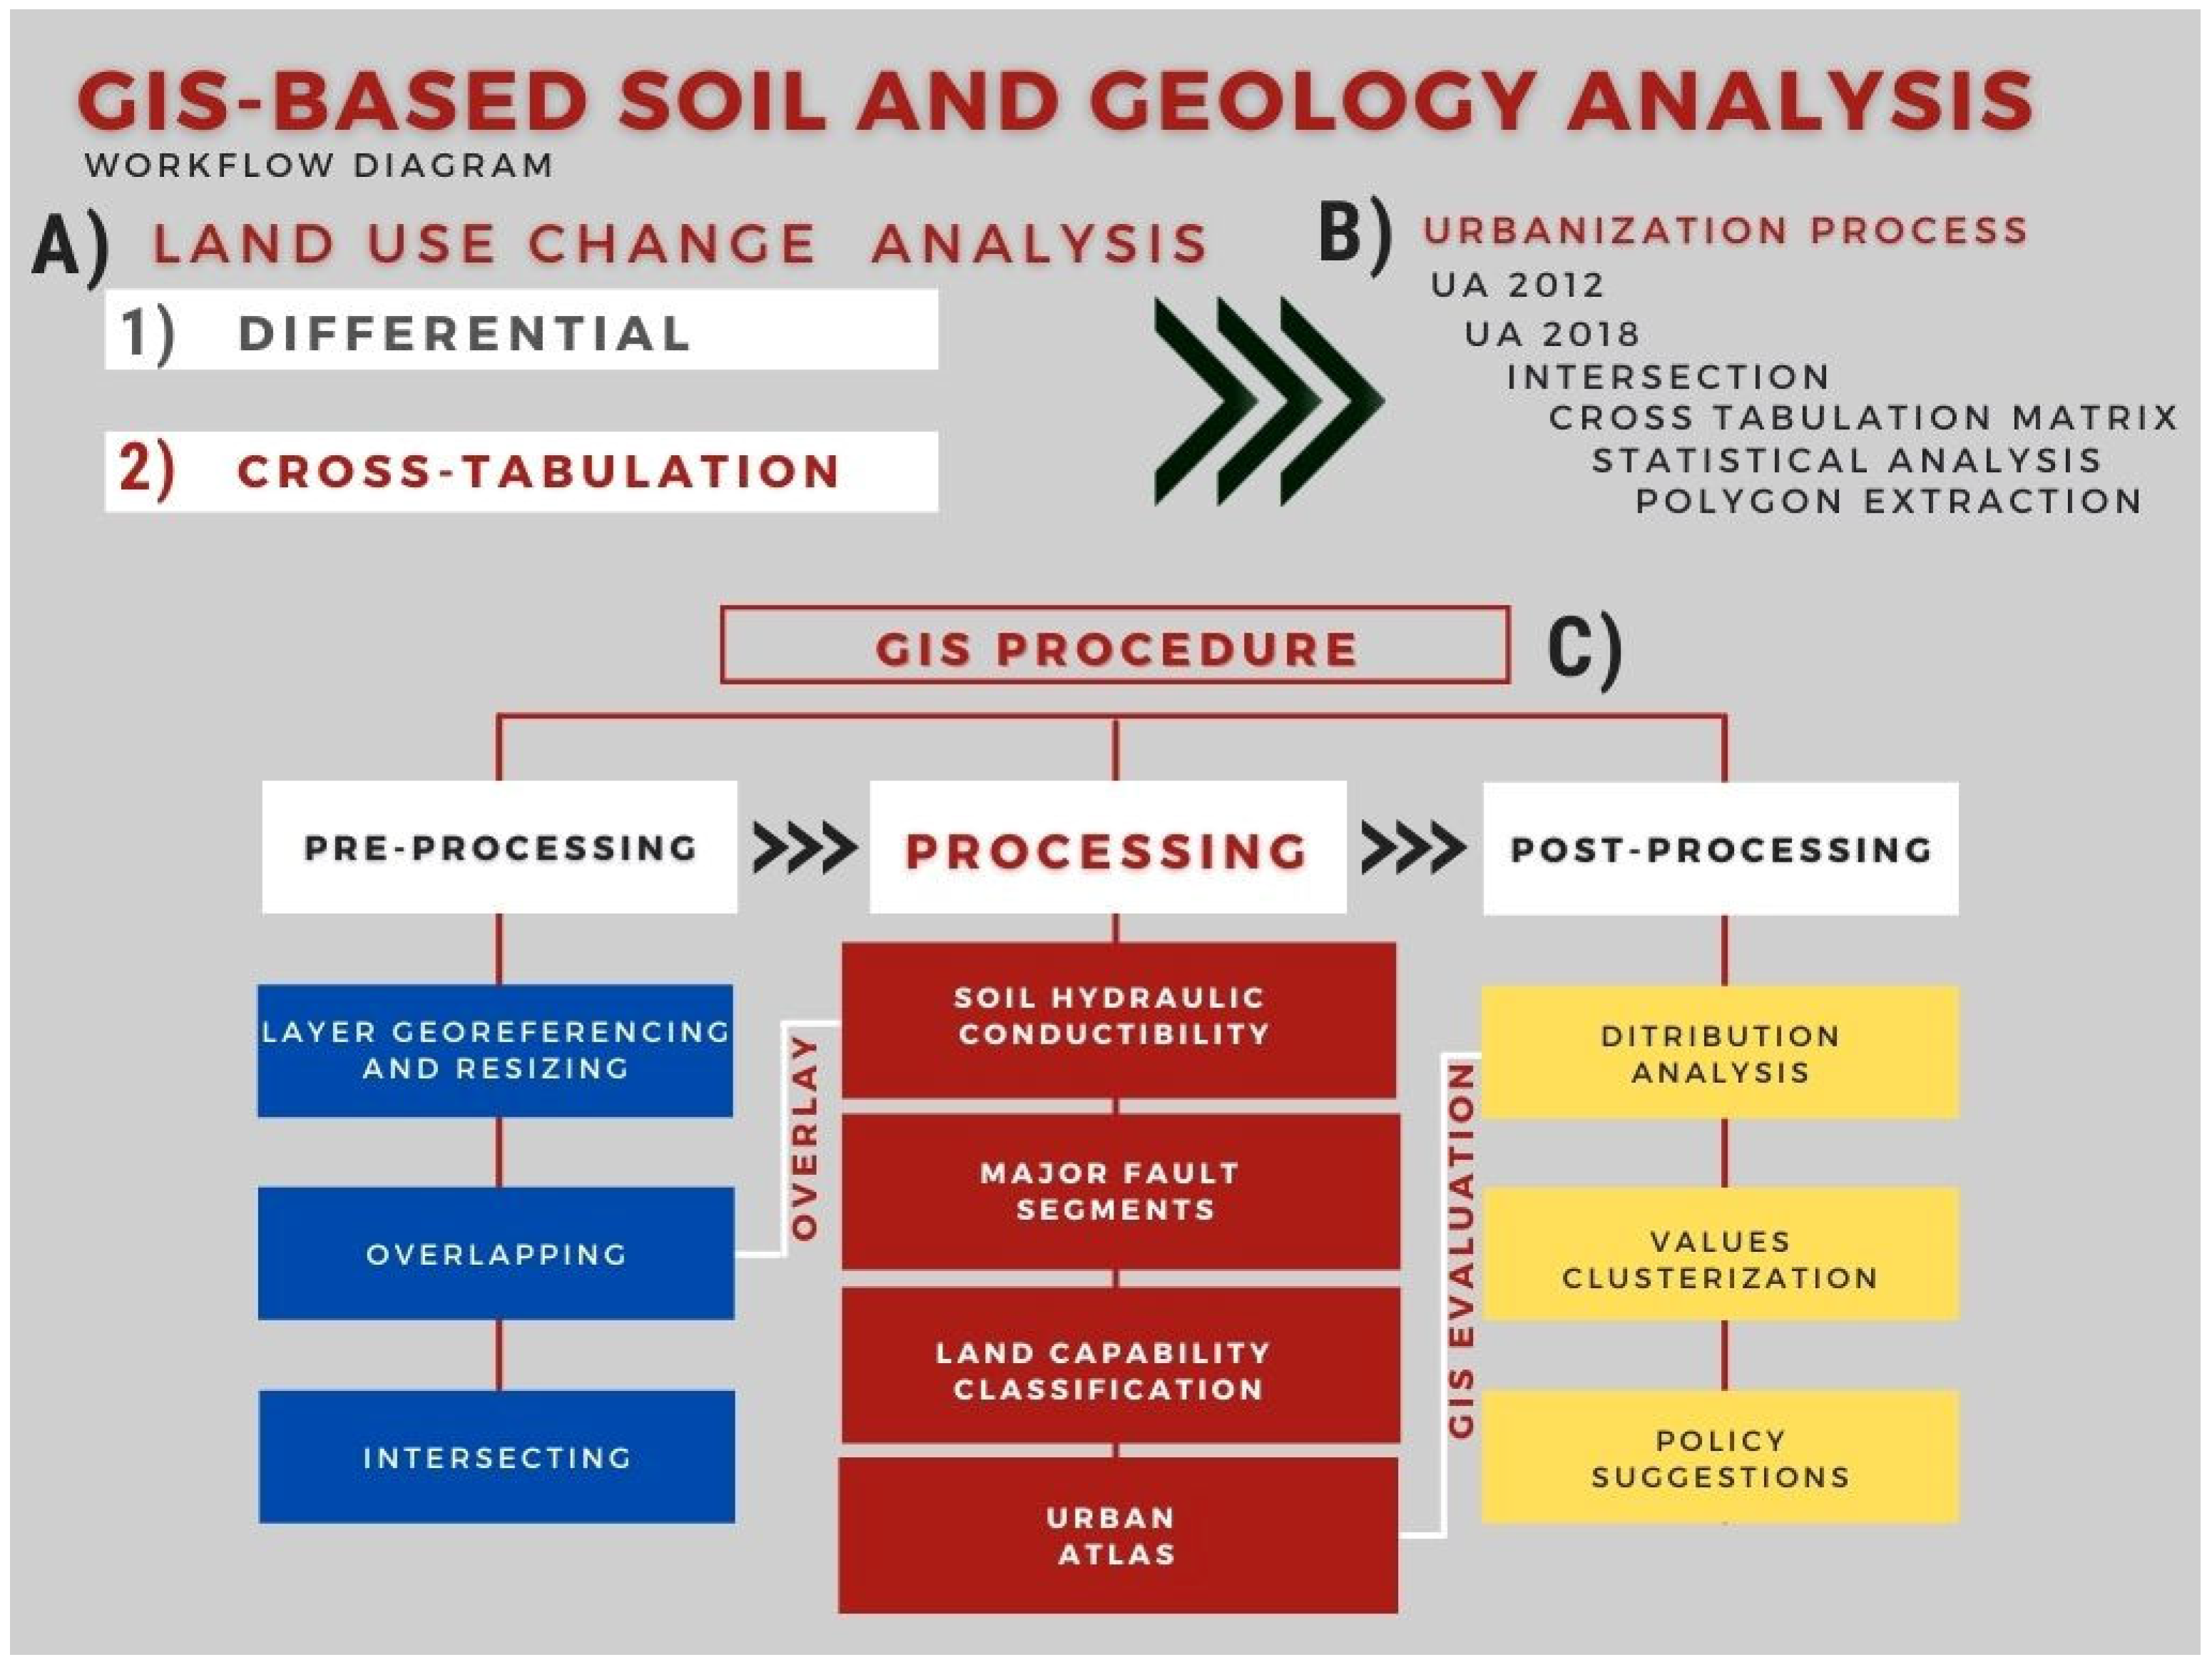
Figure 3.
Workflow scheme (source: author’s elaboration).

Figure 4.
Schematic representation of the percentage distribution of land taken by new urban areas.

Figure 5.
Land-use change pattern analysis: (a) the Gediz Delta urbanization, (b) the Kemalpasa industrial zone, and (c) the Torbali expansion (source: author’s elaboration using Urban Atlas 2018 vector file, UTM Zone 35S, Datum WGS 84).
Figure 5.
Land-use change pattern analysis: (a) the Gediz Delta urbanization, (b) the Kemalpasa industrial zone, and (c) the Torbali expansion (source: author’s elaboration using Urban Atlas 2018 vector file, UTM Zone 35S, Datum WGS 84).

Figure 6.
Distribution (%) of land taken by new urban areas by land capability classification.

Figure 7.
Geological map and urbanization changes in the metropolitan area of İzmir city between 2012 and 2018 (source: author’s elaboration modified and digitized from [53,89] and personal data. UTM Zone 35S, Datum WGS 84).

Figure 8.
Major fault segments around İzmir. Source: author’s elaboration modified after [76] with personal data. UTM Zone 35S, Datum WGS 84).
Figure 8.
Major fault segments around İzmir. Source: author’s elaboration modified after [76] with personal data. UTM Zone 35S, Datum WGS 84).

Figure 9.
Quaternary deposits map of the metropolitan area of İzmir with the distribution of Vs30 (average shear wave velocity in the upper 30 m) map. (source: author’s elaboration usingVs30 map obtained from [92] https://temblor.net/earthquake-insights/forensic-analysis-reveals-the-causes-of-building-damage-in-izmir-in-the-oct-30-aegean-sea-earthquake-12098/ (accessed on 20 August 2022). UTM Zone 35S, Datum WGS 84).

Figure 10.
Earthquake prevention/avoidance zone GIS application for one of the Karşıyaka-Bayraklı fault segments: (a) 20 m buffer zone, (b) intersected area with a newly urbanized area for 20 m, (c) 50 m buffer zone, and (d) intersected area with a newly urbanized area for 50 m. (source: author’s elaboration using Urban Atlas 2018 vector file, UTM Zone 35S, Datum WGS 84).


Table 1.
Urban Atlas thematic legend [70]. Reproduced under the EEA standard re-use policy: re-use of content on the EEA website for commercial or non-commercial purposes is permitted free of charge. Source: https://www.eea.europa.eu/legal/copyright (accessed on 24 September 2022). Copyright holder: Directorate-General Enterprise and Industry (DG-ENTR), Directorate-General for Regional Policy.
| Original Numeric Code | Land-Use Description |
|---|---|
| 11100 | Continuous urban fabric (S.L.: >80%) |
| 11210 | Discontinuous dense urban fabric (S.L.: 50–80%) |
| 11220 | Discontinuous medium density urban fabric (S.L.: 30–50%) |
| 11230 | Discontinuous low density urban fabric (S.L.: 10–30%) |
| 11240 | Discontinuous very low density urban fabric (S.L.: <10%) |
| 11300 | Isolated Structures |
| 12100 | Industrial, commercial, public, military and private units |
| 12210 | Fast transit roads and associated land |
| 12220 | Other roads and associated land |
| 12230 | Railways and associated land |
| 12300 | Port areas |
| 12400 | Airports |
| 13100 | Mineral extraction and dump sites |
| 13300 | Construction sites |
| 13400 | Land without current use |
| 14100 | Green urban areas |
| 14200 | Sports and leisure facilities |
| 21000 | Arable land (annual crops) |
| 22000 | Permanent crops (vineyards, fruit trees, olive groves) |
| 23000 | Pastures |
| 24000 | Complex and mixed cultivation patterns |
| 25000 | Orchards at the fringe of urban classes |
| 31000 | Forests |
| 32000 | Herbaceous vegetation associations (natural grassland, moors...) |
| 33000 | Open spaces with little or no vegetations (beaches, dunes, bare rocks, glaciers) |
| 40000 | Wetland |
| 50000 | Water bodies |
Table 2.
Soil hydraulic conductivity parameters.
| Group A | Group B | Group C | Group D | |
|---|---|---|---|---|
| Saturated hydraulic conductivity of the least transmissive (soil depth 50 and 100 cm) | >40 m/s | 40.10 m/s | 10.10 m/s | <1 m/s |
Table 3.
Hydrological soil group classification of geological units around İzmir.
| Geological Units | Hydrological Soil Groups | Infiltration Rate ** | Run-Off Potential ** |
|---|---|---|---|
| Recent Alluvium Deposits | A | High | Very Low |
| Continental Clastics | B | Moderate | Low |
| Volcano-sedimentary Units | C | Slow | Moderate |
| Volcanic Units (andesite, dacite) * | C | Slow | Moderate |
| Flysch | D | Very Slow | High |
| Carbonates (Miocene) | B | Moderate | Low |
| Carbonates (Cretaceous–Flysch Blocks) * | B | Moderate | Low |
| Carbonates (Cretaceous–Jurassic) * | C | Slow | Moderate |
* These units generally spread out as rock mass in the field as mentioned in the text. ** These values are generally associated to Hydrological Soil Groups but does not constitute a definitive categorization.
Table 4.
Major fault segments of the İzmir and the surrounding region [76].
Table 4.
Major fault segments of the İzmir and the surrounding region [76].
| Fault Name | Fault Type |
|---|---|
| Tuzla Fault | Strike-slip Fault |
| Dağkızılca Fault | Normal and Strike-slip Fault |
| Gülbahçe Fault | Strike-slip Fault |
| Gümüldür Fault | Normal Fault |
| Güzelhisar Fault | Strike-slip Fault |
| Seferihisar Fault | Strike-slip Fault |
| İzmir Fault | Normal Fault |
| Menemen Fault | Normal Fault |
| Mordoğan Fault | Normal Fault |
| Yağcılar Fault | Strike-slip Fault |
| Kemalpaşa Fault | Normal Fault |
| Yeni Foça Fault | Not Defined Clearly |
| Zeytindağ-Bergama Faults | Not Defined Clearly |
| Karşıyaka-Bornova Faults | Not Defined Clearly |
Table 5.
Land Capability Classification.
| LCC Class | Definition |
|---|---|
| I–II–III–IV | Tillage arable lands |
| V–VI–VII | Tillage land unsuitable for agriculture |
| VIII | Land unsuitable for agriculture |
Table 6.
List of employed layers.
| Layers | Source/Reference | Scales | Dates |
|---|---|---|---|
| Urban Atlas | https://land.copernicus.eu/local/urban-atlas (accessed on 15 August 2022) | 1:5000 | 2018 |
| Soil Hydraulic Conductibility | Modified from Akbaş et al., 2011 | 1:250,000 | 2011 |
| Major Fault Segments | Digitized from Emre et al., 2013 | 1:250,000 | 2013 |
| Land Capability Classification | İzmir Büyükşehir Belediyesi (Soil Unit) | 1:25,000 | 2015 |
Table 7.
Land-Use Change Impact Matrix (Hydrological soil group classification).
| Hydrological Groups | Construction Sites | Continuous | Discontinuous Dense | Discontinuous Low Density | Discontinuous Medium Density | Discontinuous Very Low Density | Fast Transit Roads | Green Urban Areas | Industrial and Commercial | Isolated Structures | Land without Current Use | Mineral Extraction and Dump Sites | Other Roads | Railways | Sports Facilities | Total |
|---|---|---|---|---|---|---|---|---|---|---|---|---|---|---|---|---|
| A | 25.07 | 289.40 | 119.11 | 41.61 | 46.69 | 105.59 | 1673.16 | 97.79 | 206.02 | 5.23 | 356.52 | 811.17 | 212.13 | 41.67 | 45.32 | 4076.47 |
| B | 5.24 | 49.33 | 21.67 | 30.93 | 18.11 | 17.64 | 159.15 | 4.35 | 14.33 | 309.71 | 194.07 | 13.70 | 18.29 | 2.64 | 859.14 | |
| C | 1.29 | 25.30 | 3.60 | 3.50 | 6.23 | 11.49 | 94.63 | 15.48 | 3.66 | 112.04 | 212.83 | 5.70 | 20.59 | 1.99 | 518.34 | |
| D | 1.82 | 25.52 | 2.93 | 7.92 | 3.73 | 8.86 | 167.92 | 24.17 | 40.80 | 296.40 | 14.89 | 10.74 | 10.65 | 616.34 | ||
| Total | 33.42 | 389.55 | 147.31 | 83.96 | 74.77 | 143.58 | 2094.85 | 117.62 | 248.18 | 5.23 | 819.07 | 1514.46 | 246.42 | 91.28 | 60.60 | 6070.29 |
Table 8.
Land-Use Change Impact Matrix (Land Capability Classification).
| I | II | III | IV | VI | VII | VIII | Urban | Tot | |
|---|---|---|---|---|---|---|---|---|---|
| 11100 | 0.94 | 1.88 | 1.86 | 4.78 | 1.64 | 0.40 | 8.20 | 19.70 | |
| 11210 | 22.38 | 24.65 | 39.51 | 32.07 | 6.82 | 17.53 | 116.31 | 259.24 | |
| 11220 | 30.75 | 27.72 | 3.14 | 4.97 | 3.18 | 5.02 | 51.30 | 126.08 | |
| 11230 | 8.62 | 16.91 | 4.68 | 6.39 | 4.99 | 12.17 | 17.59 | 71.36 | |
| 11240 | 2.00 | 26.43 | 4.24 | 12.14 | 4.15 | 6.12 | 8.70 | 63.77 | |
| 11300 | 19.63 | 21.30 | 12.09 | 9.22 | 9.82 | 11.53 | 1.31 | 84.91 | |
| 12100 | 406.73 | 374.17 | 237.10 | 131.66 | 98.09 | 76.81 | 2.99 | 227.06 | 1554.62 |
| 12210 | 26.02 | 47.55 | 1.69 | 0.47 | 8.61 | 1.90 | 0.17 | 31.21 | 117.62 |
| 12220 | 19.47 | 89.94 | 10.85 | 22.09 | 1.20 | 21.01 | 0.84 | 25.63 | 191.02 |
| 12230 | 5.23 | 5.23 | |||||||
| 13100 | 32.96 | 20.08 | 20.44 | 80.59 | 155.79 | 192.80 | 11.33 | 67.23 | 581.21 |
| 13300 | 56.03 | 178.76 | 54.29 | 342.12 | 99.00 | 181.32 | 4.95 | 146.55 | 1063.01 |
| 13400 | 10.96 | 7.28 | 7.70 | 64.09 | 0.21 | 7.96 | 68.84 | 167.04 | |
| 14100 | 1.37 | 1.37 | 8.63 | 20.10 | 0.78 | 14.55 | 31.87 | 78.68 | |
| 14200 | 1.11 | 9.47 | 1.52 | 5.84 | 8.61 | 0.38 | 1.32 | 2.50 | 30.75 |
| Totale complessivo | 638.95 | 847.51 | 407.74 | 736.53 | 402.88 | 549.50 | 21.59 | 809.52 | 4414.23 |
Disclaimer/Publisher’s Note: The statements, opinions and data contained in all publications are solely those of the individual author(s) and contributor(s) and not of MDPI and/or the editor(s). MDPI and/or the editor(s) disclaim responsibility for any injury to people or property resulting from any ideas, methods, instructions or products referred to in the content. |
© 2022 by the authors. Licensee MDPI, Basel, Switzerland. This article is an open access article distributed under the terms and conditions of the Creative Commons Attribution (CC BY) license (https://creativecommons.org/licenses/by/4.0/).
Share and Cite
MDPI and ACS Style
Salata, S.; Uzelli, T. Are Soil and Geology Characteristics Considered in Urban Planning? An Empirical Study in Izmir (Türkiye). Urban Sci. 2023, 7, 5. https://doi.org/10.3390/urbansci7010005
AMA Style
Salata S, Uzelli T. Are Soil and Geology Characteristics Considered in Urban Planning? An Empirical Study in Izmir (Türkiye). Urban Science. 2023; 7(1):5. https://doi.org/10.3390/urbansci7010005
Chicago/Turabian StyleSalata, Stefano, and Taygun Uzelli. 2023. "Are Soil and Geology Characteristics Considered in Urban Planning? An Empirical Study in Izmir (Türkiye)" Urban Science 7, no. 1: 5. https://doi.org/10.3390/urbansci7010005