Article

Sustainable Development in Algeria’s Urban Areas: Population Growth and Land Consumption

1
Biospheric Sciences Laboratory, NASA GSFC, Greenbelt, MD 20771, USA
2
Construction, Transport and Environmental Protection Laboratory (LCTPE), Abdelhamid Ibn Badis University, Mostaganem 27000, Algeria
3
Water, Biodiversity and Climate Change Laboratory, Faculty of Sciences Semlalia, Cadi Ayyad University, Marrakesh 40000, Morocco
4
School of Architecture, Planning and Design, Mohammed VI Polytechnic University, Ben Guerir 43150, Morocco
5
Department of Geography, Université Paris City, UMR (8586) PRODIG, 75006 Paris, France
6
Science Systems and Applications, Inc., Lanham, MD 20706, USA
*
Author to whom correspondence should be addressed.
Urban Sci. 2023, 7(1), 29; https://doi.org/10.3390/urbansci7010029
Submission received: 17 December 2022 / Revised: 7 February 2023 / Accepted: 20 February 2023 / Published: 23 February 2023

Abstract

:
We analyzed the urban development sustainability in five major urban areas of Algeria by the standard of the UN Sustainability Development Goal indicator SDG 11.3.1, which focuses on the ratio of land consumption rate to population growth rate. We utilized the annual global artificial impervious area (GAIA) dataset to characterize land-use and population data from the two censuses carried out by the National Office of Statistics (ONS) for 2008 and 2018. We discuss the prevailing relationship between urban land consumption rate and population growth rate at the smallest territorial and population census unit scale. We confirm that the indicator SDG 11.3.1 is nonlinear and that while, for example, the wilaya of Tlemcen as a whole appears to be on a sustainable path, twenty-one of its communes are not. We found that overall, and for most of its communes, the wilaya of Oran seems to have an urban land use commensurable to its population growth, but in the wilaya of Algiers, out of fifty-seven communes, only fourteen have a tendency towards sustainable development. However, the latter wilaya hosts the country’s capital and includes government buildings that are uninhabited but are accounted for as land consumed, and as such, the relationship between urban land consumption and population growth is biased. The wilaya of Annaba showed large discrepancies in terms of land use and population growth rates, and the evolution of these quantities is not homogenous across communes and not sustainable. In the Saharan wilaya of Ghardaia, the development is not homogeneous in all communes, with smaller communes undergoing buildup increases of more than 150% over the decade. Finally, in all communes where population growth exceeded urban land growth, there will be overcrowding, an aspect neither the SDG 11.3.1 nor the impervious surface per capita indicator captures. This result, in addition to other limitations, makes SDG 11.3.1 incomplete for the determination of the sustainable development in urban areas.

1. Introduction

Since the implementation of the Sustainable Development Goals (SDG) Initiative by the United Nations, Algeria has been actively engaged in the negotiating process and in the various consultations and initiatives at the national, regional, and international levels. Convinced by the importance of placing sustainable development at the center of national activities and the future of our planet, it naturally joined the consensus for the adoption of the SDG platform. This membership is a natural extension of Algeria’s commitment to the Millennium Development Agenda (MDA) in 2000, for which it achieved significant objectives by adopting its policies to the general guidelines of the sustainable development requirements. Through its policies, Algeria has significantly reduced poverty [1], designed and implemented an inclusive social protection system, developed a basic infrastructure and expanded its access, and generalized primary education, thus meeting the vital needs of its citizens and raising their awareness of good governance.
Armed with a three-dimensional development approach pointed towards social, economic, and environmental issues. Algeria intends to seize the collective awakening towards new aspirations for creating the appropriate conditions necessary to achieve the SDGs by 2030. To this end, as soon as it was adopted by the international community in September 2015, Algeria appropriated the 2030 initiative as its own in order to provide strong national responses commensurate with the objectives and the challenges it conveys. In 2016, it set up an Interministerial Coordination Committee (ICC) under the aegis of the Ministry of Foreign Affairs to bring together the different state’s institutions and departments, with the mission of monitoring and evaluating the implementation of the SDGs in Algeria. Despite all these efforts, there still is a need for more sustained actions and a faster pace of efficient implementation. Furthermore, legal and procedural measures for implementation should be announced and made public for assessment. However, as part of its sustainable development goals, and despite the rural exodus during the 1990s, Algeria has made important improvements for the development of sustainable cities, making them more inclusive, safe, and resilient, with improved water access and public transportation systems.
Since independence in 1962, Algeria’s urban population has undergone important changes. In 1962, the Algerian urban population was only 3,859,410 and represented about 33.21% of the total. Thirty years later, in 1992, that number jumped to 14,502,591, an increase of about 276%, and represented 53.66% of the total population. During the first period (1962–1992), the annual growth rate of the urban population was about 9.2%. During the second period (1992–2021), the urban population grew at an annual rate of 4.43% to reach 33,132,753 persons by 2021 and accounted for 74.26% of the total population [2]. It is worth noting that during these two periods, the annual growth rate of the urban population was almost double that of the total population; however, during the 1992–2021 period, the growth rate was about half that of the first 30 years of independence (1962–1992).
The post-independence population dynamic and the political conflicts of the 1990s created a line of discontinuity in the domains of land occupation, land tenure, and land-use planning, which had significant impacts on urbanization and architecture. With a strong population growth rate and a deficient national housing policy, several informal neighborhoods made of slums emerged at the peripheries of the largest cities in which employment was available. The relative control and management in urban land consumption in Algeria’s largest cities may be the outcome of important government programs aimed at managing urban space. Indeed, starting in the 1990s, Algeria launched a series of social programs aimed at reducing rural poverty and stopping rural exodus, which led to an apparent stabilization but did not slow the impact of rapid urbanization. Despite the success in reducing rural movements, urban demography has increased at an alarming rate, and urban management has become and remains a challenge [3]. The adoption of a national platform for planning and sustainable development was therefore necessary, and several operators were set up to meet the challenge of social housing and urban upgrade within a sustainable development framework. At the highest level is the national scheme (NS), approved in 2005 and valid through 2025, intended to provide guidance and vision to the national policy of land use and its future development. The sensitive lands, including the coastal areas and the fertile plains, have been monitored using specific schemes such as the development and management scheme for the coast and the national scheme to combat desertification. However, the absence of strategic top-down guidance has led to a disregard for regulations and rendered these approaches inefficient for controlling “downstream” changes, such as those that occur in cities [3]. This has led to an increase in the population around big cities with diffuse urban sprawl surrounded by informal housing. Cities in Algeria have high growth potential, particularly in terms of land availability, and the largest Algerian cities are not overpopulated, unlike those in other emerging countries, such as Cairo (Egypt). The potential to exploit the vertical dimension for urban expansion also has a real advantage if avoiding overcrowding and accompanied by a sound sustainability study that addresses the issues of schooling, transportation, green spaces, and other necessary commodities.
Urban development assessment is important for monitoring its sustainability and guiding future actions through the evaluation of the past. Several studies have evaluated urban land consumption around the world, but few have assessed sustainable urbanization. For example, Zhao et al. [4] examined the urban extension of Chinese cities through their spatiotemporal aspects, and Xiong et al. [5] assessed urban expansion in Indian megacities and carried out an evaluation using a multi-dimensional landscape indices comparison. On the other hand, Bounoua et al. 2018 [6] mapped the urban sustainability indicator (SDG 11.3.1) [7] for two decadal periods (2001–2011 and 2011–2020) for cities in the continental U.S., based on spatial projections of population and urban areas. In Algeria, only a few studies have assessed the impact of urban surface expansion, and most either targeted the legal instruments in the fields of urbanism and land-use planning, which have an important impact on space in the city and its environment, and the lack of directives based on the actual reality, or they were specific case studies that focused on deciphering the evolution processes of newly urbanized spaces and the mechanisms of their production within urban agglomerations [3,8,9].
In this work, we present a different and exhaustive analysis of the United Nation urban sustainability indicator SDG 11.3.1, which is used in several other studies and at different scales [10,11,12,13], for four major coastal urban areas located in the most fertile lands of Algeria and one urban area situated in the arid environment of northern central Algeria. This work validates the absence of directives on the reality of urban land use and territorial development that led to the irrational consumption of land areas inside and around the cities, often at the expense of fertile lands. Herein, we analyze the prevailing relationship between urban land consumption rate and population growth rate between 2008 and 2018, the years of the most recent available census data. The goal was to assess the sustainability of the recent urban development.

2. Data and Methods

The UN-defined urban sustainability development indicator (SDG 11.3.1) targets the monitoring of urban development by comparing the rate of urban land consumption to the rate of the urban population growth during the same period. We define land consumption in the same way as Indicator 11.3.1, “as the uptake of land by urbanized land uses, which often involves conversion of land from non-urban to urban functions” [14] and refer to it as built-up or impervious area. We estimate the SDG 11.3.1 indicator value using the land consumption rate (LCR) and the population growth pate (PGR) based on the UN defined methodology [7] as reported in Bounoua et al. [15]:
L C R = L n ( U r b [ t + Δ t ] / U r b [ t ] ) Δ t
P G R = L n ( P o p [ t + Δ t ] / P o p   [ t ] ) Δ t
The SDG 11.3.1 is obtained as the ratio of LCR to PGR:
S D G   11.3.1 = L n ( U r b [ t + Δ t ] / U r b [ t ] ) L n ( P o p [ t + Δ t ] / P o p [ t ] )
where Ln is the natural logarithm, Urb [t] is the built-up area during the initial year, and Urb [t + ∆t] is the built-up area in a future year. Similarly, Pop [t] is the total population in the initial year for each urban area, and Pop [t + ∆t] is the total population of the same urban area in the future year; ∆t is the time interval between the two measurements.
Given this definition, the SDG 11.3.1 indicator presents some limitations: (1) it is not defined for a constant population between the two measurements; (2) it takes the value of zero if the urban area remains constant between the two measurements; and (3) it is undefined in urban areas with a negative urban or population growth rate [15]. These singularities are not commonly found in urban areas and population data but are worth mentioning, as they make the indicator unfit to capture and understand the coupled dynamic of land consumption and population growth. It is important to note that most of the data used for this study did not lead to any of these limitations except for the decrease in the population in the commune of Oran (see Section 3.2).

2.1. Determining the Size of the Urban Area

In general, there is no internationally agreed upon definition of an “urban area”, and trying to accurately define it is a delicate task. As stated by the United Nations [16], “because of national differences in the characteristics that distinguish urban from rural areas, the distinction between the urban and the rural population is not yet amenable to a single definition that would be applicable to all countries or, for the most part, even to the countries within a region. Where there are no regional recommendations on the matter, countries must establish their own definitions in accordance with their own needs”.
During the 2008–2018 decade, several administrative adjustments occurred in Algeria’s territorial distribution, with new wilayas (provinces) created and communes (municipalities) and towns redistricted for socio-economic considerations. This administrative manipulation of the land use makes it difficult to compare the same urban area and its population over the decade based solely on its administrative outlines. To deal with changing administrative boundaries, we utilized the 2019 commune boundaries [17] within which the urban areas were quantified for both the 2008 and 2018 study periods. The urban area extent for each study year was mapped using the annual global artificial impervious area (GAIA) datasets for our two study years, i.e., 2008 and 2018. These data, freely available at http://data.ess.tsinghua.edu.cn/gaia.html (accessed on 26 April 2022) [18], were produced by Tsinghua University and partners within the Google Earth Engine processing environment, using the full archive of 30 m resolution Landsat images from 1985 to 2018, in addition to the Visible Infrared Imaging Radiometer Suite (VIIRS) nighttime light data (NTL) and the Sentinel-1 Synthetic Aperture Radar (SAR) data. The GAIA validation results revealed that the overall accuracy of the dataset is consistently higher than 89% at the global scale and that both omission and commission errors were reduced through the incorporation of the NTL and SAR data, resulting in an improved distinction between bare lands and impervious surfaces in dry or arid regions [19], a characteristic of our study areas. From them, using GIS-based zonal statistics functionality, we were able to derive impervious surface area statistics for census units characterized by the largest amount of population growth. The fine spatial characterization of the urban area extent over large conurbations is necessary for developing urban growth models and monitoring the UN SDGs.
For this study, we selected five wilayas (provinces) in total: four located in northern coastal Algeria and one located in the northern central desert (Figure 1). The coastal wilayas (Tlemcen, Oran, Algiers, and Annaba) differ only in population size (Table 1) and are, to a large extent, characterized by a modern European-style architecture. The desert wilaya (Ghardaia) is where the Mozabits (local inhabitants) established their habitat accounting for their local cultural references. Throughout history, this community maintained its identity embedded in its architectural and urban typology, climate, and social structure. It is known that “self-reliance” is an ancient tradition in this culture and has played a major role in the survival of these oases in a hostile arid Saharan environment.
It is important to note that about 90% of the Algerian population lives in the fertile coastal regions on about 12% of the country’s total land [25]. Therefore, it is crucial to assess the sustainability of urban development over these agricultural regions and provide indicators for land managers and policy makers to make informed decisions.

2.2. Determination of the Urban Area Population

The demographic data of the communes within the wilayas used in this study were obtained from the two censuses carried out in 2008 and 2018 by the National Office of Statistics (ONS) [26,27]. Population data for all communes were available from the ONS except for the 2018 data in the wilaya of Algiers, which we obtained from World Statistical Data and only for the entire wilaya [28]. For this wilaya, we computed the total change between 2008 and 2018 population counts and distributed this difference between all communes using their fractions of the 2008 population as weighting factors [29]. The result obtained shows that, for 2018, the total population of the wilaya of Algiers increased by 323,000, for a total of 3,333,890 people compared to 3,010,890 in 2008.
The evolution of the population of the five wilayas between 2008 and 2018 is shown in Figure 2. The statistics show that Oran had the highest population growth rate compared to the other wilayas during this period although it is ranked fifth in terms of population count. It is followed by the more populous wilaya of Ghardaia and the wilaya of Tlemcen with only 949,132 people in 2008. The wilaya of Algiers, which hosts the capital city of the country with the highest population of this group, recorded the lowest growth rate, and this is partially due to the unavailability of housing units and high cost of land. Indeed, Algiers is a city where real estate has galloped during the last decades and where the ratio of land price to income is about 24. Real estate in Algiers Centre is about 55% higher than in Oran, the second largest city in Algeria [30].

3. Results and Discussion

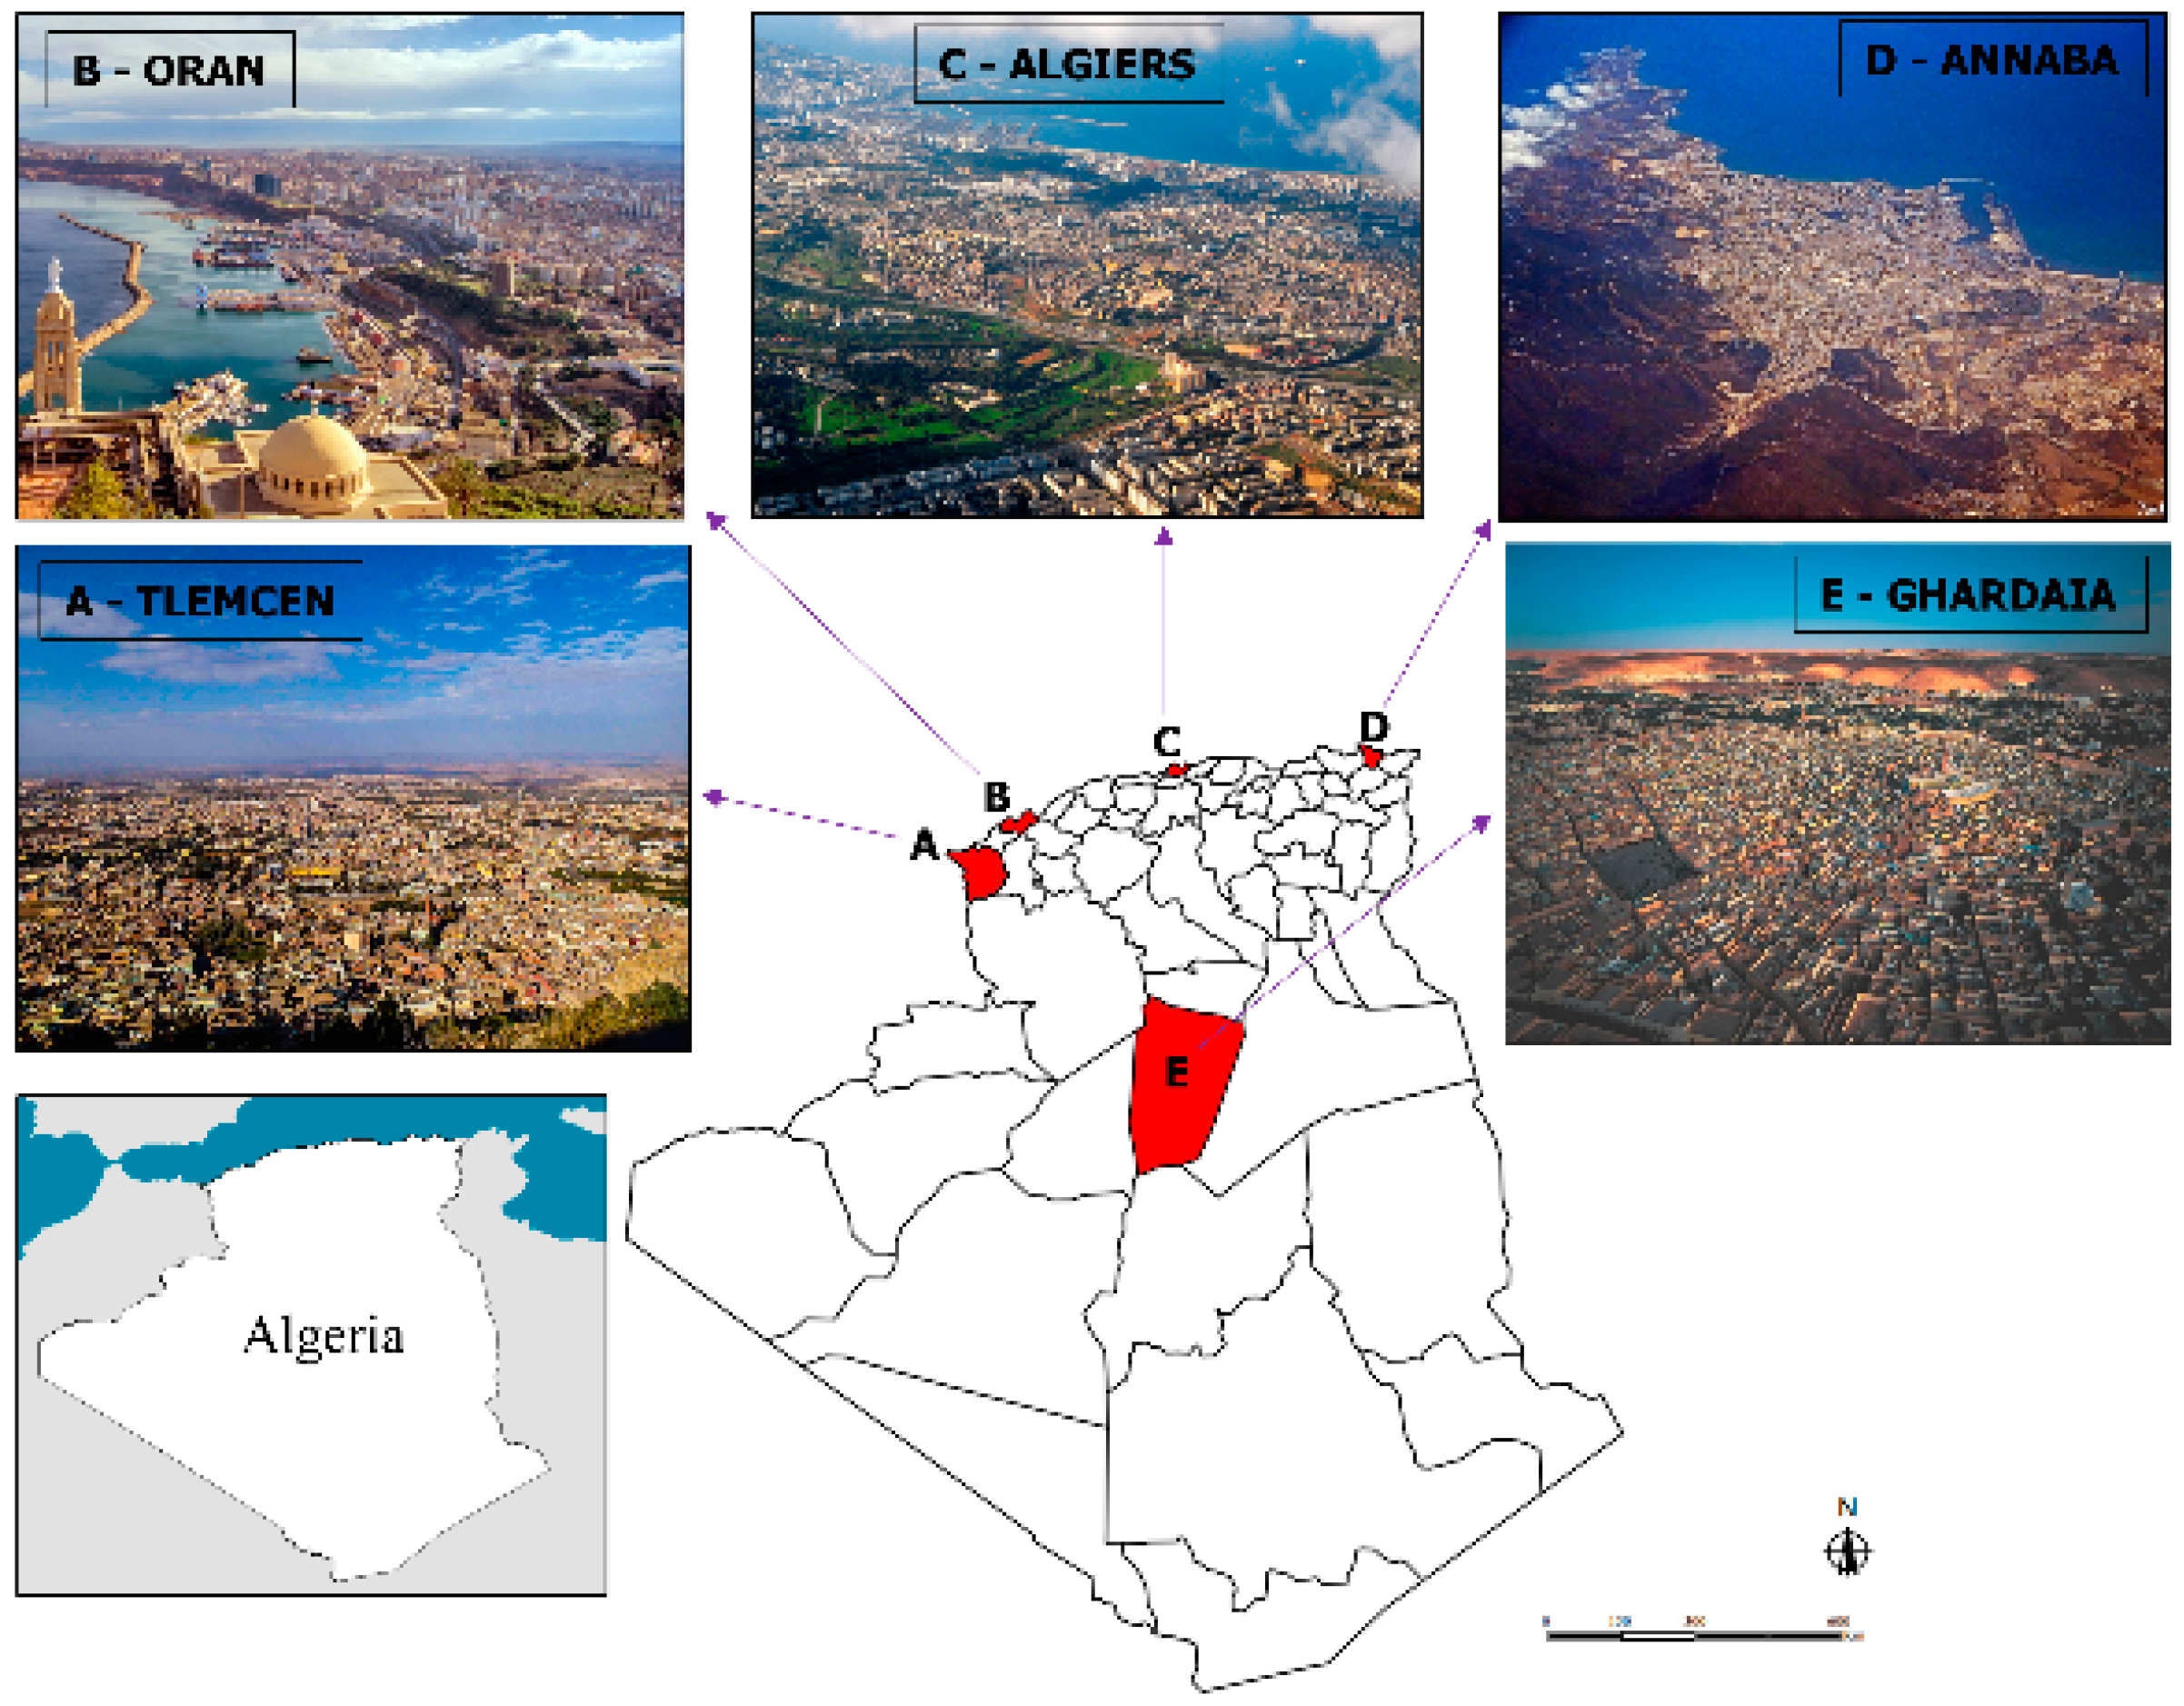
In accordance with the latest territorial organization of the country, Algeria counts 58 wilayas. The wilaya is a territorial collectivity enjoying economic and political freedom governed by an elected body, the Assemblée Populaire de Wilaya (APW), and directed by the Wali, an appointed governor. Each wilaya is divided into daïras, themselves subdivided into communes, the smallest administrative territorial and population census unit.

3.1. Wilaya of Tlemcen

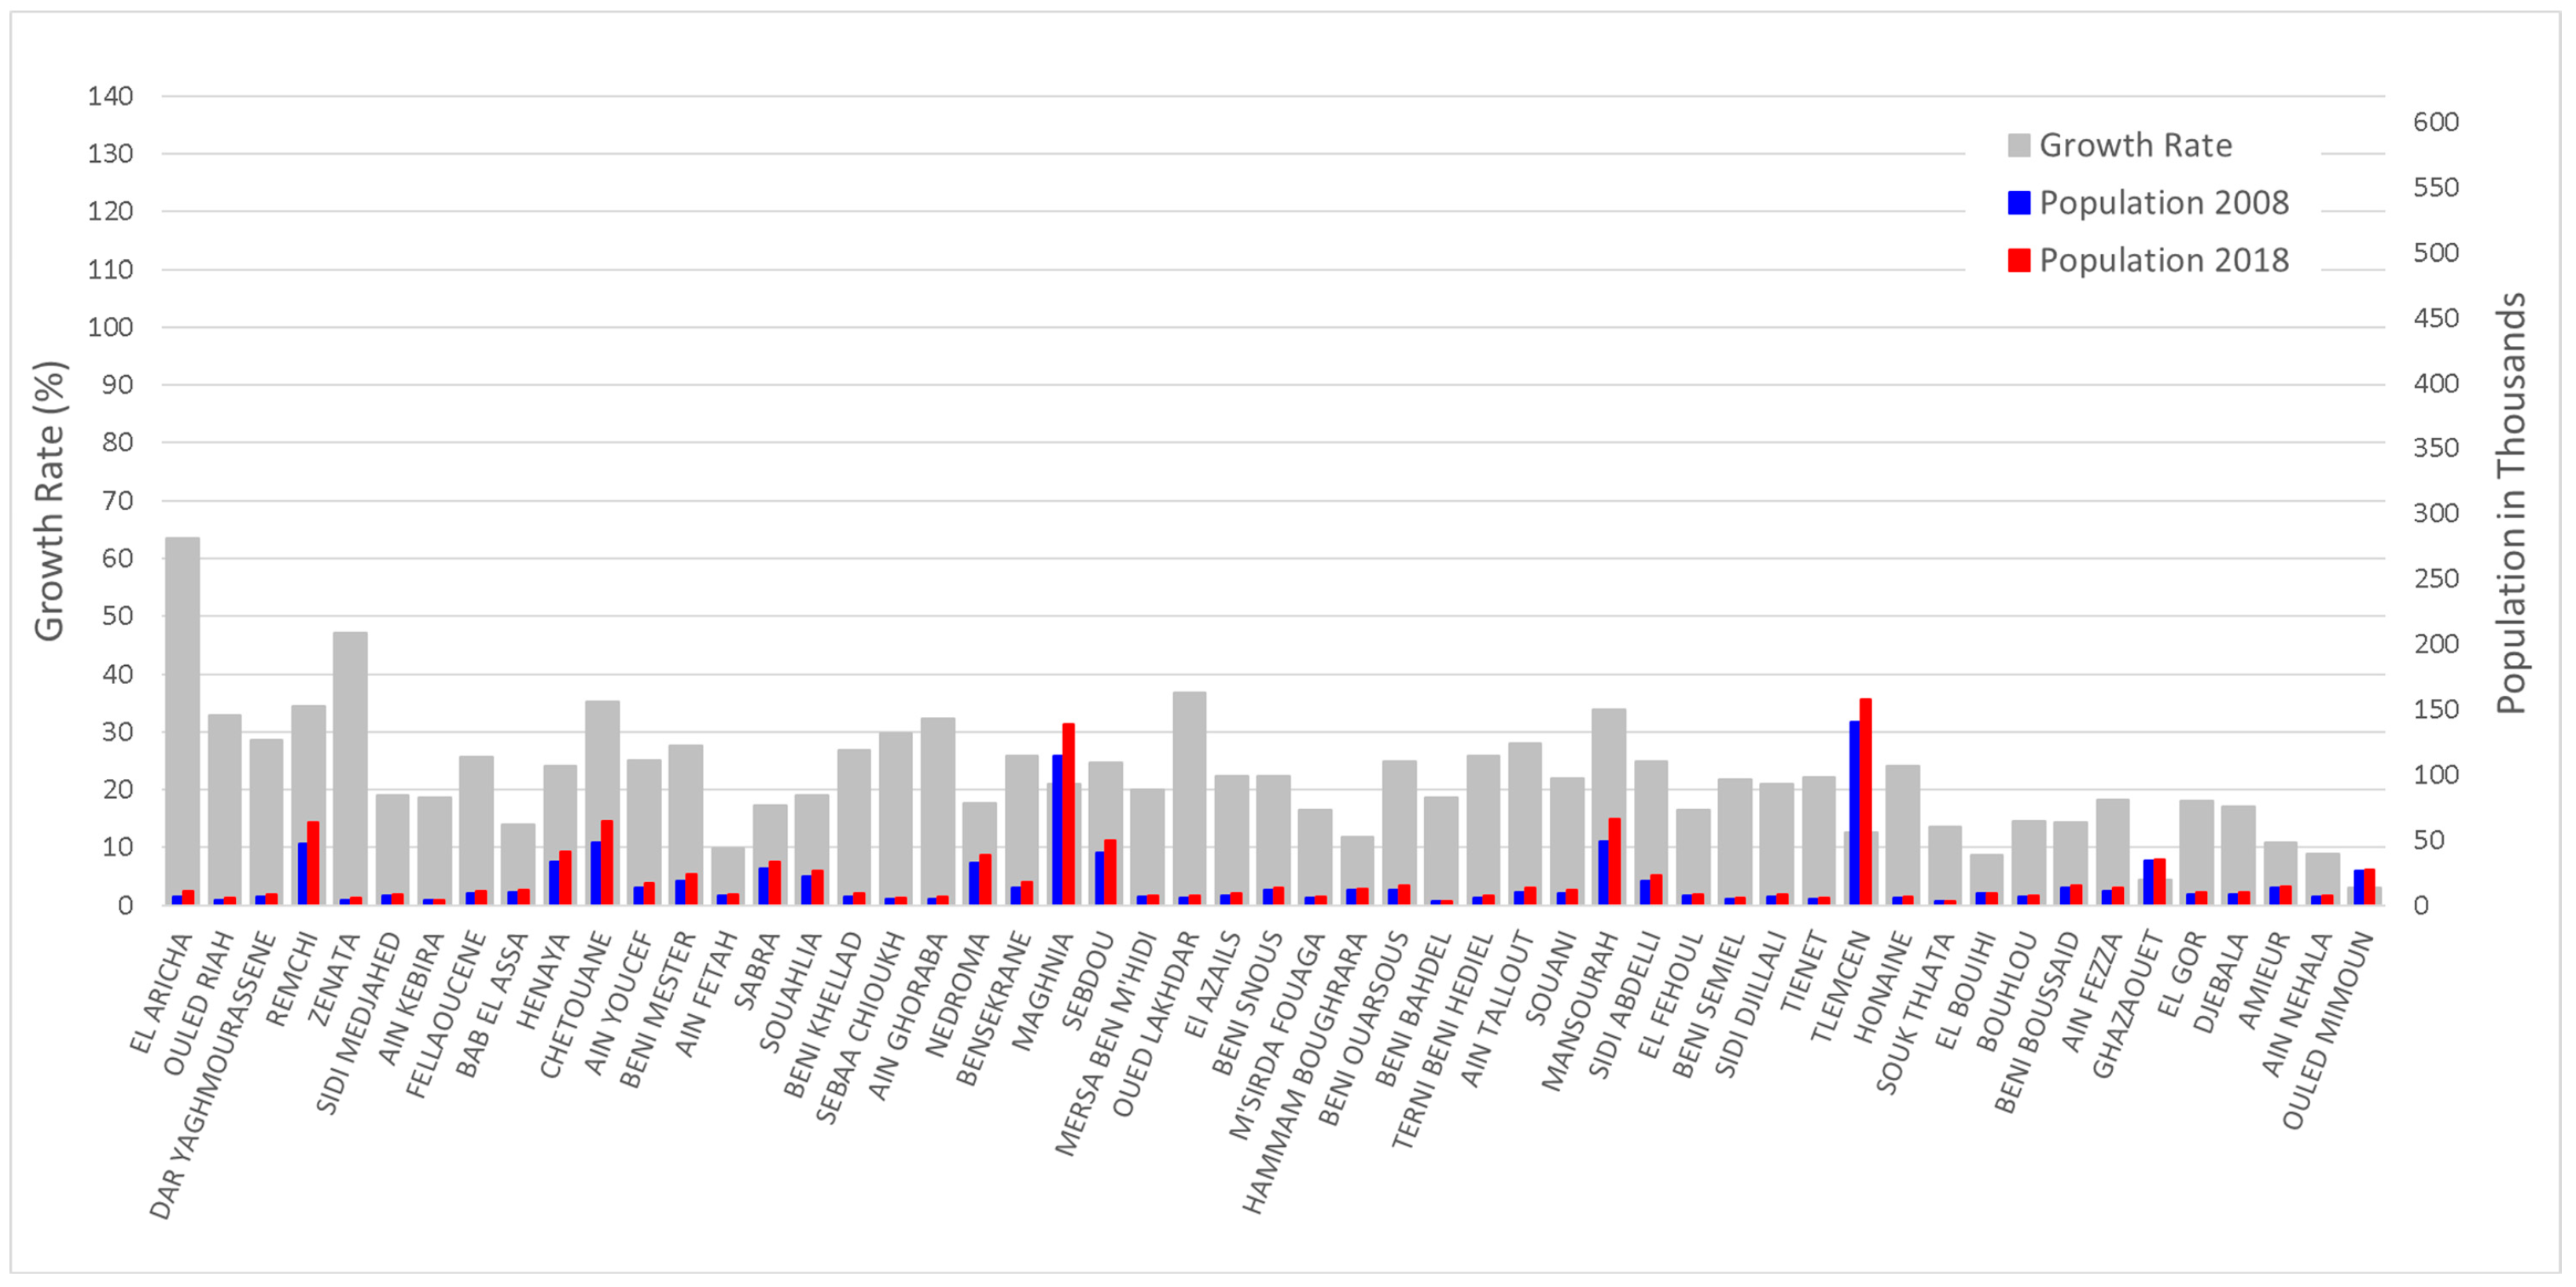
The wilaya of Tlemcen is located in the extreme northwest of Algeria, with about 120 km of coast along the Mediterranean Sea and an active population growth. The capital of the wilaya is also named Tlemcen (from here out for administrative units that have the same name, when a name is italicized, it refers to the actual commune’s name). The wilaya currently includes 53 communes, most of which are rural, with less than 40,000 inhabitants in 2018. Among the fastest-growing communes are five that passed the threshold of 60,000 inhabitants in 2018 (Figure 3). These are the communes of Remchi, Chetouane, Maghnia, Mansourah, and Tlemcen, which account for 42.62% of the total population of the wilaya. Except for Maghnia and Tlemcen, which had 138,596 and 157,751 inhabitants, respectively, the other three largest communes were less populated, with fewer than 66,000 persons. The commune of Sebdou increased by 25% during the decade under consideration and almost made it among the top five communes, with a 2018 population of 49,653 inhabitants. The two smallest communes of Souk Thlata and Beni Bahdel recorded a population of 3130 and 3223 and a growth rate of 14% and 19%, respectively.
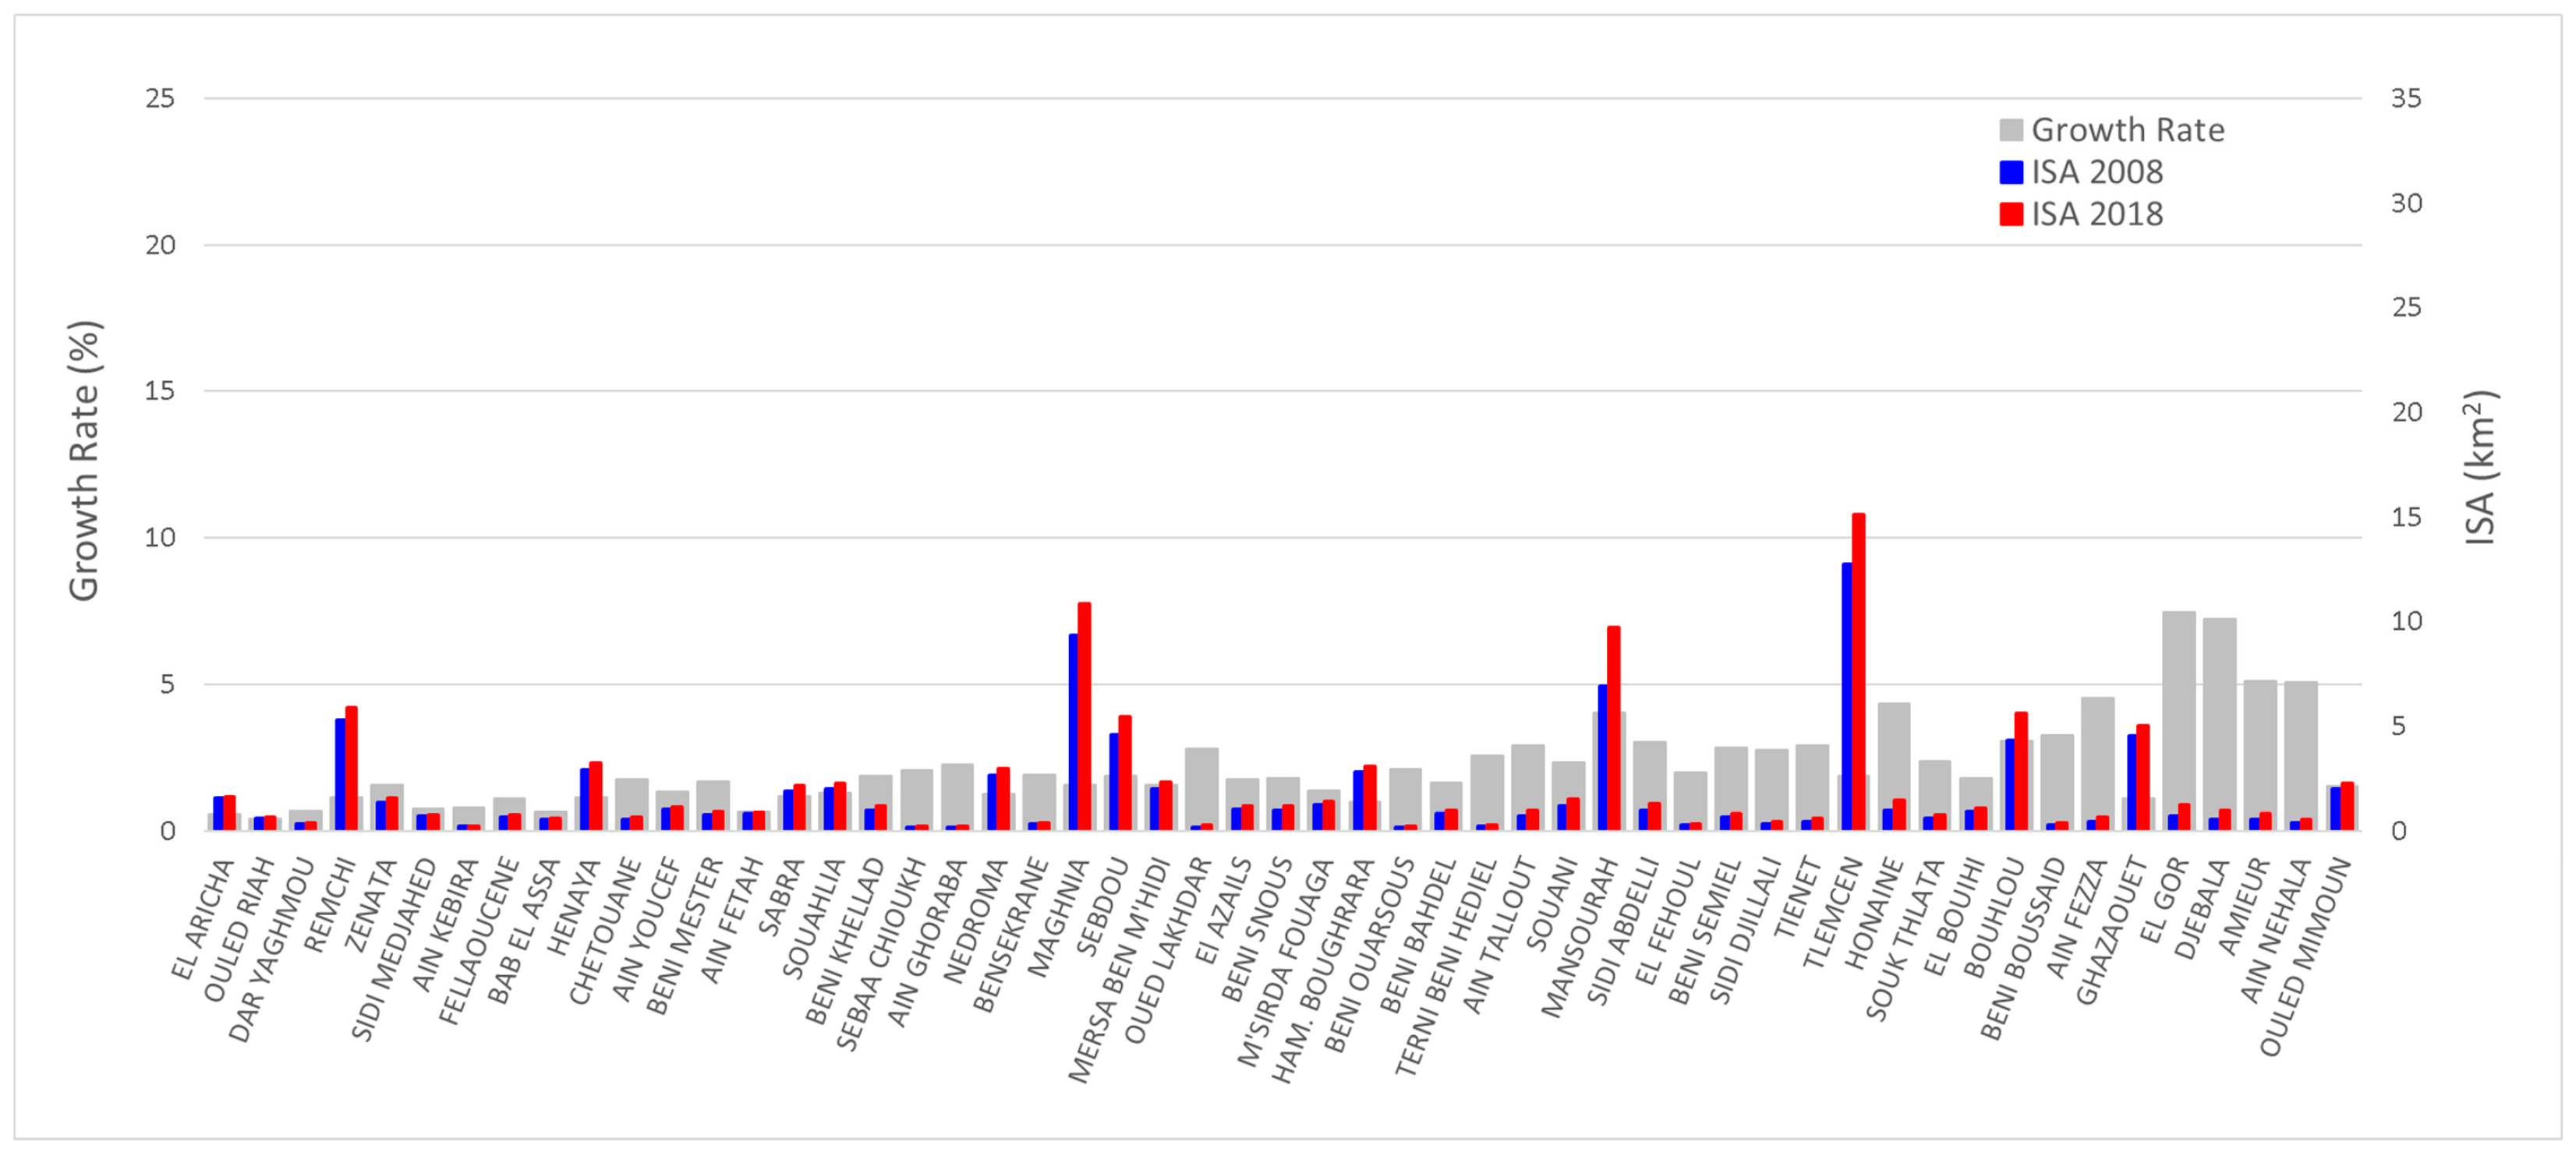
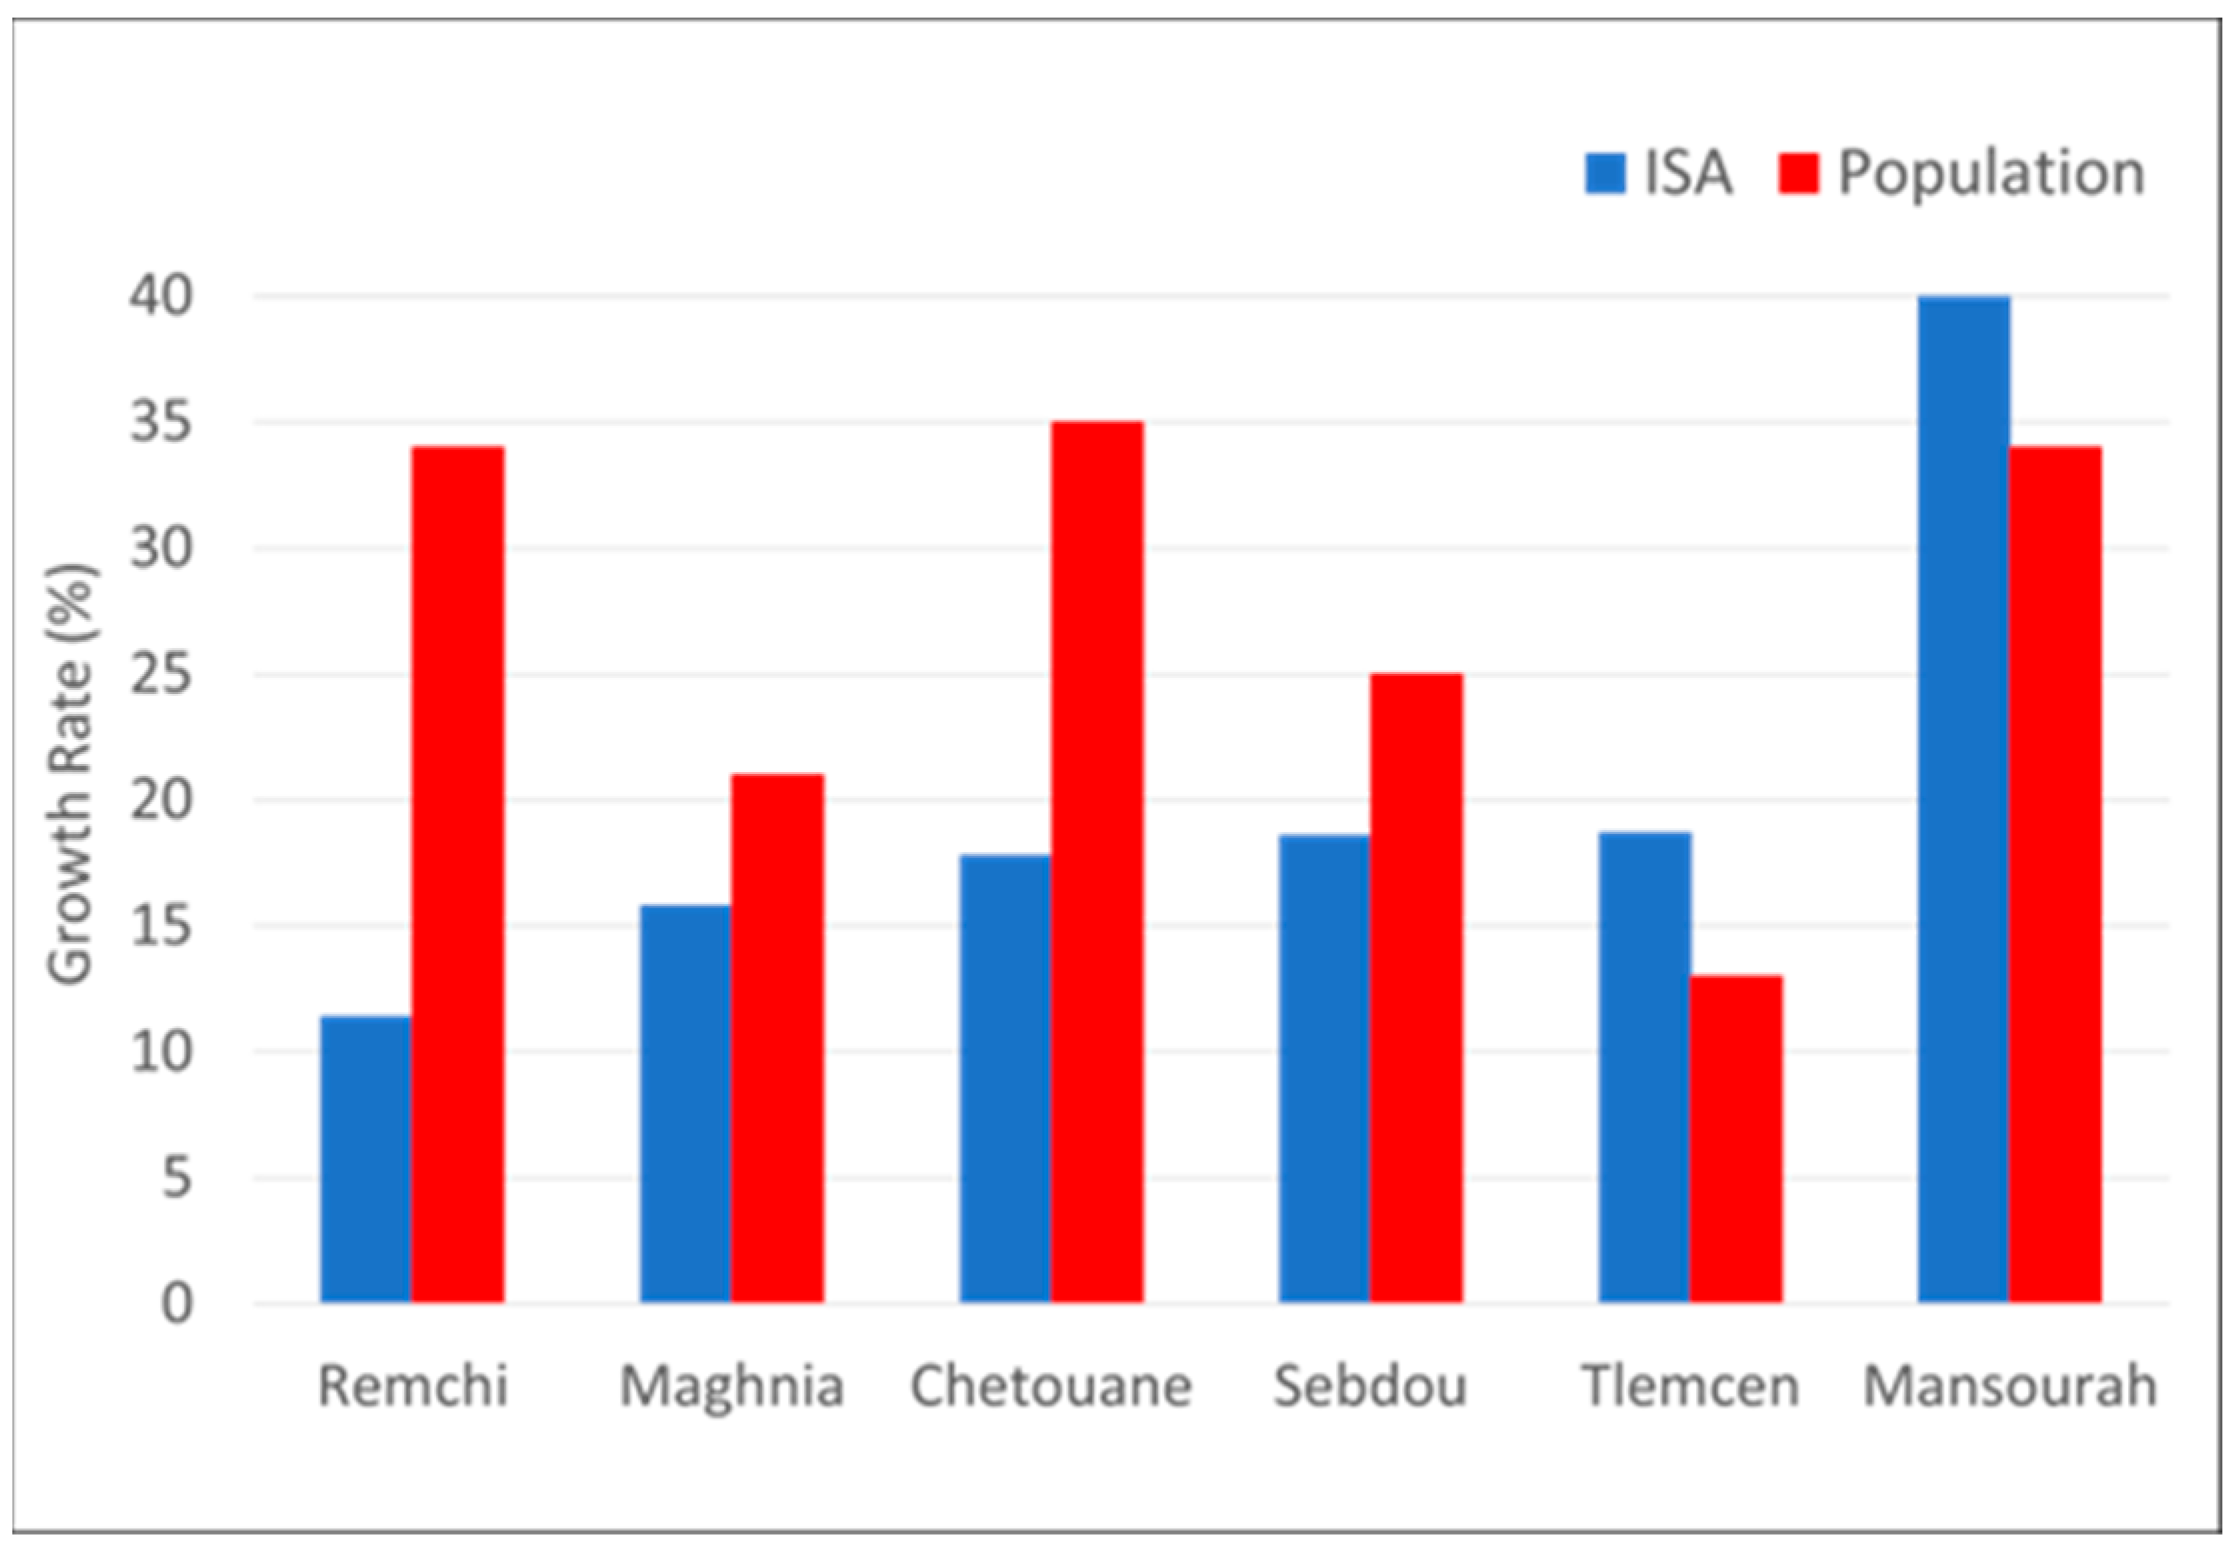
The change in built-up area as well as its growth rate for the wilaya of Tlemcen is illustrated in Figure 4. The change in urban land consumption clearly shows a non-linear relationship between population growth and ISA growth. Indeed, in terms of population, the largest cities have recorded a significant growth of between 10% and 40%. However, in the four communes of Remchi, Maghnia, Chetouane, and Sebdou, the population grew much faster than the urban land consumption, whereas in the communes of Tlemcen and Mansourah, the population grew by 13% and 34%, respectively, while the impervious surface area (ISA) grew at a rate of 18.7% and 40.4%. In terms of land use, the relationship between the population growth and the urban land consumption is at the basis of the definition of sustainability and implies that as long as the population growth is smaller than consumption of land for urban use in a given period, the urban development gears towards sustainability. Therefore, an area characterized by urban land use growing faster than its population will consume the available land and face several constraints: reduction of lands for housing, parks and recreation, schools, business, roads and parking lots, and green spaces. In sum, the ISA per capita must be reduced.
The ISA per capita represents the total urban land footprint, for urban purposes, per person. This includes land for housing, schools, business, roads, parking lots, highways, driveways, sidewalks, playgrounds, and any other artificial surfaces needed in an urban setting. While this list of urban land uses is not exhaustive, the most flexible and amenable to regulation is land for housing. Indeed, if the ratio of population to available urban land is small, the price of land decreases and leads to housing units with larger land footprints. As population grows, however, and the demand for land follows, land price will go up, and accessibility will decrease. Although other land-use types can also be regulated, the first category of urban land use that is affected is that for housing, which may negatively affect the overall sustainability. An example of this evolution is illustrated in Figure 5 for the largest communes of the Tlemcen wilaya and shows how, in the communes of Tlemcen and Mansourah, land use is increasing much faster than population growth.
The SDG 11.3.1 indicator measures the sustainability of urban development as the ratio of the rate of expansion of urban space to the rate of population growth during the same period and is computed using Equation (3). As defined, an indicator value less than 1 implies that urban land is consumed at a slower rate than population growth, and thus, the urban area is expanding in a sustainable way. To the contrary, a value greater than 1 indicates that the urban area is growing faster than the population and suggests a development away from sustainability. Finally, a value equal to 1 would theoretically indicate that the land consumption rate is commensurate to the population growth rate, and the urban area is maintaining its original sustainability level.
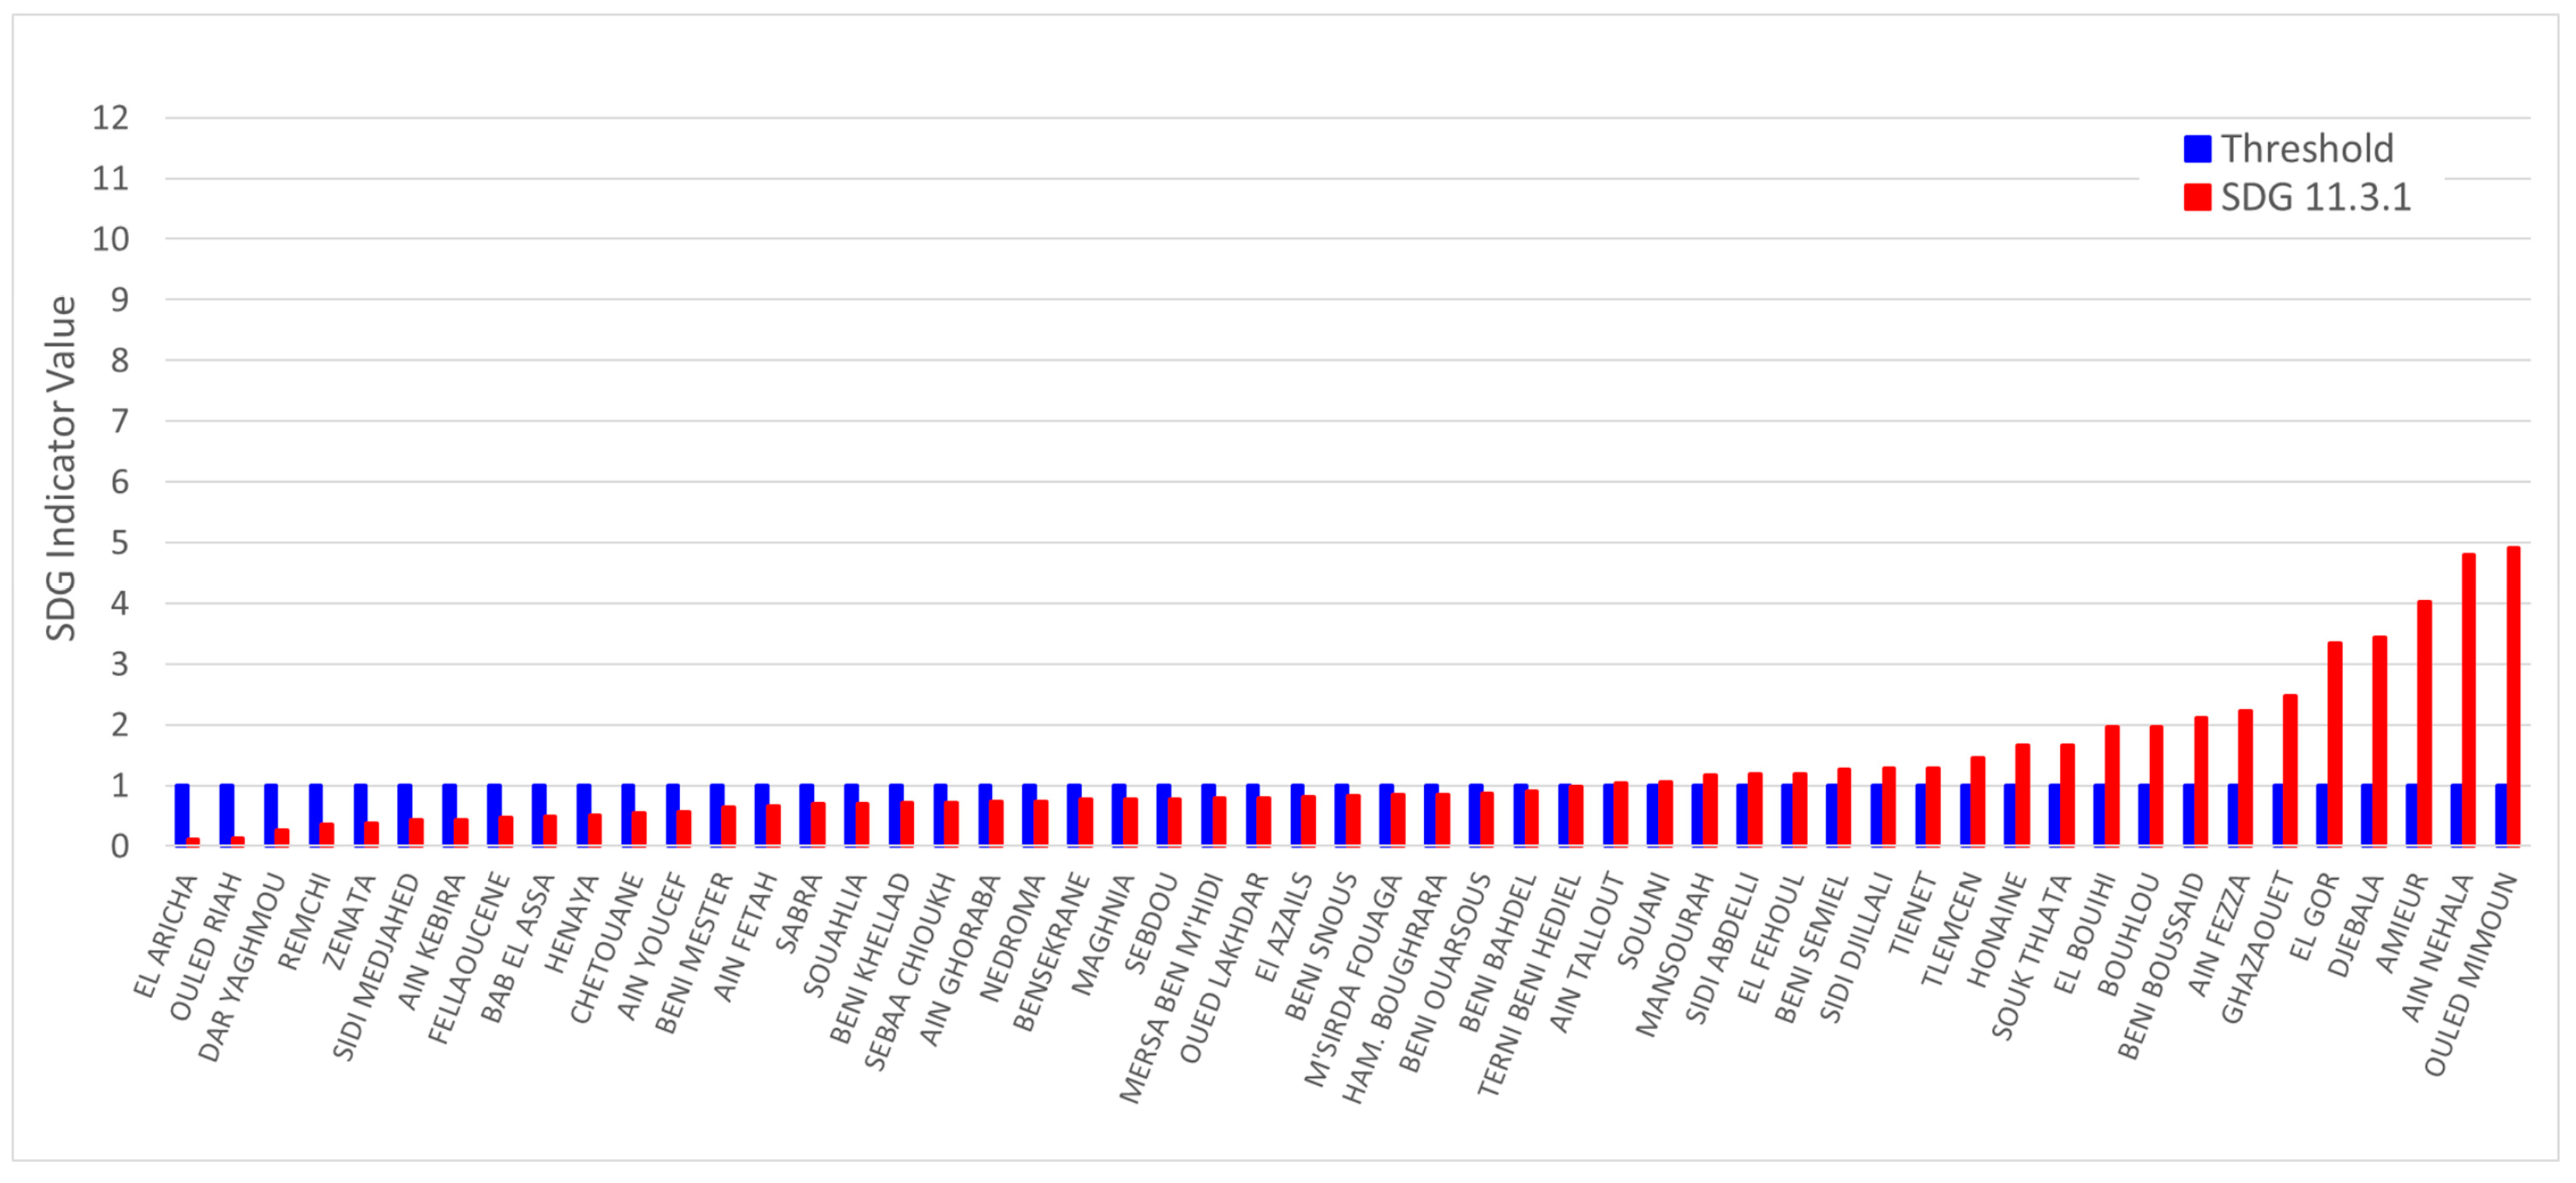
Indicator values for the communes of Tlemcen are shown in Figure 6 and are sorted for easy inter-commune comparison. Out of the total 53 communes, only 21 display an indicator greater than 1.0. We use the theoretical threshold of 1.0 to separate the development sustainability and account for an uncertainty of 0.01 in the indicator, for an error of about 0.3% of the area or population estimates [31]. Only two of the most populous communes in Figure 5 have an indicator larger than 1.0 and therefore are considered developing away from a sustainable line since their urban land consumption rate is greater than the population growth rate. These are the communes of Tlemcen, with an indicator value of 1.45, and the commune of Mansourah, with a value of 1.16, slightly over the threshold. Tlemcen is the capital of the wilaya and is rapidly expanding. It hosts administrative buildings and other government structures that make it appear to use more urban space compared to its population growth. Therefore, we argue that when estimating the SDG.11.3.1 for capital cities, one needs to account for the space allocated to government buildings as an overhead to the space consumed by the urban population. At any rate, however, the indicator trend needs to be curbed for Tlemcen to return to sustainability. The results show that the smallest unit, in terms of population growth rate, is the commune of Ouled Mimoun, with an ISA growth rate of 15.5% during the decade and an impervious surface area per capita of 391.45 (m2/person), resulting in the highest SDG indicator of 4.91, a clearly non-sustainable situation. The large majority of the communes of Tlemcen are rural in nature, with relatively small population counts, and although their urban land use is not strictly regulated, the communes are developing under sustainable conditions.
Since we detailed population and urban area at the commune level, we asked whether the sum of the indicators of several communes is equivalent to the indicator of the total area constituted by the same communes. To that end, we selected an urban zone of interest (UZI) comprised of the three conterminous communes of Chetouane, Tlemcen, and Mansourah, which are densely urbanized in the center of the wilaya, and calculated its SDG indicator as one entity. We found that the sustainability indicator value of the UZI is 1.19, whereas the sum of the individual indicators for the three communes is 3.15, with an average of 1.05, confirming the nonlinearity of this indicator. In line with this idea, we found the SDG of the entire wilaya to be 0.95, indicating that the urban development of the wilaya as a whole follows a sustainable path. It goes without saying that the SDG indicator is nonlinear, and the assessment of the sustainability of a region is best represented over the smallest territorial and census unit. While the wilaya of Tlemcen as a whole appears to be on the sustainable path, 21 of its communes are not (Figure 6).
For comparison, we utilized a state variable, the ISA per capita, defined as the impervious surface area (ISA) divided by the total population of the same area at a given time. The ISA per capita provides a precise urban land consumption per person [
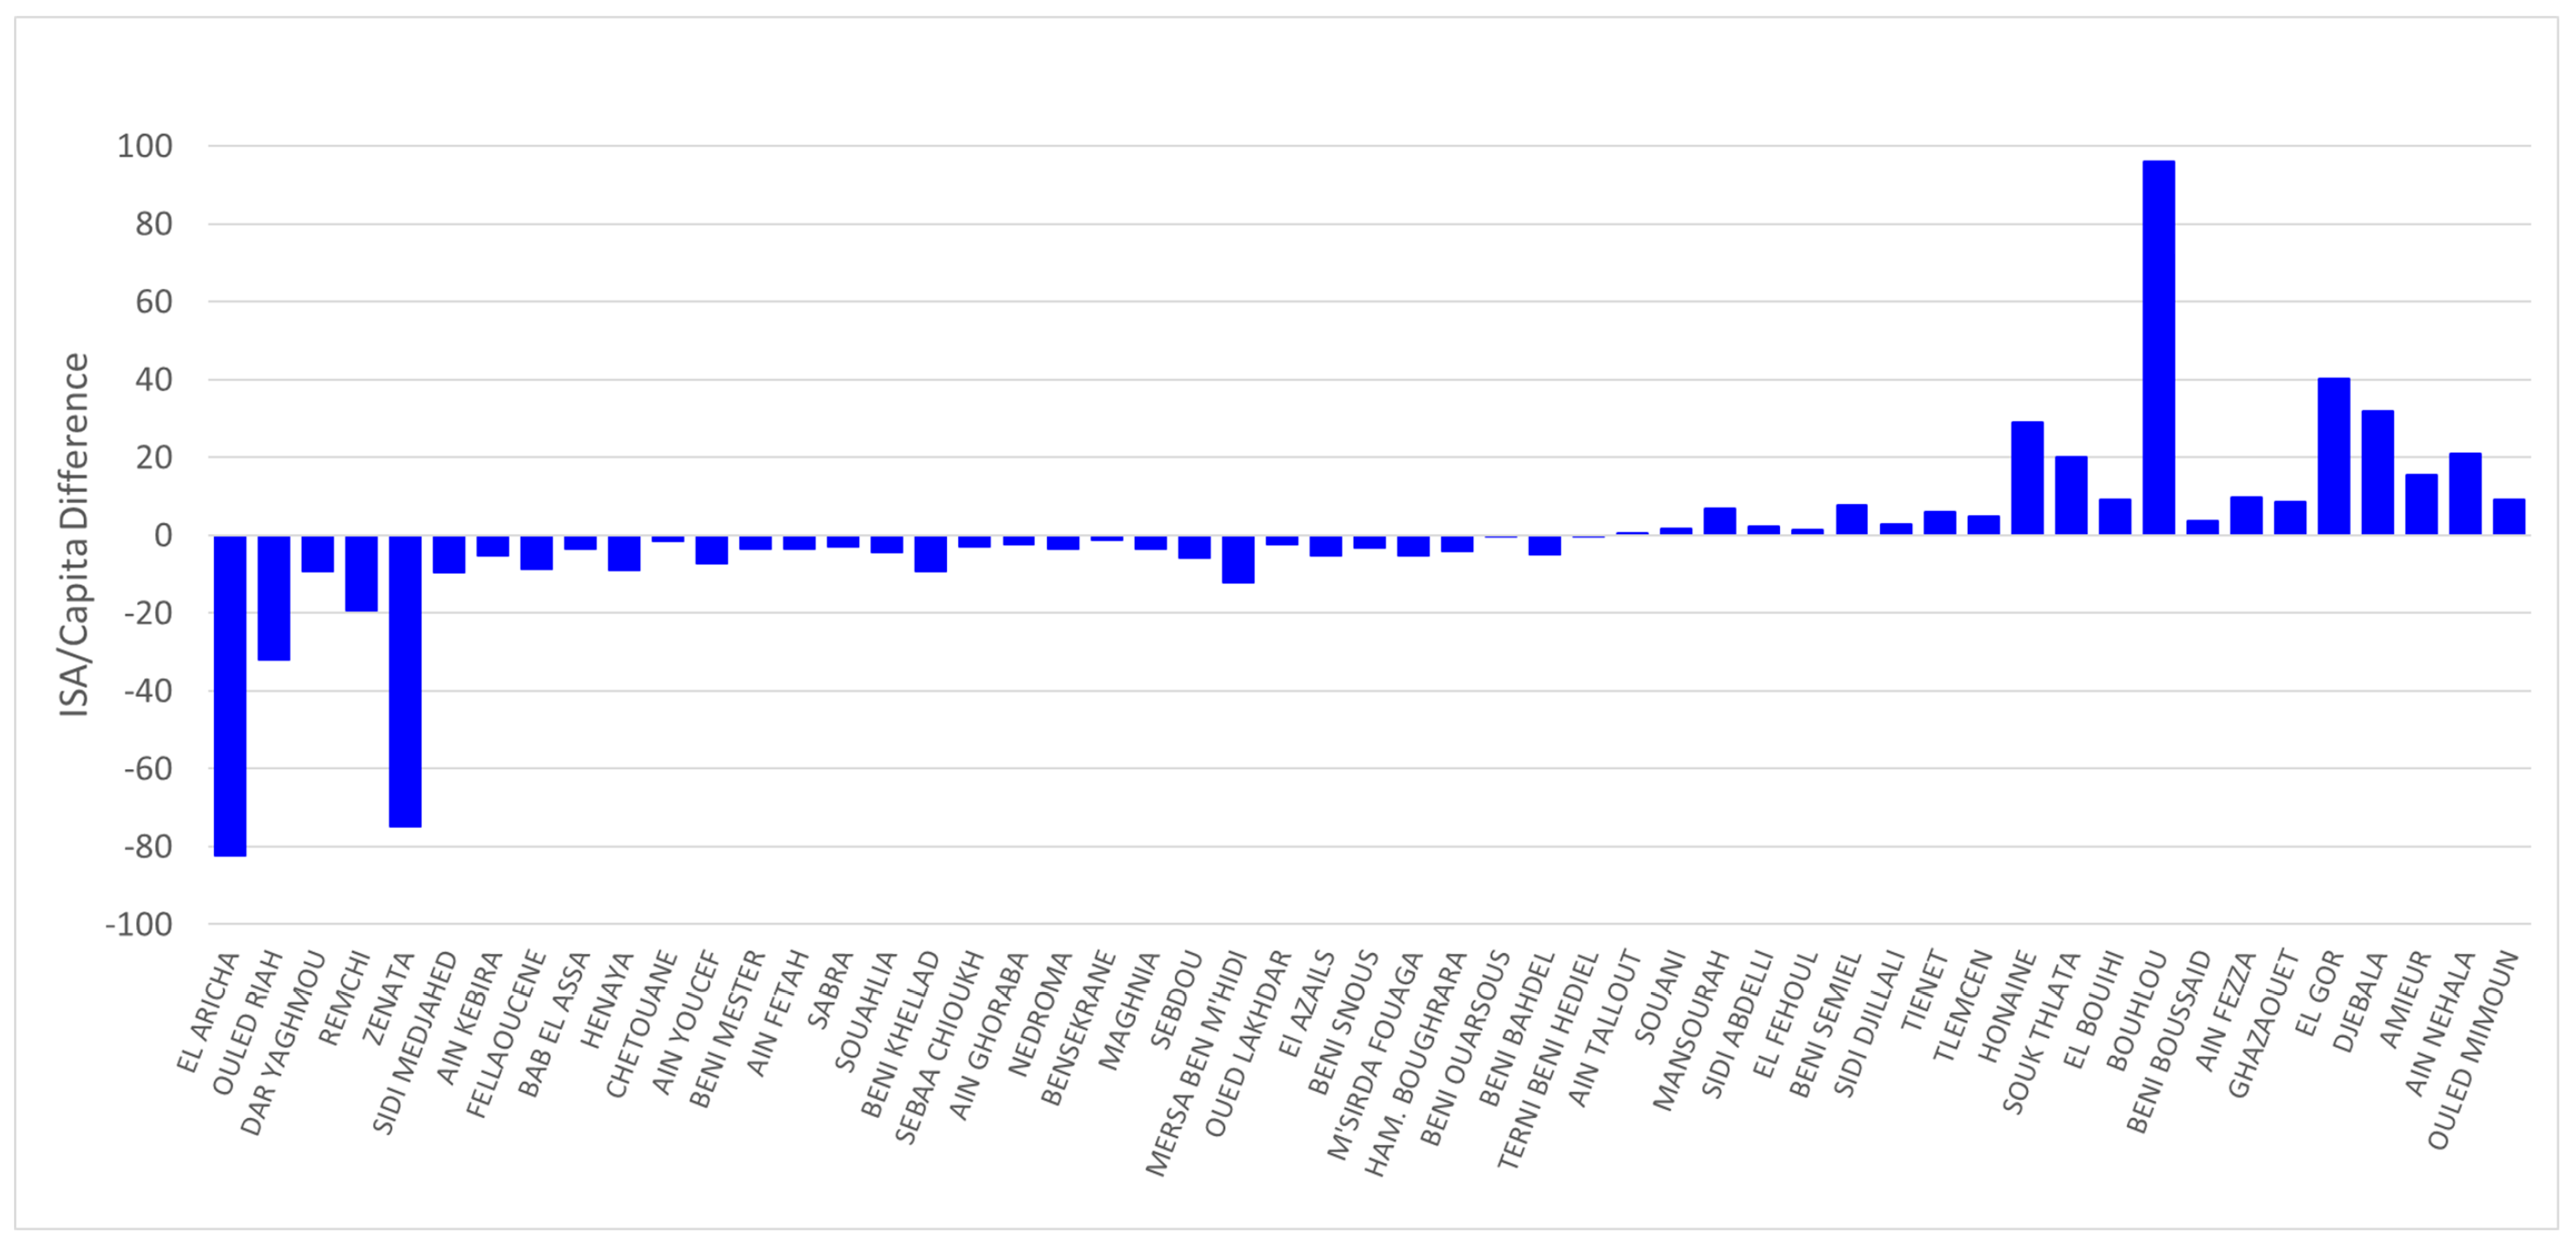
6]. The ISA per capita and its variation were then used as a metric to parallel the urban SDG indicator. Results for the wilaya of Tlemcen show that all the communes with an indicator value of less than 1 recorded a decrease in their ISA per capita (Figure 7). Among these, five communes had a large decrease in ISA per capita, namely El Aricha, Ouled Riah, Remchi, Zenata, and Marsa Ben M’hidi, ranging from 82 m2/person for Al Aricha to 12 m2/person in Marsa Ben M’hidi, while all others had a decrease of between 0 and 10 over the considered decade. Similarly, all communes with an SDG indicator value greater than 1 recorded an increase in ISA per capita. This increase is less than 15 m2/person except for the communes of Honaine, Souk Thlata, El Gor, Djebala, Ain Nehala, and the commune of Bouhlou, which has culminated with an increase of 96 m2/person over the 10-year period. It is important to note that the ISA per capita decrease between 2008 and 2018 is mainly due to an increase in the 2018 population rather than a decrease in ISA, whereas the ISA per capita increase is mainly driven by an ISA increasing faster than the corresponding population. Overall, as far as the urban development is concerned, the wilaya of Tlemcen seems to be on a sustainable track, with a constant ISA per capita of 116 m2/person for both 2008 and 2018.

3.2. The Wilaya of Oran

The wilaya of Oran is located in the north-west of Algeria; it is comprised of 26 communes including its capital, Oran. Because of its population size, commercial and industrial activities, and its cultural importance, Oran is a major coastal metropolis and the second most important in Algeria after the country’s capital, Algiers. The total population of the commune was 600,000 in 2008, while the wilaya had a total population of approximately 1,500,000, making it the second largest in Algeria. The population distribution in the wilaya of Oran is not uniform among its communes. Out of the 26 communes, only 3, namely the wilaya seat 
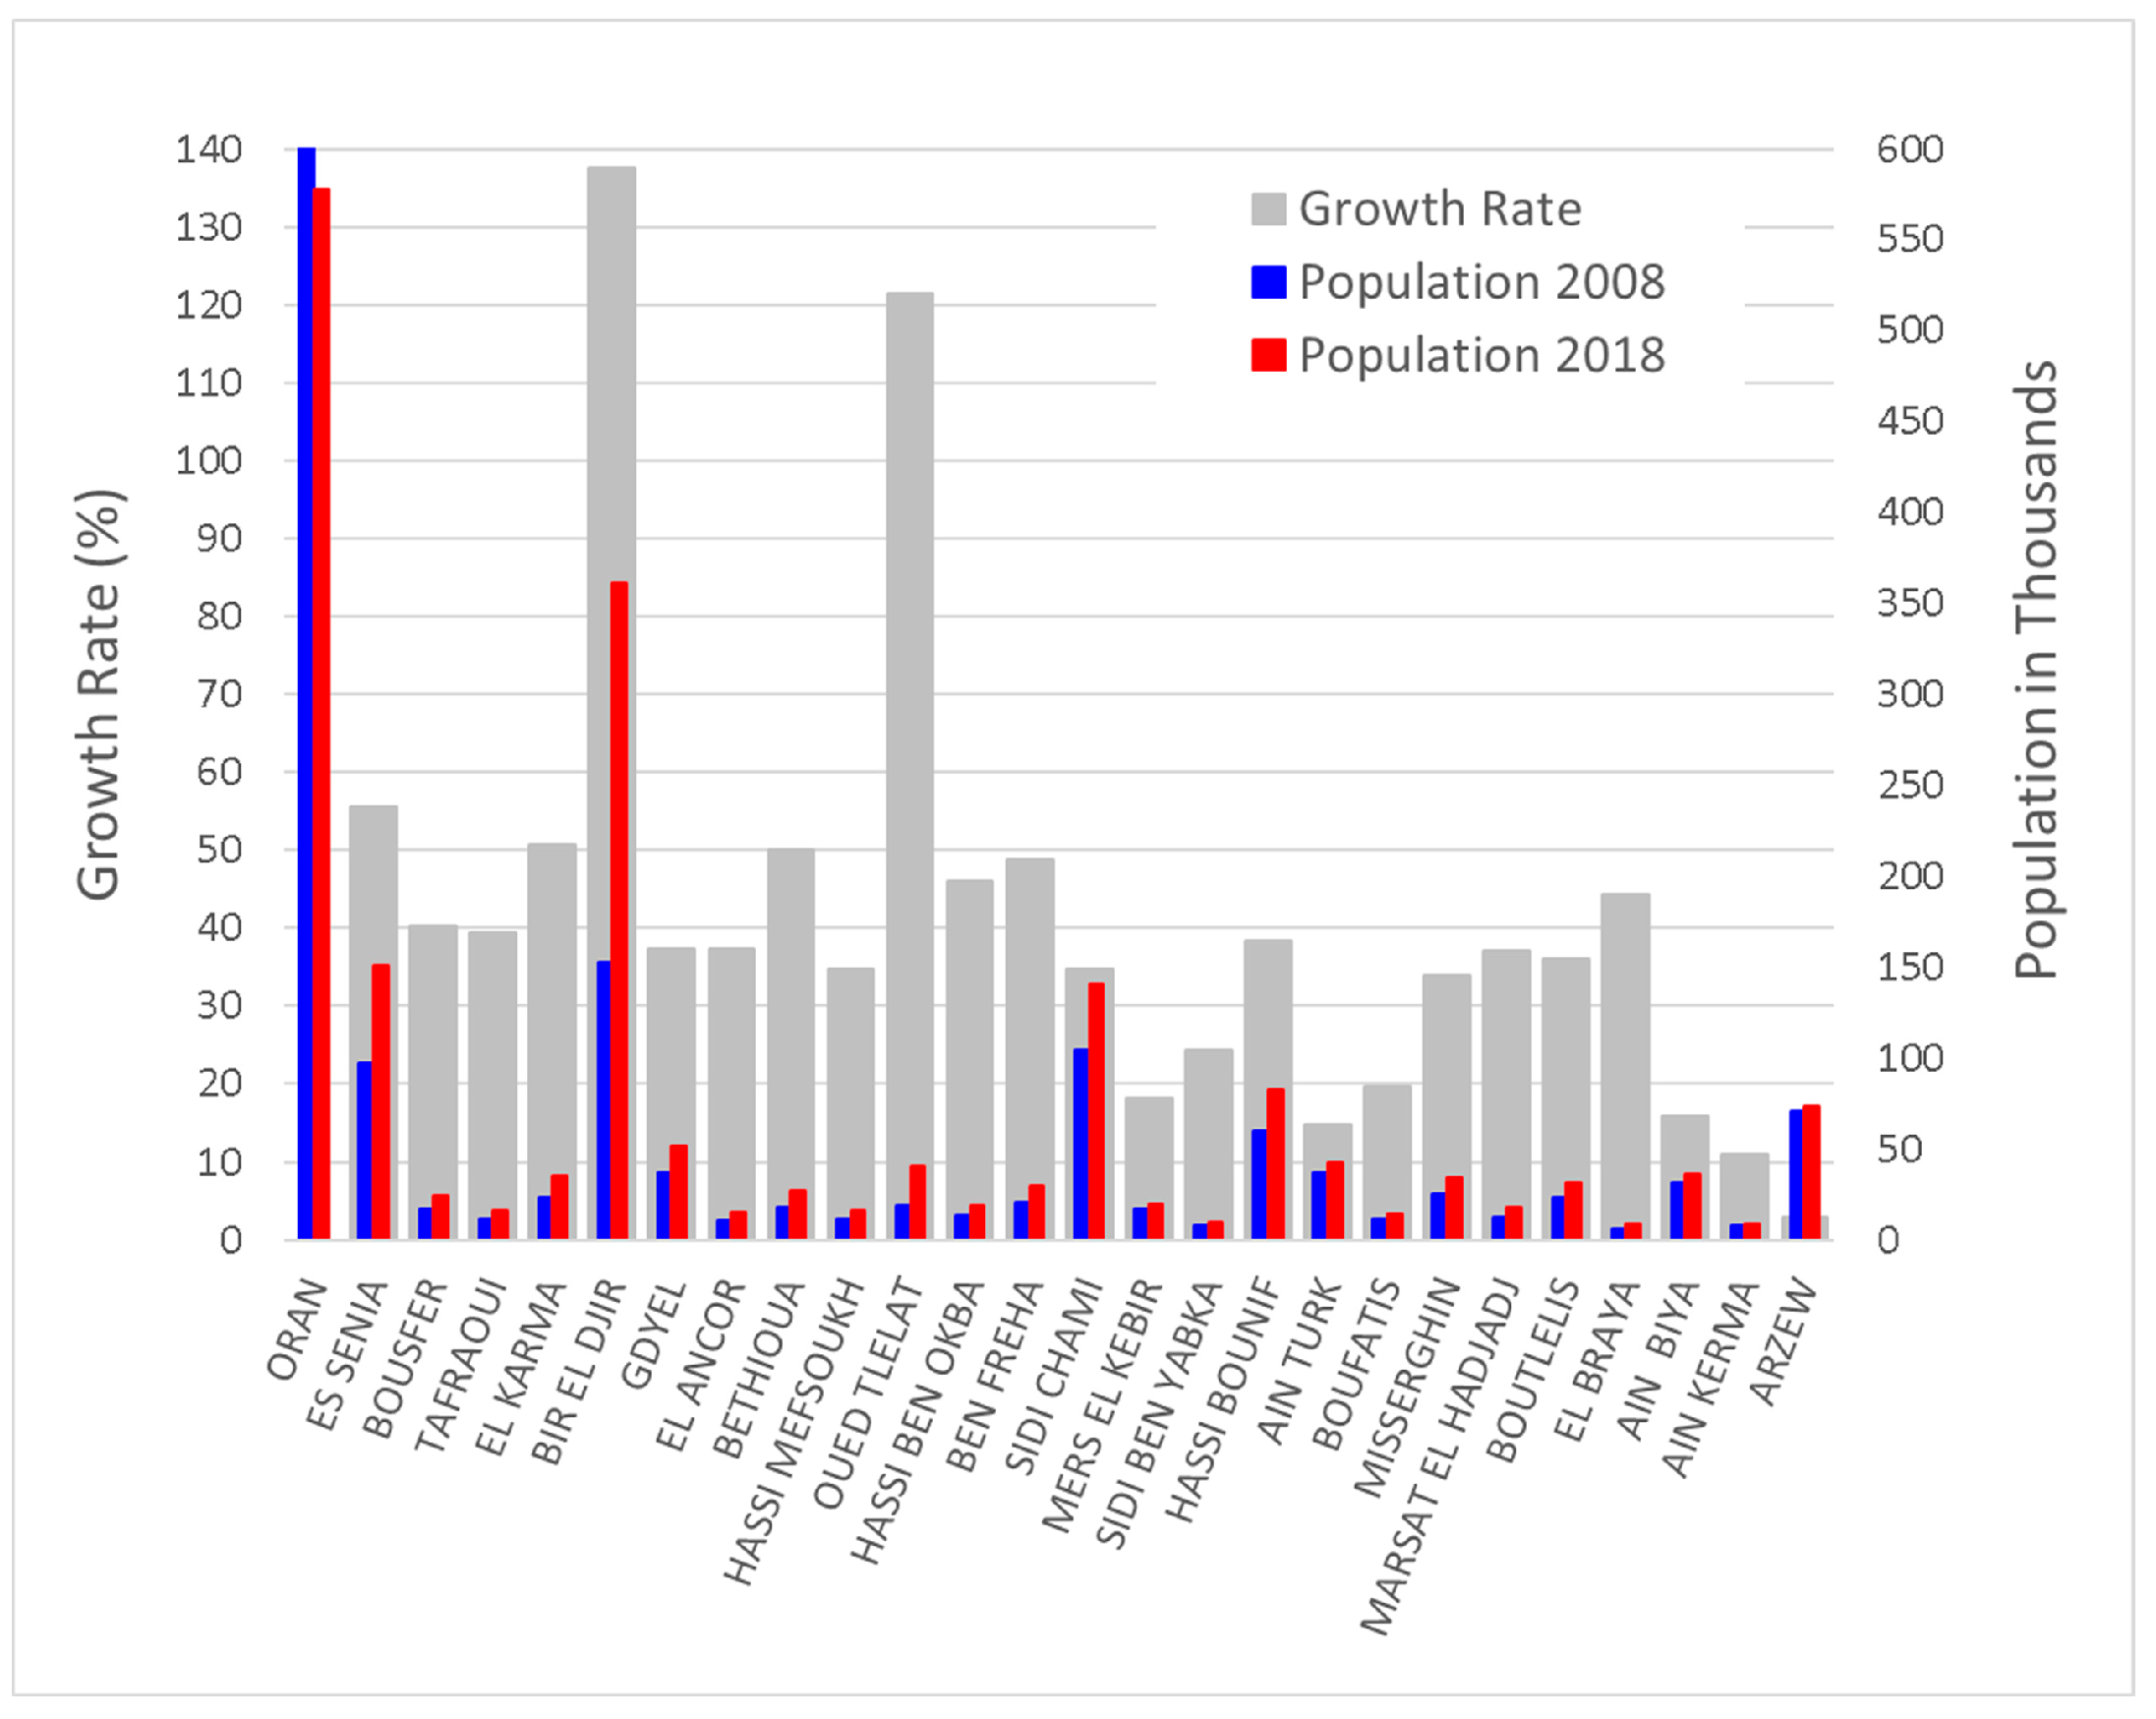
Oran and its adjacent communes Bir El Djir and Sidi Chami, counted more than 100,000 inhabitants in 2008 (Figure 8). The wilaya contains the three intermediate-sized communes of Arzew, Es Senia, and Hassi Bounif, with more than 60,000 inhabitants, while all other communes had a population count of less than 38,000 inhabitants in 2008. The population dynamic in the wilaya shows that the largest growth rate between 2008 and 2018 was recorded in Bir El Djir, a commune to the east and adjacent to Oran, which saw its population growing from 152,151 in 2008 to 361,409 in 2018, a formidable growth rate of 137.53%. The different administrative redistricting of the communes in the wilaya created apparent movements of the local population, resulting, for example, in a population decrease in Oran between 2008 and 2018 of about 5.27%, mostly due to the spilling of its population over into Bir El Djir and other neighboring communes in search for affordable housing while still residing within comfortable commuting distance. Similarly, the commune of Oued Tlelat, with a small population count in 2008 of 18,397 persons, has grown to 40,717 in 2018, an unhealthy 121.32% increase. Most of the communes showed significant growth, with many over 40%. The smallest population growth (29.3%) was recorded in the commune of Arzew.
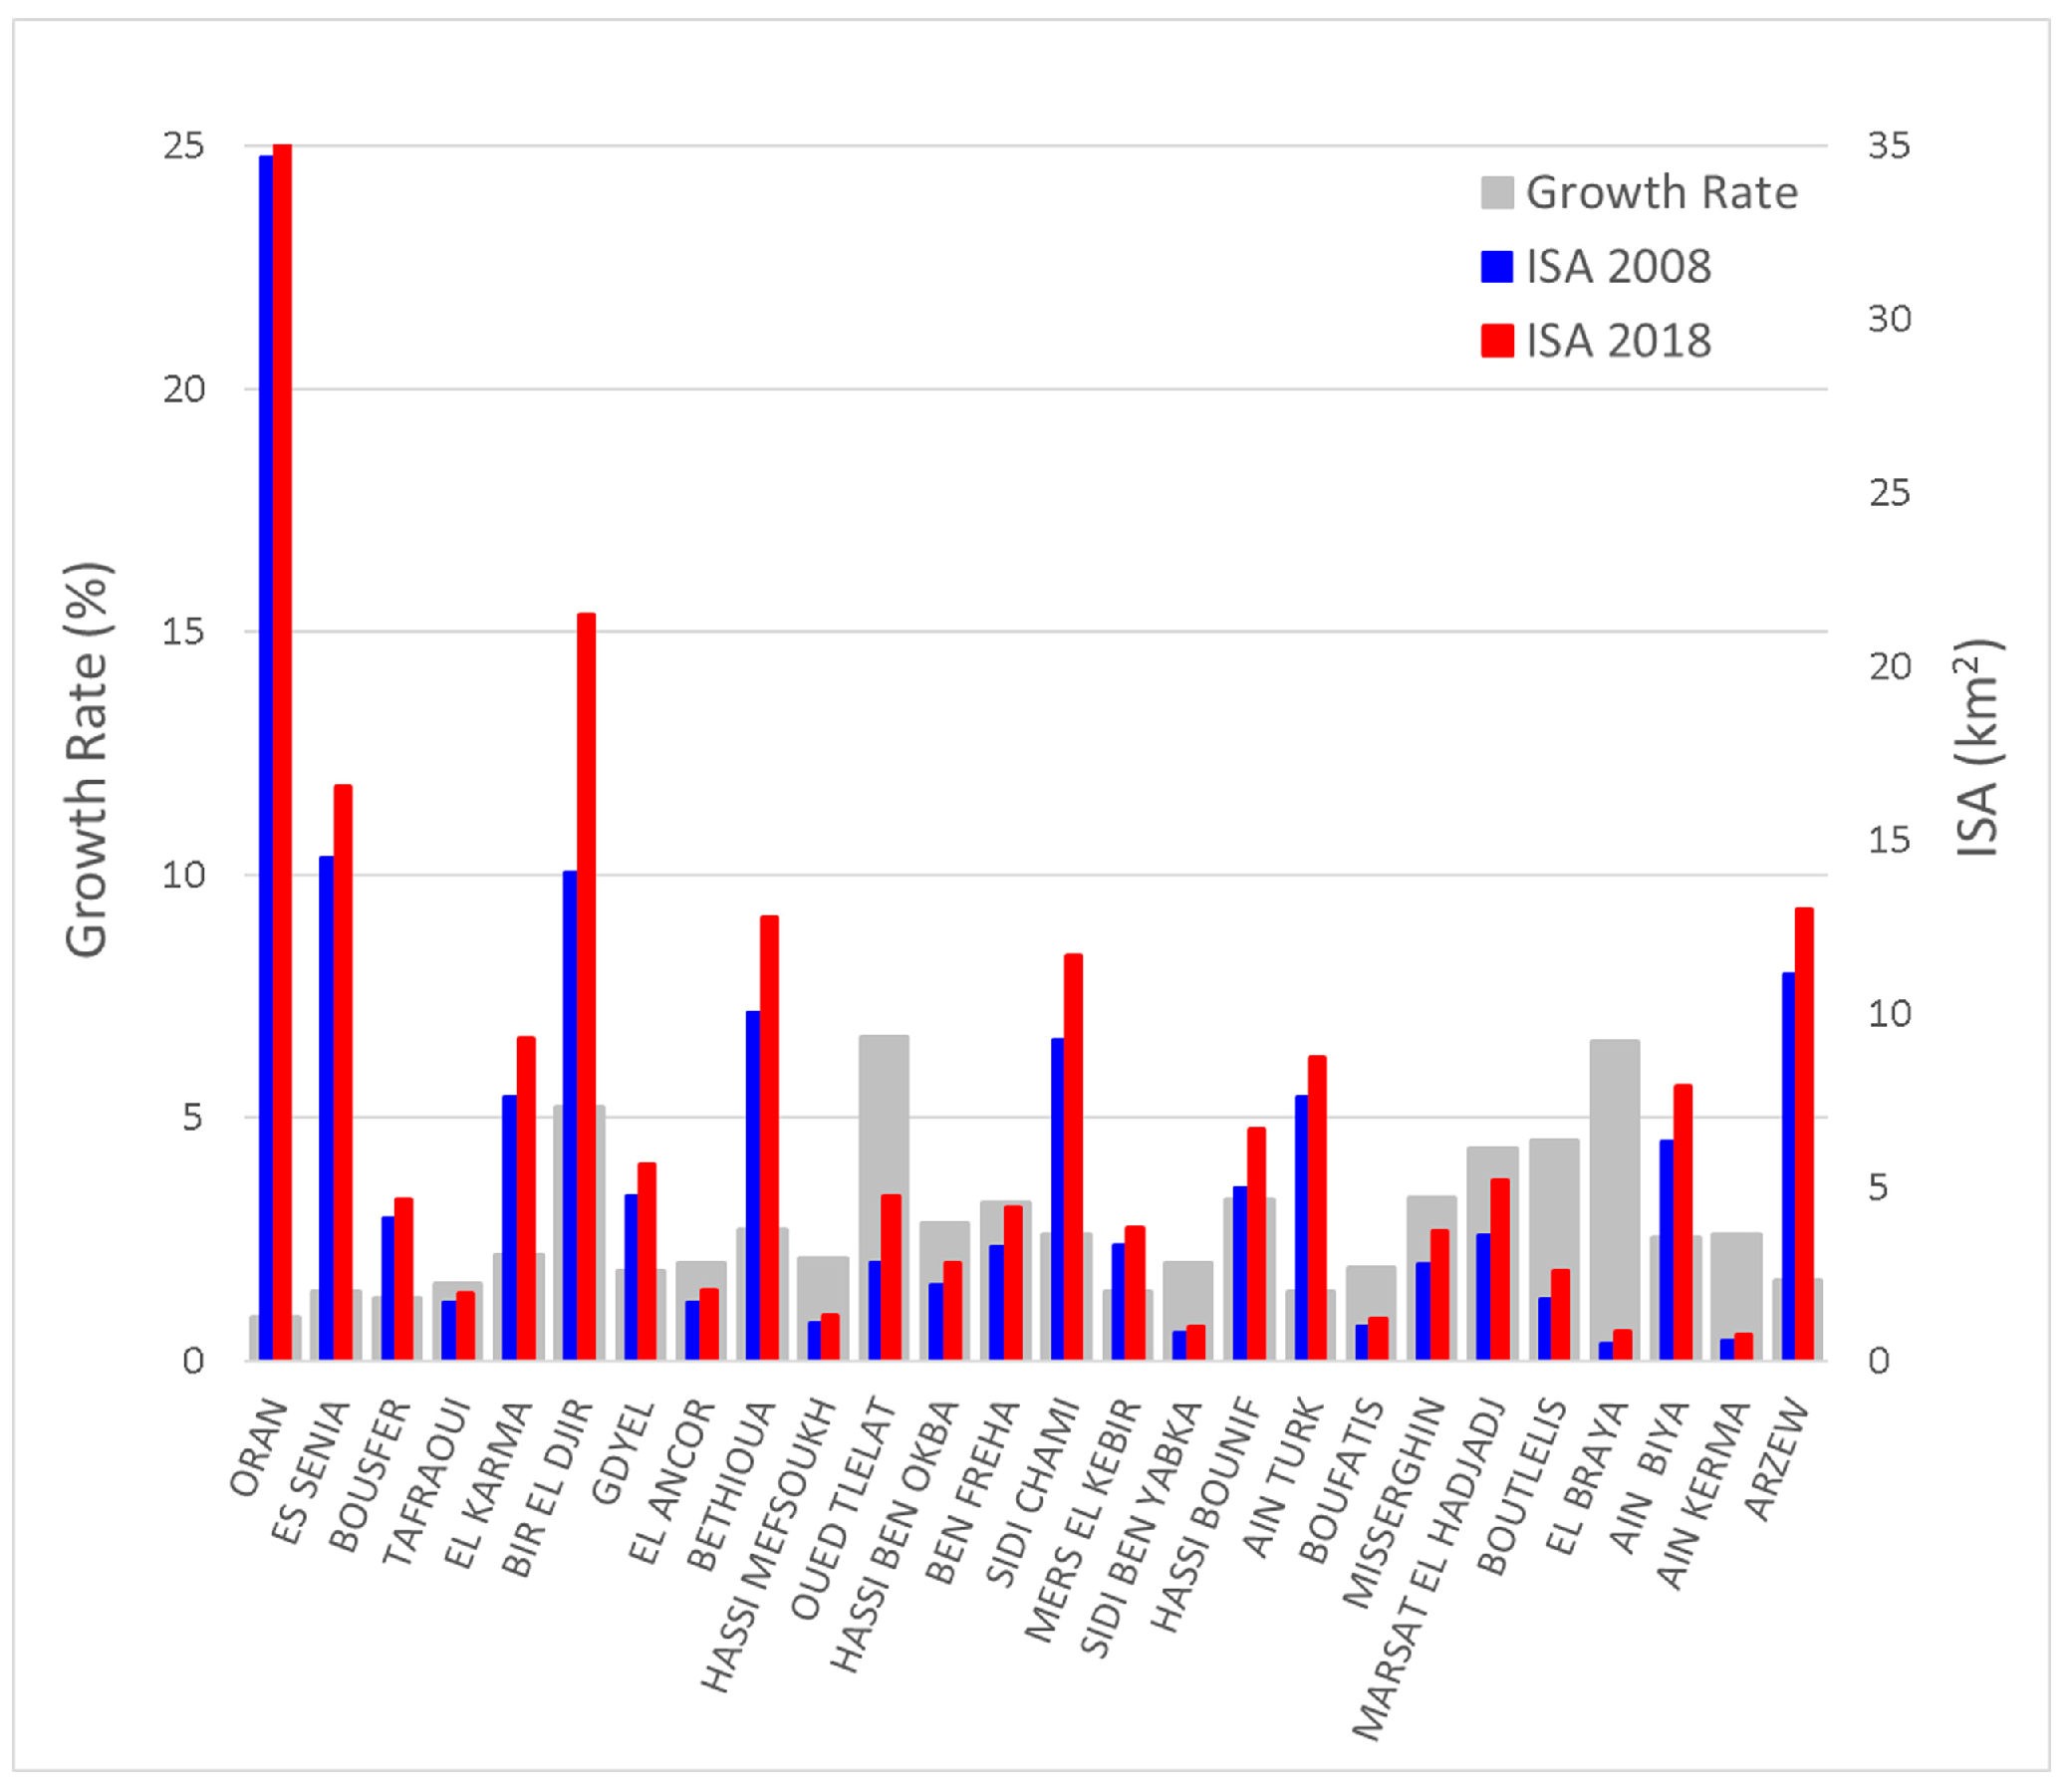
Figure 9 shows the areal expansion of the communes in the wilaya of Oran. It is clear that the largest commune is Oran, with an ISA of 34.66 km2 in 2008, increasing to 37.82 km2 in 2018. Oran is the core of the wilaya, with a dense built-up area dating back to the colonial period. The population increase has forced the expansion of buildup to the east, as the commune is limited by the Murdjadjo Mountain to its west and the Great Sebkha Lake to its south [32]. Large industrial zones have been constructed, and a significant extension has emerged to its east, closing the gap with the adjacent commune of Bir El Djir, which has become the second largest commune of the wilaya, with 21.48 km2 in 2018. While the largest communes recorded a moderate increase in urban land consumption, smaller-sized communes experienced an explosive growth of more than 20%, with the entire wilaya growing at an average 27.9% over the 10-year period.
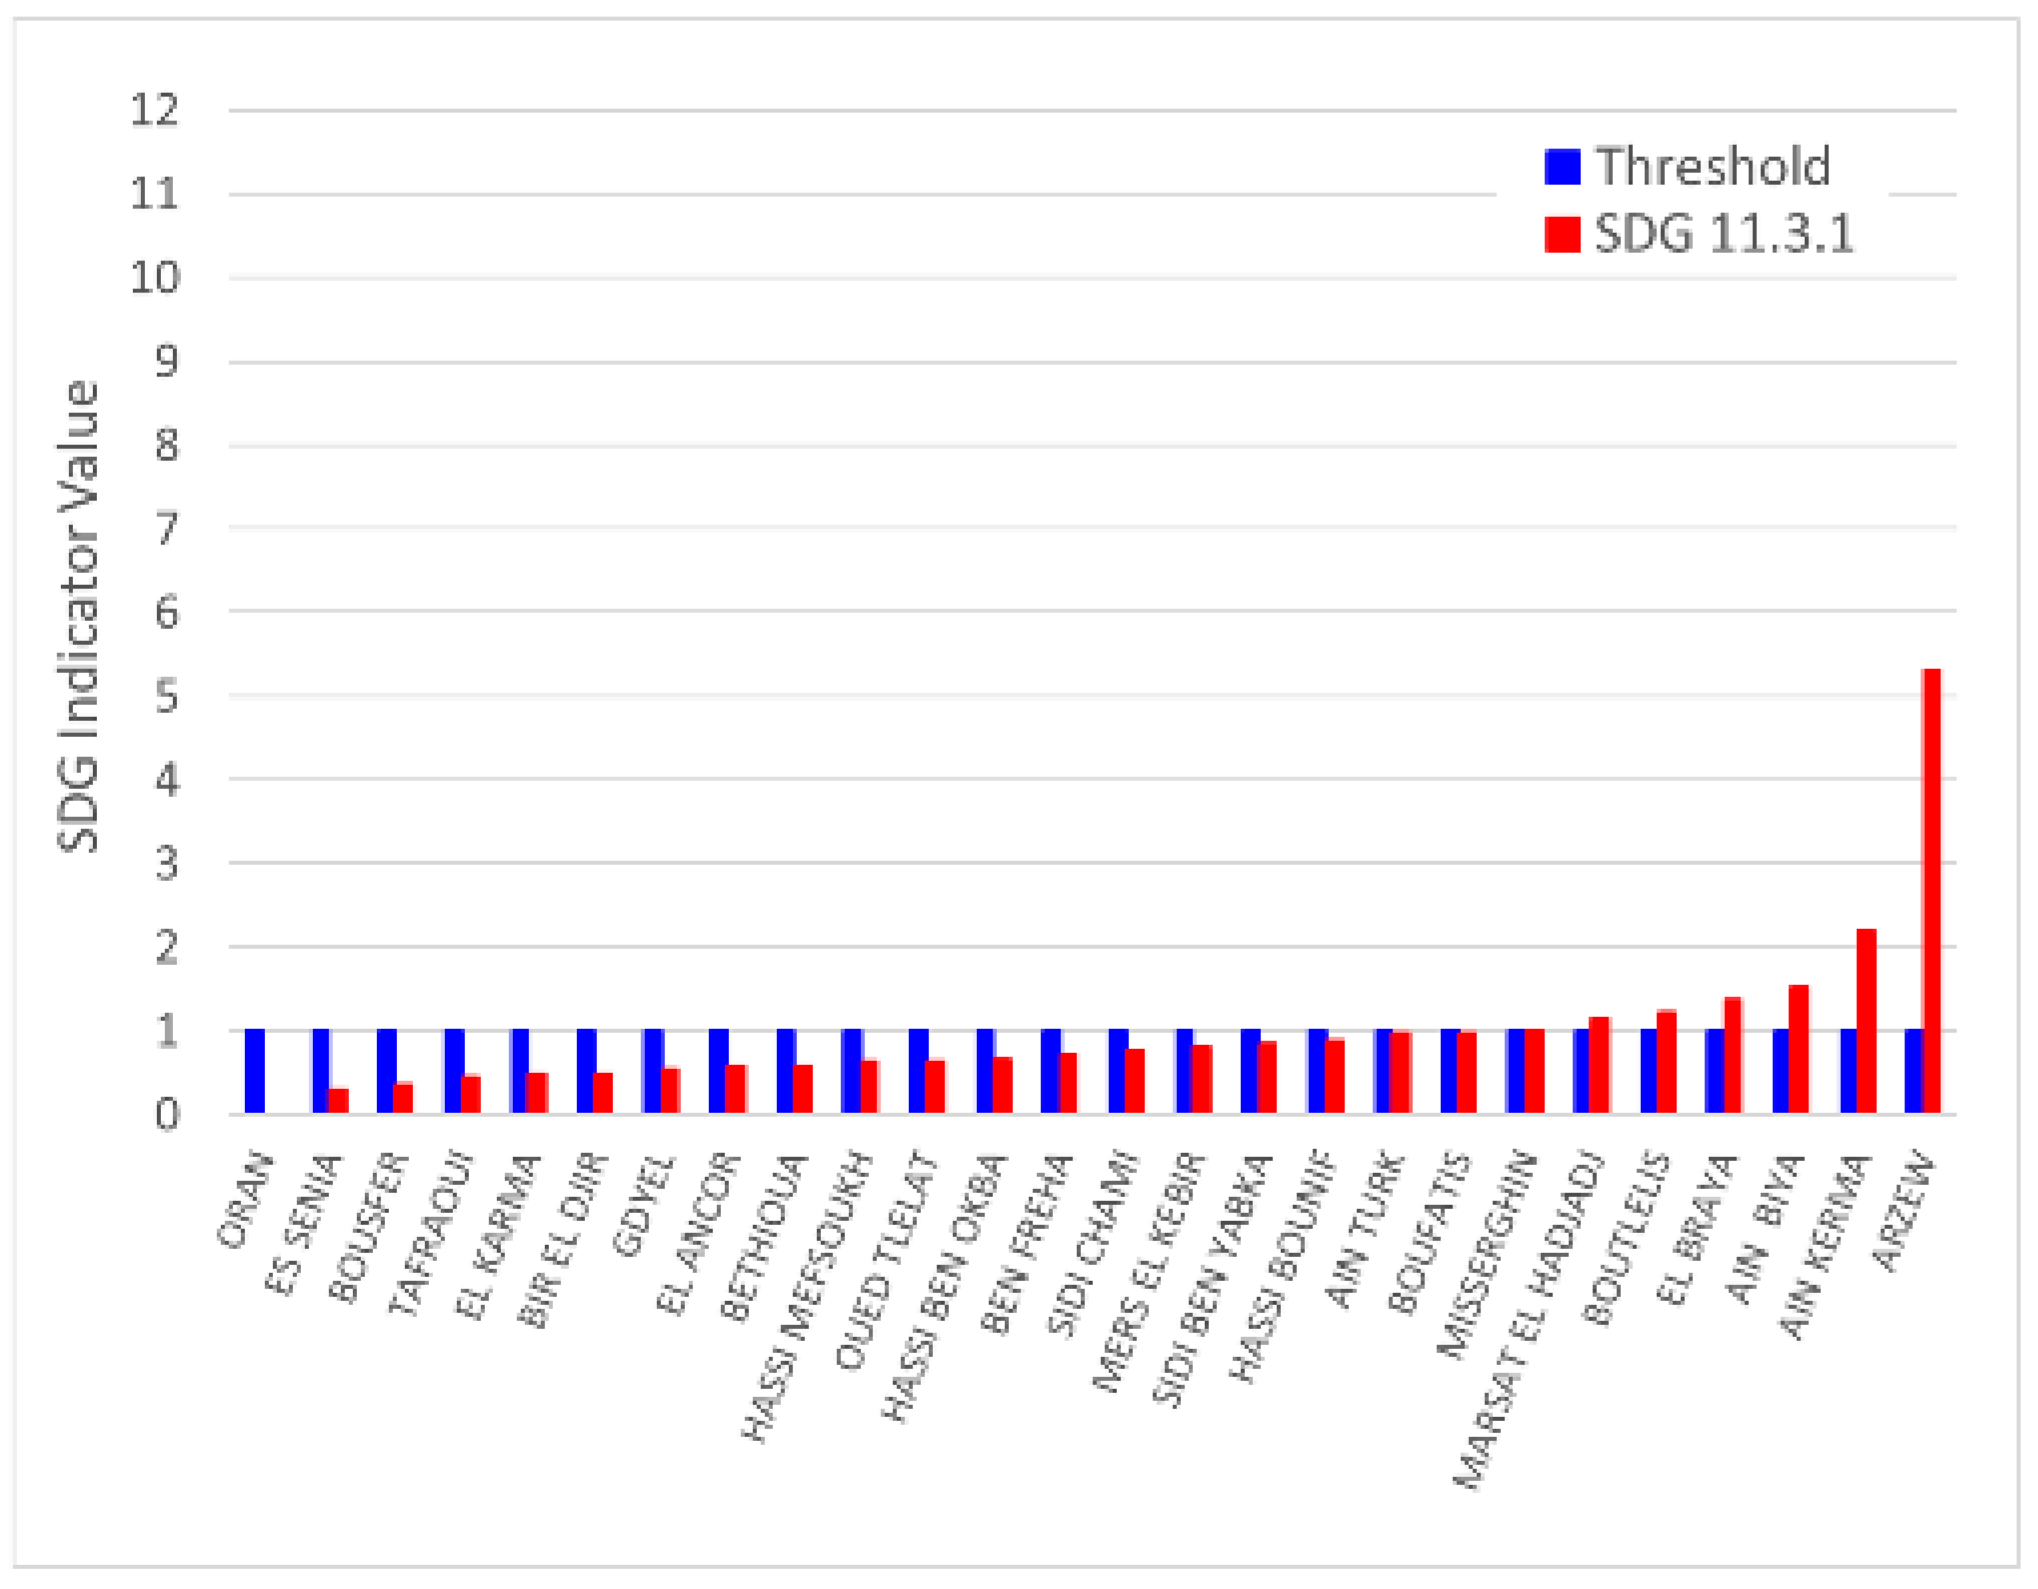
The population growth and the urban land consumption are not independent, and the UN SDG 11.3.1 as described in (3) defines this dependence. The implementation of new administrative divisions has led to an apparent decrease in population in some communes such as Oran, which recorded a decrease in population between 2008 and 2018. Since the formulation of the indicator does not allow for the population or the built-up area to recede during the measurement period [15], Oran is not included in the analysis of the SDG 11.3.1 shown in 
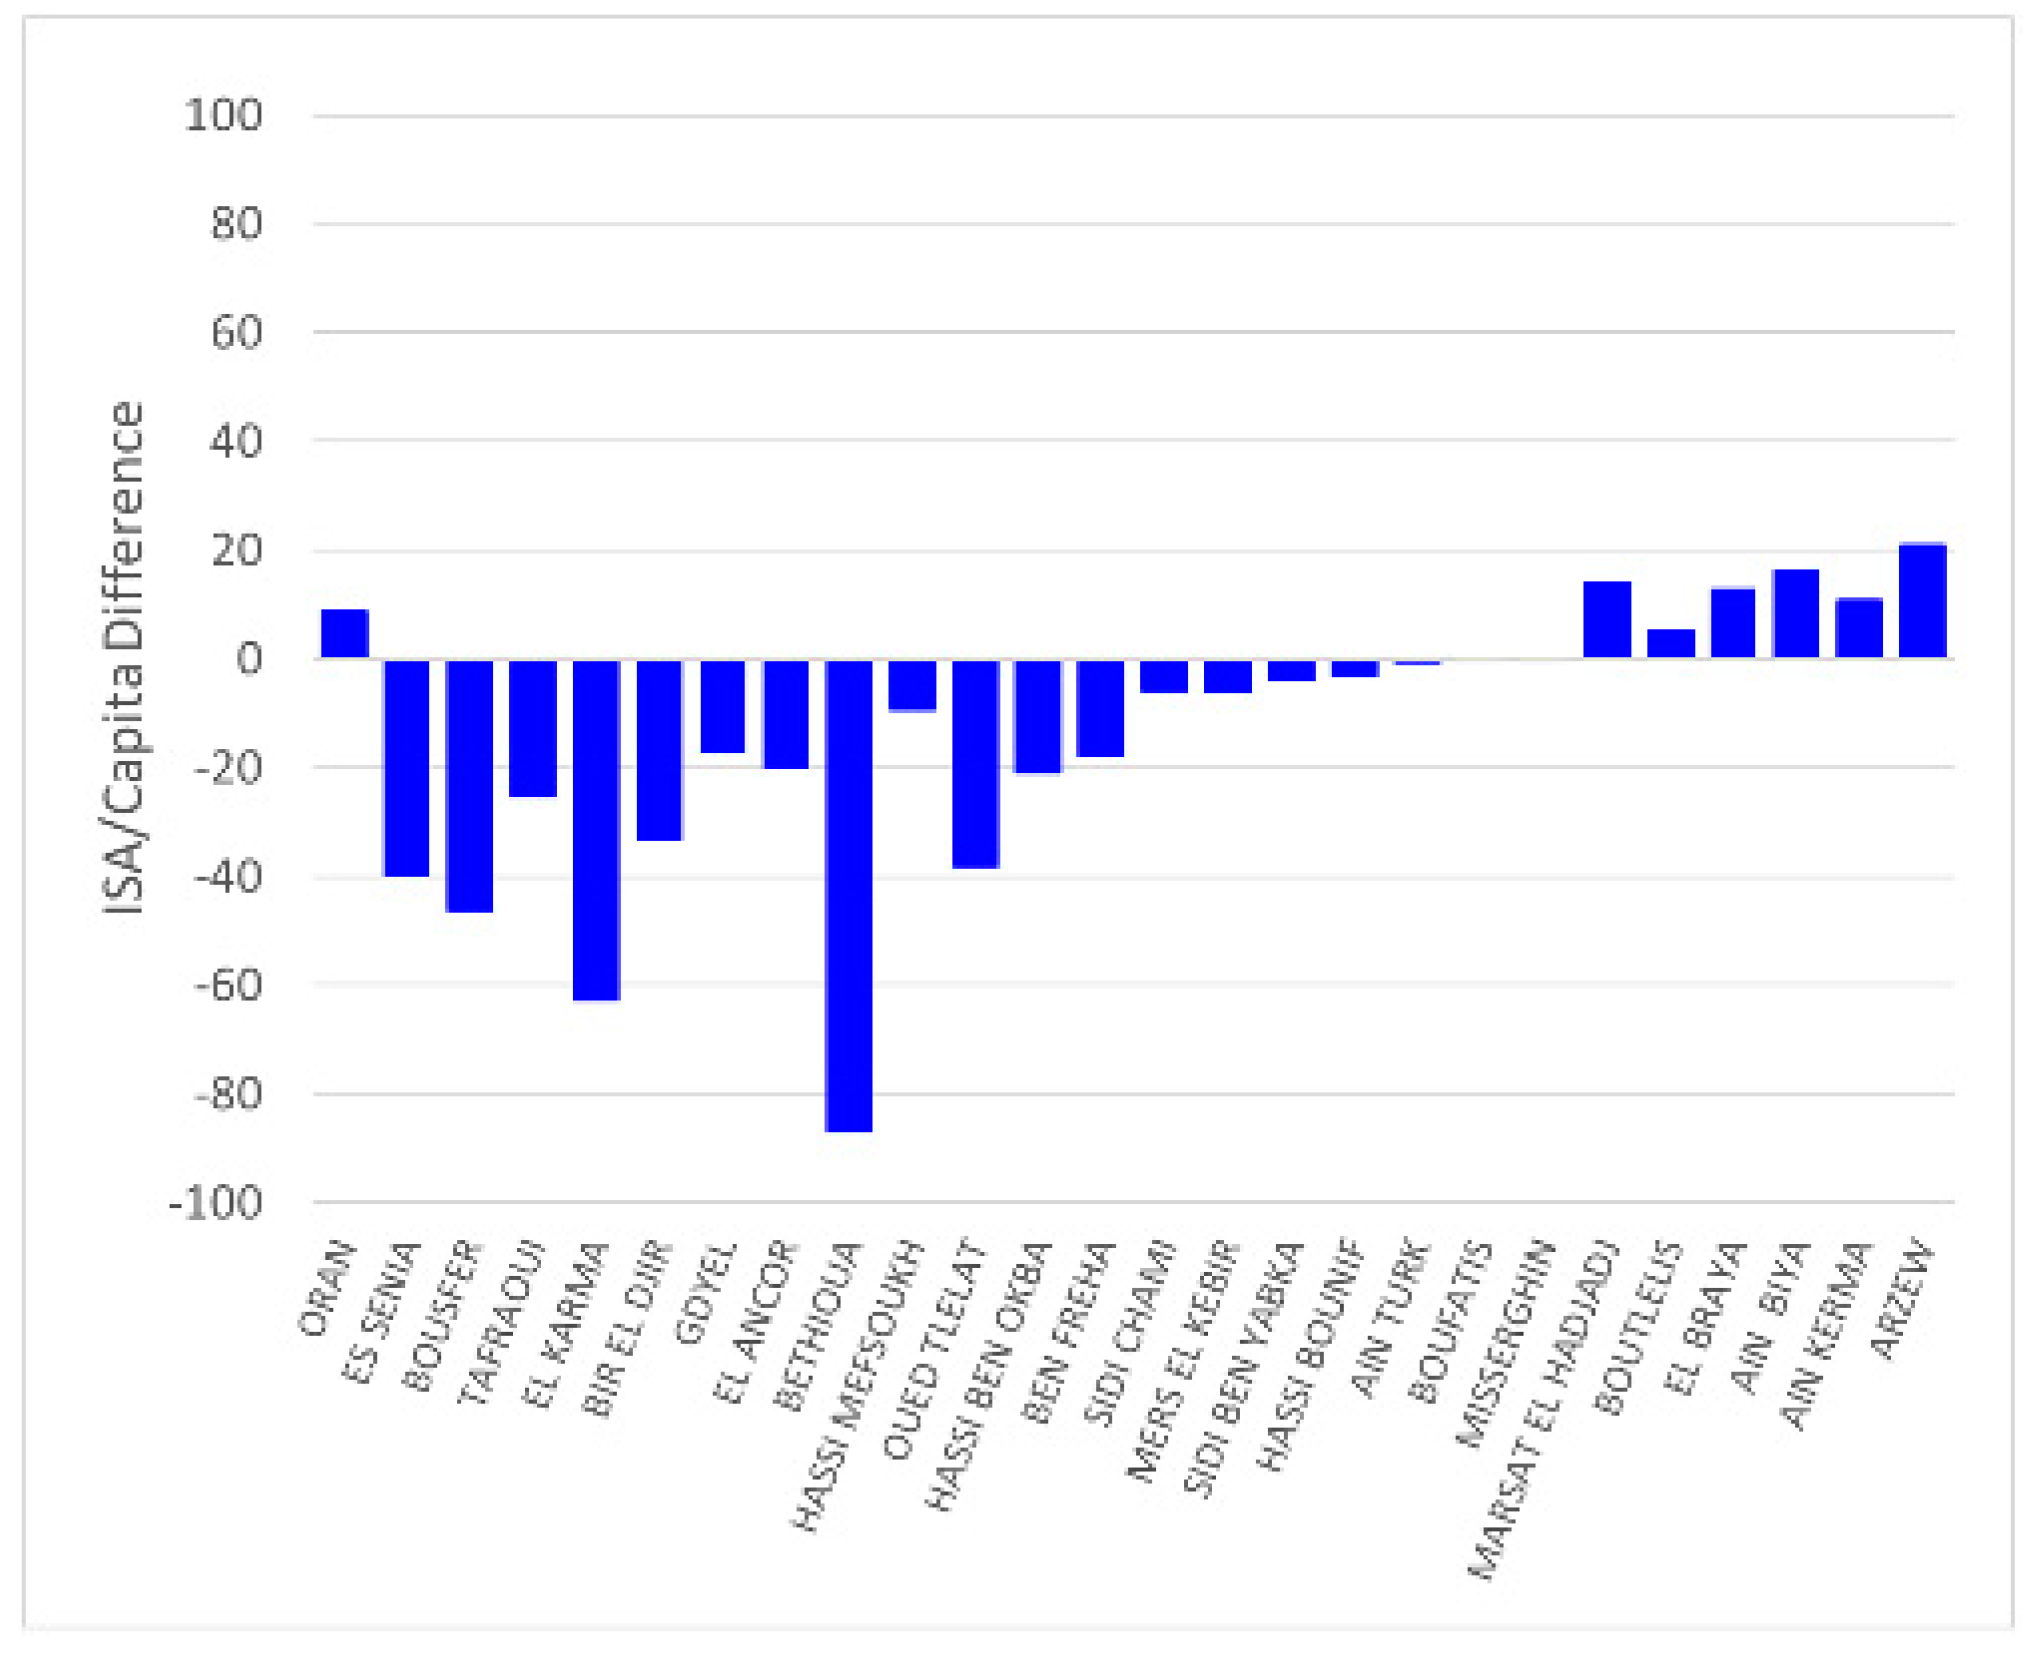
Figure 10. The wilaya of Oran has a high demand for future growth potential, and only six of its communes, the smallest in size and population, have an indicator value greater than 1 and are therefore developing in a non-sustainable way. These communes are Marsat El Hadjadj, Boutlelis, El Braya, Ain Biya, Ain El Kerma, and Arzew. This is characteristic of small urban areas, which usually populate rapidly due either to a migratory inflow or just an increase in the land consumption per capita during the early phase of the urban settlement. All other communes have an indicator value of less than 1, signifying that land consumption for urban purposes is growing much slower than population and, therefore, is evolving in a sustainable direction. The ISA per capita distribution for the communes of Oran is in line with the SDG 11.3.1 indicator (Figure 11) and shows that in all the communes indicating unsustainability, the ISA per capita increased. Although not too large for a decadal increase of 14 to 21 m2 per person, the tendency is towards consuming more urban land per person. For all other communes, the ISA per capita decreased, and the land appropriated for urban use grew much slower than the population. For the commune of Oran, for which the SDG 11.3.1 is not defined, the ISA per capita value appears to be a better proxy and gives a direct measurement of the urban land use in relation to the population dynamic. The ISA per capita for Oran increased by 8.63 m2/person over the 10 years. Overall, for most of its communes, the wilaya of Oran seems to have an urban land use commensurable to its population increase except for some communes where land tenure regulation and land-use policy need to be revisited to maintain sustainable development within the limits of land availability.

3.3. The Wilaya of Algiers

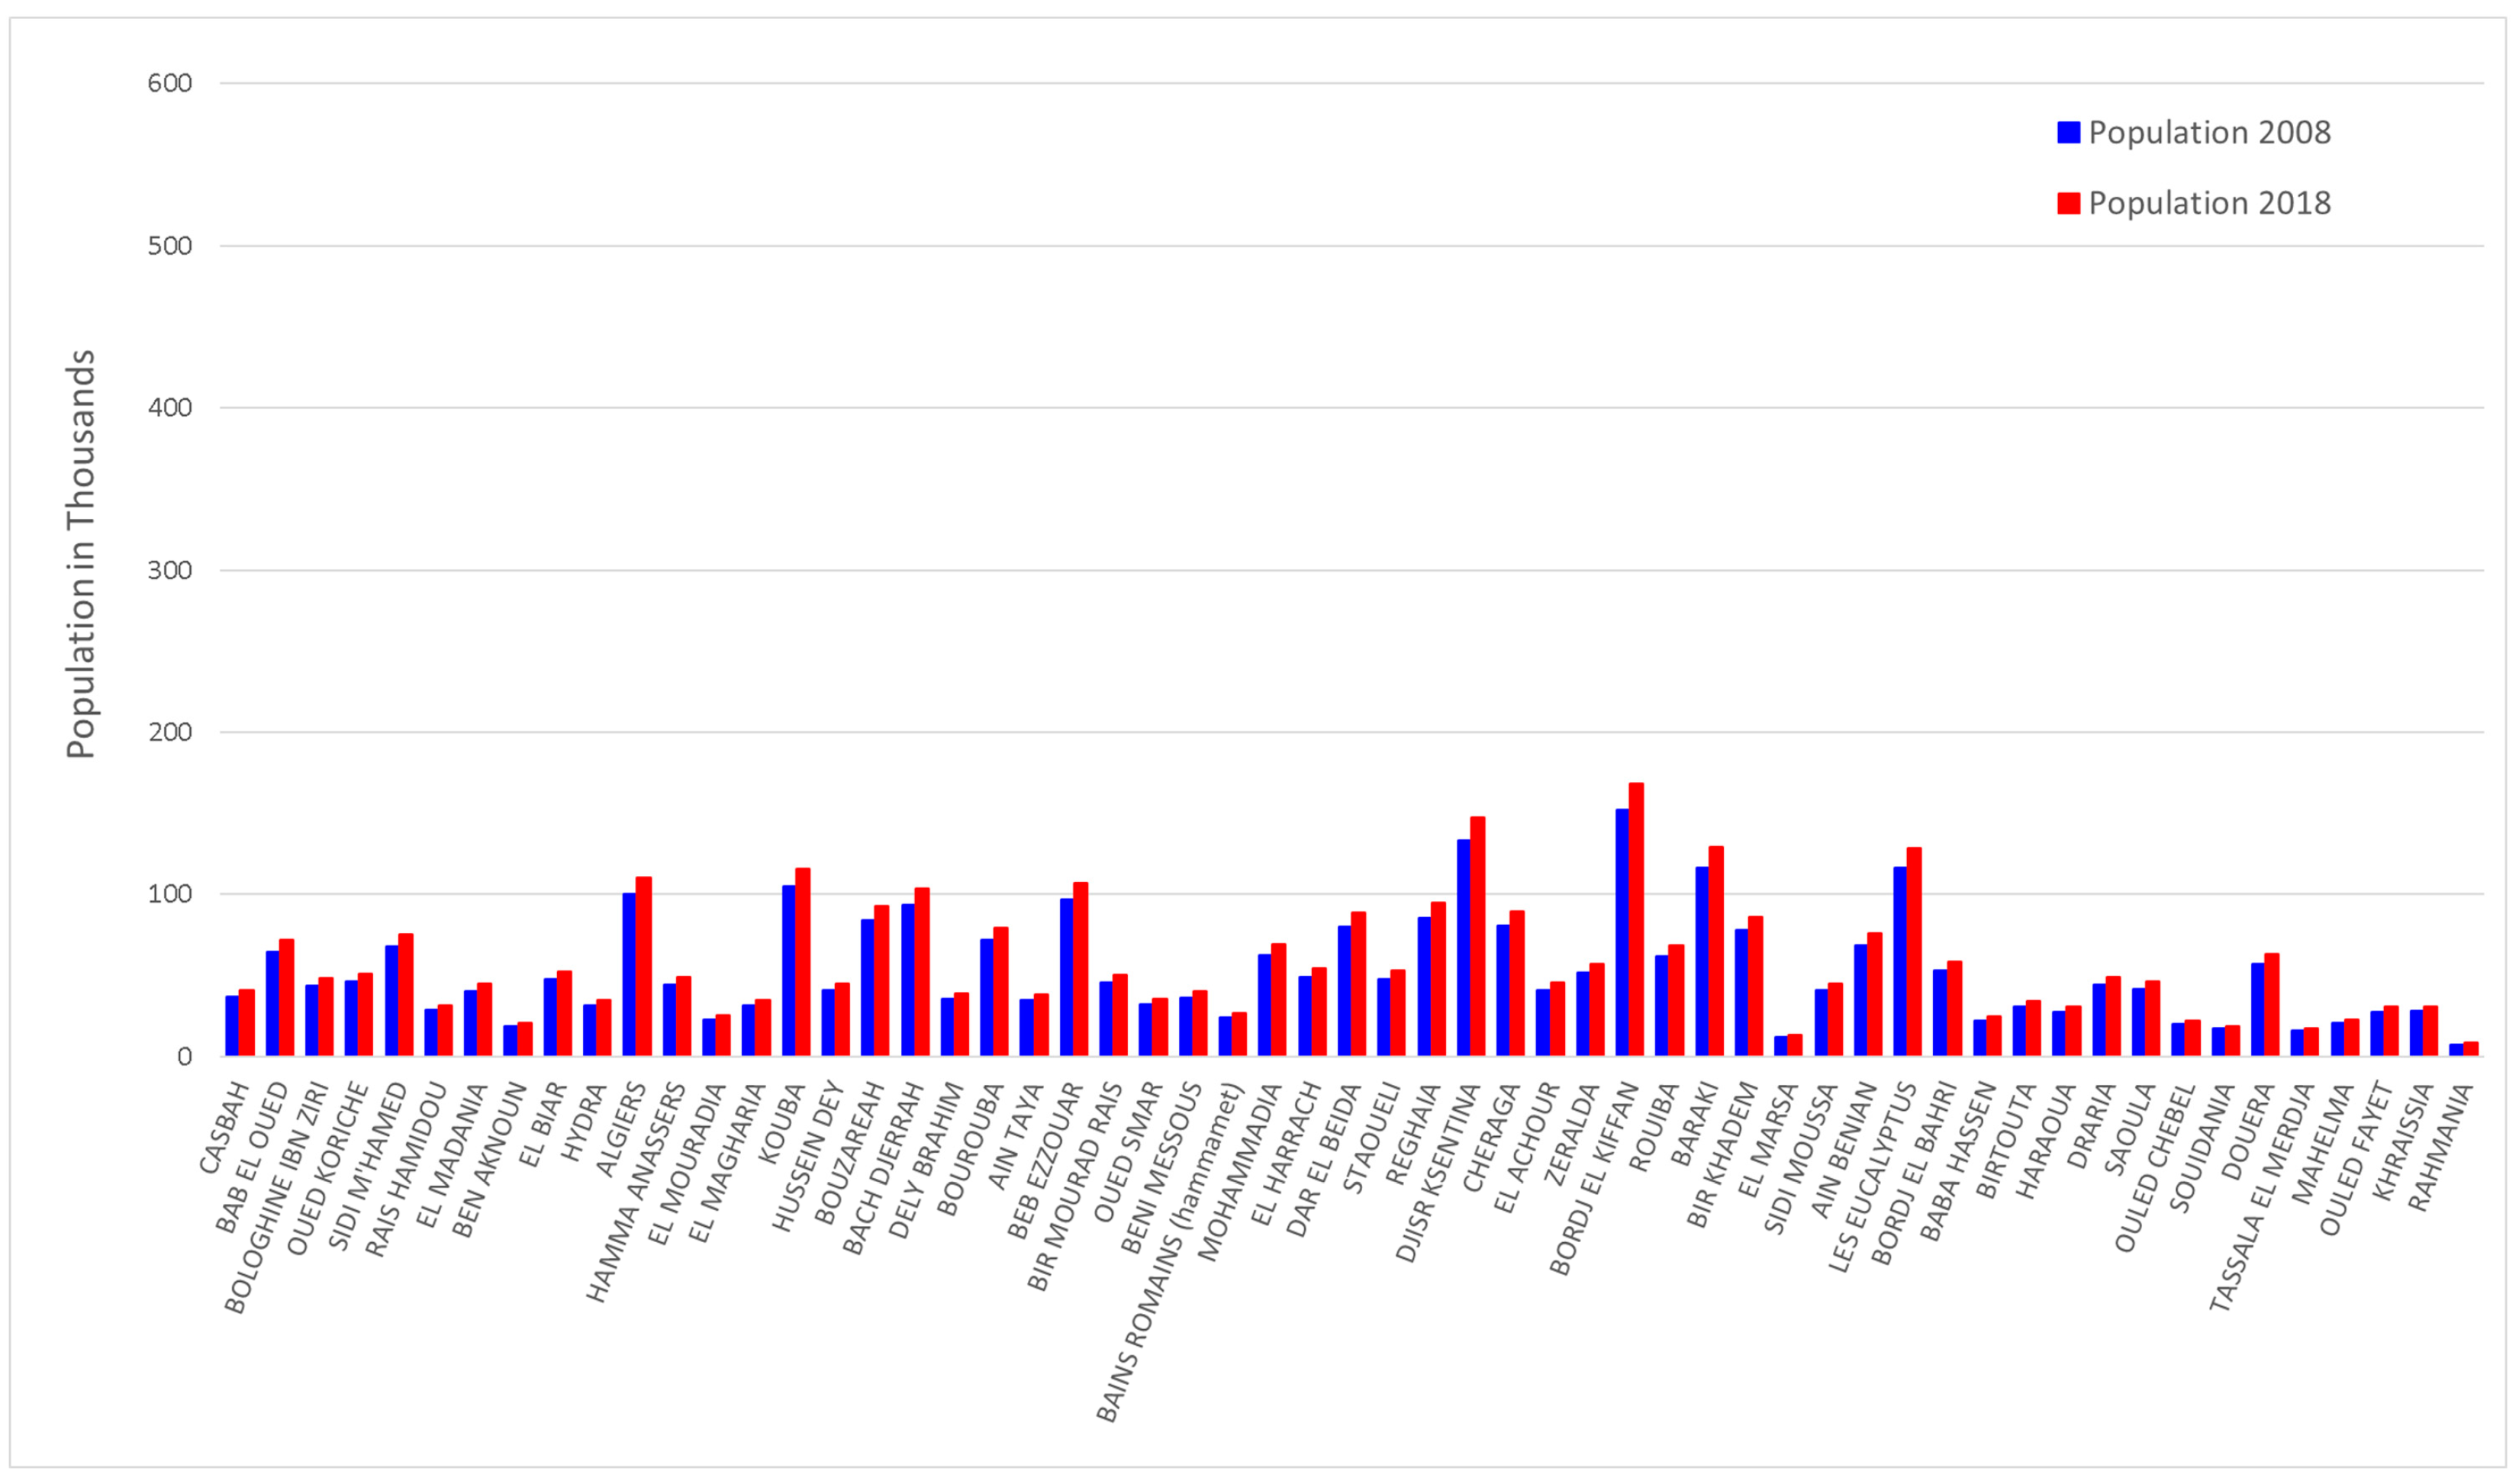
The wilaya of Algiers is the most populated in Algeria. Its seat, Algiers, is also the country’s capital. Located on the shores of the Mediterranean Sea, the wilaya of Algiers is made up of 57 communes (Figure 12) with approximately 3 million inhabitants in 2008. The wilaya experienced a significant growth rate during the 2008–2018 decade. The modern city in the commune of Algiers is built on the ground level by the seashore, while the ancient city climbs the steep hill and is crowned by the Casbah, a citadel located about 100 m above sea level. Algiers is known for its fast-growing economy, population, and urban expansion. The most populated communes as of 2008 are Bordj El Kifan (151,950), Djisr Ksentina (147,541), Baraki (116,375), Les Eucalyptus (116,107), Kouba (104,708), and Algiers in the sixth position with only 99,843 inhabitants. Apart from these communes and few others with a population of more than 60,000 inhabitants, most of the communes of Algiers have a population count of between 10,000 and 50,000 inhabitants, with the commune of Rahmania having the smallest population of 7396 inhabitants in 2008. Since population was not available for the communes of Algiers in 2018, we are not able to comment on the growth rate at the communal level.
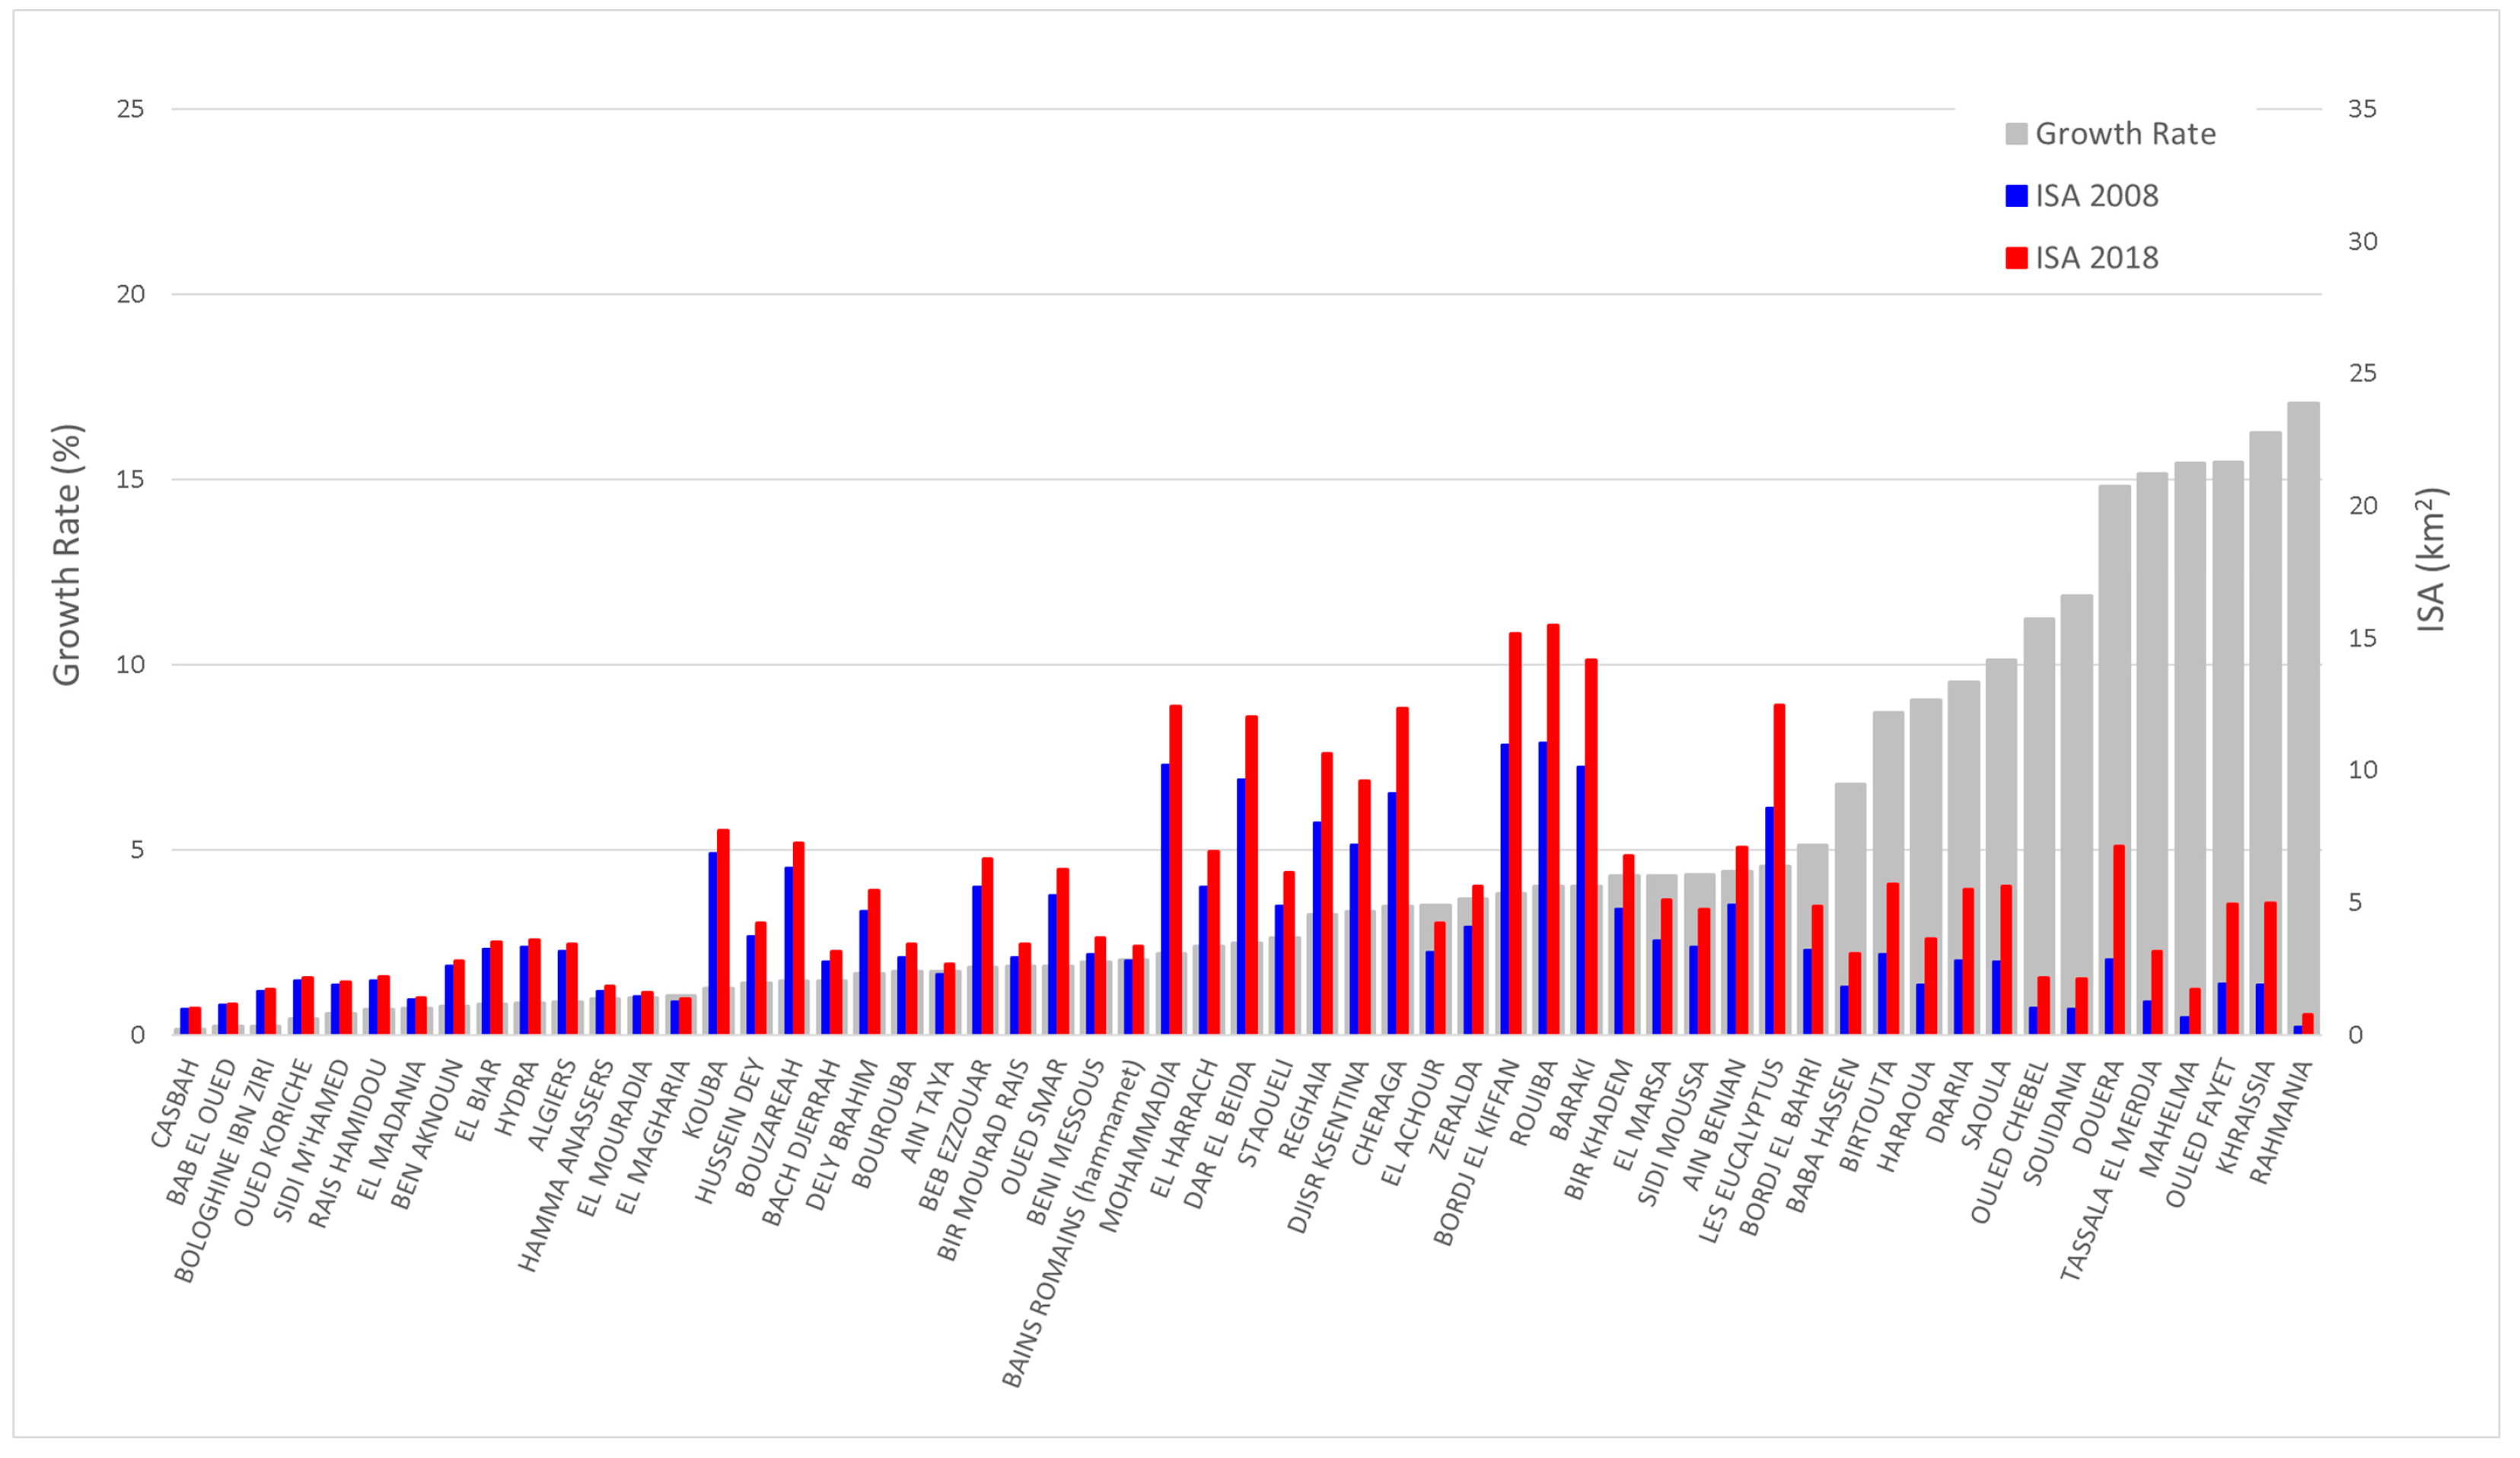
The distribution of the ISA in the communes of Algiers is shown in Figure 13 and reveals three categories of growth: (1) communes that are originally small in size (<4 km2) and densely populated, for example, Casbah, Bab El Oued, and Bologhine, where the built-up growth between 2008 and 2018 was relatively small (<10%); (2) communes that were originally small (<4 km
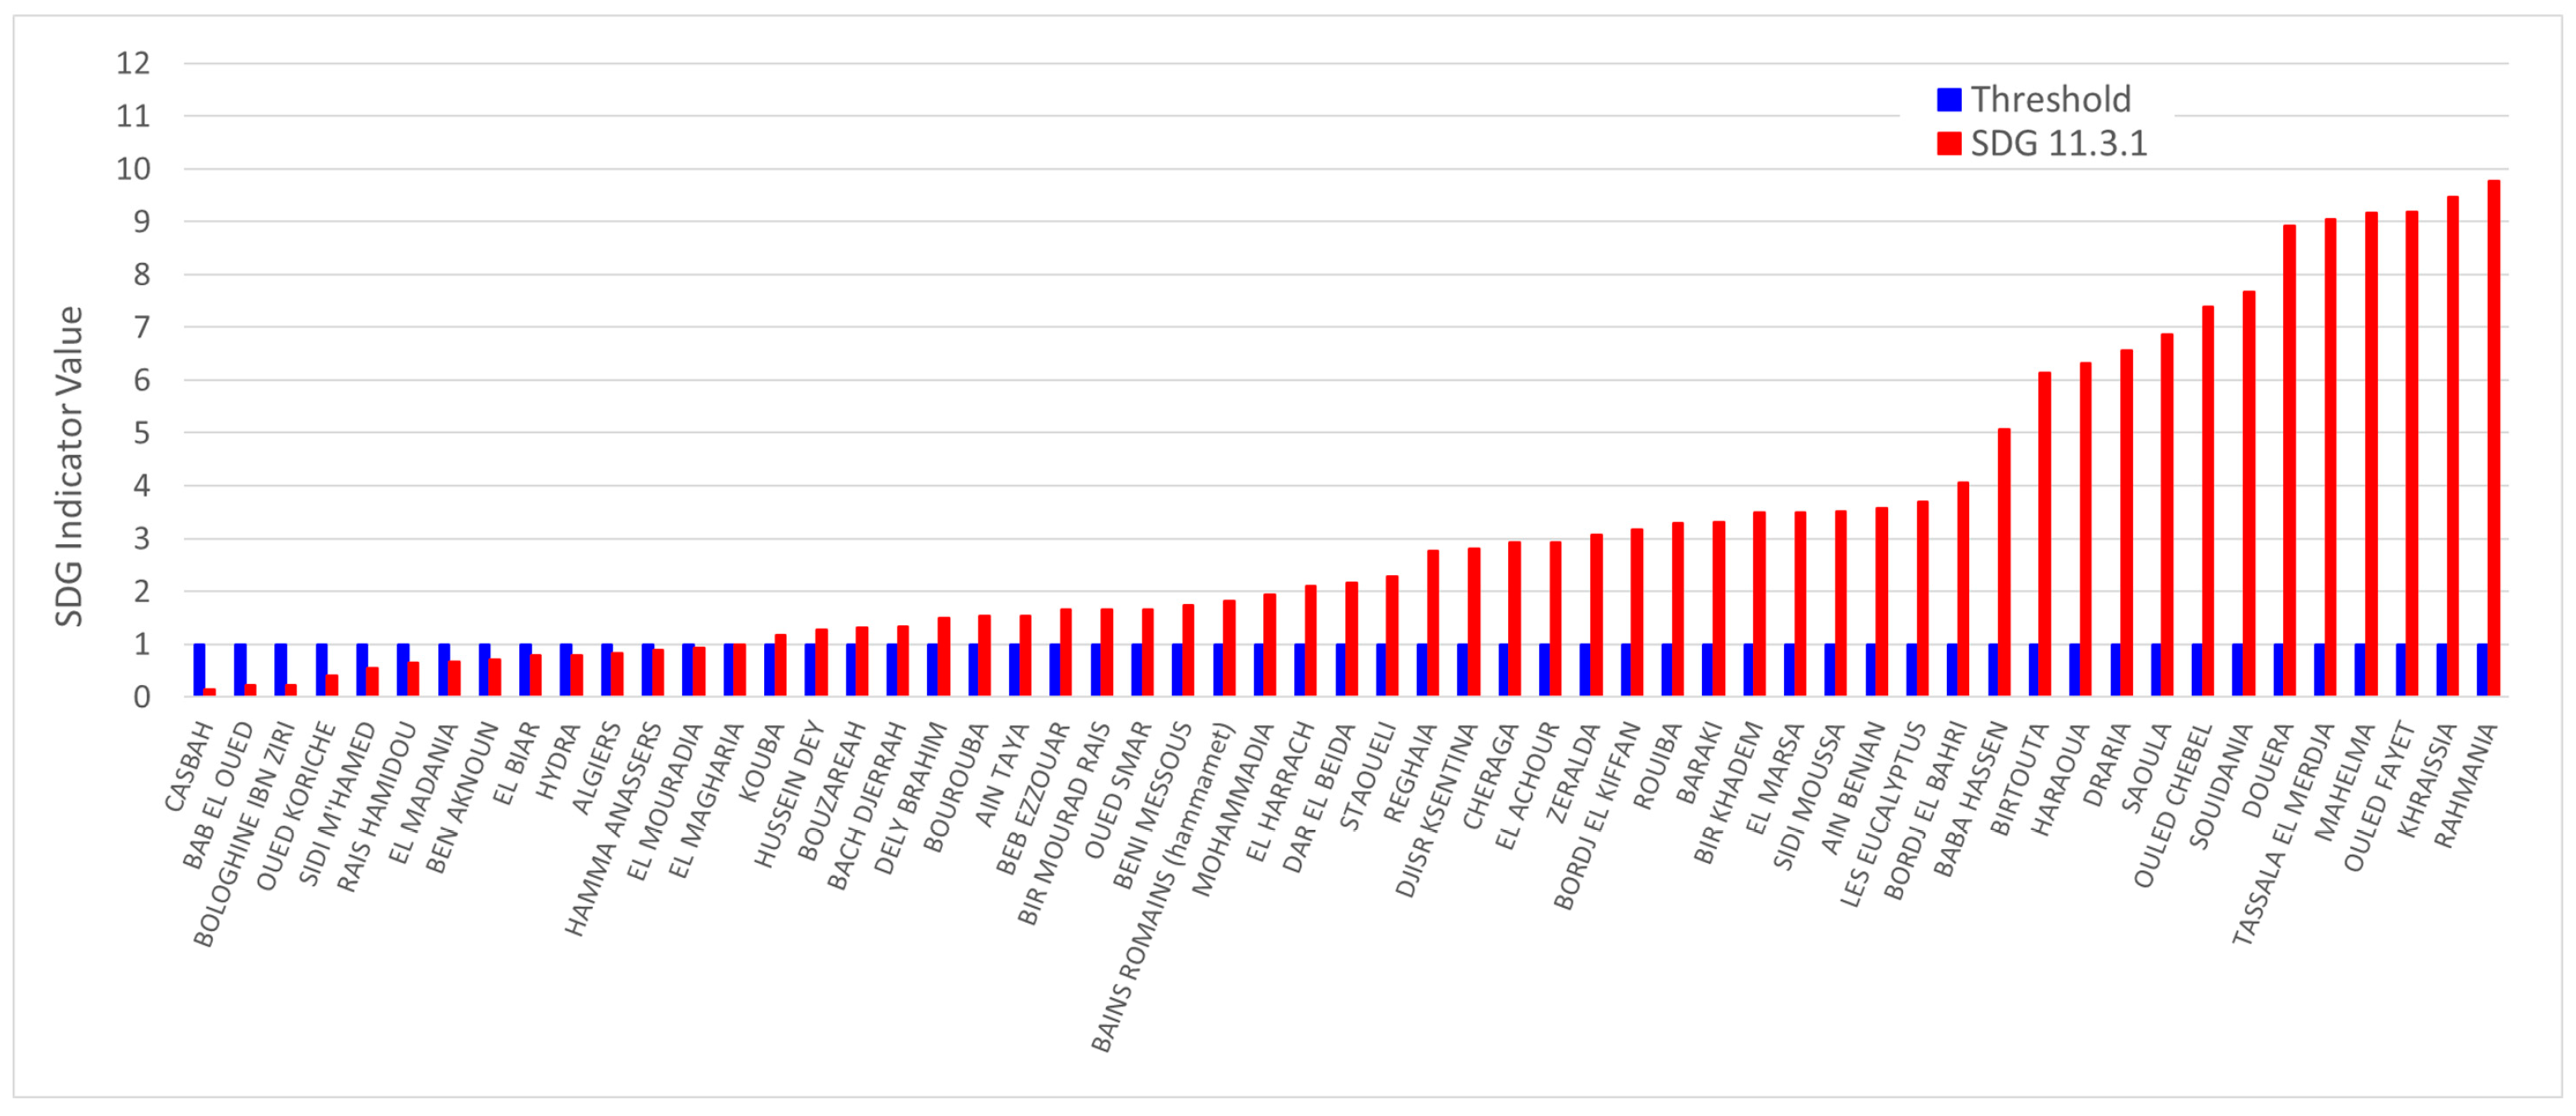
2) but not densely populated, such as Bordj El Bahri, Baba Hassen, and Birtouta, which recorded an explosive growth of more than 40%, with some extreme growth of more than 100% in the communes of Saouala, Ouled Chbel, Souidania, Douera, Tassala, Mahelma, Ouled Fayet, Khraissia, and Rahmania; and (3) the remaining communes that have experienced sizable growth in urban land consumption of 10% to 40%. This uneven correlation between urban land consumption and population growth leads to an urban development dynamic that is not sustainable, as described by the SDG indicator in Figure 14. Out of 57 communes, only 14 have an SDG 11.3.1 value of less than 1, pointing to a tendency towards sustainable growth. All other communes show an urban land consumption rate higher than the population growth rate, a sign of unsustainability and irrational urban land use. In a wilaya such as Algiers, which hosts the capital buildings, it is difficult to assess the relationship between population and impervious surface area, as the urban area includes government buildings that are uninhabited but are accounted for as land consumed and therefore counterbalance sustainability as defined by the UN SDG indicator and the ISA per capita. It is clear from the ISA distribution that the communes with concentrated government buildings, such as El Madania, El Mouradia, Hydra, and Algiers, have had minimal growth in terms of area, whereas limitrophe communes at the periphery of the wilaya, where capital city workers seek affordable housing, have experienced an explosive growth of up to 170% in places such as Rahmania (Figure 13).
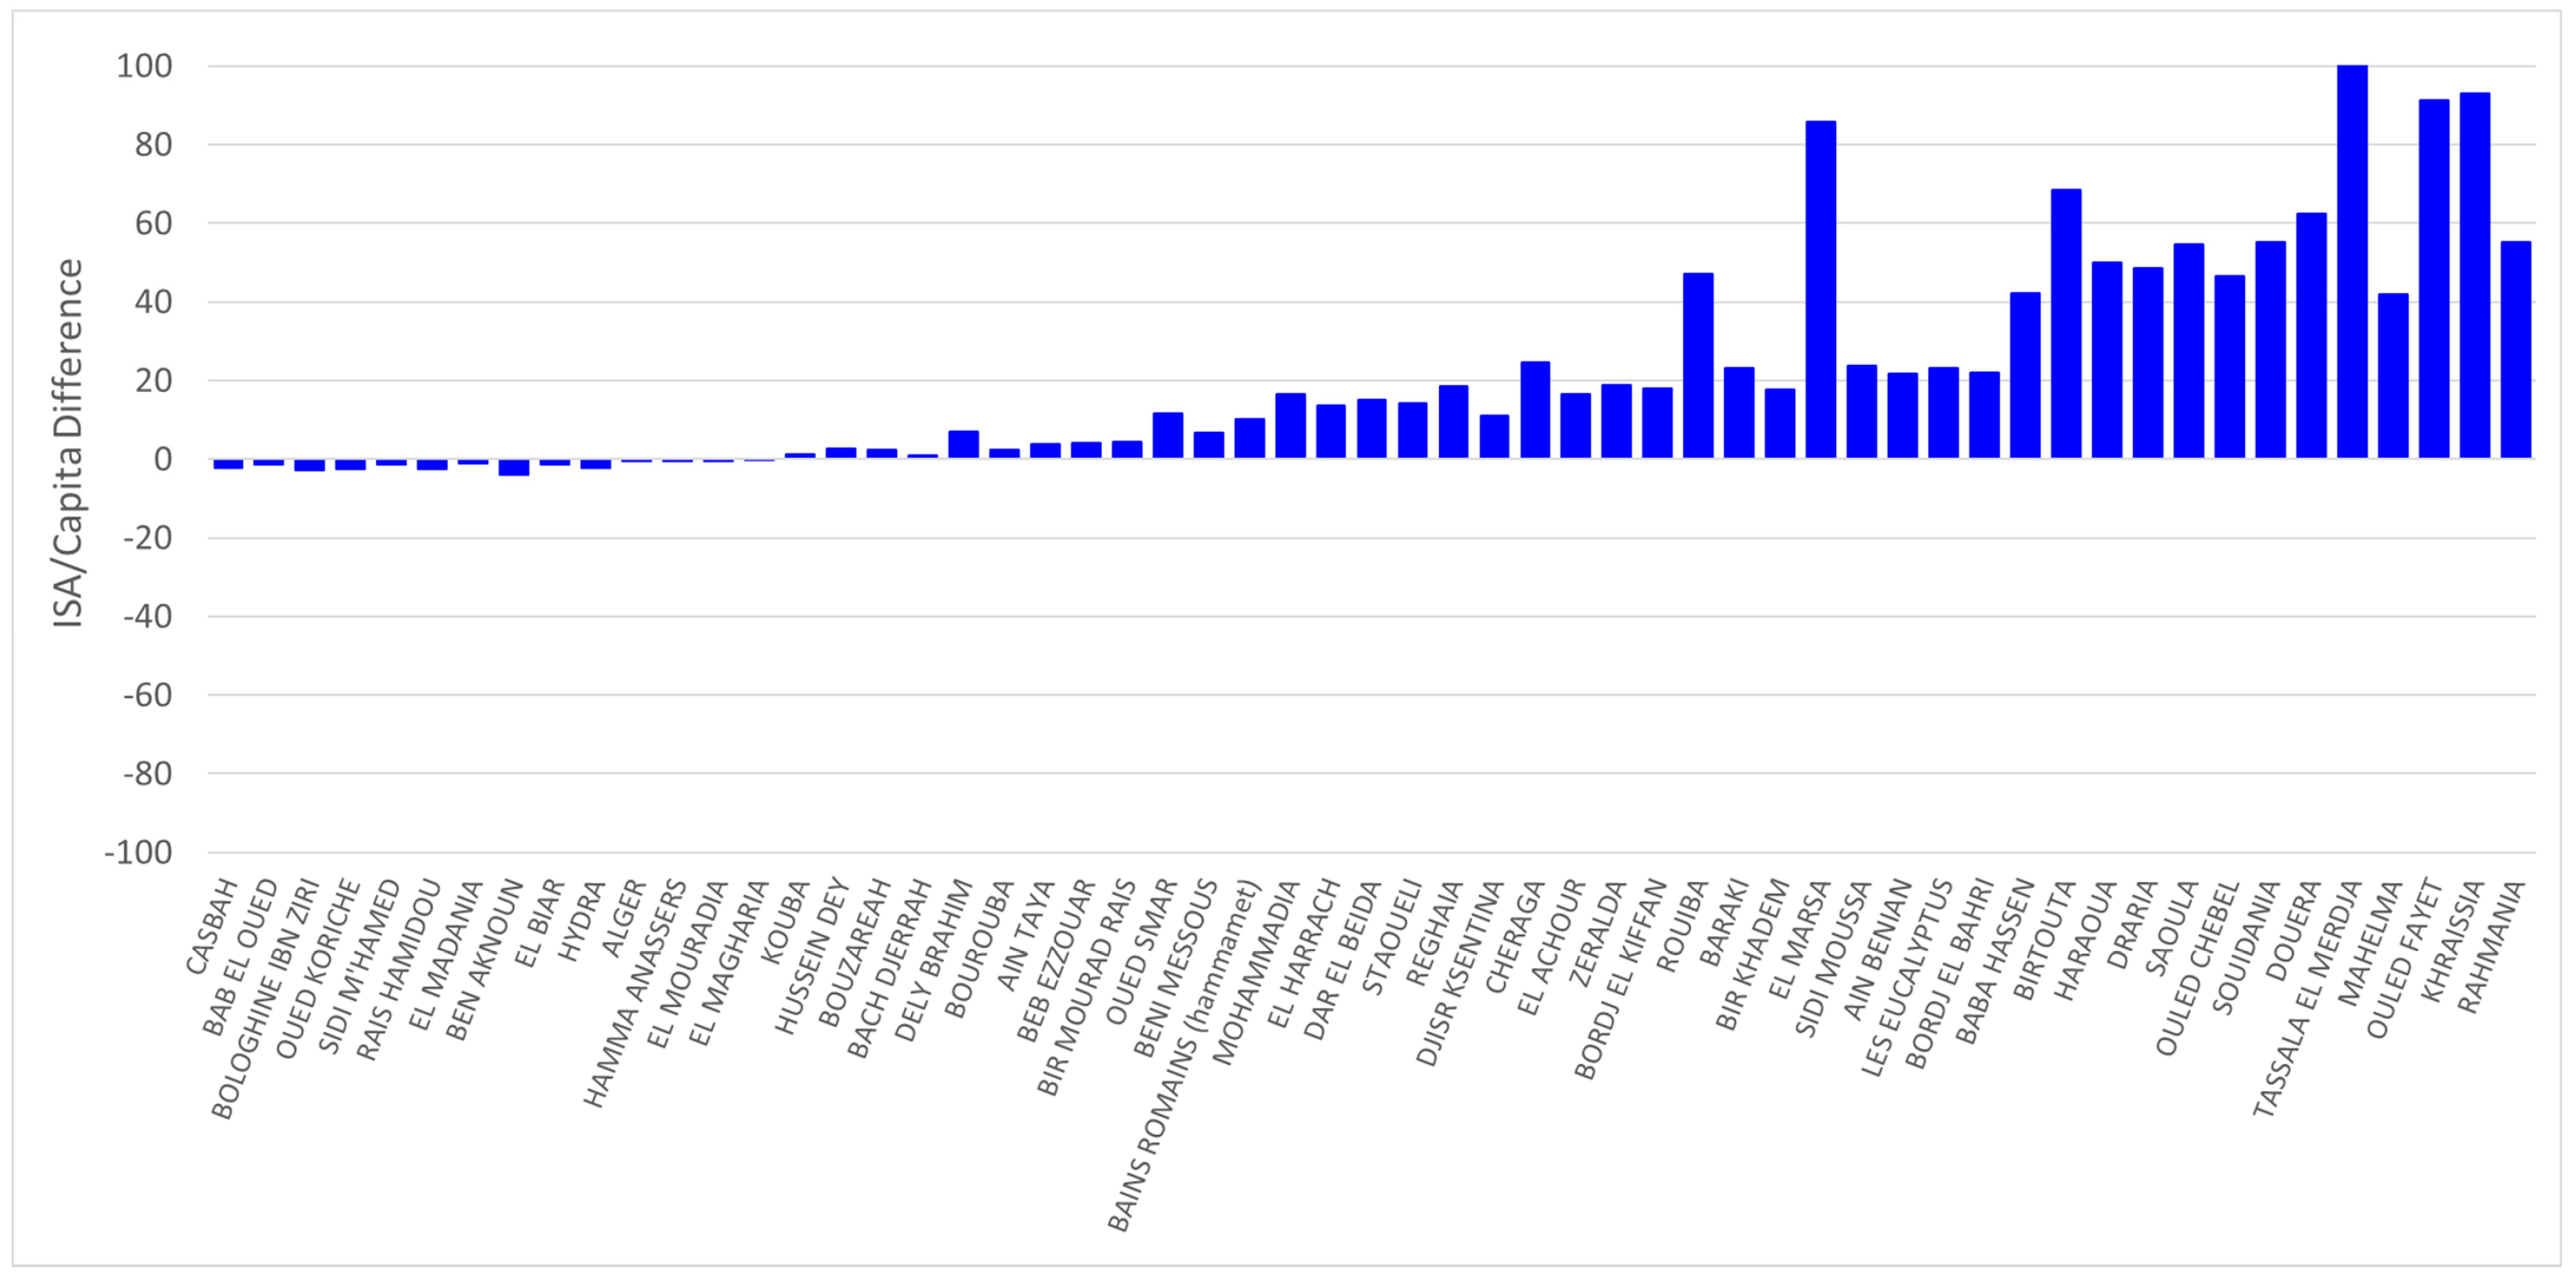
To further assess this tendency, we analyzed the ISA per capita change between 2008 and 2018. The ISA per capita precisely describes the footprint of each individual inhabitant of the urban area and includes all impervious surfaces making up the artificial ground. Figure 15 shows that all the 14 communes with an SDG indicator value of less than 1 had a reduction in ISA per capita. Knowing that the ISA did not decrease in any of these communes (Figure 13), a decrease in ISA per capita points to an increase in population. While the indicators suggest a tendency towards sustainability, the reality on the ground suggests otherwise. In these urban areas where population growth exceeds urban land growth, there will be overcrowding, with more people than what the urban land can support, an aspect neither the SDG 11.3.1 nor the ISA per capita indicator captures. This result, in addition to the limitations listed in Bounoua et al. [15], makes SDG 11.3.1 incomplete for the determination of sustainable urbanization.

3.4. The Wilaya of Annaba

The wilaya of Annaba is located in the extreme east of Algeria about 600 km away from its capital of Algiers. It is a coastal province on the Mediterranean Sea and has 12 communes. With a population of about 600,000 inhabitants in 2008, it is considered the fourth most important locality in Algeria. Annaba, the seat and capital of the wilaya, like most other northern Algeria cities, is marked with different models of urban fabrics: the Medina, the colonial sector, the modern post-colonial parts, and the informal slums. This structure makes the commune of Annaba fragmented, with the inner Medina the least integrated [33]. Annaba has a metropolitan area with a higher population density than the other metropolises on the Algerian coastline, such as Tlemcen, Oran, and Algiers. Between 2008 and 2018, the wilaya population increased by 20.54%, but the ISA increased by 40.13 km
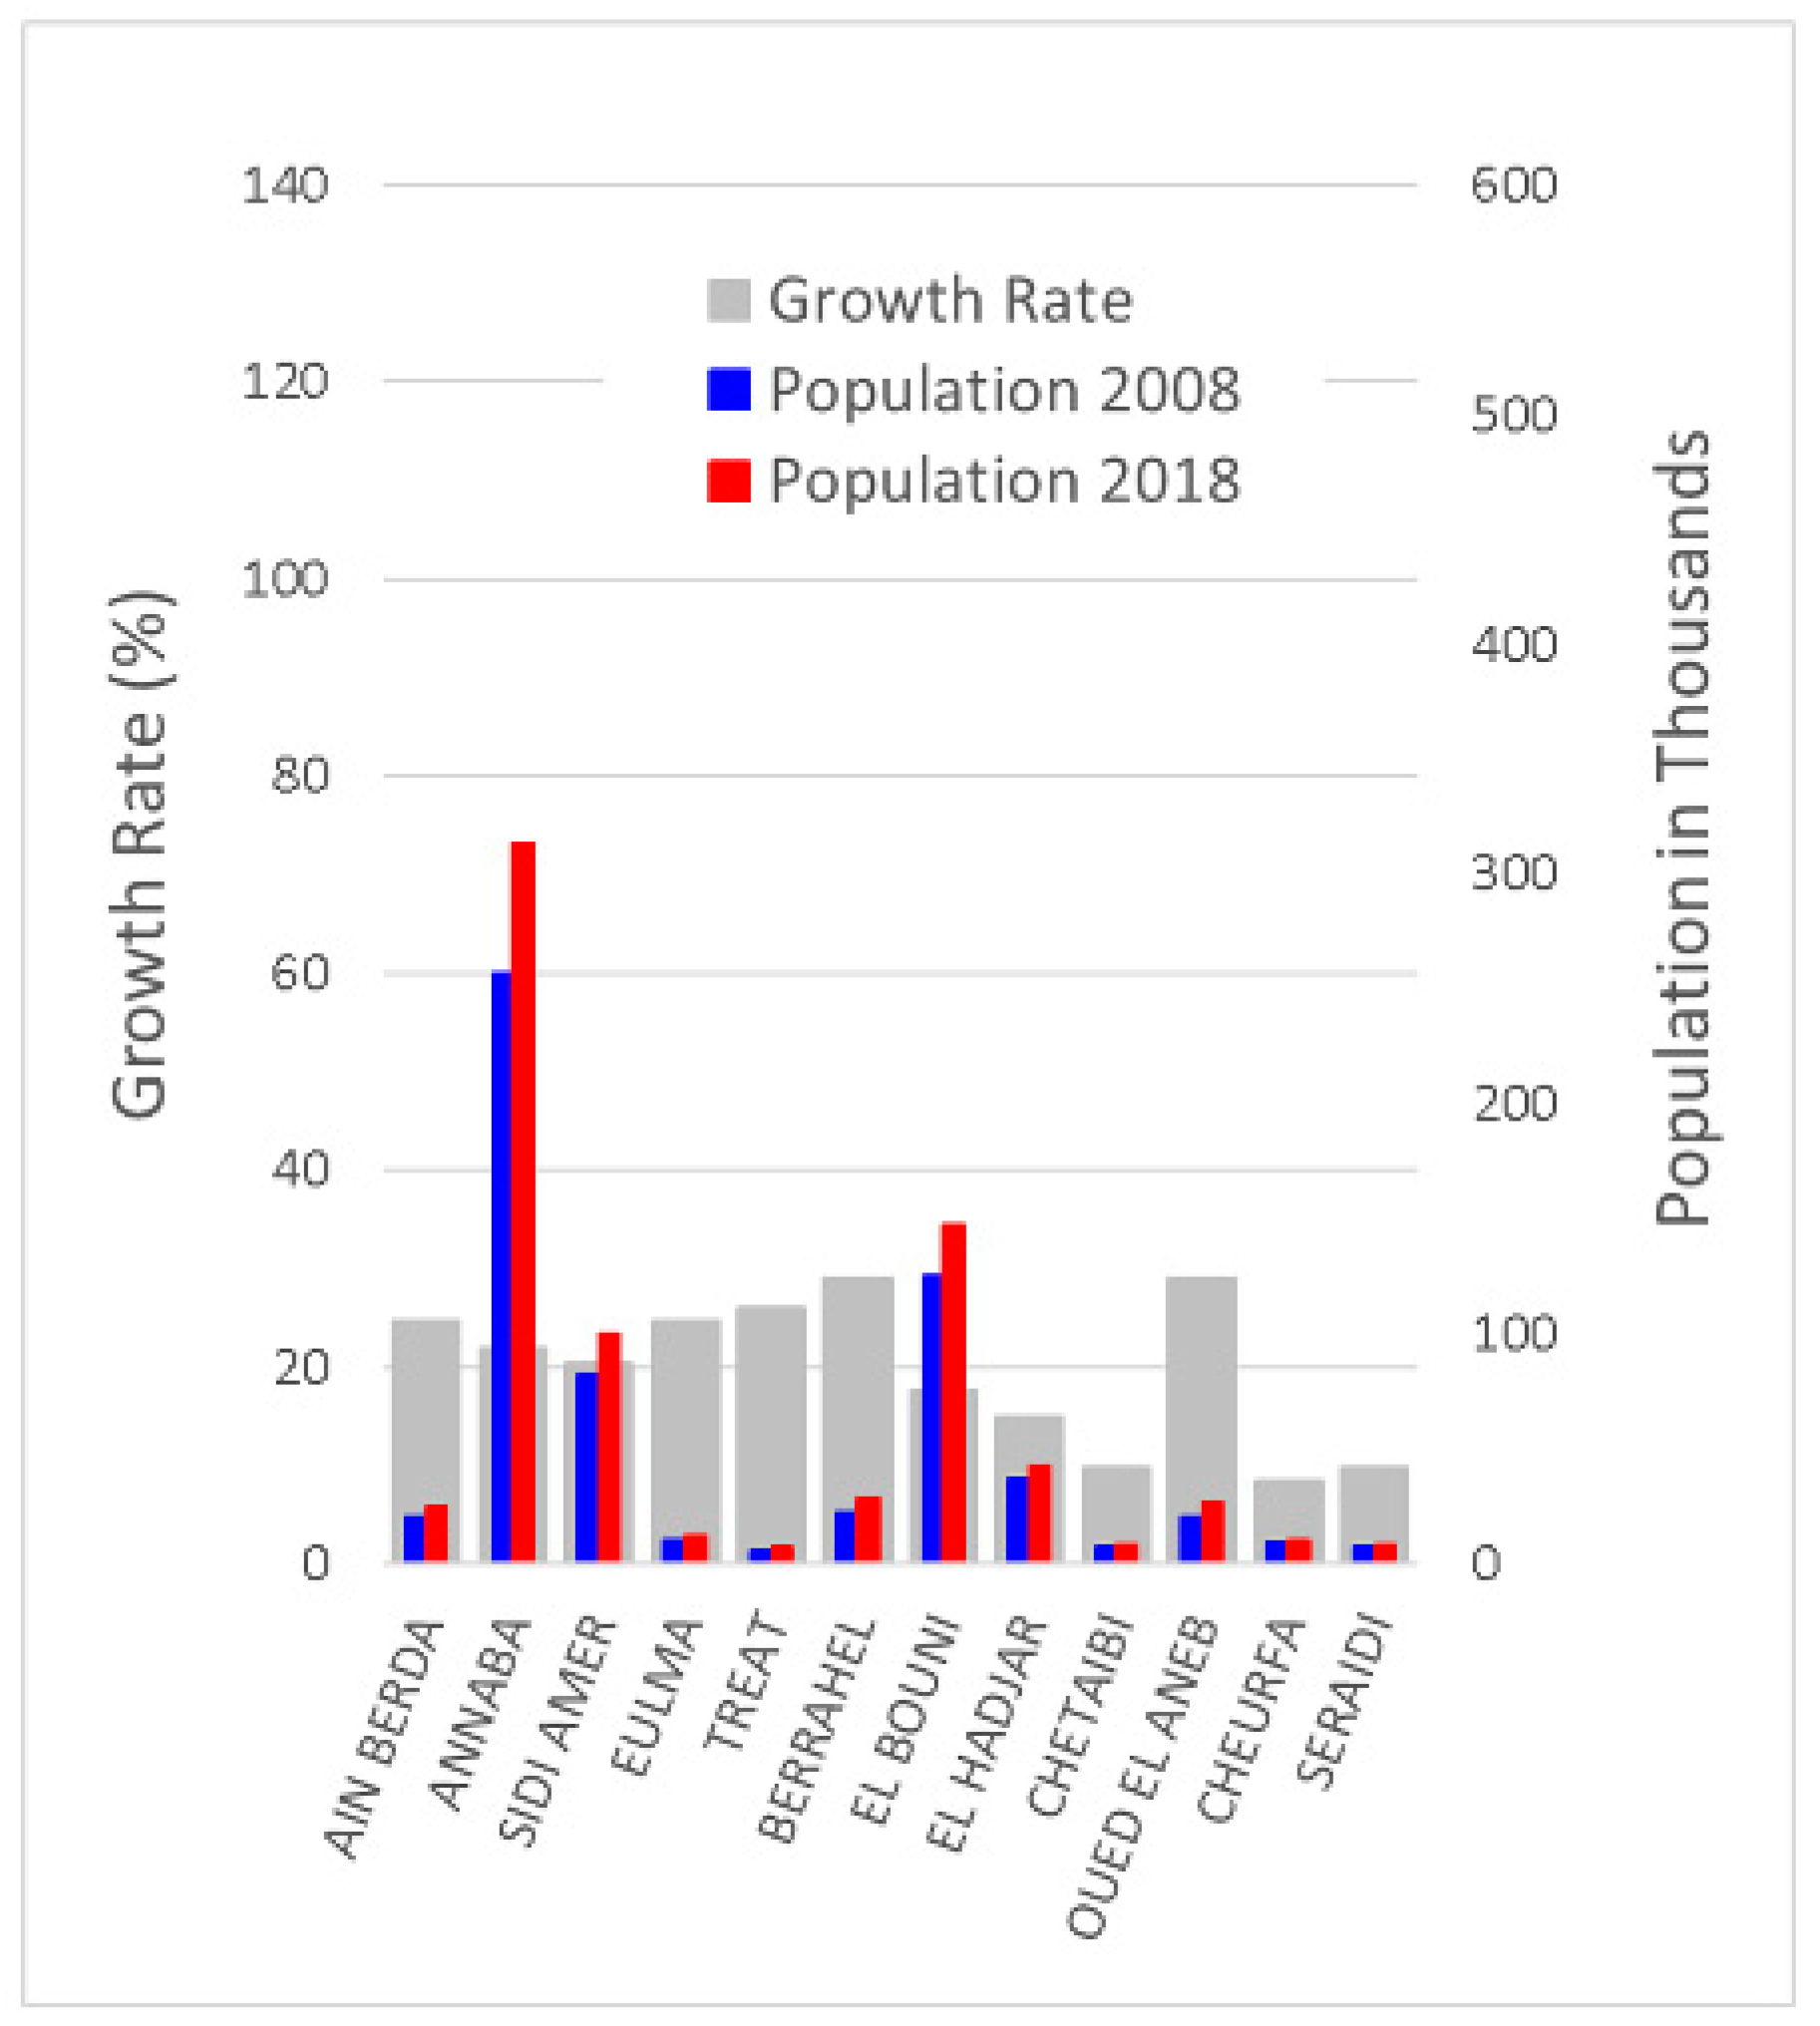
2 or 49.5%. The population distribution for the wilaya of Annaba is uneven between its communes, as can be seen in 
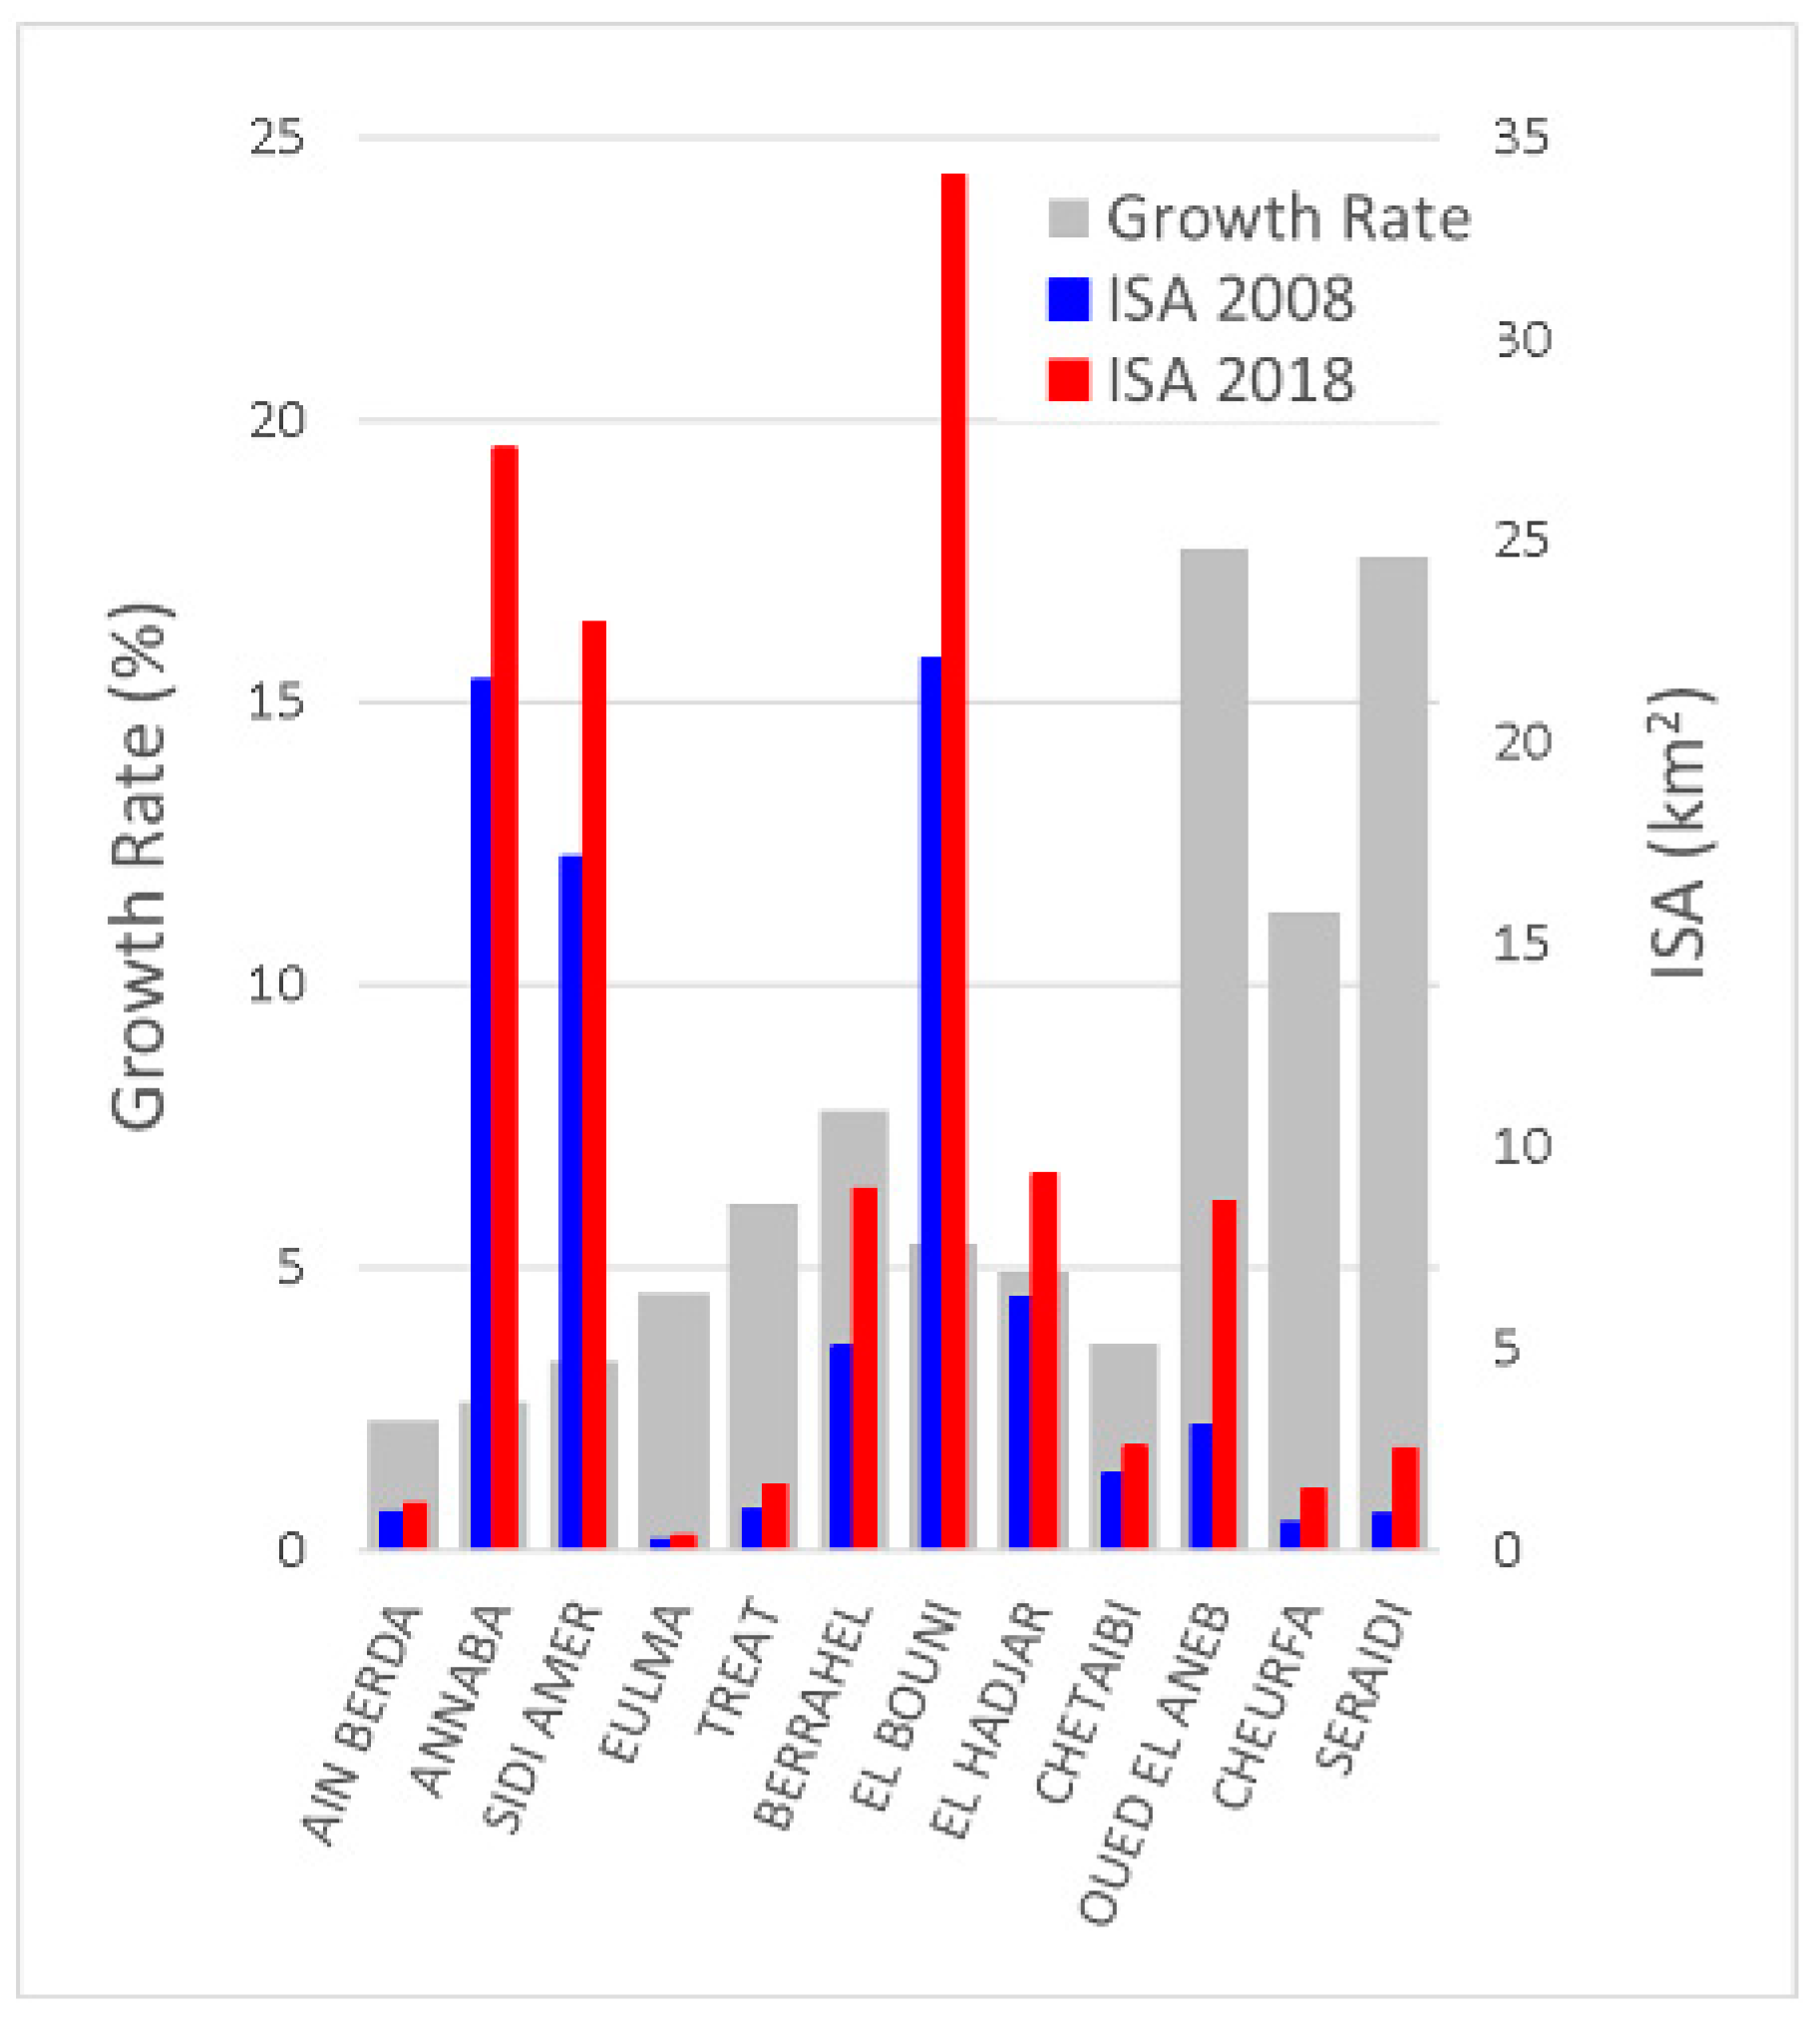
Figure 16. Its 2018 population of 734,468 is basically concentrated in three large communes of Annaba, which represents 43% of the total population, and El Bouni and Sidi Amer, accounting for 20% and 14%, respectively. For the remaining communes, except for El Hadjar, with little more than 42,000 inhabitants, all have a population count of less than 30,000. All the communes have had a significant growth rate varying between 8.5% and 29%. In contrast to the population, the ISA growth rate in the wilaya of Annaba was important in the smaller communes with smaller population sizes, with the largest growth occurring in the commune of Oued El Aneb, where the ISA increased from 3.12 km2 in 2008 to 8.65 km2 or 17.72% (Figure 17). The large discrepancies in growth rates between population and urban land consumption is the core issue addressed by the SDG 11.3.1 that, as a whole, should provide a metric to monitor the harmonious growth of population and land consumption for urban purposes. The least one can say is that the evolution of these quantities is not homogenous across communes and not sustainable in mid- to long-term timeframes for the wilaya of Annaba. 
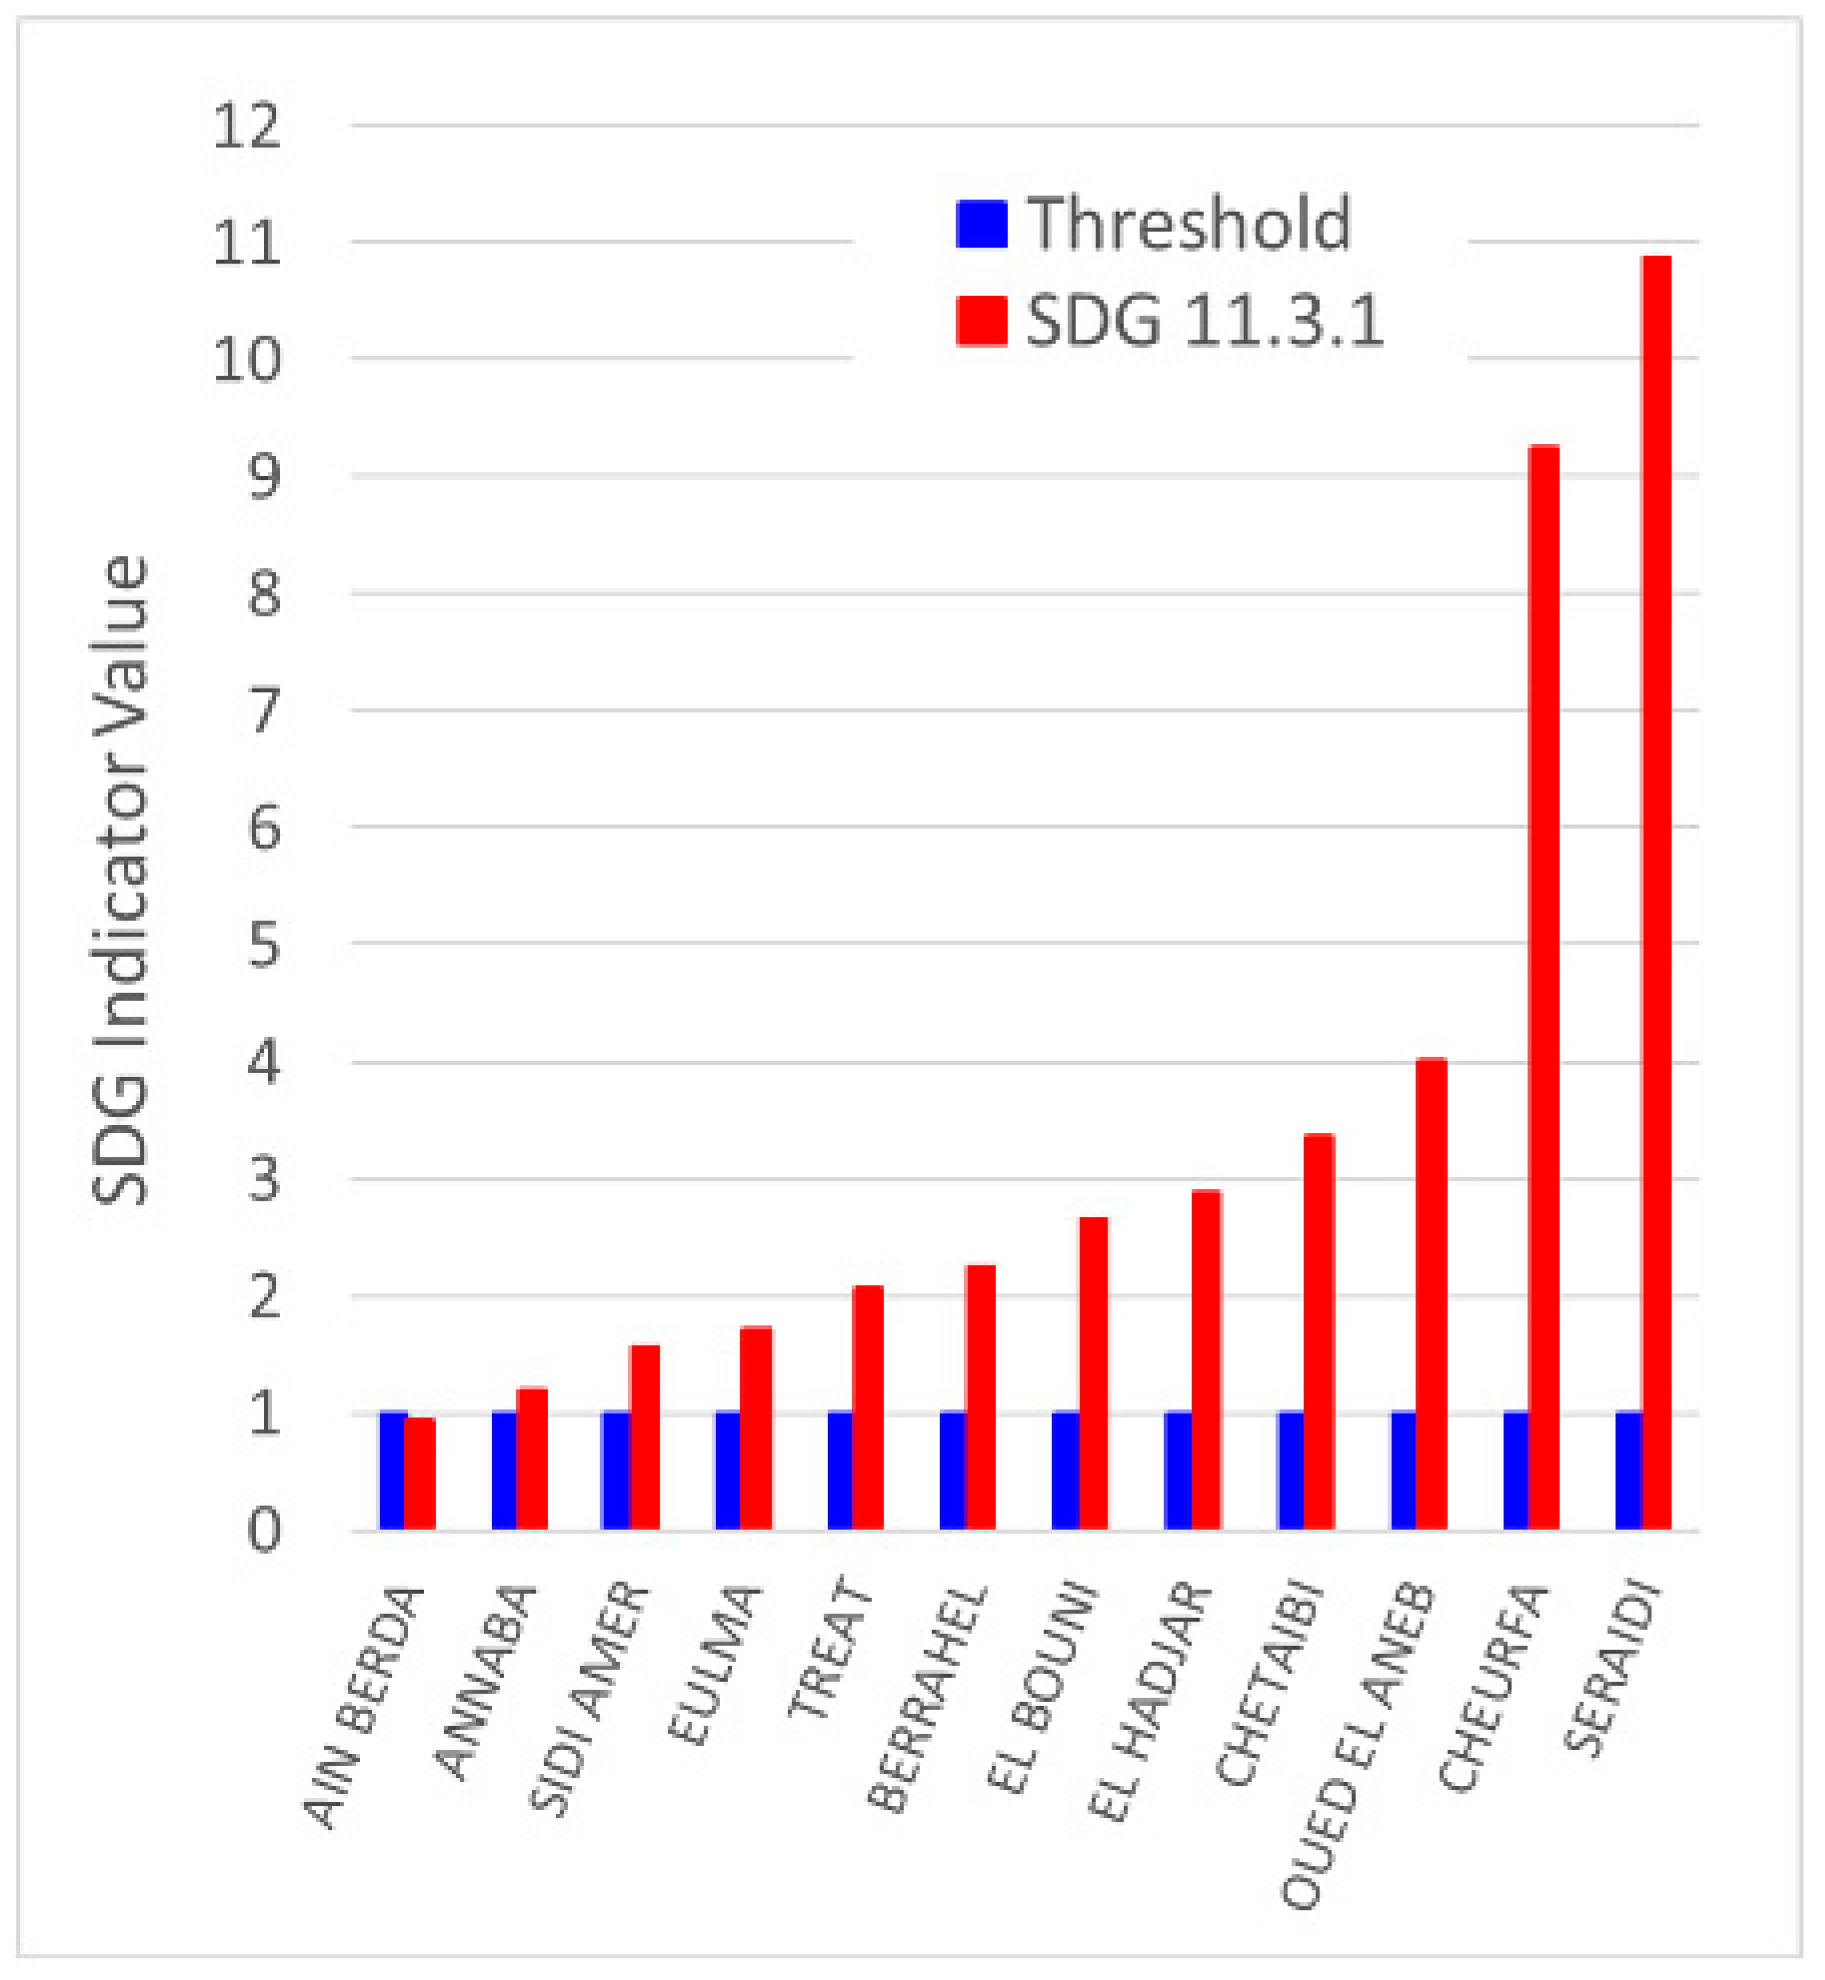
Figure 18 shows the distribution of the SDG 11.3.1 indicator for the communes of the wilaya, and except for the commune of Ain Berda, where the indicator is less than unity, all other communes have consumed urban lands at a rate faster than population growth. Indeed, while the wilaya of Annaba is expanding its tourism infrastructure mainly in the urban area of the Annaba commune, other tourism-related projects are expanding in the commune of Seraidi, which appears to have an explosive built-up growth rate. The SDG indicates that, except for Ain Berda, all communes have an urban land use that is much higher than their population growth rate and are, therefore, developing away from sustainability.
While economic development is high in Algeria in general, especially in some prime coastal wilayas encouraging tourism infrastructure, it must consider a rational land-use policy where regulation of land tenure and use is applied. At the pace observed between 2008 and 2018, the land use in the communes of Annaba will reach saturation, and further expansion must be considered, often at the expense of vegetated lands. Verticality is an option to reduce the population footprint, but here, too, caution must be taken to avoid overcrowding and maintain sustainable living. Similar to other wilayas, the ISA per capita has decreased for the commune, where the SDG 11.3.1 indicator was less than unity but has increased significantly elsewhere, with the highest per capita land-use increase of 169.86 and 183.58 m2/person recorded in Oued El Aneb and Seraidi, respectively.

3.5. The Wilaya of Ghardaïa

The wilaya of Ghardaia is located in the northern part of the Sahara Desert. It contains the valley of M’Zab, distinguished by architecture designed for community life with respect to family structures while perfectly adapting to the arid environment. The wilaya is composed of 13 communes and spans an area of 86,560 km2. The unique layout of construction in Ghardaia is constrained by the rocky landscape and the M’Zab River. Houses are often laid in alleyways in the form of labyrinths and are oriented towards sunlight. The fabric of the urban areas consists of housing, mosques, and marketplaces.
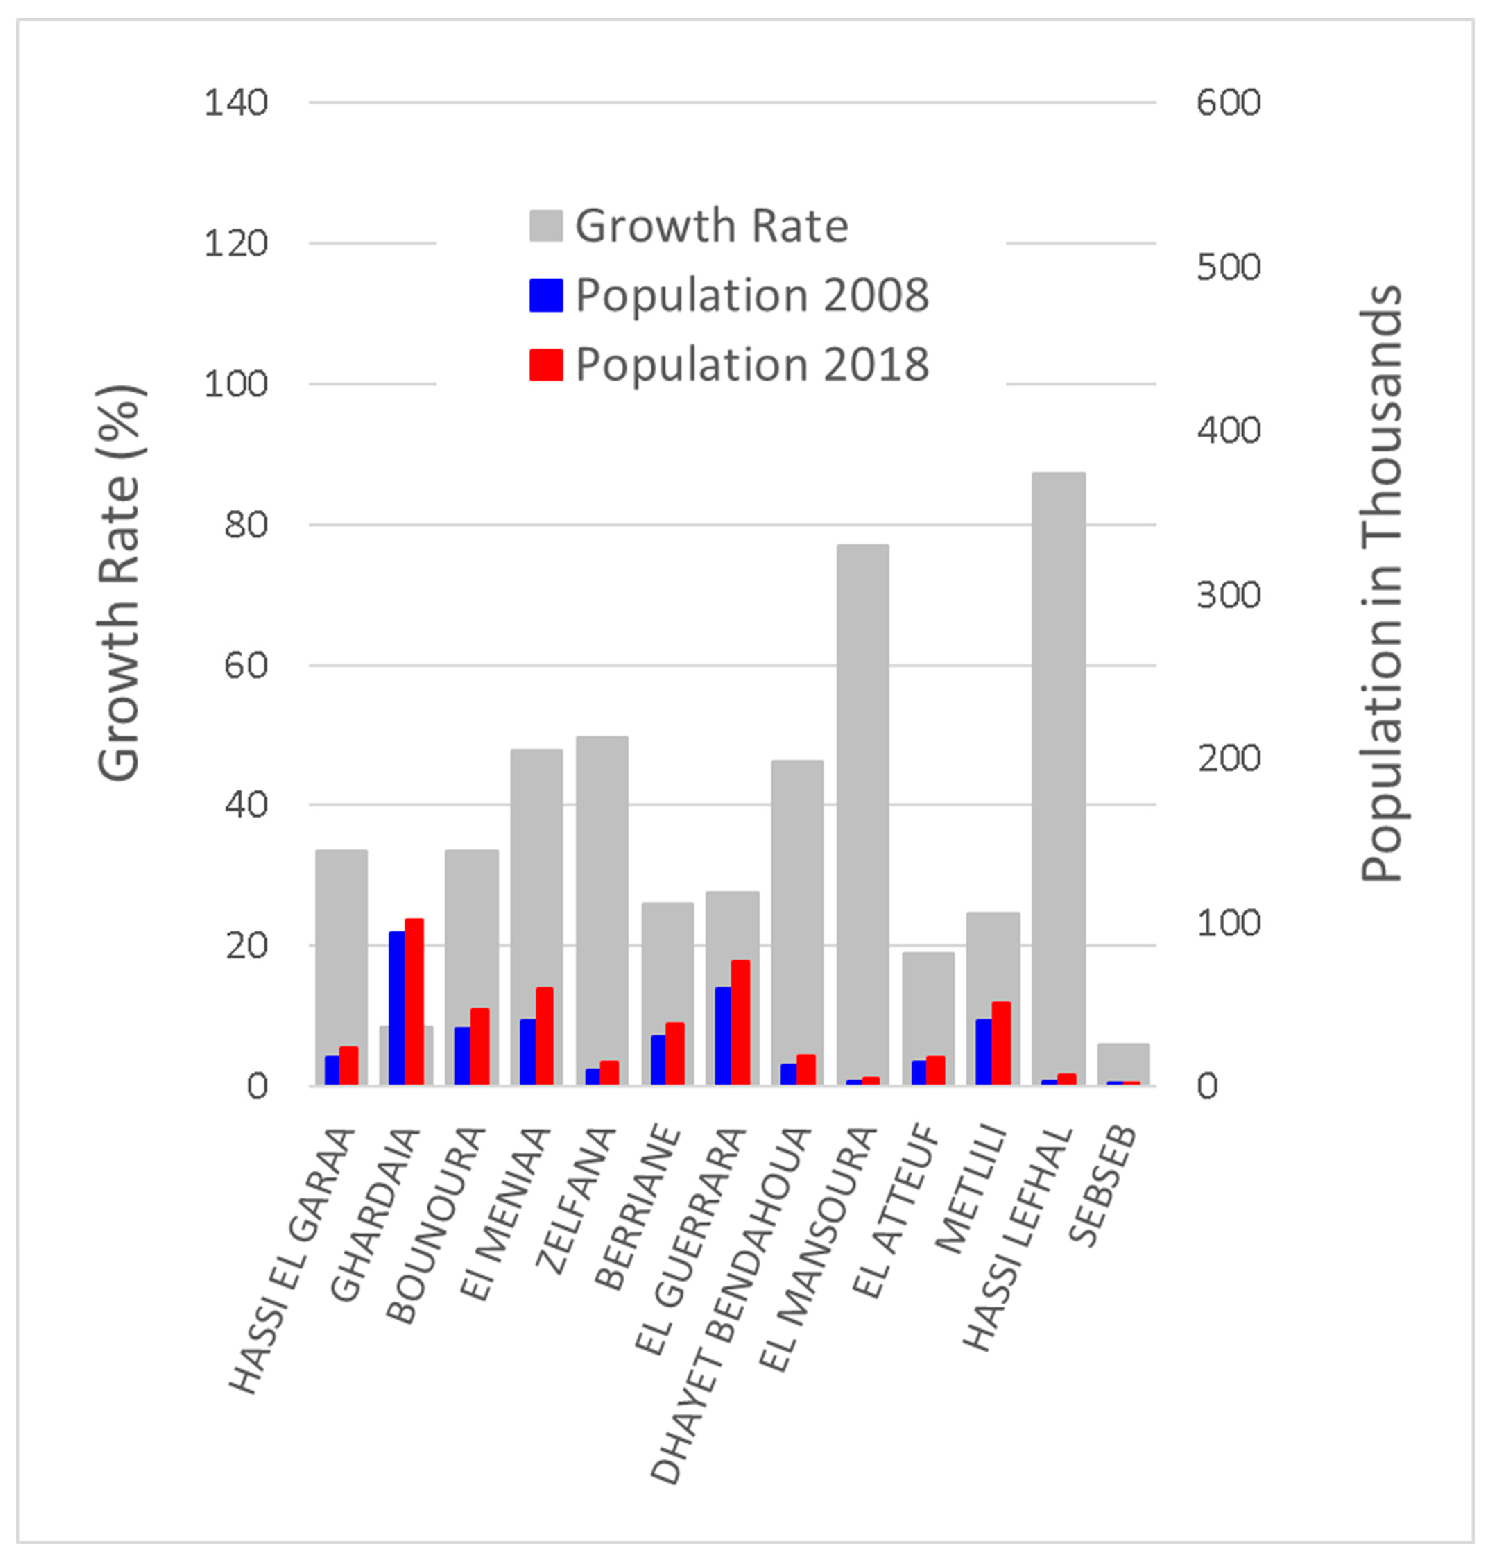
The commune of Ghardaia is the capital of the wilaya and represents the most populated commune (
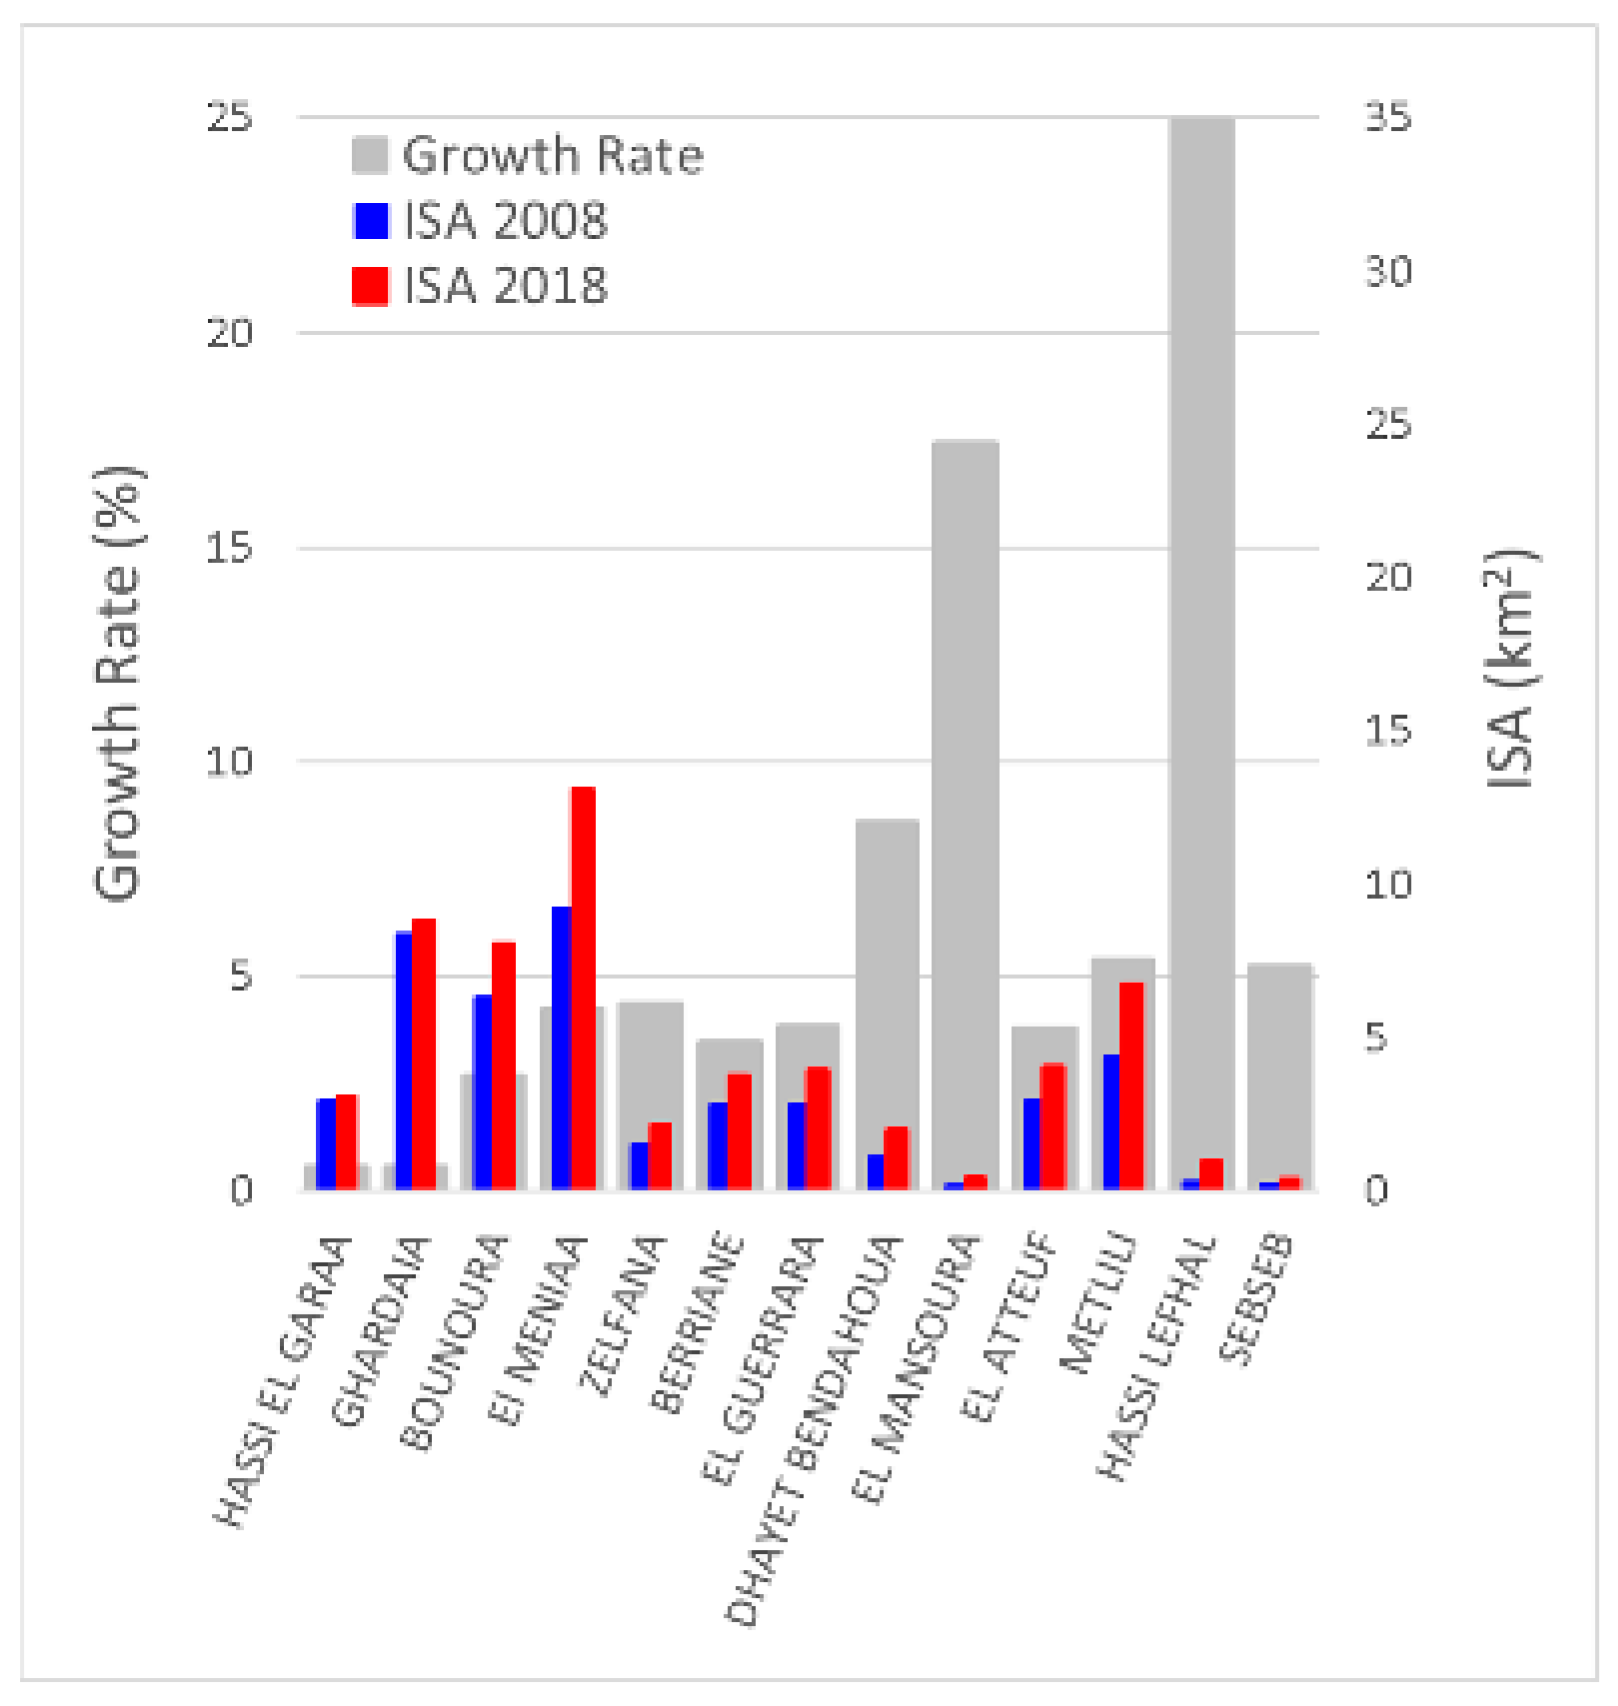
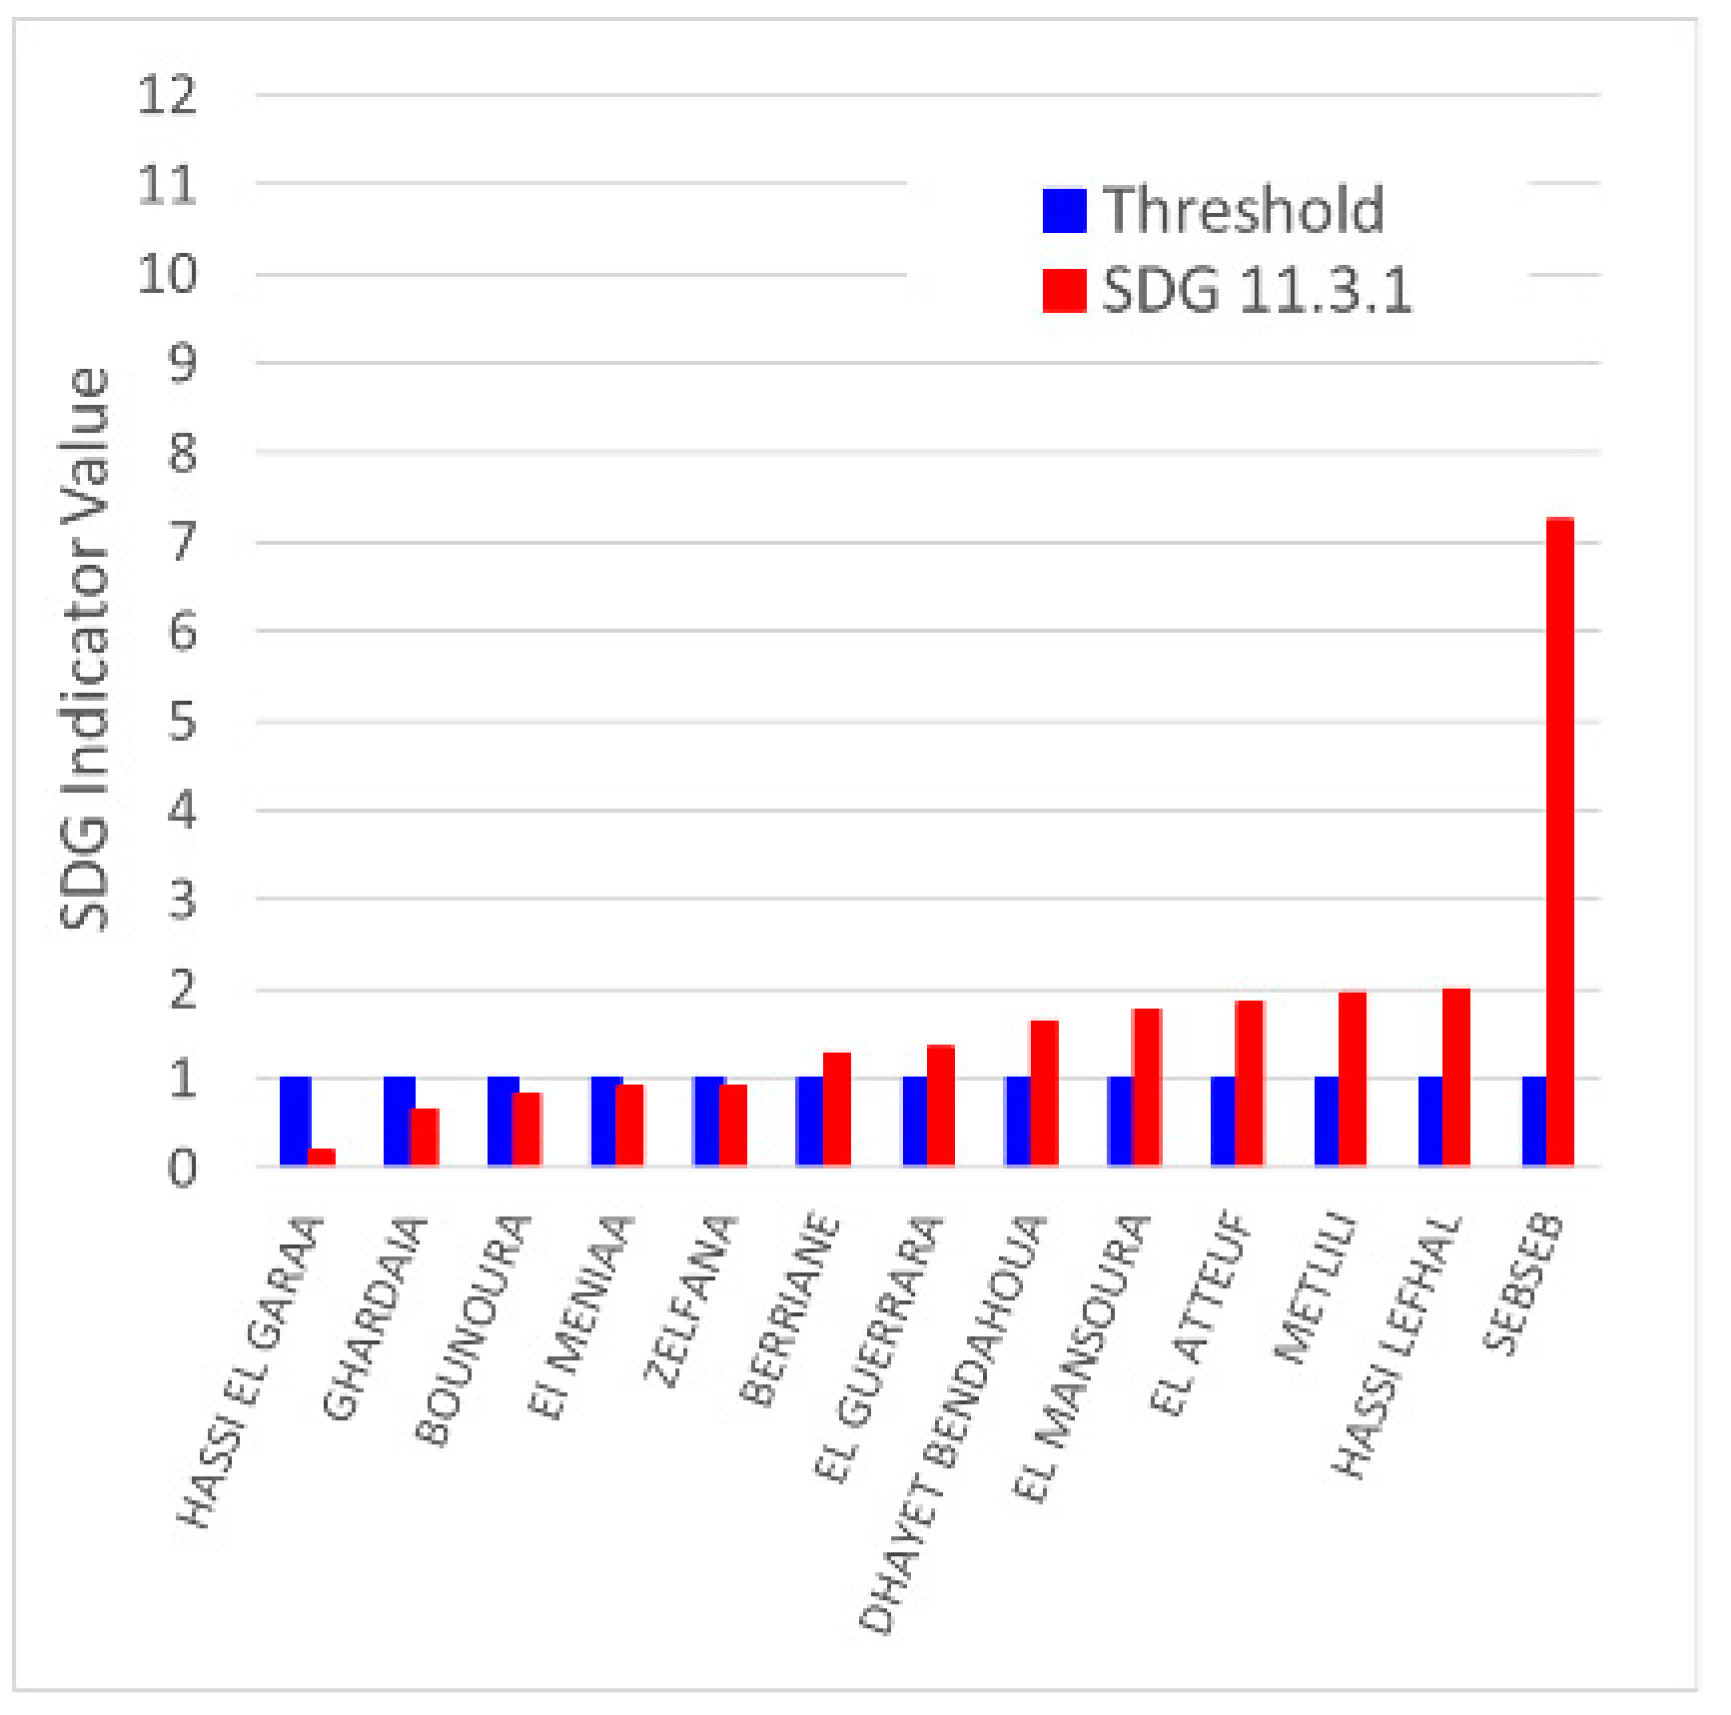
Figure 19). In 2008, it had 93,423 inhabitants, which increased to 101,374 in 2018. On the other hand, the commune of Sebseb is the least populated, with only 2437 inhabitants in 2008. The population growth rates varied between about 25% and 87%, with only two communes having a growth rate of less than ten. The commune of Hassi Lefhal recorded the highest population growth rate in the wilaya at 87.18% between 2008 and 2018. The wilaya of Ghardaia is small in terms of population count, as it had only 363,598 inhabitants in 2008. However, the impact of this population growth on land use is significant, as shown in Figure 20, especially in smaller communes where the built-up area increased by up to 174.2% in El Mansoura and up to 249.7% in Hassi Lefhal. The SDG 11.3.1 indicator shows that the communes of Ghardaia are not homogeneous in terms of development. While five communes follow a sustainable development path with indictor values much less than unity, others (seven communes) have indicator values ranging from about 1.3 to 2, suggesting a development away from sustainability with varying degrees of severity. The commune of Sebseb, however, which had an increase in urban land use of 52.3% and a population growth rate of only 5.99%, measured an indicator value of 7.24, clearly signifying that the development is not sustainable (Figure 21).

4. Concluding Remarks

The fast population growth in Algeria indicates that several urban areas located in different wilayas are poised to become metropolises. Furthermore, most of the large urban centers of Algeria present an unbalanced distribution of modern cities, ancient medinas, and peripheral slums, a situation quite representative of many large urban areas of emerging countries. Based on the wilayas selected for this study, it appears that most do not follow a strict agenda of sustainable development concerning land consumption for urban purposes. Successive realignment, redistricting, and territorial rearrangements have allowed for sprawls to occur in many small communes where land consumption is increasing well beyond population growth, creating a clearly unsustainable situation. Redistricting has favored the western wilayas of Tlemcen and Oran to spread their thin population over large, mostly rural areas. The wilaya of Algiers, the most populous of the country, has experienced a population explosion in its peripheral communes with a land-use pattern incommensurable to the population growth. This is a general trend in coastal wilayas, where a large part of the population resides. For example, results show that in the wilaya of Annaba, only one commune follows a sustainable development path out of twelve. Even in Ghardaia, an arid wilaya in central Algeria, the land-use pattern is not much different from that of the northern wilayas. This is the result of a country-wide, rapid increase in population, a growth rate of 303.4% over the 1961–2021 period [28], and a lack of regulation or strict application of established policies.
Despite the many efforts deployed by the government to stabilize rural exodus and to regulate land use in the territories, urban planning is far from an adapted tool applied to manage land consumption by the population and address environmental, economic, and social issues in urban development, as defined by the United Nations framework. The post-2015 development agenda of the United Nations General Assembly (UNGA) adopted a program (2015–2030) on a worldwide framework for the implementation of 17 SDGs having 169 specific targets [7], with SDG 11 dedicated to sustainable urban areas and communities and the indicator SDG 11.3.1 to measure the sustainable development in urban areas. The 2030 Agenda has been accepted by Algeria, and according to its terms, it will adapt it to its needs while ensuring available data for international comparison. While some studies have examined the differences in sustainability between different cities [34], our study shows that the conditions needed to promote the sustainability of metropolises and cities are not generally being met. We suggest that policies be developed and applied to land use in urban areas in order to limit urban spawl, regulate the amount of ISA per capita, and wisely distribute impervious surfaces among housing units, business buildings, marketplaces, schools, roads and parking lots, and green spaces. A notion often neglected in urban planning is the environment and surface climate. Through the process of photosynthesis, urban trees play a fundamental role in modulating surface climate and mitigating the urban heat-island phenomenon and therefore must be a necessary component of any urban setting. Studies have found that the choice and amount of tree species in urban settings play a commanding role in controlling the urban area surface temperature and bringing thermal comfort to inhabitants [35].

Author Contributions

Conceptualization, L.B. and N.B.; methodology, L.B., N.B., J.N. and H.S.; software, L.B., N.B. and J.N.; validation, N.B., H.S., H.B., S.L. and J.N.; formal analysis, L.B., N.B., J.N. and H.S.; investigation, L.B., N.B., J.N., H.S., H.B., S.L., K.T. and M.Y.K.; resources, L.B. and K.T.; data curation, N.B. and J.N.; writing—original draft preparation, L.B., N.B. and J.N.; writing—review and editing, J.N., N.B., L.B., H.S., H.B., S.L., M.Y.K. and K.T.; visualization, N.B. and J.N.; supervision, L.B.; project administration, L.B.; funding acquisition, K.T. and L.B. All authors have read and agreed to the published version of the manuscript.

Funding

This research received no external funding.

Data Availability Statement

The data presented in this study are openly available in the public domain. Satellite data-based impervious data come from http://data.ess.tsinghua.edu.cn/gaia.html (accessed on 26 April 2022). Population data can be found at https://www.ons.dz (accessed on 16 December 2022), https://www.worlddata.info/africa/algeria/populationgrowth.php (accessed on 16 December 2022), and https://populationstat.com/algeria/algiers (accessed on 16 December 2022). Administrative unit vectors come from https://data.humdata.org/dataset/cod-ab-dza? (accessed on 26 January 2021).

Conflicts of Interest

The authors declare no conflict of interest.

References

  1. Alliance 2015—Global Hunger Index. 2013. Available online: https://www.globalhungerindex.org/algeria.html (accessed on 7 February 2023).
  2. Algeria Urban Population 1960–2022. 2022. Available online: https://www.macrotrends.net/countries/DZA/algeria/urban-population (accessed on 6 December 2022).
  3. Gherbi, M. Instruments of Urban Planning in Algerian Cities: Realities and Challenges. J. Civ. Eng. 2015, 9. [Google Scholar] [CrossRef]
  4. Zhao, S.; Zhou, D.; Zhu, C.; Sun, Y.; Wu, W.; Liu, S. Spatial and Temporal Dimensions of Urban Expansion in China. Environ. Sci. Technol. 2015, 49, 9600–9609. [Google Scholar] [CrossRef] [PubMed]
  5. Xiong, Y.; Pan, R.; Xu, G.; Jiao, L.; Li, K. A comparison of spatial and temporal characteristics of urban expansion in India during 1990–2014. Prog. Geogr. 2019, 38, 271–282. [Google Scholar] [CrossRef]
  6. Bounoua, L.; Nigro, J.; Zhang, P.; Lachir, A.; Thome, K. Mapping Urbanization in the United States from 2001–2011. Appl. Geogr. 2018, 90, 123–133. [Google Scholar] [CrossRef]
  7. UN Department of Economic and Social Affairs—Statistics Division. SDG Indicator Metadata. 2021. Available online: https://unstats.un.org/sdgs/metadata/files/Metadata-11-03-01.pdf (accessed on 27 January 2023).
  8. Yamani, L.; Trache, S.M. Contournement des instruments d’urbanisme dans l’urbanisation de l’agglomération mostaganémoise (Algérie). Cybergeo Eur. J. Geogr. 2020, 943. [Google Scholar] [CrossRef]
  9. Kateb, K. Population et organisation de l’espace en Algérie. Espace Geogr. 2003, 4, 311–331. [Google Scholar] [CrossRef]
  10. Schiavina, M.; Melchiorri, M.; Corbane, C.; Florczyk, A.J.; Freire, S.; Pesaresi, M.; Kemper, T. Multi-Scale Estimation of Land Use Efficiency (SDG 11.3.1) across 25 Years Using Global Open and Free Data. Sustainability 2019, 11, 5674. [Google Scholar] [CrossRef] [Green Version]
  11. Melchiorri, M.; Pesaresi, M.; Florczyk, A.J.; Corbane, C.; Kemper, T. Principles and Applications of the Global Human Settlement Layer as Baseline for the Land Use Efficiency Indicator—SDG 11.3.1. ISPRS Int. J. Geo-Inf. 2019, 8, 96. [Google Scholar] [CrossRef] [Green Version]
  12. Mudau, N.; Mwaniki, D.; Tsoeleng, L.; Mashalane, M.; Beguy, D.; Ndugwa, R. Assessment of SDG Indicator 11.3.1 and Urban Growth Trends of Major and Small Cities in South Africa. Sustainability 2020, 12, 7063. [Google Scholar] [CrossRef]
  13. Laituri, M.; Davis, D.; Sternlieb, F.; Galvin, K. SDG Indicator 11.3.1 and Secondary Cities: An Analysis and Assessment. ISPRS Int. J. Geo-Inf. 2021, 10, 713. [Google Scholar] [CrossRef]
  14. UN-Habitat. Sustainable Development Goal 11 Make Cities and Human Settlements Inclusive, Safe, Resilient and Sustainable: A Guide to Assist National and Local Governments to Monitor and Report on SDG Goal 11 Indicators. 2018. Available online: https://smartnet.niua.org/sites/default/files/resources/sdg_goal_11_monitoring_framework.pdf (accessed on 7 February 2023).
  15. Bounoua, L.; Fathi, N.; El Berkaoui, M.; El Ghazouani, L.; Messouli, M. Assessment of Sustainability Development in Urban Areas of Morocco. Urban Sci. 2020, 4, 18. [Google Scholar] [CrossRef] [Green Version]
  16. Population Density and Urbanization. 2017. Available online: https://unstats.un.org/unsd/demographic/sconcerns/densurb/densurbmethods.htm (accessed on 6 December 2022).
  17. Open Street Map Algeria-190101.osm.pbf. Available online: http://download.geofabrik.de/africa/algeria.html# (accessed on 4 May 2022).
  18. Tsinghua University. Finer Resolution Observation and Monitoring, Global Land Cover. 2019. Available online: http://data.ess.tsinghua.edu.cn/gaia.html (accessed on 23 August 2022).
  19. Gong, P.; Li, X.; Wang, J.; Bai, Y.; Chen, B.; Hu, T.; Liu, X.; Xu, B.; Yang, J.; Zhang, W.; et al. Annual maps of global artificial impervious area (GAIA) between 1985 and 2018. Remote Sens. Environ. 2020, 236, 111510. [Google Scholar] [CrossRef]
  20. Khaledmoulai29, CC BY-SA 4.0. Available online: https://upload.wikimedia.org/wikipedia/commons/0/0a/Tlemcen_from_Top.jpg (accessed on 23 August 2022).
  21. Bakinounas, CC BY-SA 4.0. Available online: https://upload.wikimedia.org/wikipedia/commons/2/2b/Oran_algeria.jpg (accessed on 23 August 2022).
  22. Via Wikimedia Commons. Available online: https://upload.wikimedia.org/wikipedia/commons/8/8c/Argel_3.jpg (accessed on 23 August 2022).
  23. Jose, A. CC BY 2.0. Available online: https://commons.wikimedia.org/wiki/File:Annaba_(Argelia)_(38925061635).jpg (accessed on 23 August 2022).
  24. Dan, S. CC BY-SA 2.0. Available online: https://commons.wikimedia.org/wiki/File:Ville_de_Ghardaia.png (accessed on 23 August 2022).
  25. Algeria. Available online: https://www.nationsonline.org/oneworld/algeria.htm (accessed on 6 December 2022).
  26. Office National des Statistiques. 2008 Recensement Général de la Population et de l’Habitat (RPGH). 2022. Available online: https://www.ons.dz/collections/ (accessed on 6 December 2022).
  27. Office National des Statistiques, 2018 Estimation de la Population et de l’Habitat (RPGH). 2022. Available online: https://www.ons.dz/spip.php?rubrique182 (accessed on 6 December 2022).
  28. World Data. 2020. Available online: https://www.worlddata.info/africa/algeria/populationgrowth.php (accessed on 6 December 2022).
  29. Population Stat: World Statistical Data. 2022. Available online: https://populationstat.com/algeria/algiers (accessed on 6 December 2022).
  30. Numbeo 2009–2023. Property Prices in Algiers, Algeria. Available online: https://www.numbeo.com/property-investment/in/Algiers (accessed on 7 February 2023).
  31. Zakaria, A. Étude Comparative de la Durabilité du Développement Urbain dans les Villes du Maroc: Cas de Laayoune et de Tanger. Mémoire de Stage de Fin d’Etudes. Master’s Thesis, Universite Cadi Ayyad of Marrakech (UCAM), Faculty of Sciences Semlalia, Marrkech, Morocco, 2022. [Google Scholar]
  32. Mohamed Amine, N. Réalisation d’un Éco-Quartier. Master’s Thesis, University of Oran, Es Senia, Algeria, 2015. Available online: http://www.secheresse.info/spip.php?article79079 (accessed on 16 December 2022).
  33. Laouar, D.; Mazouz, S.; Teller, J. L’accessibilité spatiale comme indice de fragmentation urbaine dans les villes coloniales. Le cas de la ville d’Annaba. Cybergeo Eur. J. Geogr. 2019. [Google Scholar] [CrossRef]
  34. Liu, J.; Zhao, Y.; Lin, T.; Xing, L.; Lin, M.; Sun, C.; Zeng, Z.; Zhang, G. Analysis of sustainability of Chinese cities based on network big data of city rankings. Ecol. Indic. 2021, 133, 108374. [Google Scholar] [CrossRef]
  35. Bounoua, L.; Zhang, P.; Mostovoy, G.; Thome, K.; Masek, J.; Imhoff, M.; Shepherd, M.; Quattrochi, D.; Santanello, J.; Silva, J.; et al. Impact of urbanization on US surface climate. Environ. Res. Lett. 2015, 10, 084010. [Google Scholar] [CrossRef] [Green Version]
Figure 1. Algerian wilayas (provinces) of Tlemcen, Oran, Algiers, Annaba, and Ghardaia, selected for this study [20,21,22,23,24].
Urbansci 07 00029 g001
Figure 2. Population growth rate of the five wilayas between 2008 and 2018.
Urbansci 07 00029 g002
Figure 3. Population (thousands of persons) and growth rate (%) for the communes in the Tlemcen wilaya between 2008 and 2018.
Urbansci 07 00029 g003
Figure 4. Impervious surface area (ISA) (km2) and its growth rate (1/10 of percent) for the communes in the Tlemcen wilaya between 2008 and 2018.
Urbansci 07 00029 g004
Figure 5. Change in ISA and population growth rates (%) between 2008 and 2018 for the communes with the largest populations in the Tlemcen wilaya.
Urbansci 07 00029 g005
Figure 6. SDG 11.3.1 indicator values for the communes in the Tlemcen wilaya. The constant blue bars represent the value over which the commune develops away from sustainability.
Urbansci 07 00029 g006
Figure 7. Difference of impervious surface area per capita (m2/person) for the communes in the Tlemcen wilaya between 2008 and 2018.
Urbansci 07 00029 g007
Figure 8. Population (thousands of persons) and growth rate (%) for the communes in the Oran wilaya between 2008 and 2018.
Urbansci 07 00029 g008
Figure 9. Impervious surface area (ISA) (km2) and its growth rate (1/10 of percent) for the communes in the Oran wilaya between 2008 and 2018.
Urbansci 07 00029 g009
Figure 10. SDG 11.3.1 indicator values for the communes in the Oran wilaya. The constant blue bars represent the value over which the commune develops away from sustainability.
Urbansci 07 00029 g010
Figure 11. Difference of impervious surface area per capita (m2/person) for the communes in the Oran wilaya between 2008 and 2018.
Urbansci 07 00029 g011
Figure 12. Population (thousands of persons) for the communes in the Algiers wilaya between 2008 and 2018.
Urbansci 07 00029 g012
Figure 13. Impervious surface area (ISA) (km2) and its growth rate (1/10 of percent) for the communes in the Algiers wilaya between 2008 and 2018.
Urbansci 07 00029 g013
Figure 14. SDG 11.3.1 indicator values for the communes in the Algiers wilaya. The constant blue bars represent the value over which the commune develops away from sustainability.
Urbansci 07 00029 g014
Figure 15. Difference of impervious surface area per capita (m2/person) for the communes in the Algiers wilaya between 2008 and 2018.
Urbansci 07 00029 g015
Figure 16. Population (thousands of persons) and growth rate (%) for the communes in the Annaba wilaya between 2008 and 2018.
Urbansci 07 00029 g016
Figure 17. Impervious surface area (ISA) (km2) and its growth rate (1/10 of percent) for the communes in the Annaba wilaya between 2008 and 2018.
Urbansci 07 00029 g017
Figure 18. SDG 11.3.1 indicator values for the communes in the Annaba wilaya. The constant blue bars represent the value over which the commune develops away from sustainability.
Urbansci 07 00029 g018
Figure 19. Population (thousands of persons) and growth rate (%) for the communes in the Ghardaia wilaya between 2008 and 2018.
Urbansci 07 00029 g019
Figure 20. Impervious surface area (ISA) (km2) and its growth rate (1/10 of percent) for the communes in the Ghardaia wilaya between 2008 and 2018.
Urbansci 07 00029 g020
Figure 21. SDG 11.3.1 indicator values for the communes in the Ghardaia wilaya. The constant blue bars represent the value over which the commune develops away from sustainability.
Urbansci 07 00029 g021
Table 1. Selected wilayas and their 2018 population.
ProvinceTlemcenOranAlgiersAnnabaGhardaia
Population1,149,0061,881,2993,333,890734,684462,148
Disclaimer/Publisher’s Note: The statements, opinions and data contained in all publications are solely those of the individual author(s) and contributor(s) and not of MDPI and/or the editor(s). MDPI and/or the editor(s) disclaim responsibility for any injury to people or property resulting from any ideas, methods, instructions or products referred to in the content.

