

Waste Removal Efficiencies of Floating Macrophytes for Restoration of Polluted Stream: An Experimental Analysis

1
Department of Technology, Savitribai Phule Pune University, Pune 411007, India
2
Department of Civil Engineering, Sinhgad College of Engineering, Vadgaon, Pune 411041, India
3
Department of Civil Engineering, Vishwakarma Institute of Information Technology, Kondava, Pune 411048, India
*
Author to whom correspondence should be addressed.
Urban Sci. 2023, 7(1), 27; https://doi.org/10.3390/urbansci7010027
Submission received: 25 December 2022
/
Revised: 8 February 2023
/
Accepted: 9 February 2023
/
Published: 16 February 2023
(This article belongs to the Special Issue Urban Resources and Environment)
Abstract
:Freshwater sources are affected by a diverse range of pollutants, which increases the demand for effective remediation. Aquatic phytoremediation is a nature-based solution. It has the potential to provide efficient, adaptable, and multi-targeted treatment of polluted waters. The aim of this research is to evaluate non-mechanized, low-cost onsite treatment of waste water intrusions. It includes an experimental set up with three replicates. Each consists of a modified flow pattern under outdoor conditions. Experimental set up A and B were provided with macrophytes, water lettuce and duckweed, respectively, with plant coverage at 50% and 90%. Experimental set up C was a controlled set up without macrophytes. The highest removal of BOD, COD and Total solids by using water lettuce were observed to be 89%, 77% and 38.5%, respectively. By using duckweed, the highest removal of BOD, COD and Total solids were observed at 88%, 66% and 27.59%, respectively. Removal was also observed in Set up C for BOD, COD and Total solids; its efficiency was 48%, 47% and 25%, respectively. Set up A can be recommended for treating wastewater intrusion, so that wastewater will purify to a to satisfactory to disposal standard level before mixing in river water. The area available in the stream itself can be used as a treatment zone.
1. Introduction
Municipal wastewater is typically treated using suspended or attached growth mixed bacterial cultures in activated sludge systems, trickling filters, membrane or moving bed biofilm reactors [1]. New technologies are developing for removing complex emerging pollutants such as constructed wetlands, microbial fuel cells and phytoremediation. [2,3,4,5] Activated bentonite removes oil-solution green pigments from food-processing wastewater [6]. BiOX/TiO2 heterojunctions were observed as an excellent photocatalytic decomposer of Perfluorooctanoic Acid [7]. These processes achieve the efficient removal of organic matter and the safe disposal or reuse of treated wastewater [8]. However, they are characterized by high operational costs, high energy consumption and sludge production, which is also a crucial contribution to global warming due to their increased on-site and off-site greenhouse gas emissions [9]. As a result, an outsized scientific effort has been directed over the last decade toward the development of alternative cost-effective processes that deploy various microalgae species or different macrophytes in municipal wastewater treatment [10]. Currently, one of the most attractive research areas is the development of eco-friendly and efficient technologies for waste water treatment, such as phytoremediation [11]. Macrophytes were first recognized in water quality improvement during the 1960s and 1970s [12]. Macrophytes are used in waste water treatment as an alternative approach to remove pollutants and produce valuable biomass [13]. This is due to the serious problem of the contamination of aquatic environments by various pollutants in the world [14]. The efficiency of phytoremediation observed was improved by the use of metal-binding proteins and microbes [15]. Controlled growth of aquatic plants can be achieved by regular harvesting of these plants; the harvested aquatic plants can be further converted into fertilizer [16].
Macrophytes may be categorized into four basic types that include freely floating, floating leave, emergent, and submerged. The floating leaf types’ roots become stagnant in the saturated media with their entire body above the water surface, the emergent kinds may be observed at a significant height above the water’s surface, have their roots planted in soil, and greatly stabilize substrate [4]. Two macrophytes (i.e., water lettuce and duckweed plants) have been chosen for this study. To optimize the results, local macrophyte species are preferred, as they can tolerate the conditions of a particular region.
Free floating macrophytes viz. Salvinia, Lemna, Eichornia and Pistia showed their phytoremediation eventuality for the sanctification of waters from organic pollutants. The Lemna gibba used in the phytoremediation of numerous biochemical processes is similar to BOD, total suspended solids, ammonium nitrate and phosphate, ammonia and total nitrogen. Furthermore, Lemna minor has implicitly ameliorated the quality of water defiled with blue and textile colorings. It has the capability to remove answerable Pb, Ni. It has accumulation capability for Cd and Cr. Azolla caroliniana, a small water fern implicit to purify the waters defiled by mercury and chromium [17]. The studies published by the main pollution authority of India, the Central Pollution Control Board (CBPC), revealed in 2013 the working condition and inadequacy of pollution treatment infrastructure in India [18]. The Ex-Planning Commission has suggested developing “treatment zones” in city drains. The Government of India has given a very innovative approach, which needs to be strengthened further by scientific implementations by researchers who have mastered the technique of the eco-treatment of polluted waters [19].
Water pollution is becoming a serious problem due to rapid population growth, lack of sustainable technology and poor management. In large cities, municipal wastewater from almost the entire city is discharged, along with commercial/industrial wastewater, into water bodies (rivers, runoff, canals, etc.) in the immediate vicinity of the city. As a result, the pollution levels in water bodies are increasing [20]. Water lettuce and duckweed are commonly observed in various rivers in Pimpri Chinchwad Municipal Corporation (PCMC) area located in Maharashtra, India. In the last few years, an exponential growth of water lettuce and duckweed was observed in river water. The engulfing presence of water lettuce and Duckweed blocks the sunlight, prevents oxygen transfer and drops the dissolved oxygen levels. This may be the reason due to which PCMC spends large amounts for complete removal of macrophytes every year. As these are natural purifiers, there is a need to study the effect of complete removal of water lettuce and duck weed on water quality of rivers (before and after removal). Furthermore, the removal of floating macrophytes from river water will not curb its growth, and 100% diversion of waste water from going into the river is practically very difficult, as the infrastructure required for the same is not well planned. Therefore, a balanced solution to this problem is the need of the hour. Municipal wastewater contains a large variety of contaminants generated from various sources. The most probable pollutants include pathogens, oil and grease, metals, organic matter, solids, and nutrients such as nitrogen and phosphorus [21].
In previous literature, researchers have used phytoremediation, bioremediation with or without baffled tanks, vertical flow, or horizontal flow mixing. In this research paper, the combination of modified flow patterns, which allows zig-zag flows in vertical as well as in horizontal directions, were used along with locally available floating macrophytes, i.e., water lettuce and duckweed, for the removal of organic impurities. This research is an attempt through which a model study has been carried out with three different experimental set-ups for comparison. The investigation of various pollutants of raw wastewater, as well as treated wastewater, have been carried out with due regard to the removal efficiency of set ups. The investigation was conducted to evaluate the % increase in Dissolved Oxygen (DO), % decrease in Biochemical Oxygen Demand (BOD), Chemical Oxygen Demand (COD) and Total Solids (TS) with respect to the % plant area coverage. At the end of the study, it will lead to selecting more appropriate treatment for such kinds of water bodies.
2. Materials and Methods
2.1. Study Area and Experimental Setup
Pimpri- Chinchwad is among the fastest growing cities in India. The population of Pimpri- Chinchwad city is 1,729,359 as per its 2011 census. It has also resulted in an increased amount of wastewater generation, which subsequently goes into rivers either partially treated or untreated.
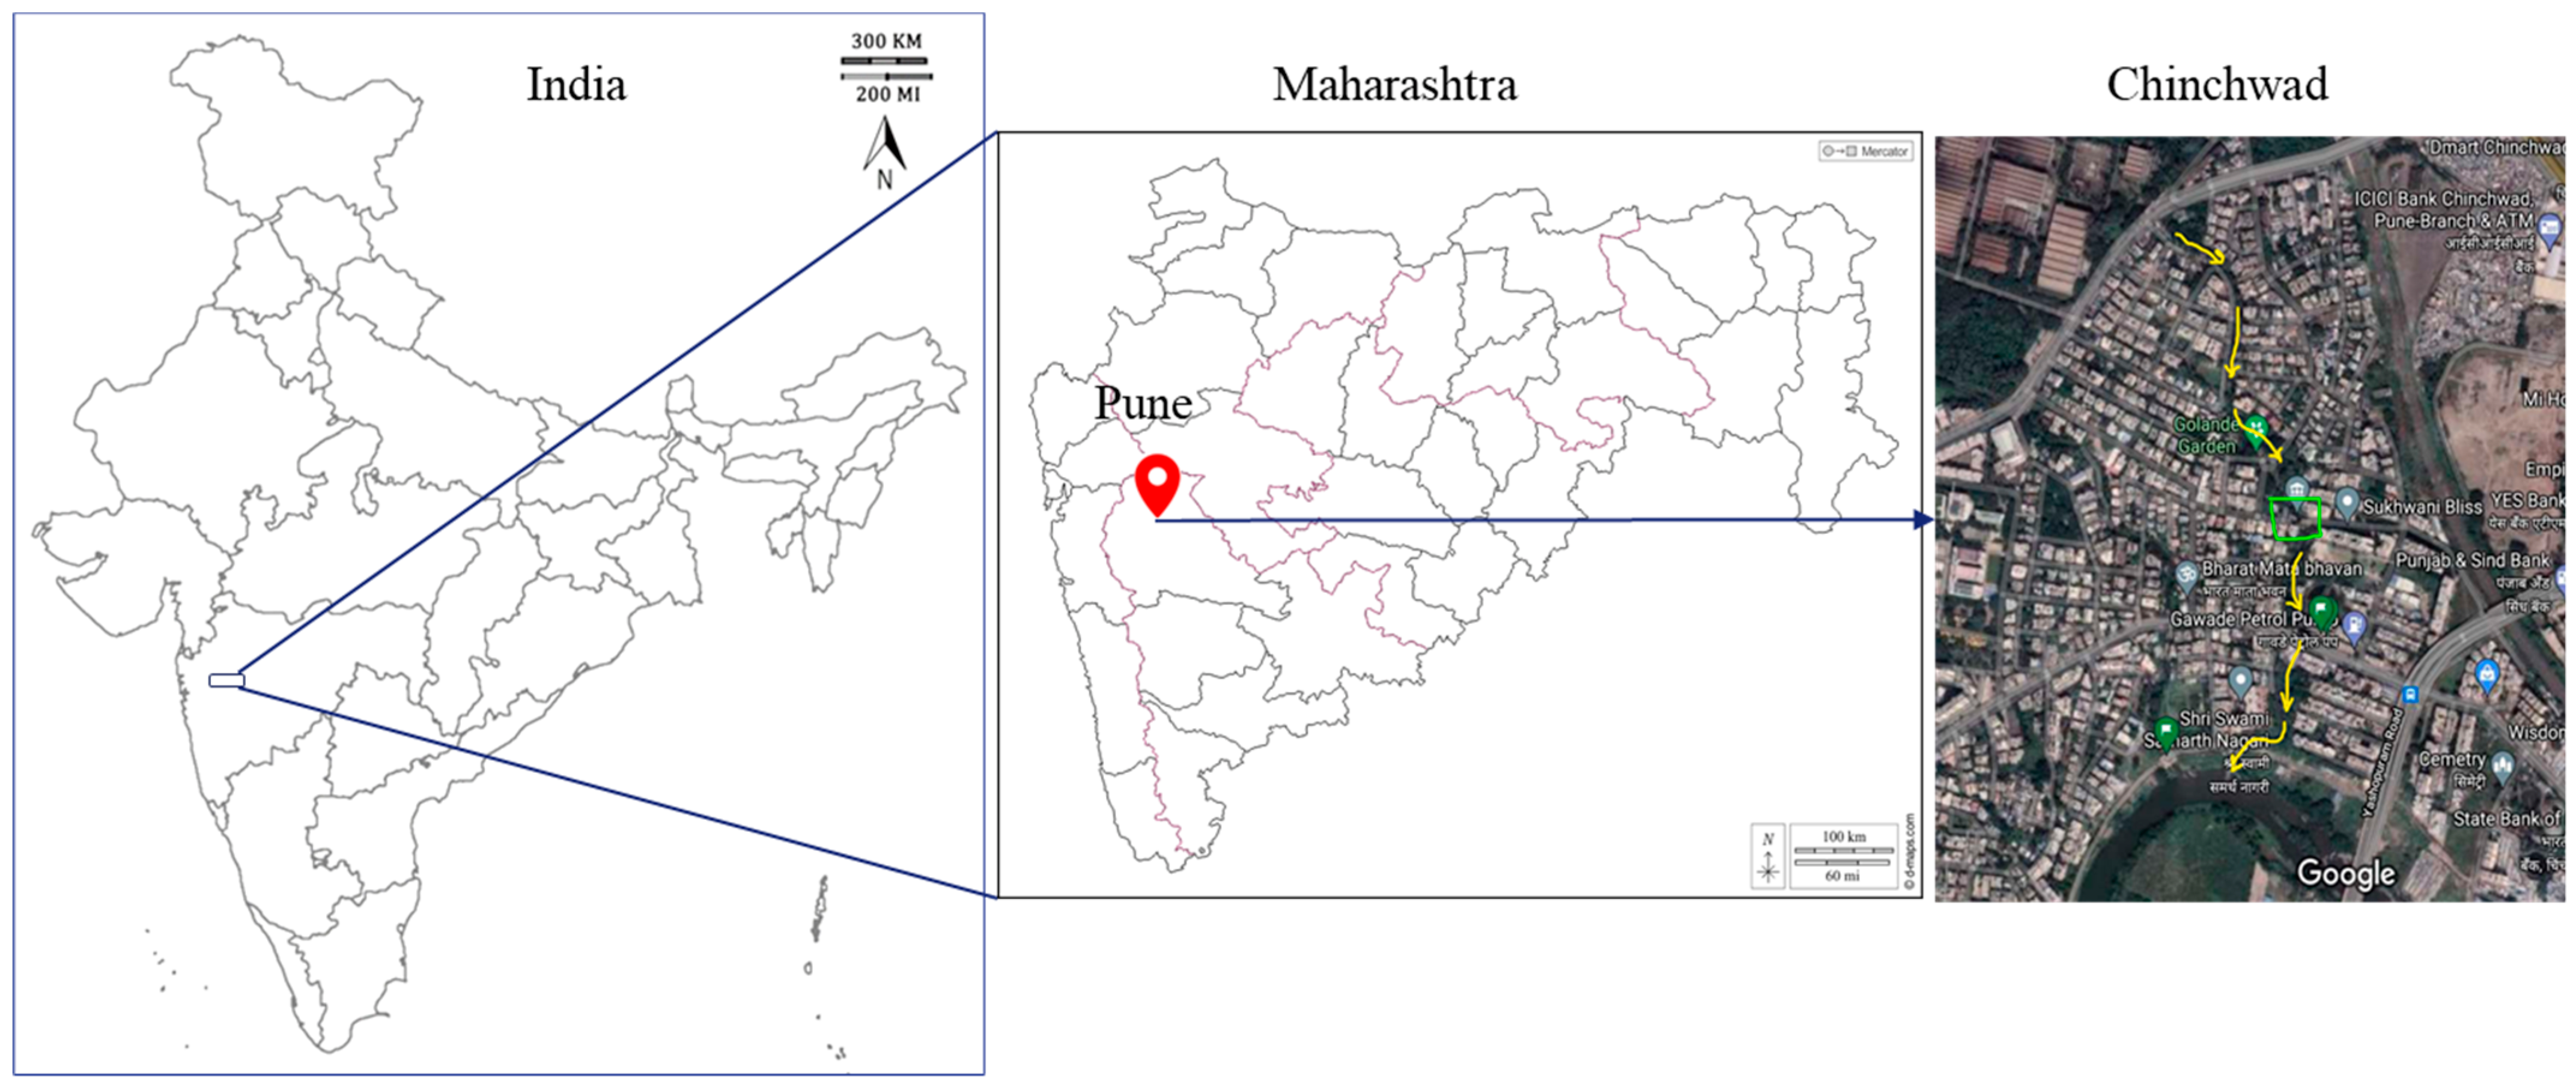
As per the Environmental Status Report of 2021–2022, prepared by the Municipal Corporation, the total sewage generated was approximately 312 MLD. The city has a total of fourteen sewage treatment plants, with a capacity of 353 MLD [22]. Due to an incomplete collection network, approximately 270 MLD sewage is treated daily. The sewage which does not reach STP is disposed of in the river Pawana without treatment, through wastewater streams. It is increasing pollution load of River Pawana, it was measured as 7925 Kg of BOD, 24,192 Kg of COD and 31,056 Kg of TSS per day through 20 wastewater intrusions [21]. For this purpose, we have selected one of the wastewater intrusions for this research. Figure 1 shows the source of the sewage fed into the experimental set up; the wastewater stream at Chinchwad, Pune, Maharashtra, India (Location: Latitude-18.632204, Longitude-73.791965).
Initial characteristics of wastewater collected were as mentioned in Table 1.
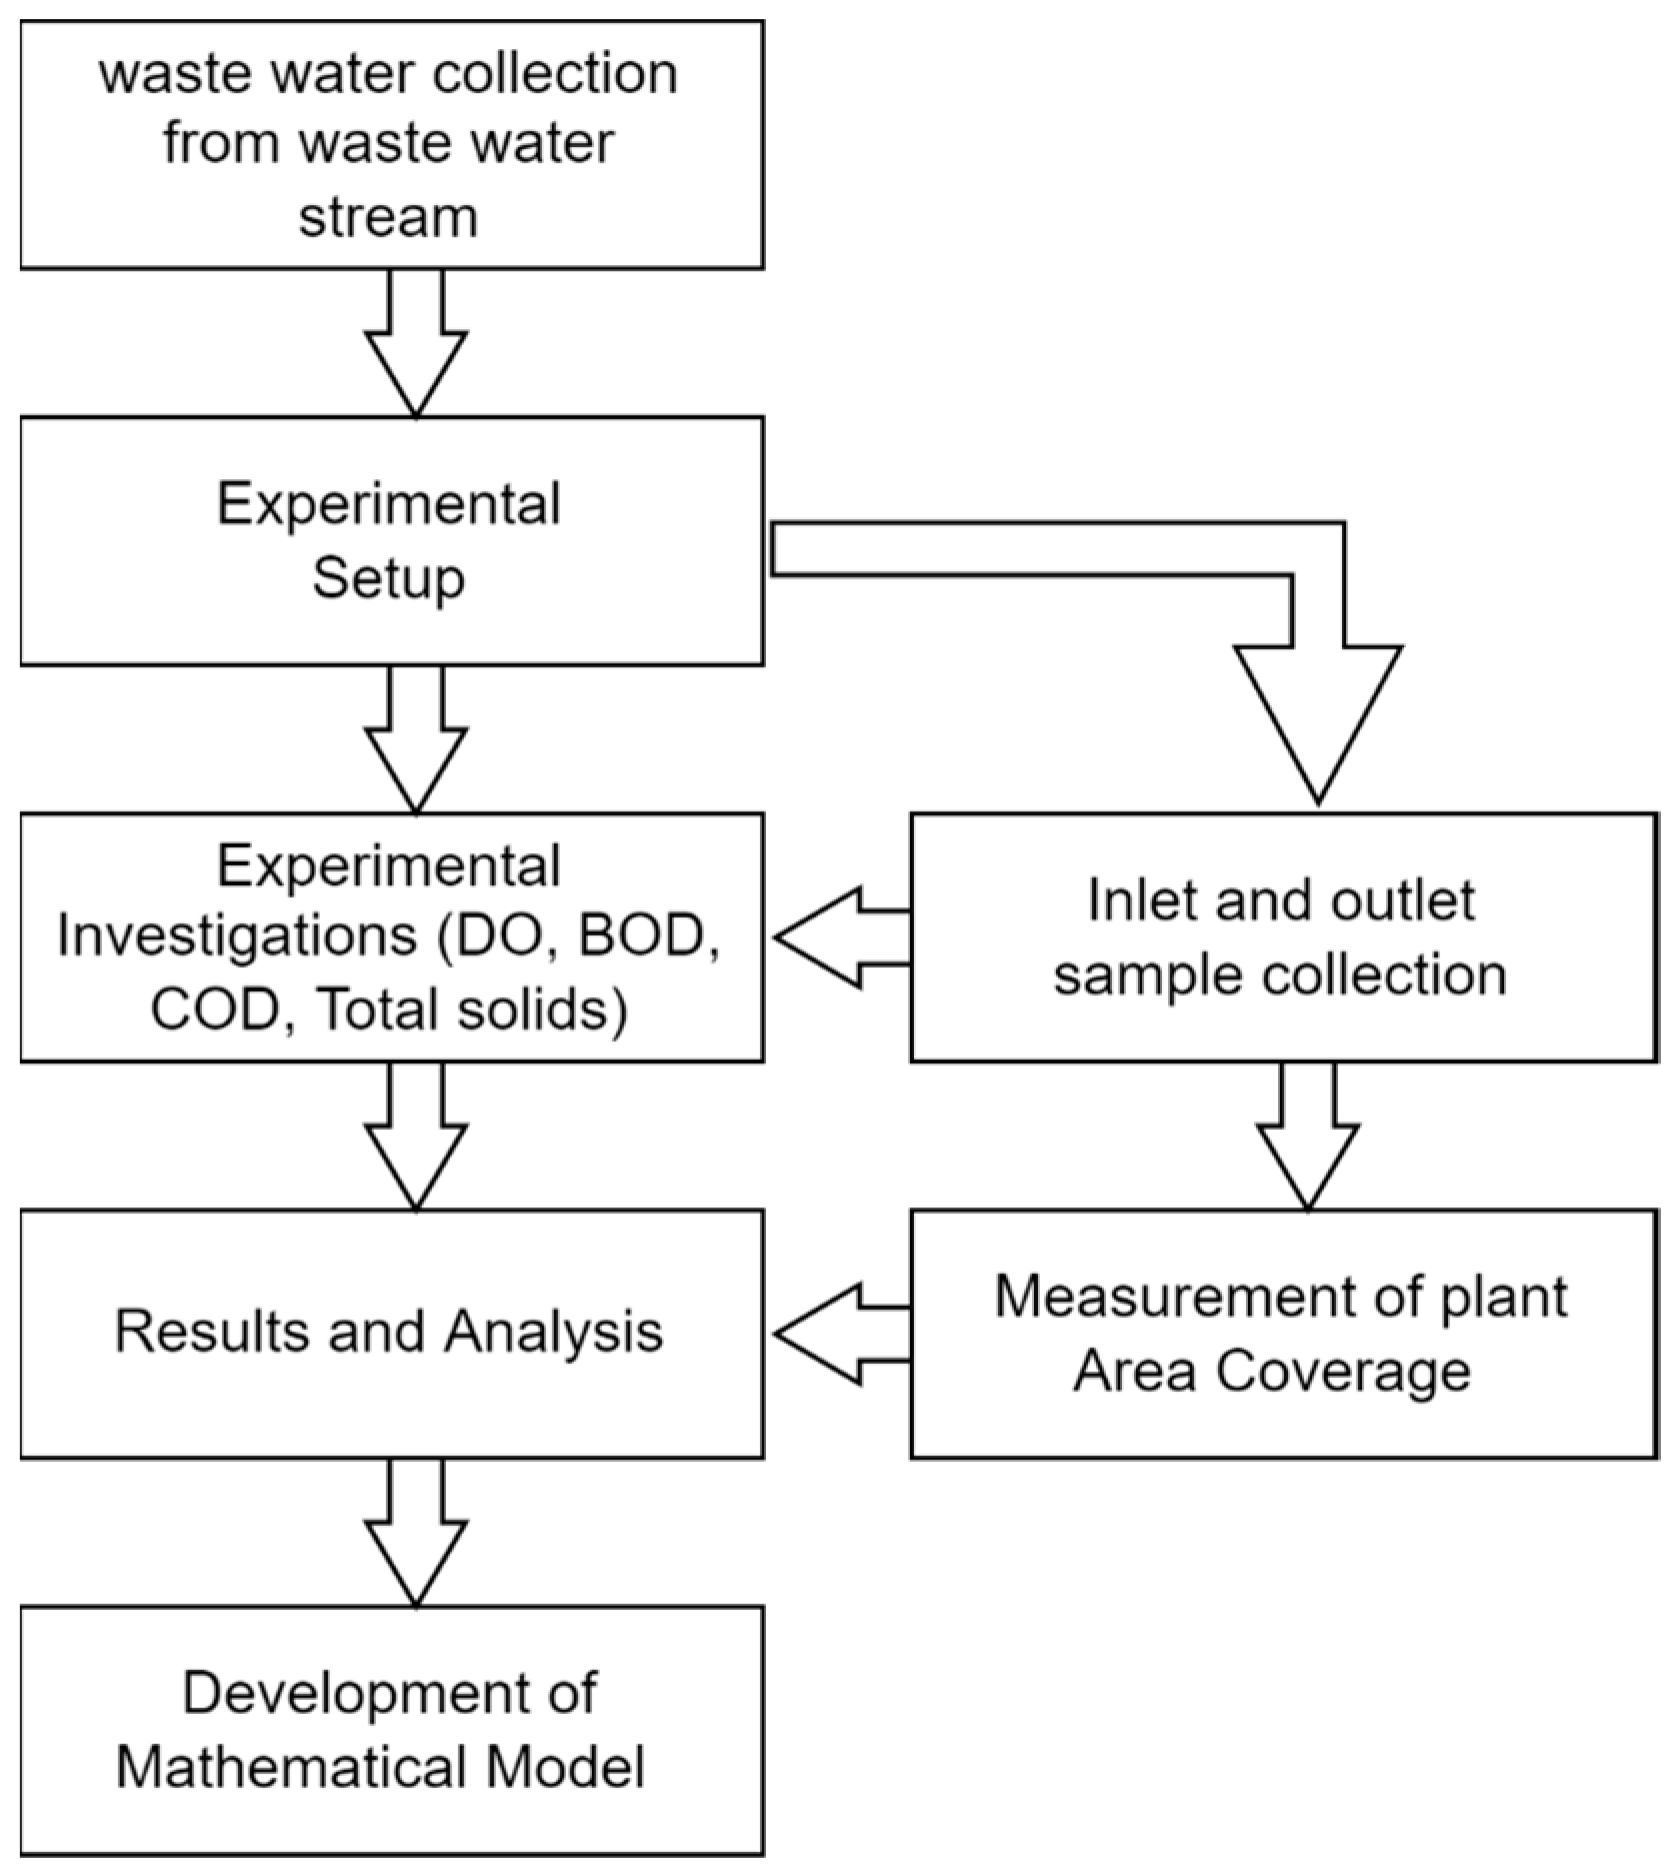
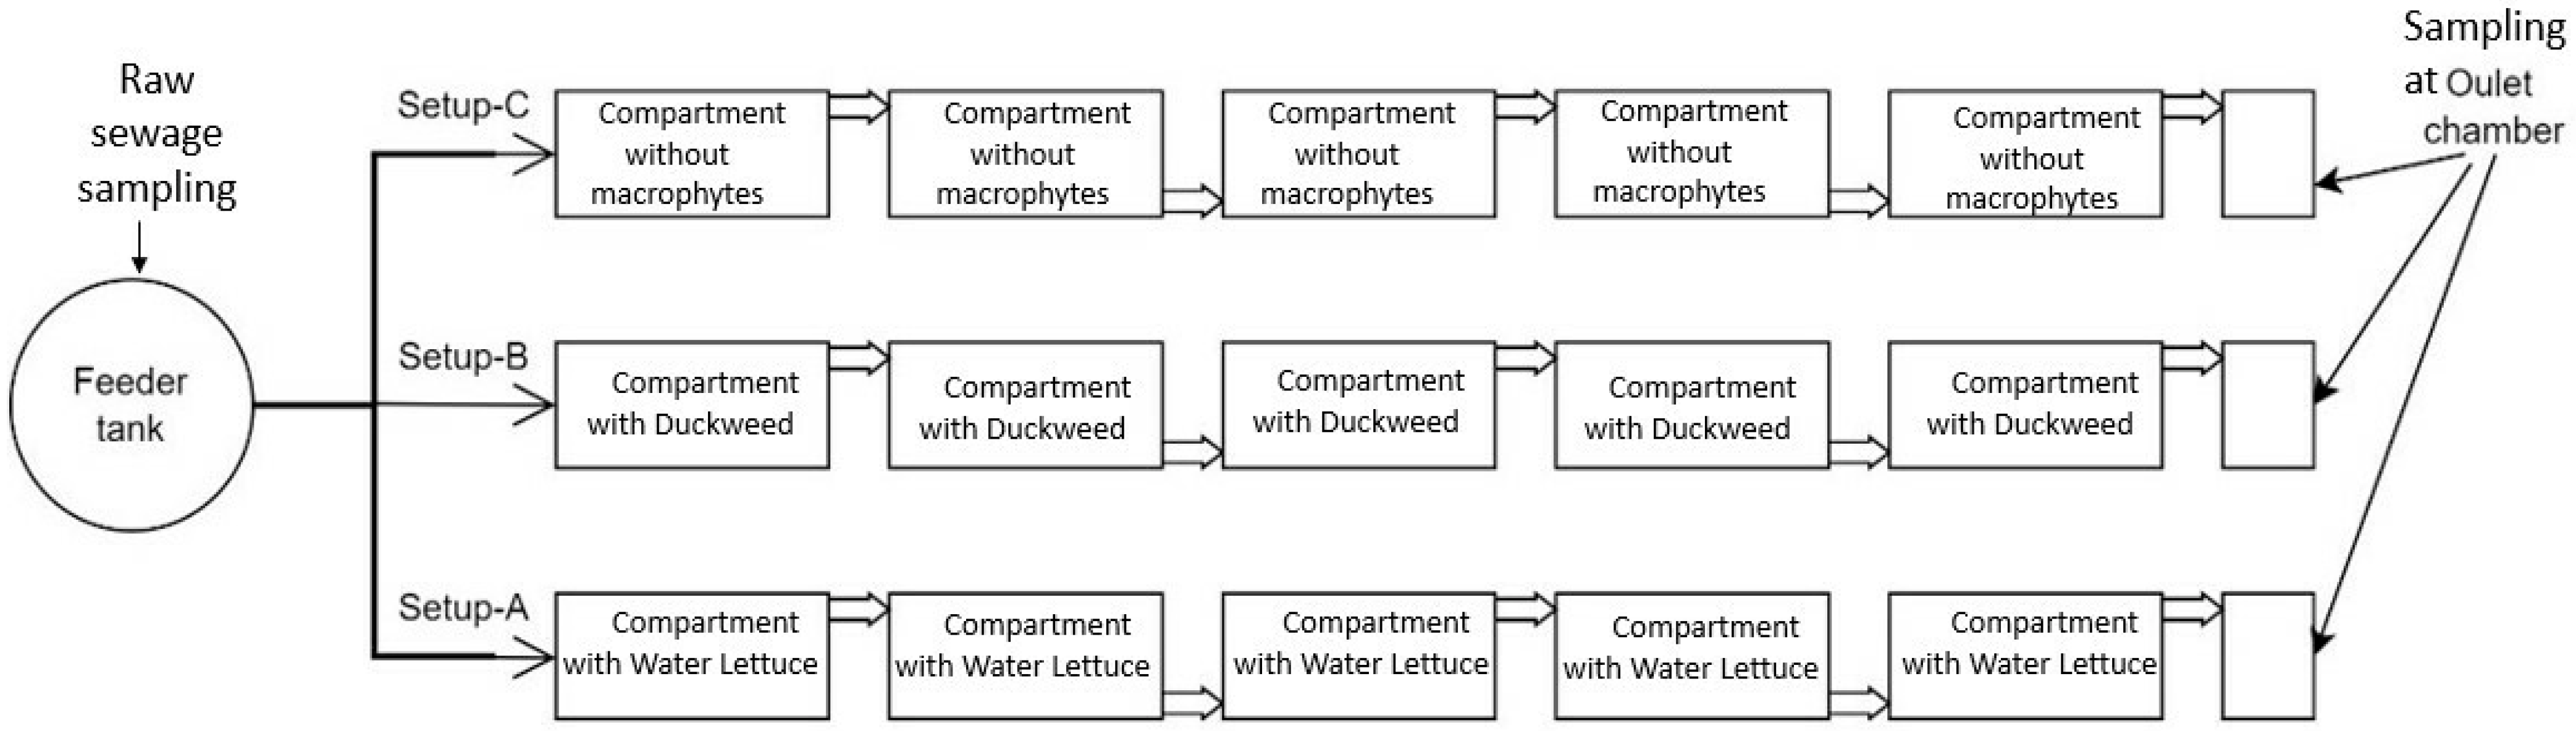
The experimental set up consists of locally available plastic pots and plumbing accessories. The capacity of each pot was observed to be 22.7 L. The fabrication of the experimental set up was done at the terrace of the sewage treatment plant at Chinchwad. As shown in Figure 3, the pots were connected by PVC pipe (outer diameter ¾ inch). Inlet and outlet arrangements were done using T-Sections to avoid blockage due to suspended impurities. Three similar experimental set ups were installed at the same time. The first setup contained the aquatic species ‘water lettuce’ (Pistia stratiotes) [23]. The second set up contained the aquatic species ‘duckweed’ (Lemna minor) [4]. The third set up was run without any aquatic species. All of these experimental set ups were designed for a modified flow pattern. The present study is being carried out with an approach of depicting the actual conditions in a stream using an experimental set-up. Floating macrophytes used in the experimentation were collected from the River Pavana at Ravet Bund. Water lettuce and duckweed plants collected from the river were washed using distilled water and acclimatized in wastewater before being used in the experimental setup [24]. The methodology adopted is shown in Figure 2.
2.2. Sampling and Analysis of Wastewater before and after Treatment
Domestic wastewater quality was determined by analyzing dissolved oxygen, bio-chemical oxygen demand, chemical oxygen demand, and total solids. The samples were collected from the inlet and outlet of each setup for detention time of 2, 3, 4 and 5 days. Removal of organic nutrients by macrophytes may be enhanced with a higher detention time [25]. For each detention time, the area covered was varied as 50 and 90%. Laboratory methods adopted for analysis were as per IS 3025 Part 15, 16, 17, 18, 38, 44 and 58.
2.3. Operation
Experimental set ups were installed as shown in Figure 3. A common feeder tank was provided for sewage feeding in Setup A, B and C. Experimentation was performed for varying detention times of 2, 3, 4 and 5 days. For each detention time, the plant area covered was varied, as 50% and 90%.
2.4. Evaluation of Monitored Data
Data analysis was performed using Microsoft Excel version 2019. To investigate the difference in the experimental set ups shown in Figure 3 and the efficiency of water lettuce and duckweed, two-way analysis of variance (ANOVA) at a 95% (p < 0.05) confidence level was used. Removal of pollutants was calculated in terms of percentage decrease in BOD, COD and TS with respect to the initial concentration [26].
3. Results and Discussions
3.1. Dissolved Oxygen
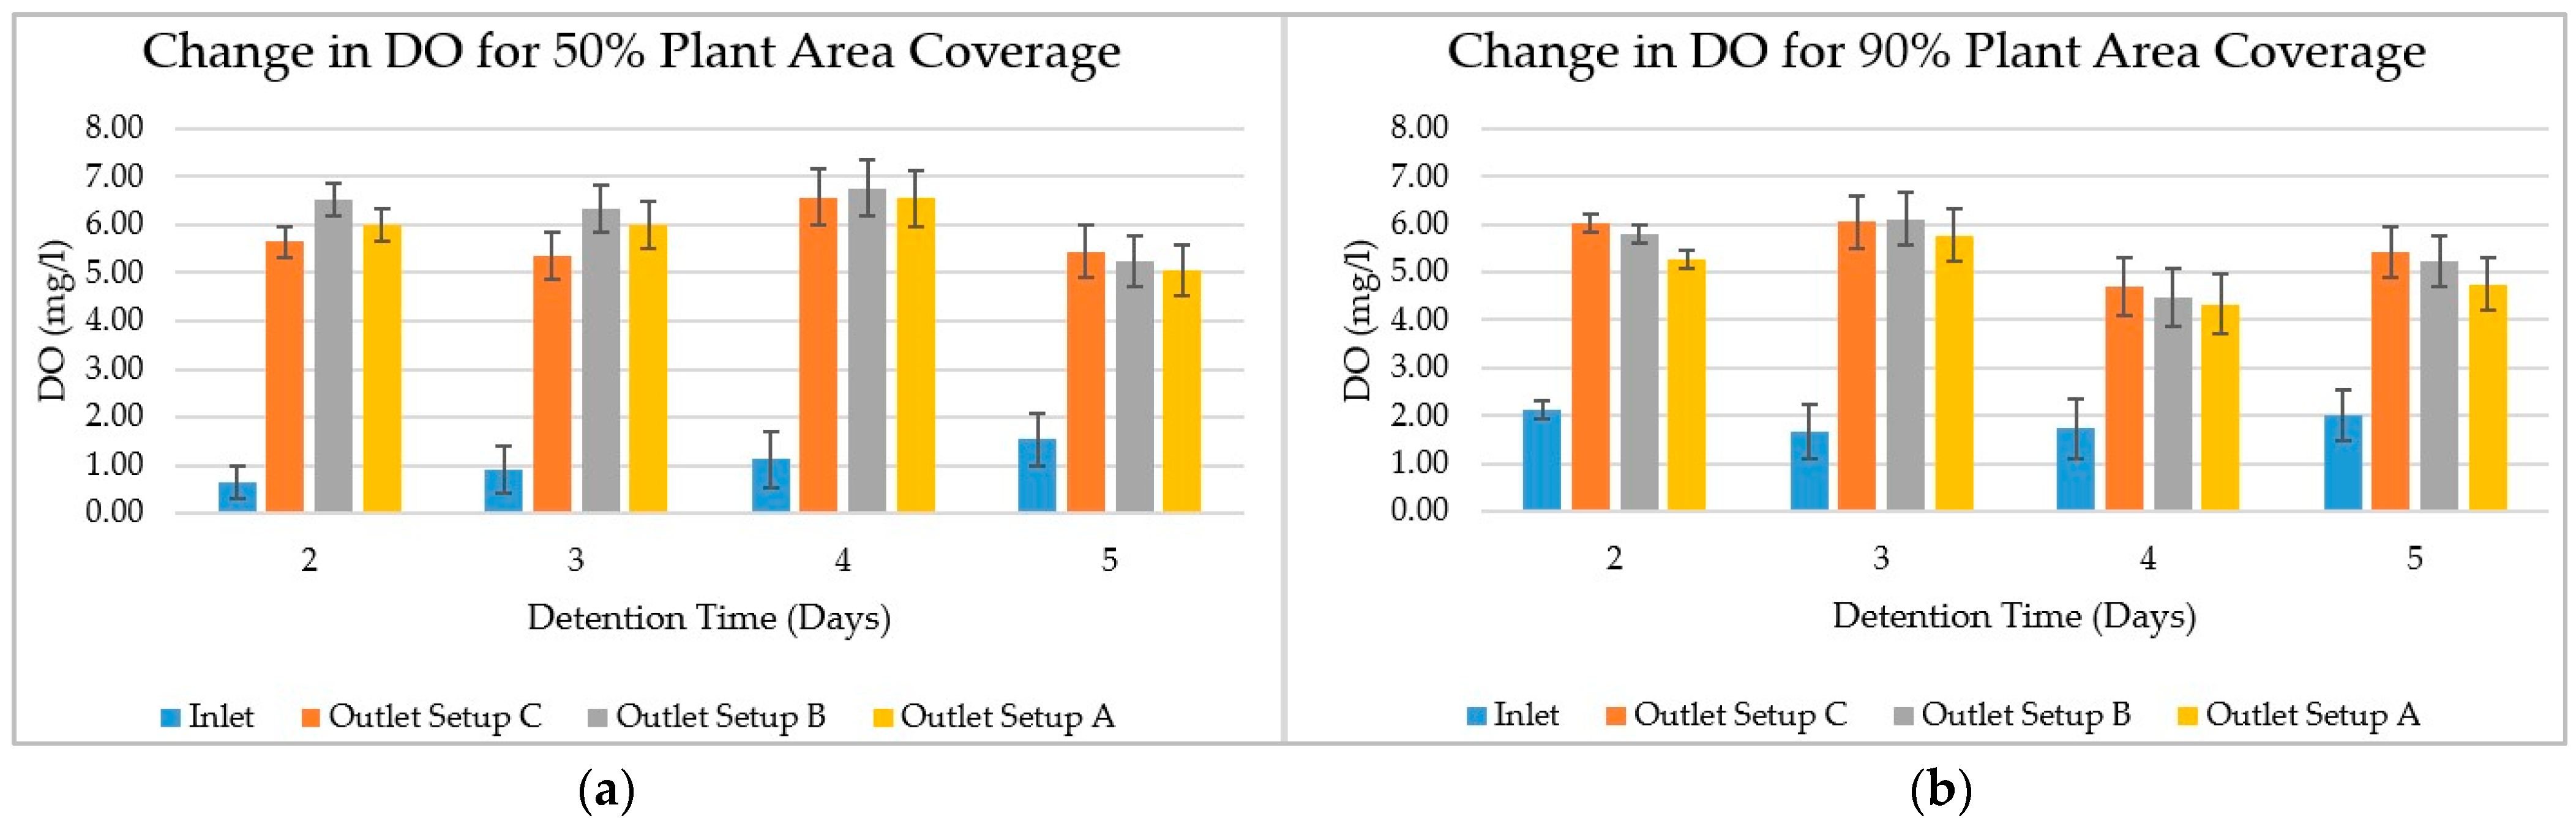
The dissolved oxygen concentration of influents was observed to be 0.9 ± 0.2 mg/L to 2.13 ± 1 mg/L and the maximum increase in DO was observed to be 5.99 ± 0.3 mg/L for Set up A at a three day DT (detention time) for 50% area coverage. For Set up A, DO increase was less than Set up C. Set up C had no aquatic plants, therefore, the contact area of water and air was comparatively more. The DO increase in Set up C was observed more than 50% and 90% area coverage by water lettuce. Another reason for the DO increase might be modified flow pattern. Due to the provision of the zig-zag flow pattern, water at the bottom was moved at the surface and contacted with air directly, similarly, water at the surface with high DO moved towards the bottom and increased DO at lower portions of Set up C, as shown in Figure 2. DO increase was significantly affected by DT (p < 0.05); as DT increased, flow rate decreased and churning effect due to modified flow pattern also decreased. Therefore, in Set up A, B and C, ‘increase in DO’ is reduced with ‘increase in DT’. For Set up B, the maximum DO increased to 89.79 ± 12.5 at two days of detention time, which was slightly more than Set up C; this was due to roots and lower frond surface of leaves, as they provide oxygen [27]. The DT and area coverage of aquatic plants inhibit an increase in DO [27]. The DO increase of Set up B was observed as slightly more than or equal to Set up C. Figure 4a shows the comparison of DO increases in Set up A, Set up B, and Set up C. For 50% aquatic plant coverage, Set up B had best efficiency at two days of DT. Set up C had good efficiency to increase DO comparatively more than Set up A and Set up C. As shown in Figure 4b, for 90% area coverage, an increase in DO was observed lowest at a five day DT. In Set up A, it might be due to longer DT and low flow rate. Set up B had more efficiency than Set up A and C, as duckweed roots oxygenate water. No Set up had given effluent having DO less than 4 mg/L. An increase in DO improves the taste of water [28]. Standard deviation is a popular measure of variability. DO shows low variability for Set up C, medium for Set up A, and high for Set up B, with respect to increase in detention time (Figure 4) [29].
3.2. Bio-Chemical Oxygen Demand
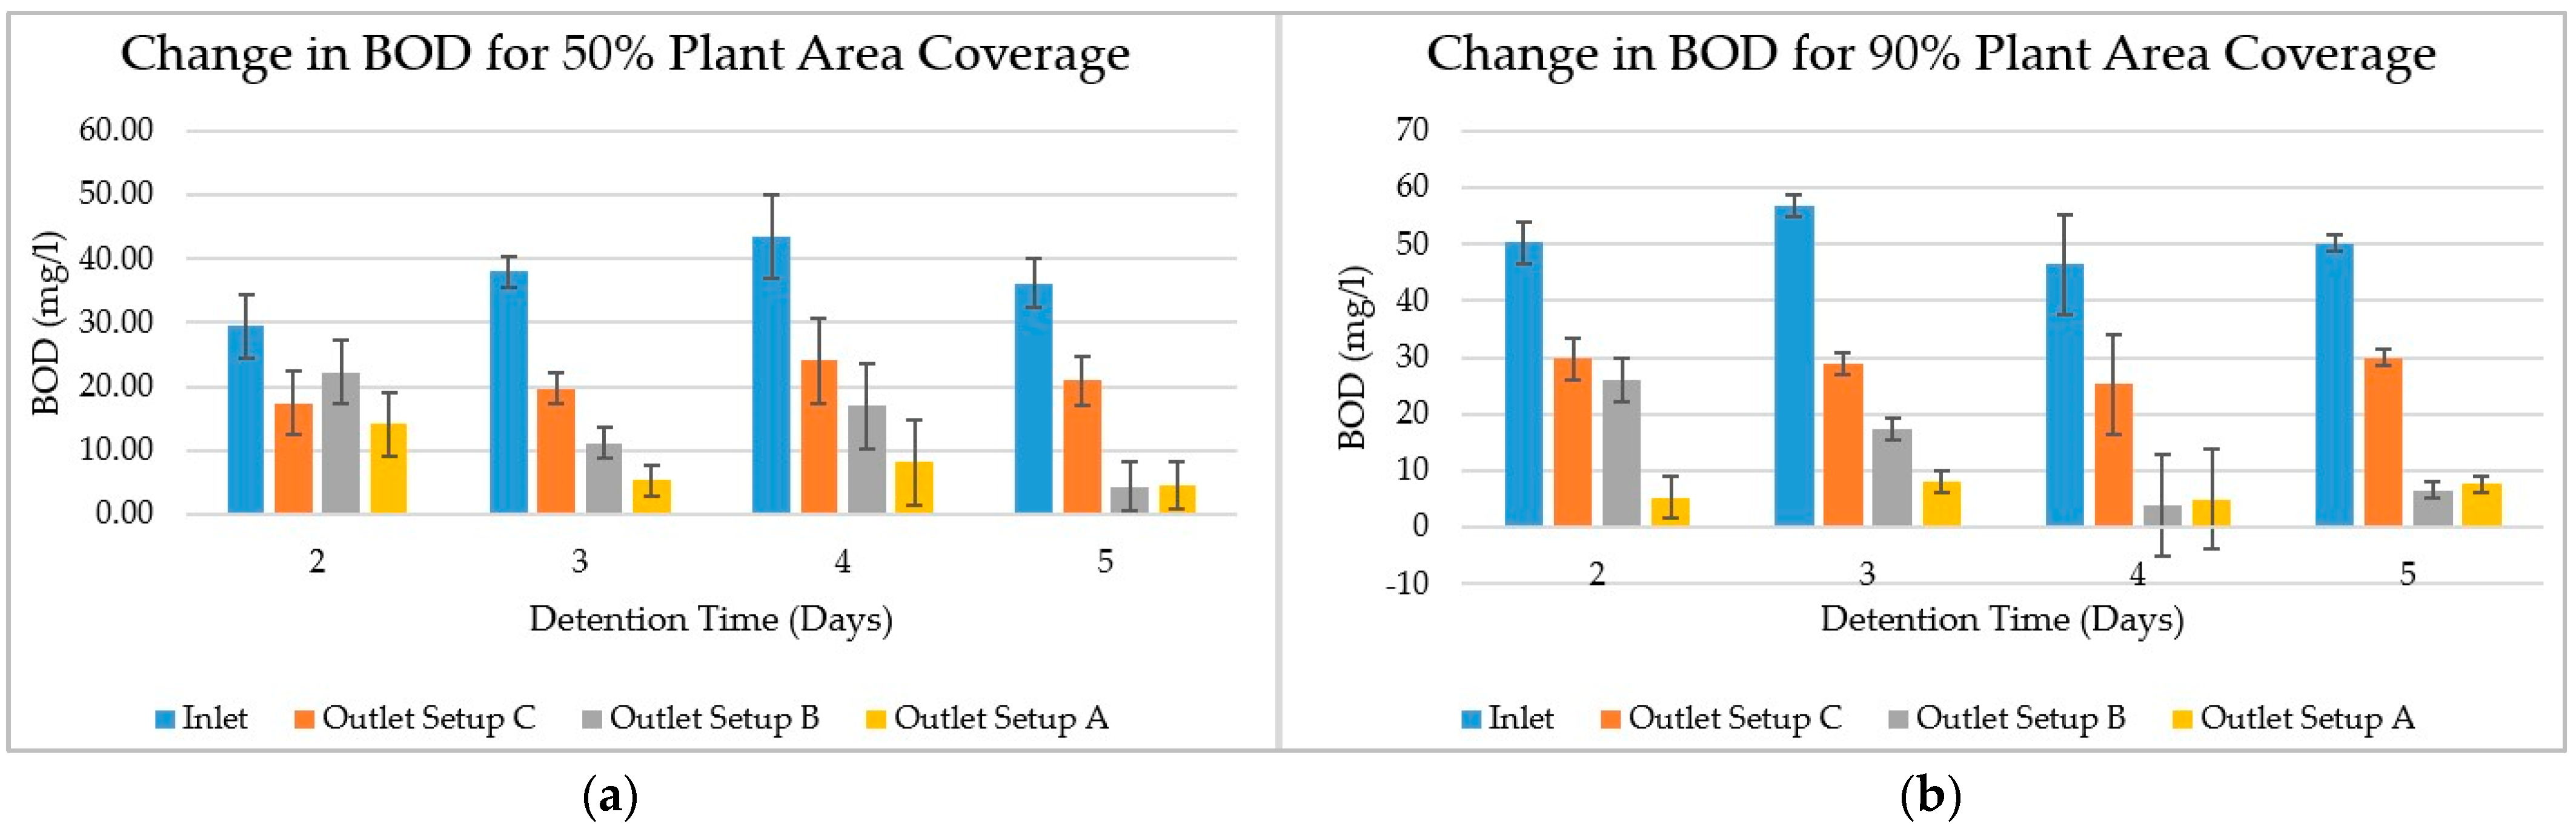
As compared with Set up C, BOD reduction by Set up A was observed to be 89.17% at four days detention time and 90% plant coverage. Awuah et al. used water lettuce with complete area coverage at seven days of DT; water lettuce reduced 93% of BOD from their bench scale plant [30]. Comparatively, set up A had given good efficiency at less DT. It may be due to a modified flow pattern which increases DO in the system. Minimum BOD removal was observed to be 43.48 ± 26.7 mg/L to 24.66 ± 11.4 mg/L at four days of DT with 50% area coverage; it may be due to higher BOD concentration at the inlet (Figure 5a).
For set up A, the BOD of influents and effluents observed in between 29.56 ± 9.5 mg/L to 43.48 ± 26.7 mg/L and 4.56 ± 3 mg/L to 24.66 ± 11.4 mg/L for 50% area coverage, respectively. According to disposal standards, all DTs were observed with less BOD3 concentration (<30 mg/L) for disposing treated waste water in inland surface water. Three days and five days of DT also satisfy the disposal standards given for STPs at metro Politian cities (<10 mg/L).
Similarly, for 90% area coverage, BOD of influents and effluents were observed between 46.53 ± 5.3 mg/L 56.8 ± 19.9 mg/L and 4.96 ± 0.4 mg/L to 8.07 ± 4.9 mg/L, respectively (Figure 5b). According to disposal standards, all DTs were observed at less BOD concentration (<30 mg/L) for disposing treated waste water in inland surface water. They also satisfy disposal standards given for STPs at metro Politian cities (<10 mg/L).
For set up B, the BOD of influents and effluents observed between 29.56 ± 9.5 mg/L to 43.48 ± 26.7 mg/L and 4.42 ± 2.5 mg/L to 22.27 ± 7.6 mg/L for 50% area coverage, respectively. According to disposal standards, all DTs were observed at less BOD concentration (<30 mg/L) for disposing treated waste water in inland surface water. Five days of DT also satisfies the disposal standards given for STPs at metro Politian cities (<10 mg/L). For 90% area coverage, the BOD of influents and effluents observed between 46.53 ± 5.3 mg/L 56.8 ± 19.9 mg/L and 3.92 ± 2.2 mg/L to 26.04 ± 15.5 mg/L, respectively. According to disposal standards, all DTs were observed with permissible BOD concentration (<30 mg/L) for disposing treated waste water in inland surface water. Four days of DT also satisfy disposal standards given for STPs at metro Politian cities (<10 mg/L).
For five days of DT, there was a slight decrease observed in BOD removal in set up B with 90% coverage, due to limited oxygen transfer into water. Percentage removal efficiency was highest in set up A (MF+WL), followed by set up B and Set up C (MF) at 88.86% (DT-5 days) [31], 88.59% (DT-5 days) and 48.23% (DT-2 days), respectively, for 50% area coverage. For 50% area coverage, there was a statistical significance (ANOVA) of treatment provided (F-49.24) and DT adopted (F-31.92) in percentage removal of BOD. Both parameters had significant interaction (F-7.54) at p < 0.05.
For 90% area coverage, percentage removal efficiency was highest in set up B, followed by Set up A and Set up C at 91.5% (DT-4 days), 89.17% (DT-4 days) and 49.18% (DT-2 days), respectively. The combination of modified flow patterns and types of plants used (F = 69.89) and detention time (F = 5.76) had a significant impact on the removal process and significant interaction (F-5.77) at p < 0.05. It also shows the contribution of plants for aeration of natural bodies to reduce contaminants [23]. As shown in Figure 5, for 50% plant area coverage, BOD shows low variability for Set up C, medium for Set up A and high for Set up B with respect to increase in detention time. For 90% plant area coverage, BOD shows low variability for Set up A, medium for Set up C and high for Set up B with respect to increase in detention time [29].
3.3. Chemical Oxygen Demand
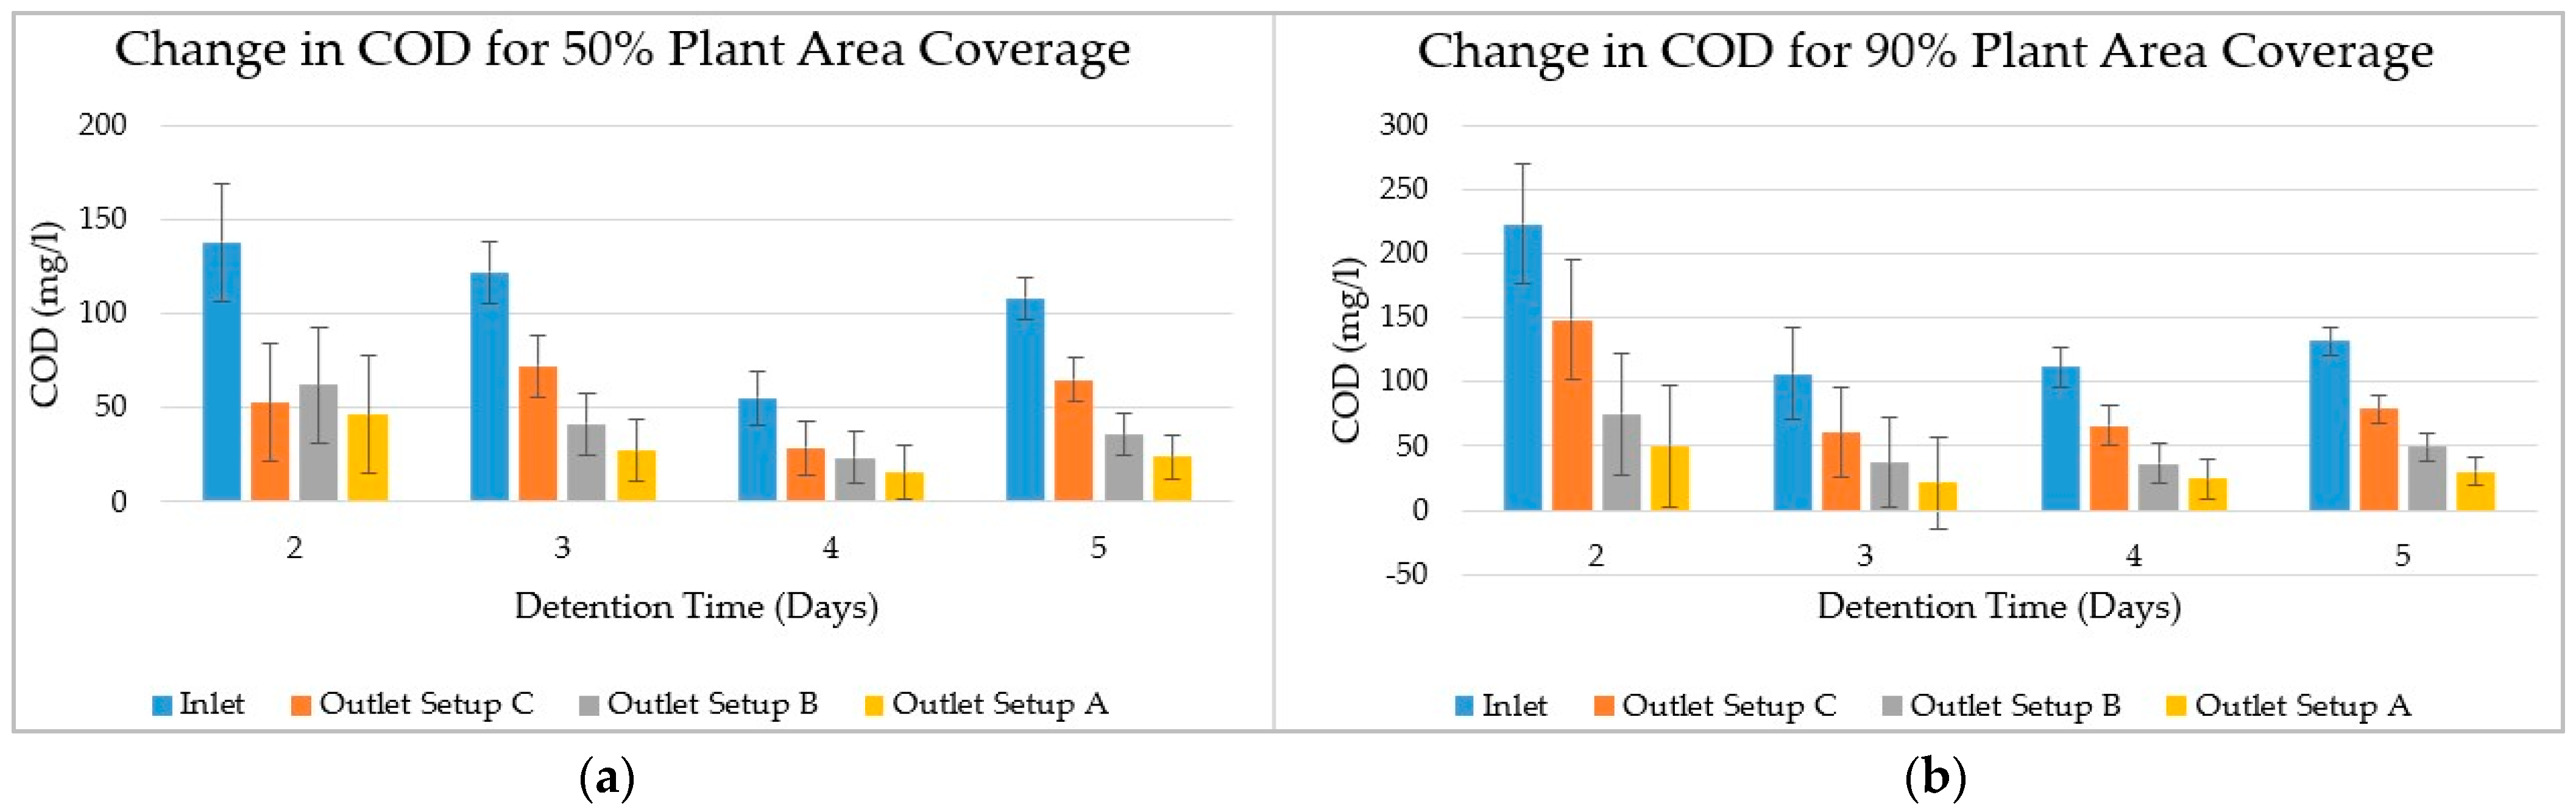
For set up A, COD of influent and effluent observed in between 55.05 ± 27.6 mg/L to 137.7 ± 71.4 mg/L and 15.8 ± 10.2 mg/L to 46.54 ± 15.4 mg/L for 50% area coverage respectively (Figure 6a). For 90% area coverage, COD of influent and effluent observed in between 106.46 ± 26.8 mg/L 223.07 ± 131.7 mg/L and 21.55 ± 9.6 mg/L to 49.97 ± 60.7 mg/L respectively (Figure 6b). According to CPHEEO disposal standards all DTs were observed permissible COD concentration (250 mg/L) for disposing treated waste water in inland surface water. They also satisfy the disposal standards given for STPs at metro Politian cities (<50 mg/L). As the COD Concentration was more than the BOD concentration, the sample contained a large number of organic compounds that were not easily biodegraded [20].
In Set up A, the highest percent removal of COD was observed at 77.21% with 90% area coverage, followed by 50% area coverage, and the least at Set up C.
For Set up B, the COD of influents and effluents was observed between 55.05 ± 27.6 mg/L to 137.7 ± 71.4 mg/L and 23.75 ± 16.4 mg/L to 62.11 ± 38.2 mg/L for 50% area coverage, respectively. For 90% area coverage, the COD of influents and effluents was observed between 106.46 ± 26.8 mg/L 223.07 ± 131.7 mg/L and 36.69 ± 9.1 mg/L to 75 ± 59.2 mg/L respectively.
According to CPHEEO disposal standards, all DTs were observed at permissible COD concentration (250 mg/L) for disposing treated waste water in inland surface water. Three days, four days and five days of DTs also satisfy the disposal standards given for STPs at metro Politian cities (<50 mg/L).
In Set up B, the highest percent removal of COD was observed at 66.72% with 90% area coverage, followed by 64.71 with 50% area coverage and the least at 47.16% modified flow pattern without aquatic plants. The growth of macrophytes such as, water lettuce and duckweed, showed high performance in removing COD, mainly due to a well-developed root system. Micro-organisms present in the water establish a symbiotic relation to the aquatic plants; this contributes to degradation of COD [20]. As shown in Figure 6a,b, Set up A has the highest COD removal followed by Set up B and Set up C for two days, three days, four days and five days of DT.
For 50% area coverage, the significance of the treatment provided in Model A, B and C and DT has been analyzed by using ANOVA at 95% confidence level for both cases, i.e., 50% and 90% area coverage. For 50% area coverage, the combination of the modified flow pattern and type of plant used (F = 11.17) had a significant impact on the removal of COD, with no significance of DT at p < 0.05. Similarly, for 90% coverage, Set up A has highest COD removal followed by Set up B and Set up C for two days, three days, four days and five days of DT. For the 90% area coverage, treatments given in set ups had a significant impact (F = 39.55) on the removal of COD with no significance of DT at p < 0.05.
3.4. Total Solids
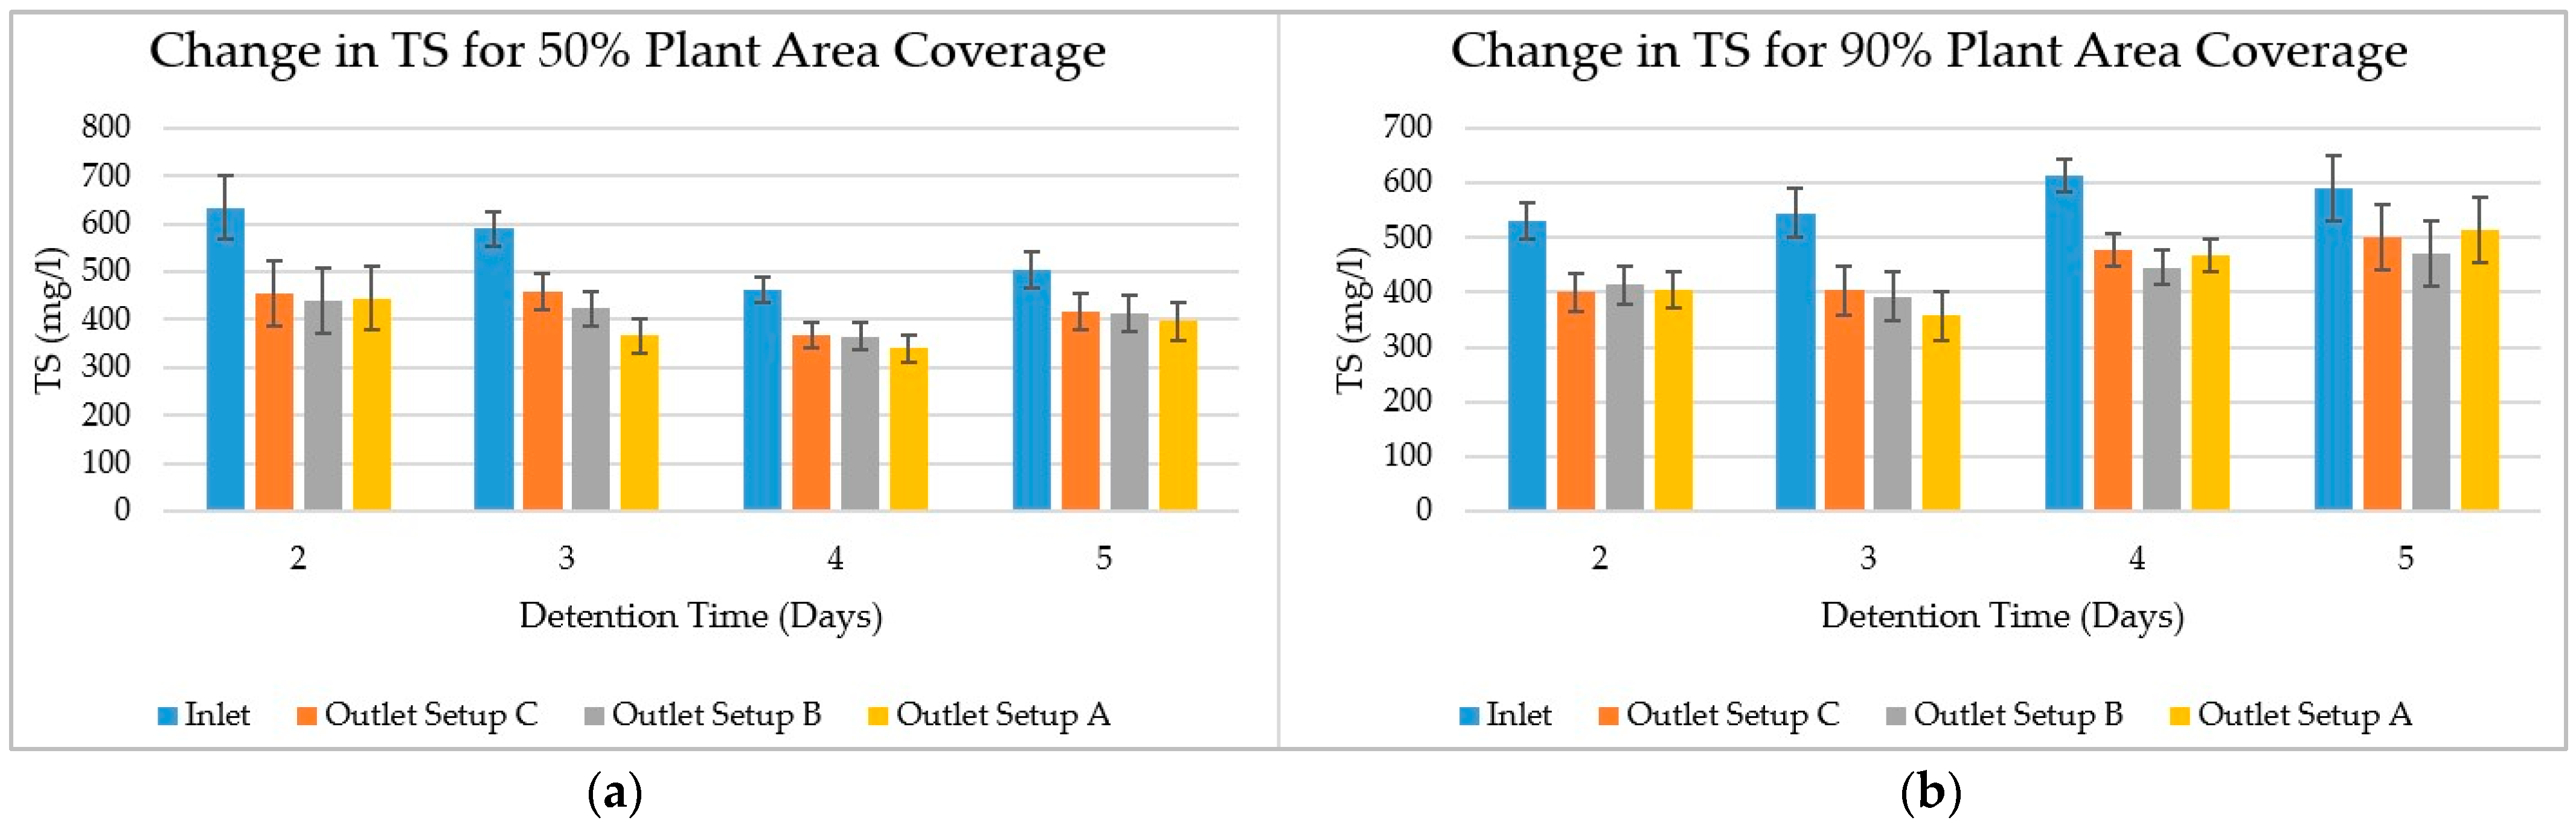
Total solids represent the summation of total dissolved solids and total suspended solids. Regular monitoring of total solids (TS) may detect trends. Water lettuce growth decreased the salts from the waters by plant uptake or root adsorption, and it was concluded that the water quality in ponds was improved by phytoremediation with water lettuce, as evidenced by total solids [32]. For Set up A, the TS of influents and effluents observed between 463 ± 55 mg/L to 635 ± 165 mg/L and 340 ± 63 mg/L 445 ± 32 mg/L for 50% area coverage, respectively. For 90% area coverage, the TS of influents and effluents observed between 531 ± 75 mg/L 613 ± 179 mg/L and 358 ± 89 mg/L to 514 ± 45 mg/L, respectively.
In Set up A, the highest TS removal was observed at three days of DT with 50% area coverage, followed by three days of 90% area coverage, and the least was at two days without aquatic plants in Set up C (Figure 7a,b). In Set up B, the highest TS removal observed at two days of DT with 50% area coverage, followed by three days of 90% area coverage, and the least was at two days without aquatic plants in Set up C. The TS of influents and effluents observed between 463 ± 55 mg/L to 635 ± 165 mg/L and 365 ± 34 mg/L 439 ± 40 mg/L for 50% area coverage, respectively. For 90% area coverage, the TS of influents and effluents observed between 531 ± 75 mg/L 613 ± 179 mg/L and 393 ± 60 mg/L to 471 ± 64 mg/L, respectively. The significance of treatment provided in Set up A, B, C and DT was analyzed by using Two Way ANOVA at 95% confidence level for both cases, i.e., 50% and 90% area coverages. The author does not have enough evidence to say that the treatment provided in set up and DT were statistically significant in percent removal of total solids. As p = 0.2 > 0.05, the author failed to reject the null hypothesis. For 90% area coverage, detention time had a significant impact (F = 4.29) on the removal of total solids with no significance of treatment given in set up at p < 0.05. For 50%, as well as for 90% area coverage. As per Figure 7a,b, the highest TS removal was observed in Set up A, followed by Set up B and Set up C. For 50% and 90% plant area coverage, TS shows low variability for Set up B, medium for Set up C and high for Set up A with respect to increase in detention time [29].
3.5. Roll of Macrophytes in Experimental Set Ups for Removal of Pollutant
The macrophytes played very important role in the removal of pollutants. It is achieved by the ability to undergo a phenomenon known as phytoremediation. During the photosynthesis process, roots absorb water, it is split into the protons and the oxygen molecule by the process of photolysis. Therefore, these plants have a root zone which maintains comparatively high dissolved oxygen. It results in the symbiotic relation of micro-organisms and plants. Micro-organisms utilize the oxygen for their survival and biodegraded the organic matter [20]. They need nutrients like nitrogen, phosphorus and potassium for their growth. These nutrients are present in wastewater in the form of organic impurities. The plants utilize these nutrients, and due to this, there were reductions in BOD, COD and TS. In present study, the length of the roots observed for water lettuce and duckweed were 10 cm to 15 cm and 2 cm to 8 cm, respectively. As the depth of wastewater in set-up was kept constant for both plants, percentage removal for BOD, COD and total solids were observed comparatively more in Set-up A containing water lettuce. In Set-up C (without macrophytes), the observed percentage removal of BOD, COD and TS was lowest. Phytoremediation is very promising technology, successfully removing heavy metals like cadmium from wastewater [33].
4. Conclusions
Aquatic plants (water lettuce and duckweed) and the associated microorganisms are those from the surrounding habitat, hence, already adapted to the sewage. These plants have shown rapid growth throughout the study period; the growth at the first pot was observed fast, and plants were seen healthy as compared to the last pot of experimental set ups. This system, with 90% plant coverage and four days of detention time, removes 89% BOD, 77% COD with water lettuce and 91% BOD, 66% COD with duckweed. The combination of water lettuce and modified flow pattern treatment is recommended for the restoration of polluted streams, which are currently disposing untreated waste water in rivers. After treatment, treated wastewater will act as dilution water when it is mixed with river water, and the pollution load of rivers will be reduced. As compared with the conventional wastewater treatment, this treatment is cost effective, easy to set up, and requires low maintenance. For the prediction of the efficiency of experimental set ups, mathematical modeling using the appropriate methods is highly recommended.
Author Contributions
All authors have contributed equally for this work. All authors have read and agreed to the published version of the manuscript.
Funding
This research received no external funding.
Institutional Review Board Statement
Not applicable.
Informed Consent Statement
Not applicable.
Data Availability Statement
The data presented in this study are available on request from the corresponding author.
Acknowledgments
The authors would like to convey thanks to the Joint Secretary, Water Supply and Drainage Department, Pimpri Chinchwad Municipal Corporation, Pune and Project Manager, HNB Engineers Pvt. Ltd. for the permission and support provided for conducting this study.
Conflicts of Interest
The authors declare no conflict of interest.
References
- Tchobanoglous, G.; Burton, F.L.; Stensel, H.D. Wastewater engineering: An Overview. Management 1991, 7, 4. Available online: http://www.mumbaidp24seven.in/reference/Ch_1WastewaterEngineering4thed_byMetcalfandEddy.pdf (accessed on 1 November 2020).
- Singh, K.; Dharmendra. Power density analysis by using soft computing techniques for microbial fuel cell. J. Environ. Treat. Tech. 2019, 7, 1068–1073. [Google Scholar]
- Singh, K.; Dharmendra. Performance of a dual chamber microbial fuel cell using sodium chloride as catholyte. Pollution 2020, 6, 79–86. [Google Scholar] [CrossRef]
- Justin, L.D.; Olukanni, D.O.; Babaremu, K.O. Performance assessment of local aquatic macrophytes for domestic wastewater treatment in Nigerian communities: A review. Heliyon 2022, 8, e10093. [Google Scholar] [CrossRef] [PubMed]
- Singh, K.; Dharmendra. Optimization and performance evaluation of microbial fuel cell by varying agar concentration using different salts in salt bridge medium. Arch. Mater. Sci. Eng. 2020, 101, 79–84. [Google Scholar] [CrossRef]
- Zheng, R.; Gao, H.; Ren, Z.; Cen, D.; Chen, Z. Preparation of activated bentonite and its adsorption behavior on oil-soluble green pigment. Physicochem. Probl. Miner. Process. 2017, 53, 829–845. [Google Scholar] [CrossRef]
- Liu, X.; Duan, X.; Bao, T.; Hao, D.; Chen, Z.; Wei, W.; Wang, D.; Wang, S.; Ni, B.-J. High-performance photocatalytic decomposition of PFOA by BiOX/TiO2 heterojunctions: Self-induced inner electric fields and band alignment. J. Hazard. Mater. 2022, 430, 128195. [Google Scholar] [CrossRef] [PubMed]
- Fletcher, J.; Willby, N.; Oliver, D.M.; Quilliam, R.S. Phytoremediation Using Aquatic Plants; Springer International Publishing: New York, NY, USA, 2020; pp. 205–260. [Google Scholar] [CrossRef]
- Koutsou, O.P.; Gatidou, G.; Stasinakis, A.S. Domestic wastewater management in Greece: Greenhouse gas emissions estimation at country scale. J. Clean. Prod. 2018, 188, 851–859. [Google Scholar] [CrossRef]
- Mohedano, R.A.; Tonon, G.; Costa, R.H.; Pelissari, C.; Filho, P.B. Does duckweed ponds used for wastewater treatment emit or sequester greenhouse gases? Sci. Total Environ. 2019, 691, 1043–1050. [Google Scholar] [CrossRef]
- Rezania, S.; Ponraj, M.; Talaiekhozani, A.; Mohamad, S.E.; Din, M.F.M.; Taib, S.M.; Sabbagh, F.; Sairan, F.M. Perspectives of phytoremediation using water hyacinth for removal of heavy metals, organic and inorganic pollutants in wastewater. J. Environ. Manag. 2015, 163, 125–133. [Google Scholar] [CrossRef]
- Wooten, J.W.; Dodd, J.D. Growth of water hyacinths in treated sewage effluent. Econ. Bot. 1976, 30, 29–37. [Google Scholar] [CrossRef]
- Kotoula, D.; Iliopoulou, A.; Irakleous-Palaiologou, E.; Gatidou, G.; Aloupi, M.; Antonopoulou, P.; Fountoulakis, M.S.; Stasinakis, A.S. Municipal wastewater treatment by combining in series microalgae Chlorella sorokiniana and macrophyte Lemna minor: Preliminary results. J. Clean. Prod. 2020, 271, 122704. [Google Scholar] [CrossRef]
- Lu, Q.; He, Z.L.; Graetz, D.A.; Stoffella, P.J.; Yang, X. Phytoremediation to remove nutrients and improve eutrophic stormwaters using water lettuce (Pistia stratiotes L.). Environ. Sci. Pollut. Res. 2010, 17, 84–96. [Google Scholar] [CrossRef] [PubMed]
- Sharma, P.; Pandey, A.K.; Udayan, A.; Kumar, S. Role of microbial community and metal-binding proteins in phytoremediation of heavy metals from industrial wastewater. Bioresour. Technol. 2021, 326, 124750. [Google Scholar] [CrossRef] [PubMed]
- Bassiouny, M.; Nasr, P.; Sewilam, H. Investigating the pilot-scale performance of a hydroponic nutrient solution as potential draw solution for fertilizer drawn forward osmosis and hydroponic agriculture of lettuce. Clean Technol. Environ. Policy 2022, 24, 2749–2760. [Google Scholar] [CrossRef]
- Ansari, A.A.; Naeem, M.; Gill, S.S.; AlZuaibr, F.M. Phytoremediation of contaminated waters: An eco-friendly technology based on aquatic macrophytes application. Egypt. J. Aquat. Res. 2020, 46, 371–376. [Google Scholar] [CrossRef]
- Tyagi, A. Central Pollution Control Board India, Performance Evaluation of Sewage Treatment Plants under NRCD; Central Pollution Control Board, Ministry of Environment and Forests: Delhi, India, 2013. [Google Scholar]
- Joshi, S.; Patil, P. Eco-Treatment Zone in Open Drain. In Water Resources Management: Select Proceedings of ICWEES-2016; Springer: Singapore, 2018; pp. 79–90. [Google Scholar] [CrossRef]
- Shah, M.; Hashmi, H.N.; Ali, A.; Ghumman, A.R. Performance assessment of aquatic macrophytes for treatment of municipal wastewater. J. Environ. Health Sci. Eng. 2014, 12, 1–12. [Google Scholar] [CrossRef] [PubMed] [Green Version]
- Mahajan, B.; Shastri, S.; Londhe, S. Impact Assessment of Waste Water Streams on Water Quality of River Pavana in Pimpri Chinchwad City Area. In Proceedings of the 2021 International Conference on Computing, Communication and Green Engineering (CCGE), Pune, India, 8–10 July 2021; pp. 1–6. [Google Scholar] [CrossRef]
- PCMC. Environment Status Report; Pimpri Chinchwad Munciple Corporation: Pune, India, 2022. [Google Scholar]
- Gaballah, M.S.; Ismail, K.; Beltagy, A.; Eldin, A.M.Z.; Ismail, M.M. Wastewater Treatment Potential of Water Lettuce (Pistia stratiotes) with Modified Engineering Design. J. Water Chem. Technol. 2019, 41, 197–205. [Google Scholar] [CrossRef]
- Nahar, K.; Hoque, S. Phytoremediation to improve eutrophic ecosystem by the floating aquatic macrophyte, water lettuce (Pistia stratiotes L.) at lab scale. Egypt. J. Aquat. Res. 2021, 47, 231–237. [Google Scholar] [CrossRef]
- Lu, B.; Xu, Z.; Li, J.; Chai, X. Removal of water nutrients by different aquatic plant species: An alternative way to remediate polluted rural rivers. Ecol. Eng. 2017, 110, 18–26. [Google Scholar] [CrossRef]
- Aalam, T.; Arias, C.A.; Khalil, N. Physicochemical and Biological Contribution of Native Macrophytes in the Constructed Wetlands to Treat Municipal Wastewater: A Pilot-Scale Experiment in a Sub-Tropical Climate Region. Recycling 2022, 7, 8. [Google Scholar] [CrossRef]
- Osama, R.; Awad, H.M.; Ibrahim, M.G.; Tawfik, A. Mechanistic and economic assessment of polyester wastewater treatment via baffled duckweed pond. J. Water Process. Eng. 2020, 35, 101179. [Google Scholar] [CrossRef]
- Oladejo, O.S.; Ojo, O.M.; Akinpelu, O.I. Wastewater Treatment Using Constructed Wetland With Water Lettuce (Pistia Stratiotes). Int. J. Chem. Environ. Biol. Sci. 2015, 3, 119–124. Available online: http://www.isaet.org/images/extraimages/P315027.pdf (accessed on 1 November 2020).
- The, I.; Hoogleraar, P.; Delft, T.H.; Most, P.S.; The, B.T. The Effect of Wastewater and Treatment System on Effluent Quality H2O 1976, 9, 7–18. Available online: https://edepot.wur.nl/403238 (accessed on 1 November 2020).
- Awuah, E.; Oppong-Peprah, M.; Lubberding, H.J.; Gijzen, H.J. Comparative performance studies of water lettuce, duckweed, and algal-based stabilization ponds using low-strength sewage. J. Toxicol. Environ. Health Part A 2004, 67, 1727–1739. [Google Scholar] [CrossRef] [PubMed]
- Szabó, S.; Koleszár, G.; Braun, M.; Nagy, Z.; Vicei, T.T.; Peeters, E.T.H.M. Submerged Rootless Macrophytes Sustain a Stable State Against Free-Floating Plants. Ecosystems 2022, 25, 17–29. [Google Scholar] [CrossRef]
- Gupta, P.; Roy, S.; Mahindrakar, A.B. Treatment of Water Using Water Hyacinth, Water Lettuce and Vetiver Grass—A Review. Resour. Environ. 2012, 2, 202–215. [Google Scholar] [CrossRef]
- Javed, M.T.; Tanwir, K.; Akram, M.S.; Shahid, M.; Niazi, N.K.; Lindberg, S. Phytoremediation of Cadmium-Polluted Water/Sediment by Aquatic Macrophytes: Role of Plant-Induced pH Changes. In Cadmium Toxicity and Tolerance in Plants; Academic Press: Cambridge, MA, USA, 2019; pp. 495–529. [Google Scholar]
Figure 1.
Study area showing wastewater stream selected for experimental investigations.

Figure 2.
Flow chart for Methodology.

Figure 3.
Schematic diagram of experimental set up.

Figure 4.
Change in DO with respect to Detention Time: (a) Change in DO for 50% plant area coverage; (b) Change in DO for 90% plant area coverage.
Figure 4.
Change in DO with respect to Detention Time: (a) Change in DO for 50% plant area coverage; (b) Change in DO for 90% plant area coverage.

Figure 5.
Change in BOD with respect to Detention Time: (a) Change in BOO for 50% plant area coverage; (b) Change in BOD for 90% plant area coverage.
Figure 5.
Change in BOD with respect to Detention Time: (a) Change in BOO for 50% plant area coverage; (b) Change in BOD for 90% plant area coverage.

Figure 6.
Change in COD with respect to Detention Time: (a) Change in COD for 50% plant area coverage; (b) Change in COD for 90% plant area coverage.
Figure 6.
Change in COD with respect to Detention Time: (a) Change in COD for 50% plant area coverage; (b) Change in COD for 90% plant area coverage.

Figure 7.
Change in TS with respect to Detention Time: (a) Change in TS for 50% plant area coverage; (b) Change in TS for 90% plant area coverage.
Figure 7.
Change in TS with respect to Detention Time: (a) Change in TS for 50% plant area coverage; (b) Change in TS for 90% plant area coverage.


Table 1.
Initial Characteristics of Wastewater.
| Parameters | Minimum (mg/L) | Maximum (mg/L) | Mean | SD |
|---|---|---|---|---|
| Dissolved Oxygen | 0.00 | 3.90 | 1.57 | 1.02 |
| Biochemical Oxygen Demand | 17.14 | 88.00 | 45.69 | 16.53 |
| Chemical Oxygen Demand | 24.49 | 448.56 | 135.35 | 82.93 |
| Total solids | 400.00 | 934.00 | 567.32 | 123.14 |
Disclaimer/Publisher’s Note: The statements, opinions and data contained in all publications are solely those of the individual author(s) and contributor(s) and not of MDPI and/or the editor(s). MDPI and/or the editor(s) disclaim responsibility for any injury to people or property resulting from any ideas, methods, instructions or products referred to in the content. |
© 2023 by the authors. Licensee MDPI, Basel, Switzerland. This article is an open access article distributed under the terms and conditions of the Creative Commons Attribution (CC BY) license (https://creativecommons.org/licenses/by/4.0/).
Share and Cite
MDPI and ACS Style
Mahajan, B.; Shastri, S.; Londhe, S. Waste Removal Efficiencies of Floating Macrophytes for Restoration of Polluted Stream: An Experimental Analysis. Urban Sci. 2023, 7, 27. https://doi.org/10.3390/urbansci7010027
AMA Style
Mahajan B, Shastri S, Londhe S. Waste Removal Efficiencies of Floating Macrophytes for Restoration of Polluted Stream: An Experimental Analysis. Urban Science. 2023; 7(1):27. https://doi.org/10.3390/urbansci7010027
Chicago/Turabian StyleMahajan, Bharati, Sameer Shastri, and Shreenivas Londhe. 2023. "Waste Removal Efficiencies of Floating Macrophytes for Restoration of Polluted Stream: An Experimental Analysis" Urban Science 7, no. 1: 27. https://doi.org/10.3390/urbansci7010027