1. Introduction
A distinctive aspect of contemporary cities is the constant change they experience in their built environment. Urban growth, both horizontal and vertical, is a topic of interest because of the environmental and landscape effects that it causes. From this perspective, continuous urbanization produces important environmental changes in the global context, rooted at the local scale [
1,
2,
3,
4]. Unplanned urban growth creates urban problems as well as environmental side effects. For example, urban development in the periphery increases a city’s boundary limits, and if located in risk areas, it can generate considerable environmental side effects. Urbanization in the periphery implies a reconfiguration of space and, therefore, environmental changes for every community [
5,
6].
Unplanned urbanization can mean an increase in hydrometeorological events, such as floods, which are experienced by most cities. Urbanized areas lose moisture retention capacity when the vegetal cover is replaced by concrete or asphalt surfaces, causing important surface water run-offs during rain seasons [
7,
8,
9]. Considerable water run-off increase can have significant consequences, as urban textures favor impervious surfaces. In this context, water run-off is an interesting variable of study because of their contribution to floods in urban systems.
Land use transformation and intensified urbanization generate important changes in natural drainage systems and watersheds [
10,
11]. Current territory modifications, including public and private space, imply sealed and impervious surfaces, in which rainwater management and conduction occurs mainly through hydraulic engineering methods [
12,
13].
In cities, drainage infrastructure has proven incapable of handling run-off during floods and flash floods—especially in places where precipitation is largely variable due to climatic characteristics—and yet, it still minimizes the potential water that could be infiltrated, integrated in the aquifer, and recirculated through the hydrological system.
In this context, the appraisal of water run-off coefficients in different scenarios of the built environment can be applied to urban design and construction. Such hydrological consideration may contribute to better city-planning and the improvement of the urban environment without negative effects on economic and social development. Furthermore, such assessment must be supported with sufficient knowledge of soil management, water reservoir management, and the strategic planning of vegetal cover in slope surfaces, especially in rural and agro-ecological systems [
14].
The recent literature contains numerous studies in urban areas with previous levels of development. However, only a few of them project advances for their urban growth, especially regarding applied problems.
Therefore, there is an urgent need to adopt hydrological strategies, such as those mentioned above in new urban developments, with the aim of increasing surfaces for water filtration. Projects and designs in slope surfaces must promote better run-off water use and management [
15], especially for the mitigation of floods in nearby areas. To date, several different techniques and urban design strategies that foster ecohydrological functions have emerged, contributing to a preference for water filtration through significant vegetal cover [
16,
17], while improving urban system conditions.
Meanwhile, new construction must consider current urban design innovations for the local hydrological context. Such changes imply that run-off water might be collected and used as a resource instead of being disposed as wastewater directly.
Two emergent challenges that urban development faces are the reduction of the negative environmental effects of construction and the guarantee of a sustainable integration of human (or social) dynamics into the natural systems at local scale [
18,
19]. Such tasks should be approached from an integrated ecological and territory planning and management perspective. In this regard, Latin American cities frequently experience unplanned urban growth, and Mexican cities are not an exception. In Mexico, there are several cities with precarious human settlements or sanctioned urban developments on slope surfaces. In this context, urbanization modifies watersheds and the landscape, generating alternative effects which can lead to aggravated problems. If there is no proper management of slope surfaces, water run-off and soil structure loss can lead to landslides, as well as human and economic losses, especially during rain seasons [
20,
21].
Another aspect of ongoing relevance is the study of urban systems in arid and semi-arid regions, for which models and methods require adjustments depending on the conditions of the environment.
For one pavement permeability model, the assessment of time concentration in terms of flux velocity was an innovative parameter to analyze an urban surface in the semi-arid city of Tehran, Iran [
22]. In another study, vegetal cover in a rain garden and pervious pavement were factors that allowed for reducing the peak rate of run-off in Detroit, MI, USA, as well as in Addis Ababa, Ethiopia [
23]. Further, a hydrological and hydraulic coupling for different return periods based on a regional frequency analysis was used for research in Mexicali, Baja California, Mexico, as rainfall intensity data were null [
24]. Another study reported the adaptation of green infrastructure in roofs of new houses complexes, which allowed for the interception of run-off, as well as water collection, in Mineral de la Reforma, Hidalgo, Mexico [
25].
Although some zones can favor hydro-meteorological events such as floods, there are also regions in which precipitation is not frequent, but eventual torrential rains are. An example of a city with such characteristics is San Luis Potosi, the place where the present study was conducted. Thus, the central argument is that urban development construction processes that integrate eco-hydrologic adaptation in slope surfaces can contribute to the mitigation of water run-offs in a micro-watershed within the urban periphery.
The area where this study was conducted is an area of rapid and commercial growth located in the west of the city, on one side of Sierra de San Miguelito. The study area is of crucial importance because it is located in a zone of high real-estate speculation and also because it presented the conditions for realizing the run-off estimations based on data from a previous study. It may be assumed that real-estate developers are ignorant of the importance of slope surfaces for water run-offs and their probable effects. In addition, current urban plans omit the ecological importance of unpaved soil and the implementation of adequate vegetal cover, which implicates land-use and sustainable urban design principles.
Currently, there are several paths to increase vegetation cover and green spaces in urban systems. However, planting specific tree species and fostering sustainable patterns of urban growth can offer certain ecosystem services that are vital to maintain soil structure, increase water filtration, and reduce water run-offs. This work considers three possible urban development patterns in the micro-watershed that are characterized by run-off coefficients. A sustainable alternative for the micro-watershed was recognized as a result of the projected scenarios. The best scenario showed how urban development can foster eco-hydrological principles while maintaining a high urban density and without undermining real-estate profitability.
2. Materials and Methods
2.1. Site Study
The study site is located in the northern portion of the mountain range Sierra de San Miguelito, in the western limits of San Luis Potosí, México. From a hydrological perspective, the studied micro-watershed belongs to the Hydrological Region No. RH-37 El Salado, which is characterized by the presence of important rivers and streams, as well as natural water outputs from higher zones or micro-watersheds. The climate is dry steppe, semi-arid (BS1kw) with summer rains, some isolated in winter, and an average annual temperature between 12 °C and 18 °C. For the city area, a low saturation of water vapor and an average annual rainfall below 400 mm per year has been indicated [
26].
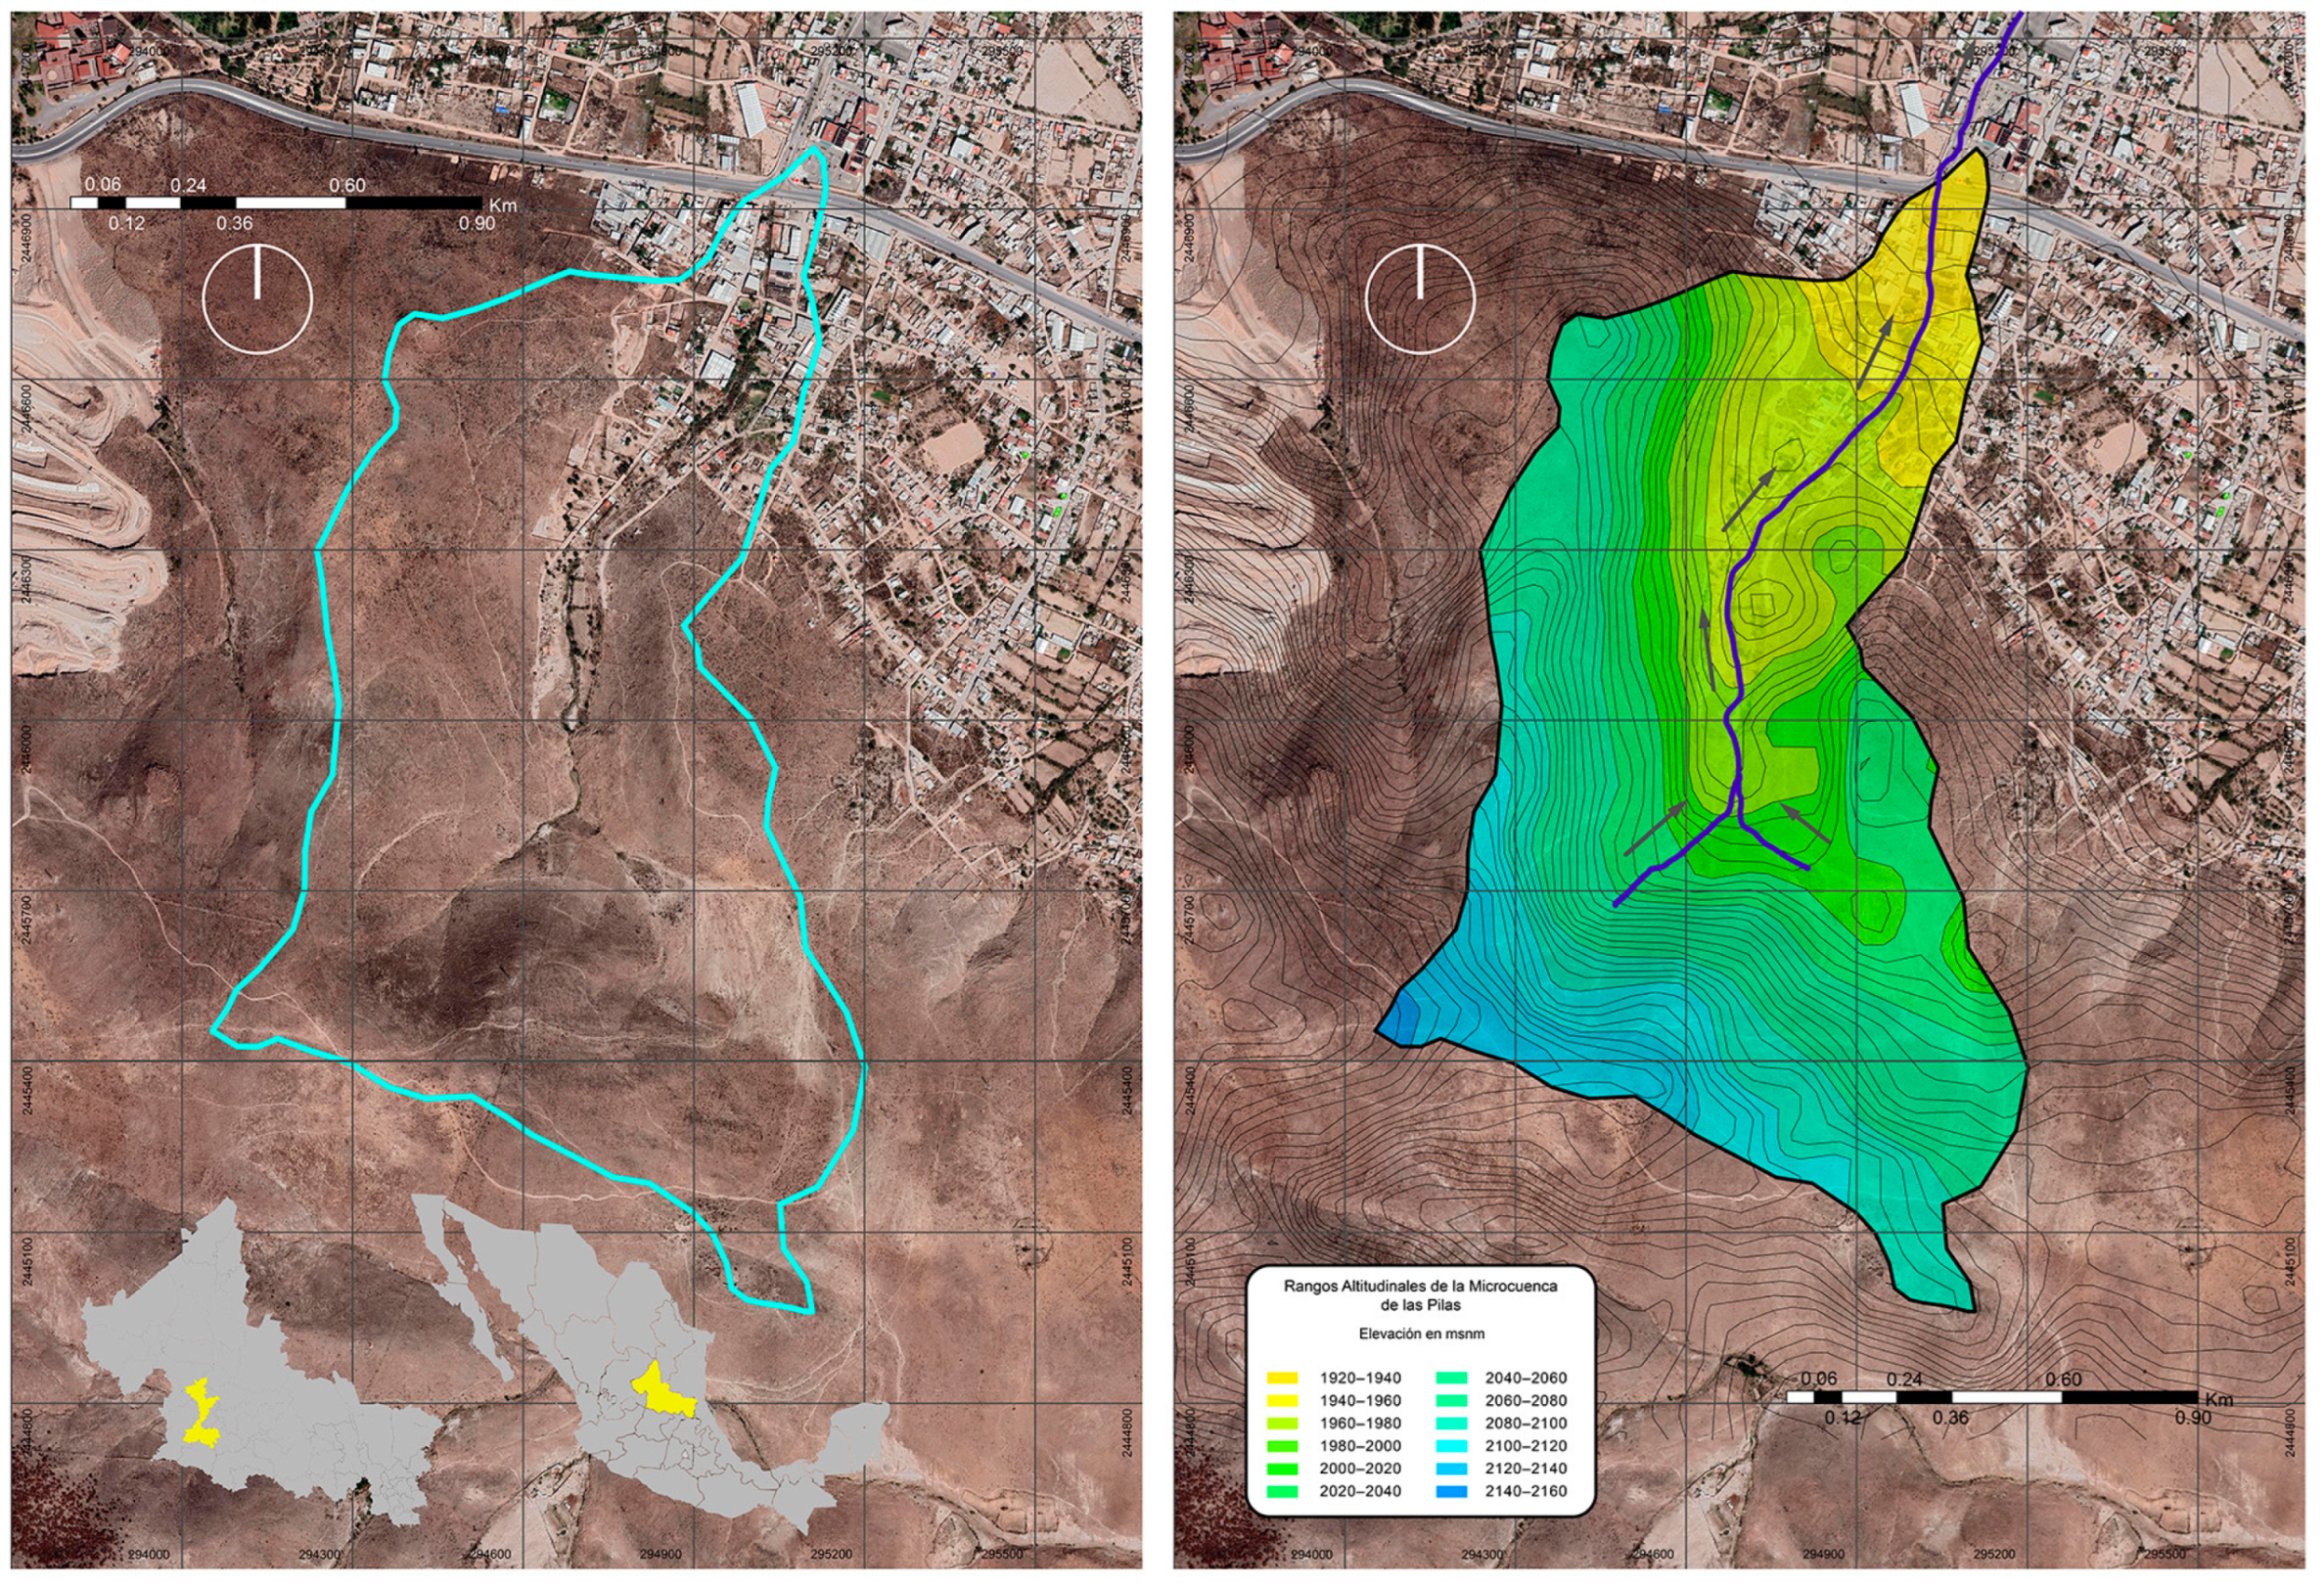
The micro-watershed under study, Las Pilas, is located in the northeastern urban limit of San Luis Potosí and exhibits run-offs that impact the lower zones. In an initial study, the micro-watershed’s polygon was defined using geographic coordinates and compared with a digital database from the National Statistics and Geography Institute (INEGI, by its acronym in Spanish). Additionally, topographic curves were obtained using Global Mapper v. 21.0, a software package from Blue Marble Geographics (
Figure 1).
The micro-watershed’s outlet is located on two primary streets from the periphery of the urban zone. According to the data obtained by site studies, the topographic relief indicated a slope of 2.5° and the rainfall intensity was determined within a drained area of 0.014 km2, converging on the lower part of the micro-watershed where the city exhibits urban growth.
The maximum and minimum elevation of its main collector is 2020 and 1910 m above sea level, respectively, and its height difference (H) is 110 m. The length of the main channel (Lc) is 1634 km and its average slope (S) is 0.0731, dimensionless. The characteristics of the relief and slope of the terrain define this area as the system’s outlet, where one of the two primary streets can lead to floods by excessive runoff.
2.2. Runoff Coefficient Calculation
The field data and the measurements made in the area of 0.014 km2 allowed for characterizing the area as a transition zone of bare ground with irregular settlements, dirt roads, and urban sprawl with paved streets and housing construction based on concrete slab. Collected information enabled runoff values for three scenarios that considered constructed areas as urban growth parameters: non-urbanized, corresponding to the current state; partially urbanized, corresponding to low-density urbanization with extensive green areas; totally urbanized, corresponding to regions of the study area expected to lead to unsustainable development due to maximization of land use and economic benefits.
Flood design (
QTr) was calculated using the formula of the rational method for return periods (
Tr) for 2, 5, 10, and 25 years, considering the three above-mentioned urban development scenarios (urbanization scenarios): (a) non-urbanized, (b) partially urbanized, and (c) totally urbanized. To perform such estimations, the following three calculations were required: (1) dimensionless runoff coefficients (
C), related to the micro-watershed conditions and the return periods (
Tr) adopted; (2) time of concentration (
Tc) expressed in minutes; and (3) maximum rainfall intensities (
I), corresponding to the duration of
Tc and with the recurrences of the selected
Tr. In order to obtain runoff coefficients, the values were adopted from Chow et al. [
27] (
Table 1).
To obtain the time of concentration (
Tc) while considering the size of the micro-watershed, the formulas of Kirpich [
28] and California Highways and Public Works [
29] were applied:
In both empirical formulas,
Lc is the main channel length expressed in km, whereas
H is the height difference expressed in m. Rain intensities for locality No. 33 (San Luis Potosí, S.L.P.) were taken from Campos-Aranda [
30] according to Chen’s formula [
31]. These values are as follows: maximum precipitation in one hour and
Tr = 10 years (
=
) equal to 42 mm; maximum daily rainfall (PMD) of
Tr = 10 and 100 years, equal to 59.8 and 79.0 mm;
a = 45.012,
b = 12.029, and
c = 0.891. A rainfall intensity type was used in this study. It is not viable to obtain Intensity–Duration–Frequency estimation curves (IDF) for specific regions in the urbanized area, since local pluviographic information is not existent. However, Chen’s formula was used to incorporate available pluviometer data. Its contrast and relevance for different climatic zones has been tested by Campos-Aranda [
32].
Thus, according to Chen [
31], the duration expressed in minutes (
t) was calculated as
where
F is the rain-frequency factor, whose value of 1.321 was obtained by dividing 79.0 by 59.8 mm. Substituting the mentioned values, the following parameters were obtained: α
2 = 1466.2, α
5 = 1707.6, α
10 = 1890.4, and α
25 = 2131.9. As a result, the design intensities for the
Tc of 16.4 min were as follows:
Flood design estimation (
QTr), expressed in m
3/s, was obtained using the rational method formula through the following algorithm:
where the rainfall intensity (
I) is in mm/h and the micro-watershed area (
A) is 0.014 km
2, which corresponds with the micro-watershed’s outlet from the initial study with the dimensionless runoff coefficient (
C) [
33].
Table 2 compiles resulting runoff coefficient (
C), rainfall intensities (
I), and flood design (
QTr).
The assessment of the maximum design flood estimation (QTr) for the current conditions, partial urbanization, and total urbanization served as the basis for estimating the different urbanization scenarios. The modeling parameters for each modeled scenario are described below.
2.3. Digital Modeling
Assuming continuous urban growth and the extension of urban sprawl in the micro-watershed, four scenarios were modeled. For this study, the first tool was the digital modeling of the micro-watershed, which allowed control and precision of the area’s quantification using the software Rhinoceros v. 6 SR23 (2020). This allowed for generating scenarios attached to the probable levels of urbanization and their respective design flood estimation (QTr). The visualizations of the model for each scenario were generated using 3dMax v. 2020, software from Autodesk.
2.4. Current Situation (without Urbanization)
The scenarios were modeled based on the calculation of the micro-watershed’s area of 1.27 km2, of which, 1.09 km2 was considered as deforested land without urbanization. This area is composed of isolated bushes with a maximum height of 1 m, which constitutes secondary natural vegetation. Although other hydrological assessments were not considered, the current conditions of this surface suggest probable soil permeability and infiltration. On the other hand, the remaining surface of the micro-watershed (0.181 km2) corresponds to an area of informal settlements with low land occupancy (Floor Area Ratio or FAR) and a low land-use coefficient (Building Coverage Ratio or BCR).
The lots also exhibit rural typologies and large dimensions and are delimited by self-built fences. Thus, of the remaining 0.181 km
2 area, the built surface covers a total average of 12.4%, in which most of the constructions are one-story homes. The existing roads to access such constructions are dirt roads, which can be considered permeable. In the northern part of the micro-watershed, the surface of 0.007 km
2 is completely paved. Therefore, of the total area of the micro-watershed, only 2.73% is covered by impermeable surfaces, considering the current urban development. In this context, the permeable surface is 1.24 km
2, while the impermeable surface corresponds to an area of 0.029 km
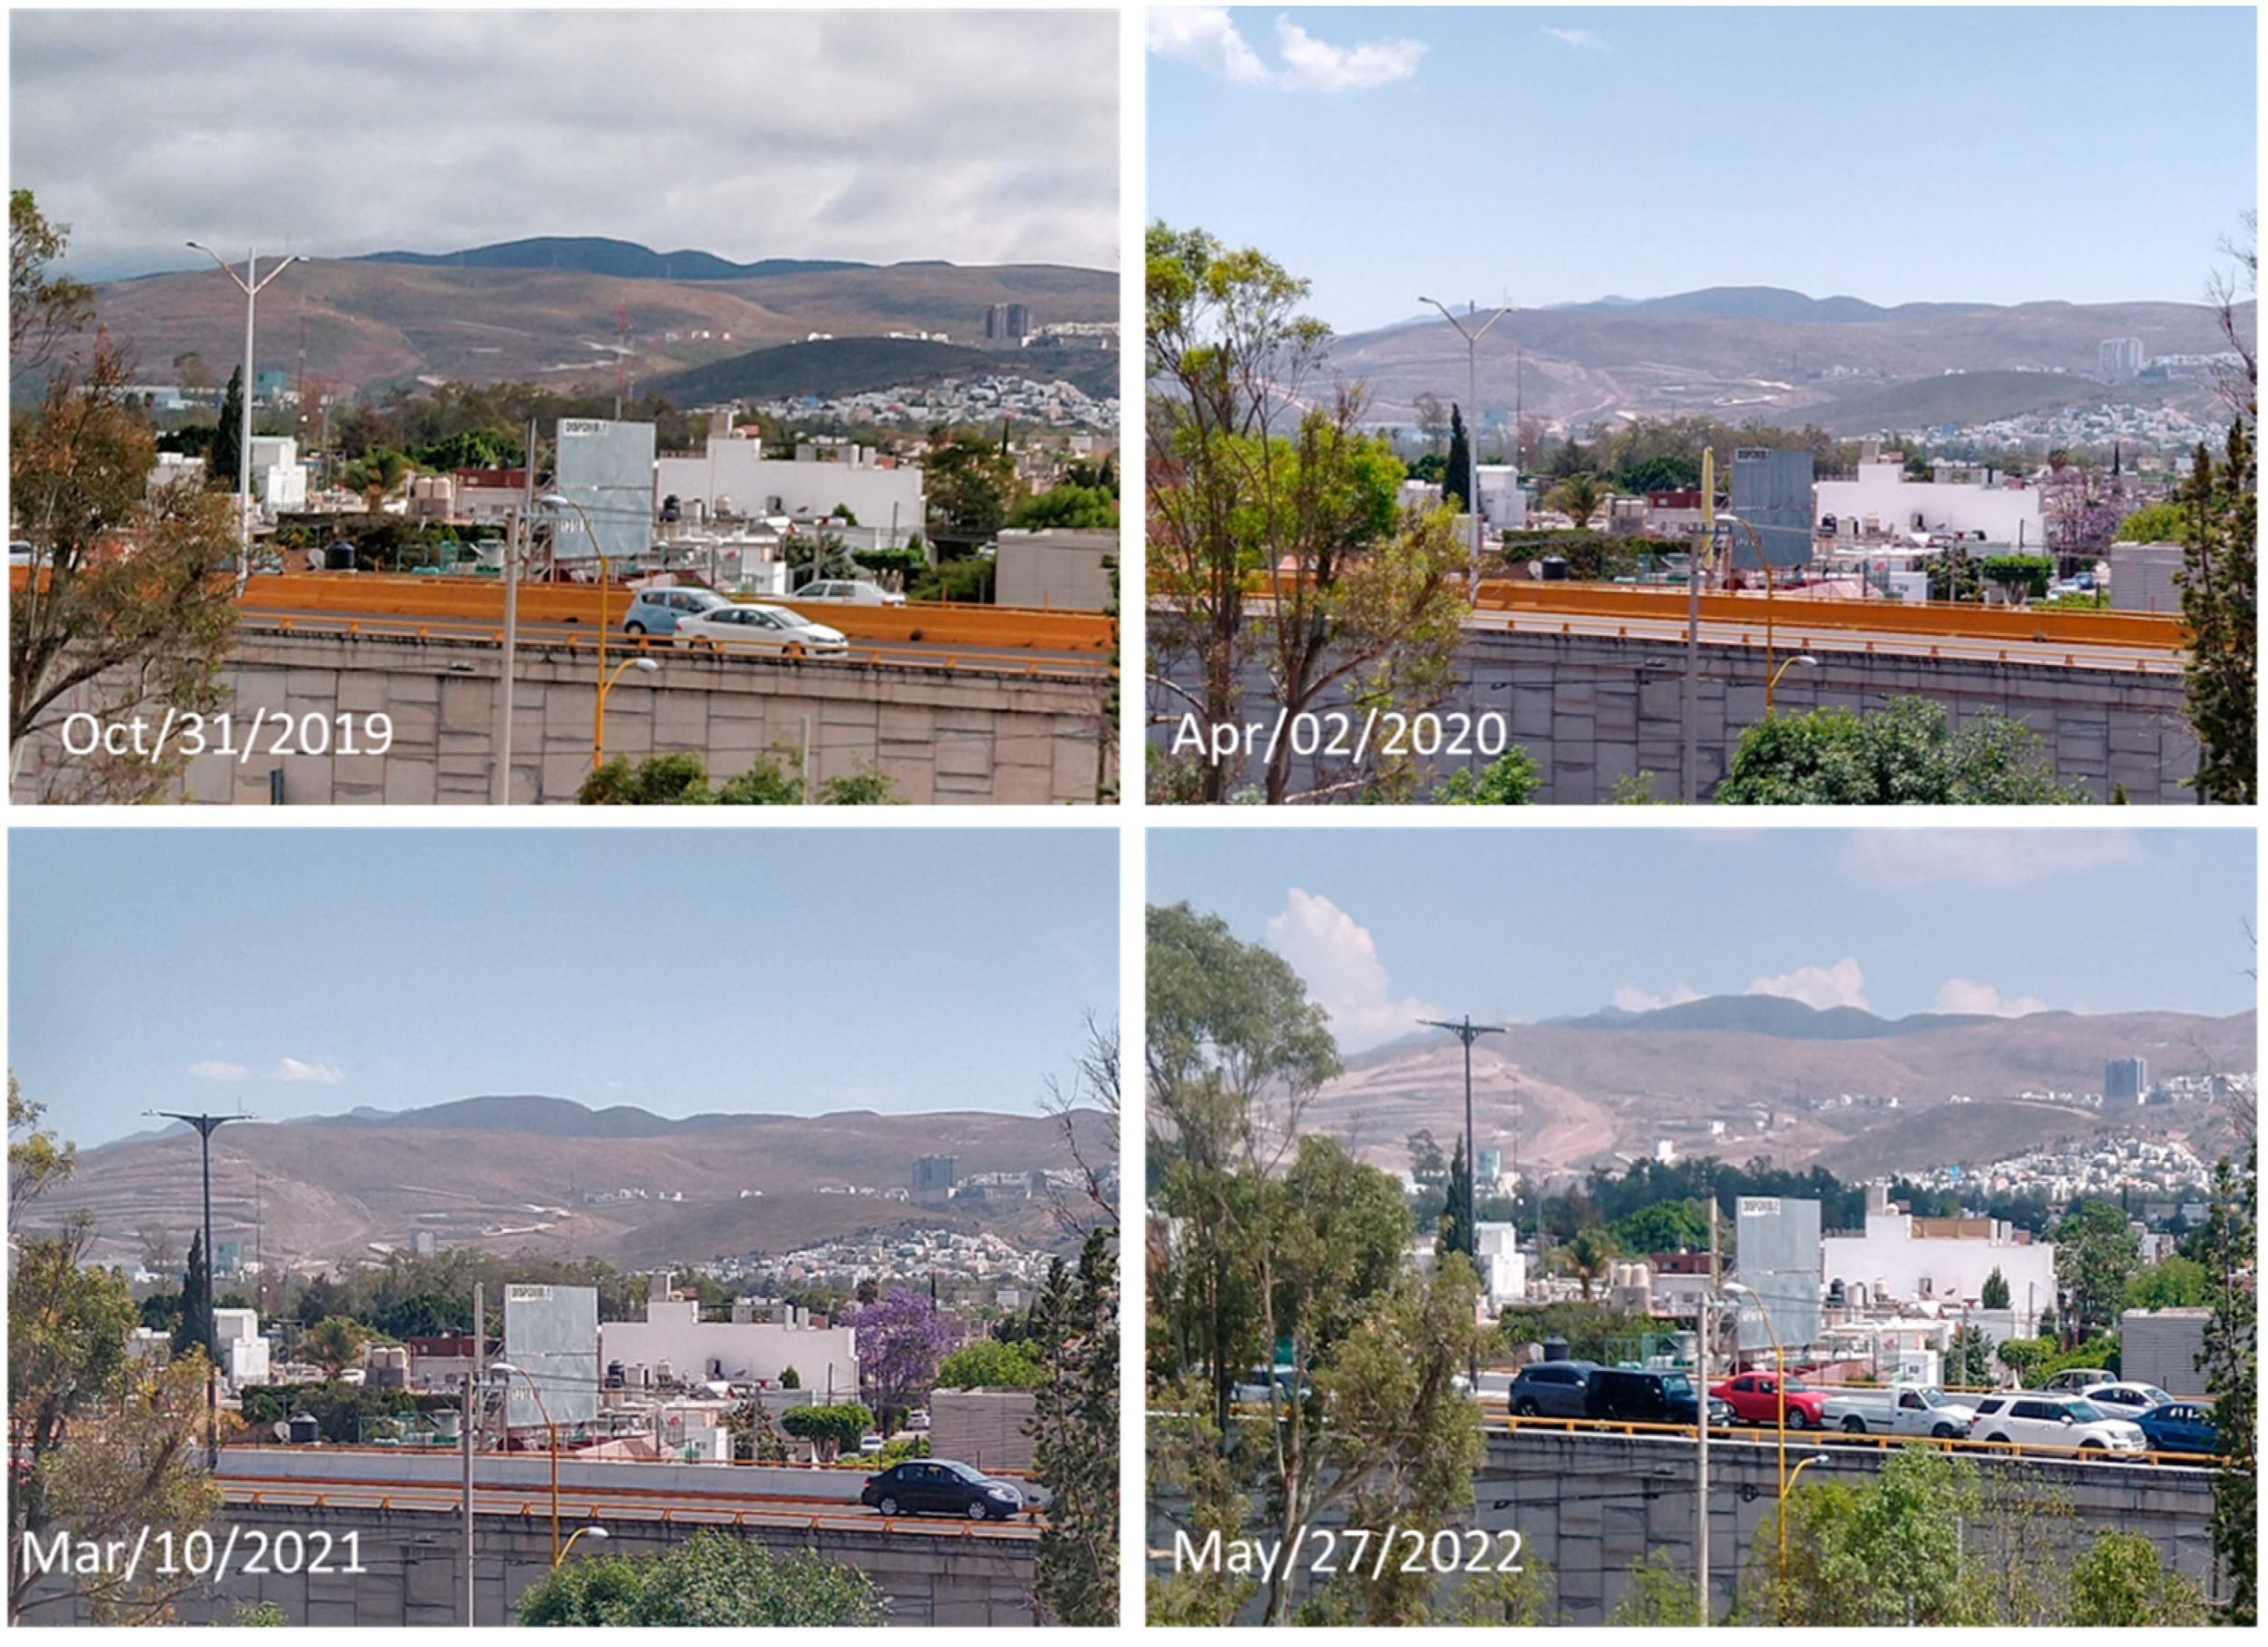
2. In addition, this area has exhibited ongoing urbanization pressure over the last three years. The urban sprawl can be observed on the north face, and a part of the land-use changes toward the west of the micro-watershed, as shown in
Figure 1. This last area has shown transformations across the landscape and the rapid urbanization of views in the last three years, as illustrated in
Figure 2.
2.5. High Urban Density
The parameters we considered to model this scenario included the area currently occupied by informal settlements (0.181 km2), a maximum BCR of 70%, and high-density residential FAR four-story constructions. For the remaining area (1.09 km2), an urbanization model that was detached from the site’s topographic lines was conceived. The described urban development prioritizes overcrowding of the land, traffic routes imposed on natural formations, and an important reduction of natural and permeable land. Additionally, the built surface we modeled supposes the use of impermeable materials, a trace of rectilinear roads without considering topography, and the probable runoff.
A characteristic of this scenario is that the lots along the primary roads become part of commercial corridors, which allows a change in the land-use to mixed and high-density according to San Luis Potosí’s Urban Development Plan (Secretaria General de Gobierno, S.L.P., 2018). These lots were assigned a higher density, resulting in ten-story buildings. Considering urban legislation, in this scenario, the permeable surface of the micro-watershed is 0.26 km2 (20.49%), the impermeable surface is 1.01 km2 (79.51%), and the area with buildable potential is 2.93 km2.
2.6. Low Urban Density (Green Area)
This scenario considered projections for the area already occupied by informal settlements (0.181 km2) and the probable urban growth within the existing lots. From all the lots, the BCR was determined based on 70% of the lot size and a projection of 3-story constructions corresponding to a FAR of average residential density, according to the San Luis Potosí’s Urban Development Plan. This modeling included the surfaces of local and paved roads, quantified as impervious surfaces.
Green area was projected in the remaining surfaces (1.09 km2), granting a larger unbuilt area. Thus, this urban model considered relatively larger lots (500–600 m2) surrounded by large extensions of gardens with permeability capacity. In this low-density model, buildings had three levels per lot, which meant an average height of 12 m. In this scenario, the areas with buildable potential signified profitable real estate development. Hence, this model envisaged 0.67 km2 (52.57%) of permeable surface, 0.6 km2 (47.42%) of impervious surface, and 0.97 km2 with buildable potential.
2.7. High Urban Density (Green Area)
This scenario was projected using the parameters of low urban density for green areas. However, it included a larger use of the buildable area: in the remaining area of 1.09 km2, urban planning was projected with a low-density approach while considering a BCR of 4-story constructions: 0.178 km2 (81.21%). The remaining portion of 0.041 km2 (18.79%) was treated as the effective construction area for buildings with 45 levels, or an average height of 135 m. This model presented the same construction capacity as the high-density scenario, but with low land-use.
The modeling of skyscrapers was based on reducing the probable effects of runoff, seeking a greater extension of permeable soil in the green area. This land area can host fragments of trees and shrubs. The proposal requires a set of plant species for semi-arid conditions that favor moisture retention in terms of the soil–plant–air system in suitable land areas and terraces. In addition, a projection of 40% permeable pavement in roads, access to housing complexes, parking areas, and roads with moderate traffic was included in the calculation of QTr. In addition, the model estimated a 10% area of green roofs and an 8.8% area of semi-pervious concrete, which allows rainwater harvesting. In this scenario, the permeable surface was 0.67 km2 (52.88%), impermeable surface was 0.6 km2 (47.12%), and 2.97 km2 belonged to the area with buildable potential.
Flood design estimations were obtained using the formula from the rational method with return periods of 2, 5, 10, and 25 years for each of the above-mentioned scenarios.
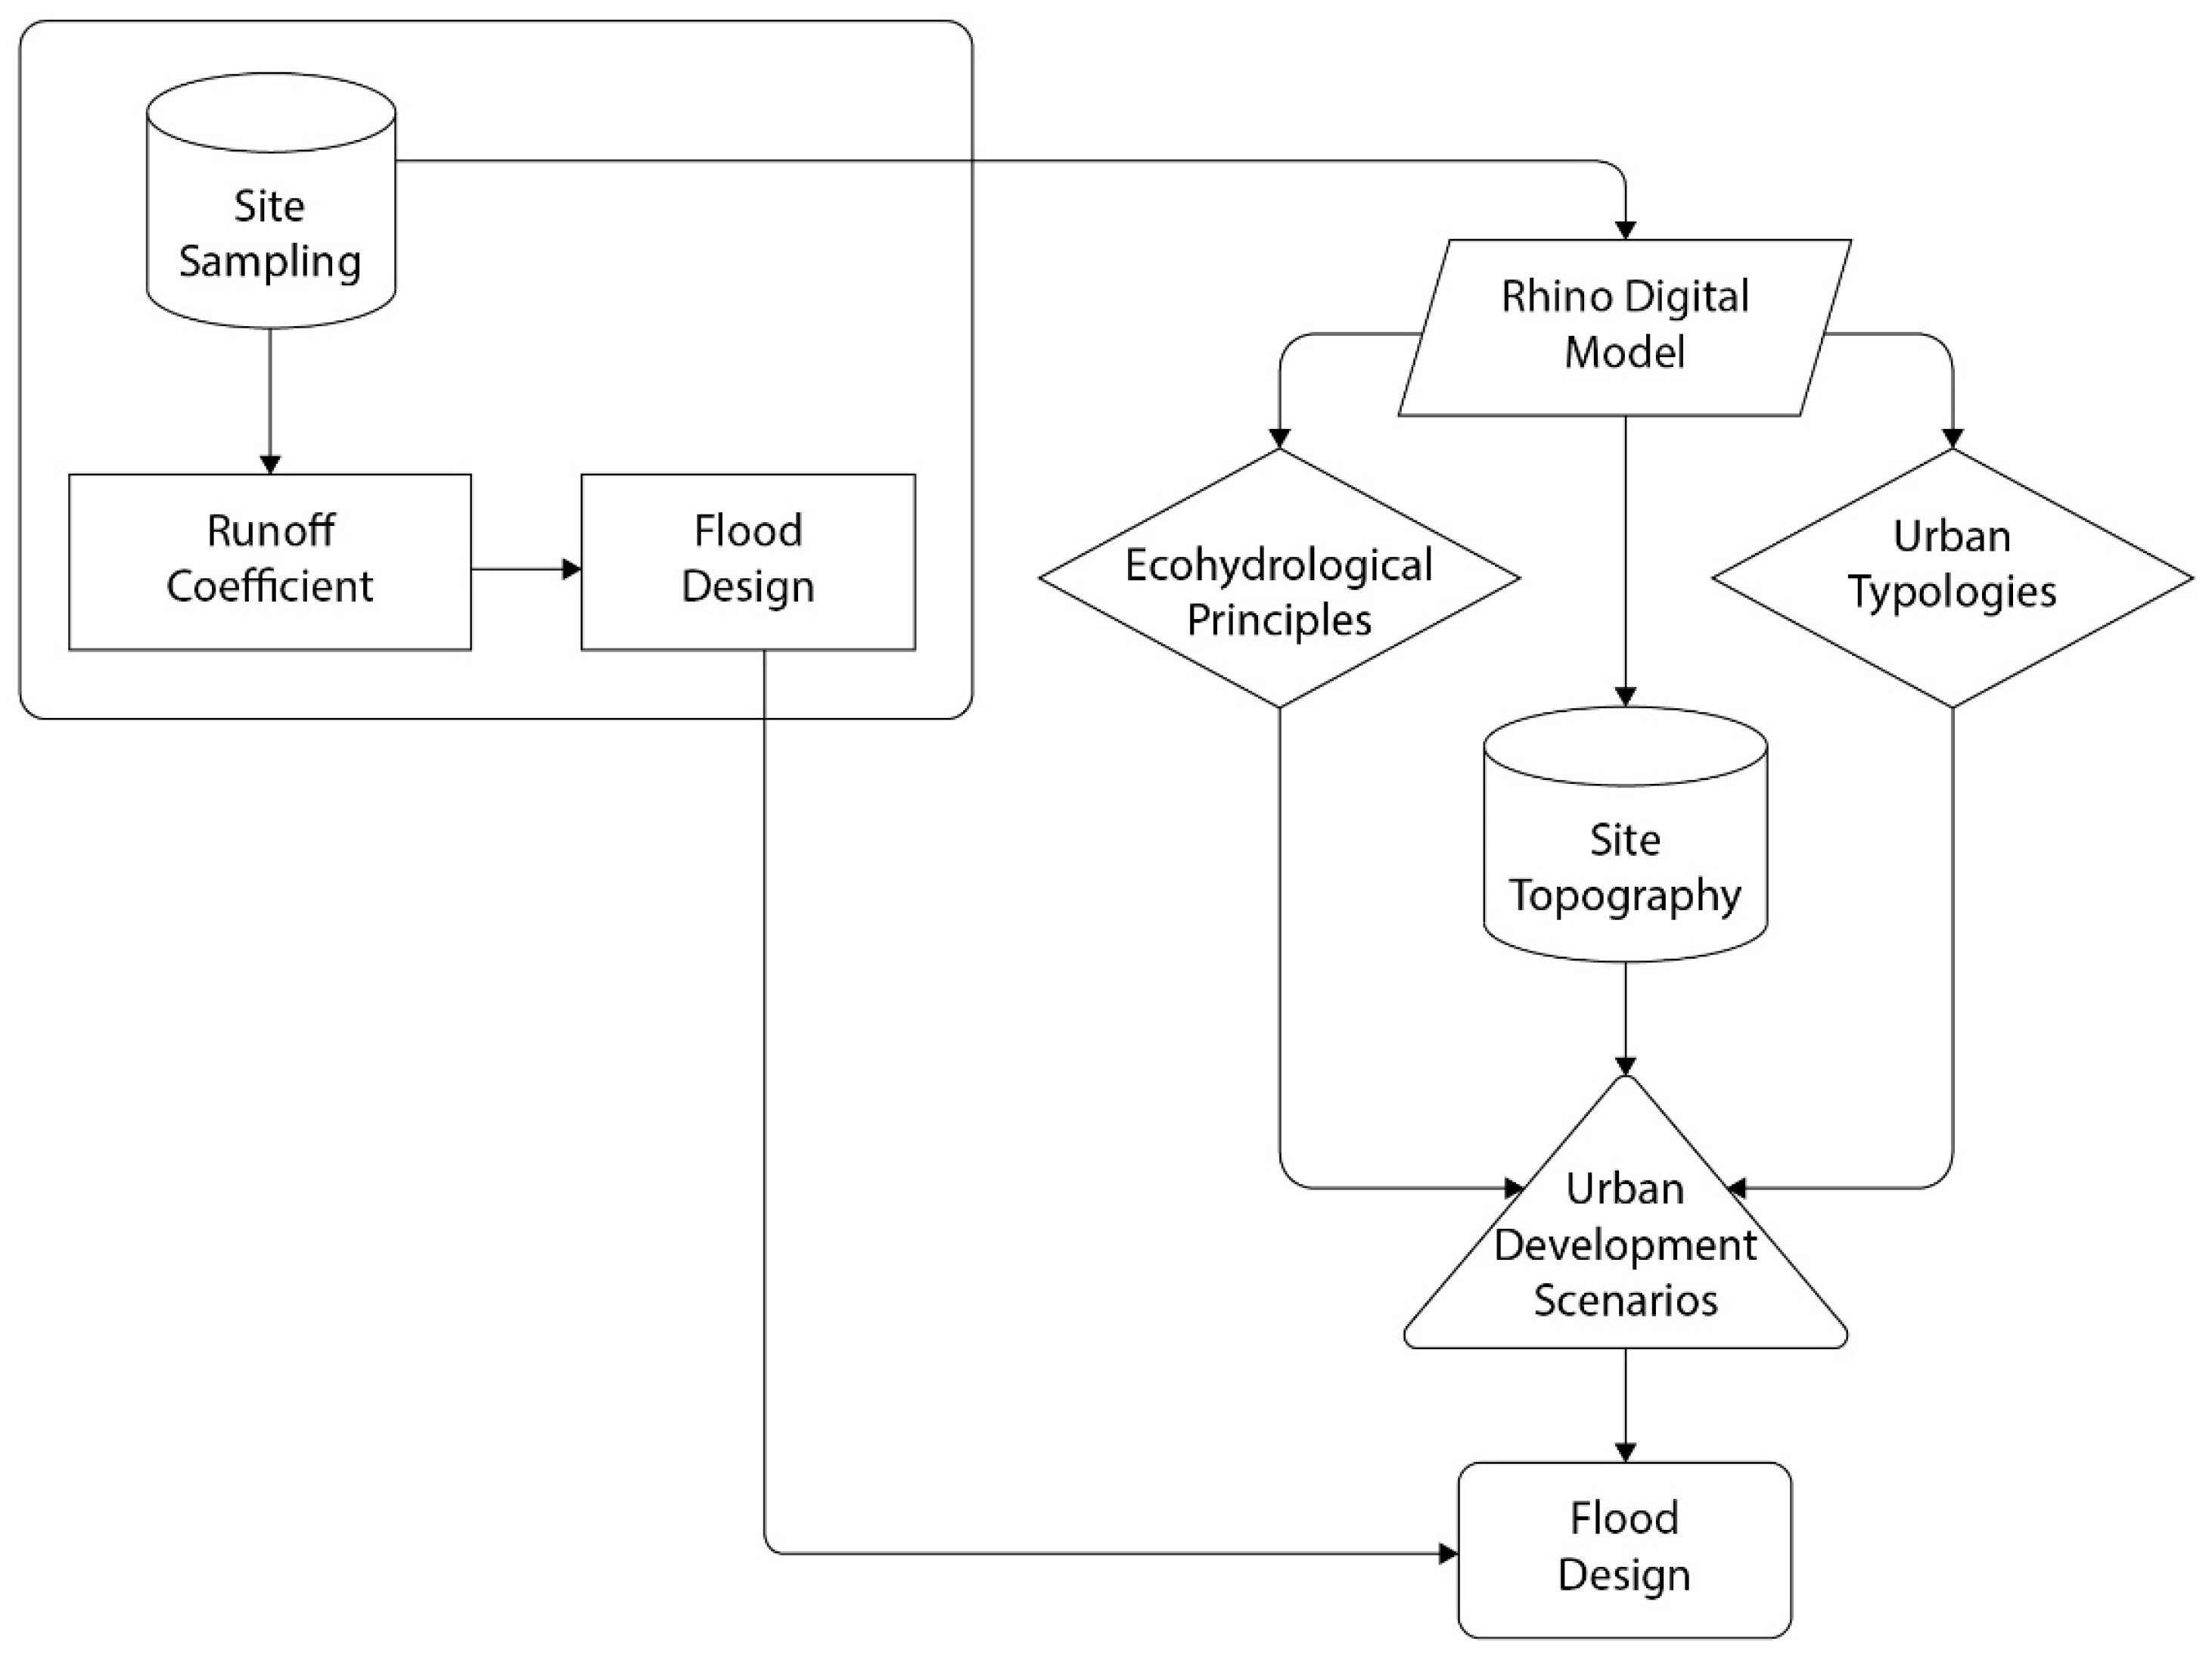
In this stage, the total area of the micro-watershed of 1.27 km
2 was incorporated, and new runoff coefficients were calculated based on the permeability attributes of the projected areas and the maximum rainfall intensities, obtained in a previous study. To summarize, we present a workflow diagram describing flood design and urban development scenarios in respect to their information processing (
Figure 3).
3. Results
Urban Development Scenarios
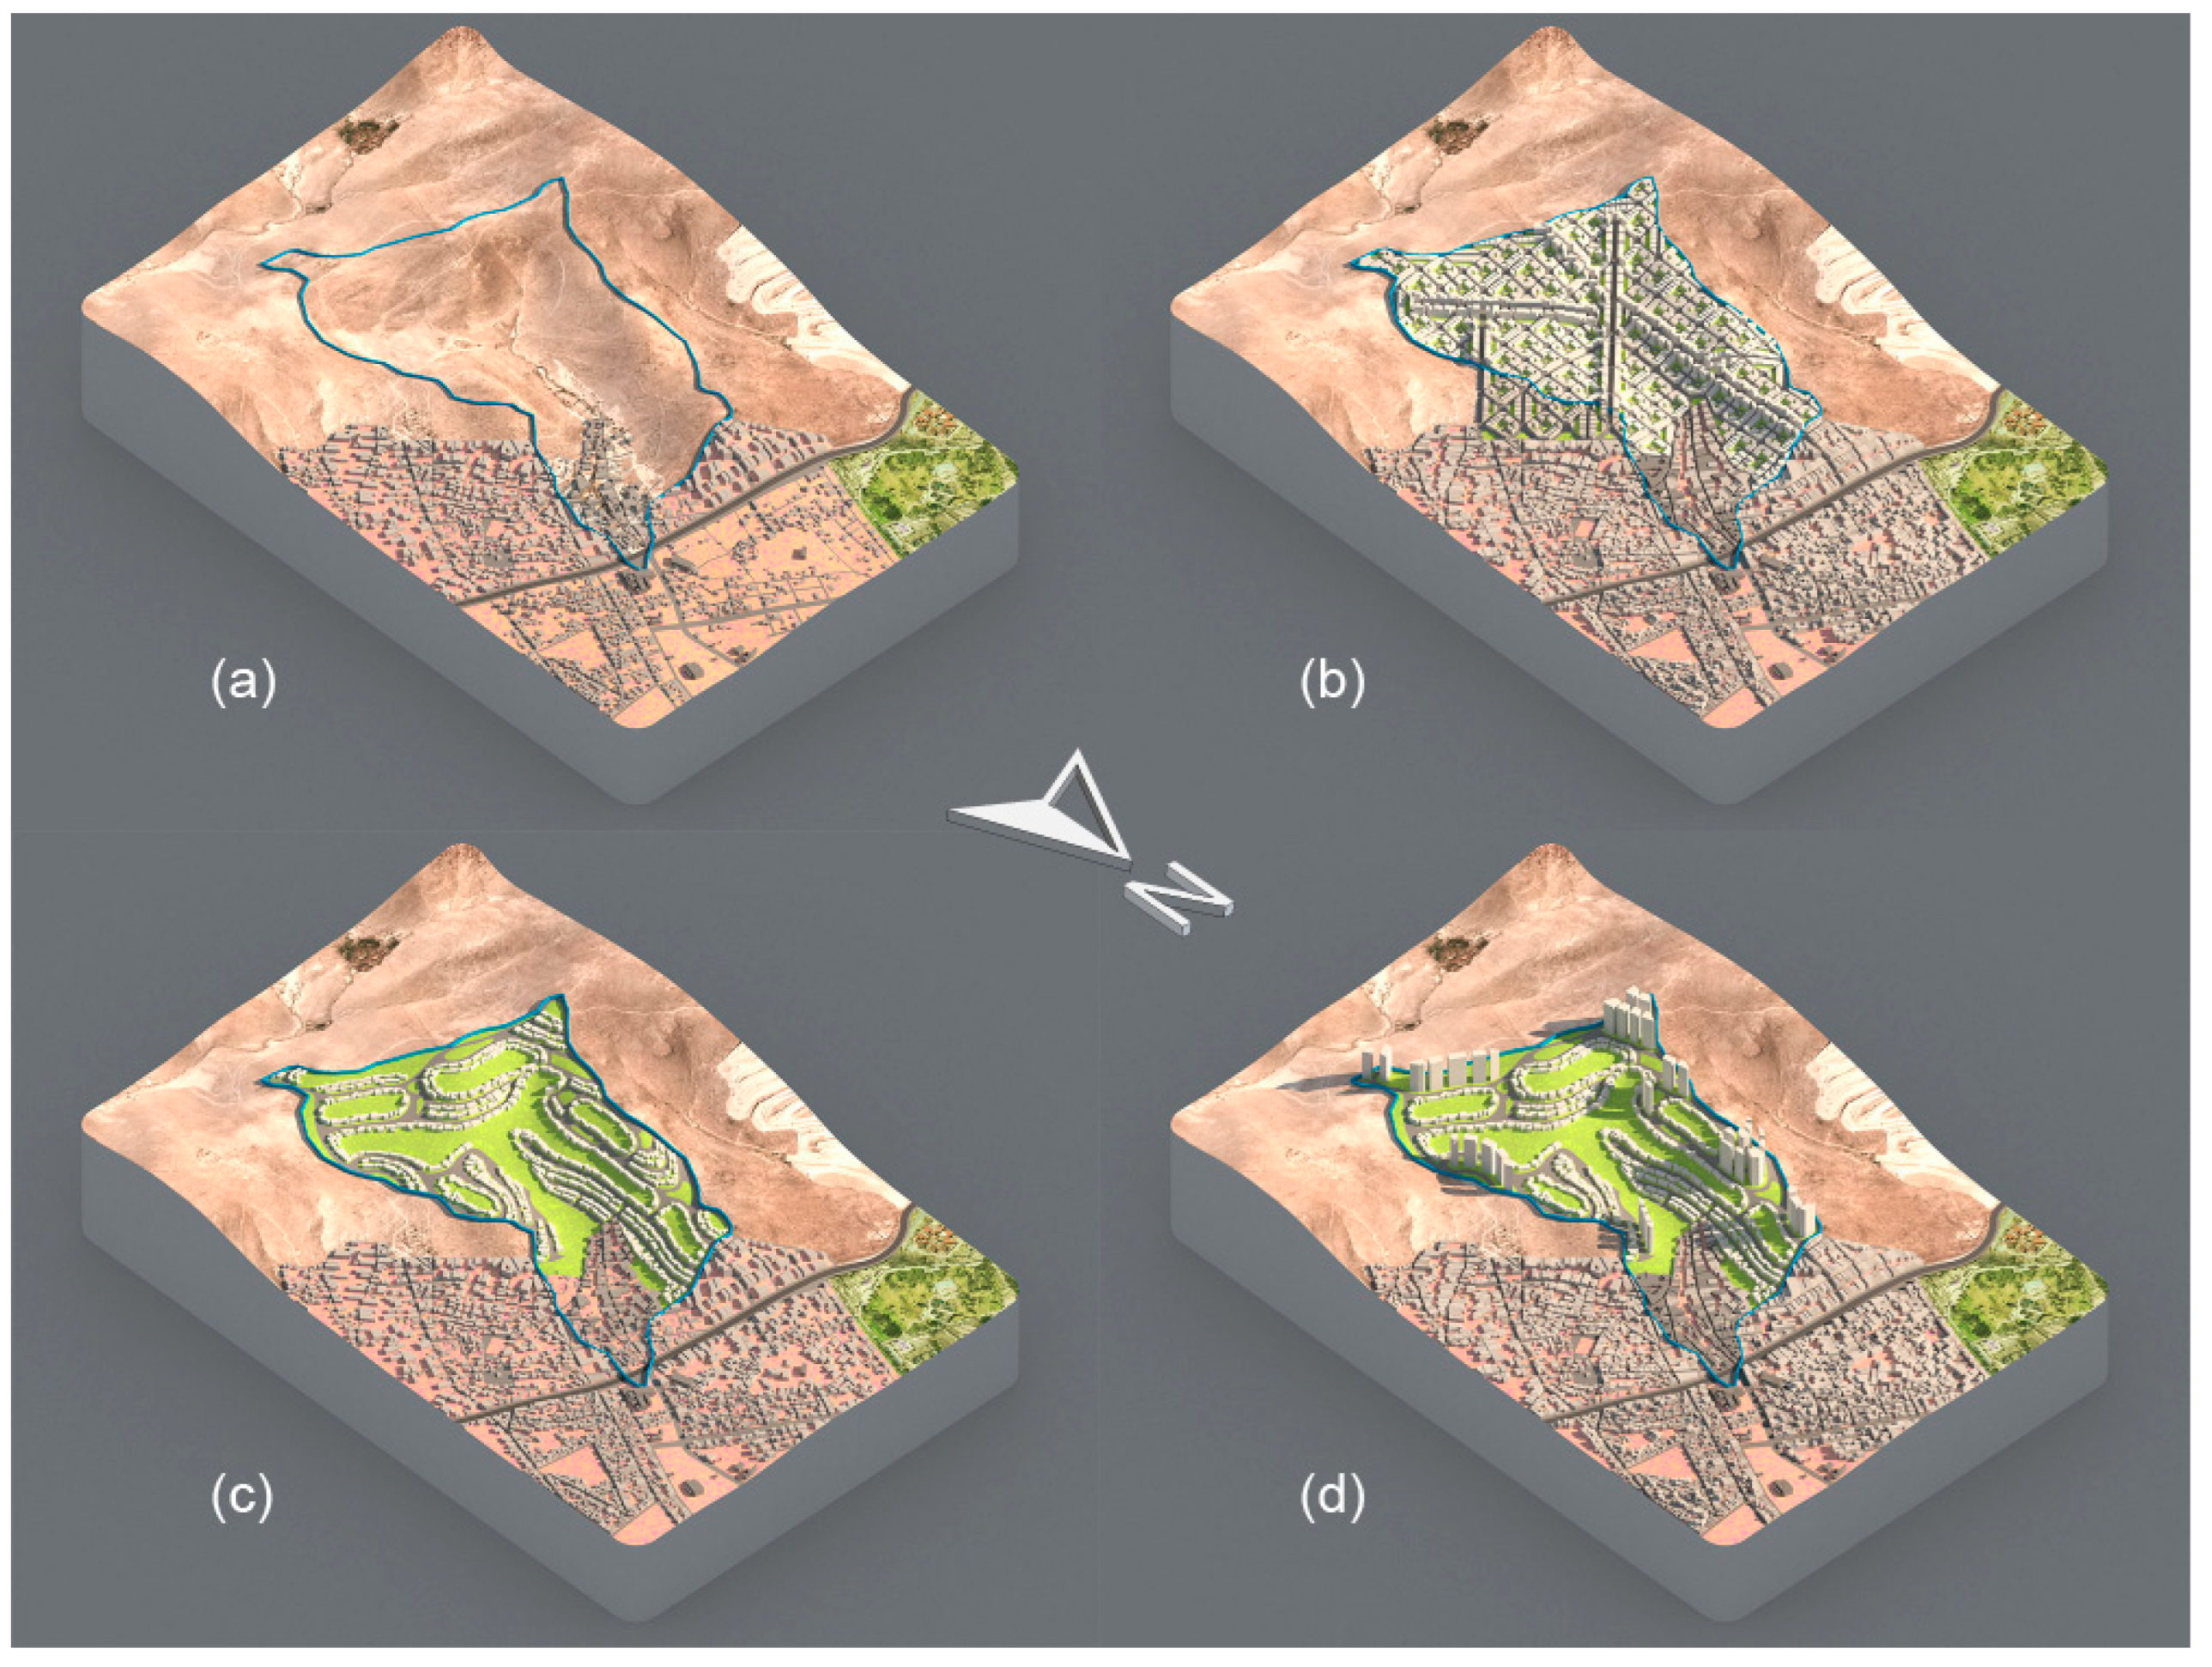
The scenarios were modeled based on the site topographic profile, FAR (Floor Area Ratio) and BCR (Building Coverage Ratio) indexes, and the mentioned urbanization patterns. Thus, the delimitation of the micro-watershed is presented in four scenarios that were projected based on the current scenario (without urbanization), whose outlet is in the northern edge where the environment is already built and lies perpendicularly to an important road. The following scenarios present density and type of urbanization, as well as the level of land-use required to function as a green area. In the second scenario, high urban density with a completely paved urban area without green areas was projected, while the other scenarios correspond to low and high urban density models with the same proportion of green area, as presented in
Figure 4.
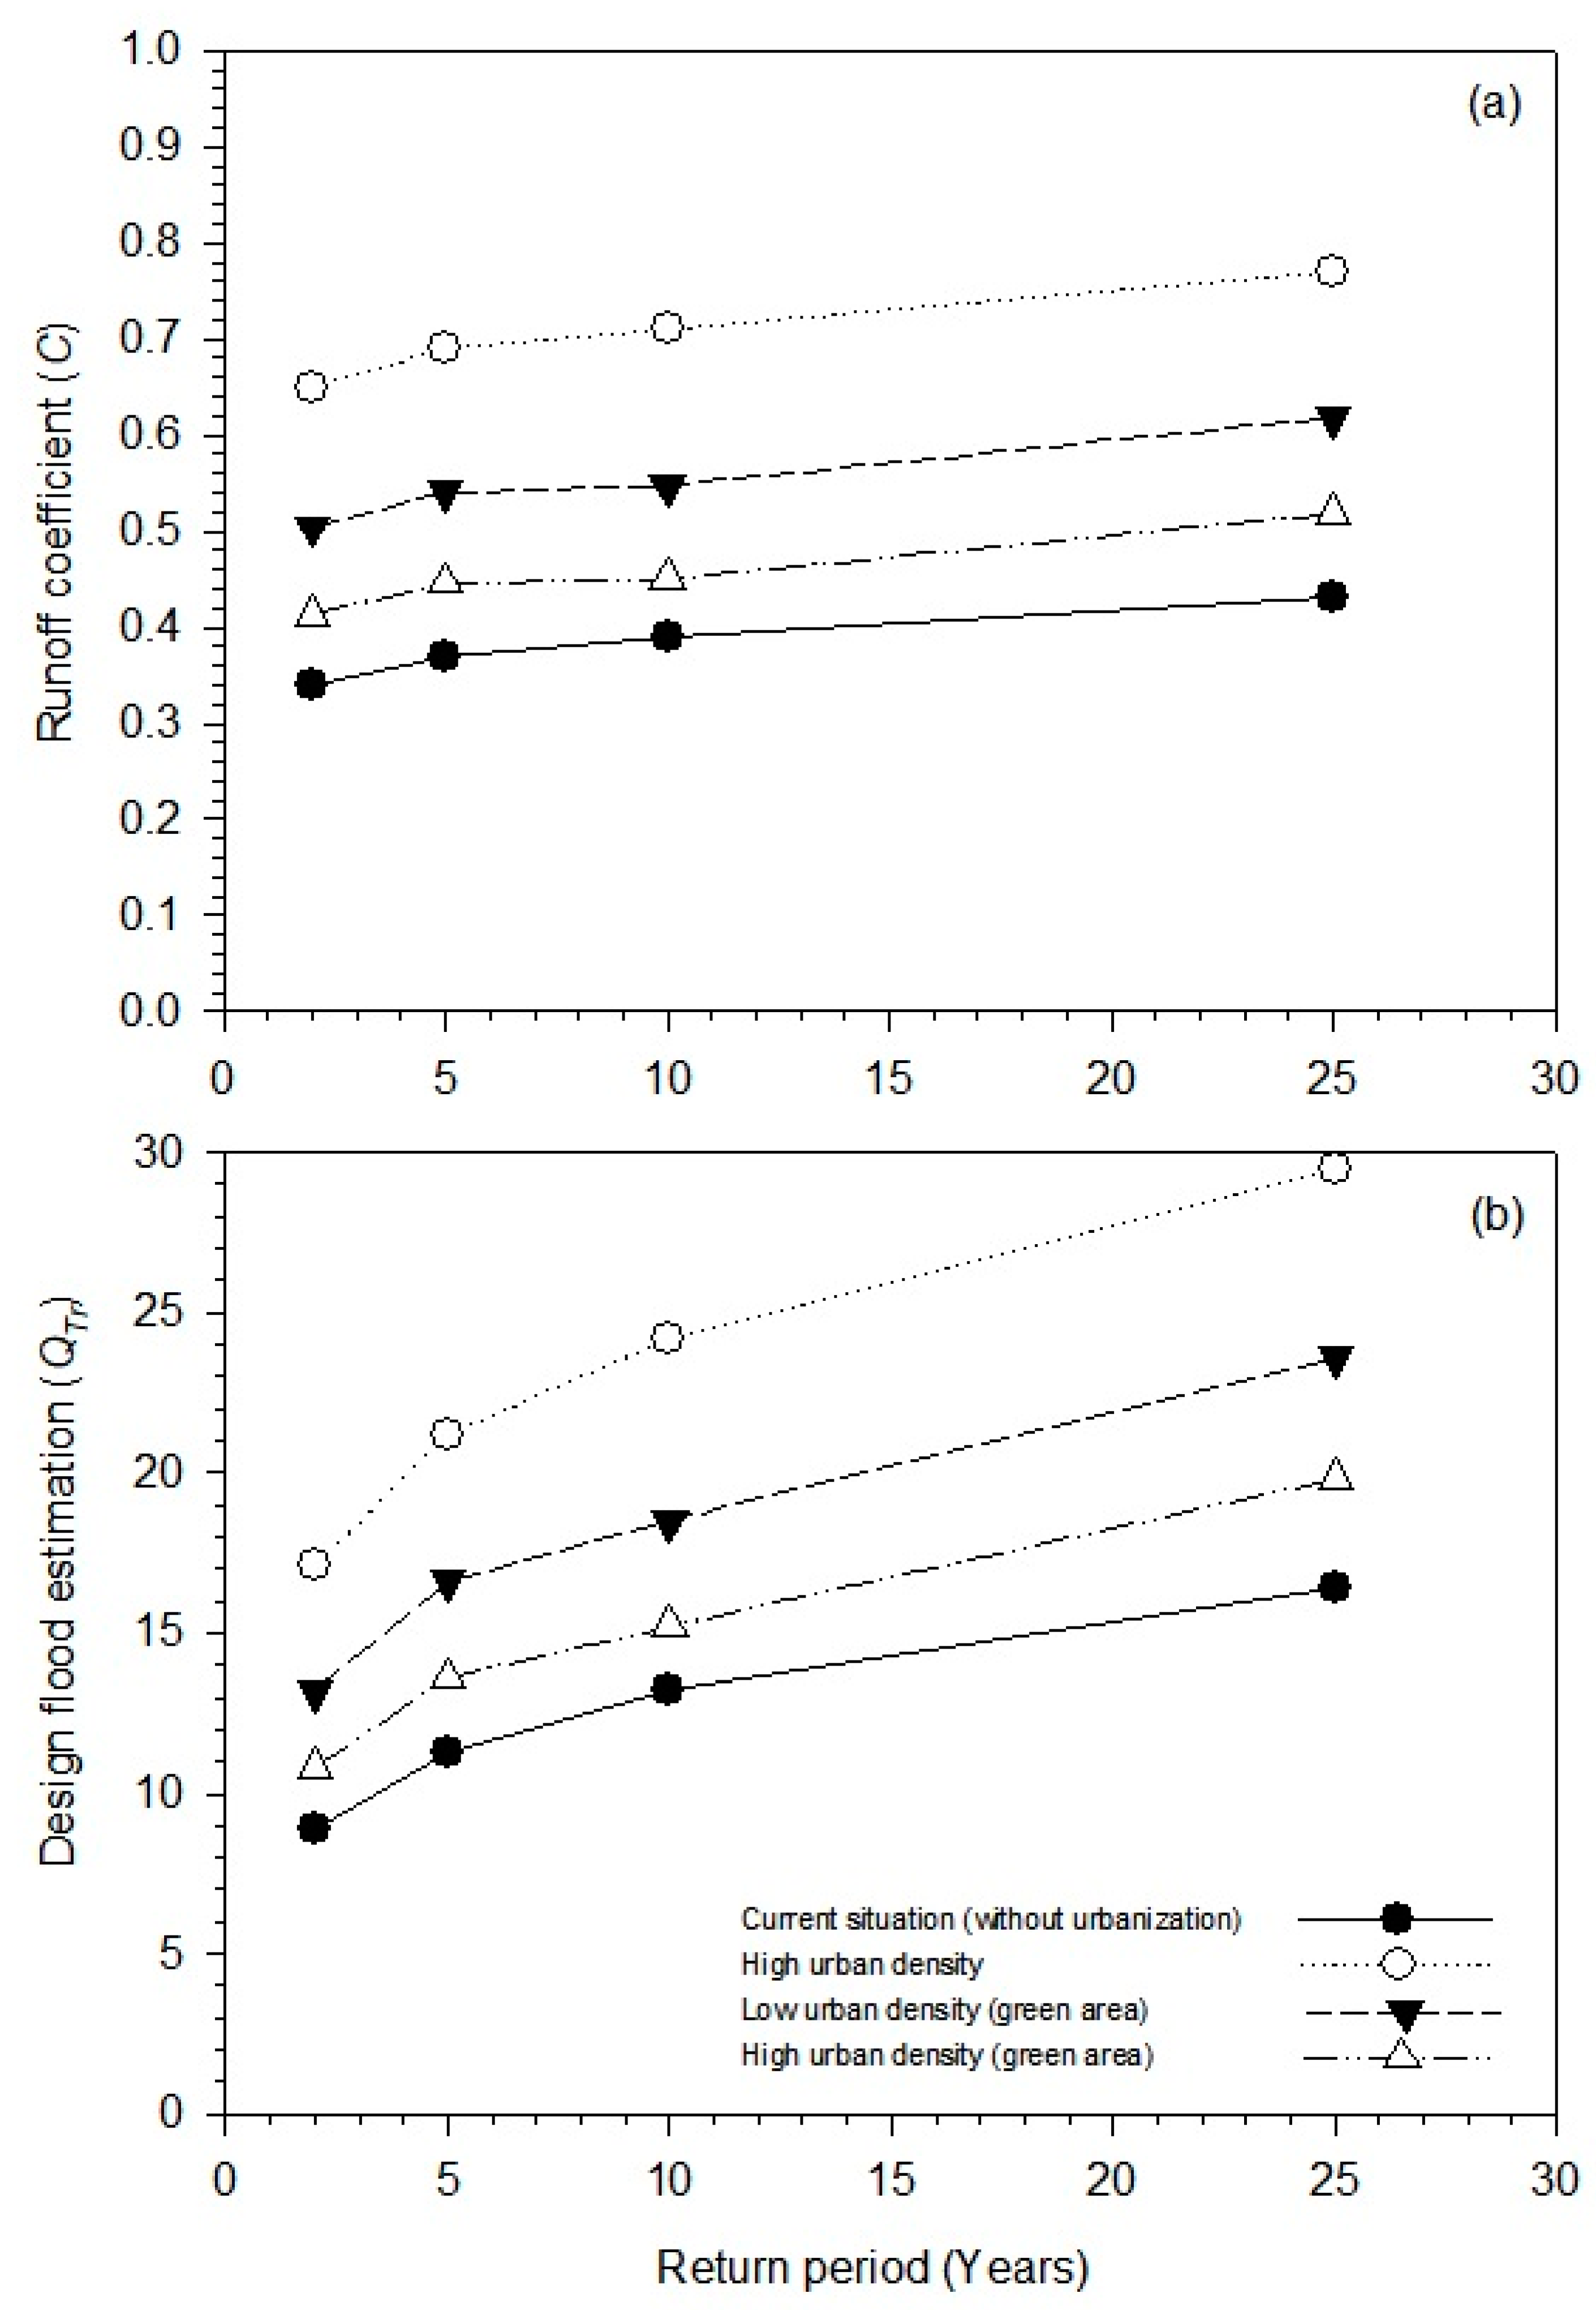
Hence, depending on the composition and distribution of the urban density in these scenarios, runoff coefficients, design flood estimation, and respective surplus value perspectives were estimated. According to the estimations of runoff coefficients and design flood, the projected scenarios showed different values for the return period in years. In the scenario of the current situation without urbanization, both the runoff and the design flow resulted in the lowest values of all the scenarios. This may indicate fewer effects due to probable flooding in the micro-watershed’s current scenario without urbanization. On the other hand, the scenario of high urban density with a buildable area of 2.97 km2 stood out for presenting the largest impervious surface of all the projections. Therefore, the runoff coefficients and flood design expenditures exhibited the highest values and calculated return period years of all the scenarios. In both variables, the values of the high urban density scenario doubled the estimations for the return period years of the current situation scenario.
Regarding the low urban density scenario (green area), the low buildable area capacity of 0.97 km
2 allowed it to offer large spaces of green area and thereby a reduction of the probable flooding effects by runoff. By presenting large extensions of green area with such function, real-estate development can produce housing with true ecological and landscape potential. The last scenario, which combined the maximum value of buildable area and outdoor space, was the high urban density scenario (green area). As a result of this model, the runoff coefficient and the design flood estimation presented reduced values; however, they were not the lowest among all the scenarios. Although the scenario of high urban density with green area did not indicate values equal to or less than that of the current situation, it was the closest (
Figure 5).
Along with the capacity to offer larger amounts of green area, the high-density scenario allows for the introduction of vegetation cover, which is only indicated for a set of measures and planned planting strategies under the criteria of increasing moisture retention and reducing possible design flood estimation. Although the present study did not contemplate the function of the vegetal component in the design flood estimation, it is possible to recognize the resulting needs in the modeled scenarios. In the first scenario, the current situation (without urbanization), plantations of shrub and tree species can favor indicated points of superficial hydrological concentration, as long as its land use does not change. The same principle can be applied to the scenarios with green area capacity, regardless of the arrangement or its accessibility (public or private). Although the vegetation cover plays a central role in the effect of runoff on slopes, the type of plants is rarely emphasized in this type of scenario; that is, scenarios that combine urban development on slopes with green space planning. Likewise, its value as a natural environment must also be considered in terms of the capital gain analyzed in the area.
As a result of comparing the design flood estimation, the possible population density and the capital gain in the modeled scenarios, the following observations were derived. In the first scenario, high urban density presented high value for the design flood estimation and buildable area, but also a low capital gain. In the second scenario, the design flood estimation was lower than the first scenario, with less buildable area and reduced population density, but exhibited a high capital gain. Because of the exclusivity offered by the type of urban development, in this scenario, the land-use tenure would remain in the hands of property owners, under a condominium regime.
On the other hand, the third scenario entails the lowest design flood estimation of the three models, and although it presents a maximum buildable area to host a high population density, it can also represent a high capital gain. As observed in
Figure 4, this scenario resulted in a large capacity for green area, expected to work to public benefit. In this context, the analysis is supported by the values indicated in
Table 3 as a part of the rational method and the response of the modeling with each scenario surface.
The valuation of the runoff coefficients and digital modeling allowed for analyzing parameters such as the design flood estimation, the buildable area, and the urban design typology. Therefore, based on the calculations and modeling, the third scenario allowed for contemplating the possibility of a green area with ecohydrological principles in the studied micro-watershed. Finally, and based on the results of design flood estimation and the buildable area, the indirect calculation of capital gain and population density in the three scenarios allowed for delving into the probable environmental and social effects of the locality.
4. Discussion
According to the calculation of the runoff parameters and flood design, the projection of the four different resulting models defined their probable urban development scenarios. Although the projection of scenarios through Rhinoceros software was based on runoff calculations and flood design, the method is simple and easily replicable. However, we state this without forgetting the existence of examples in the literature that apply more advanced technology to model possible urban scenarios. Several of these works, developed using digital methods, follow the same principle of finding solutions to runoff calculation in urban spaces [
34] or stormwater management in the city [
35]. An important aspect to consider in the model used was the lack of heterogeneity in rainfall intensity; however, its relevance should be noted in the climatic zones previously reported by Campos-Aranda. Likewise, other studies also indicate the use of models under such circumstances. The Kuischling and Gransky method allows for estimating runoff for flood mitigation in places where rainfall intensity data are scarce [
36]. Another method of hydrological and hydraulic coupling for different return periods based on a regional frequency analysis was also successfully used for runoff estimation in a case in which rainfall intensity data were non-existent [
24]. In addition, there are many studies that address, e.g., the conditions that prevail in arid regions from a hydrological and environmental perspective. An example of this is a study that demonstrated the lack of correspondence between the variables of lag time and rainfall intensity in semi-arid areas [
37]. In this context, urban development, which integrates open space with green areas and ecohydrology strategies, may be key to reducing such phenomena.
Despite the fact that the resulting flood design in the scenario of greater urban density without green areas suggests a probable risk in the lower part of the micro-watershed, the scenarios with green areas do present a mitigation effect, although not greater than the current situation. An important aspect that helps distinguish the response of the flood design curve between the scenarios with green areas is the vegetation cover with an ecohydrological approach in the high urban density scenario. This characteristic was associated with a decrease in the response curve of this scenario, such that it resembled the scenario of the current situation. Therefore, the modeling included vegetation cover with an ecohydrological approach, i.e., buildings with green roofs and impermeable pavements in plausible areas. In fact, the implementation of grassy green surfaces in ditches may be a measure to control surface stormwater [
38]. Although the present study did not specify the mitigating effect of runoff or soil moisture retention, the green area represents a blank canvas with high possibilities for reaching the same response as the current scenario or even improving it.
Vegetation cover with ecohydrological functions should be able to allocate a selection of functional species for planting, focused on soil and moisture retention properties on the site key areas [
23]. Urban development with such green area capacities requires improvements in urban planning that incorporate hydrological and ecological management to recognize the characteristics of the soil in different areas of the micro-watershed [
39]. Generally, the region where the study site is located exhibits shallow soils, with arid climate conditions, low rainfall, high evaporation, and a low probability of aquifer recharge [
26]. However, planting suitable species could improve return period parameters and thus permeability. In addition to the strategic planting of trees [
11,
40] and shrubs with such characteristics, combination with grassland areas can increase the effect of reducing runoff and therefore the flood design in the micro-watershed [
41,
42,
43].
Although the fourth scenario entails high urban density, a form of compensation may be achieved through a significant green area in the micro-watershed. This scenario, however, requires considering two essential criteria to increase the similarity or even become equal to the current situation’s flood design. The first criterion comprises the natural runoff zones for designing new construction and roads following the topographic contours of the terrain. This forces the development of gravity water-filtration treatment systems, for example, to prevent the percolation of grease and oils and therefore take advantage of naturally occurring runoff. The second criterion is the integration of sufficient green surfaces in urban development, combined with eco-technologies in the micro-watershed system. The estimation of the last scenario resulted in an approximated value of 52% and 47% permeable and impermeable surface, respectively, demonstrating feasibility in retaining or even favoring water absorption in soil.
The cover plant and green technologies implementations have a great advantage in showing important effects for reducing runoff and various ecological benefits that are essential in the relationship between cities and nature [
44]. On the other hand, the different environmental benefits due to green infrastructure taking advantage of rainwater imply ecosystem services in arid and semi-arid zones, but further studies are required in different cities [
45].
In this way, such urban development is expected to have an environmental performance with less impact on the estimated runoff. By considering the physical conditions of the topographical relief and surface water channeling, the fourth scenario can acquire certain independence from the municipal water supply at certain times of the year by installing water treatment systems. Moreover, in steep-slope areas, recovered water by runoff can be concentrated and stored in retention tanks. There are also retention and conduction techniques implemented through terrestrial vegetation that favor absorption and runoff mitigation [
15]. Water reservoirs or water bodies in large lots within a neighborhood represent a multifunctional environmental, landscape, and capital gain measure that is linked to green areas [
46]. By implementing this series of urban design and ecohydrological principles, the micro-watershed can become a cell of resilient construction for water management. Such advantages in the micro-watershed will be feasible as long as soil function, vegetation, and eco-technological systems are integral parts of development processes and their respective legal frameworks [
19].
In addition to the probable ecohydrological benefits, another important aspect is capital gain, which green area can provide to urban development projects [
46]. Nevertheless, the results of flood design, buildable area, and population density highlight some aspects to be considered in terms of urban planning. If the high flood design and the low added value resulting from the first analyzed scenario are considered, the result is unsustainable urban development, which is part of the existing reality (
Figure 2). The results of this study can be supported with other studies that provide interesting examples. By analyzing two typical urban areas, it has been determined that grassland green infrastructure causes a larger lag-time in the run-off than an area of impervious soil [
47]. Likewise, in a modeling study, it was demonstrated that the portion of pervious area is directly related with the drainage network in an urban environment, concluding that the vegetation and its composition play a crucial role in the system [
13].
The second scenario decreases the buildable area load, but by lowering population density, urban development forces an increase in property values. One question that could be asked relates to the public or private character that such urban development should acquire. However, any site development option should prioritize ecohydrological principles based on the topographic relief in the micro-watershed, rather than only the resulting real-estate values. In contrast, the third scenario stands out not only because of the reduction of flood design, but also because of the low property value and its feasible accessibility for a larger population sector. Another great benefit of this scenario is that, in addition to capital gain, green area is more accessible to citizens, guaranteeing both ecosystem regulation and cultural services [
17].
On the other hand, although urban growth has been extensively studied in irregular settlements in other Mexican cities [
48], the present study may respond to different factors. Gaps in the state government legal frameworks regarding construction suggest that urbanization in this area might be boosted by economic pressure from real estate developers and an absence of regulating public policies. In contrast, other city zones located in large plain areas, feasibly more developable, are not considered or lack real-estate economic speculation.
In addition to the adoption of ecohydrological measures, it is vital to implement an ecological territorial management master plan within urban development legislation. As urban growth continues in the area, it becomes increasingly urgent to promote mitigation and adaptation strategies to avoid the possible effects of runoff, especially during torrential rains. A latent phenomenon is the possible torrential rainfall, which can occur due to the effects of climate change, increasing the probability of floods in the city [
49]. Although the region has a semi-arid climatic regime, San Luis Potosi usually exhibits heavy rain events across a sporadic number of years. In this study, we highlighted the contrast between a flood design estimation (
QTr) for a return period of 25 years of 29.5 m
3/s in the high urban density scenario without green area (which is expected given current development trends, real-estate pressure, and existing legislation), 16.4 m
3/s for the scenario without urbanization (unlikely for the same reasons), or 19.8 m
3/s for the high urban density scenario with green area and implemented ecohydrological principles (see
Figure 5), which would involve the employment of its criteria into parameters of urban development legislation.
It is worth mentioning that the absence of similar strategies within Latin American urban development creates an area of study in need of answers to the challenges emerging due to climate change and the water supply. Therefore, the current environmental emergency requires adopting this type of estimation in urban design and thus in development processes. Another relevant factor is that these priority adjustments should be implemented in territorial management and development programs at local and federal levels, as well as in the urban-growth decision-making processes, safeguarded by critical government stakeholders. In return, the forecast of such environmental measures can favor surface hydrological conditions and encourage safer and livable urban development without compromising the city’s progress.


 ,
, 


