1. Introduction
Managing urban populations requires an integrated approach to planning with particular attention to land use [
1]. Urban land use controls how the various locations urban dwellers travel to or would like to travel to are organized. Indeed, it affects activity patterns and thus has a clear relationship with transportation [
2]. Ongoing land use modifications led to dynamic transport systems changing [
3]. Meanwhile, different transport infrastructure types can impact land use patterns in metropolitan zones [
4]. Hence, to make a balanced condition, identifying potential sites for future urban development should be notified for sustainable development [
5].
Several land-use transport interaction models have been developed in recent decades, and most of them have three main sub-model components: land use, socio-demographic, and transportation. The transport component of land use and transport interaction models focuses on understanding travel behavior as a basis for predicting and managing travel demand [
6]. As the first model to integrate the urban land use and transport feedback cycle in an operational model, Lowry’s Model of a Metropolis included a residential location model and a service and retail employment location model [
7].
The MEPLAN model developed by Echenique, Crowther, and Lindsay (1969) is an aggregated land use–transport model based on the Lowry model. This model can simulate various land use and transport scenarios [
8]. A similar model based on the Lowry model is TRANUS, which simulates land use, transportation, and their interactions in urban and regional settings [
9]. Additionally, Wegener (1982) developed the IRPUD model as a fully integrated land use–transport model. The household location choice is microscopic, simulating every household individually [
10]. A few influential microscopic land-use models have been developed, including the ILUTE, UrbanSim, ALBATROSS, PUMA, SimDELTA, TIGRIS XL, and LUSDR, all of which use an aggregated transport model [
11,
12,
13,
14,
15,
16].
The node–place model proposed by Bertolini [
17,
18] aims to balance transport provision with land use. This model describes transport (‘node’) and urban development (‘place’) by presenting their characteristics and the correlation between them [
19]. The node indices include the accessibility of the station area by several transportation modes, the frequency of the public transport system for a station, the network accessibility connected to the node, and the number of mobility means that reach the station. On the other hand, the place value depends on the number of functions accessible in the vicinity of the node (such as offices, public buildings, leisure activities, and shops), the number of residents in the area, the number of workers in each of the abovementioned economic clusters, and the degree of the functional mix [
20].
Previous studies indicated the influence of transportation systems on land use altering and vice versa, aiming to find a balance between node and place. However, this balance may not be sufficient since it is necessary to consider the road infrastructure as a significant item affecting land cover, population growth, and employment density. Being aware of the importance of road infrastructure importance, many studies regarding population and employment location introduced highways as a critical factor in forming the pattern of residential and firm location of a city [
21]. For instance, highway expansion is one of the major construction activities of the United States [
22], which makes this infrastructure a substantial factor in the country’s land use planning. Highways could rearrange the residents of a city; according to the findings of [
23], the U.S. Interstate Highway System caused the central city population to decline and attract population along the highways [
24]. The population increase in the suburban areas of Wisconsin in the 1980s and 1990s also resulted from highway expansion.
While highways are introduced as an impressive factor in TOD planning, the feature of accessibility provided by highway ramps could be considered a complementary indicator that offers a better understanding of travel behavior and, as shown by Garcia-López [
25], the vicinity to highway ramps increases population densities in the Barcelona Metropolitan area. Hence, this research uses the node–place model to evaluate a case study’s future growth and urban development in New York state (I-287 Corridor exits and the nearby surrounding areas). In contrast with previous node–place research that focused on rail transportation, the current research focuses on highway accessibility. This approach aims not to predict or advise a development path for the study area but rather to better understand development dynamics.
The paper’s structure is as follows: Previous research is reviewed in
Section 2. The node–place model is discussed in
Section 3. The paper’s methodology, including node and place values, is presented in
Section 4. Results and discussions are presented in
Section 5, and the paper concludes with a summary of the findings and future research directions.
2. Literature Review
In addition to the node–place model, Chorus and Bertolini [
26] made some additional complementary efforts in station redevelopment. First, they tried to identify the main transport and land use factors that influenced the redevelopment of Tokyo Station areas. Then, they compared the model results with the ongoing development in the stations. Their findings showed that the combination of rail proximity to the Central Business Districts (CBD) and the number of train connections relative to the workforce size influenced the station area redevelopments. Additionally, Luca Bertolini [
17] discussed the complexity of railway station redevelopment in Utrecht and showed the necessity of node and place integration in redevelopment planning. He considered the railway station redevelopment according to three aspects: flow enhancement, activity accumulation, and the involved authorities’ role.
The literature review of node–place applications indicated that researchers have considered some other valuable contents, which are in line with the basic idea of Bertolini’s model. Their efforts were directed towards making a more comprehensive model by extending it, updating the indicators, and interacting with other models. An extension of the model was conducted by Lyu et al. [
19], who added a third dimension, ‘design’, to the original model. In addition, they used a new dimension, named ‘Oriented characteristics of station areas’, for metro station areas in Beijing. Their study focused on determining a functional relationship between transit and development components and established a positive correlation between these dimensions in their results. Similarly, to classify the TOD typologies, Zhang et al. applied an extended “Node–Place” model with a third “design” dimension [
27]. Based on their results, new town planners and governors can use the thematic function categories and TOD types to diagnose common problems and develop targeted strategies.
Furthermore, Babb et al. [
17] used an extended node–place model for stations located in freeway medians in the Perth Metropolitan Area, Australia. Due to the stations’ distance from the CBD and local land use, the “Background Traffic conditions” were employed as the third dimension. Their model included the road network’s capacity and road access as indicators, along with other factors. Their findings showed that the balance of node and place functions of stations located in freeway medians is challenging and needs more attention to node functions. Adding Background Traffic (none-station traffic) as the third dimension to the primary model was not limited to the study in [
17], as Olaru et al. [
28] also used this indicator in their study of railway stations in Perth, Western Australia, to overcome deficiencies of the model in low-density areas by employing the new indicator.
The application of the model for metro-station-surrounding areas in London by Zhang et al. [
4] reapproved the importance of adding the third dimension of ‘design’ for the station’s Transit Oriented Development (TOD) evaluation. This model introduced the three indicators of pedestrian shed ratio, the density of intersections per hectare, and the length of the accessible network regarding the model’s design index. Their findings showed a strong correlation between the place and design, but a relatively low correlation between the node and design indices. This is similar to the Vale’s [
29] finding that a high node value does not certify a suitable design of the station’s surrounding areas. Moreover, Du et al. analyzed socio-demographic characteristics simultaneously with quality perceptions utilizing a path analysis [
30].
Additionally, Pezeshknejad et al. [
31] used the extended model of [
19,
32] in their study of bus rapid transit (BRT) stations in Tehran. Street density and connectivity were added as two significant factors to assess their impacts on station areas. According to their study, areas with well-integrated and continuous walkways to BRT stations seemed to be more suitable for TOD implementation. Their findings also showed that residents tend to reside in areas with more integration and street density.
While node–place studies have developed in the direction of improving the main model, accessibility conditions have been considered to increase the model’s efficiency. For example, since the main node–place model missed the walkability conditions, [
32] tried to improve the model’s usefulness by combining the node–place model with an evaluation of the walking accessibility of each station area in Lisbon. Their finding showed that a balanced node–place is not necessarily a transit-oriented development and vice versa. Caset et al.’s [
33] study of Flanders’s and Brussels’s railway stations was another example of developing the node–place model through accessibility. To conduct this, they focused on the users to estimate the accurate demand of passengers for accessibility to and from each station.
The usage domain of node–place model has not been limited to extended models. For instance, Monajem and Ekram Nosratian [
34] used two spatial indices to develop Bertolini’s model. They tried to understand how the spatial configuration of the street network affects transportation and land use in the metro station areas of Tehran. Their result confirmed the advantage of using spatial indices in the node–place model by obtaining a fairly logical relationship between these indices with other indices. A different improvement of the node–place model was later presented by Yingqun Zhang et al. [
35], who used Network–Activity–Human model in Beijing’s central district. He made some changes in measuring node and place values. This adaption was mainly conducted due to the different patterns of populated cities, so transportation schedules may not be reliable and accurate.
Trying to achieve a perfect model has led studies towards combining the model with other methods, as van Nes and Stolk [
36] applied the space syntax method and node–place model together to prioritize railway station improvements in North Holland due to the local accessibility degree. Moreover, they prioritized the sustainable development of new housing areas based on the abovementioned methods. According to their results, the spatial configuration of the local street and road network is important for the degree of sustainable mobility means around station areas.
The shortcoming of the node–place model function in some situations was another reason for addressing the extended model. The original model’s inability to distinguish between large groups of balanced places was one of these limitations. In this regard, Vale et al. [
29] applied the extended node–place model to Lisbon’s metro station areas on a local scale to provide a more accurate specification of balanced stations. However, their adjustment of the model to the local scale ended in recognizing some of the stations as “underdeveloped urban TOD”, which means that they showed a high design and node index but an average place index in their study. Similarly, Reusser et al.’s [
37] study on Swiss railway stations was another proof of node–place model balance function deficiency and clarified the necessity of further research for future planning.
Reviewing the previous studies showed that accessibility is an essential measure to determine the land use and transportation performance that often incorporates land use patterns, network topology, and travel behavior [
38]. Accessibility-based planning can help to achieve community goals. For instance, highway infrastructure improvement positively impacted labor productivity [
20], and inter-state highways strongly impacted metropolitan regions’ labor production in the United States, as shown by using structural equation modelling [
39]. Although previous research has evaluated accessibility using different methods (e.g., distance or spatial interaction) [
40], few studies have examined its capacity to evaluate transportation infrastructure development plans [
41,
42]. In light of the successful application of the node–place model, the current research proposes a new methodology for assessing the development plans of a highway corridor. Indeed, the proposed study provides a classification methodology to evaluate development plans that other evaluation methods do not suggest.
3. Node–Place Model
The node–place model helps to identify a location’s transportation (node’) and urban development characteristics [
28]. In addition, it works as a TOD planning tool for a better understanding of development dynamics [
26]. Node–place models are based on the idea that improving transportation (the node value) improves accessibility, which enhances conditions for further growth. Therefore, a growing demand for transport facilitates the further development of a transport system as a result of the development of a location (place value). The use of the node–place approach allows to assess the nodes’ value based on their place value [
17].
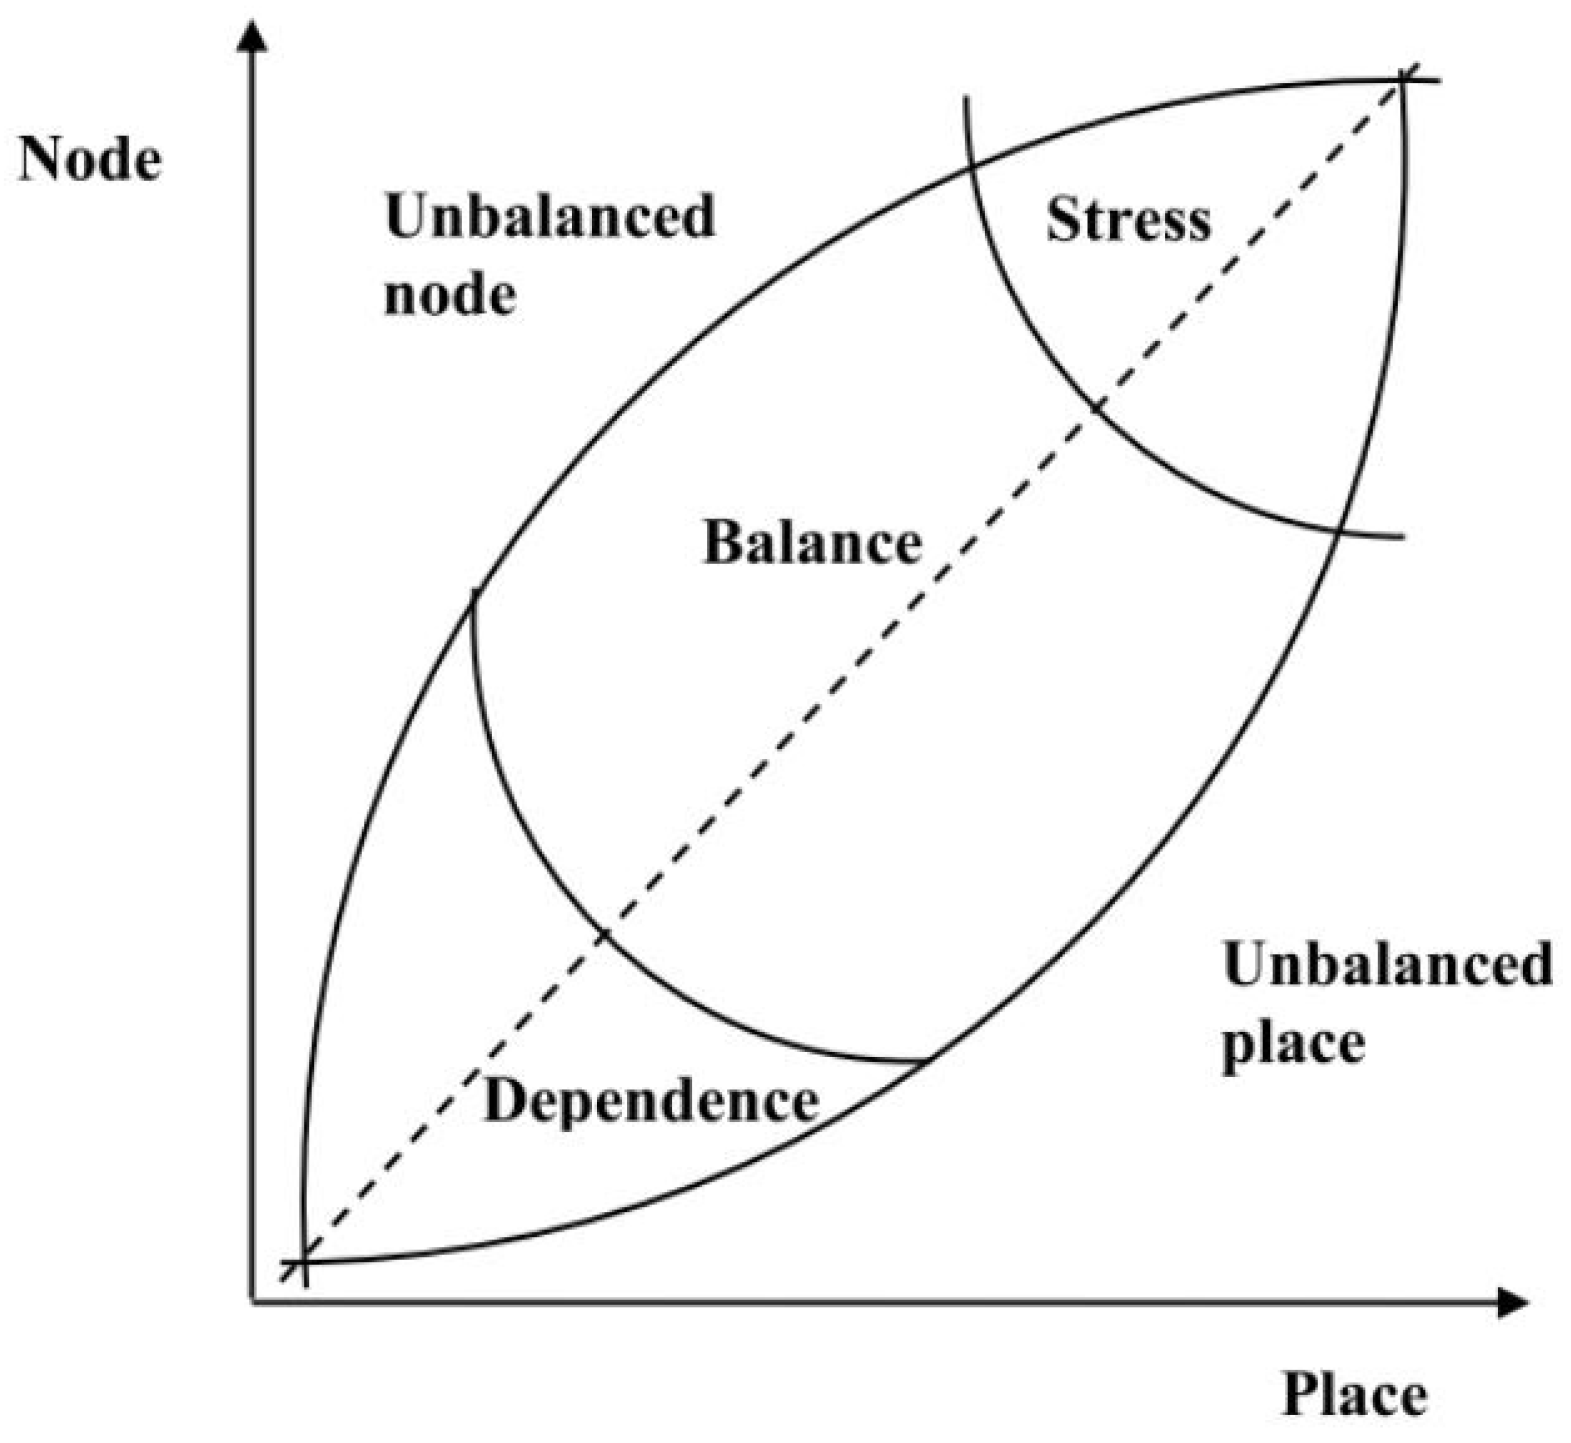
An area around a station is categorized into five ideal–typical situations according to the node–place model (
Figure 1). Each situation reflects a particular relative position of a station area on the node and place scale or, in other words, its position in the node or place hierarchy of an urban region.
The “balanced” areas are found along the middle line; their relative positions on both the node and place scales are roughly equal. Due to transport and land use interactions, these relative positions are expected to be comparable in most cases.
At the top of the line are the “stressed” areas: locations where both the node and the place have been used to the fullest. “Stressed” station areas are relatively strong on both the node and place scales. However, further development in these areas can become problematic as multiple claims on the limited space can easily cause conflict.
At the bottom of the line are the “dependent” areas where the struggle for space is minimal. This is because the node and the place values are relatively weak factors and other factors beyond internal node–place dynamics (e.g., subsidization) must intervene for the area to sustain itself. Furthermore, two unbalanced situations exist.
Above the middle line are the “unbalanced nodes”, locations where the transport systems are relatively more developed than the urban activities. Below the middle line are the “unbalanced places” where the opposite is true. An “unbalanced” station area thus has a significantly stronger relative position in either the node or the place scale.
The node–place model provides clear guides for decision-makers and the public about how transport and land use interact, through deep collaboration between planners of transport and land use. Additionally, it provides a solid framework from which decision-makers can plan or allocate infrastructure/land use initiatives [
19]. However, a significant limitation of the node–place model is the absence of basic indices that capture some of the most critical aspects of land use and transportation [
37]. Another limitation occurs when there is a time lag between land use and transport projects, which creates tension between node and place. In some cases, nodes and places have conflicting objectives, so they do not work complementarily together [
31].
4. Methods
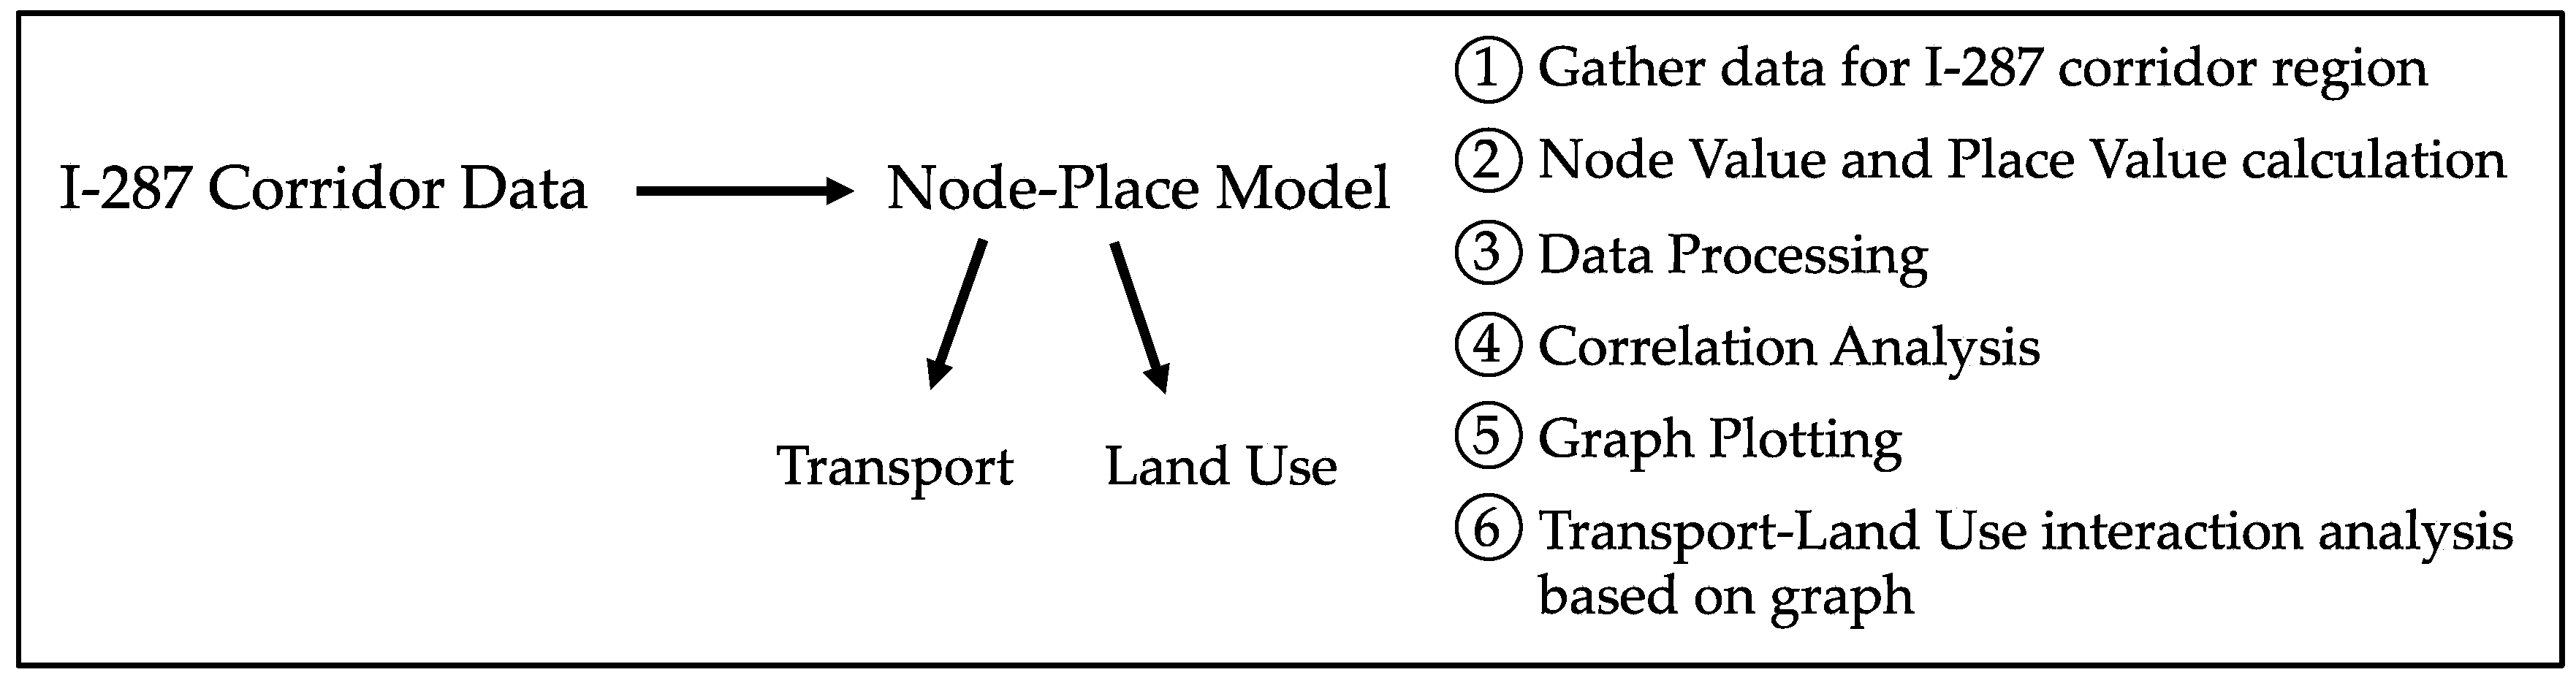
Figure 2 illustrates the framework developed for this study that evaluates transportation planning and land use via the node–place model for the I-287 Corridor.
4.1. Study Area
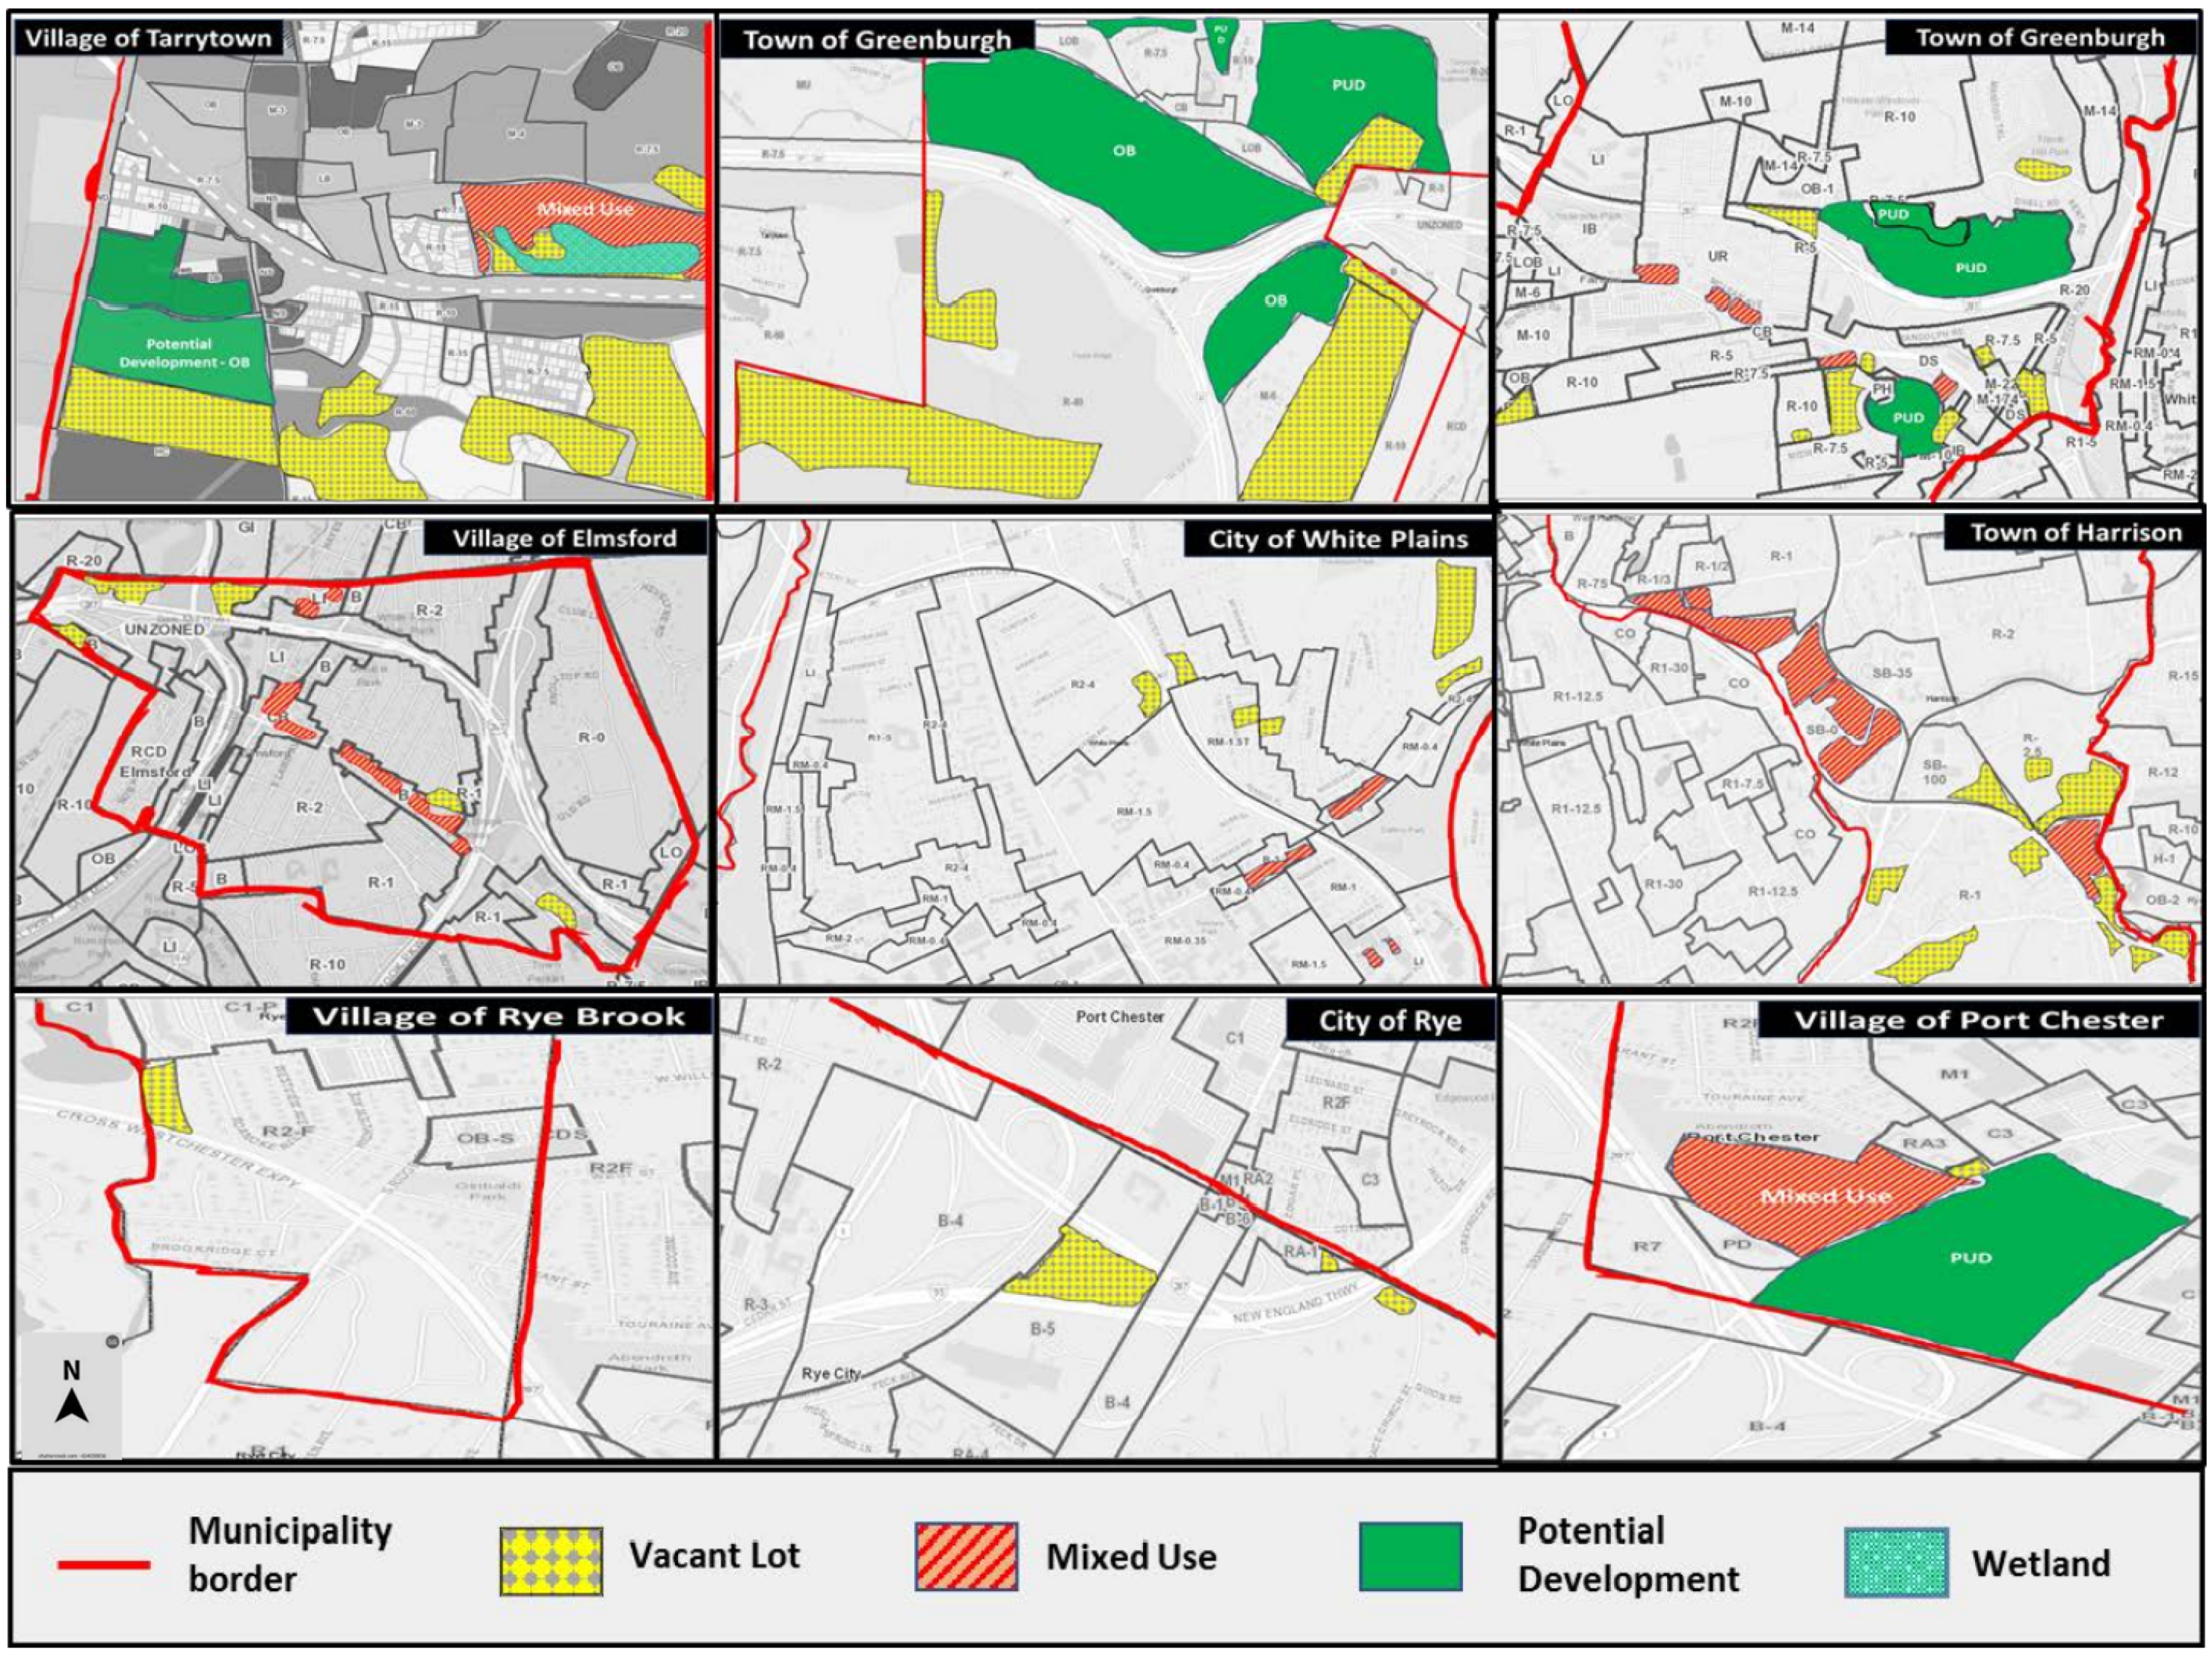
In the current paper, the development dynamics of Westchester County’s I-287 Corridor were examined using the node–place model. The I-287 is a beltway around New York City and is an Auxiliary Interstate Highway passing through New York and New Jersey states. It is also located in the most populated area in the United States, which carries considerable traffic volumes. As shown in
Figure 3, along this corridor, eight municipalities have Sustainable Development Centers: the Village of Tarrytown, the Village of Elmsford, the Town of Greenburgh, the City of White Plains, the Town of Harrison, the Village of Rye Brook, City of Rye, and Village of Port Chester.
The area close to the I-287 Corridor is emphasized to evaluate the potential growth and development. Their land use plans are also reviewed to help us to obtain a better understanding of the further development potential. Based on those plans, the study found that municipalities such as Tarrytown, Greenburg, and Portchester have larger potential areas.
Various indicators should be evaluated in the models for a better description of the existing characteristics in the areas mentioned above. However, since this study focuses primarily on development dynamics, indicators were chosen to relate the approach mentioned above as much as possible.
4.2. Node Values
Seven node indexes are discussed for this research as follows: average annual daily traffic, number of highway lanes, connection to other highways, number of train stations within 15 min of travel, number of bus lines within 1 mile, land use within 1 mile (considering the distances between exits), and distance to next highway exit. A node function also measures the connectivity between the area and other places of interest, e.g., whether it is accessible, the type of connection (by rail or road from all types), and how many directions are connected.
Table 1 indicates the list of node values assumed for the current research.
4.3. Place Values
Three place values were considered in this research: population within 1 mile, the number of workers in the labor force within 1 mile, and the degree of the functional mix. The degree of functional mix reflects the complexity and diversity of urban activities. To calculate the degree of the functional mix, Equation (1) was used as follows [
26]:
where
a = max (x1, x2); b = min (x1, x2); c = ½ (x1 + x2); and d = (x1 + x2).
A higher degree of mixing means higher potential social connections and thus represents higher economic values. Place functions describe the variety and quantity of activities that can be performed near the exit of the corridor. It could be considered as an indicator of land use diversity and activity intensity at a site. All variables were collected from the municipality area closer to the corridor and checked for normality. Variables were calculated and used by using available sources and online maps. The approach used by Reusser et al. [
37] for Switzerland served as the reference for plotting the results of the node–place model in this research. The node and place indicators—yi and xi, respectively—were used as defined in
Table 1.
4.4. Data Processing
It was necessary to ensure that the data size is consistent with the value of the node site. For example, the larger number of train stations represents higher node values. However, the closer the distance to the next highway exit, the better. Therefore, it was necessary to convert them into the same standard before further data processing.
In order to reduce skewness in univariate distributions, all indicators were log-transformed. In addition, all indicators were normalized to have a minimum and maximum value of 0. Node indices were summed up based on all node indicators, and place indices were summed based on all place indicators. A Z transformation of the two indices was performed before plotting the node–place diagram to make the distances comparable (i.e., distances are represented as standard deviations in the diagram). The study attempted to verify whether highway exits tend to lie along or tend toward a diagonal between node and place index to examine the proposed balance between node and place functions (their relative positions are roughly equal).
4.4.1. Pearson’s Correlation Analysis
First, to understand how well-related the indices are, especially the spatial indices, the correlation coefficient among the node and place indices must be mutually defined by Pearson’s method. The study subsequently interpreted the statically significant indices. Pearson’s correlation describes a linear relationship between two variables and measures the existence (given by a
p-value) and the population correlation coefficient, often denoted by r values ranging from plus one to minus one (r = ±1). In Pearson’s correlation analysis, both variables are assumed to be normally distributed. It also considers the data values are independent [
44,
45].
4.4.2. Canonical Correlation Analysis
In addition to Pearson’s method, to propose the most effective indices in the node place model, the Canonical Correlation Analysis (CCA) was employed to identify which transportation and land use dynamics are more effective in station areas when we considered them together as two sets of indices. The CCA is a statistical technique that identifies a sequence of pairs of patterns in two multivariate datasets and constructs sets of transformed variables by projecting the original data onto these patterns. This model aims to find mutually orthogonal pairs of maximally correlated linear combinations of the components [
46,
47].
Canonical correlation measures the strength of the overall relationships between the two sets of variables. It identifies the optimum structure or dimensionality of each variable group that maximizes the relationship between independent and dependent variable sets.
In data processing, the first options with the same score are eliminated, indicating that this factor does not correlate with others. Spearman’s rank correlation coefficient is then used to discover the correlation between different indexes. Considering a variable loading of more than 0.3 as being significant statistically, factors with strong correlations were selected for further analysis. Those indexes lower than 0.3 were not considered in the following research. Different indexes of each municipality were then added to obtain the node value and place value. Then, those values were plotted onto the diagram: the x-axis represents place value and the y-axis represents node value.
5. Results
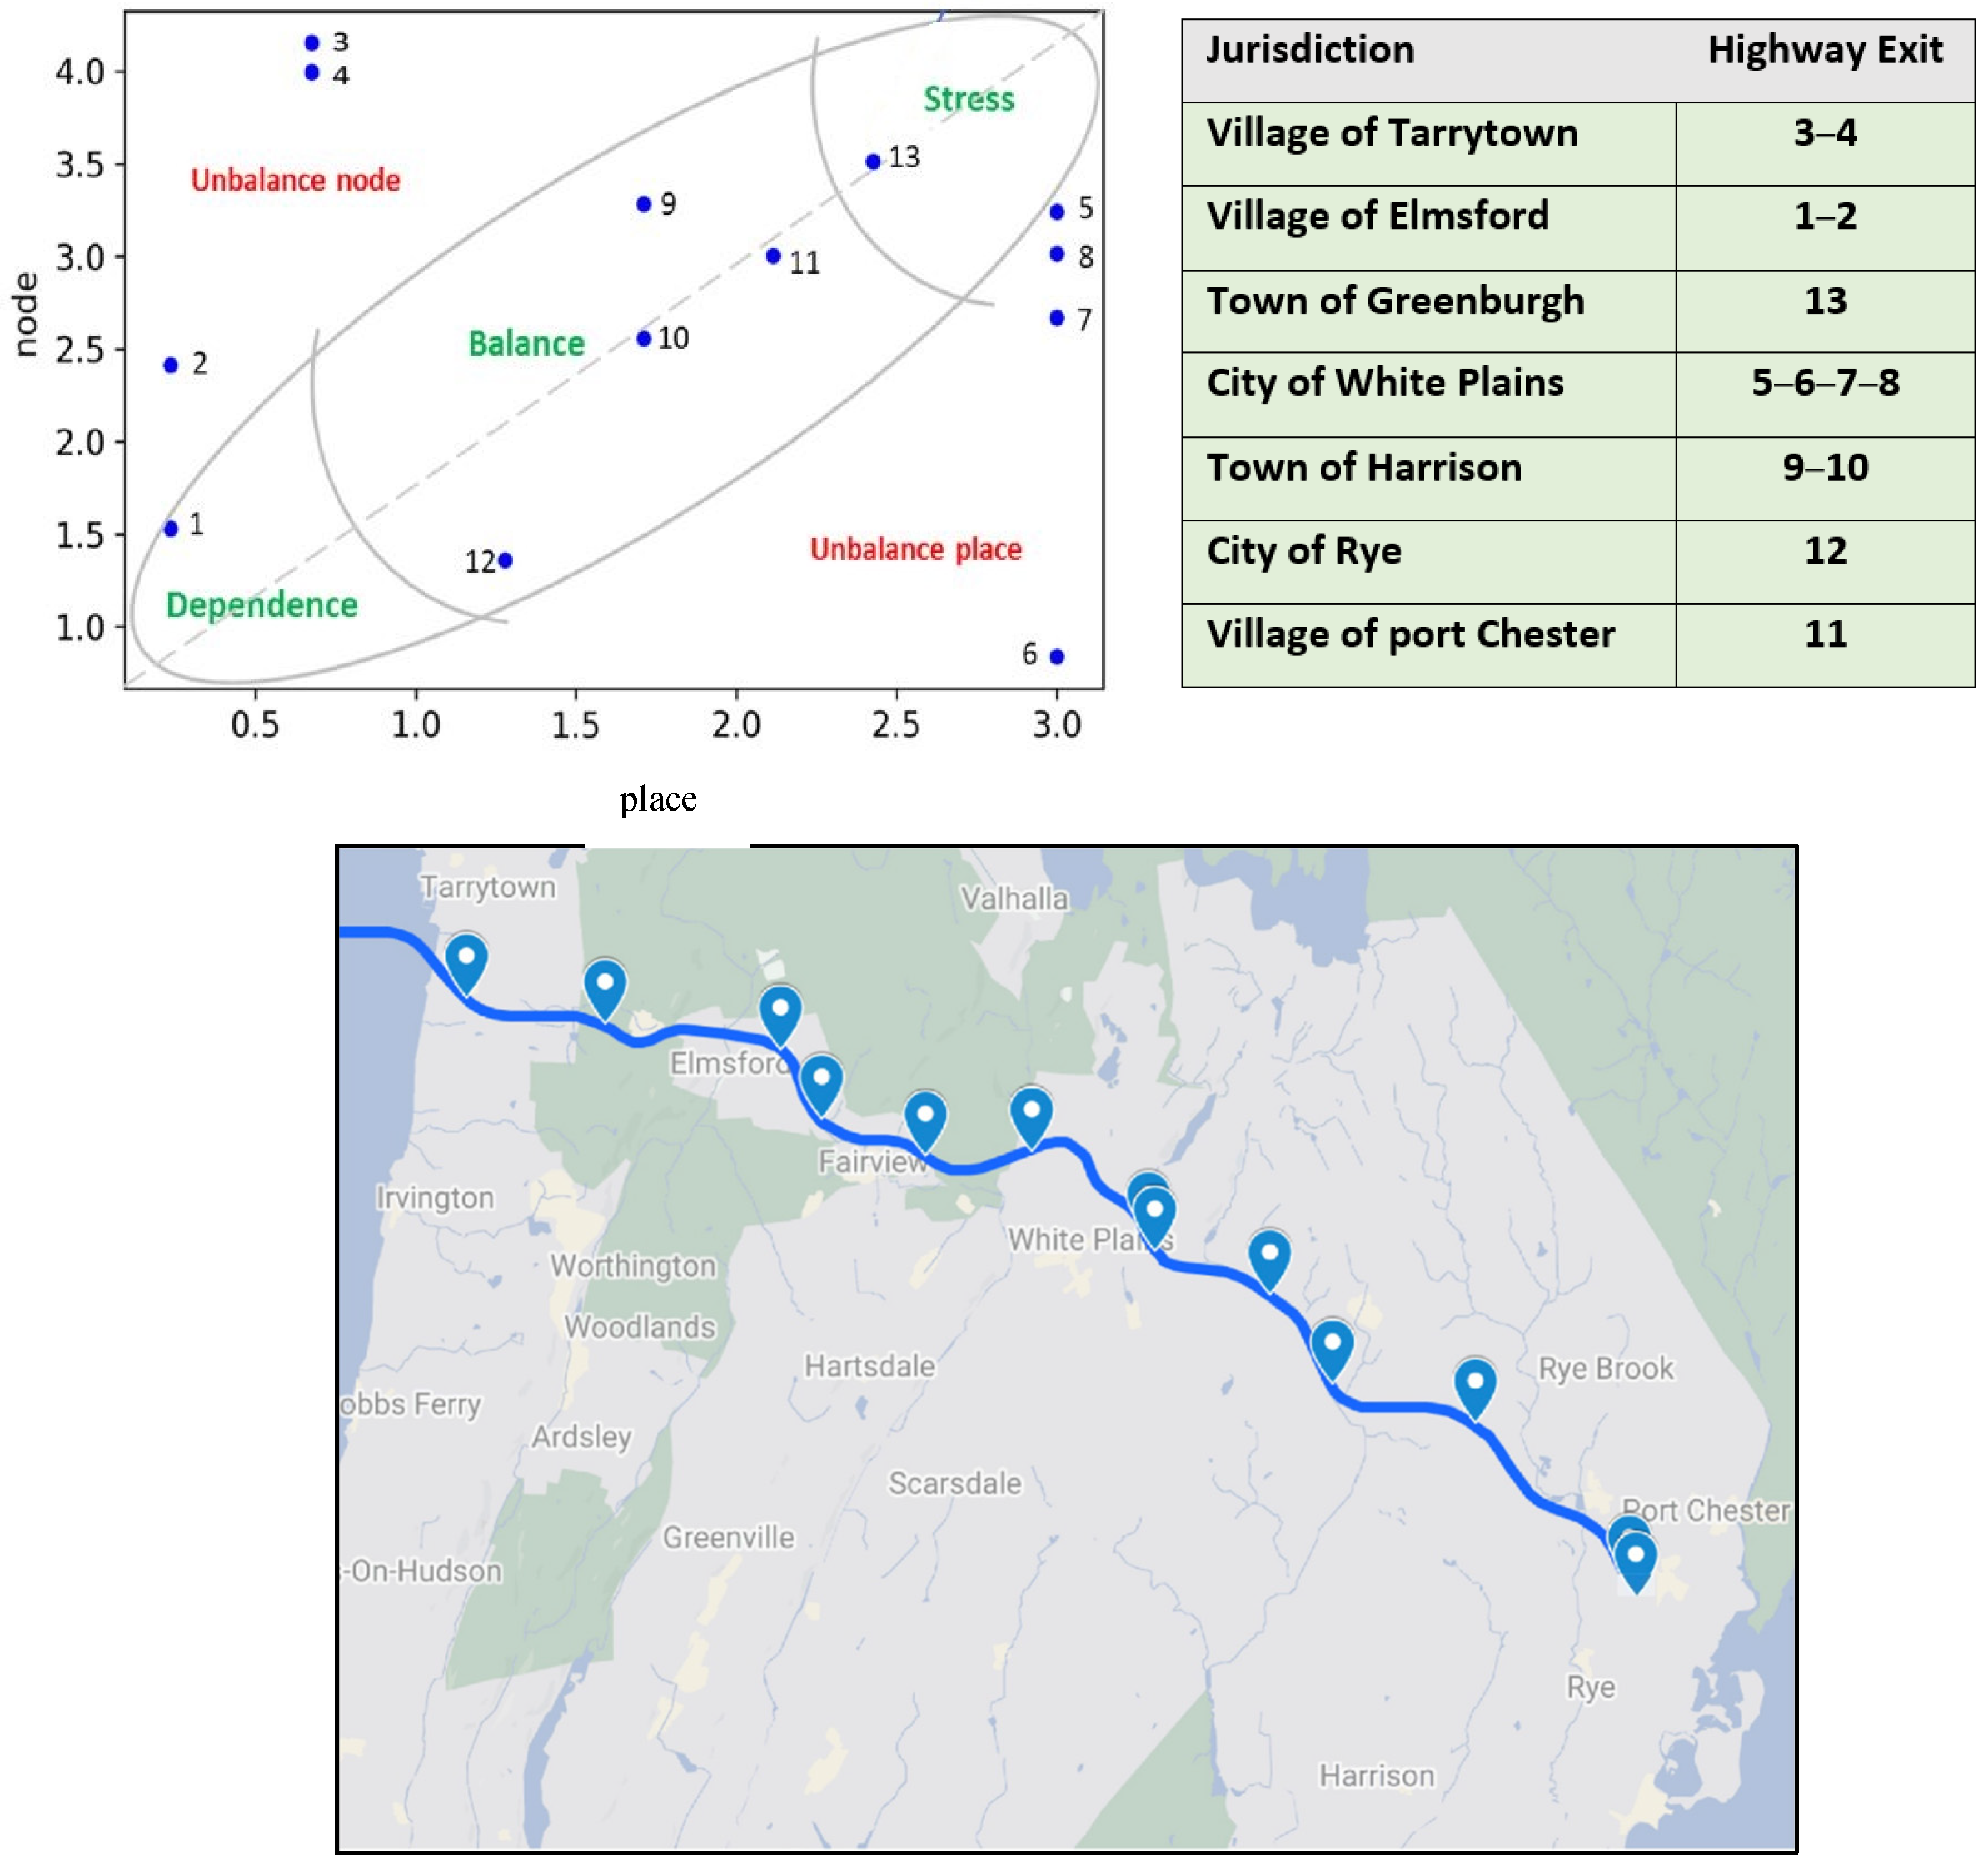
Figure 4 represents the node–place analysis results in the I-287 Corridor area. Exits are classified into five classes (balanced, stressed, dependence, imbalanced nodes, and imbalanced places).
5.1. Dependence Area
Located at Elmsford, Exit 1 belongs to the dependency area, indicating no free space competition and low demand for infra flows. To maintain the area, other factors other than internal dynamics between nodes and places are required (e.g., subsidization). In the area surrounding this exit, the AADT and population are very low. These areas, primarily located on the outskirts of the urban transit network, have the lowest levels of all indices. Such sites are less accessible, yet they match land use characteristics, such as insufficient development intensity and lack of diversity.
In other countries, it has been demonstrated that expanding a city from a single center to a multicenter can be achieved using high-speed rail stations with low node and space values. For example, La Defense station, Europe’s greatest transportation hub, has evolved into a sub-center of Greater Paris with international city functions. Additionally, Shinjuku, Ikebukuro, and Shibuya rely on building big-scale stations to bring together many office and commercial facilities simultaneously. Soon after, they evolve into Tokyo’s three major sub-centers. This experience in high-speed rail stations could likely be applied to highways.
5.2. Stress Area
Greenburgh Exit 13 is categorized as a stress area, which means the intensity of traffic flows and urban activity is maximal (top of the line). In these areas, further development can be problematic because of conflicting claims to limited space. Among the entire exits considered for this study, this one has the highest AADT and is the most populated. These areas are at the heart of the urban transport network, with easy access to neighboring stations. They are also in the core business district, where the station area’s development intensity and diversity are high. However, the traffic function of such sites and the activation function of the venue have achieved their maximum development value, and further development will be limited. The coordination of transportation development and utilization will also face challenges.
5.3. Balanced Area
Exits 9, 10, 11, and 12 are located at the balanced class with a compatible arrangement for the street network, which has high values of place-to-movement and place-through-movement potential, leading to a sustainable city and neighborhood structure [
34,
35]. These areas have strong and stable traffic and customer flow support and strong support from local government departments. Additionally, they also have a system that connects with other modes of transportation and integrates with the commercial center. Therefore, these areas are well-developed, and their structure reduces commuting time [
48,
49].
5.4. Unbalanced Nodes
Where transportation systems are relatively much more developed than urban activities such as exits 2, 3, and 4, at the urban scale, the streets connected to the site have a high degree of integration and selection, forming a high node value and potentially developing into an urban center. Although the streets connected to the site have high global accessibility, their development potential has not been achieved through the street network design in the site area, resulting in an imbalance between node value and place value. The transportation advantages displayed by the highway systems cannot match the urban functions of the area in which it is located, resulting in node value waste. It is also not conducive to regional development potential.
5.5. Unbalanced Place
All exits located in white plains, including exits 5, 6, 7, and 8, belong to an unbalanced place group where the urban activity is more intense than the transportation supply. Even though the difficulty of planning and redevelopment of stations in the core area of those areas is beyond imagination, the local government may still need great efforts to improve the traffic node value of these areas. This is because such areas are typically found in commercial centers with the main business centers, which are the places with the largest economic potential. Significant investments in increasing the accessibility of the area will reduce traffic congestion and increase the place value of those areas.
6. Discussion
Assessing an existing corridor is a critical first step in creating recommendations for its (re)development. Using our method, all exits along the I-287 in Westchester County were distinguished according to their node (connection to other places) and place (possible activities nearby). In the evaluation framework, mobility was just one aspect. By defining the classes, it becomes possible to make class-specific suggestions as input to the development process.
The traditional practice in development plans that includes applying traffic-related performance measures, such as delays, solely based on traffic networks does not guarantee the accessibility of the community members. The more recent approach of focusing on accessibility tends to be inefficient in addressing the mobility needs of metropolitan areas. The TOD approach is effective in balancing both mobility and accessibility needs. Borrowing the node–place model from TOD, we applied the model to the highway development plans.
Highway exits are usually considered inaccessible areas that may damage neighborhoods and create injustice. The proposed methodology has the potential to provide a balanced development solution by looking at a corridor (i.e., highway) and nodes (i.e., here, highway exists) comingling with the transportation and land use factors.
In this paper, we demonstrated how the node–place model can be useful for screening highways’ accessibility and for initiating future discussion processes. Moreover, these model-driven results can be used in the planning process to pre-select highways that need to be investigated further. A simpler, less data-intensive model may be able to accomplish this preselection. Thus, the node–place model assists in planning processes by identifying areas for discussion and further evaluation. It is also important to consider values and preferences when selecting specific development options, requiring a more process-oriented planning approach, such as communicative, participatory, collaborative, or deliberative.
Our results suggest that, for those places with poor values, we can consider introducing some relevant industries and commercial centers, as well as delaying the construction of new highway lines or other modes of transit. Furthermore, more transportation options should be considered for those with low node values, such as constructing more train/bus stations, increasing the number of highway exits, or connecting the existing roadway to others. Additionally, when it comes to optimizing the road network, the development of expressways and trunk roads is required to ensure the speed of regional external connections.
7. Conclusions
The purpose of this paper was to examine the development dynamics of the I-287 Corridor and nearby surrounding areas using the node–place model. This method enables urban and transportation planners to simultaneously evaluate neighboring areas of the corridor from the perspective of integrated land use and transportation. We used this method to identify the transport and land use factors that contributed to the redevelopment of the I-287 Corridor and determine the extent to which they influenced it. The hypothesized relationship between node and place functions was tested by applying Bertolini’s (1999) node–place model. The transport activity and connectedness of the highway exits to other places of interest were explained by the node function. An interpretable five-cluster solution was developed by categorizing highway exits, which stimulated discussion about further development suggestions.
This case study is a first step toward improving the understanding and evaluation of highway existence. Despite its incapacity to predict development, the node–place model can be used to better understand the dynamics of development. Our findings provide insights into the alternative methods that could assist the government in promoting a balanced growth along the I-287 Corridor. The development dynamics of the corridor could also be determined by examining how the corridor has developed over time. The vertical integration of land use and transportation planning can be enhanced in the planning area. The node–Place analysis, or a similar approach, can help to identify vertical integration opportunities based on the land use component of regional transportation plans. Based on the findings, local officials must be brought into the planning process in a targeted manner by assessing the development potential of the area, providing technical assistance and funding for transportation projects and collaborating with the implementation partners.
Our study, however, has its limitations. Our data size was not large enough. Moreover, we did not evaluate the results of our model for an existing condition. This could have helped with the better fine-tuning of our model. Future research can add more indexes to the place values. Three potential node indices can be added in the future to assess the connectivity within the area better, including car parking capacity, bicycle parking capacity, and bicycle across.


 ,
, 


