


An Urban Density-Based Runoff Simulation Framework to Envisage Flood Resilience of Cities

1
Department of Town and Country Planning, University of Moratuwa, Moratuwa 10400, Sri Lanka
2
Global Disaster Resilience Centre, University of Huddersfield, Huddersfield HD1 3DH, UK
*
Authors to whom correspondence should be addressed.
Urban Sci. 2023, 7(1), 17; https://doi.org/10.3390/urbansci7010017
Submission received: 26 December 2022
/
Revised: 14 January 2023
/
Accepted: 19 January 2023
/
Published: 31 January 2023
(This article belongs to the Special Issue Urban Agenda)
Abstract
:Assessing the influence of urban density on surface runoff volume is vital for guiding the built-form expansions toward flood-resilient cities. This paper attempts to develop a spatial simulation framework to assess the impact of urban density on the level of surface runoff (SR), at the scale of the micro-watershed. This paper proposes a spatial simulation framework that comprehensively captures the influence of urban density dynamics over surface runoff. The simulation model consists of 13 proxies of urban density that are identified through a systematic literature review. The model is formulated through three case applications in Colombo, Sri Lanka; and validated statistically and empirically with reference to flooding events that occurred in 2021–2022. The possible planning interventions for reducing urban flooding are analyzed through an AI-based application of Decision Tree Analysis. The model results indicated that impervious coverage, open space ratio, and road density have the most significant impact on surface runoff volumes in selected micro-watersheds. The decision-making process for planning the built environment for reducing urban flooding is demonstrated by three possible density control options with a prediction accuracy of 98.7%, 94.8%, and 93.5% respectively. This contributes a novel framework to capture the density dynamics of built form in surface runoff simulations by three density areas (3Ds): density, diversity, and design; and to demonstrate the decision-making process for controlling the density of built form in reducing urban flooding.
1. Introduction
Rapid urbanization generally increases the magnitude and frequency of flood events and exposes communities to increasingly severe floods. Urban flooding is a commonly found hazard that causes significant damage to property, people, and the environment due to high population density, service agglomeration, and impervious surfaces in urban areas [1,2]. Today more than 50% of the population is agglomerating into urban areas and flooding is the most frequently identified hazard. During the last twenty years (2000–2019), the number of significant flooding events reported more than doubled compared to the previous decade [3,4] (from 1389 events to 3254 events), while the number of storms with flood-related damages grew from 1457 to 2034. The recorded economic loss was USD 2.97 trillion [3]. As a result, most countries tend to make cities resilient to floods.
Even though flooding is a natural phenomenon, the risk factor enhances with community exposure and vulnerability [5]. When community agglomeration occurs with urbanization the risk of flooding increases [6]. Consequently, urban areas have become more vulnerable hotspots of extreme flooding events due to high-intensity developments. The urban form characteristics such as land use, density, type of buildings, street pattern, and building layout may have a significant impact on inundation flow, since they affect the discharging partition between each urban element, thus they affect flow depths and velocities [6,7]. As a result, urban watersheds have greater peak discharge rates than rural watersheds, which reduces the water storage capacity. The urban form densities may have more substantial damage on an equivalent exposed urban land unit [8]. As such, the impact of urban form density on flood damage is evaluated in this paper. The urban form density changes by anthropogenic activities which trigger the level of surface runoff (SR) and affect economic, social, physical, and environmental damage to the entire urban system. Hence, managing the level of SR due to urban form density can be manipulated as a decision-making tool for practitioners such as disaster managers, planners, developers, engineers, and government and non-government agencies in urban flood risk management.
Numerous factors cause the peak discharge of the urban catchment to increase SR according to principal studies. Among those various causative factors for flooding (i.e., high intensity of precipitation, topographic features of the catchment area, geological characteristics of the catchment area, type of vegetation cover, hydrologic conditions, and urban form density), the urban form density is the factor most responsible for greater peak discharge [9,10]. Further, SR controls how accumulated rainfall and discharge of runoff from the urban environment flows into the natural landscape through paving, residences, and building [11,12]. A series of studies have been performed that comprehensively explore the natural factors connected to SR in urban settings, according to recent literature. However, we still do not completely understand the dynamic and intricate aspects of urban form density with changing SR due to limited evaluation frameworks [13,14].
Anthropogenic activities play a significant role in increasing SR in urban catchment areas including reclamation of water retention areas, development activities in low-lying areas, unplanned urban development, infrastructural issues, and socio-economic factors that trigger urban flooding [15,16,17,18]. Accordingly, enhancing urban flood resilience is an important consideration for a more effective flood management strategy. A substantial number of studies illustrate that the level of SR significantly increases with high-dense urban form characteristics (i.e., building density, road density, land use, and built features) in particular, urban watershed areas [19]. There is a need to develop an accurate quantification mechanism to identify the relationship between urban form density and level of SR.
The high-density urban form indicates a high level of impervious surfaces which reduces the natural penetration capacity while decreasing the infiltration rate. That leads to peak runoff in the urban environment, which generally reduces hydrologic response time [6]. Eini et al., 2020 and Le et al., 2022 [18,20] explained how the growth of urban areas reduces the natural infiltration rate under different urbanization conditions. Eini et al., 2020 [20] investigated the sensitivities of urban flooding to urban land growth through the simulation of flood flows under different urbanization conditions. Consequently, urbanization causes increased SR that is unsuitable for addressing by urban drainage or canal discharge rates which reduce the time required to reach peak runoff and discharge. Urban densities are directly connected to the percentage of total impervious surface area, which indicates the geographical distribution of impervious surface among each kind of land use in a particular flood-affected urban watershed [13,21]. As a result, urban density is a broad concept that needs to be analyzed in its complex reality to change surface runoff in dynamic urban watersheds [22].
In such a context, the impact of built-form densities has a significant influence on increasing the level of SR under dynamic urban forms [18,23] because the built-up area or the building density increases the risk of urban flooding and waterlogging. Property, livelihood loss, and traffic delays due to urban flooding are also significant in urban areas as employment hubs with the agglomeration of economic properties of high value, which can be minimized by controlling the intensity of SR [4,24,25]. Even though existing studies evaluate the impact of urban flooding with natural parameters such as rainfall uncertainties, topo-geological conditions, land use changes, soil features, or hydraulic and hydrological perspectives to manage urban flooding at different spatial levels [1,2], how the urban form density factor alone impacts flooding in a dynamic urban environment has yet to be studied. Furthermore, the available knowledge merely explains how surface runoff depends on urban form densities at urban watershed scales which has become a critical challenge for decision-makers due to the limited availability and validity of accurate methods to predict future and existing flood situations. Consequently, there is a need to develop a novel theory-based quantification method to measure the impact of urban form densities on surface runoff, which will support decision-makers, urban planners, governmental and non-government agencies to make their decisions more strategically.
The primary aim of this study is to develop a spatial simulation framework to assess the impact of urban density on SR in urban watersheds’ scale, under different urban form scenarios. The first objective of this study is to identify urban form-based proxies of urban density that are employed in quantifying SR. The second objective is to develop a conceptual framework to assess the influence of urban density on the level of SR at the urban watershed scale. Third, real ground validation of the developed conceptual framework will be performed under distinct urban form densities (i.e., at the urban watershed scale). Ultimately, the model output is expected to be developed as a planning guidance tool in process of decision-making.
1.1. Identifying the Urban Form-Based Proxies of Urban Density
Different studies argue that urban density has a significant influence on the change/trigger runoff in a particular area, but there is no concern about what the most critical parameters are that influence SR due to the complexity of the urban environment [13,18]. One group of studies argued that the climate change impact is the key causative factor that changes the level of SR as per the environmental studies by focusing on rainfall intensity [1,3]. However, the impact of climate change will continue for a long time. Due to disparities in infrastructure expansion, urban density and land use varying, climatic conditions and the impact on the lengthy lifespan of the urban systems by increasing level of SR as the result of anthropogenic activities [18]. Urban flooding is the outcome of the interaction between hydrological and meteorological conditions, which are made worse by human activity in dense urban catchment areas [13,26]. As a result, studying the key causative proxies which trigger the level of surface runoff still remains an open-ended topic in the urban density-based literature.
As per the first objective, this research examined the urban density-based proxies which can be measured/quantified regarding the level of SR in the key literature by performing a systematic review. This systematic review is based on a 10-year time frame and makes a density classification that covers the overall urban form density factors by adapting predefined criteria (i.e., select the articles that have open access, density parameter data available at the local context, and the article relates to the urban planning subject field area, etc.). Table 1 indicates the identified density-based proxies that represent flood/runoff-based studies. As per the key outcome of the systematic review, there is no single agreement as to which urban density-based proxies have the highest impact that triggers the level of SR [14,27]. However, scholars come to grips with that, urban density has been well recognized in urban flood studies as a factor triggering the SR.
As shown in Table 1, previous studies have derived urban density-based proxies used to measure the level or change of SR by combining natural factors (i.e., precipitation change, soil characteristics, terrain conditions, type of vegetation cover, drainage condition) but no study focuses on the change of SR due to the variation of urban form density as a standalone indicator.
The systematic review observed three limitations based on the evaluation of proxies identified that affect SR. First, urban density is captured by several proxies/indicators in different studies but there is not any agreement on which indicator would represent runoff level the best. Second, the majority of surface runoff studies analyse the impact of riverine floods on the urban environment, not sudden urban floods that occur due to extreme precipitation and rapid expansion of imperviousness or urban densities. Urban flood studies show that SR increases due to urban development such as constructing and paving of roadways, which have a poorer capacity for absorption than earlier locations or natural fields. Rainfall runoff in urban settings can rise to six times more than in natural settings as a result. Third, the derived proxies are overlapping with urban form functionality that demands a quantification approach representing the impact on runoff with a strong conceptual framework. Hence, this research attempts to review the indicators of urban density that are being utilized in existing studies and identify the most influential indicator(s) that could better represent the impact of urban density on surface runoff, particularly referring to the micro-watershed level.
The following sections describe how the framework to quantify the impact of urban densities on SR at the urban watershed scale is developed with reference to existing theories, concepts, and models.
1.2. Framework to Assess the Influence of Urban Density Changes on the Level of SR
The second objective of this study is to develop a framework to identify the impact of urban density on the level of SR in the urban watershed scale. The theories, concepts, and models are identified by utilizing a theoretical and narrative review. Here, used three theoretical frameworks, the Pattern of Natural Movement, the Theory of Urban Maturation Process, and the Rational Method.
The theory of natural movement describes how space changes as a result of economic activity. Here, a well-known feature along the street network is a structural component of the urban form and building densities. The built-form densities were established when the first wave of urban growth was brought about by economic activity agglomerations. Second, there is a rise in the demand for property near economic centers, and property rights are important in that regard [54]. The development of built-form density, diversity of activities, and economic agglomeration are all seen to contribute to the long-term growth of cities. Here, the land subdivision, as observed in smaller plot systems, is thought to facilitate these processes [22].
Theoretical justifications for the use of plot systems in several domains that analyze cities in light of this concept are a component of this process. At this time, the parcel size becomes smaller [54]. Consequently, as people move to such urban centers, the natural characteristics there suffer severe anthropogenic damage, and the building density rises [55]. This tendency is facilitated by a wider segmentation of urban land into small plots, as mentioned in urban morphological studies [56]. With the elements of accessibility and rising density in urban areas, road networks play a vital role in the subdivision of land parcels [55]. When impermeable surfaces quickly encroach on the natural environment fast floods occur while limiting the penetration rates. This is a widespread phenomenon that occurs in urban watershed environments where small land parcels, high building density, and increasing imperviousness prevent rainwater from flowing.
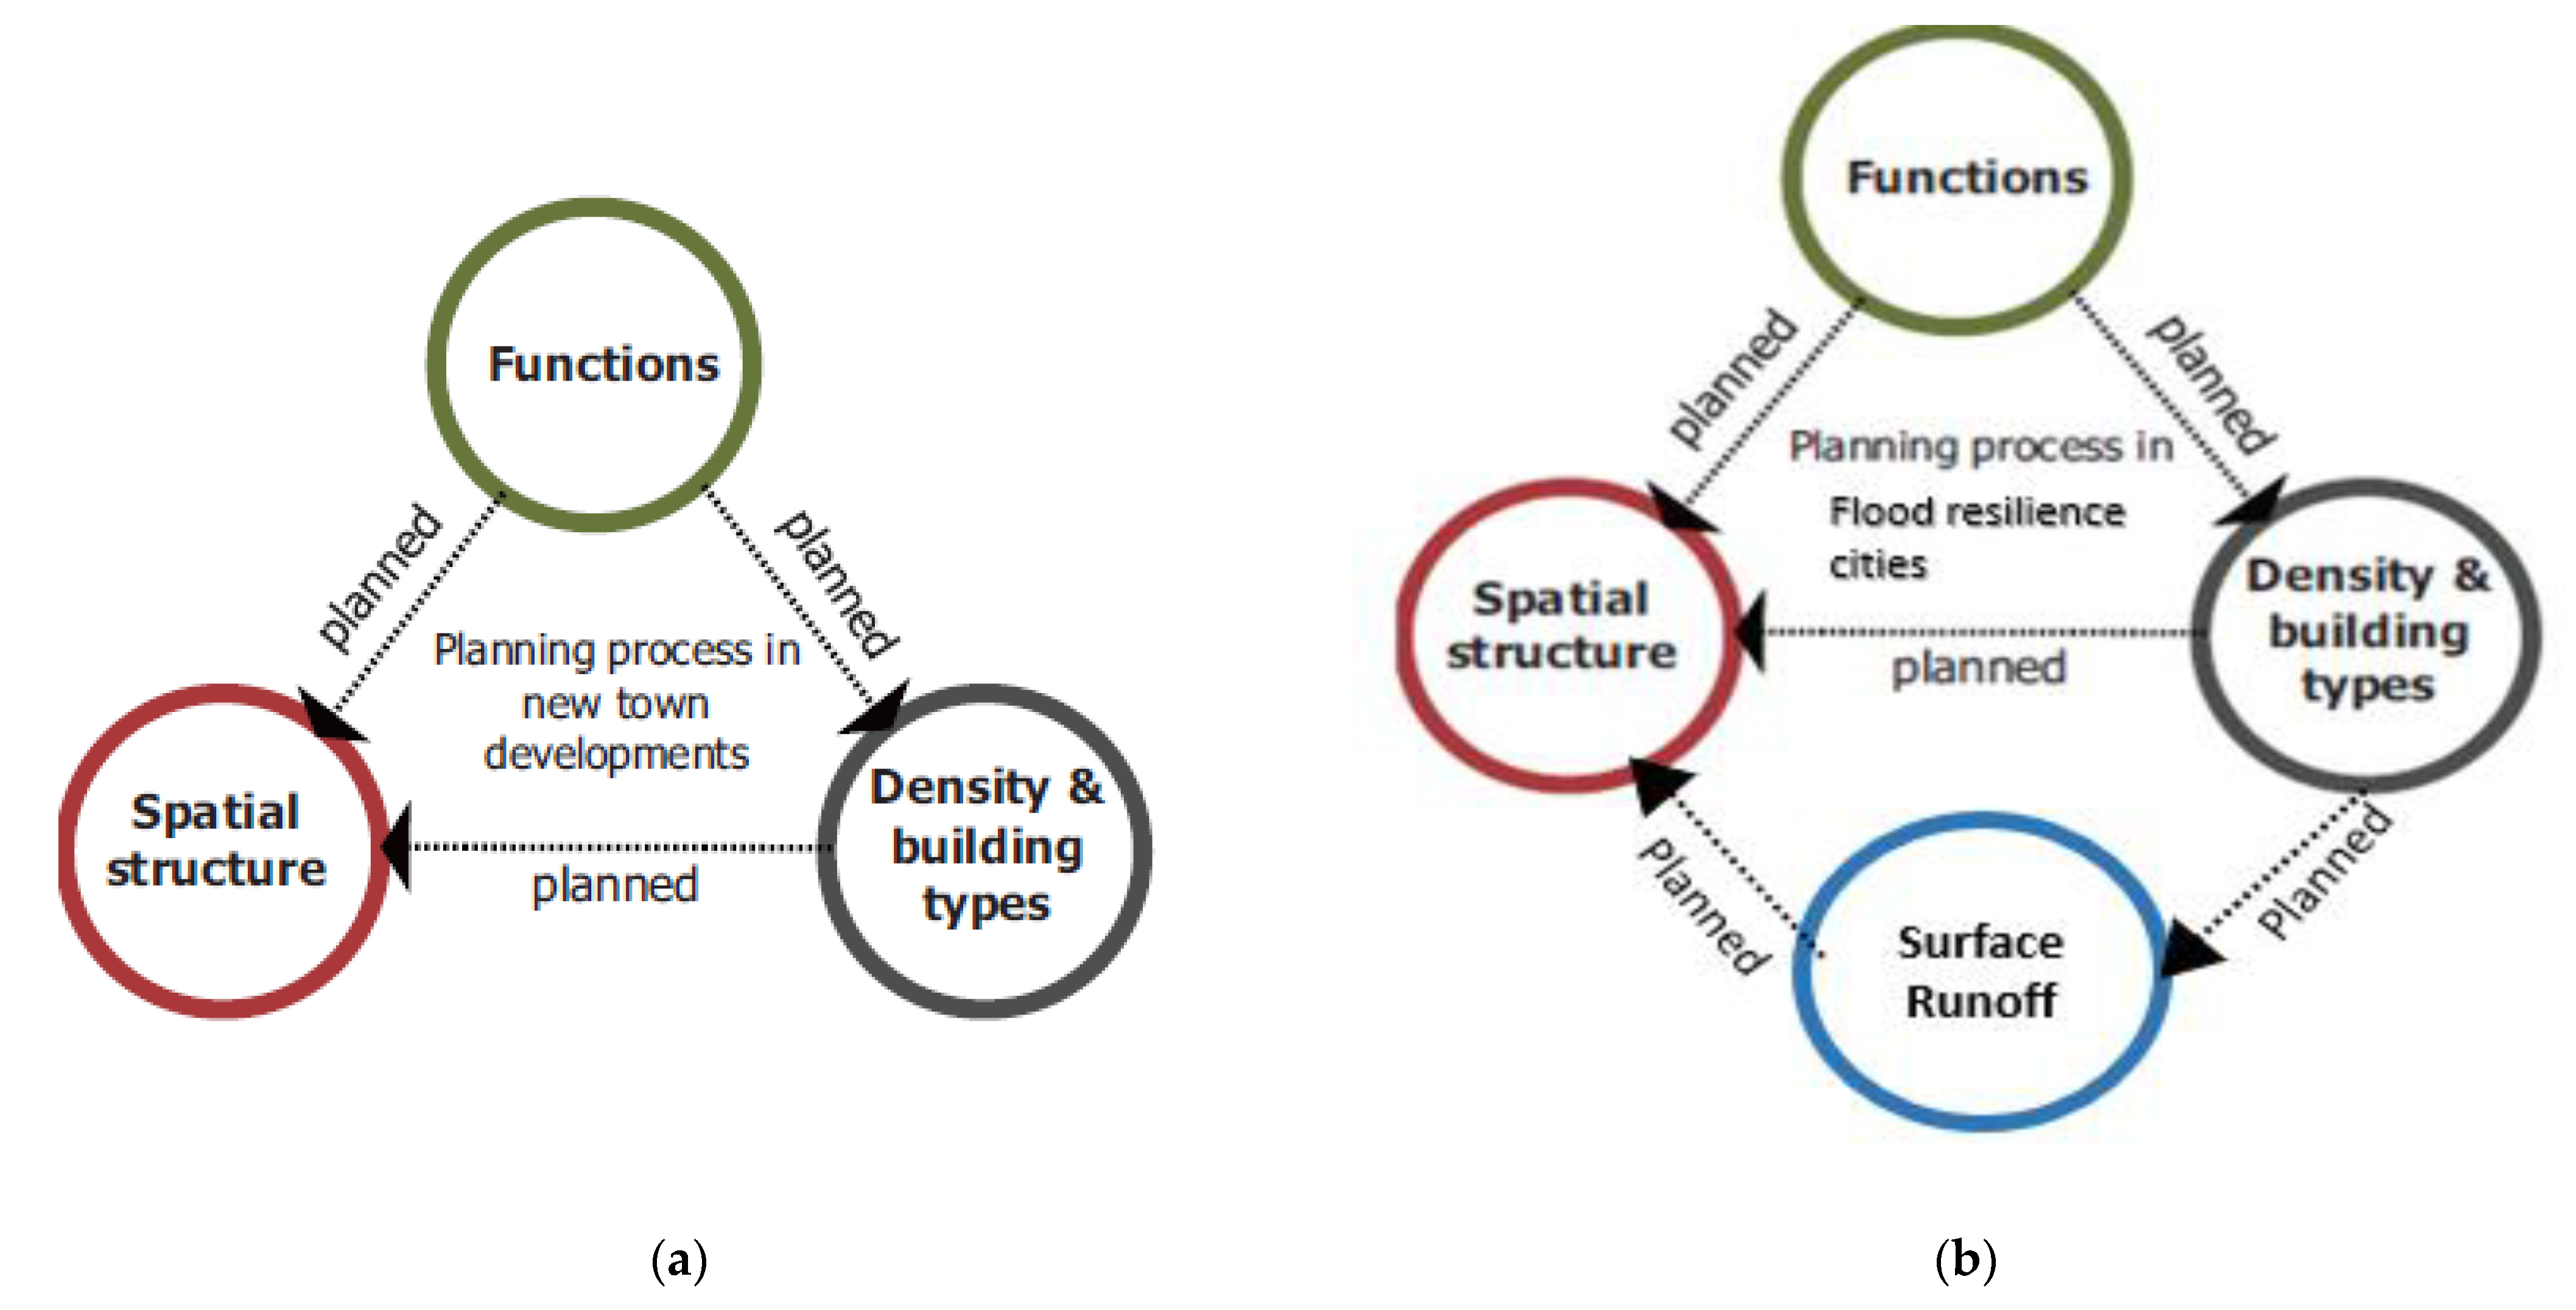
As per the Theory of the Urban Maturation Process, urban form densities develop or increase with special integration and land use mix. This explains why city/urban form has different stages (i.e., beginning, developing, developed) that enhance when in combination with built form density, special integration with spatial structure, and city functions indicated by a mix of land use [57]. This is developed based on Hillier’s (1999) spatial configuration idea with the combination of urban form features [57]. As a result, it theoretically defines interdependency between spatial structure (i.e., shape), degree of urban density, and degree of functional mix in the natural urban environment. Consequently, the functional mix indicates the land use density and density determined by building density. When the urban area becomes mature step by step, the density of the urban form increases due to the high level of accessibility and land use mix [13]. That leads to rise in SR and flooding because of highly dense urban clustering of activities (i.e., city function) and natural land conversion to the built environment (i.e., city spatial structure). In the end, it can be agreed that the planning process in a new town develops in combination with urban density, city functions, and special structure. To make flood-resilient cities, planning processes incorporate with control/management of SR with the previous concept (refer to Figure 1).
The Rational Method illustrates how a natural system exists by balancing the water (rainfall) in an area with runoff water, among rainfall intensity and catchment area features [58]. The Rational Method assumes that rainfall intensity and catchment area act as a uniform feature, and the runoff coefficient changes with the land use type of built-form density in an area. However, recent studies argue that the runoff coefficient cannot be a standard value that should change with land use and the urban density of an area [56,58]. Based on that assumption this study will evaluate the change of runoff coefficients under different urban densities and their impacts on SR. Here, the authors argue that the SR should change based on the change of runoff coefficient with urban density features linked with the theory of natural moment and urban maturation process.
Concepts
In order to develop the conceptual framework, this study used a concept of urban density categorization which represents spatial variations. Here, the city concepts identified through the narrative review conducted focus on urban water management strategies practiced under different urban contexts.
There are several ways to quantify density, including building density, built-up coverage, land-use intensity, and spaciousness [8,59]. Among those several approaches, no specific measure best represents the urban density at the local or urban watershed scale due to urban form complexity. However, the majority of scholars agree that density is an important element of the entire urban form, which changes with anthropogenic activities [14,59]. A notion as conceptually complicated as density has several interconnected aspects [22,57]. It is feasible to quantify the elements in a certain area physically and geographically, but it is also possible to evaluate them using features of the individual or group [60]. Other aspects of urban form, such as land use, accessibility, utilities, and neighborhood characteristics, are also intimately related to urban density. In such a context, urban density is likely an arrangement of physical components [59]. Therefore, in urban planning and development, density has been used as a tool to assess urban density, spatial diversity, and design elements.
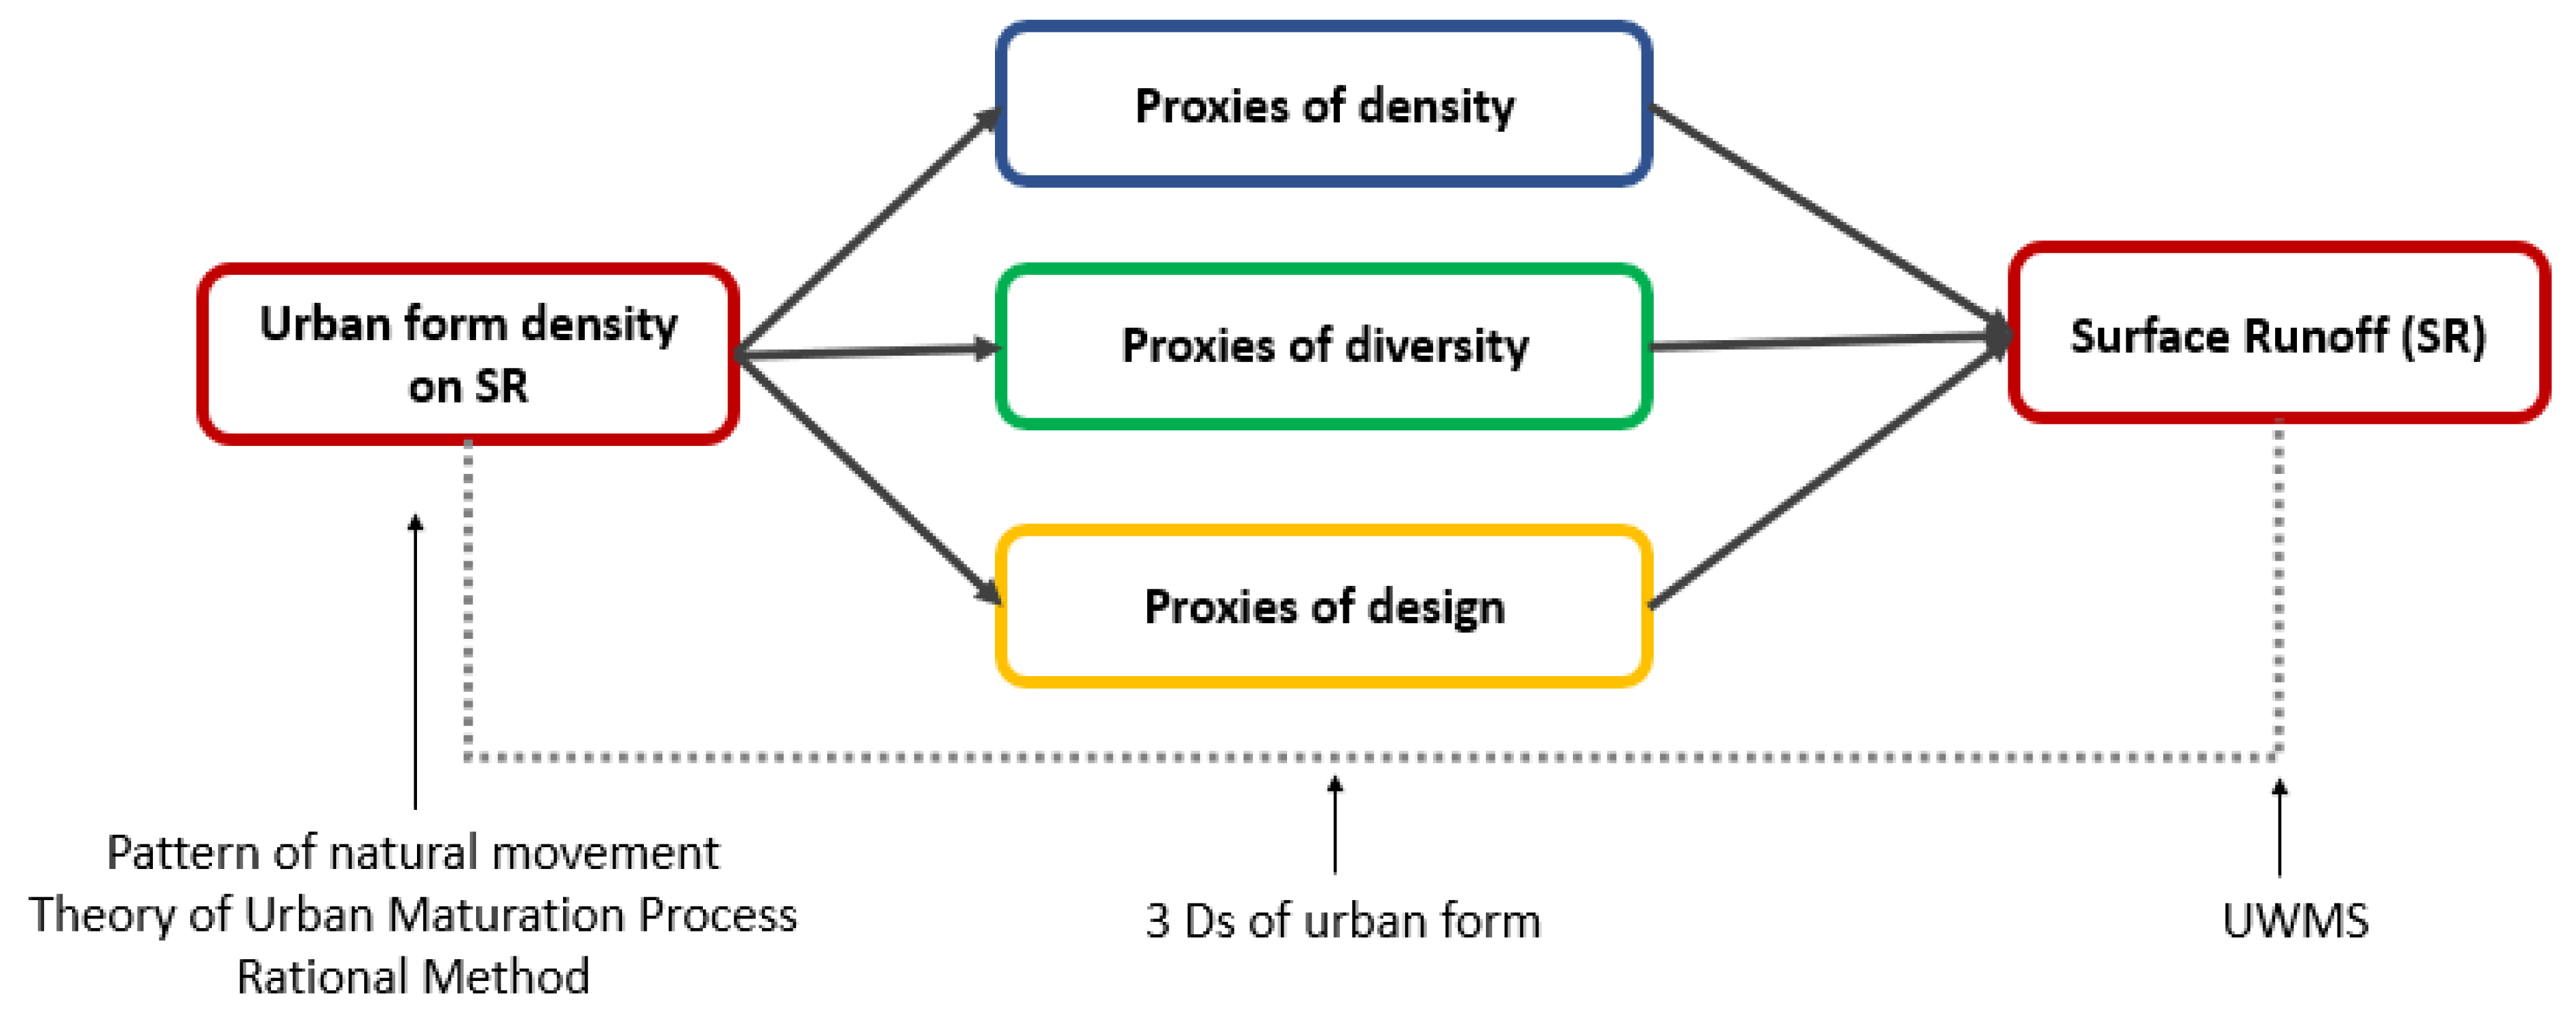
Here adapted to the ‘‘3D’’ model—density, diversity, and design—introduced by Cervero and Kockelman (1997) [61] to capture the variations of urban forms. This is a broad concept that comes under travel demand and transportation studies which also incorporate into urban planning studies [62]. Here they argued that entire urban density can be made with the combination of three factors: proxies of urban density, proxies of urban diversity, and proxies of urban design [63,64]. To attain these goals, new urbanists, neo-traditionalists, and other designers advocate for altering the built environment’s three dimensions, or the 3Ds: density, diversity, and design [63]. This concept is able to accomplish the primary aim of this study by using the component analysis approach to evaluate the relative importance of each proxy as well as their combined effects. Table 2 indicates the definitions of each dimension.
The conceptual framework of this study was developed based on the discussed theories and two concepts (i.e., 3Ds of urban form categorization and concepts of urban water management strategies).
1.3. The Proposed Conceptual Framework
The second objective of this study is to evaluate the impact of density-based urban form proxies on SR quantify under three broad density clustering approaches which come under 3Ds of urban forms, as proxies of urban density, proxies of spatial diversity, and proxies of urban design. Here it is expected to evaluate the most influencing proxies or groups of proxies on SR at the urban watershed scale. After identification of the most influencing indicator that would represent the level of SR at best, at the urban watershed scale can be developed as a planning and decision-making tool for making future cities resilient to flooding. Figure 2 represents the conceptual framework for this study. The next section explains the methods and materials utilized in the quantification process.
2. Materials and Methods
2.1. Overall Methodology
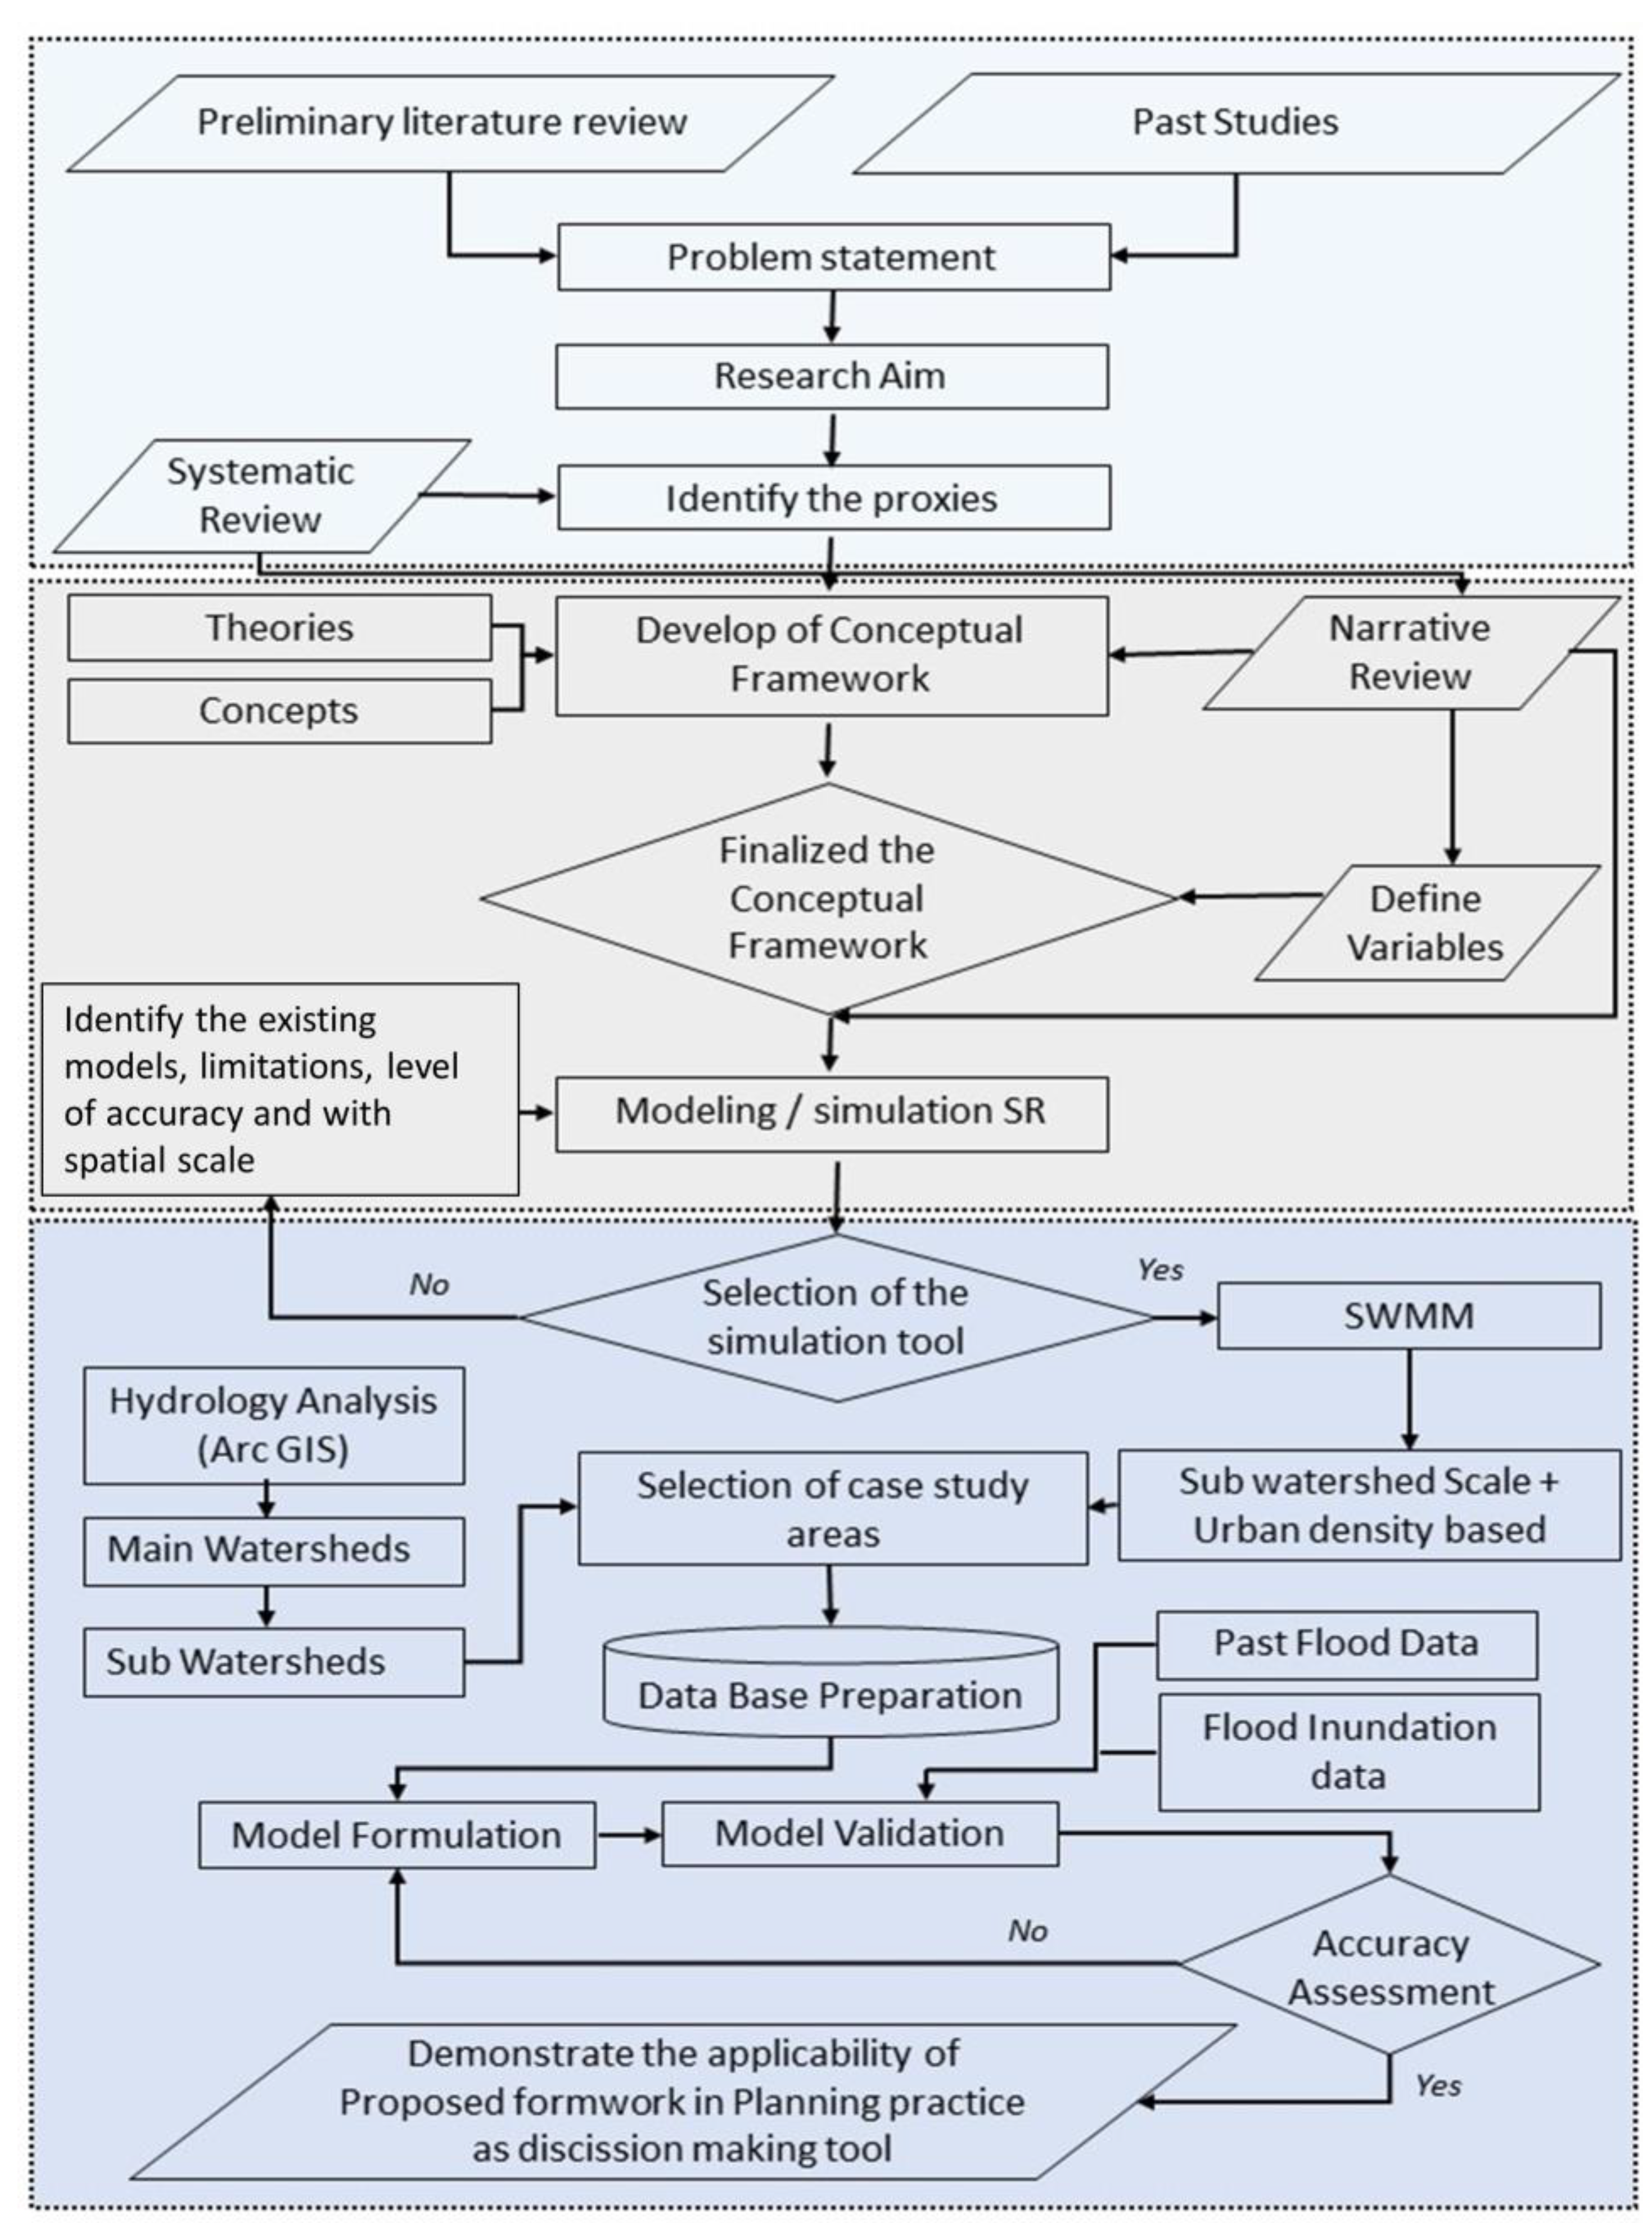
First, the variables to quantify urban form density as per the above-developed conceptual framework were defined. Second, a runoff simulation model for model formulation and validation was selected. Third, the selection of case study areas was carried out based on urban densities in urban morphology. After that, model formulation and validation were carried out with basic statistical analysis as well as decision tree analysis to measure the prediction probability and the level of accuracy of the pre-developed theoretical framework with real ground verifications. Below Figure 3 indicates the methodological flow chart.
2.2. Quantifying the Urban Form Density
There are 13 sub-variables selected to quantify urban form density under the three main variables (density, diversity, and design). Table 3 summarizes the variables, quantification methods, and data collection sources.
2.3. Selection of a Software Tools for Modelling Surface Runoff
To identify a simulation tool to model the surface runoff (SR) this study used both a systematic and a narrative review. Here, the existing modelling frameworks under different spatial scales, such as local level, site-specific level, and regional level were reviewed to verify the model accuracy. Further, the existing limitations of each model in practical usage and data requirements were also considered particularly referring to the Sri Lankan context. Table 4 represents the suitable model selection criteria used for this study.
By comparatively analyzing the existing flood simulation models, this study selected the SWMM modelling platform for modelling the surface runoff as per the above criteria.
The EPA SWMM (United States Environmental Protection Agency Storm Water Management Model) was selected to calculate the surface runoff in urban watersheds for this study by reviewing available surface runoff simulation approaches as a free and open-access flood inundation model [65]. It can be used under deterministic modelling scenarios to simulate water inflows, outflows, and storage within an urban sub-catchment area. Further, this model generates significant and accurate results on different spatial scales (i.e., local level, sub-watershed scale, neighborhood scale, and site scale). Furthermore, EPA SWMM has the capability to calculate runoff component functions as a collection of sub-catchment areas by adding land use dynamics and physical scenarios of urban form density. Among urban stormwater modelling, EPA SWMM 5.1 has recorded a reliable outcome in model calibration and verification [17,65]. This tool is used by several location-specific applications in worldwide planning and urban flood analysis, i.e., CSO-LTC (combined sewer overflows for long-term control plan by the United States Environmental Protection Agency) plans in Philadelphia, Cincinnati, Indianapolis, Seattle, New Haven, etc.) [53,66]. The result of SWMM is governed by the equation:
where
Q = Discharge through the conduit
V = Velocity in the conduit
A = Cross sectional area of the flow
H = Hydraulic head (invert elevation plus water depth)
Sf = Friction slope [67]
2.4. Selection of Cases Study Areas
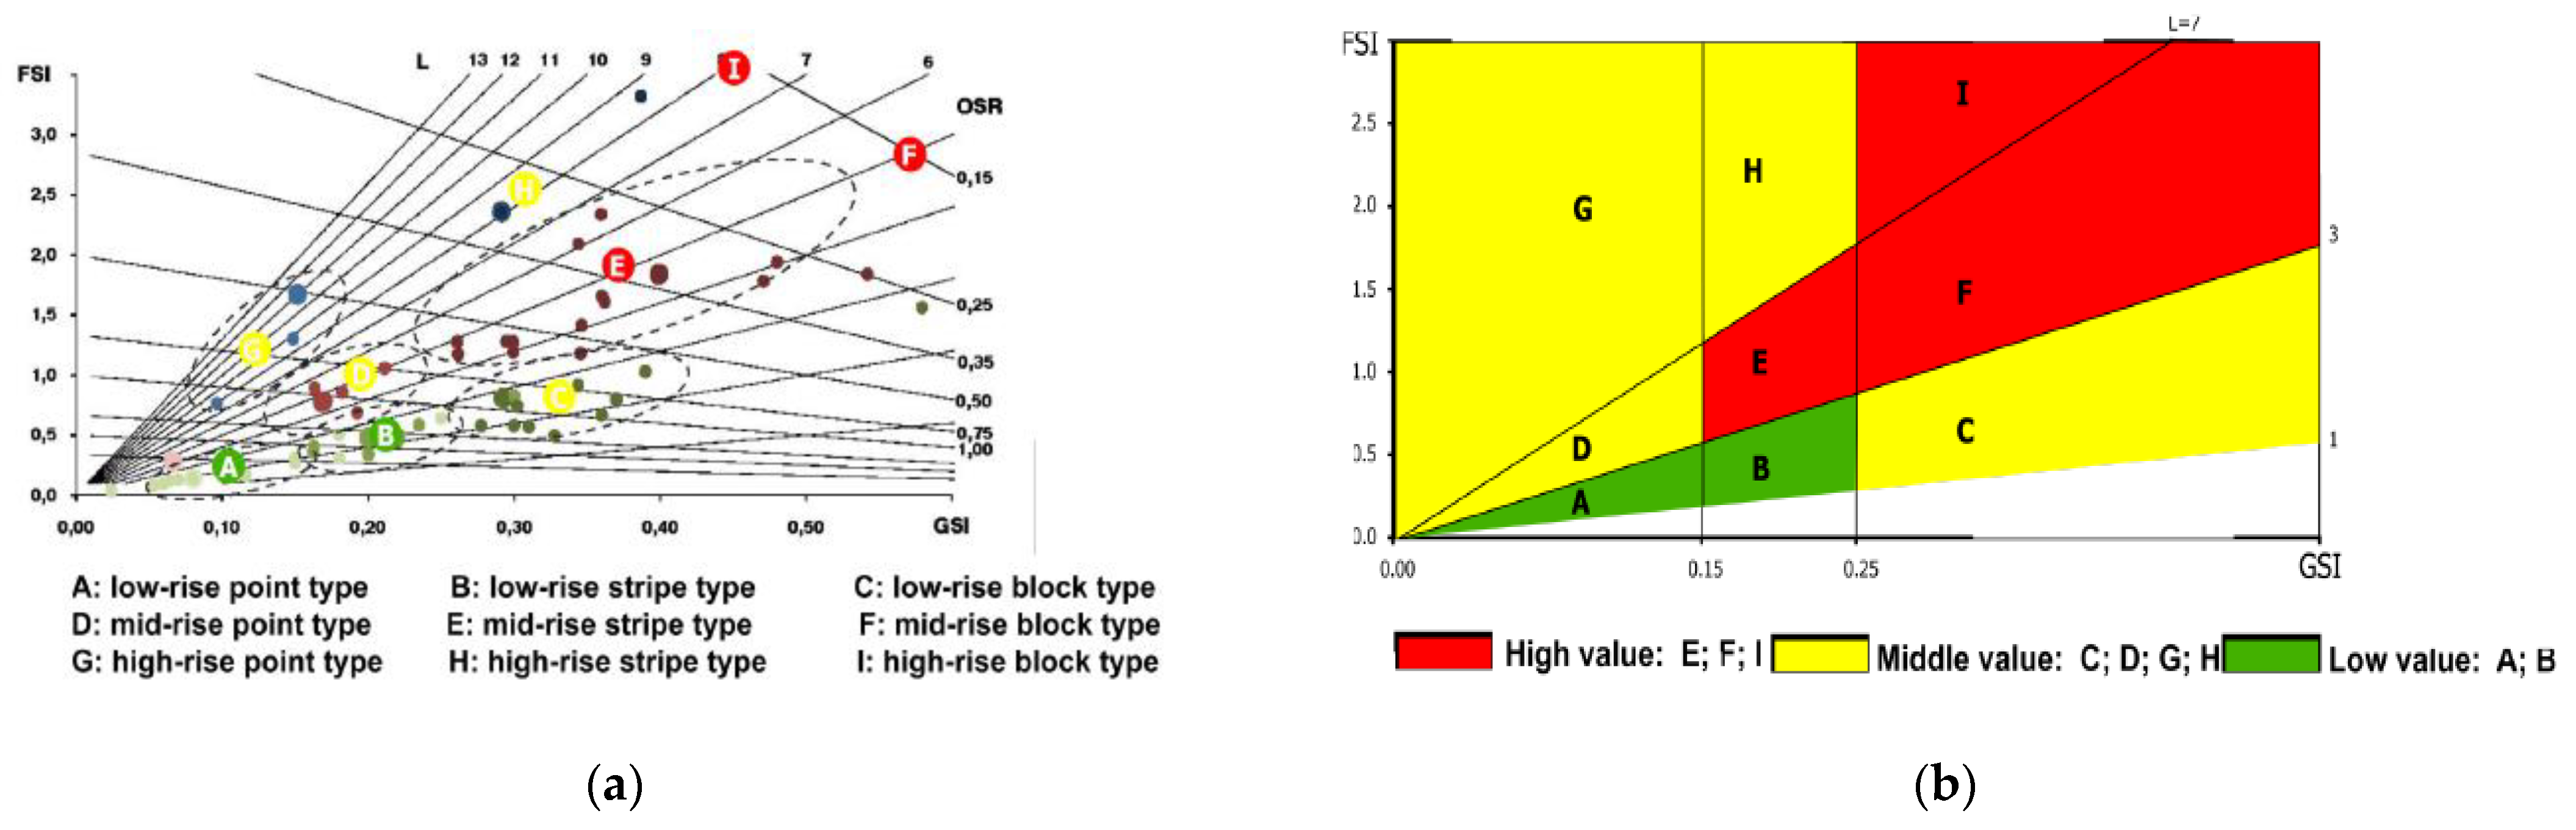
The case study areas were selected based on the type of density in the urban watershed. Three basic density types explained in the Spacemate density categorization [57] were considered. The Space matrix is a method to measure urban form densities that utilized nine density categories as depicted in Figure 4 based on floor space index (FSI), ground space index (GSI), and open space ratio (OSR). Those nine density categories are able to categorize the main three density groups (high, middle, and low-density). Hence, the three main density categorizations were directly adopted to validate the previously developed theoretical framework.
As the first step of case study area selection, the type of density layout of the urban watershed was selected as the process of creating urban layouts automatically using a computer-based procedural urban generation system with a set of rules and parameter values. Here, the key purpose is to develop a procedural generation system that creates urban layouts automatically while taking geometric urban parameters (such as road width, building orientation, road curvature, lot size, open space orientation, etc.) into account [68]. It is an open-source visual computing tool that helps to make decisions for urban planners in assessing the implementation of urban design layouts on expected flood risk within a limited time duration. The AI-based “Probabletrain Procedural City Generator” application was used to generate density-based procedural urban forms for this study. Table 5 depicts the set of parameters used for urban form density generation.
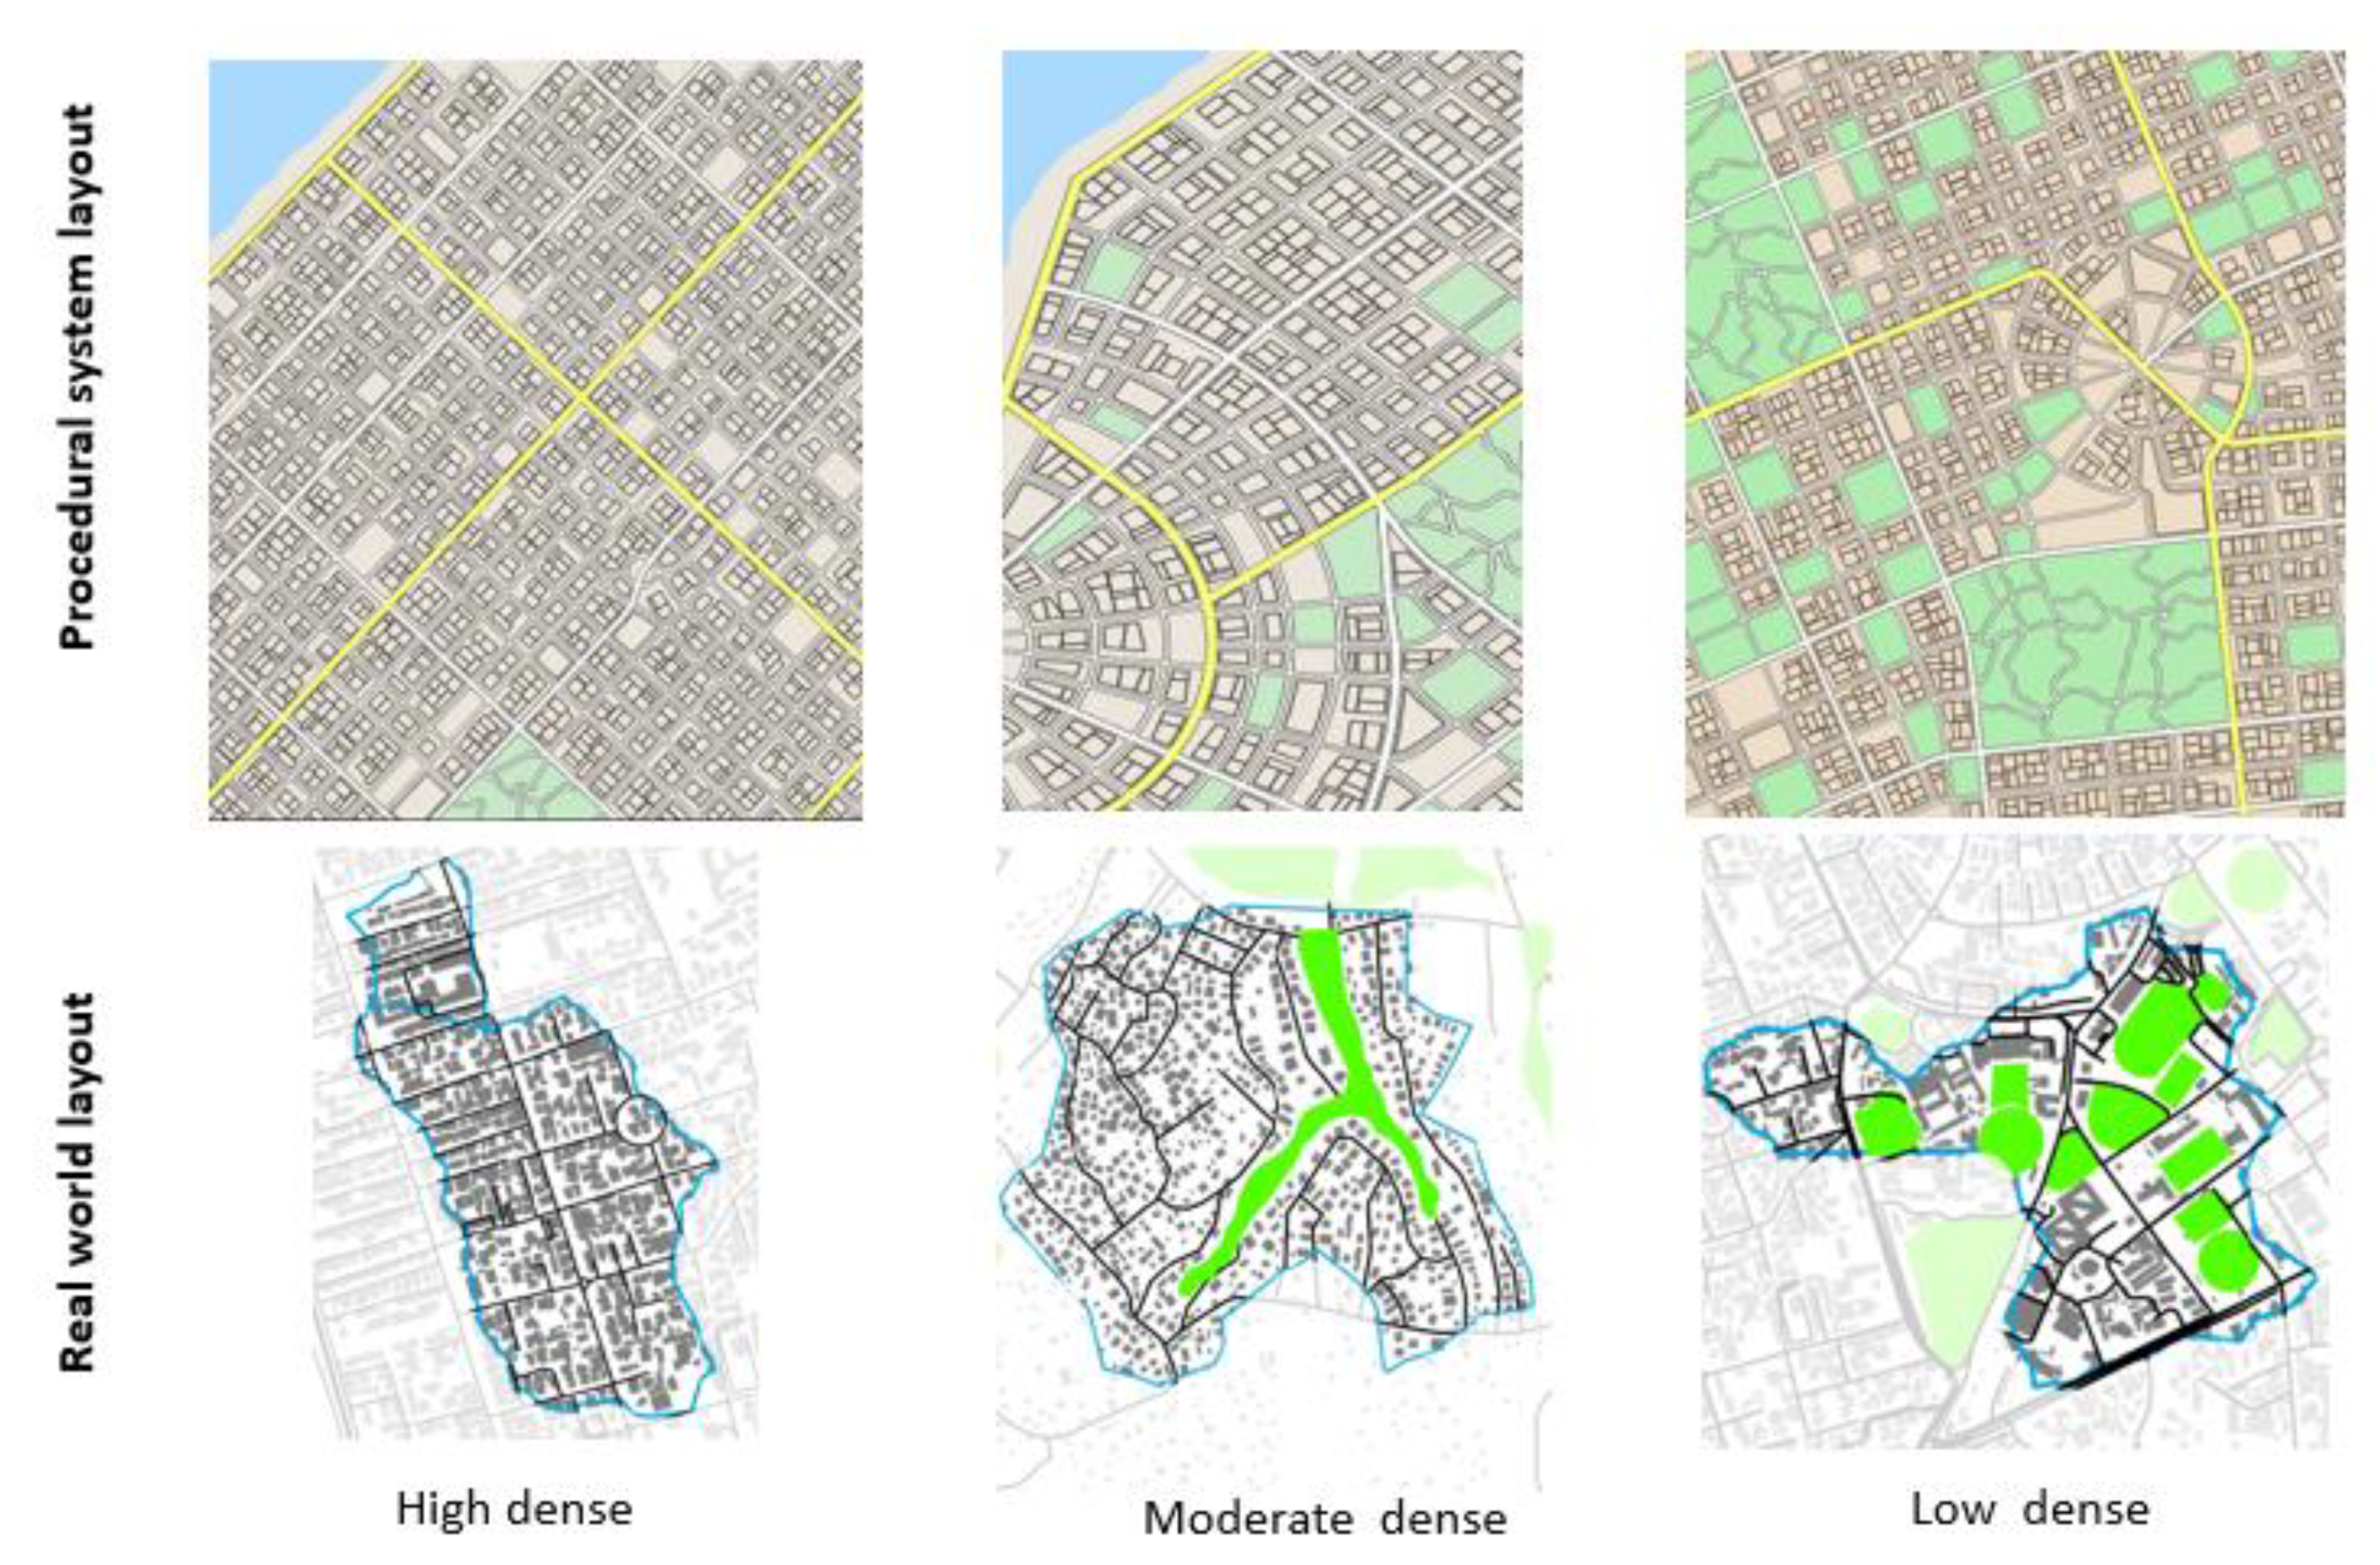
The second step of the case study areas was to select an entire urban watershed based on pre-derived urban form density types. The selected watershed was derived through hydrological analysis in the Arc GIS platform using a 12.5 m spatial resolution digital elevation model (DEM). The selected urban watershed is further subdivided into sub-catchment areas based on existing drainage networks and natural water flow patterns. Figure 5 indicates the procedural system layouts and the real-world layouts selected as the case studies to explore the relationship between urban form density and SR (surface runoff/urban flooding) in the Sri Lankan context. Table 6 depicts the characteristics of each selected density-based case study area.
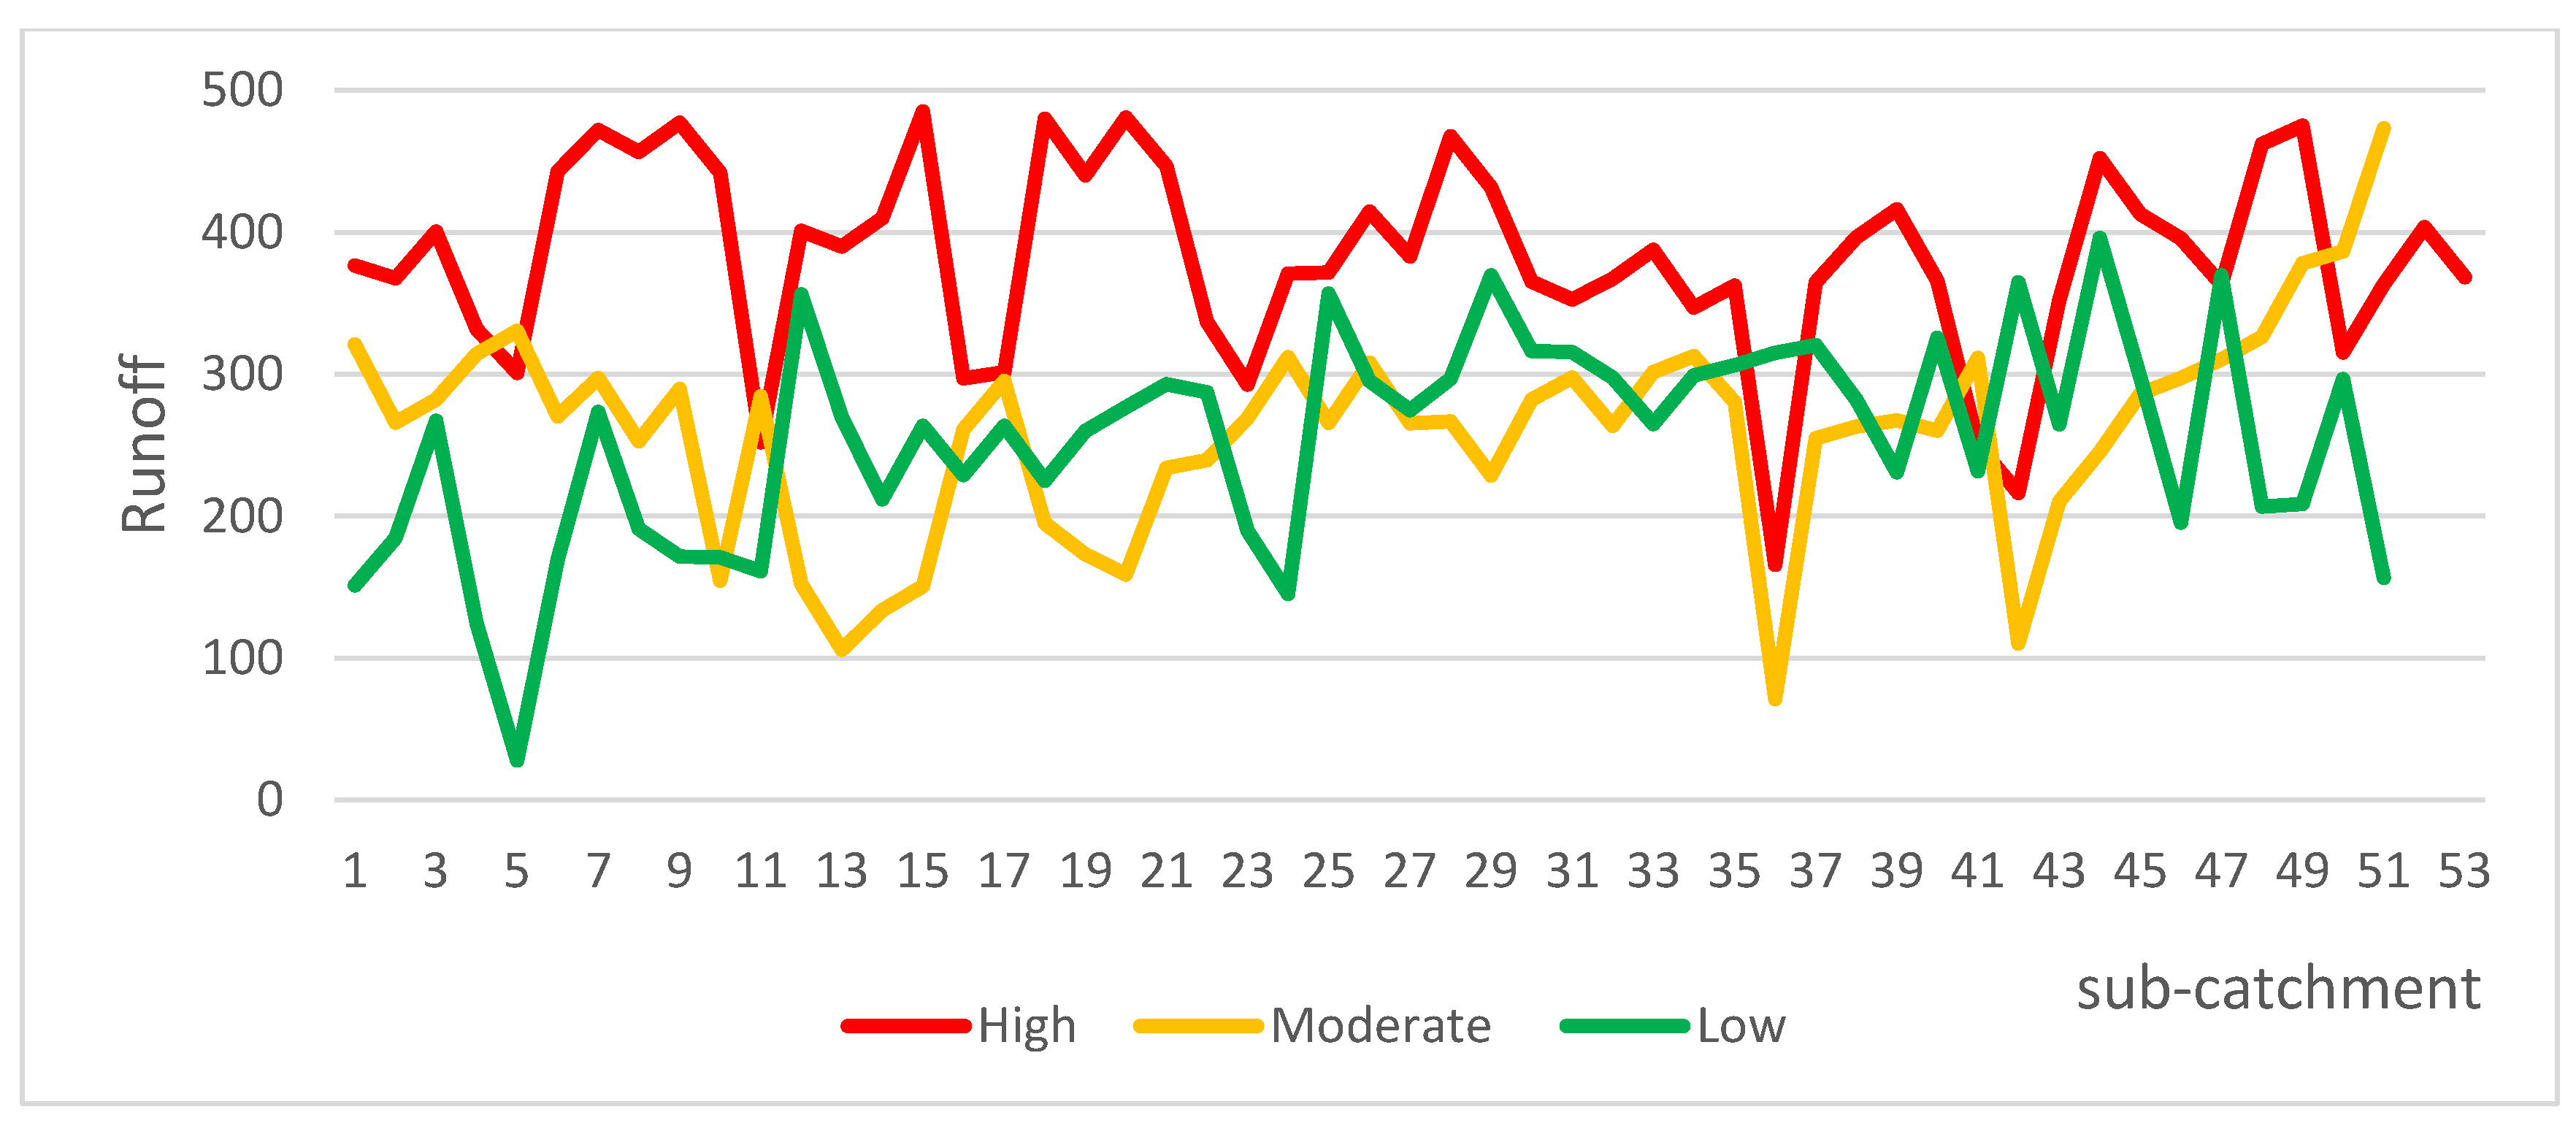
Figure 6, depicts the amount of surface runoff in selected case study areas. The surface runoff was simulated based on the actual highest recorded rainfall events occurred between 20 June 2021 and 25 June 2021 with the SWMM platform. There was an extreme rainfall event of 150–200 mm rainfall per 24 h. Accordingly, 15 min interval rainfall values were recorded and taken as input rainfall data at 4ONSE Weather Stations in the University of Moratuwa and Nagoda rainfall station by the Meteorological Department database.
3. Analysis and Results
The main aim of this study was to develop a spatial simulation framework to assess the impact of urban density on SR at the urban watershed scale. To achieve this aim, the developed framework was validated with selected case studies. As a first step of the analysis, Pearson correlation analysis was carried out to identify the correlation among selected individual density-based proxies. Next, the AI-based decision tree analysis was utilized to develop a model to determine the most influencing density-based parameter on surface runoff. The third stage was regression analysis utilized to validate the developed framework with real ground flood data. Table 7 indicates a summary of the analysis in each stage.
3.1. Correlation Analysis
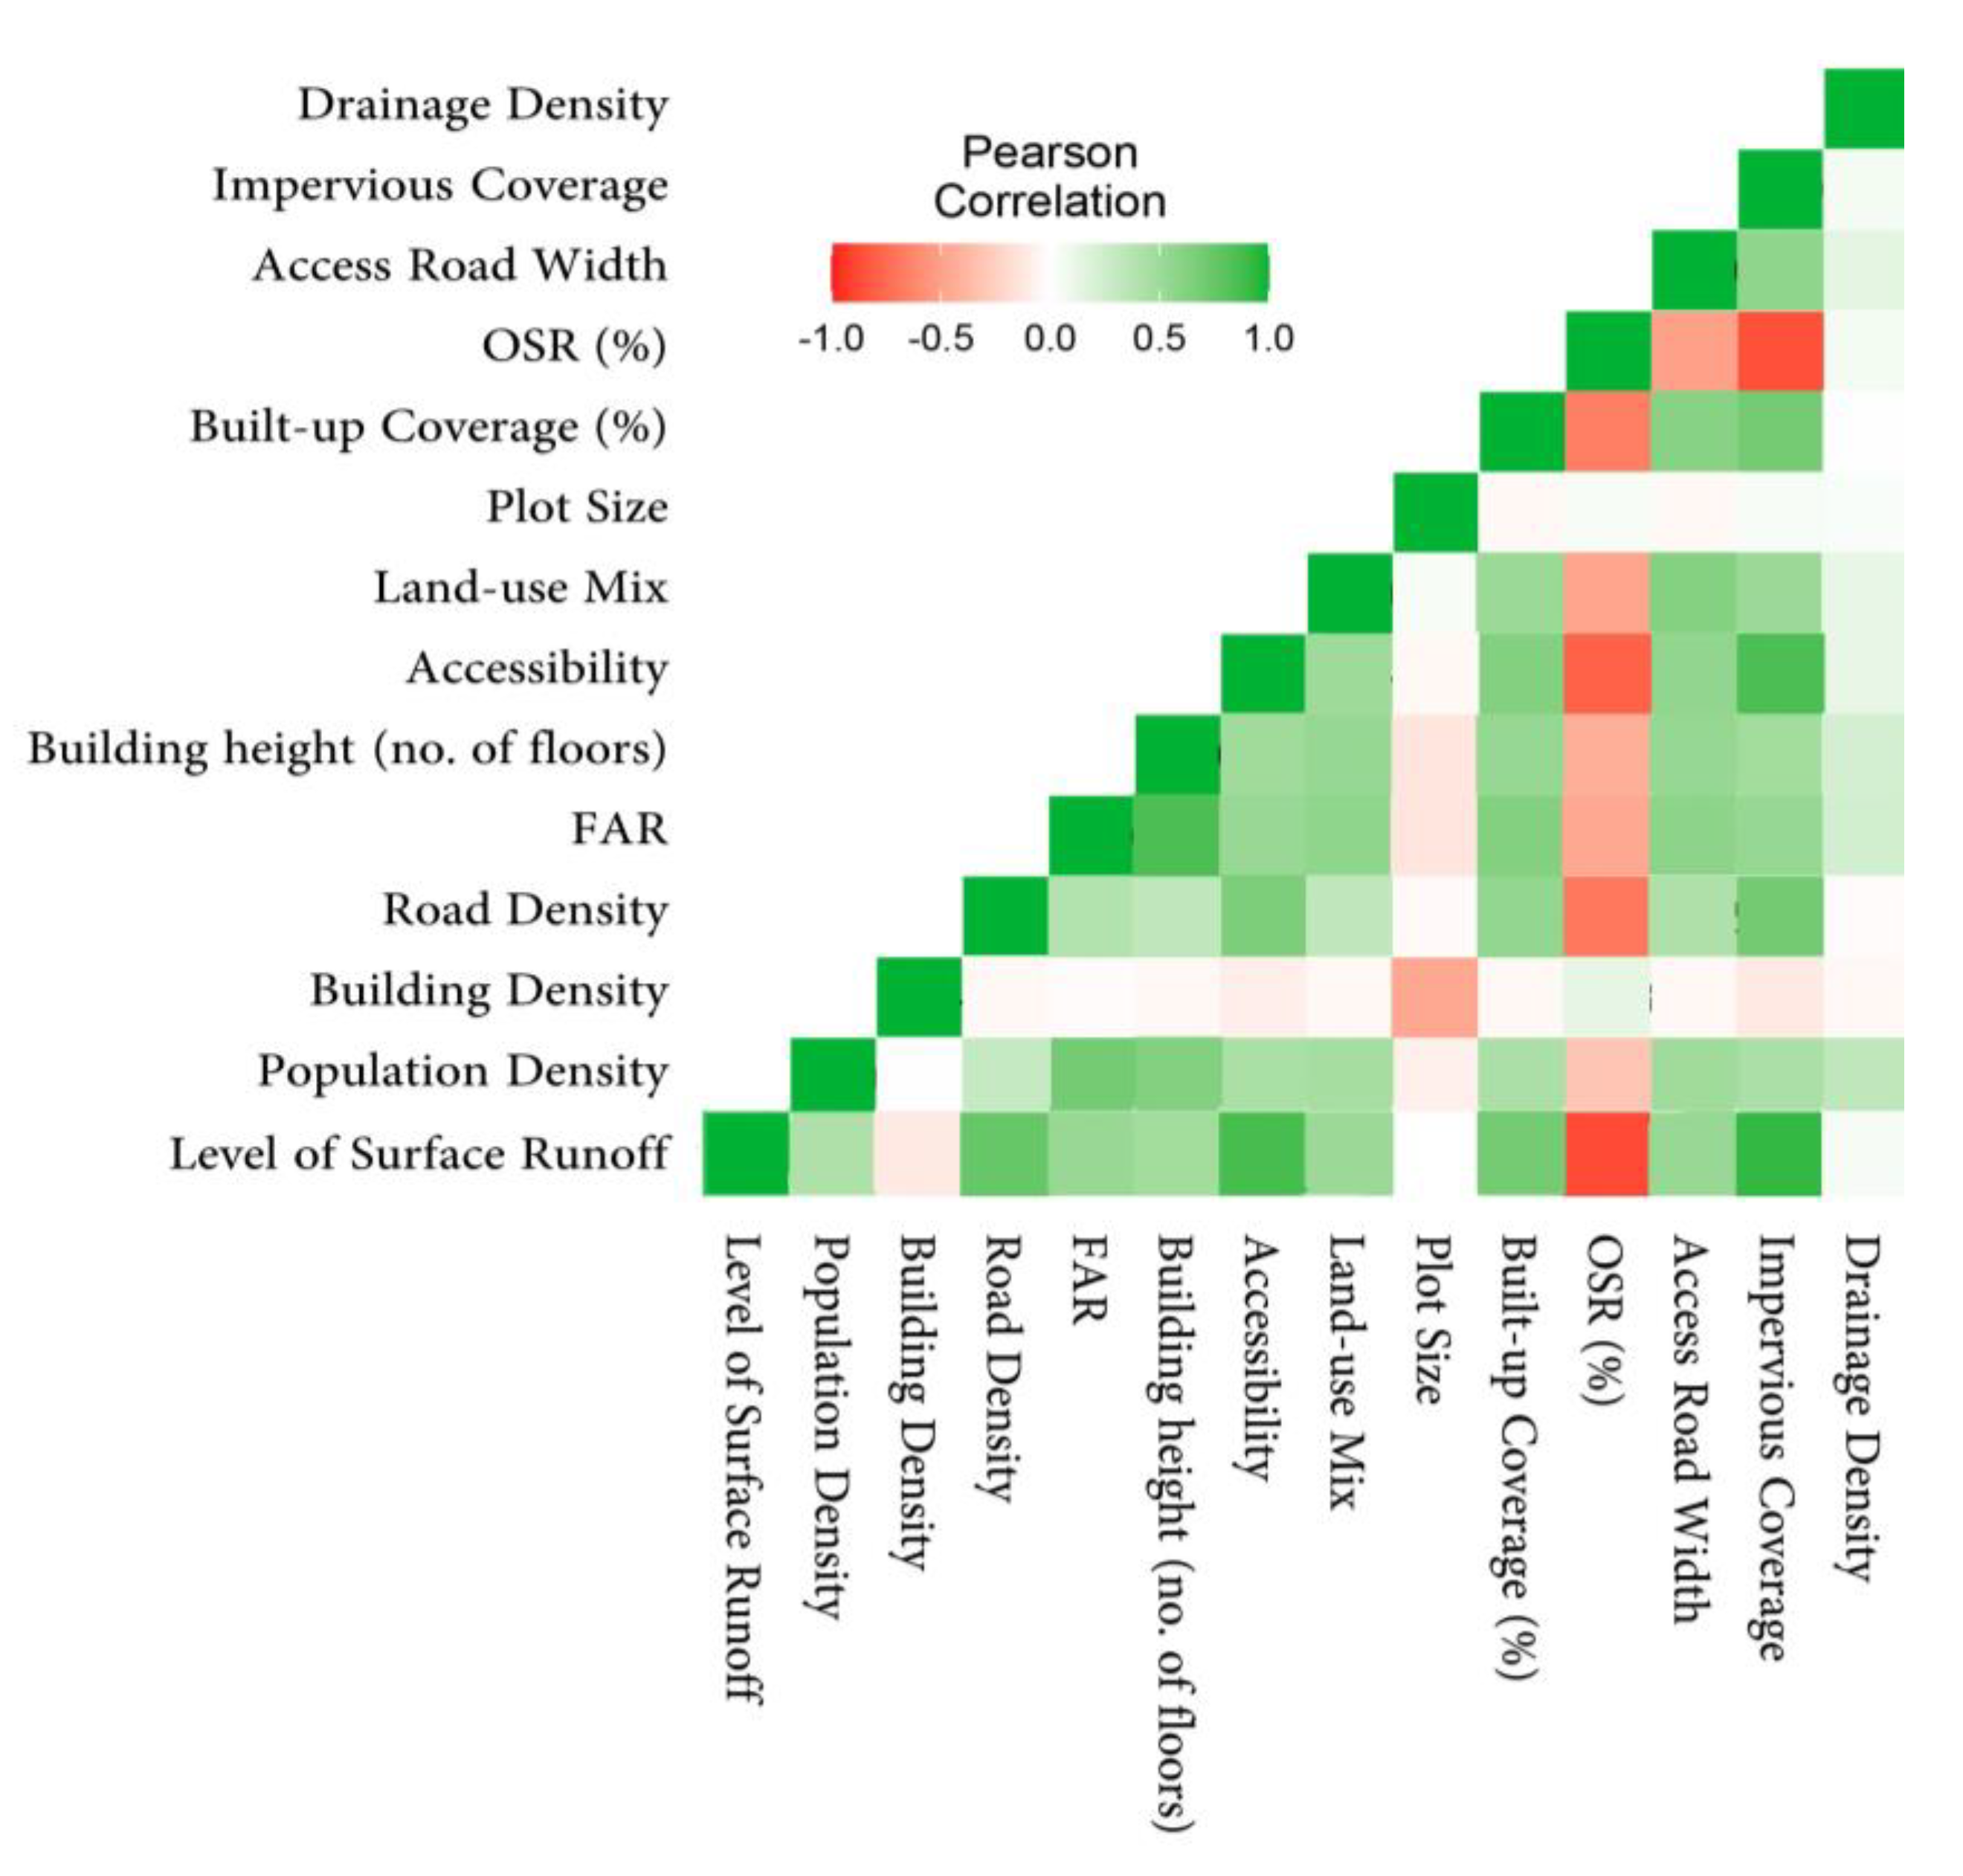
The correlation analysis was carried out to identify how each independent urban form proxy affects SR in urban catchment areas. As per the results of correlation analysis, impervious coverage has a strong positive correlation as R2 = 0.92 and the open space ratio (OSR) has a strong negative correlation R2 = (−0.846). Accessibility and road density also have strong correlations with the level of SR, as R2 = 0.873 and R2 = 0.745, respectively. Those factors (i.e., OSR, impervious coverage, accessibility, road density, and FAR) go hand in hand in an urban environment and these are the most influencing factors in increasing urban floods. Due to anthropogenic developments, the number of open spaces is converted to built-up areas then the infiltration rate is significantly reduced with impervious coverage. As a result of a high-intensity rainfall event, the urban areas are quickly inundated. Furthermore, the type of FAR, land use mix, built-up coverage, and access road width also moderately correlated with SR having a moderately strong correlation (±6.00 > r ± 7.99 <) (p < 0.01). The correlation matrix is shown in Figure 7 and it indicates the Pearson correlation between each density-based proxy in the 3Ds (i.e., proxies of density, diversity, and design).
3.2. Decision Tree Analysis
Decision tree analysis was carried out to measure the prediction probability and the level of accuracy of the pre-developed theoretical framework. Decision trees are machine learning approaches that discover the connections between predictors and target variable connections. In other words, depending on the frequencies of predictor variables, they assign a dataset to one of the specified classes [69]. The “Waikato Environment for Knowledge Analysis” (WEKA) application was used to perform a decision tree analysis to determine the potential flows of variables that could occur at various surface runoff levels. One of the common classification methods, the J48 Classifier, was utilized. It produced a decision tree that was created using C4.5 (an extension of ID3).
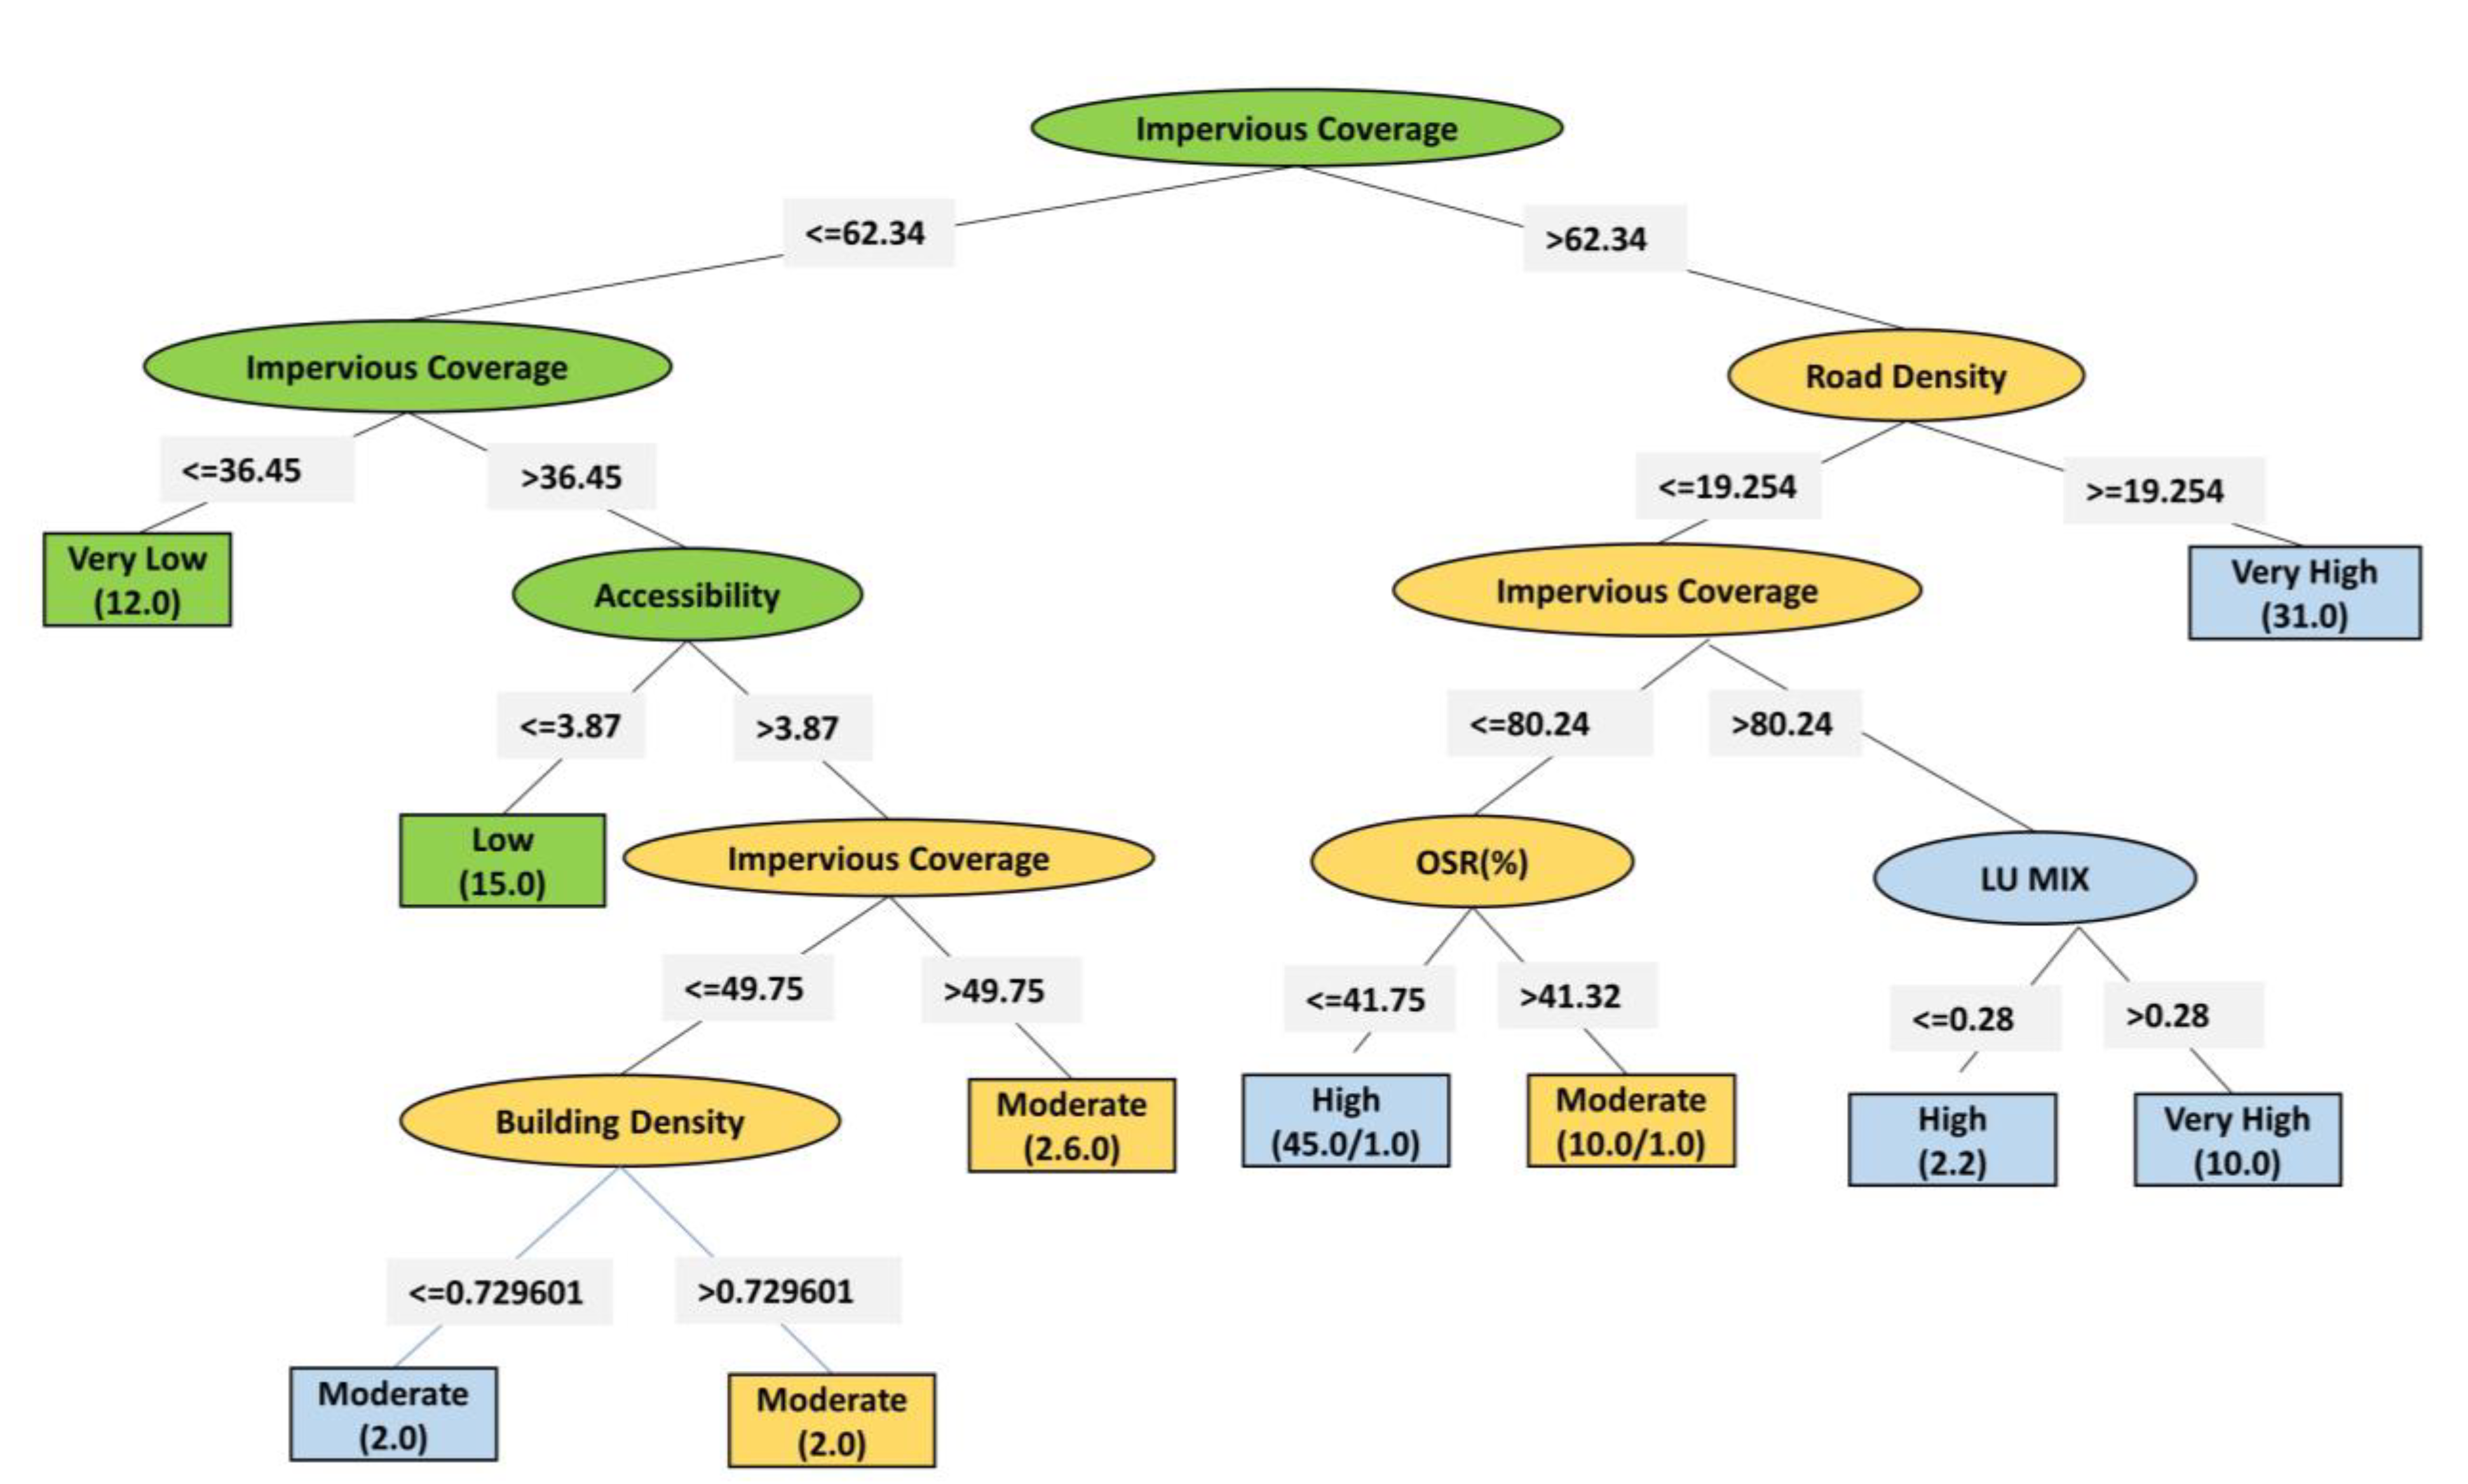
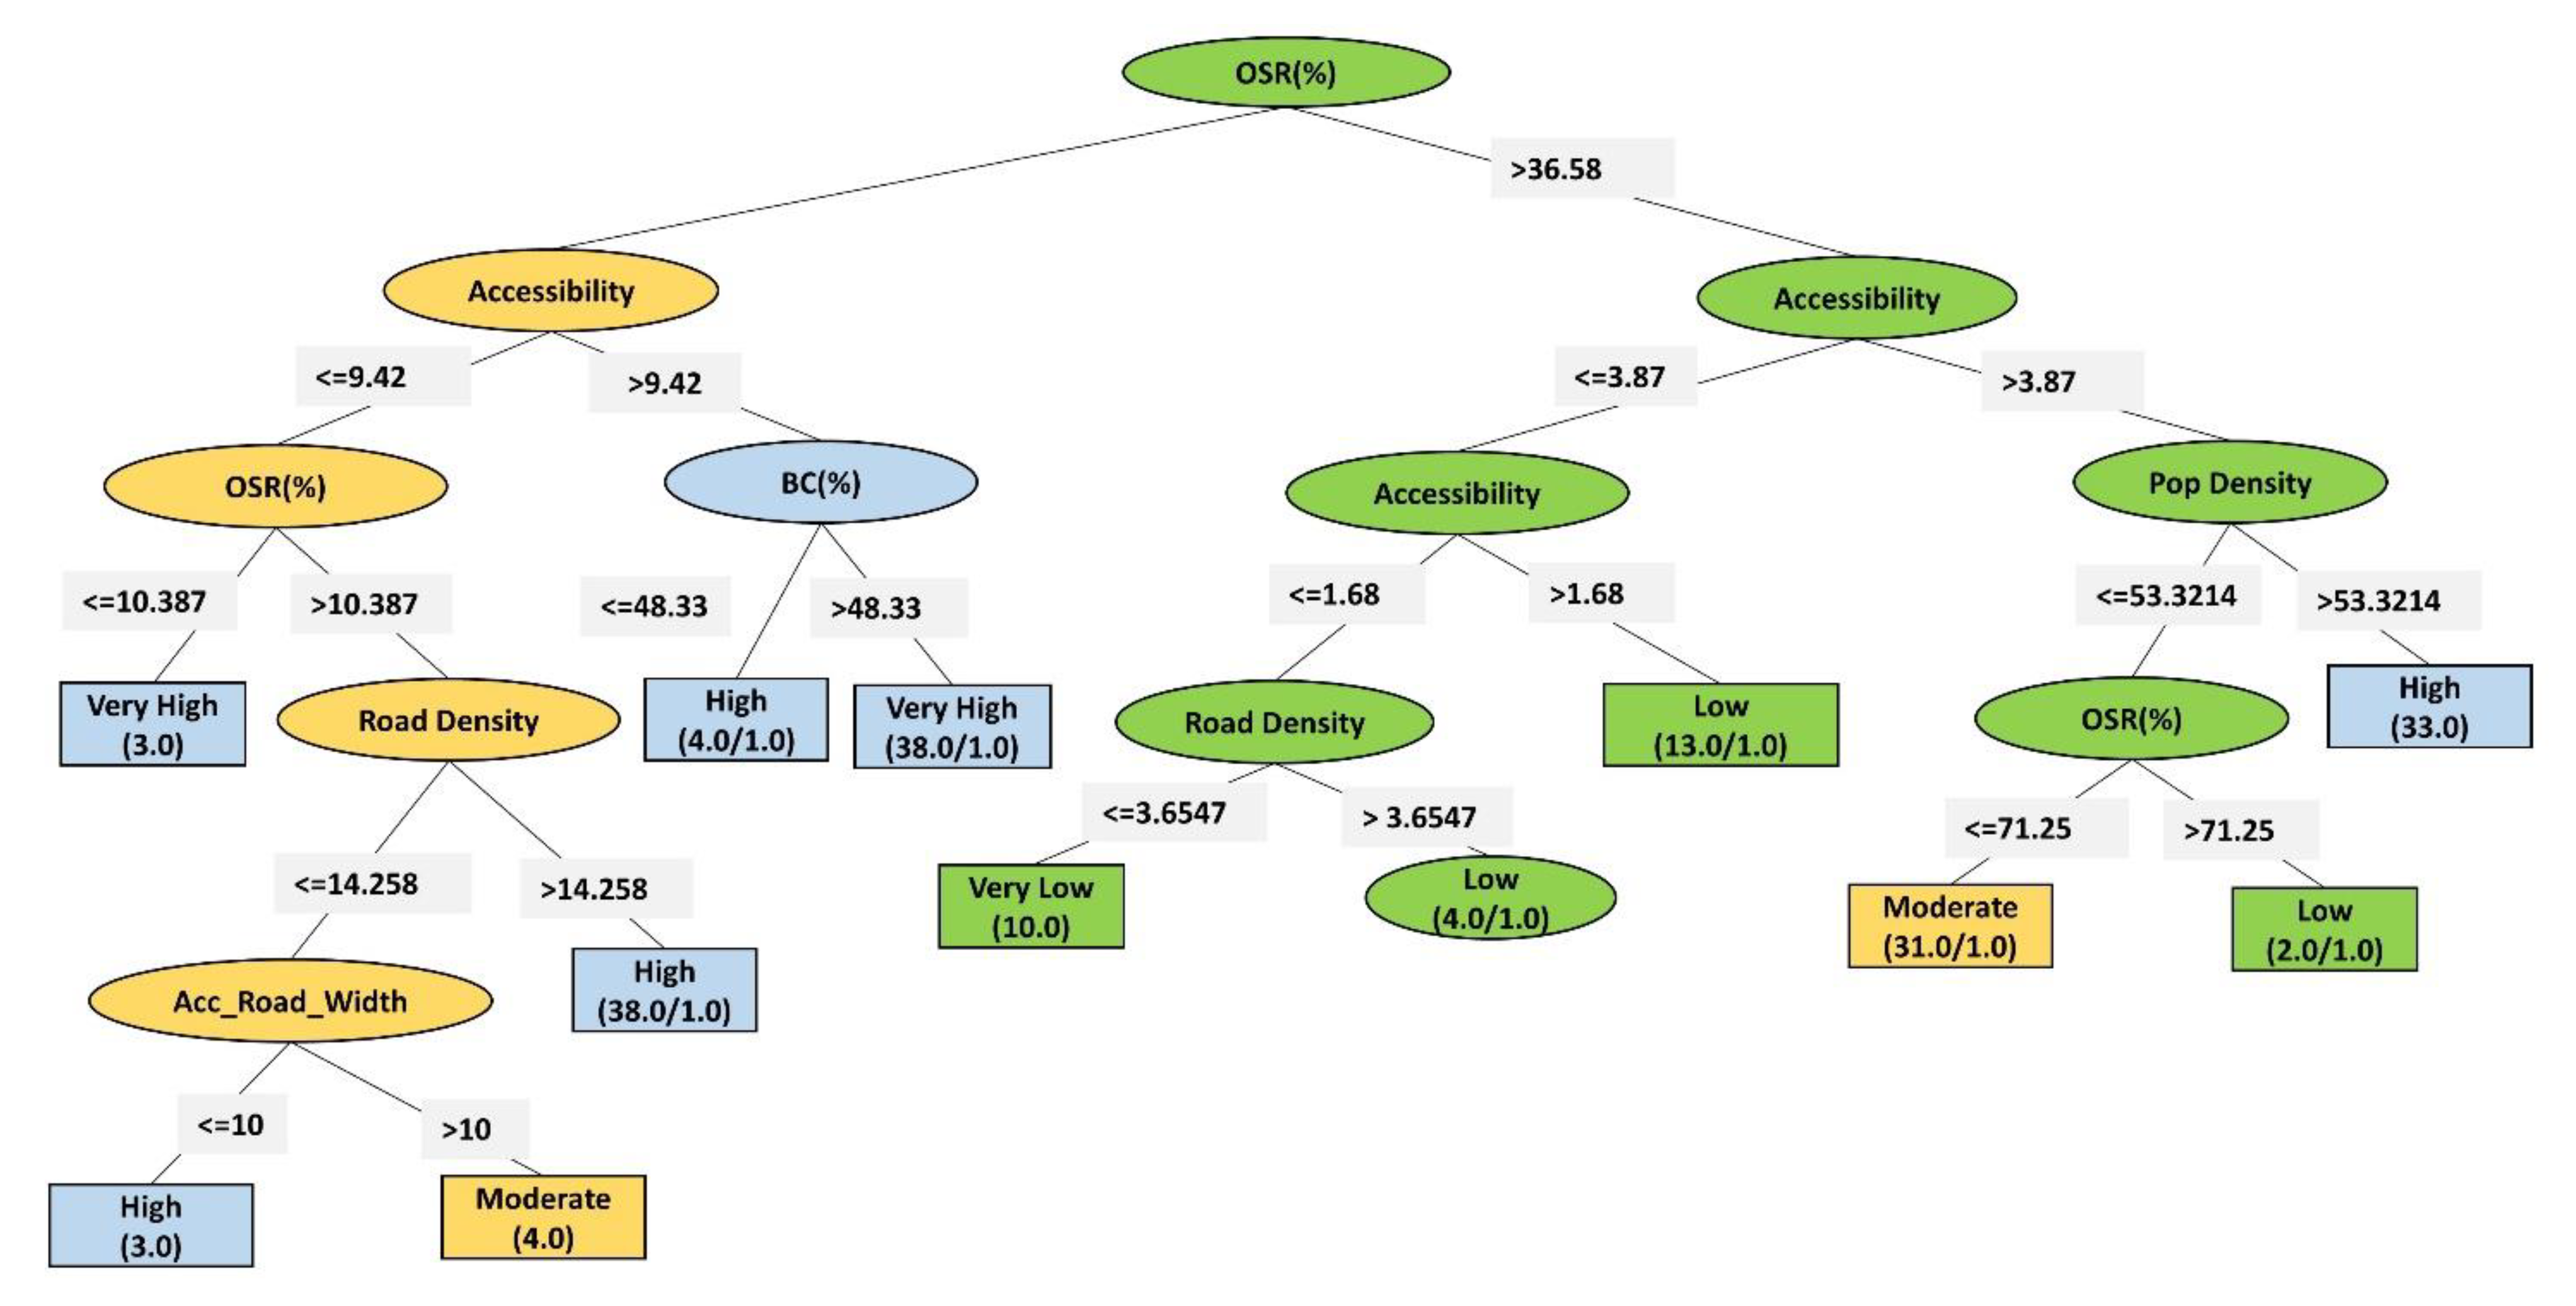
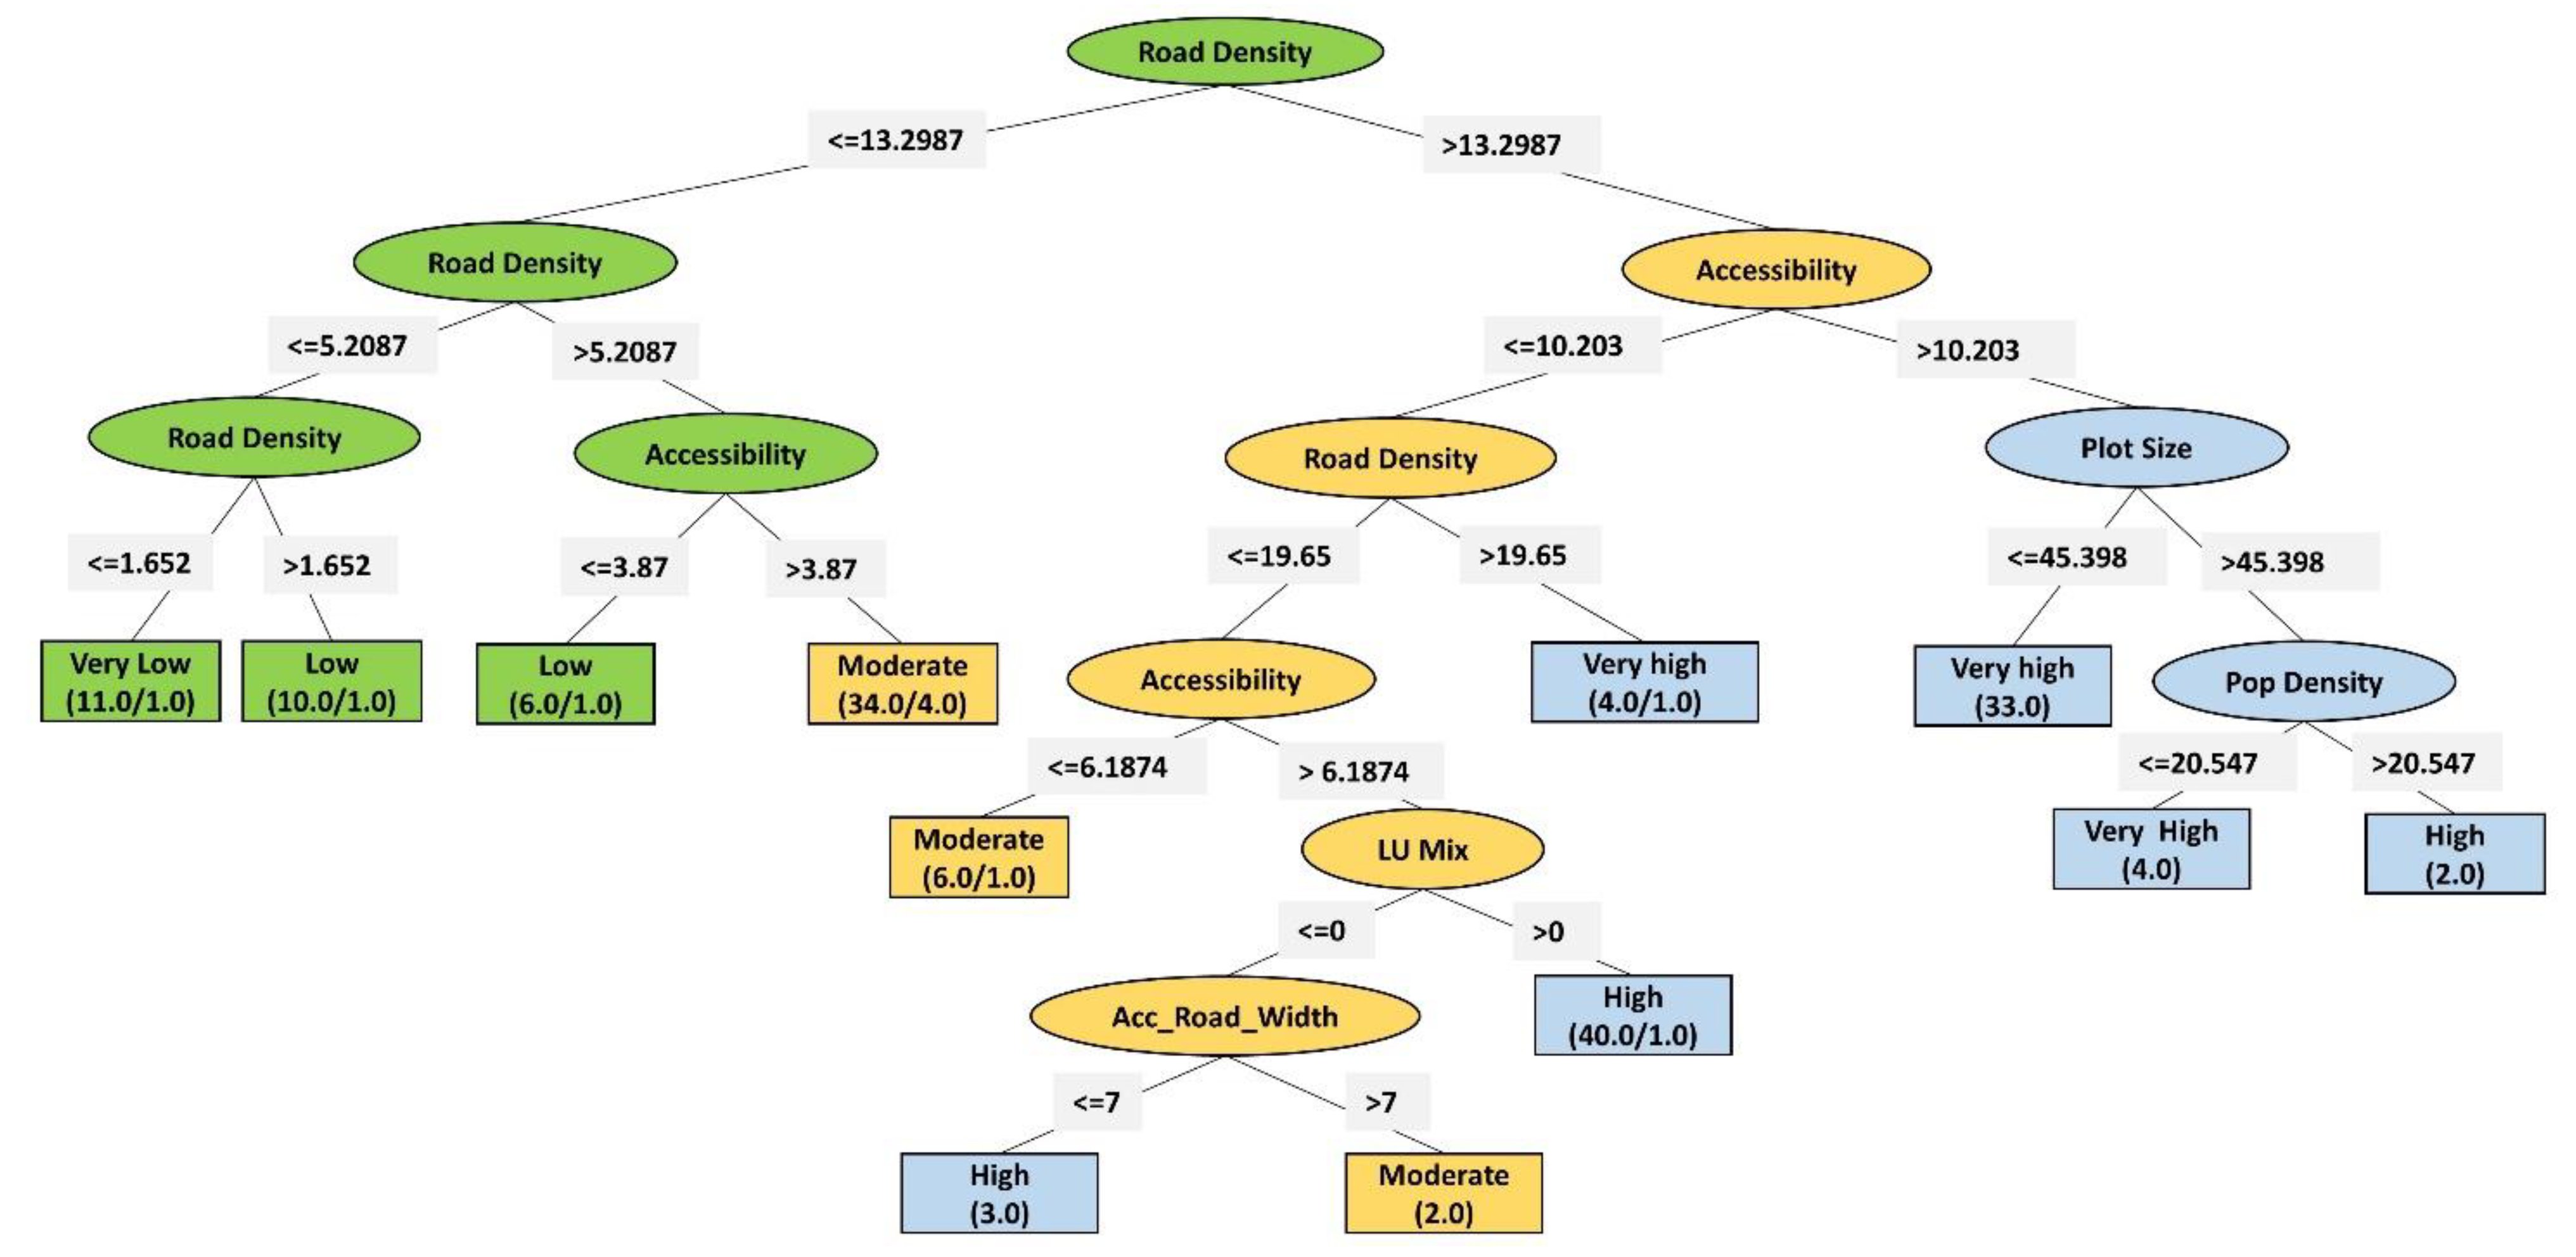
The viewer can see the decision tree using the Classification Table. By deleting the attributes that are not necessary and restarting the classification process, tree trimming can be conducted from the pre-process tab of the decision tree [69]. The model prediction accuracy is calculated utilizing the set of parameters (i.e., correctly classified instances, incorrectly classified instances, kappa statistic, mean absolute error, relative absolute error, root relative squared error). Three models were developed to make possible options to reduce the level of SR. As per the analysis, the output target is to make the level of SR low or very low. If the urban catchment has high or very high runoff generation that level can be reduced up to a moderate level (refer to Figure 8, Figure 9 and Figure 10). Table 8 indicates the summary of accuracy in each derived model.
As an example, the model output illustrates how surface runoff was able to be reduced under each urban scenario. Three possible model options in the decision tree analysis to make the level of runoff under five grades (i.e., very low, low, moderate, high, and very high) by considering independent density variables were simulated. Among 13 independent density-determining variables the model selected three key variables to reduce the level of runoff in urban catchment areas: impervious coverage, open space ratio (OSR), and road density. Under those key variables the level of accessibility, population density, access road width, land use mix, built-up coverage (BC), and average plot size play a significant role to change the level of SR in urban catchment areas. In Figure 8, Figure 9 and Figure 10, green indicates the most preferred regions to reduce the level of SR in complex urban catchment areas. The yellow indicates the feasible areas to reduce runoff level to moderate. Hence, those variables under the urban planning practices should be considered the minimum required values to make cities resilient to flooding. This provides a decision-making and guidance tool for designing future resilient cities or for managing existing urban areas by adjusting different density-based proxies.
3.3. Field Verification of the Simulated Results
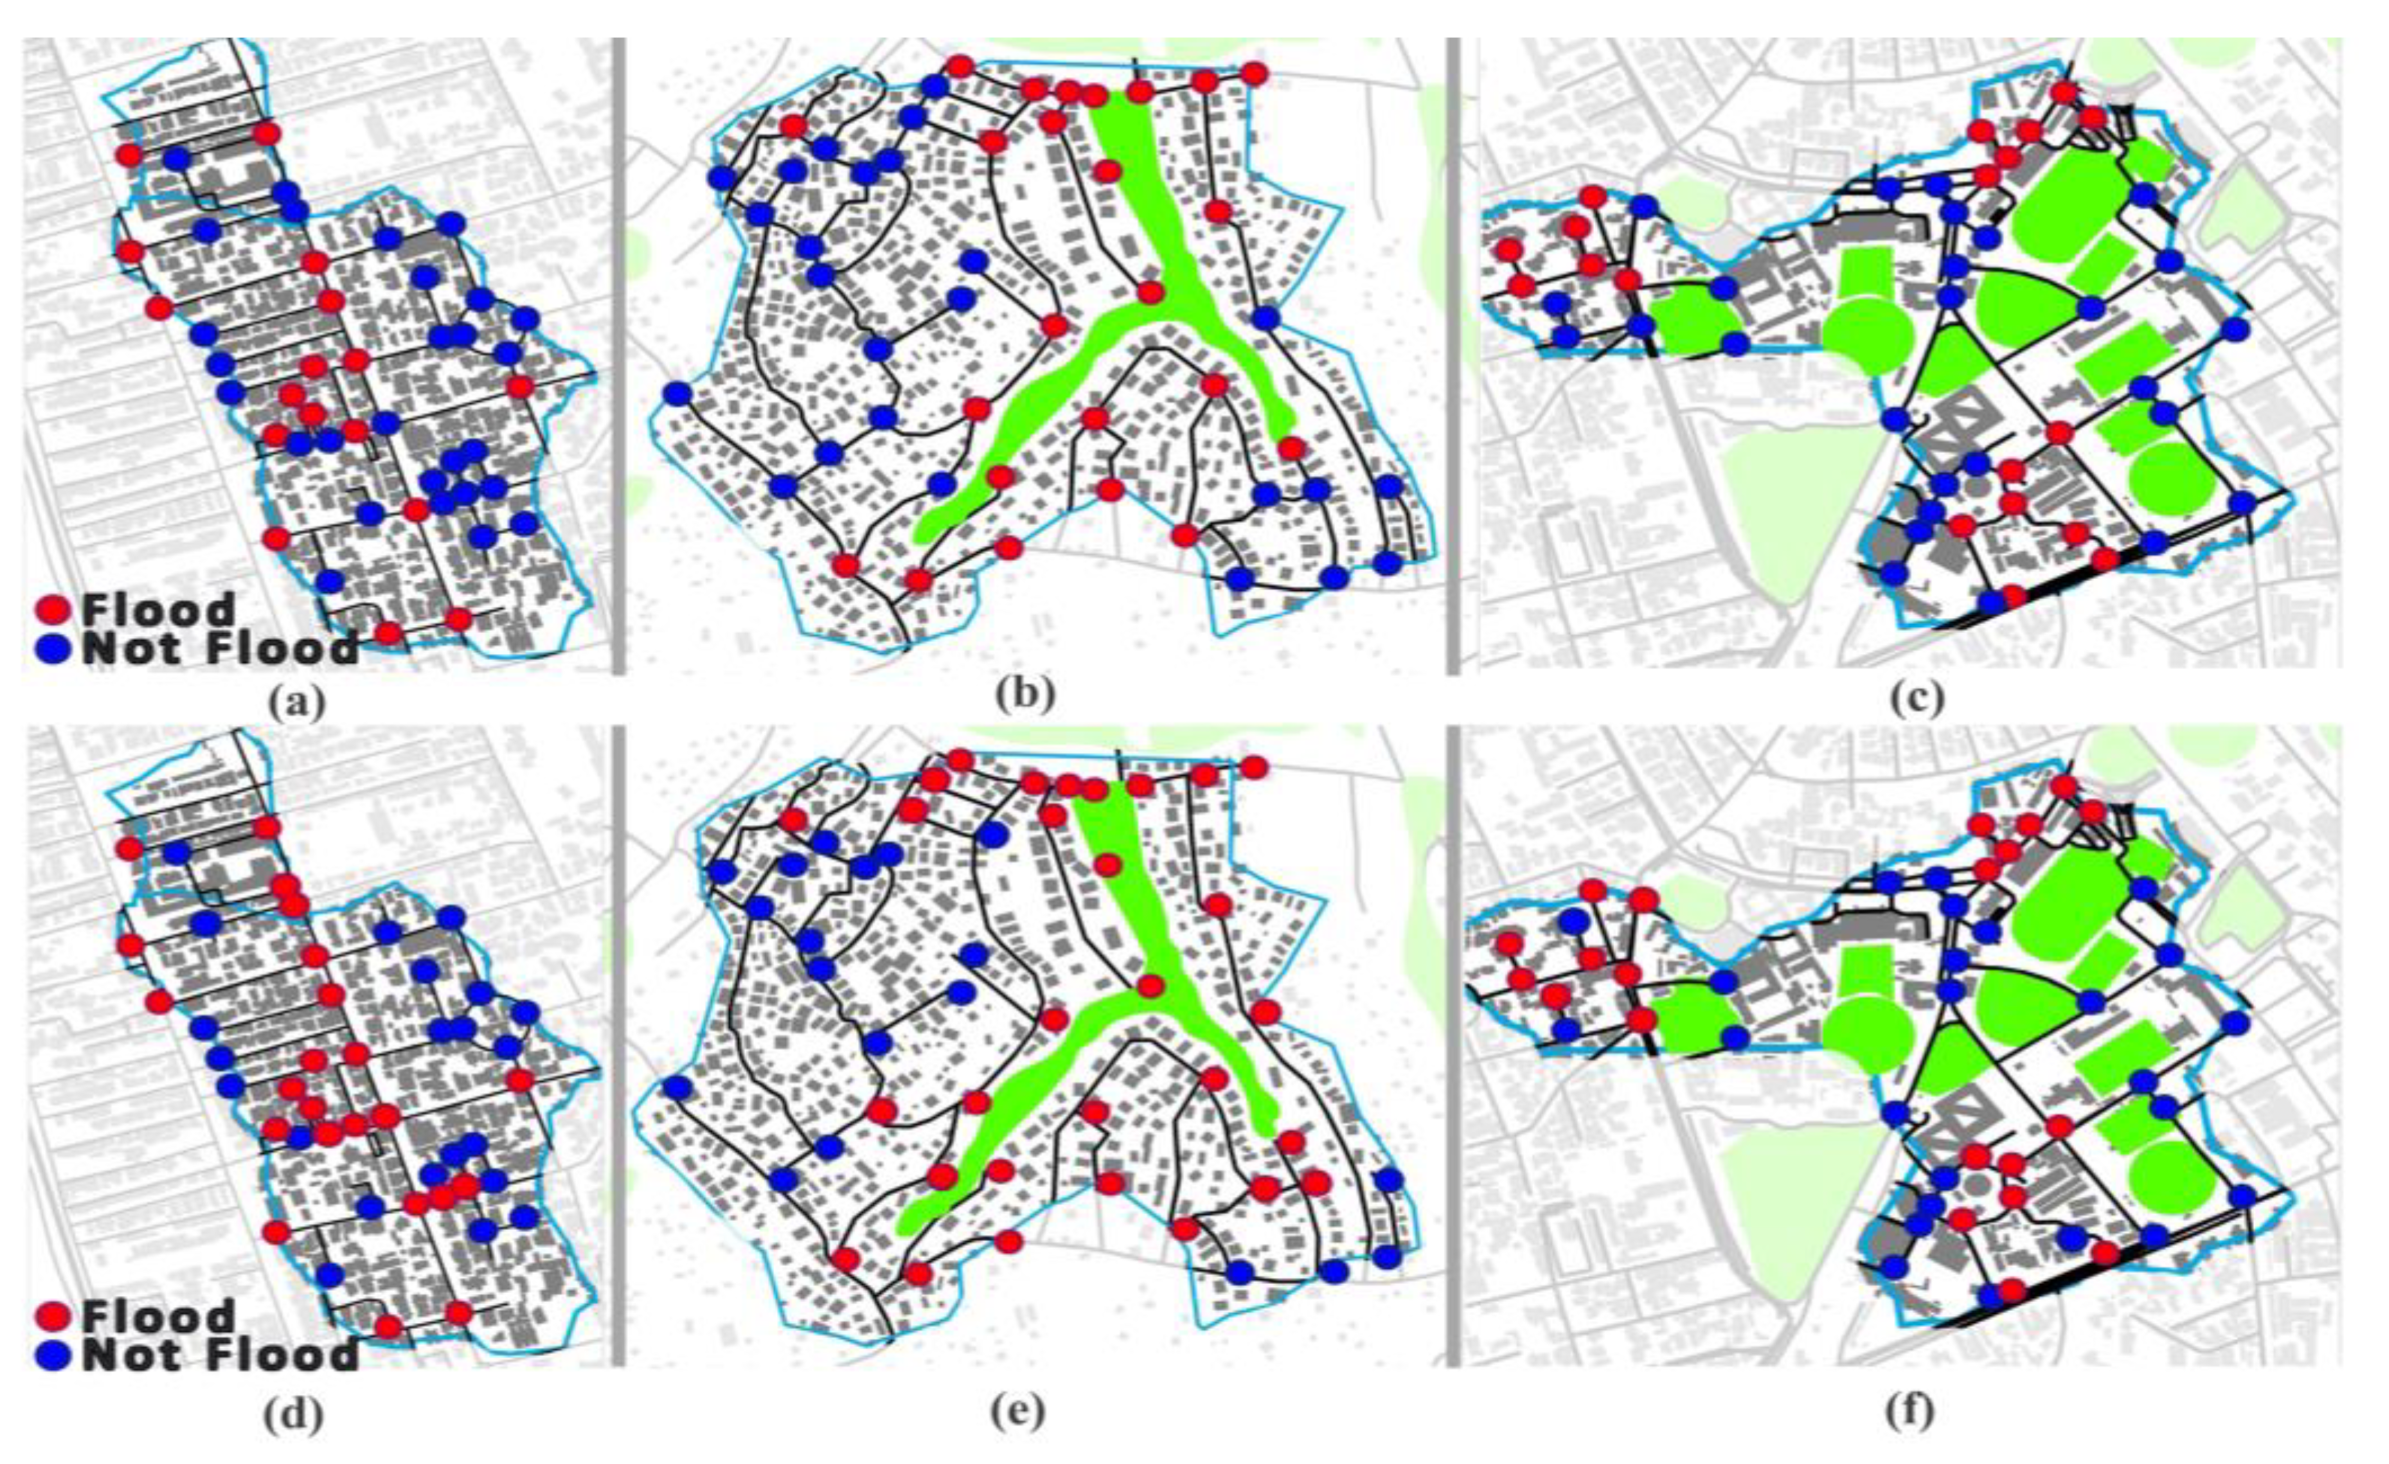
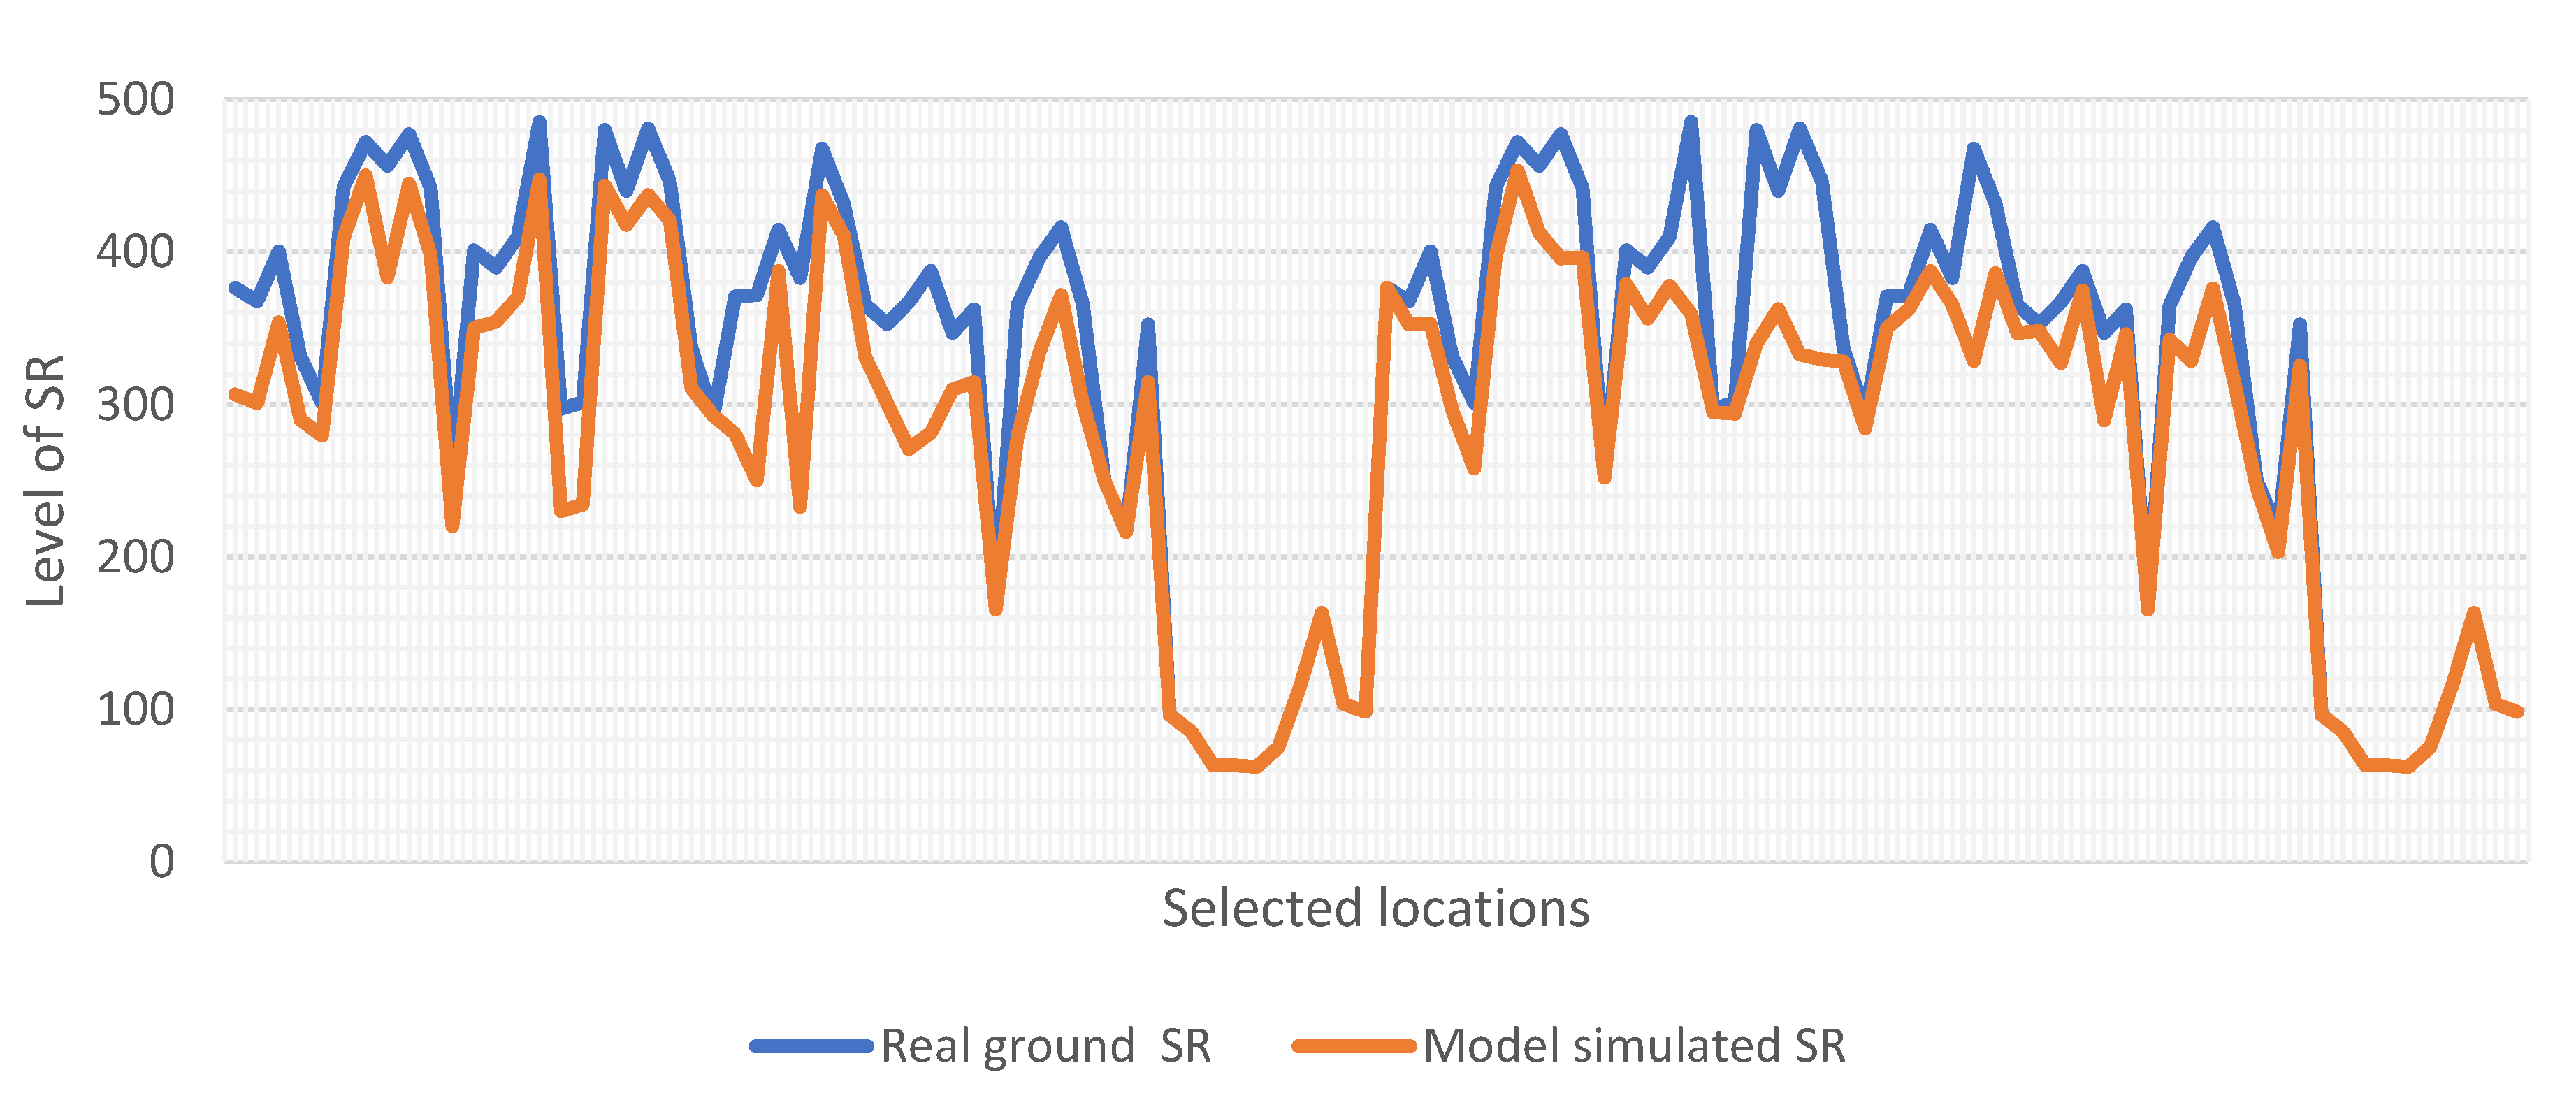
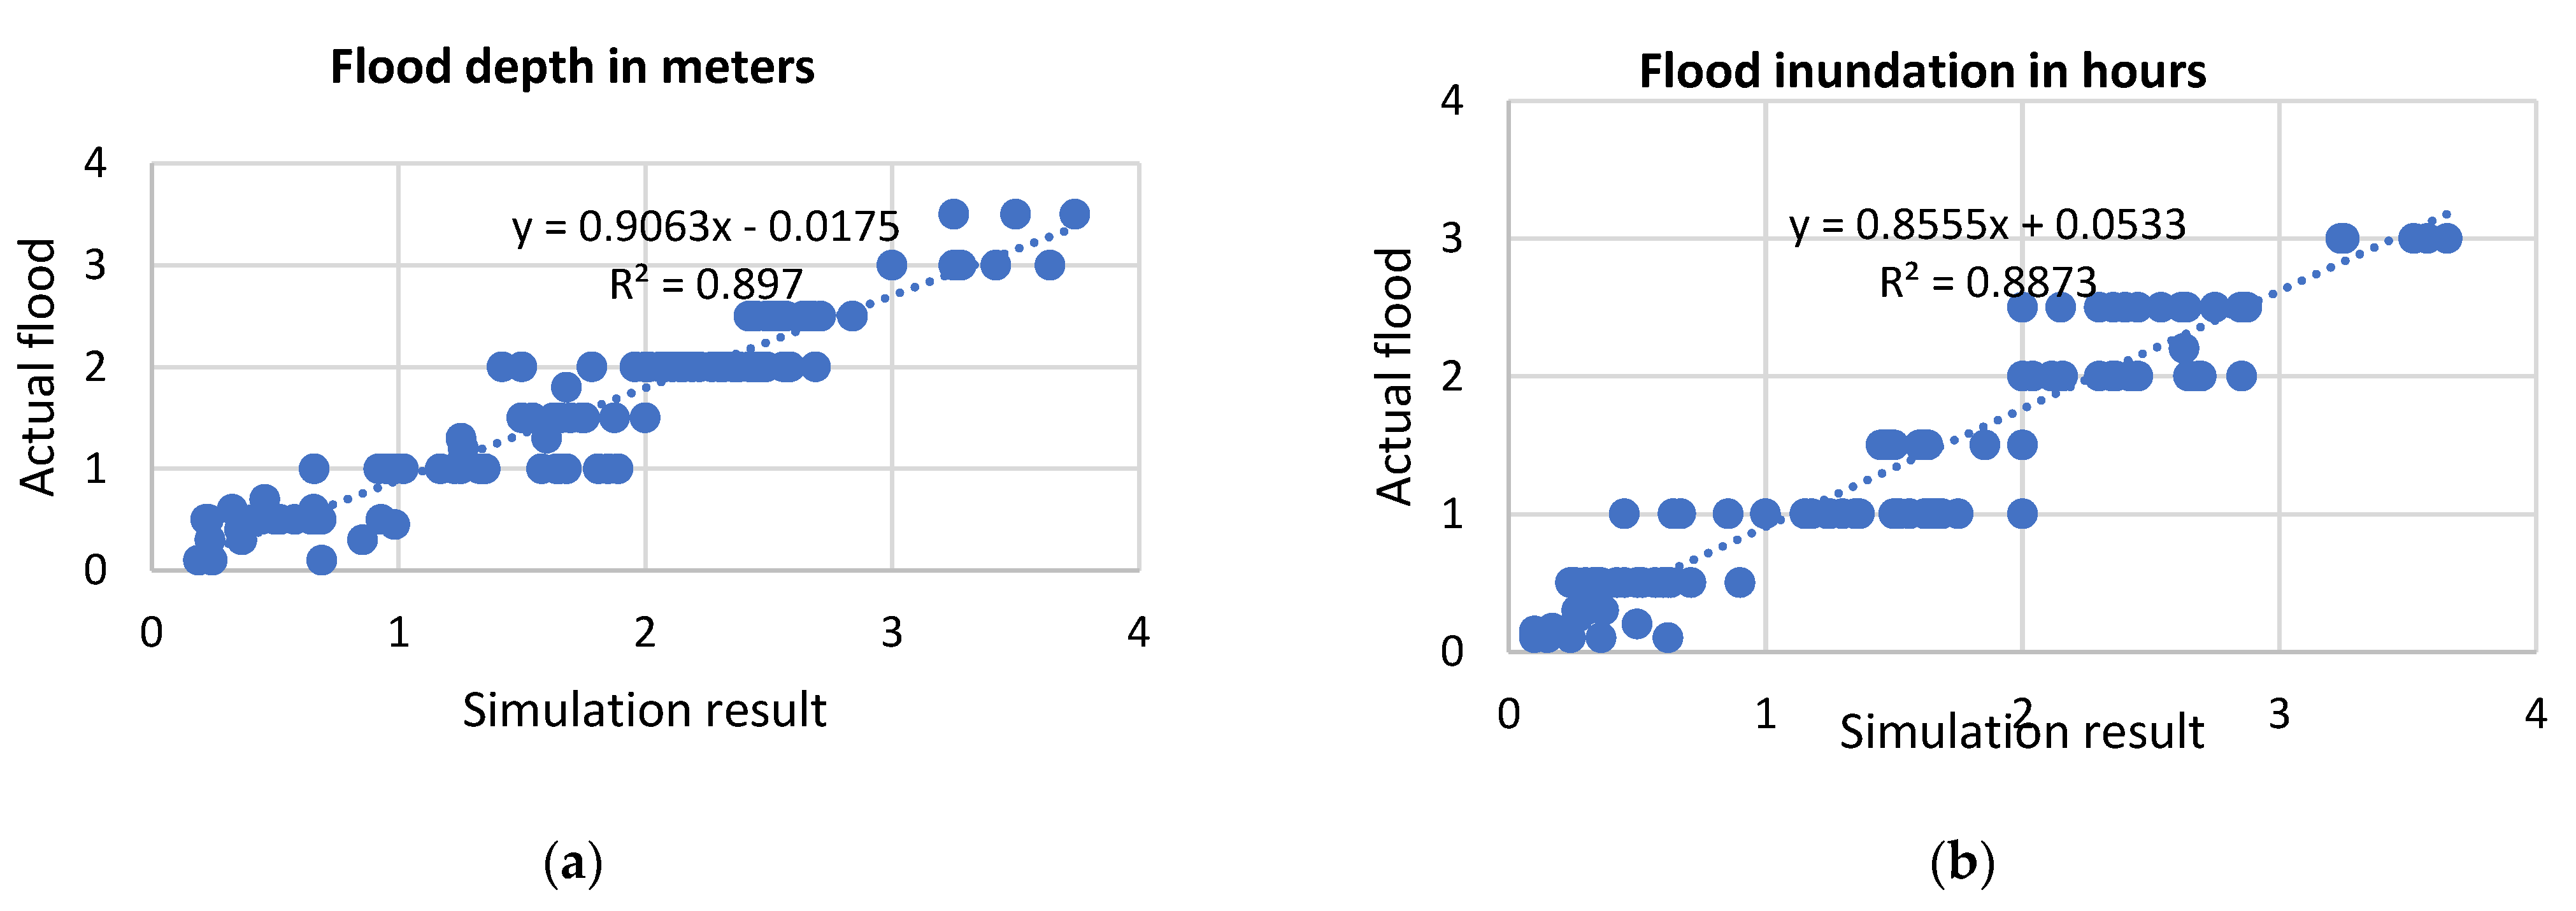
Finally, the results generated from the model were verified with real ground flood data (i.e., flood depth and flood inundation duration). In order to verify the prediction capability of the model that is based on GIS and SWMM platforms, this study carried out a comparative analysis of selected three case study locations in the Colombo Metropolitan Area of Sri Lanka with past flood occurrence data vs. simulated data. A total of 140 nodes were considered for accuracy testing. More than 88% (R2 > 0.88) of the regions where the model predicted floods actually experienced ground flooding, as shown in Figure 11. The upper three images indicate actual flood conditions, and the latter three images indicate the model-generated flood result. The model has established a satisfactory accuracy level with ground flood sites and non-flood locations based on the aforementioned data set. The comparative result of the real ground flood and model results in three different case study areas is indicated in Figure 12 and Figure 13. As a result, practitioners including disaster managers, planners, developers, engineers, and government and non-government entities can utilize this approach to reasonably accurately envision regions that may experience flooding in the future or present.
4. Discussion
The findings of this study indicate that urban form density has a considerable capability to manage surface runoff in an urban watershed as a standalone factor. Based on random occurrences, the decision tree generates models that resemble how trees offer different outcomes. This is conducted by examining the pattern of past occurrences impacted by various variables. Regression problems include, for instance, models that attempt to forecast actual importance for future predictions. Density classification has more than 90.00% model accuracy in predicting urban form densities, in the case of all 13 independent density parameters. Further, the model generated results that correspond to the real ground verifications of the simulated values. Hence it is promising that the planned interventions on urban density can be utilized to make urban areas resilient to flooding.
The developed evaluation framework on the level of surface runoff under distinct urban form densities has universal applicability to make cities resilient to urban flooding upon localization. The finding of this study reveals that the influence of all three types of density (3Ds) measuring proxies is important to managing SR the density-based parameters such as impervious coverage, OSR, and road density are the key factors incorporated with the level of accessibility, population density, and built-up coverage to determine surface runoff in the urban catchment. The finding of the study incorporates previous studies as urban design-based density factors have the highest significance on reducing surface runoff via urban design elements (i.e., urban water management strategies, low impact developments, BMP- Best Management Practices, etc.) [46,70]. The proxies of urban density also can be utilized to successfully manage the SR in urban catchments using sub-density parameters such as plot size, land use mix, and access road width [14].
Previous studies have identified the difference in urban morphological elements on the level of SR [26,40,41], but this study developed a quantitative evaluation mechanism of physical urban density as a standalone factor which helps elucidate the impact of density in a case-specific manner. The built-form density that incorporates natural factors has the highest impact on changing surface runoff in urban catchments as per the results revealed. The novelty of this study is that it contributes a holistic spatial framework to measure the built-form density by categorizing three density areas (i.e., 3Ds: density, diversity, and design) which can be applied to any urban context in the world. Hence, this application supports the decision-making processes in the field of urban flood management and planning practices.
5. Conclusions
This study has contributed with a qualitative technological-based framework to pre-evaluate disaster risk assessment by consolidating urban form densities with a set of dynamic parameters. It has the ability to compute and simulate a range of parameters within a user-friendly environment, and the ability to visualize it geospatially with different intensity levels numerically. Hence, this approach is capable of catering to the spatial change needs of land use policy planning and decision-makers. The usability of this framework can be further improved by incorporating existing policy regulations with expert opinion surveys in future research. Furthermore, this approach is only verified at the micro watershed scale and may be developed to manage at the macro watershed scale by changing density parameters for large catchment areas as future work. Nevertheless, more case studies (i.e., different land uses, different terrain conditions, different urban density management strategies, etc.) must be carried out to increase the accuracy level of this application. Therefore, such research may be very helpful to those who plan for land use, formulate policies and decisions, and work with implementing agencies. In conclusion, the research’s findings can continue to be a valuable resource for stakeholder groups who are engaged in flood-related catastrophe management and control.
As itemized earlier, rapid urbanization and expansion of built-up area density have weakened the natural defense mechanisms increasing the probability of urban flooding. Empirical evidence revealed that disaster-resilient development is needed to be focused on supplementing the flood-resilient ecosystem services. This has become a critical challenge for decisionmakers partly due to the limited availability and validity of accurate methods to predict future and existing flood situations with urban expansion scenarios. Accordingly, the proposed spatial simulation approach suggested in this study has the ability to capture the thresholds of built-form density variations, as well as the desirable dynamics of land use changes and infrastructure supply which can be utilized for future development plans as an application of free and open source. In order to strengthen such efforts, this research has attempted to develop a theory-based simulation framework with the existing built-up scenarios and verified the accuracy of the simulated outcome.
Author Contributions
Conceptualization, N.W. and. C.A.; methodology, N.W. and N.D.; software, N.W. and A.J.; validation, C.A. and N.W.; formal analysis, N.W.; investigation, N.W.; resources, C.A.; data curation, N.W.; writing—original draft preparation, N.W.; writing—review and editing, C.A. and A.J.; visualization, N.W.; supervision, C.A. and A.J.; project administration, C.A.; funding acquisition, C.A. All authors have read and agreed to the published version of the manuscript.
Funding
This research received no external funding.
Institutional Review Board Statement
Not applicable.
Informed Consent Statement
Not applicable.
Data Availability Statement
Data sharing not applicable.
Conflicts of Interest
The authors declare no conflict of interest.
References
- Zevenbergen, C.; Cashman, A.; Evelpidou, N.; Pasche, E.; Garvin, S.; Ashley, R. Urban Flood Management, 1st ed.; CRC Press: London, UK, 2010. [Google Scholar]
- World Bank. Land Use Planning for Urban Flood Risk Management; World Bank: Washington, DC, USA, 2017. [Google Scholar]
- United Nations Office for Disaster Risk Reduction. Human Cost of Disasters an Overview of the Last 20 Years 2000–2019; United Nations: New York, NY, USA, 2020. [Google Scholar]
- United Nations; Department of Economic and Social Affairs; Population Division. World Urbanization Prospects: The 2018 Revision; 2019. Available online: https://www.un.org/development/desa/publications/2018-revision-of-world-urbanization-prospects.html (accessed on 1 December 2022).
- Feng, B.; Zhang, Y.; Bourke, R. Urbanization impacts on flood risks based on urban growth data and coupled flood models. Nat. Hazards 2021, 106, 613–627. [Google Scholar] [CrossRef]
- Kang, S.; Yeom, J.; Jung, J. Urban Form and Natural Hazards: Exploring the Dual Aspect Concept of Urban Forms on Flood Damage. Sustainability 2021, 13, 9007. [Google Scholar] [CrossRef]
- Ferrari, A.; Viero, D.P. Floodwater pathways in urban areas: A method to compute porosity fields for anisotropic subgrid models in differential form. J. Hydrol. 2020, 589, 125193. [Google Scholar] [CrossRef]
- Alexander, E.R. Density measures: A review and analysis. J. Archit. Plan. Res. 1993, 10, 181–202. [Google Scholar]
- Nguyen, T.T.; Ngo, H.H.; Guo, W.; Wang, X.C.; Ren, N.; Li, G.; Ding, J.; Liang, H. Implementation of a specific urban water management—Sponge City. Sci. Total Environ. 2019, 652, 147–162. [Google Scholar] [CrossRef]
- Wang, M.; Shao, Y.; Jiang, Q.; Xiao, L.; Yan, H.; Gao, X.; Wang, L.; Liu, P. Impacts of Climate Change and Human Activity on the Runoff Changes in the Guishui River Basin. Land 2020, 9, 291. [Google Scholar] [CrossRef]
- Hoyer, J. (Ed.) Water Sensitive Urban Design: Principles and Inspiration for Sustainable Stormwater Management in the City of the Future. Berlin: Jovis-Verl. 2011. Available online: https://www.hcu-hamburg.de/fileadmin/documents/Research/Forschungsgruppen/REAP/WD_Publikationen/Hoyer_Dickhaut_Kronawitter_Weber_Manual_WSUD_2011.pdf (accessed on 1 December 2022).
- Park, K.; Lee, M.-H. The Development and Application of the Urban Flood Risk Assessment Model for Reflecting upon Urban Planning Elements. Water 2019, 11, 920. [Google Scholar] [CrossRef] [Green Version]
- Madusanka, S.; Abenayake, C.; Jayasinghe, A.; Perera, C. A Decision-Making Tool for Urban Planners: A Framework to Model the Interdependency among Land Use, Accessibility, Density, and Surface Runoff in Urban Areas. Sustainability 2022, 14, 522. [Google Scholar] [CrossRef]
- Sharifi, A. Urban form resilience: A meso-scale analysis. Cities 2019, 93, 238–252. [Google Scholar] [CrossRef]
- Owusu-Ansah, J.K. The influences of land use and sanitation infrastructure on flooding in Kumasi, Ghana. GeoJournal 2016, 81, 555–570. [Google Scholar] [CrossRef]
- Kumar, M.; Sharif, M.; Ahmed, S. Impact of urbanization on the river Yamuna basin. Int. J. River Basin Manag. 2020, 18, 461–475. [Google Scholar] [CrossRef]
- Abenayake, C.C.; Wijayawardana, P.N.P.; Jayasinghe, A.B.; Kalpana, L.D.C.H.N.; Dias, N.; Amaratunga, D.; Haigh, R. A GIS-Based Simulation Application to Model Surface Runoff Level in Urban Blocks. FARU J. 2020, 7, 56. [Google Scholar] [CrossRef]
- Li, M.; Wang, Y.; Rosier, J.F.; Verburg, P.H.; van Vliet, J. Global maps of 3D built-up patterns for urban morphological analysis. Int. J. Appl. Earth Obs. Geoinform. 2022, 114, 103048. [Google Scholar] [CrossRef]
- Schubert, J.E.; Sanders, B.F. Building treatments for urban flood inundation models and implications for predictive skill and modeling efficiency. Adv. Water Resour. 2012, 41, 49–64. [Google Scholar] [CrossRef]
- Eini, M.; Kaboli, H.S.; Rashidian, M.; Hedayat, H. Hazard and vulnerability in urban flood risk mapping: Machine learning techniques and considering the role of urban districts. Int. J. Disaster Risk Reduct. 2020, 50, 101687. [Google Scholar] [CrossRef]
- Zhang, H.; Cheng, J.; Wu, Z.; Li, C.; Qin, J.; Liu, T. Effects of Impervious Surface on the Spatial Distribution of Urban Waterlogging Risk Spots at Multiple Scales in Guangzhou, South China. Sustainability 2018, 10, 1589. [Google Scholar] [CrossRef] [Green Version]
- Berghauser Pont, M.; Haupt, P. “Space, Density and Urban Form,” urn:NBN:nl:ui:24-uuid:0e8cdd4d-80d0-4c4c-97dc-dbb9e5eee7c2, Netherlands. 2009. Available online: http://resolver.tudelft.nl/uuid:0e8cdd4d-80d0-4c4c-97dc-dbb9e5eee7c2 (accessed on 1 December 2022).
- Zhao, C.; Weng, Q.; Hersperger, A.M. Characterizing the 3-D urban morphology transformation to understand urban-form dynamics: A case study of Austin, Texas, USA. Landsc. Urban Plan. 2020, 203, 103881. [Google Scholar] [CrossRef]
- Nguyen, H.D.; Fox, D.; Dang, D.K.; Pham, L.T.; Viet Du, Q.V.; Nguyen, T.H.T.; Dang, T.N.; Tran, V.T.; Vu, P.L.; Nguyen, Q.-H.; et al. Predicting Future Urban Flood Risk Using Land Change and Hydraulic Modeling in a River Watershed in the Central Province of Vietnam. Remote Sens. 2021, 13, 262. [Google Scholar] [CrossRef]
- Berling-Wolff, S.; Wu, J. Modeling urban landscape dynamics: A case study in Phoenix, USA. Urban Ecosyst. 2004, 7, 215–240. [Google Scholar] [CrossRef]
- Piyumi, M.M.M.; Abenayake, C.; Jayasinghe, A.; Wijegunarathna, E. Urban Flood Modeling Application: Assess the Effectiveness of Building Regulation in Coping with Urban Flooding Under Precipitation Uncertainty. Sustain. Cities Soc. 2021, 75, 103294. [Google Scholar] [CrossRef]
- Chen, C.; Gong, H.; Paaswell, R. Role of the built environment on mode choice decisions: Additional evidence on the impact of density. Transportation 2008, 35, 285–299. [Google Scholar] [CrossRef]
- Khalaj, M.R.; Noor, H.; Dastranj, A. Investigation and simulation of flood inundation hazard in urban areas in Iran. Geoenvironmental Disasters 2021, 8, 18. [Google Scholar] [CrossRef]
- Waqas, H.; Lu, L.; Tariq, A.; Li, Q.; Baqa, M.F.; Xing, J.; Sajjad, A. Flash Flood Susceptibility Assessment and Zonation Using an Integrating Analytic Hierarchy Process and Frequency Ratio Model for the Chitral District, Khyber Pakhtunkhwa, Pakistan. Water 2021, 13, 1650. [Google Scholar] [CrossRef]
- Lin, J.; He, X.; Lu, S.; Liu, D.; He, P. Investigating the influence of three-dimensional building configuration on urban pluvial flooding using random forest algorithm. Environ. Res. 2021, 196, 110438. [Google Scholar] [CrossRef] [PubMed]
- Liu, Y.; Bates, P.D.; Neal, J.C.; Yamazaki, D. Bare-Earth DEM Generation in Urban Areas for Flood Inundation Simulation Using Global Digital Elevation Models. Water Resour. Res. 2021, 57. [Google Scholar] [CrossRef]
- Abdrabo, K.I.; Kantoush, S.A.; Saber, M.; Sumi, T.; Habiba, O.M.; Elleithy, D.; Elboshy, B. Integrated Methodology for Urban Flood Risk Mapping at the Microscale in Ungauged Regions: A Case Study of Hurghada, Egypt. Remote Sens. 2020, 12, 3548. [Google Scholar] [CrossRef]
- Thoban, M.I.; Hizbaron, D.R. Urban resilience to floods in parts of Makassar, Indonesia. E3S Web Conf. 2020, 200, 01007. [Google Scholar] [CrossRef]
- Ress, L.D.; Hung, C.J.; James, L.A. Impacts of urban drainage systems on stormwater hydrology: Rocky Branch Watershed, Columbia, South Carolina. J. Flood Risk Manag. 2020, 13, e12643. [Google Scholar] [CrossRef]
- Mwangi, P.W.; Karanja, F.N.; Kamau, P.K.; Letema, S.C. Impact of urban forms on 3d built-up intensity expansion rate from aerial stereo-imagery. ISPRS Ann. Photogramm. Remote Sens. Spat. Inf. Sci. 2020, 4, 203–208. [Google Scholar] [CrossRef]
- Papilloud, T.; Röthlisberger, V.; Loreti, S.; Keiler, M. Flood exposure analysis of road infrastructure—Comparison of different methods at national level. Int. J. Disaster Risk Reduct. 2020, 47, 101548. [Google Scholar] [CrossRef]
- Khadiyanto, P.; Soetomo, S.; Hadi, S.P. Violation factors of the building coverage ratio: A study in Trimulyo Genuk, Semarang, Indonesia. IOP Conf. Ser. Earth Environ. Sci. 2020, 490, 012012. [Google Scholar] [CrossRef]
- Ogato, G.S.; Bantider, A.; Abebe, K.; Geneletti, D. Geographic information system (GIS)-Based multicriteria analysis of flooding hazard and risk in Ambo Town and its watershed, West shoa zone, oromia regional State, Ethiopia. J. Hydrol. Reg. Stud. 2020, 27, 100659. [Google Scholar] [CrossRef]
- Chen, J.; Li, Q.; Wang, H.; Deng, M. A Machine Learning Ensemble Approach Based on Random Forest and Radial Basis Function Neural Network for Risk Evaluation of Regional Flood Disaster: A Case Study of the Yangtze River Delta, China. Int. J. Environ. Res. Public. Health 2019, 17, 49. [Google Scholar] [CrossRef] [Green Version]
- Albano, R. Investigation on Roof Segmentation for 3D Building Reconstruction from Aerial LIDAR Point Clouds. Appl. Sci. 2019, 9, 4674. [Google Scholar] [CrossRef] [Green Version]
- Fahy, B.; Brenneman, E.; Chang, H.; Shandas, V. Spatial analysis of urban flooding and extreme heat hazard potential in Portland, OR. Int. J. Disaster Risk Reduct. 2019, 39, 101117. [Google Scholar] [CrossRef]
- Ahmed, S.; Meenar, M.; Alam, A. Designing a Blue-Green Infrastructure (BGI) Network: Toward Water-Sensitive Urban Growth Planning in Dhaka, Bangladesh. Land 2019, 8, 138. [Google Scholar] [CrossRef] [Green Version]
- Caparros-Midwood, D.; Dawson, R.; Barr, S. Low Carbon, Low Risk, Low Density: Resolving choices about sustainable development in cities. Cities 2019, 89, 252–267. [Google Scholar] [CrossRef]
- Afifi, Z.; Chu, H.-J.; Kuo, Y.-L.; Hsu, Y.-C.; Wong, H.-K.; Zeeshan Ali, M. Residential Flood Loss Assessment and Risk Mapping from High-Resolution Simulation. Water 2019, 11, 751. [Google Scholar] [CrossRef] [Green Version]
- Cai, T.; Li, X.; Ding, X.; Wang, J.; Zhan, J. Flood risk assessment based on hydrodynamic model and fuzzy comprehensive evaluation with GIS technique. Int. J. Disaster Risk Reduct. 2019, 35, 101077. [Google Scholar] [CrossRef]
- Peng, Z.; Jinyan, K.; Wenbin, P.; Xin, Z.; Yuanbin, C. Effects of Low-Impact Development on UrbanRainfall Runoff under Different RainfallCharacteristics. Pol. J. Environ. Stud. 2018, 28, 771–783. [Google Scholar] [CrossRef]
- Stetsenko, S.E.; Yastrebova, N.A. The Influence of Urban Planning and Building Factors on the Dustiness of the Urban Environment. IOP Conf. Ser. Mater. Sci. Eng. 2018, 463, 032031. [Google Scholar] [CrossRef]
- Abo-El-Wafa, H.; Yeshitela, K.; Pauleit, S. The use of urban spatial scenario design model as a strategic planning tool for Addis Ababa. Landsc. Urban Plan. 2018, 180, 308–318. [Google Scholar] [CrossRef]
- Kumar, B.; Bhaduri, S. Disaster risk in the urban villages of Delhi. Int. J. Disaster Risk Reduct. 2018, 31, 1309–1325. [Google Scholar] [CrossRef]
- Sitzenfrei, R.; Zischg, J.; Sitzmann, M.; Bach, P. Impact of Hybrid Water Supply on the Centralised Water System. Water 2017, 9, 855. [Google Scholar] [CrossRef] [Green Version]
- Majid, M.R.; Jamaludin, J.A.; Wan Ibrahim, W.Y. Estimation of residential impervious surface using gis technique. Plan. Malays. J. 2013, 11. [Google Scholar] [CrossRef] [Green Version]
- I-soon, R.; Chaweewan, D.; Iamtrakul, P. Evaluation of Storm Surge Map for Safety Improvement in Bangkok Metropolitan Region, Thailand. Lowl. Technol. Int. 2011, 13, 19–26. [Google Scholar]
- Chrysochoou, M.; Brown, K.; Dahal, G.; Granda-Carvajal, C.; Segerson, K.; Garrick, N.; Bagtzoglou, A. A GIS and indexing scheme to screen brownfields for area-wide redevelopment planning. Landsc. Urban Plan. 2012, 105, 187–198. [Google Scholar] [CrossRef]
- Buitelaar, E.; Segeren, A. Urban Structures and Land. The Morphological Effects of Dealing with Property Rights. Hous. Stud. 2011, 26, 661–679. [Google Scholar] [CrossRef]
- Bobkova, E. Towards a Theory of Natural Occupation: Developing Theoretical, Methodolgical and Empirical Support for the Relation between Plot Systems and Urban Processes; Chalmers University of Technology: Gothenburg, Sweden, 2019; ISBN 978-91-7905-196-9. [Google Scholar]
- Marcus, L.; Colding, J. Toward an integrated theory of spatial morphology and resilient urban systems. Ecol. Soc. 2014, 19, 55. [Google Scholar] [CrossRef] [Green Version]
- Ye, Y.; Van Nes, A. Measuring urban maturation processes in Dutch and Chinese new towns: Combining street network configuration with building density and degree of land use diversification through GIS. J. Space Syntax 2013, 4, 18–37. [Google Scholar]
- Grimaldi, S.; Petroselli, A. Do we still need the Rational Formula? An alternative empirical procedure for peak discharge estimation in small and ungauged basins. Hydrol. Sci. J. 2015, 60, 67–77. [Google Scholar] [CrossRef]
- Dempsey, N.; Brown, C.; Raman, S.; Porta, S.; Jenks, M.; Jones, C.; Bramley, G. Elements of Urban Form. In Sustainable City Form; Jenks, M., Jones, C., Eds.; Future City; Springer: Dordrecht, The Netherlands, 2008; Volume 2, pp. 21–51. ISBN 978-1-4020-8646-5. [Google Scholar]
- Churchman, A. Women and the Environment: Questioned and Unquestioned Assumptions. In Theoretical Perspectives in Environment-Behavior Research; Wapner, S., Demick, J., Yamamoto, T., Minami, H., Eds.; Springer: Boston, MA, USA, 2000; pp. 89–106. ISBN 978-1-4613-7129-8. [Google Scholar]
- Cervero, R.; Kockelman, K. Travel demand and the 3Ds: Density, diversity, and design. Transp. Res. Part Transp. Environ. 1997, Volume 2(no. 3), 199–219. [Google Scholar] [CrossRef]
- Kim, Y.-A.; Hipp, J.R. Density, diversity, and design: Three measures of the built environment and the spatial patterns of crime in street segments. J. Crim. Justice 2021, 77, 101864. [Google Scholar] [CrossRef]
- Ye, Y.; Yeh, A.; Zhuang, Y.; van Nes, A.; Liu, J. “Form Syntax” as a contribution to geodesign: A morphological tool for urbanity-making in urban design. URBAN Des. Int. 2017, 22, 73–90. [Google Scholar] [CrossRef]
- Carpio-Pinedo, J.; Ramírez, G.; Montes, S.; Lamiquiz, P.J. New Urban Forms, Diversity, and Computational Design: Exploring the Open Block. J. Urban Plan. Dev. 2020, 146, 04020002. [Google Scholar] [CrossRef]
- Moravej, M.; Renouf, M.A.; Lam, K.L.; Kenway, S.J.; Urich, C. Site-scale Urban Water Mass Balance Assessment (SUWMBA) to quantify water performance of urban design-technology-environment configurations. Water Res. 2021, 188, 116477. [Google Scholar] [CrossRef] [PubMed]
- Jang, S.; Cho, M.; Yoon, J.; Yoon, Y.; Kim, S.; Kim, G.; Kim, L.; Aksoy, H. Using SWMM as a tool for hydrologic impact assessment. Desalination 2007, 212, 344–356. [Google Scholar] [CrossRef]
- Rossman, L.A. Storm Water Management Model User’s Manual, Version 5.0; Environmental Protection Agency: Washington, DC, USA, 2010. [Google Scholar]
- Bruwier, M.; Mustafa, A.; Aliaga, D.G.; Archambeau, P.; Erpicum, S.; Nishida, G.; Zhang, X.; Pirotton, M.; Teller, J.; Dewals, B. Influence of urban pattern on inundation flow in floodplains of lowland rivers. Sci. Total Environ. 2018, 622–623, 446–458. [Google Scholar] [CrossRef] [Green Version]
- Abana, E.C. A Decision Tree Approach for Predicting Student Grades in Research Project using Weka. Int. J. Adv. Comput. Sci. Appl. 2019, 10. [Google Scholar] [CrossRef] [Green Version]
- Rodrigues, M.; Antunes, C. Best Management Practices for the Transition to a Water-Sensitive City in the South of Portugal. Sustainability 2021, 13, 2983. [Google Scholar] [CrossRef]
Figure 1.
Planning process in new town development combined with urban density, city functions, special structures, and surface runoff; (a) Planning process in new town development, (b) Planning process in new town development with SR.
Figure 1.
Planning process in new town development combined with urban density, city functions, special structures, and surface runoff; (a) Planning process in new town development, (b) Planning process in new town development with SR.

Figure 2.
Proposed Conceptual Framework to analysing the relationship among urban form density and surface runoff. Source: Compiled by author.
Figure 2.
Proposed Conceptual Framework to analysing the relationship among urban form density and surface runoff. Source: Compiled by author.

Figure 3.
Methodological flow chart. Source: Compiled by author.

Figure 4.
Spacemate density categorization. Source: [57]; (a) Nine density categorization, (b) Three main density categorization.
Figure 4.
Spacemate density categorization. Source: [57]; (a) Nine density categorization, (b) Three main density categorization.

Figure 5.
The procedural system layouts and the real-world layouts. Source: Compiled by author.

Figure 6.
Amount of surface runoff in each sub-catchment of the selected case study areas—generated from SWMM. Source: Compiled by author.
Figure 6.
Amount of surface runoff in each sub-catchment of the selected case study areas—generated from SWMM. Source: Compiled by author.

Figure 7.
Correlation heat map.

Figure 8.
Decision Tree Analysis predicted model 1.

Figure 9.
Decision Tree Analysis predicted model 2.

Figure 10.
Decision Tree Analysis predicted model 3.

Figure 11.
Real ground flood locations and model predicted flood locations: (a) actual flood Bambalapitiya; (b) actual flood Nagoda Hospital Junction; (c) actual flood Colombo-7; (d) model result for Bambalapitiya; (e) model result for Nagoda Hospital Junction; (f) model result for Colombo-7.
Figure 11.
Real ground flood locations and model predicted flood locations: (a) actual flood Bambalapitiya; (b) actual flood Nagoda Hospital Junction; (c) actual flood Colombo-7; (d) model result for Bambalapitiya; (e) model result for Nagoda Hospital Junction; (f) model result for Colombo-7.

Figure 12.
Change of surface runoff (SR) in real ground result and model result.

Figure 13.
Level of accuracy verification: (a) flood depth; (b) inundation duration.


Table 1.
Summary of density-based factors utilized to determine urban flooding by previous studies.
| Identified Density-Based Proxies | [28] | [29] | [30] | [31] | [24] | [26] | [32] | [33] | [34] | [35] | [36] | [37] | [38] | [39] | [40] | [41] | [42] | [43] | [12] | [44] | [45] | [46] | [47] | [48] | [49] | [50] | [51] | [52] | [53] | [19] |
|---|---|---|---|---|---|---|---|---|---|---|---|---|---|---|---|---|---|---|---|---|---|---|---|---|---|---|---|---|---|---|
| Drainage Density | * | * | * | * | * | * | * | * | * | |||||||||||||||||||||
| Population Density | * | * | * | * | * | * | * | * | * | * | ||||||||||||||||||||
| Building Density | * | * | * | * | * | * | * | * | * | * | * | |||||||||||||||||||
| Building Height | * | * | * | * | * | * | * | |||||||||||||||||||||||
| Green/Open Space Ratio | * | * | * | * | * | * | ||||||||||||||||||||||||
| Road/Street Density | * | * | * | * | ||||||||||||||||||||||||||
| Accessibility/Access Road Width | * | * | * | |||||||||||||||||||||||||||
| FAR | * | * | * | * | * | |||||||||||||||||||||||||
| Built Up/Ground Coverage Ratio (GCR) | * | |||||||||||||||||||||||||||||
| Impervious Surface Coverage/% | * | * | * | * | * | |||||||||||||||||||||||||
| Area of Building Footprints | * | * | ||||||||||||||||||||||||||||
| GSI | * | |||||||||||||||||||||||||||||
| Plot Size | * | * | * | |||||||||||||||||||||||||||
| Land Use | * | * | * | * | * |
* Factors mentioned in the relevant publication.
Table 2.
Definition for dimensions in 3Ds.
| Dimension | Description with Candidate Variable |
|---|---|
| Density | This variable represents a ratio between the total amount of gross area and the area of a parcel upon which a building is located. Ex: Population density of the area, building density of the area, road density of the area, FAR (Floor Area Ratio). |
| Diversity | This variable represents variation or diversity in horizontal or vertical space in a particular area. Ex: Building height, level of accessibility, land use mix, plot size, built up coverage |
| Design | The variables or elements introduced that minimize or maximize impact. Ex: Green/open space ratio, access road width, impervious surface coverage, drainage density |
Source: Compiled by author.
Table 3.
Quantification of variables.
| Density-Based Key Variable | Measuring Variable | Equation/Method of Measure | Source |
|---|---|---|---|
| Proxies of density | Population density (PD) | Census and statistics/Calculated by author | |
| Building density | Building density in a particular land plot/area | JICA database | |
| Road density | JICA database/Calculated by author | ||
| FSI (FAR) | JICA database | ||
| Proxies of diversity | Building height | Sum of floors in selected land plot/area | JICA data/Calculated by author |
| Level of accessibility | CCi = (N − 1)/Σdij (Closeness centrality of road segment) | JICA database/Calculated by author | |
| Land use mix (Mixed Use Index) | JICA database | ||
| Plot size | Extracted as mean plot size from survey department data | JICA database/survey department data | |
| Built-up coverage (BC) | Satellite data/Calculated by author | ||
| Proxies of urban design | Open space ratio (OSR) | Calculated by author | |
| Access road width | Extracted with google earth | OSM data/Google Earth measure | |
| Impervious surface coverage | The % of impervious area of the catchment | Satellite data/Calculated by author | |
| Drainage density | Drainage data of the area—WSDB and GN level/Calculated by author |
Source: Compiled by author. Abbreviations: FSI (FAR)—Floor Space Index or Flore Area Ratio; GN—Grama Niladari Divisions (that is the smallest administrative Divisions in Sri Lanka); JICA—Japan International Cooperation Agency; OSM—Open Street Map; WSDB—Water Supply and Drainage Board.
Table 4.
Selection of surface runoff (SR) simulation model (using pre-defined criteria).
| Selection Criteria | HEC-RAS | SWMM | PC- SWMM | Urban BEATS | MIKE Flood | City Drain | 3Di | 2D RRI | DS | DEM Based | RS | Lidar/GIS | ML |
|---|---|---|---|---|---|---|---|---|---|---|---|---|---|
| Level of accuracy in local or watershed scale | √ | √ | √ | x | √ | x | √ | x | x | √ | x | √ | √ |
| Data availability in Sri Lankan context | √ | √ | √ | √ | √ | √ | x | x | √ | √ | √ | x | √ |
| Free and open-source application | √ | √ | x | x | x | x | √ | √ | √ | √ | √ | x | √ |
| Less calibration time | √ | √ | x | √ | √ | x | √ | x | √ | x | √ | √ | x |
| Used in urban planning subject area | √ | √ | √ | x | √ | √ | x | √ | √ | √ | √ | √ | √ |
| Used for Urban flood modelling | x | √ | √ | x | √ | √ | √ | √ | √ | x | √ | √ | √ |
Source: Compiled by author. Abbreviations: HEC-RAS—Horologic Engineering Center’s River Analysis System; SWMM—Storm Water Management Model; PCSWMM—Personal Computer Storm Water Management Model; BEATS—Biophysical Environments and Technologies Simulator; MIKE—stormwater modeling software powered by Danish Hydraulic Institute (DHI); 3Di—three-dimensional flood model; 2D RRI—Two-Dimensional Rainfall-Runoff-Inundation; DS—Digitalwater Simulation; DEM—Digital Elevation Model; RS—Remote Sensing based; GIS—Geographic Information System; ML—Machine Learning.
Table 5.
Input parameters for the parameterized urban city-generator model.
| Parameter | High Density | Moderate Density | Low Density |
|---|---|---|---|
| Average street length | 35–400 m | 50–500 m | 60–700 m |
| Major road width | 12–20 m | 12–15 m | 12–15 m |
| Minor road width | 6–10 m | 6–10 m | 6–8 m |
| Road curvature | 0°–90° | 0°–120° | 0°–170° |
| Park coverage (green space) | 0–20% | 5–40% | 5–98% |
| Buildings per lot | 6–30 | 6–34 | 1–36 |
| Lot size (in sq m) | 250–2500 | 350–1400 | 600–11,000 |
| Building front setback | 0–5 m | 0–35 m | 0–30 m |
| Building rear setback | 0–5 m | 0–35 m | 0–30 m |
| Building side setback | 0–5 m | 0–35 m | 0–30 m |
Source: Compiled by author.
Table 6.
Characteristics of each selected density-based case study area.
| High Dense | Moderate Dense | Low Dense | |
|---|---|---|---|
| Location | Bambalapitiya—CD | Nagoda hospital junction—KD | Colombo 7—CD |
| Land area | |||
| Number of sub-catchments | 53 | 51 | 51 |
| Population density (persons per km) | 257 | 15 | 5 |
| Building density | 59.52% | 25.65% | 16.52% |
| Open space | 9.52% | 62.47% | 78.21% |
| Avg. number of floors | 7 | 2 | 2 |
| Avg. plot size (m) | 758 Sqm | 900 Sqm | 2100 sqm |
| Land use mix | 85.74% | 14.31% | 35.57% |
Source: Compiled by author.
Table 7.
Type of analysis with purpose in each stage.
| Stage | Type of Analysis | Purpose |
|---|---|---|
| 1 | Correlation analysis | To identity the relationship between individual variables |
| 2 | Decision tree analysis | To measure the prediction probability and the level of accuracy of the pre-developed framework. |
| 3 | Regression analysis | Validation of the developed framework with real ground flood data (i.e., flood depth, inundation duration). |
Table 8.
Model accuracy of decision tree analysis.
| Parameters | Model 1 Accuracy | Model 2 Accuracy | Model 3 Accuracy |
|---|---|---|---|
| Correctly classified instances | 98.7097% | 94.8387% | 93.5484% |
| Incorrectly classified instances | 1.2903% | 5.1613% | 6.4516% |
| Kappa statistic | 0.983 | 0.932 | 0.915 |
| Mean absolute error | 0.0097 | 0.034 | 0.0457 |
| Relative absolute error | 3.183% | 11.1693% | 14.9979% |
| Root relative squared error | 3.183% | 33.4472% | 38.758% |
| Total number of instances | 155 | 155 | 155 |
Disclaimer/Publisher’s Note: The statements, opinions and data contained in all publications are solely those of the individual author(s) and contributor(s) and not of MDPI and/or the editor(s). MDPI and/or the editor(s) disclaim responsibility for any injury to people or property resulting from any ideas, methods, instructions or products referred to in the content. |
© 2023 by the authors. Licensee MDPI, Basel, Switzerland. This article is an open access article distributed under the terms and conditions of the Creative Commons Attribution (CC BY) license (https://creativecommons.org/licenses/by/4.0/).
Share and Cite
MDPI and ACS Style
Wijayawardana, N.; Abenayake, C.; Jayasinghe, A.; Dias, N. An Urban Density-Based Runoff Simulation Framework to Envisage Flood Resilience of Cities. Urban Sci. 2023, 7, 17. https://doi.org/10.3390/urbansci7010017
AMA Style
Wijayawardana N, Abenayake C, Jayasinghe A, Dias N. An Urban Density-Based Runoff Simulation Framework to Envisage Flood Resilience of Cities. Urban Science. 2023; 7(1):17. https://doi.org/10.3390/urbansci7010017
Chicago/Turabian StyleWijayawardana, Naduni, Chethika Abenayake, Amila Jayasinghe, and Nuwan Dias. 2023. "An Urban Density-Based Runoff Simulation Framework to Envisage Flood Resilience of Cities" Urban Science 7, no. 1: 17. https://doi.org/10.3390/urbansci7010017