


Mental Models for Assessing Impacts of Stormwater on Urban Social–Ecological Systems
1
School of Marine and Environmental Affairs, University of Washington, Seattle, WA 98195, USA
2
The Nature Conservancy, Seattle, WA 98121, USA
*
Author to whom correspondence should be addressed.
Urban Sci. 2023, 7(1), 14; https://doi.org/10.3390/urbansci7010014
Submission received: 18 November 2022
/
Revised: 14 January 2023
/
Accepted: 19 January 2023
/
Published: 30 January 2023
(This article belongs to the Special Issue Urban Agenda)
Abstract
:Managing social–ecological systems that benefit both humans and nature is the central challenge of natural resource management. Integrating multiple perspectives into decision-making adds flexibility to social–ecological systems by reducing rigidity and promoting adaptability. Our objective was to assess expert perceptions of the structure, content, and function of the Puget Sound stormwater social–ecological system. We interviewed Puget Sound stormwater experts to document their mental models of the system and compared the network structure of expert maps. We also assessed differences among experts in the components of the social–ecological system which were included in mental models. Our analyses revealed differences between genders, as well as between managers, in how experts characterized the system. Notably, female participants tended to characterize the social–ecological system as one in which there were many system drivers generating multiple impacts across the system. The mental models of the scientists tended to include more resource units than those of the managers, which focused more on governance compared to those of the scientists. Finally, we incorporated the diverse input from mangers and scientists to create a single mental model to represent a consensus on the Puget Sound stormwater social–ecological system. This work highlights the fact that addressing the stormwater problem requires that we embrace the varied perspectives of scientists, managers, and stakeholders. We contend that incorporating the diverse perspectives of experts within the context of social–ecological systems provides a promising path towards a lasting and durable recovery for the ecosystem.
1. Introduction
Social–Ecological Systems (SES) are complex, adaptive systems that consist of diverse connections between people and their environments [1]. The SES approach to natural resource management emphasizes that people, communities, economies, societies, and cultures are embedded parts of the ecosystem, and that each part is shaped by, dependent on, and evolving with one another [1,2,3]. Given this interdependence between human and ecological well-being, it is vital to incorporate this connection during natural resource decision-making [4]. Indeed, managing social–ecological systems that benefit both humans and nature is a central challenge of natural resource management [1,5,6].
Relationships among components of an SES can be complex and non-linear, and can operate across multiple scales; as a result, a first step in natural resource decision-making must be to understand the constituents of SES components and their connections [7,8]. To this end, experts often play a key role in building an understanding of social–ecological processes (e.g., [9,10,11]), and decision-makers frequently seek input from a wide range of technical experts (e.g., [9,10,12,13]). Elicitation of expert knowledge can generate valuable information, particularly in data-poor situations that require rapid management action [14]. Expert opinion can provide information on possible consequences and tradeoffs of management action (e.g., [9]), and because experts are trained in a diversity of disciplines and hold positions that focus on different parts of the system, they bring a variety of perspectives to bear on issues [15]. Thus, it is both a challenge and an opportunity for natural resource management to understand and effectively use the diverse perspectives of experts [16].
Capturing mental models is an emerging approach used to integrate and share knowledge from diverse experts [17,18,19,20]. Mental models allow individuals to use their “fuzzy” logic to illustrate how they catalog, interpret, and assign meaning to their environment [21,22]. In this way, experts can indicate what they believe are the most critical components and causal relationships, and then determine the strength, directionality, and impact of these relationships [20]. The qualitative nature of mental models allows individuals to describe components of the system that are not well-known, and makes them able to incorporate relationships that have yet to be quantified [20]. As examples: (1) Stier and colleagues [12] used mental models to describe and compare varying conceptualizations of the pelagic food web in Haida Gwaii, Canada; (2) Henly-Shepard and colleagues [23] used participatory modeling workshops to develop mental models that represented, explored, and actively questioned community beliefs about the natural hazards faced by communities of the North Shore of O’ahu Hawai’i; and (3) Nayaki and colleagues [24] used mental models to compare the assumptions driving externally-generated bushmeat management with perceptions of bushmeat trade derived from local community members. In these examples, mental models have proven to be useful tools for aligning perceptions of diverse actors and improving success by promoting context-appropriate policies.
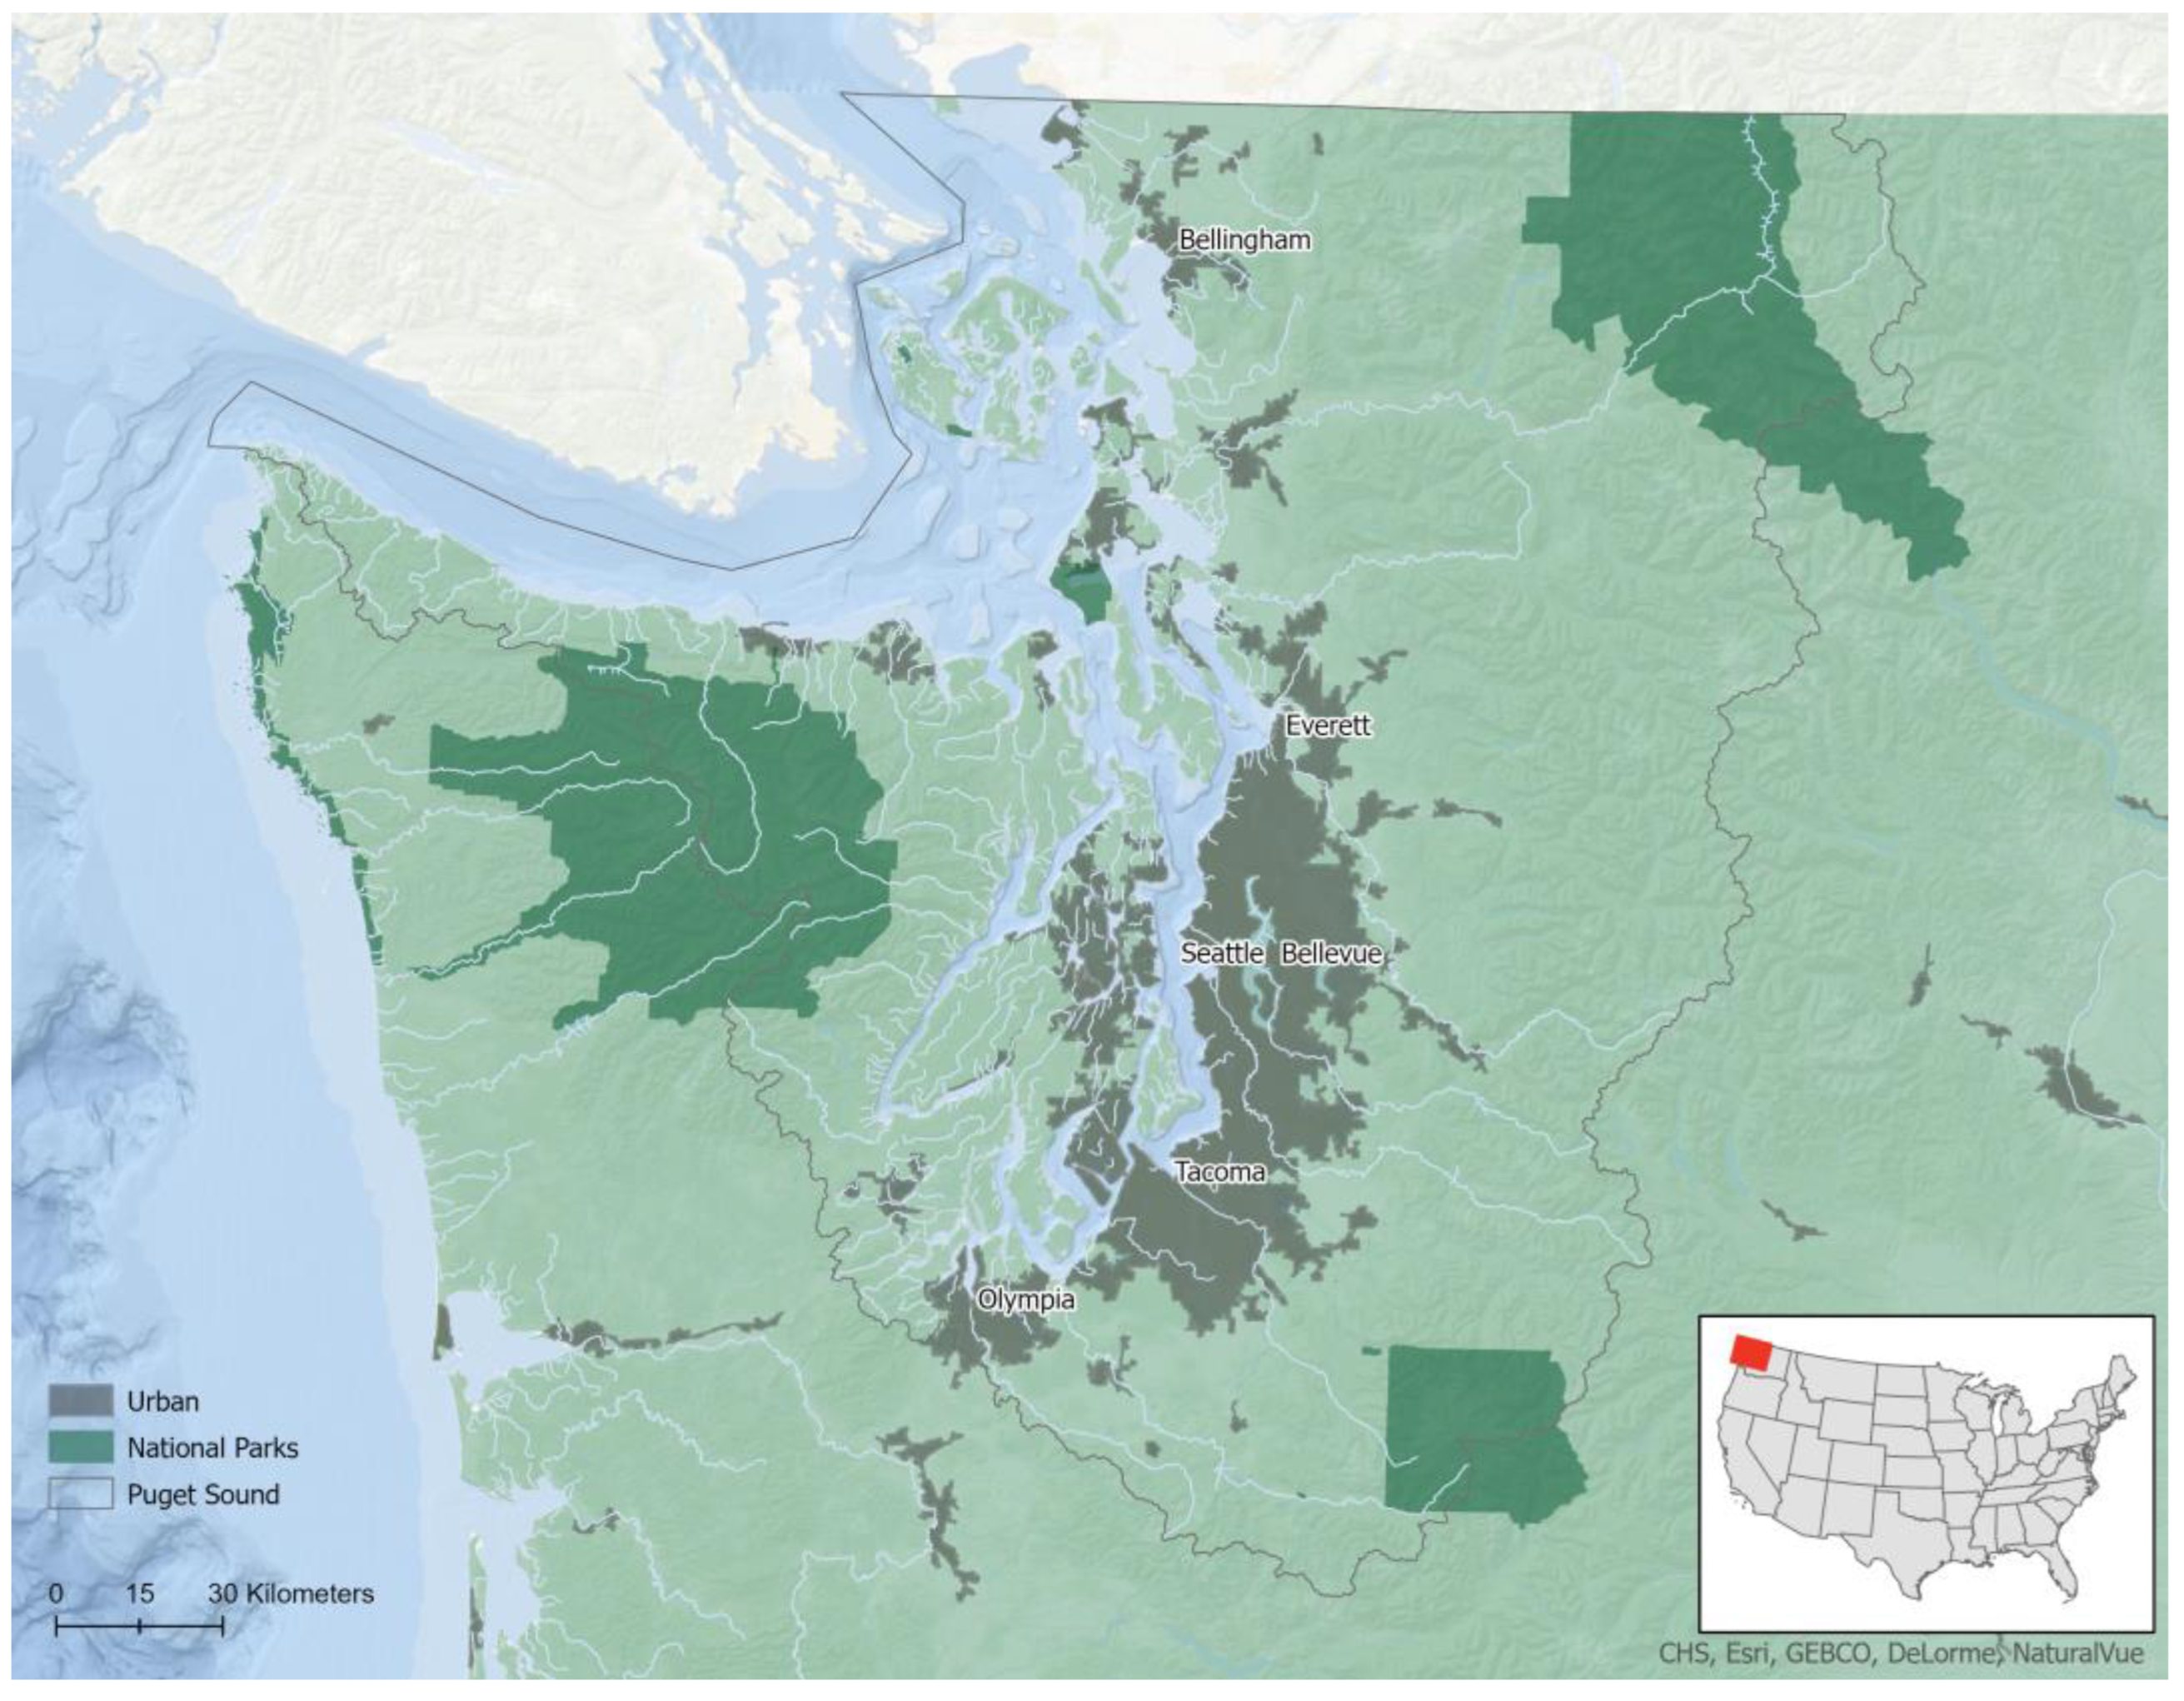
Herein, we use mental models as a tool to capture the perceptions of experts of the Puget Sound, USA, (Figure 1) social–ecological system, with a focus on urban stormwater management. Our objective of this project was to elicit the opinions of stormwater experts in order to fill a key knowledge gap about the linkages among biophysical and social dimensions of stormwater management, as well as to reveal the perceptions of experts regarding the factors and processes influencing the stormwater SES in Puget Sound. We define the Puget Sound stormwater SES as the resources, resource systems, actors, and governance engaged with managing urban stormwater pollution in Puget Sound. Specifically, we elicited mental models from diverse stormwater experts and asked whether the structure of mental models differed among experts with varying demographic or employment attributes (i.e., stormwater managers and scientists). We built a consensus mental model to highlight key components of the stormwater SES, and then characterized the mental models using an SES framework to examine whether experts varied in their perspectives on the Puget Sound stormwater SES structure.
2. Materials and Methods
2.1. The Puget Sound Study System
Puget Sound encompasses 41,500 km2 of upland, freshwater, estuarine, and marine habitats in Washington State, USA, and British Columbia, Canada, and supports a large (>4.2 million) and increasingly urban population ranging from Vancouver, British Columbia to Olympia, Washington [25] (Figure 1). With dozens of birds, mammals, fishes, plants, and invertebrates currently listed on state and federal endangered species lists, Puget Sound is also considered a hot-spot of extinction risk [26].
The Puget Sound region receives up to 1 m of precipitation annually, generating about 1.5 billion cubic meters of stormwater runoff [27]. This runoff is largely untreated, resulting in 544 fresh and marine waterbodies being designated as impaired or threatened by pollutants [27]. Stormwater impacts a diversity of species, from invertebrates [28] to marine mammals [29]. For example: (1) Tian and colleagues [30] recently demonstrated that a compound from tire rubber causes acute mortality in coho salmon (Oncorhynchus kisutch) when they migrate to urban creeks to spawn; (2) Pacific herring (Clupea pallasii) exposed to urban stormwater runoff suffer cardiac injury and reduced growth [31]; and (3) toxic contaminants in the blubber of southern resident killer whales ostensibly result in adverse health consequences, such as modifications in hormone levels, reproductive disruption or miscarriages, reduced immunity to diseases, neurotoxicity, neurobehavioral disruptions, and cancer [32]. Managing and mitigating stormwater impact is a priority in the Puget Sound region and beyond, but linkages among components of the biophysical and human dimensions of the stormwater SES are poorly understood [33].
2.2. Expert Elicitation of Mental Models
We conducted semi-structured interviews with stormwater experts to understand how experts perceived the Puget Sound Stormwater SES. Using stratified chain referral sampling (also known as snowball sampling) [34], we identified 25 Puget Sound stormwater experts. To accomplish this, we identified individuals who were considered stormwater experts by local, state, or federal management agencies, and, following the interviews, we asked them for the names of others whom they considered to be experts. We defined a stormwater expert as someone who works professionally in stormwater policy, science, or management. Experts were described as having either scientific or management expertise (hereafter referred to as “scientists” or “managers”). There was no exchange of money or goods for participating in the interviews. Interviews lasted between 60 and 110 min.
Following Carley and Palmquist [35], we asked each expert to draw a network with the most critical components and interactions in the Puget Sound stormwater SES. We asked experts to consider key drivers of stormwater, impacts of stormwater, ways to mitigate stormwater, species, habitats, threats, and ecological relationships. We then asked participants to consider linkages between the components of the system and describe the strength of interactions, ranging from −2 (strongly negative) to +2 (strongly positive). We also asked a series of demographic questions to gather information that could potentially influence responses (e.g., age, years of experience, professional affiliation, and gender).
We constrained expert responses in two ways: (1) they had to include herring and stormwater in their model, and (2) due to computational efficiency, they could include no more than 20 components in their model. We focused on herring because they have been identified by the Puget Sound Partnership as a key indicator of ecosystem health [36], are a critical component of the Puget Sound food web [37], and play a vital role in the trophic transfer of contaminants in the food web [38].
2.3. Analysis of Mental Models
Network Structure
We transformed each expert drawing of the Puget Sound Stormwater SES into adjacency matrices in the form A(D) = [aij], where the variables vi are listed on the vertical axis and vj on the horizontal axis to form a square matrix [17]. Connections among variables were then coded in the square matrix (between −2 and 2).
We assessed the content and structure of the mental models by evaluating eight network descriptors: number of components, number of connections, number of drivers, number of receivers, centrality, complexity, number of connections per component, and density (Table 1).
To test the null hypothesis that scientists and managers did not differ in the network structure of their mental models, we used t-tests to test for differences in the means of each of the eight network descriptors. We used a Bonferroni adjustment to modify the level of significance to account for multiple tests [39]. To examine the influence of years of experience on the structure of mental models, we used linear regression, with years of experience as the independent variable and network descriptors as dependent variables. We again adjusted p-values using a Bonferroni adjustment.
We also conducted a non-metric multidimensional scaling analysis (NDMS) using a Bray–Curtis dissimilarity matrix to further analyze patterns in the network structure of mental models. We used the number of components, number of connections, number of drivers, number of receivers, centrality, complexity, number of connections per component, and density (Table 1) as inputs for the analysis. The analysis was performed in R using the Vegan package [40].
2.4. Characterization of the Puget Sound Stormwater SES
We next investigated the degree to which experts emphasized different components of the Puget Sound SES. To accomplish this, we followed McGinnis and Ostrom [7] and classified each component that arose in mental models as follows: (1) actor, (2) resource system, (3) governance system, or (4) resource unit. We then examined the frequency at which participants emphasized different components of the SES. As with the structural network descriptors above, we used t-tests with Bonferroni adjustments to evaluate the null hypothesis that scientists and managers did not differ in the mean number of SES categories in mental models.
2.5. Development and Analysis of Aggregate Models
Following the approach of Özesmi and Özesmi [17] and Gray et al. [20], we created an aggregate mental model of the Puget Sound SES. Individual mental models were given equal weight in the aggregating process. Our first step was to group similar components by SES framework elements (actor, resource system, governance system, resource unit). Because individuals differ in the level of detail or components of their models, our next step was to qualitatively combine similar components to produce an aggregate model with about 20 components. We estimated interaction strengths in the aggregate model by averaging interaction strengths from individual mental models [20].
3. Results
3.1. Structural Characterization of the Mental Models
We elicited 25 individual mental models from experts with an average of 13.7 (SD 1.7) years of experience in stormwater science or management. Of the experts, 56% identified as female, and 44% as male. Individuals who identified as scientists comprised 40% of our subjects, while 60% described themselves as managers.
The mental models had an average of 18.04 (SE 0.53) components, with a mean of 31.44 (SE 1.68) connections. The average number of connections per component was 1.75 (SE 0.08), and that of complexity was 0.64 (SE 0.17). Individual mental models can be found in O’Connor, 2020 [41].
We were unable to detect an association between years of experience and eight network descriptors: number of components, number of connections, number of drivers, number of receivers, centrality, complexity, number of connections per component, and density (in all cases, r2 < 0.03; p > 0.05).
In models generated by participants who identified as female, the average number of drivers (4.86, SE 0.75) was nearly double that of models created by males (2.45, SE 0.39; t = 2.85, adjusted p = 0.02), and the average number of receivers in female-created models (2.21; SE 0.41) was 2.4-fold that of participants who identified as male (0.91, SE 0.32; t = 2.53, adjusted p = 0.02). We did not detect differences between the genders in any of the other network descriptors. In models generated by scientists, the average number of receivers was more than twice that of managers (2.13 (SE 0.40) vs. 0.90 (SE 0.31); t = 2.42, adjust p = 0.04). We did not detect differences between scientists and managers in any of the other network descriptors.
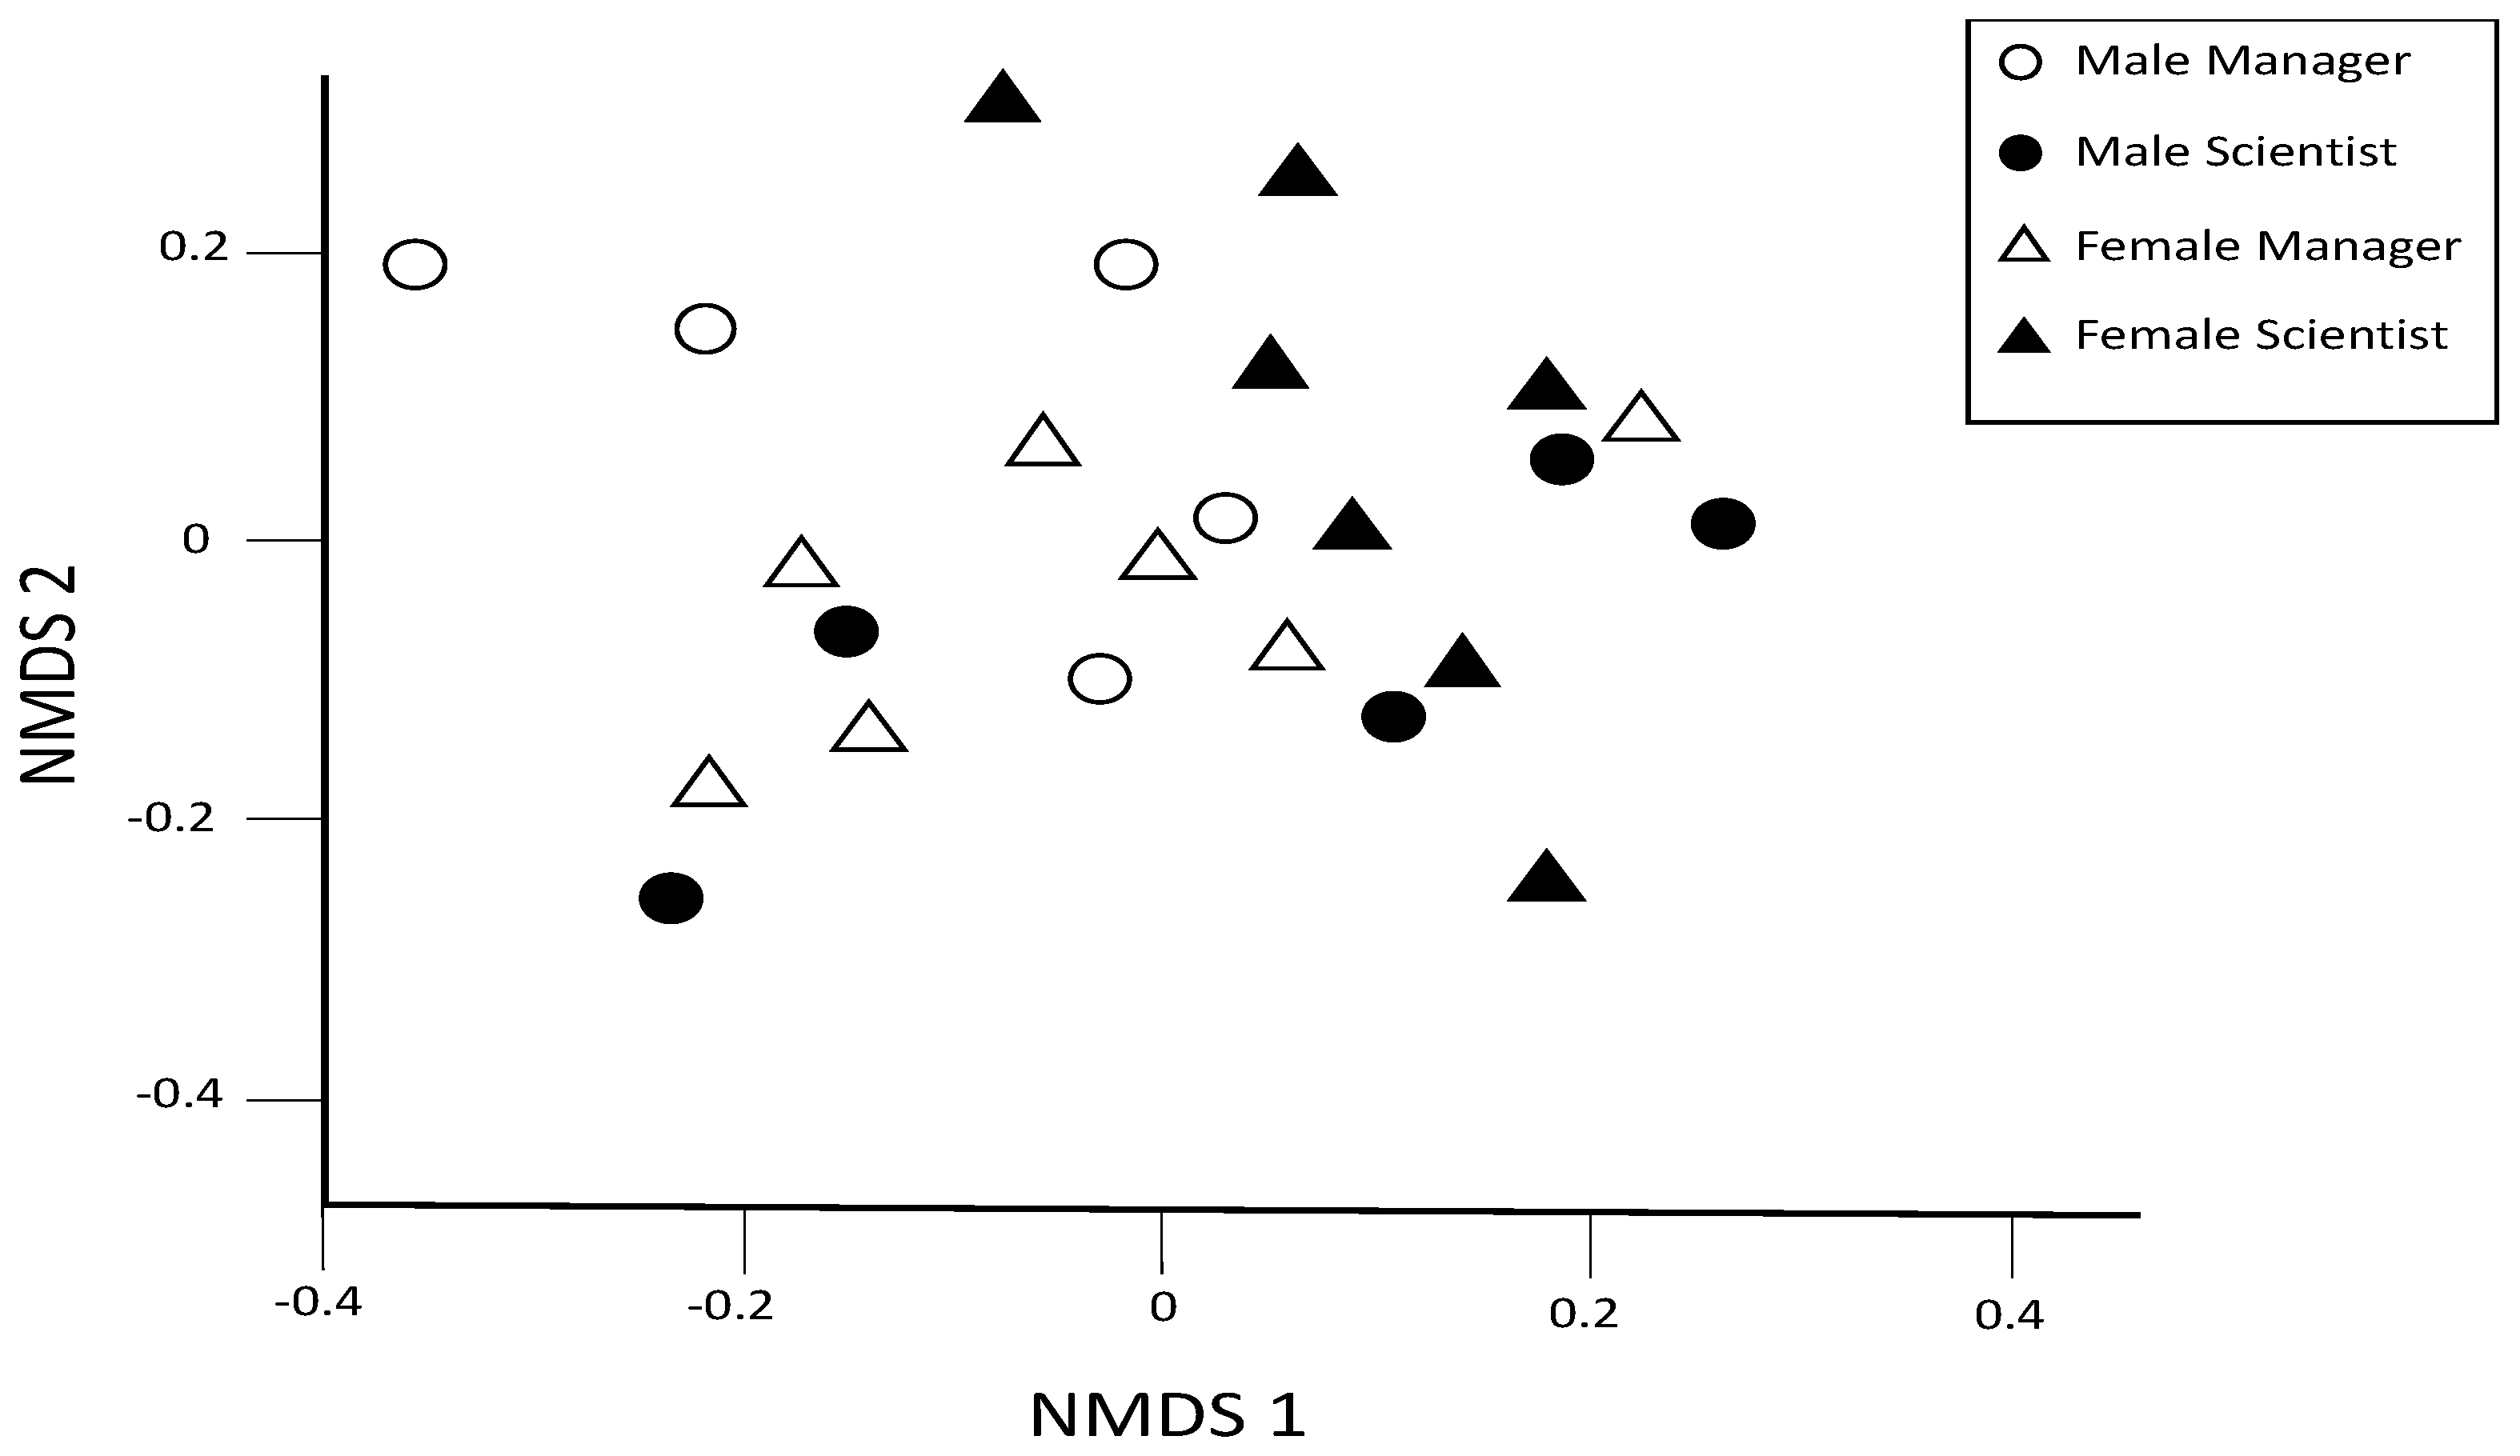
The non-metric multidimensional scaling (NMDS) shows no evidence of any groupings of mental models based on the network descriptors we used (Figure 2). However, the spread of individuals across the multivariate space in the NMDS plot highlights the diversity of the mental models developed by the experts we interviewed.
3.2. Aggregate Mental Model of the Puget Sound Social–Ecological System
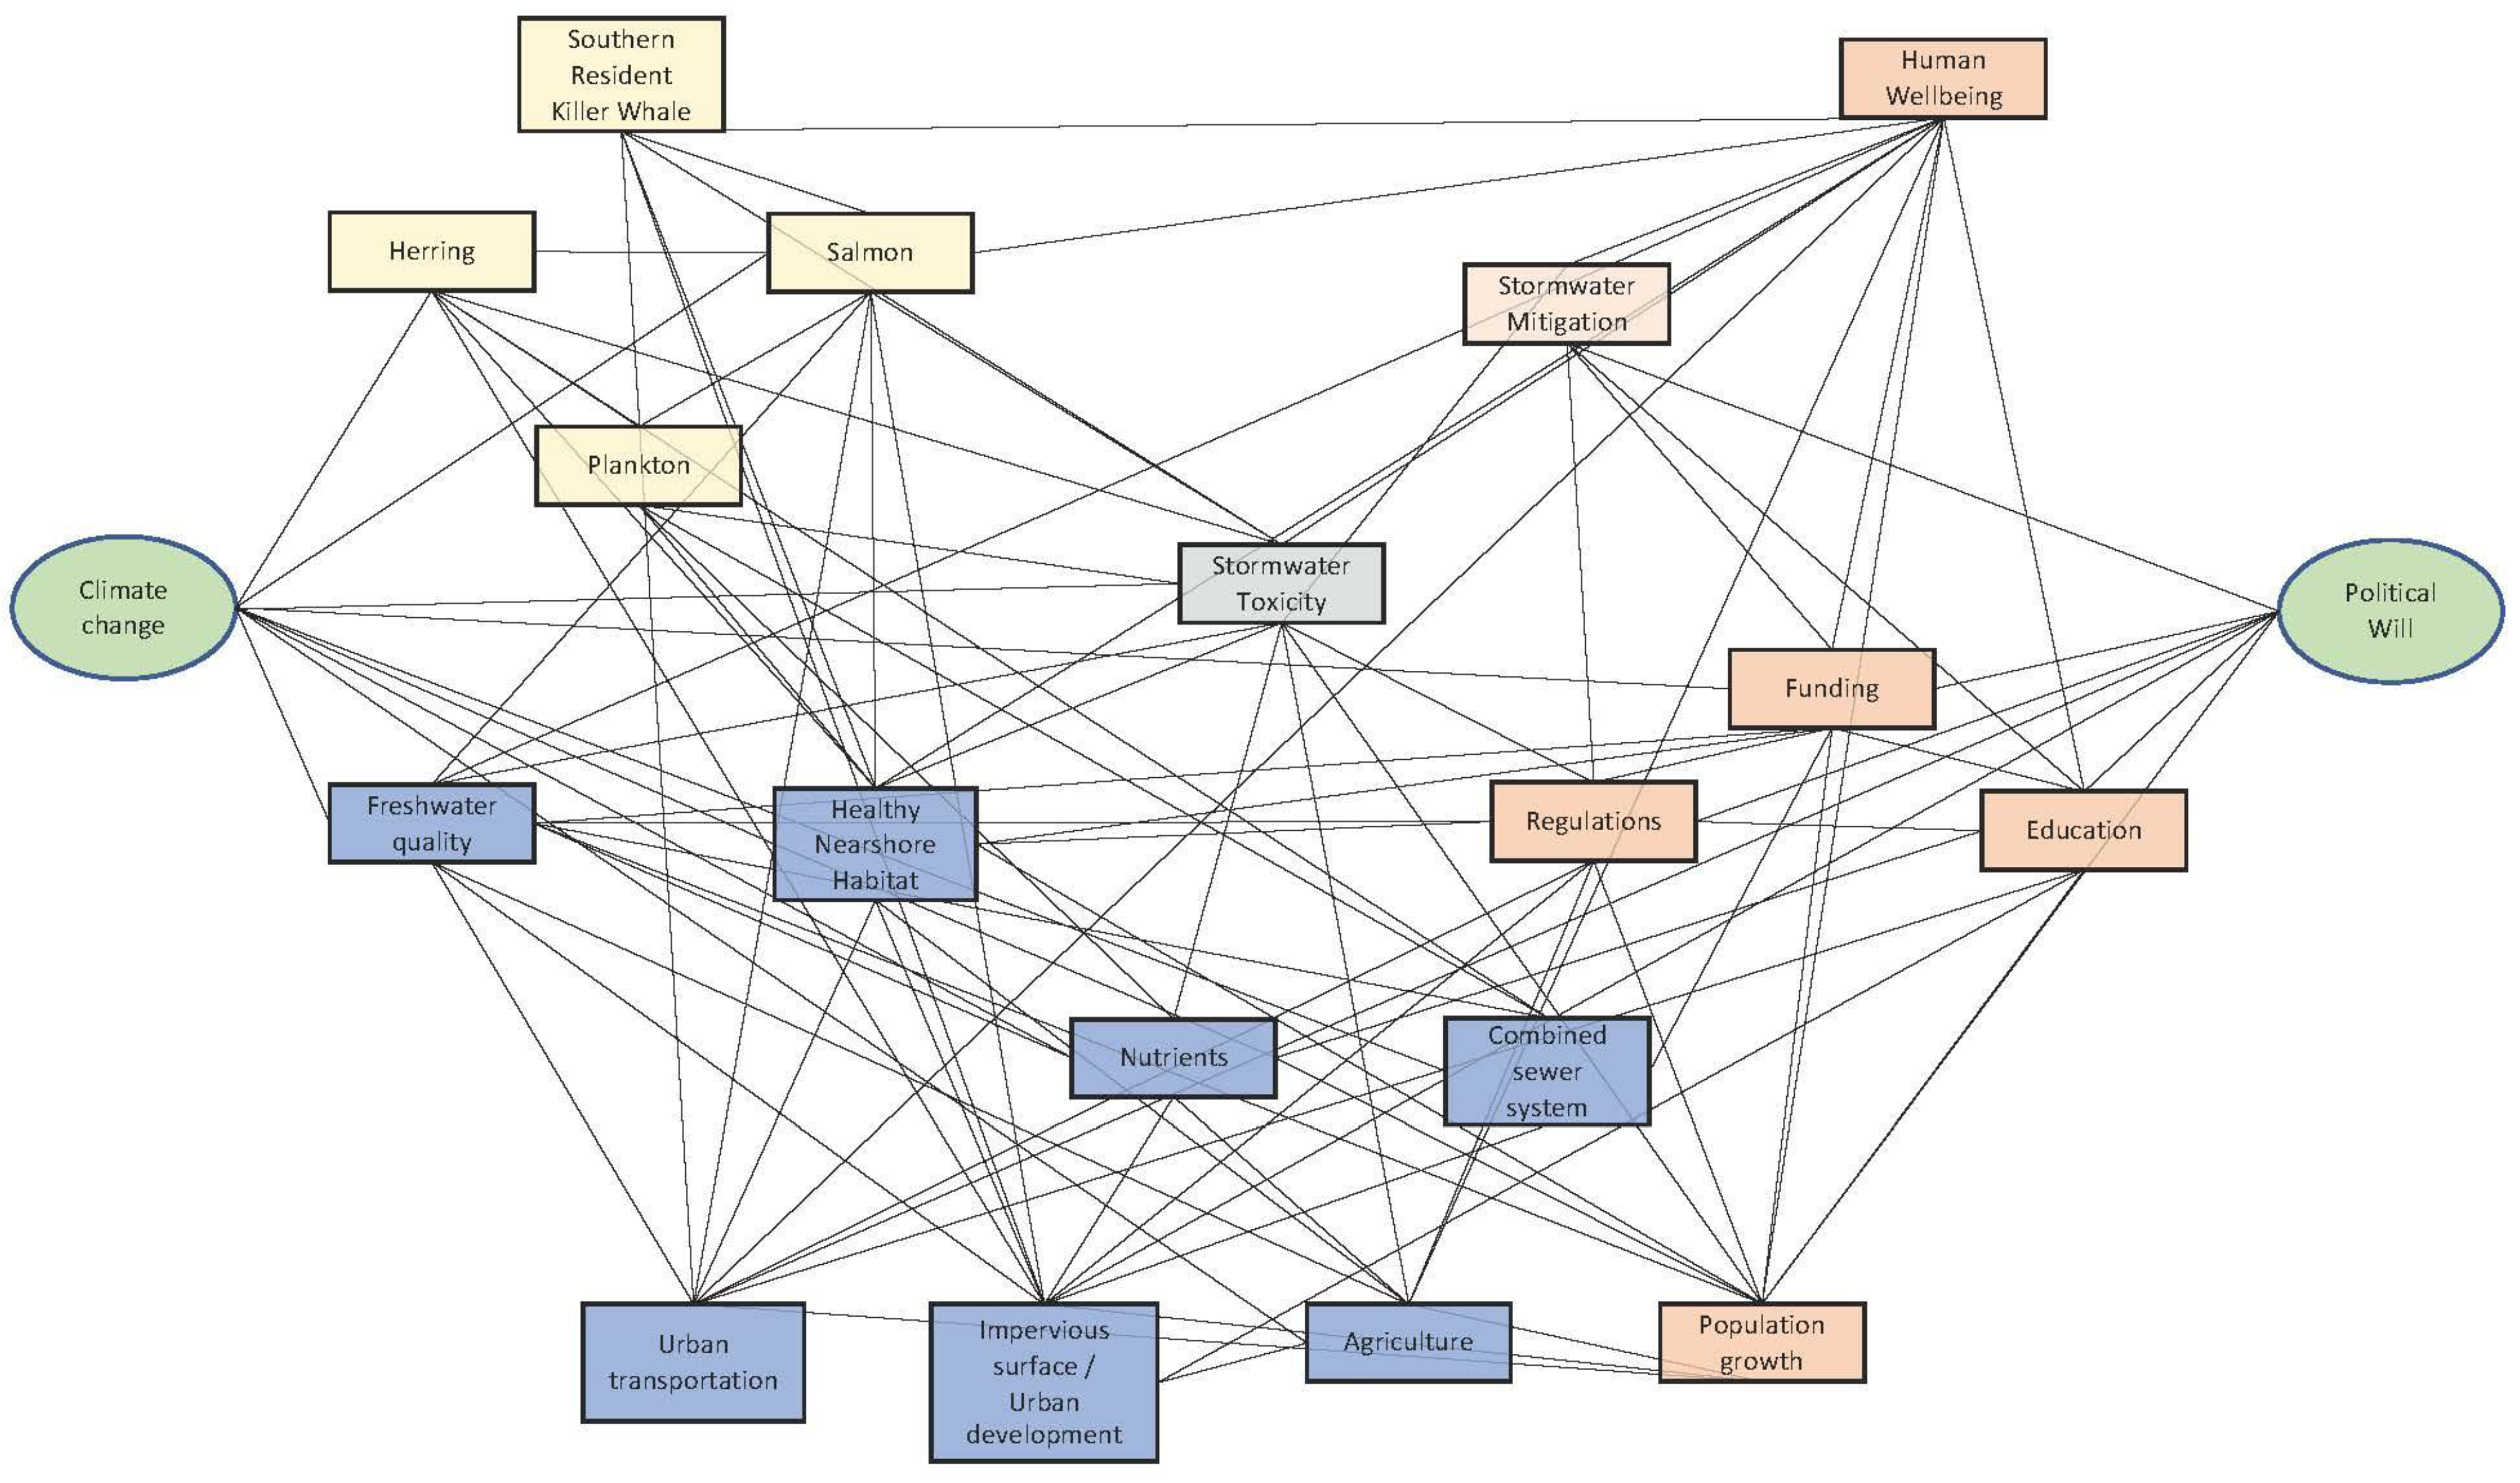
When we combined the 25 mental models elicited from stormwater experts, 4 ecological resource units emerged: salmon, herring, plankton, and southern resident killer whales (Figure 3; Figure A1). While some participants spoke of salmon generally (e.g., “salmon” or “Puget Sound salmon”), others listed specific species of salmon (e.g., Chinook salmon, Coho salmon, see also [41]). Similarly, some experts referred to plankton generally, while others specified zooplankton or phytoplankton. Most respondents included herring as a single node in their mental model; however, some separated different life stages (i.e., eggs, embryos, adults). Experts also included nutrients and stormwater as resource units in their models (Figure 3). In the resource unit sub-model, increased stormwater has negative impacts, both direct and indirect, on the food web. Nutrients, however, had mixed impacts on the food web—small increases in nutrients had a positive impact on plankton while large increases had negative effects.
The combined mental model characterized the resource system with nine components that represented the region’s urban and adjacent rural areas. In the resource system sub-model, urban development is the primary driver (Figure 3). The model highlights that increased development directly increases stormwater by expanding impervious surfaces, and indirectly increases stormwater toxicity by raising the number of vehicles in the region. Additionally, the model underscores that increased roadways and other impervious surfaces result in more overflow events from combined wastewater–stormwater systems, resulting in increased toxics and nutrients entering the system. Development also impacts nutrients directly (e.g., from wastewater or septic systems) or indirectly through agriculture.
The governance and actor sub-model derived from our interviews included five additional components (Figure 3). In this sub-model, stormwater education was a key driver. Participants perceived that increased education would lead directly to more effective stormwater regulations, more funding for stormwater management, and increased use of green stormwater infrastructure to mitigate its negative effects on ecosystems and human well-being. Experts also identified funding as an important limitation to increasing green stormwater infrastructure in the Puget Sound region.
Finally, stormwater experts noted two key externalities in their mental models: climate change and political context (Figure 3). Study participants predicted that climate change would increase precipitation, leading to increased runoff of stormwater pollutants and nutrients. Unless mitigated, this would negatively impact human well-being and ecosystem health. Experts also noted that political decisions and political will to address would significantly impact the implementation of measures to mitigate stormwater; however, whether the political milieu would have a positive or negative effect was uncertain.
3.3. Characterization of the Social–Ecological System
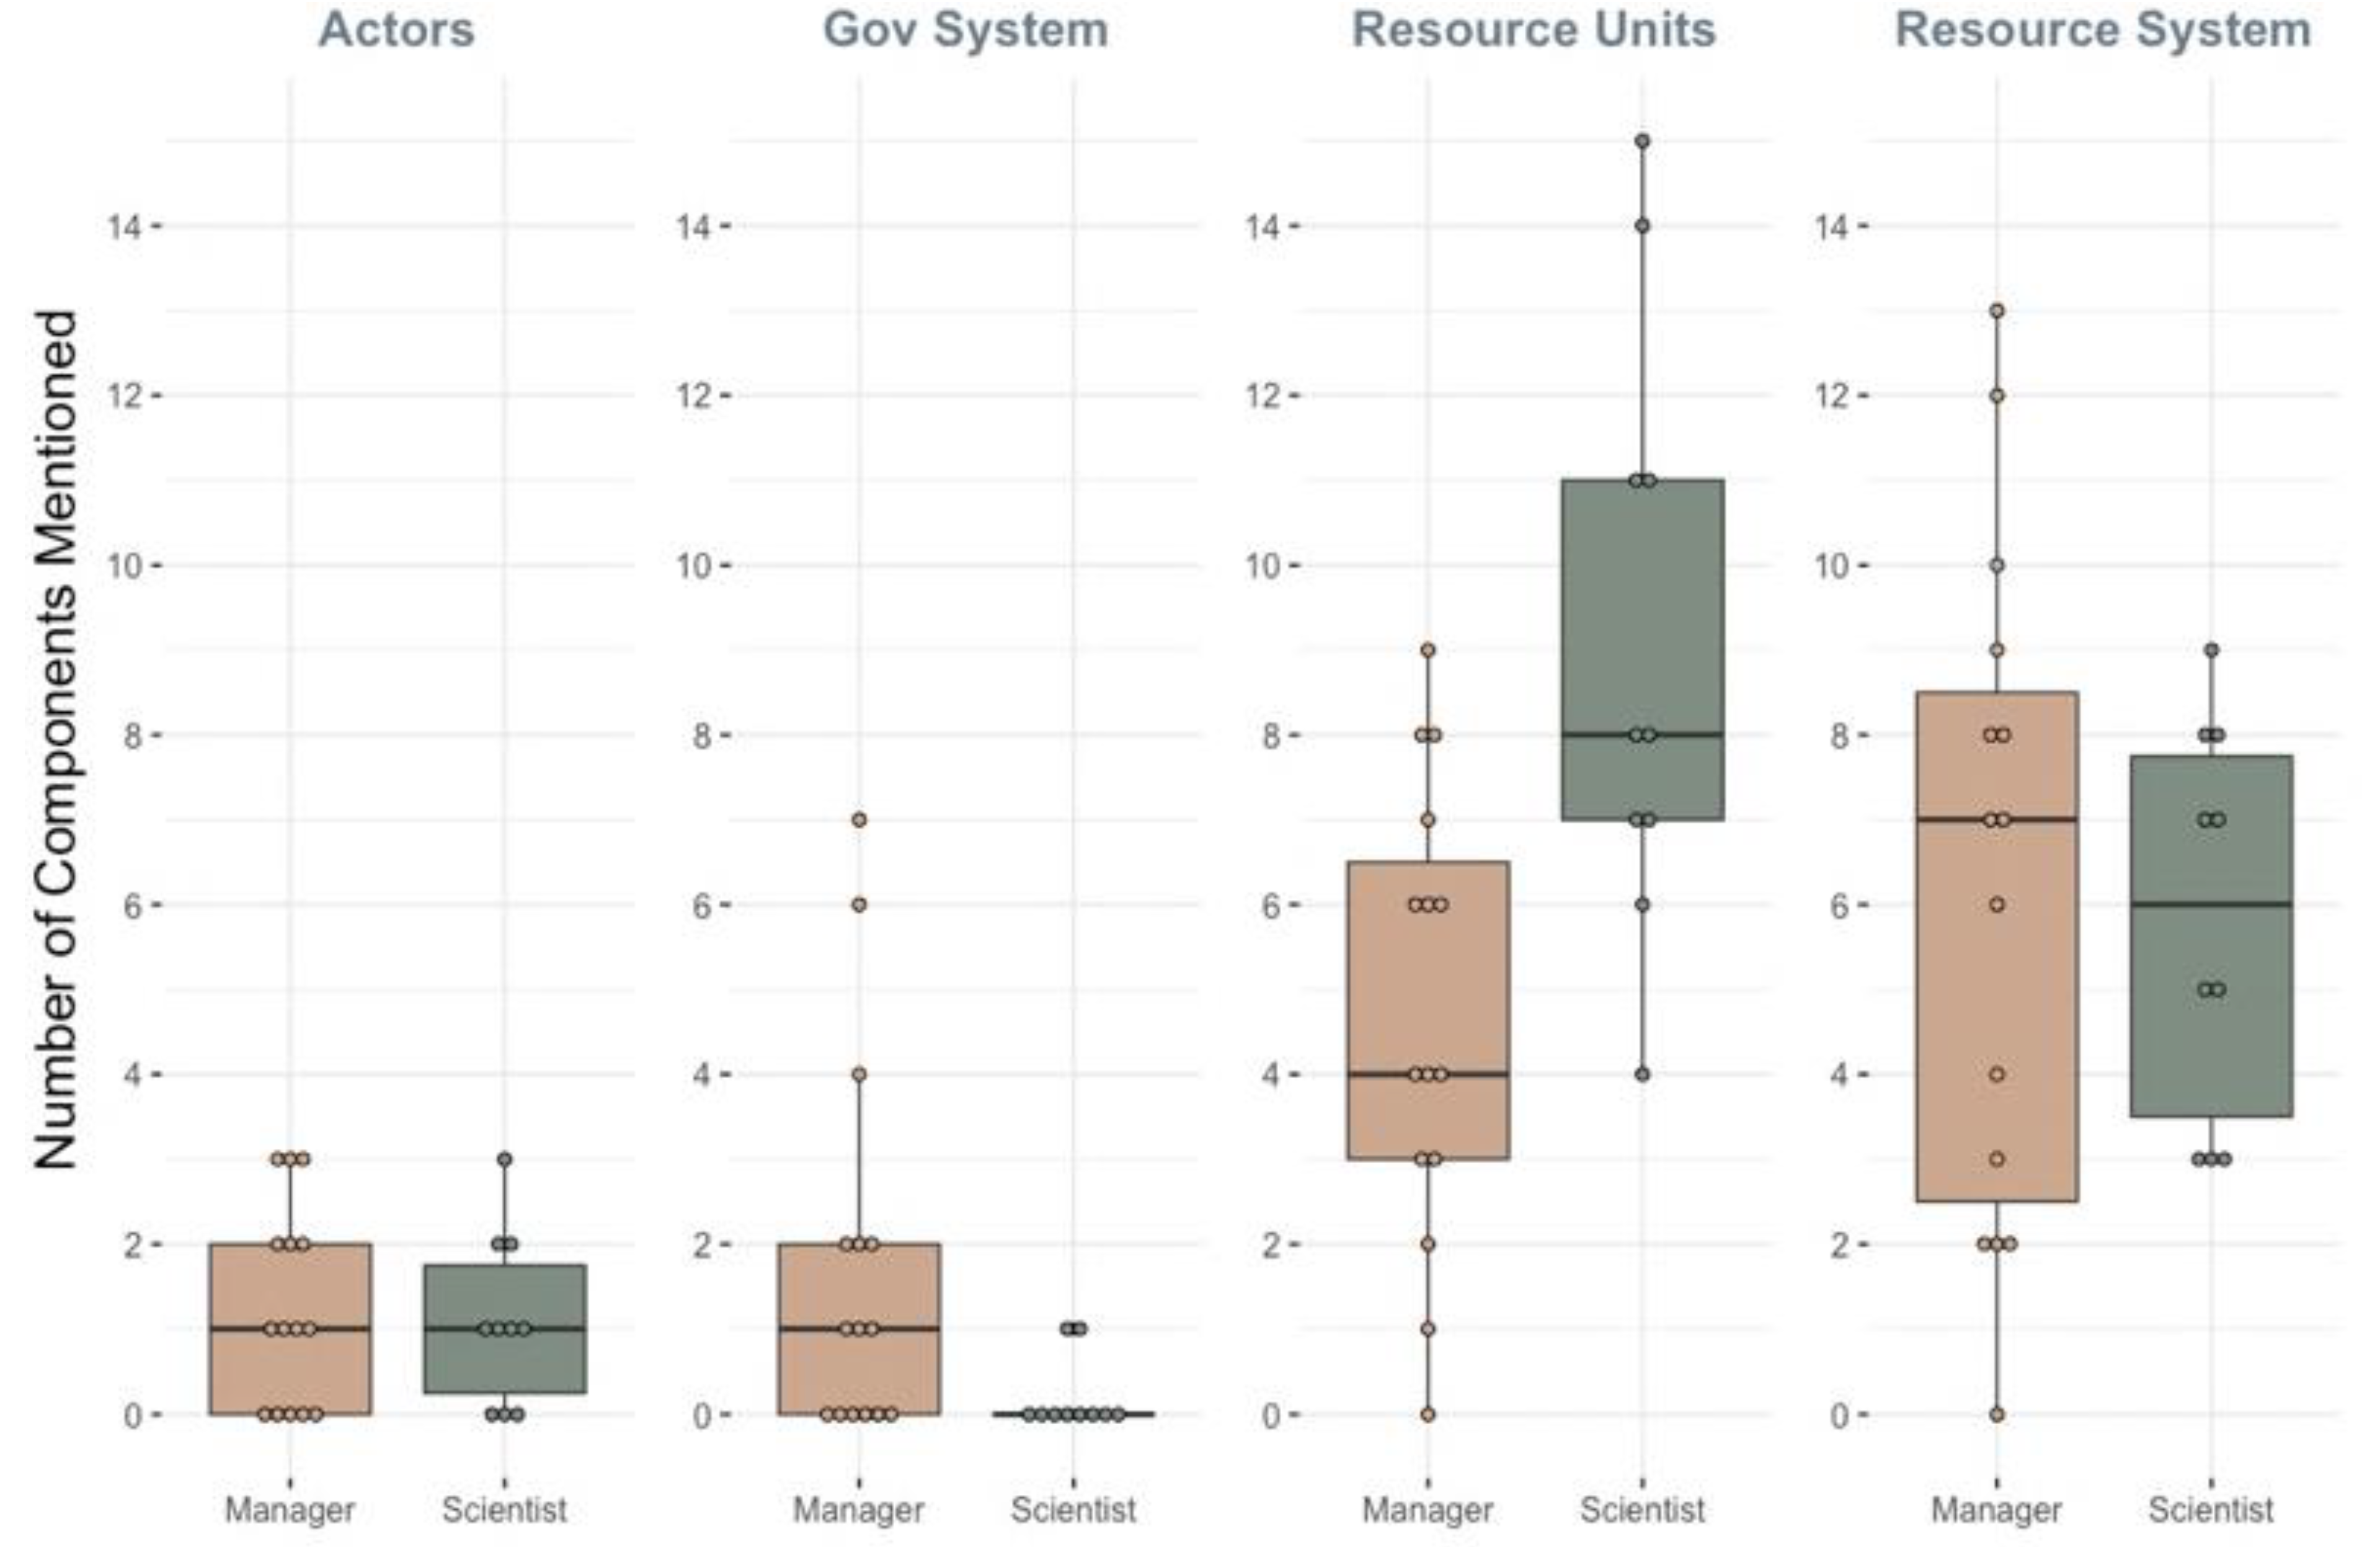
When we organized mental models by elements of the Social–Ecological System (i.e., resource system, resource units, governance system, and actors), it became clear that managers and scientists emphasized different aspects of the SES (Figure 4); thus, a complete picture of the SES required us to include perspectives from both scientists and managers.
On average, scientists included about twice the number of resource unit components than managers (t = 3.31; adjusted p = 0.002; Figure 4). In contrast, models created by managers included eight times the number of governance system components compared to scientists (t = 2.57, adjusted p = 0.04; Figure 4). We did not observe differences between scientists and managers in the number of actors or resource system components in the models (Figure 4).
We estimated centrality values of the components in two aggregate models: one created using only scientist input and a second created with only manager input. The rank order of the centrality values of components from the scientist model was correlated with those of managers (Spearman rank correlation, R = 0.68; Figure 5). Despite the overall correlation between models, managers and scientists appeared to differ in their perspectives on the importance of some model components (Table 2). Centrality of plankton, for example, ranked seventh in the scientist model, but was twentieth in the manager model (Table 2). Scientists also perceived agriculture as more important (centrality rank = 9) than managers did (centrality rank 19; Table 2). In contrast, the centrality of stormwater regulation ranked 10th in the manager model, but 17th in the scientist model (Table 2).
4. Discussion
People are drawn to places where land and water meet [6]. While cities emerge along coasts out of geographic and economic necessity, the land–water interface also provides leisure and recreational opportunities and meets critical cultural needs for a range of indigenous and non-indigenous communities [42,43,44]. While coastal zones are essential contributors to the delivery of ecosystem services, their growing population, geographical location, and frequent pattern of unsustainable land use has led to their degradation. The diversity of users and threats to coastal zones makes their management particularly challenging [45]. Herein, we elicited knowledge from Puget Sound stormwater specialists in the form of mental models. These mental models provided insight into the varying perspectives of stormwater professionals and highlighted the need to synthesize disparate perceptions to achieve a holistic view of the system.
To solve complex problems such as those associated with stormwater, decision-makers increasingly embrace the integration of knowledge from diverse experts into natural resource management (e.g., [11,46,47,48,49]). However, expert knowledge can be siloed, incomplete, variable, and biased [11,50,51,52]. Despite this, mental models make the implicit explicit, which provides a concrete way of examining the perspectives of experts, including what is fundamental and of value to them [20,49,53]. The usefulness of this information may justify and explain the behavior of individuals or support for certain management.
Our analyses revealed wide diversity in the network structure of mental models. In particular, experts who identified as male or as managers created mental models with fewer receivers than scientists or female participants. Thus, experts and scientists who identified as female tended to characterize the social–ecological system as one in which its drivers generate multiple impacts across the system (cf. [54]). Moreover, female experts also identified more drivers than males; thus, they perceive the Puget Sound system as one where some SES components are impacted by multiple factors (cf. [54]). For example, such experts see the node “Healthy Nearshore Habitat” as being affected by a diversity of direct threats (e.g., nutrients, stormwater pollution, freshwater quality) as well as a variety of indirect drivers (e.g., regulations, agricultural practices, transportation policy, education). The Puget Sound Partnership, the State agency charged with Puget Sound management, defines six management domains (healthy human population, vibrant quality of life, thriving species and food web, protected and restored habitat, abundant water quantity, and healthy water quality) [55]. Thus, the tendency of managers to build models with multiple impacts across the system may reflect the multiple objectives of the State. For example, managers often linked water quality, human community, and health objectives to each other and with ecological objectives. For instance, one participant noted that
“We want to improve stormwater for the health of Puget Sound and the health of people, so that leads to two questions we don’t know. We don’t know how much water quality would need to improve in order to help specific species, and we don’t know how much nature in communities we would need to have a positive impact on several different aspect of human communities, whether it be individual health, or community cohesion, or improving the water into human communities”
Our analysis of the models using Ostrom’s SES framework revealed differences between the SES elements on which experts focused, and contained individual and group discourses that justified and explained the experts’ behavior [53,56,57,58,59]. Managers were much more likely to emphasize aspects of governance in their models, while scientists were more likely to highlight resource units. This may be because scientists often focus on the ecological components of the system, while managers are required to meet regulatory standards. Our findings support the notion that incorporating a diverse range of expertise is necessary to fully conceptualize management plans for the Puget Sound stormwater SES. Therefore, to completely conceptualize the Puget Sound stormwater SES and to fully consider the potential consequences of different management actions or policies, managers and scientists must both be included to ensure all facets of the SES are considered.
Incorporating a diversity of perspectives into management may lead to outcomes that are enduring, because it makes knowledge structures less rigid and more adaptive to change [20,60,61,62]. However, including diverse perspectives can introduce some challenges. Indeed, knowledge diversity can lead to conflict and, sometimes, may even be counter-productive [15,63]. For example, diverse perceptions of the structure or function of social–ecological systems can lead to conflicts over where to intervene or where there are “leverage points” in a resource system [15,20,24]. Additionally, diverse perceptions of functional goals of management can lead to conflict over the appropriate management actions to take [64,65,66].
One means of overcoming such conflicts is participatory modeling—an approach for including a broad group of actors in the process of developing and implementing scientific models [67]. The work we conducted here is a necessary pre-cursor to participatory modeling approaches using a diversity of methodologies, including Bayesian Belief Networks (e.g., [9]), Qualitative Network Models (e.g., [68,69], and Fuzzy Cognitive Models (e.g., [12,21]). Moving from the static mental models we created here to more dynamic models that could be used to test the efficacy of alternative management strategies requires a more detailed understanding of the strength of the linkages among nodes (for Fuzzy Cognitive Models) or joint probability distributions (for Bayesian Networks) [70]. While such models will require additional effort and engagement, they have proven to be effective in reaching a consensus regarding the direction that management actions should take [22,71]. Importantly, our work highlights the fact that effective participatory modeling will require input from both scientists and managers to capture the complete social–ecological system. Thus, future work will advance more effectively when individuals and institutions who are skilled boundary spanners are engaged, as they will be able to foster transparent discussions and expose unconscious biases and assumptions [72,73]. Ultimately, as conservation scientists increasingly embrace and integrate community values, we expect better and more durable outcomes for both nature and humans.
5. Conclusions
The recognized importance of stormwater mitigation to the health of Puget Sound requires prompt research and action [33]. Ideally, conservation action is grounded in strong empirical science; however, conservation science, particularly that informing restoration at local scales, is often inelegant, ambiguous, and uncertain (e.g., [73]). Given the substantial repercussions regarding human and ecological well-being that conservation actions can have, in conjunction with limited conventional scientific information, it is clearly necessary to broaden participation and knowledge sources to include all those who can contribute. Equally important is that broadening project goals and outcomes to include community needs builds support for actions that benefit conservation.
In the face of a degraded Puget Sound ecosystem [74], our work highlights that addressing the stormwater problem requires that we embrace human as well as ecological processes, and innovative solutions leading towards transformative progress will most likely emerge from processes that include the varied perspectives of scientists, managers, and stakeholders. Moreover, it is clear that the diverse stormwater experts in the Puget Sound region have cogent views on system connections, and this shines a light on specific ecological and socioeconomic research that could inform future management decisions. Indeed, incorporating the diverse perspectives of regional experts within the context of the Puget Sound social–ecological system provides a promising path towards the lasting and durable recovery of Puget Sound. Rich, collaborative processes, though time- and resource-intensive, are critical for success in environmental management [49]. We highlight here that such an approach, built on genuine engagement with experts, yields a picture of the social–ecological system that is better positioned to advance the needs of both nature and humans.
Author Contributions
Conceptualization, C.B.O. and P.S.L.; methodology, C.B.O. and P.S.L.; data collection and analysis, C.B.O.; writing—original draft preparation, C.B.O.; writing—review and editing, P.S.L.; supervision, P.S.L.; project administration, P.S.L.; funding acquisition, P.S.L. All authors have read and agreed to the published version of the manuscript.
Funding
This research was funded by gift from the Boeing Company.
Data Availability Statement
Individual mental models summarized in this paper are available in graphical and tabular form here: https://digital.lib.washington.edu/researchworks/handle/1773/46013, accessed on 18 January 2023.
Acknowledgments
We are grateful to the staff at The Nature Conservancy in Washington, in particular the Science and Puget Sound teams, as well as the UW Interdisciplinary and Conservation Science Lab for their support. The manuscript was improved by the insightful comments from Emily Howe and Greg Bratman. We thank Ericka Hegeman for creation of the map used in Figure 1. Funding for this project was generously provided by the Boeing Company and the Nature Conservancy of Washington.
Conflicts of Interest
The authors declare no conflict of interest.
Appendix A. Interview Guide
Opening
(Establish rapport) My name is Caitlyn O’Connor and I am a graduate student at SEFS at UW. Based on your knowledge, skills, and abilities, we would like to interview you about stormwater in Puget Sound.
(Introduction) I would like to start by asking a few quick demographic questions and then I will ask you to draw a mental model of the Puget Sound stormwater to marine environment ecosystem.
(Motivation) I’m interested in learning what you believe are the drivers and effects behind the stormwater problem. I understand that your model is no means complete but I want to capture your experience and understanding to provide the start of better stormwater management.
(Privacy) Your privacy is important to me. Your name and this recording will not be linked unless you identify yourself in the recording. Only myself and my graduate advisor, Phillip Levin, will have access to your recordings.
(Timeline) The interview should take about 1 h. I would like to record this conversation to go back and clarify any of your responses as well as be able to draw out the key themes in your responses. Do you provide consent for me to record our discussion? Do you have any questions at this time?
Discuss Research Project
So, as we both know, urbanization is increasing and along with it, the amount of impervious surfaces. Of course, this means that when it rains, the water picks up contaminants that mostly go straight to the closest body of water. This polluted rainwater can harm aquatic life and is making our waterways an unhealthy place to live, work, and play. Today, I’d like to focus our discussion on stormwater in Puget Sound.
I am particularly interested in understanding how experts in stormwater (management or science) perceive this problem’s structure, impacts, and solutions within this urban to marine ecosystem problem.
To look at this land–sea connection, I have decided to use herring as my indicator species. As you know, the Puget Sound Partnership has identified this as one of its vital signs because of its centrality in the food web.
As we move forward, I want to be clear that I am really interested in your perceptions of how the system is structured and functions. I expect that you will have a great deal of uncertainty about some components of the system—that’s okay! Part of my work is understanding where people see key uncertainties and understanding similarities and differences among experts in this field. So, I’m interested in your opinion—whether or not there are quantitative data to back it up. I am looking to see what your experience tells us. How you see the system and the solutions. In essence, I’m investigating the scientists who study or manage stormwater, not the stormwater itself.
General Information
This is the part where I collect data on gender, years of experience, professional affiliation, training, and place of residence.
- Educational background?
- Highest degree, Major, and Where?
- Who is your employer?
- E.g. government, state, local, federal, university, consultant, etc.
- How would you describe your role in stormwater management?
- E.g. science, policy, management, communication
- How long have you worked on this topic?
- Birth year?
- Preferred pronoun?
Transition into Mental Model Exercise
In this mental model exercise, I would like you to sketch out the most important players and interactions in the Puget Sound stormwater system—this could include key drivers of stormwater, the impacts of stormwater, and ways to mitigate stormwater—so anything like species, habitats, human activity, threats, predator–prey relationship, or factors affecting stormwater. You can focus on whatever you like or a combination of all.
I have three requirements.
You must include stormwater and herring.
You then get 18 more nodes. You can use as many or few of those 18 as you would like.
And you should draw arrows illustrating the interactions between the nodes. They can be positive or negative interactions—and you can illustrate these , +, ++. Arrows can go both ways, and they don’t have to be symmetrical.
For example, seal predation might be strongly negative for salmon (), but salmon might only have a moderately positive interaction on seals (+) if seals eat lots of different kinds of fish.
Conceptual Model Activity
I would ask this for anything directly connected to stormwater and herring and would ask these similar questions.
- How much stormwater needs to be treated to ensure a healthy Puget Sound?
- I see that you put a (negative/0/positive) from (stormwater to herring/species), I’m wondering how much would you guess that I have to reduce this toxicity to change this negative to a zero?
- Would you say 50% or would I have to get rid of all of it?
- Like what is your ballpark guess?
- How confident are you on a scale from 0 to 100%?
- How would this change make the Puget Sound species respond?
- How come?
- Would you expect to see a response higher in some species rather than others?
- Would some species decline if stormwater pollution decreased?
- If they have other species on their mental model
- Which species are most at risk?
- What is the dynamic response of the food web?
- How would you describe the difference between one negative/positive to two negative/positives?
- Ask them to clarify what they mean by each relationship.
- Ask them to define the node.
Closing
(summarize)
(maintain rapport) I appreciate the time you took for this interview.
Is there anything you would like to add?
Have we missed something you think is important?
What else should we talk about regarding this issue/topic?
(action to be taken) I should have all the information I need. Would it be alright to call/email you if I have any more questions?
Thanks again.
Appendix B
Figure A1.
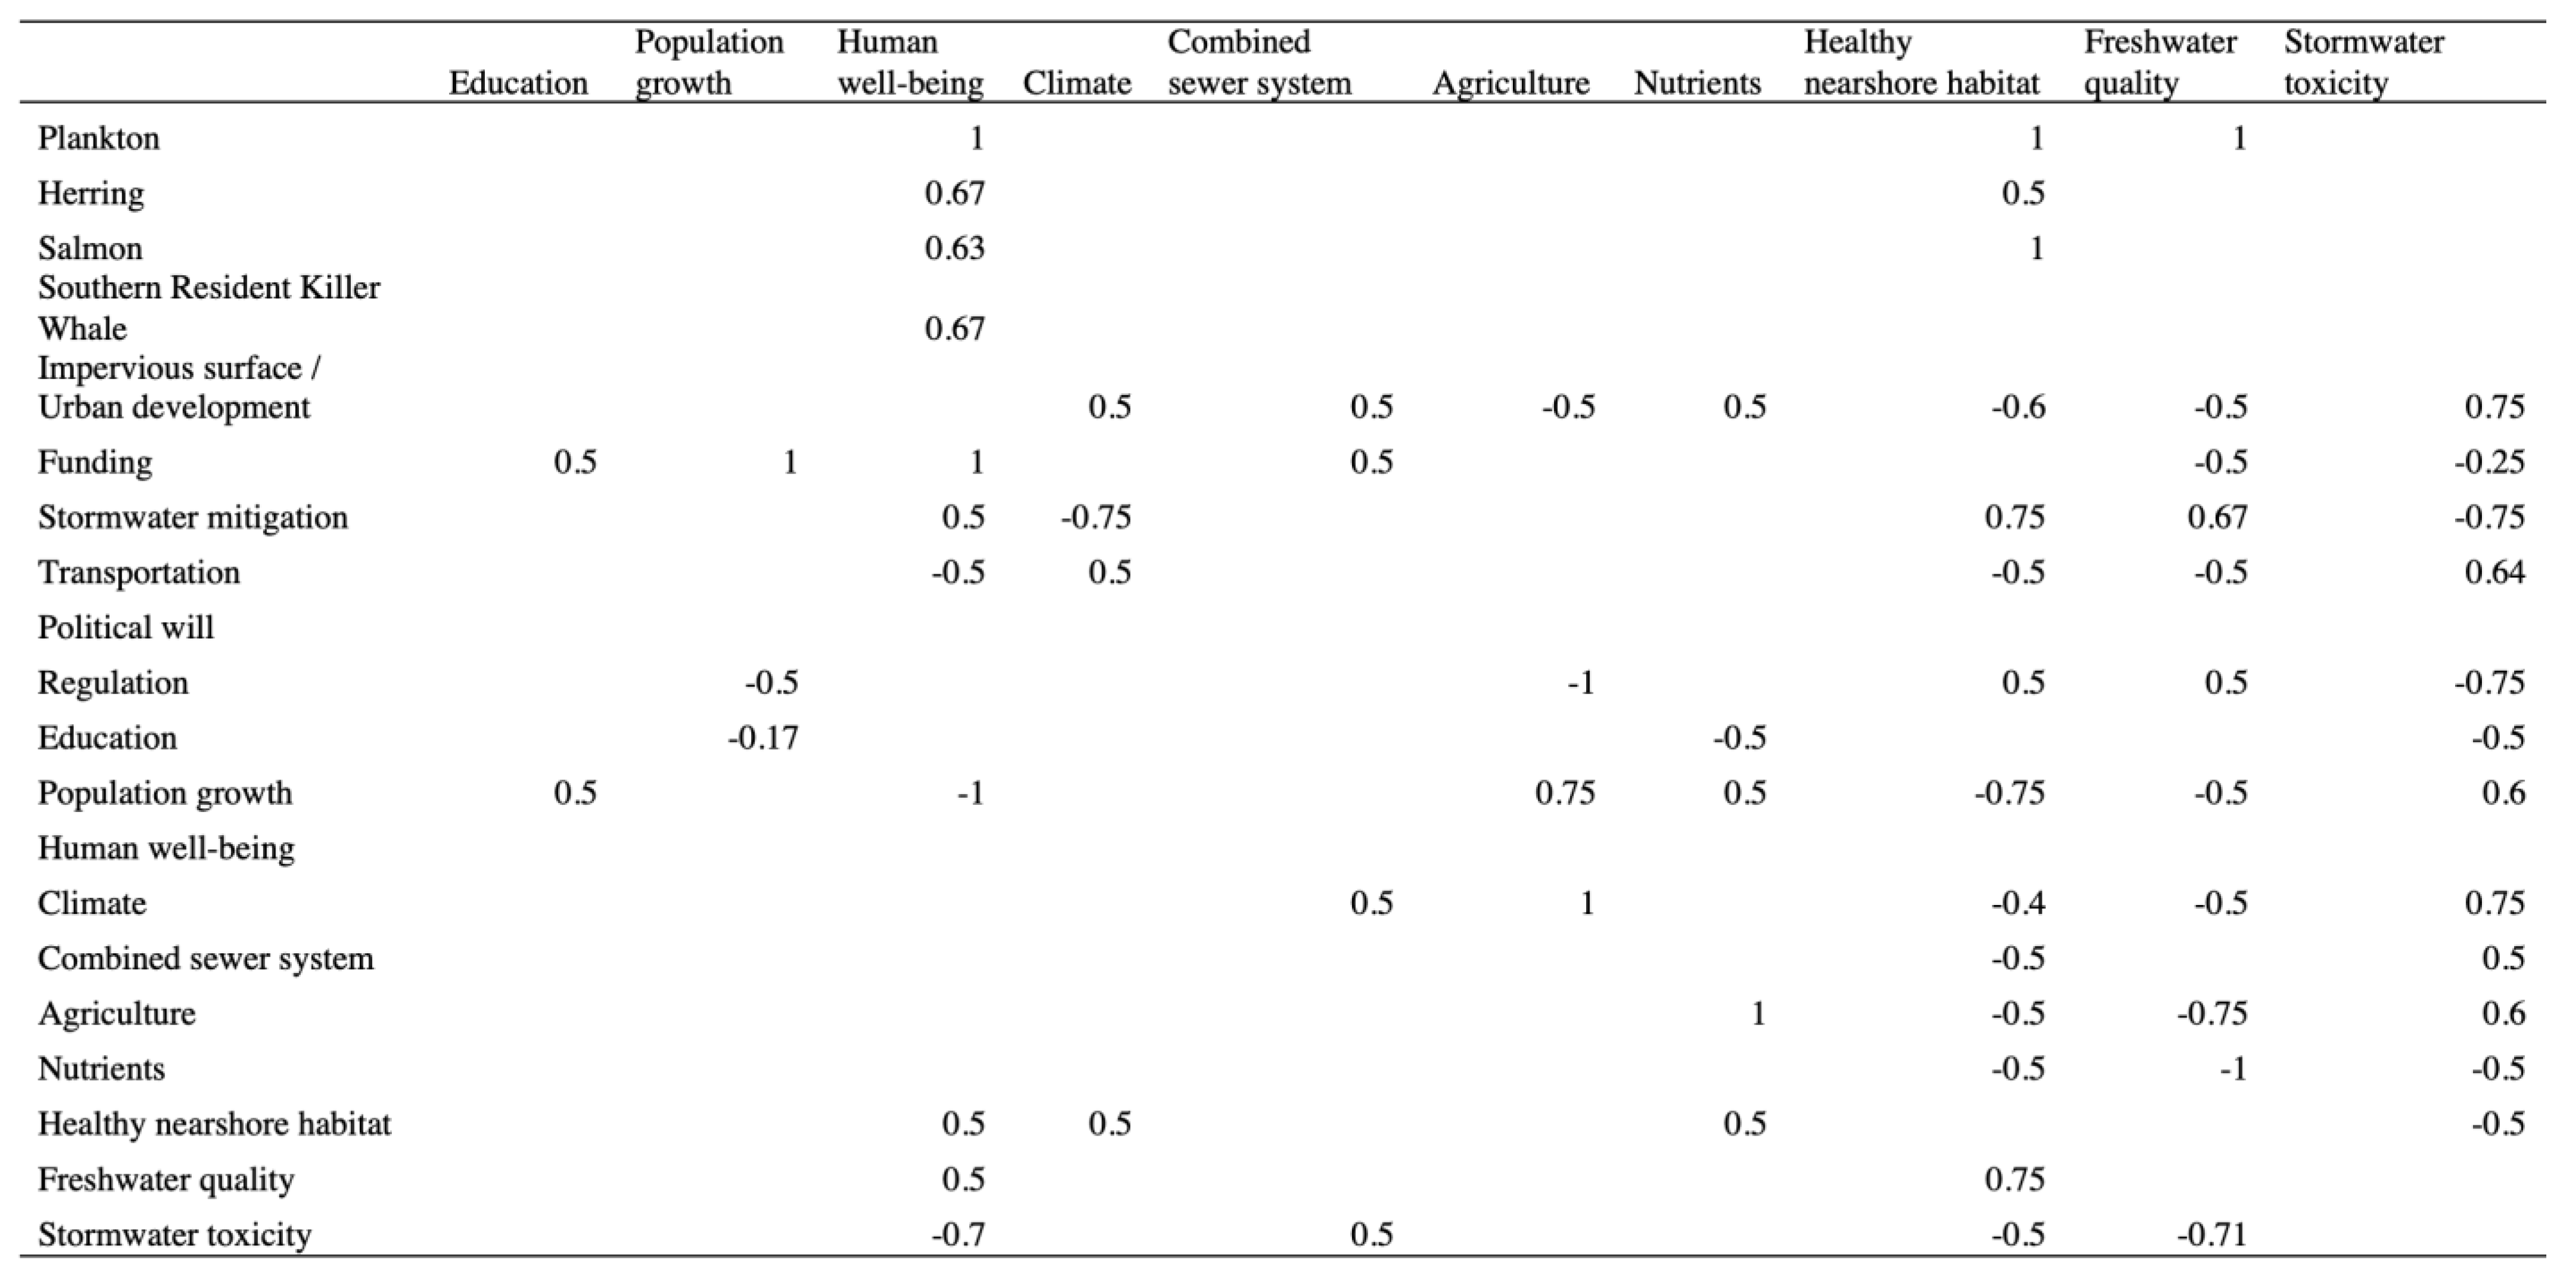
Matrix representation of the aggregate mental model of the Puget Sound stormwater social–ecological system shown in Figure 2. The aggregate model integrates information from all experts interviewed in the study. Numbers represent interaction strengths between nodes in the mental model and were estimated by averaging interaction strengths from individual mental models. See methods for more details.
Figure A1.
Matrix representation of the aggregate mental model of the Puget Sound stormwater social–ecological system shown in Figure 2. The aggregate model integrates information from all experts interviewed in the study. Numbers represent interaction strengths between nodes in the mental model and were estimated by averaging interaction strengths from individual mental models. See methods for more details.


References
- Folke, C.; Biggs, R.; Norström, A.V.; Reyers, B.; Rockström, J. Social-Ecological Resilience and Biosphere-Based Sustainability Science. Ecol. Soc. 2016, 21, 43. [Google Scholar] [CrossRef]
- Leach, M.; Rockström, J.; Raskin, P.; Scoones, I.; Stirling, A.C.; Smith, A.; Thompson, J.; Millstone, E.; Ely, A.; Arond, E.; et al. Transforming Innovation for Sustainability. Ecol. Soc. 2012, 17, 11. [Google Scholar] [CrossRef] [Green Version]
- Clark, W.C.; Munn, R.E. Sustainable Development of the Biosphere; Cambridge University Press: Cambridge, UK, 1986. [Google Scholar]
- Gray, S.; Sterling, E.J.; Aminpour, P.; Goralnik, L.; Singer, A.; Wei, C.; Akabas, S.; Jordan, R.C.; Giabbanelli, P.J.; Hodbod, J.; et al. Assessing (Social-Ecological) Systems Thinking by Evaluating Cognitive Maps. Sustainability 2019, 11, 5753. [Google Scholar] [CrossRef] [Green Version]
- Ostrom, E. A General Framework for Analyzing Sustainability of Social-Ecological Systems. Science 2009, 325, 419–422. [Google Scholar] [CrossRef] [PubMed]
- Levin, P.S.; Poe, M.R. Conservation for the Anthropocene Ocean: Interdisciplinary Science for Nature and People; Academic Press: London, UK, 2017. [Google Scholar]
- McGinnis, M.D.; Ostrom, E. Social-Ecological System Framework: Initial Changes and Continuing Challenges. Ecol. Soc. 2014, 19, 30. [Google Scholar] [CrossRef] [Green Version]
- Del Mar Delgado-Serrano, M.; Ramos, P. Making Ostrom’s Framework Applicable to Characterise Social Ecological Systems at the Local Level. Int. J. Commons 2015, 9, 808–830. [Google Scholar] [CrossRef]
- Rehr, A.P.; Williams, G.D.; Tolimieri, N.; Levin, P.S. Impacts of Terrestrial and Shoreline Stressors on Eelgrass in Puget Sound: An Expert Elicitation. Coast. Manag. 2014, 42, 246–262. [Google Scholar] [CrossRef]
- Burgman, M.; Carr, A.; Godden, L.; Gregory, R.; McBride, M.; Flander, L.; Maguire, L. Redefining Expertise and Improving Ecological Judgment. Conserv. Lett. 2011, 4, 81–87. [Google Scholar] [CrossRef]
- Martin, T.G.; Burgman, M.A.; Fidler, F.; Kuhnert, P.M.; Low-Choy, S.; Mcbride, M.; Mengersen, K. Eliciting Expert Knowledge in Conservation Science. Conserv. Biol. 2012, 26, 29–38. [Google Scholar] [CrossRef] [Green Version]
- Stier, A.C.; Samhouri, J.F.; Gray, S.; Martone, R.G.; Mach, M.E.; Halpern, B.S.; Kappel, C.V.; Scarborough, C.; Levin, P.S. Integrating Expert Perceptions into Food Web Conservation and Management. Conserv. Lett. 2016, 10, 67–76. [Google Scholar] [CrossRef]
- Dietz, T. Bringing Values and Deliberation to Science Communication. Proc. Natl. Acad. Sci. USA 2013, 110, 14081–14087. [Google Scholar] [CrossRef] [PubMed] [Green Version]
- Morgan, D.L. Integrating Qualitative and Quantitative Methods: A Pragmatic Approach; SAGE Publications, Inc.: London, UK, 2014; ISBN 978-0-7619-1523-2. [Google Scholar]
- Levin, P.S.; Gray, S.A.; Möllmann, C.; Stier, A.C. Perception and Conflict in Conservation: The Rashomon Effect. Bioscience 2020, 71, 64–72. [Google Scholar] [CrossRef]
- Elsawah, S.; Guillaume, J.H.; Filatova, T.; Rook, J.; Jakeman, A.J. A Methodology for Eliciting, Representing, and Analysing Stakeholder Knowledge for Decision Making on Complex Socio-Ecological Systems: From Cognitive Maps to Agent-Based Models. J. Environ. Manag. 2015, 151, 500–516. [Google Scholar] [CrossRef]
- Özesmi, U.; Özesmi, S.L. Ecological Models Based on People’s Knowledge: A Multi-Step Fuzzy Cognitive Mapping Approach. Ecol. Model. 2004, 176, 43–64. [Google Scholar] [CrossRef] [Green Version]
- Vasslides, J.M.; Jensen, O.P. Quantitative vs. Semiquantitative Ecosystem Models: Comparing Alternate Representations of an Estuarine Ecosystem. J. Coast. Res. 2017, 78, 287–296. [Google Scholar] [CrossRef]
- Ziegler, J.P.; Jones, S.E.; Solomon, C.T. Local Stakeholders Understand Recreational Fisheries as Social-Ecological Systems but Do Not View Governance Systems as Influential for System Dynamics. Int. J. Commons 2019, 13, 1035–1048. [Google Scholar] [CrossRef]
- Gray, S.; Chan, A.; Clark, D.; Jordan, R. Modeling the Integration of Stakeholder Knowledge in Social–Ecological Decision-Making: Benefits and Limitations to Knowledge Diversity. Ecol. Model. 2012, 229, 88–96. [Google Scholar] [CrossRef]
- Gray, S.A.; Gray, S.; de Kok, J.L.; Helfgott, A.E.R.; O’Dwyer, B.; Jordan, R.; Nyaki, A. Using Fuzzy Cognitive Mapping as a Participatory Approach to Analyze Change, Preferred States, and Perceived Resilience of Social-Ecological Systems. Ecol. Soc. 2015, 20, 11. [Google Scholar] [CrossRef]
- Gray, S.; Jordan, R.; Crall, A.; Newman, G.; Hmelo-Silver, C.; Huang, J.; Novak, W.; Mellor, D.; Frensley, T.; Prysby, M.; et al. Combining Participatory Modelling and Citizen Science to Support Volunteer Conservation Action. Biol. Conserv. 2017, 208, 76–86. [Google Scholar] [CrossRef] [Green Version]
- Henly-Shepard, S.; Gray, S.A.; Cox, L.J. The Use of Participatory Modeling to Promote Social Learning and Facilitate Community Disaster Planning. Environ. Sci. Policy 2015, 45, 109–122. [Google Scholar] [CrossRef]
- Nyaki, A.; Gray, S.A.; Lepczyk, C.A.; Skibins, J.C.; Rentsch, D. Local-Scale Dynamics and Local Drivers of Bushmeat Trade. Conserv. Biol. 2014, 28, 1403–1414. [Google Scholar] [CrossRef] [PubMed]
- Puget Sound Regional Council 2050 Forecast of People and Jobs; Puget Sound Regional Council: Seattle WA, USA, 2018; Available online: https://www.psrc.org/planning-2050/vision-2050 (accessed on 18 January 2023).
- Ruckelshaus, M.; Essington, T.; Levin, P. Puget Sound, Washington, USA. In Ecosystem-Based Management for the Oceans; McLeod, K., Leslie, H., Eds.; Island Press: Washington, DC, USA, 2009; pp. 201–226. [Google Scholar]
- Baker, J.; Biedenweg, K.; Birkeland, C.; Christie, P.J.; Dunagan, C.; Francis, T.; Gaydos, J.; Genther, K.; Georgiadis, N.; Howe, E.; et al. Puget Sound Factbook Version 3; University of Washington: Tacoma, WA, USA, 2015. [Google Scholar]
- James, C.A.; Lanksbury, J.; Khangaonkar, T.; West, J. Evaluating Exposures of Bay Mussels (Mytilus trossulus) to Contaminants of Emerging Concern through Environmental Sampling and Hydrodynamic Modeling. Sci. Total. Environ. 2019, 709, 136098. [Google Scholar] [CrossRef] [PubMed]
- Krahn, M.M.; Hanson, M.B.; Baird, R.W.; Boyer, R.H.; Burrows, D.G.; Emmons, C.K.; Ford, J.K.; Jones, L.L.; Noren, D.P.; Ross, P.S.; et al. Persistent Organic Pollutants and Stable Isotopes in Biopsy Samples (2004/2006) from Southern Resident Killer Whales. Mar. Pollut. Bull. 2007, 54, 1903–1911. [Google Scholar] [CrossRef] [PubMed]
- Tian, Z.; Zhao, H.; Peter, K.T.; Gonzalez, M.; Wetzel, J.; Wu, C.; Hu, X.; Prat, J.; Mudrock, E.; Hettinger, R.; et al. A Ubiquitous Tire Rubber–Derived Chemical Induces Acute Mortality in Coho Salmon. Science 2021, 371, 185–189. [Google Scholar] [CrossRef] [PubMed]
- Incardona, J.P.; Carls, M.G.; Holland, L.; Linbo, T.L.; Baldwin, D.H.; Myers, M.S.; Peck, K.A.; Tagal, M.; Rice, S.D.; Scholz, N. Very Low Embryonic Crude Oil Exposures Cause Lasting Cardiac Defects in Salmon and Herring. Sci. Rep. 2015, 5, 13499. [Google Scholar] [CrossRef] [PubMed] [Green Version]
- Mongillo, T.M.; Ylitalo, G.M.; Rhodes, L.D.; O’Neill, S.M.; Noren, D.P.; Hanson, B.M. Exposure to a Mixture of Toxic Chemicals: Implications for the Health of Endangered Southern Resident Killer Whales. NOAA Tech. Memo. 2016, 107, 1–118. [Google Scholar] [CrossRef]
- Levin, P.S.; Howe, E.R.; Robertson, J.C. Impacts of Stormwater on Coastal Ecosystems: The Need to Match the Scales of Management Objectives and Solutions. Philos. Trans. R. Soc. B Biol. Sci. 2020, 375, 20190460. [Google Scholar] [CrossRef]
- Bernard, H.R. Social Research Methods; Sage: Los Angeles, CA, USA, 2011. [Google Scholar]
- Carley, K.; Palmquist, M. Extracting, Representing, and Analyzing Mental Models. Soc. Forces 1992, 70, 601–636. [Google Scholar] [CrossRef]
- Puget Sound Partnership The 2022-2026 Action Agenda for Puget Sound; Puget Sound Partnership. Available online: https://www.psp.wa.gov/2022AAupdate.php/ (accessed on 13 January 2023).
- Harvey, C.J.; Williams, G.D.; Levin, P.S. Food Web Structure and Trophic Control in Central Puget Sound. Estuaries Coasts 2012, 35, 821–838. [Google Scholar] [CrossRef]
- West, J.E.; O’Neill, S.M.; Ylitalo, G.M. Time Trends of Persistent Organic Pollutants in Benthic and Pelagic Indicator Fishes from Puget Sound, Washington, USA. Arch. Environ. Contam. Toxicol. 2017, 73, 207–229. [Google Scholar] [CrossRef]
- Cabin, R.J.; Mitchell, R.J. To Bonferroni or Not to Bonferroni: When and How Are the Questions. Bull. Ecol. Soc. Am. 2000, 81, 246–248. [Google Scholar]
- Oksanen, J.; Blanchet, F.G.; Kindt, R.; Legendre, P.; Minchin, P.R.; O’hara, R.B.; Simpson, G.L.; Solymos, P.; Stevens, M.H.H.; Wagner, H. Package ‘Vegan’: Community Ecology Package; R Package Version 2.5-6; 2017. Available online: https://cran.r-project.org/web/packages/vegan/vegan.pdf (accessed on 18 January 2023).
- O’Connor, C.B. Variation in Perceptions of the Stormwater Social-Ecological System in Puget Sound: Insights for Management Across the Land-Sea Interface; University of Washington: Seattle, WA, USA, 2020; ISBN 9798662579101. [Google Scholar]
- Ghermandi, A.; Nunes, P.A.D. A Global Map of Coastal Recreation Values: Results from a Spatially Explicit Meta-Analysis. Ecol. Econ. 2013, 86, 1–15. [Google Scholar] [CrossRef]
- King, O.H. Estimating the Value of Marine Resources: A Marine Recreation Case. Ocean Coast. Manag. 1995, 27, 129–141. [Google Scholar] [CrossRef] [Green Version]
- Poe, M.R.; Norman, K.C.; Levin, P.S. Cultural Dimensions of Socioecological Systems: Key Connections and Guiding Principles for Conservation in Coastal Environments. Conserv. Lett. 2013, 7, 166–175. [Google Scholar] [CrossRef]
- Safford, T.G.; Norman, K.C.; Henly, M.; Mills, K.E.; Levin, P.S. Environmental Awareness and Public Support for Protecting and Restoring Puget Sound. Environ. Manag. 2014, 53, 757–768. [Google Scholar] [CrossRef]
- Farr, B.D.; Otto, C.M.; Szymczak, J.E. Expert Perspectives on the Performance of Explosive Detection Canines: Operational Requirements. Animals 2021, 11, 1976. [Google Scholar] [CrossRef]
- Jalkanen, J.; Vierikko, K.; Moilanen, A. Spatial Prioritization for Urban Biodiversity Quality Using Biotope Maps and Expert Opinion. Urban For. Urban Green. 2020, 49, 126586. [Google Scholar] [CrossRef]
- Tarancón, A.A.; Kim, Y.-S.; Padilla, T.; Fulé, P.Z.; Meador, A.J.S. Co-construction of Ecosystem Services Management in Tribal Lands: Elicit Expert Opinion Approach. Weather. Clim. Soc. 2020, 12, 487–499. [Google Scholar] [CrossRef]
- Reed, M.S. Stakeholder Participation for Environmental Management: A Literature Review. Biol. Conserv. 2008, 141, 2417–2431. [Google Scholar] [CrossRef]
- Hemming, V.; Hanea, A.M.; Walshe, T.; Burgman, M.A. Weighting and Aggregating Expert Ecological Judgments. Ecol. Appl. 2020, 30, e02075. [Google Scholar] [CrossRef]
- Crawford, B.A.; Olds, M.J.; Maerz, J.C.; Moore, C.T. Estimating Population Persistence for At-Risk Species Using Citizen Science Data. Biol. Conserv. 2020, 243, 108489. [Google Scholar] [CrossRef]
- McAndrew, T.; Wattanachit, N.; Gibson, G.C.; Reich, N.G. Aggregating Predictions from Experts: A Review of Statistical Methods, Experiments, and Applications. WIREs Comput. Stat. 2020, 13, e1514. [Google Scholar] [CrossRef] [PubMed]
- Siqueiros-García, J.M.; Lerner, A.M.; Eakin, H.C.; Aguilar, B.H. A Standardization Process for Mental Model Analysis in Socio-ecological Systems. Environ. Model. Softw. 2018, 112, 108–111. [Google Scholar] [CrossRef]
- Levy, M.A.; Lubell, M.N.; McRoberts, N. The Structure of Mental Models of Sustainable Agriculture. Nat. Sustain. 2018, 1, 413–420. [Google Scholar] [CrossRef]
- Puget Sound Partnership Puget Sound Vital Signs. Available online: https://vitalsigns.pugetsoundinfo.wa.gov/ (accessed on 18 January 2023).
- Alexandridis, K.; Takemura, S.; Webb, W.; Lausche, B.; Culter, J.; Sato, T. Semantic Knowledge Network Inference Across a Range of Stakeholders and Communities of Practice. Environ. Model. Softw. 2018, 109, 202–222. [Google Scholar] [CrossRef]
- Hämäläinen, R.P. Behavioural Issues in Environmental Modelling—The Missing Perspective. Environ. Model. Softw. 2015, 73, 244–253. [Google Scholar] [CrossRef]
- Jones, N.A.; Ross, H.; Lynam, T.; Perez, P. Eliciting Mental Models: A Comparison of Interview Procedures in the Context of Natural Resource Management. Ecol. Soc. 2014, 19, 13. [Google Scholar] [CrossRef]
- Singer, A.; Gray, S.; Sadler, A.; Olabisi, L.S.; Metta, K.; Wallace, R.; Lopez, M.C.; Introne, J.; Gorman, M.; Henderson, J. Translating Community Narratives into Semi-Quantitative Models to Understand the Dynamics of Socio-Environmental Crises. Environ. Model. Softw. 2017, 97, 46–55. [Google Scholar] [CrossRef]
- Folke, C. Traditional Knowledge in Social–Ecological Systems. Ecol. Soc. 2004, 9, 7. [Google Scholar] [CrossRef]
- Ludwig, D.; Mangel, M.; Haddad, B. Ecology, Conservation, and Public Policy. Annu. Rev. Ecol. Syst. 2001, 32, 481–517. [Google Scholar] [CrossRef]
- McLain, R.J.; Lee, R.G. Adaptive Management: Promises and Pitfalls. Environ. Manag. 1996, 20, 437–448. [Google Scholar] [CrossRef] [PubMed]
- Varjopuro, R.; Gray, T.; Hatchard, J.; Rauschmayer, F.; Wittmer, H. Introduction: Interaction between Environment and Fisheries—The Role of Stakeholder Participation. Mar. Policy 2008, 32, 147–157. [Google Scholar] [CrossRef]
- Levin, P.S.; Williams, G.D.; Rehr, A.; Norman, K.C.; Harvey, C.J. Developing Conservation Targets in Social-Ecological Systems. Ecol. Soc. 2015, 20, 6. [Google Scholar] [CrossRef] [Green Version]
- Shelton, A.O.; Samhouri, J.F.; Stier, A.C.; Levin, P.S. Assessing Trade-Offs to Inform Ecosystem-Based Fisheries Management of Forage Fish. Sci. Rep. 2014, 4, 7110. [Google Scholar] [CrossRef] [PubMed] [Green Version]
- Stave, K. Participatory System Dynamics Modeling for Sustainable Environmental Management: Observations from Four Cases. Sustainability 2010, 2, 2762–2784. [Google Scholar] [CrossRef] [Green Version]
- Carey, M.P.; Levin, P.S.; Townsend, H.; Minello, T.; Sutton, G.R.; Francis, T.B.; Harvey, C.J.; Toft, J.E.; Arkema, K.K.; Burke, J.L.; et al. Characterizing Coastal Foodwebs with Qualitative Links to Bridge the Gap between the Theory and the Practice of Ecosystem-Based Management. ICES J. Mar. Sci. 2013, 71, 713–724. [Google Scholar] [CrossRef]
- Reum, J.C.P.; McDonald, P.S.; Ferriss, B.E.; Farrell, D.M.; Harvey, C.J.; Levin, P.S. Qualitative Network Models in Support of Ecosystem Approaches to Bivalve Aquaculture. ICES J. Mar. Sci. 2015, 72, 2278–2288. [Google Scholar] [CrossRef] [Green Version]
- Voinov, A.; Bousquet, F. Modelling with Stakeholders. Environ. Model. Softw. 2010, 25, 1268–1281. [Google Scholar] [CrossRef]
- Goulding, R.; Jayasuriya, N.; Horan, E. A Bayesian Network Model to Assess the Public Health Risk Associated with Wet Weather Sewer Overflows Discharging into Waterways. Water Res. 2012, 46, 4933–4940. [Google Scholar] [CrossRef]
- Francis, T.B.; Levin, P.S.; Punt, A.E.; Kaplan, I.C.; Varney, A.; Norman, K. Linking Knowledge to Action in Ocean Ecosystem Management: The Ocean Modeling Forum. Elementa Sci. Anthr. 2018, 6, 63. [Google Scholar] [CrossRef] [Green Version]
- Bednarek, A.T.; Wyborn, C.; Cvitanovic, C.; Meyer, R.; Colvin, R.M.; Addison, P.F.E.; Close, S.L.; Curran, K.; Farooque, M.; Goldman, E.; et al. Boundary Spanning at the Science–Policy Interface: The Practitioners’ Perspectives. Sustain. Sci. 2018, 13, 1175–1183. [Google Scholar] [CrossRef] [PubMed]
- Carwardine, J.; Klein, C.J.; Wilson, K.A.; Pressey, R.L.; Possingham, H.P. Hitting the Target and Missing the Point: Target-Based Conservation Planning in Context. Conserv. Lett. 2009, 2, 4–11. [Google Scholar] [CrossRef]
- Puget Sound Partnership State of the Sound Report. Olympia, Washington. 2019. Available online: www.stateofthesound.wa.gov (accessed on 18 January 2023).
Figure 1.
Map of Puget Sound, USA study region. Urbanized areas are shown in gray, National Parks are shown in dark green.
Figure 1.
Map of Puget Sound, USA study region. Urbanized areas are shown in gray, National Parks are shown in dark green.

Figure 2.
A plot of non-metric multidimensional scaling of individual fuzzy cognitive map-based network analysis. Each point represents a single expert and is derived from the eight metrics of model structure which we calculated from the fuzzy cognitive maps created by experts. Distance: Bray-Curtis; dimensions: 2 (2-dimensional plot represents the data structure well); stress: 0.14 (a stress level <0.2 is good); weak ties, 2 convergent solutions found after 20 tries.

Figure 3.
The aggregate mental model of stormwater experts showing connections among ecological resource units (yellow), the resource system (green), governance and actors (orange), and key externalities (blue). Details of the linkages among nodes can be found in Figure A1.
Figure 3.
The aggregate mental model of stormwater experts showing connections among ecological resource units (yellow), the resource system (green), governance and actors (orange), and key externalities (blue). Details of the linkages among nodes can be found in Figure A1.

Figure 4.
Box plot showing the number of Ostrom’s SES components mentioned by each expert. The circles represent an amount mentioned by an expert. The top of the box represents the 75th percentile, the bottom of the box represents the 25th percentile, and the line in the middle represents the 50th percentile. The whiskers represent the highest and lowest values that are not outliers. The circles beyond the whiskers represent outliers.

Figure 5.
Spearman rank order correlation reveals a positive correlation between centrality of components in an aggregate model derived from stormwater managers and an aggregated model derived from stormwater scientists.
Figure 5.
Spearman rank order correlation reveals a positive correlation between centrality of components in an aggregate model derived from stormwater managers and an aggregated model derived from stormwater scientists.


Table 1.
Structural metrics applied to matrix forms of fuzzy cognitive maps to quantify structural properties of each expert’s perceived food web. Adapted from [12].
Table 1.
Structural metrics applied to matrix forms of fuzzy cognitive maps to quantify structural properties of each expert’s perceived food web. Adapted from [12].
| Mental Model, Structural Measurement | Description of Measure and Cognitive Inference |
|---|---|
| Components | Number of variables included in the model; higher number of concepts indicates more concepts in the mental model |
| Connections | Number of connections included between components; a higher number of connections indicates a higher degree of interaction between components in a mental model |
| Drivers | Components with only arrows out—this means that they are not affected by other components and have influence over other variables, and, consequently, over the entire system |
| Receivers | Components with only arrows in—this means they are impacted by other components, but have no effect on the system |
| Centrality | Absolute value of either (a) overall influence in the model (all + and − relationships indicated, for the entire model), or (b) influence of individual concepts, as indicated by positive (+) or negative (−) values placed on connections between components. Indicates (a) the total influence (positive and negative) in the system or (b) the conceptual weight/importance of individual concepts. The higher the value, the greater the importance of all concepts or the individual weight of a concept in the overall model |
| Complexity | Ratio of receiver variables to transmitter variables. Indicates the degree of resolution and is a measure of the degree to which outcomes of driving forces are considered. Higher complexity indicates more complicated systems. |
| Connections per component (C/N) | Number of connections divided by number of variables (concepts). The lower the C/N score, the higher the degree of connectedness in a system. |
| Density | Number of connections compared to number of all possible connections. The higher the density, the more potential management policies exist [17]. |
Table 2.
Rank centrality scores for components in the mental model created by aggregating all stormwater experts (aggregate model); a model derived by aggregating models from stormwater scientists (scientist rank), and a model derived by aggregating models from stormwater managers (manager rank). Centrality rank is the overall influence in a model, with rank one being the most important and 21 being the least important.
| Mental Model Component | Aggregate Rank | Scientist Rank | Manager Rank |
|---|---|---|---|
| Stormwater | 1 | 1 | 1 |
| Biotic Habitat | 2 | 2 | 2 |
| Management Practices | 8 | 3 | 4 |
| Stormwater Quantity | 6 | 4 | 5 |
| Salmon | 4 | 5 | 9 |
| Impervious Surface | 3 | 6 | 3 |
| Plankton | 14 | 7 | 20 |
| Herring | 11 | 8 | 13 |
| Agriculture | 15 | 9 | 19 |
| Freshwater Quality Health | 9 | 10.5 | 6 |
| Human Well-Being | 10 | 10.5 | 11 |
| Human Population | 7 | 12 | 7 |
| Orcas | 16 | 13 | 15 |
| Climate: Precipitation | 13 | 14 | 12 |
| Economy/Funding | 5 | 15 | 8 |
| Nutrients | 17 | 16 | 14 |
| Regulation | 12 | 17 | 10 |
| Transportation | 18 | 18 | 16 |
| Combined Sewer Overflows | 20 | 19 | 18 |
| Education | 19 | 20 | 17 |
| Politics | 21 | 21 | 21 |
Disclaimer/Publisher’s Note: The statements, opinions and data contained in all publications are solely those of the individual author(s) and contributor(s) and not of MDPI and/or the editor(s). MDPI and/or the editor(s) disclaim responsibility for any injury to people or property resulting from any ideas, methods, instructions or products referred to in the content. |
© 2023 by the authors. Licensee MDPI, Basel, Switzerland. This article is an open access article distributed under the terms and conditions of the Creative Commons Attribution (CC BY) license (https://creativecommons.org/licenses/by/4.0/).
Share and Cite
MDPI and ACS Style
O’Connor, C.B.; Levin, P.S. Mental Models for Assessing Impacts of Stormwater on Urban Social–Ecological Systems. Urban Sci. 2023, 7, 14. https://doi.org/10.3390/urbansci7010014
AMA Style
O’Connor CB, Levin PS. Mental Models for Assessing Impacts of Stormwater on Urban Social–Ecological Systems. Urban Science. 2023; 7(1):14. https://doi.org/10.3390/urbansci7010014
Chicago/Turabian StyleO’Connor, Caitlyn B., and Phillip S. Levin. 2023. "Mental Models for Assessing Impacts of Stormwater on Urban Social–Ecological Systems" Urban Science 7, no. 1: 14. https://doi.org/10.3390/urbansci7010014