
A One-Dimensional Blocking Index Becomes Two-Dimensional Using GIS Technology


Abstract
:1. Introduction
2. Data and Methods
2.1. Data
2.2. Methods
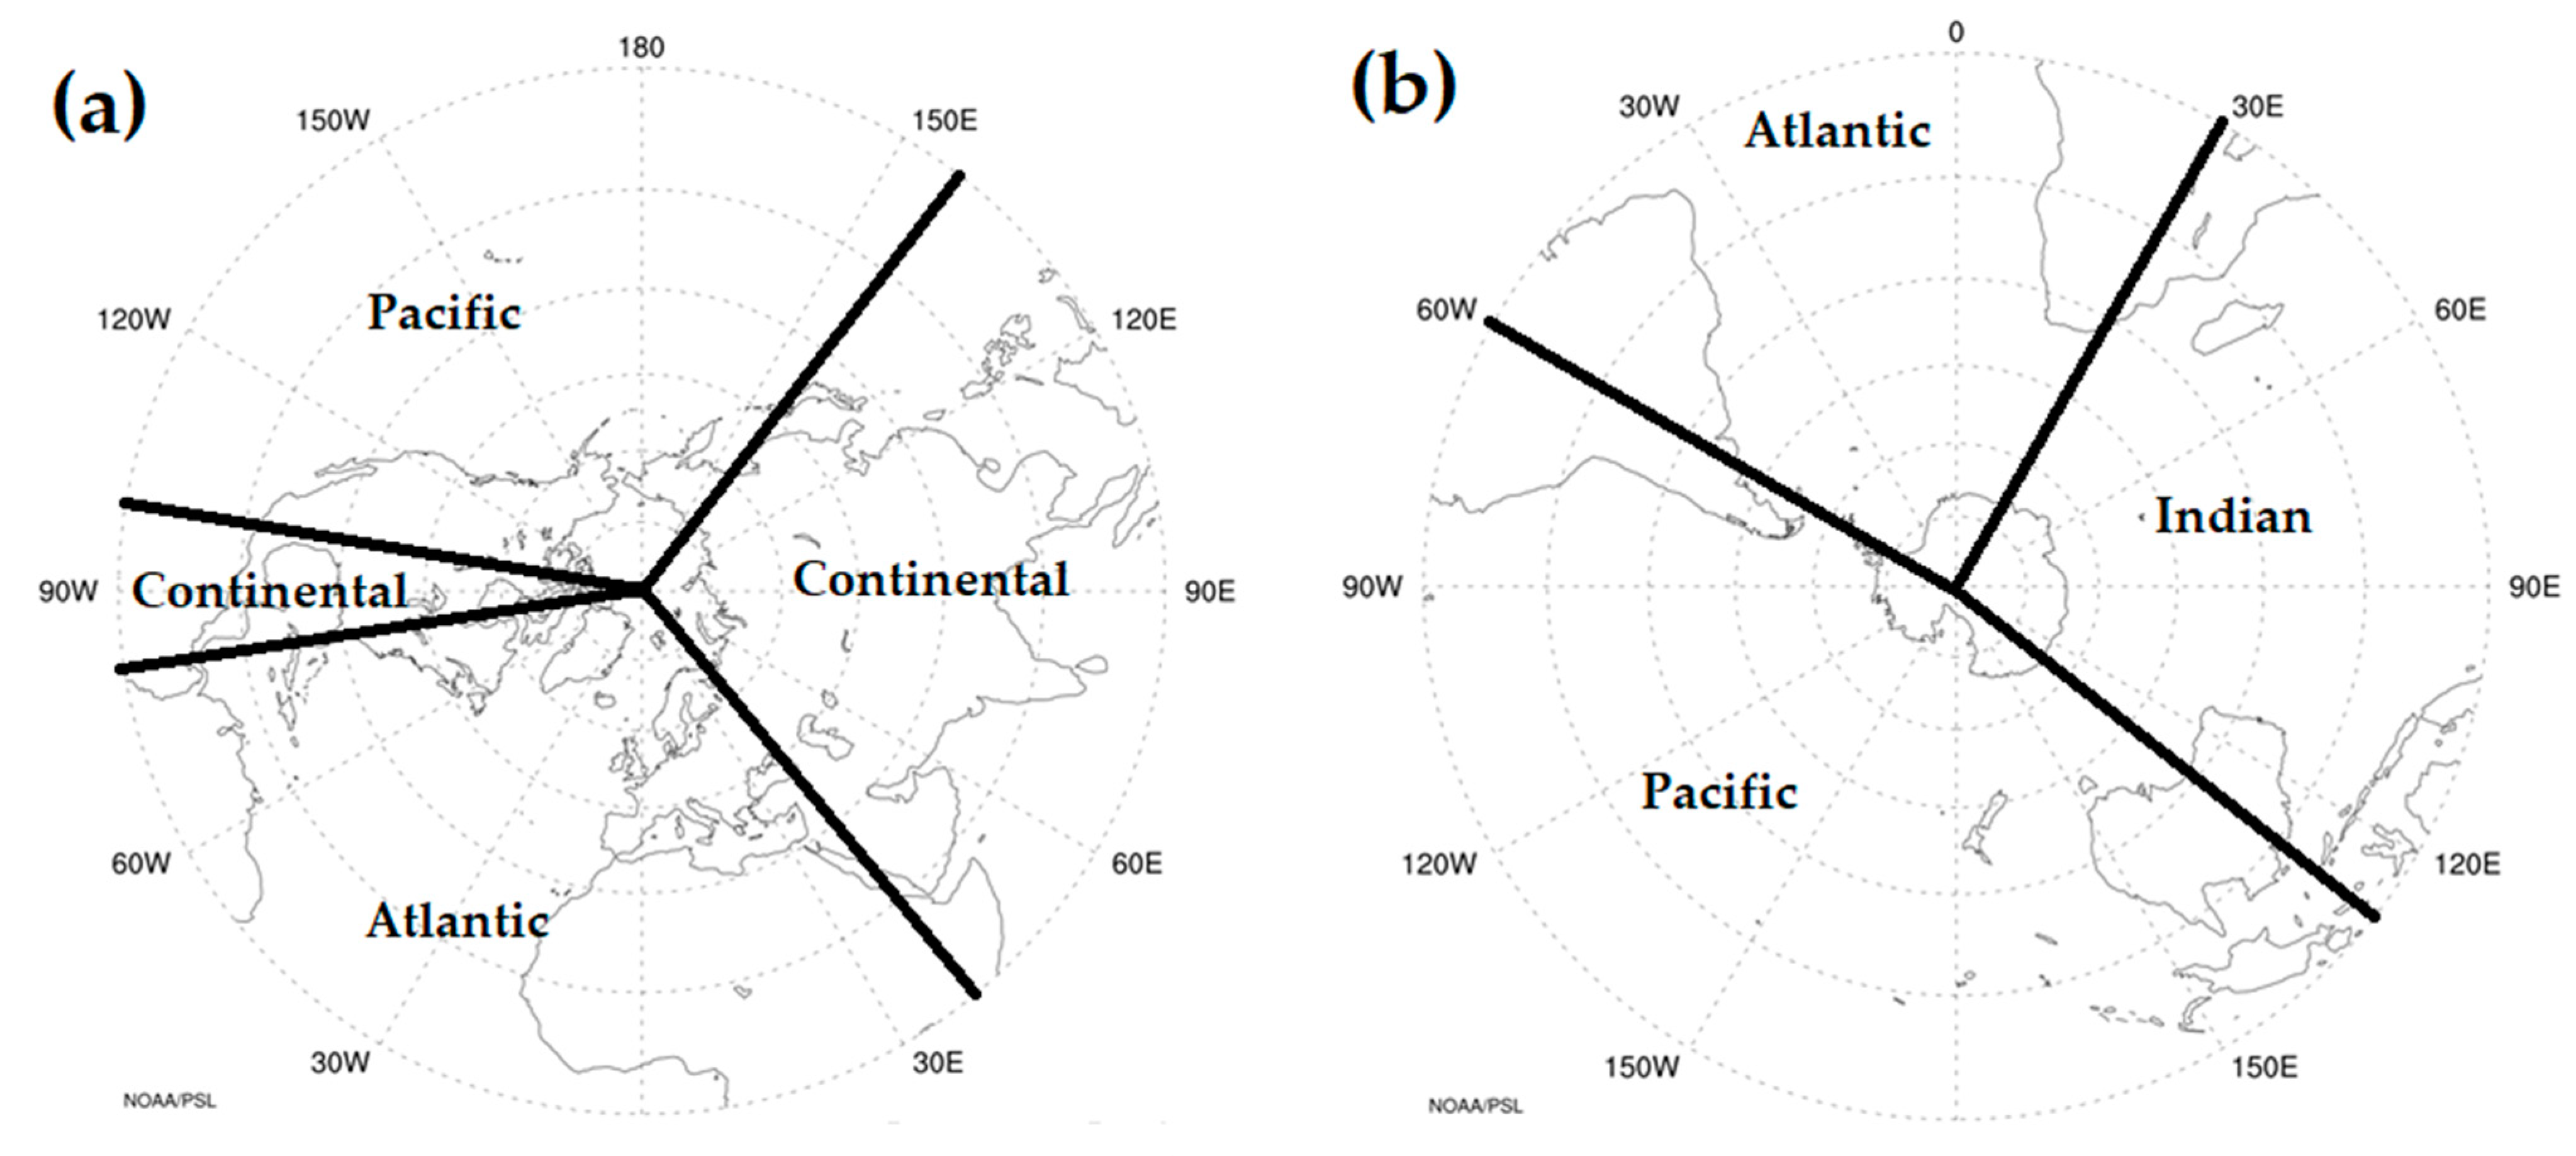
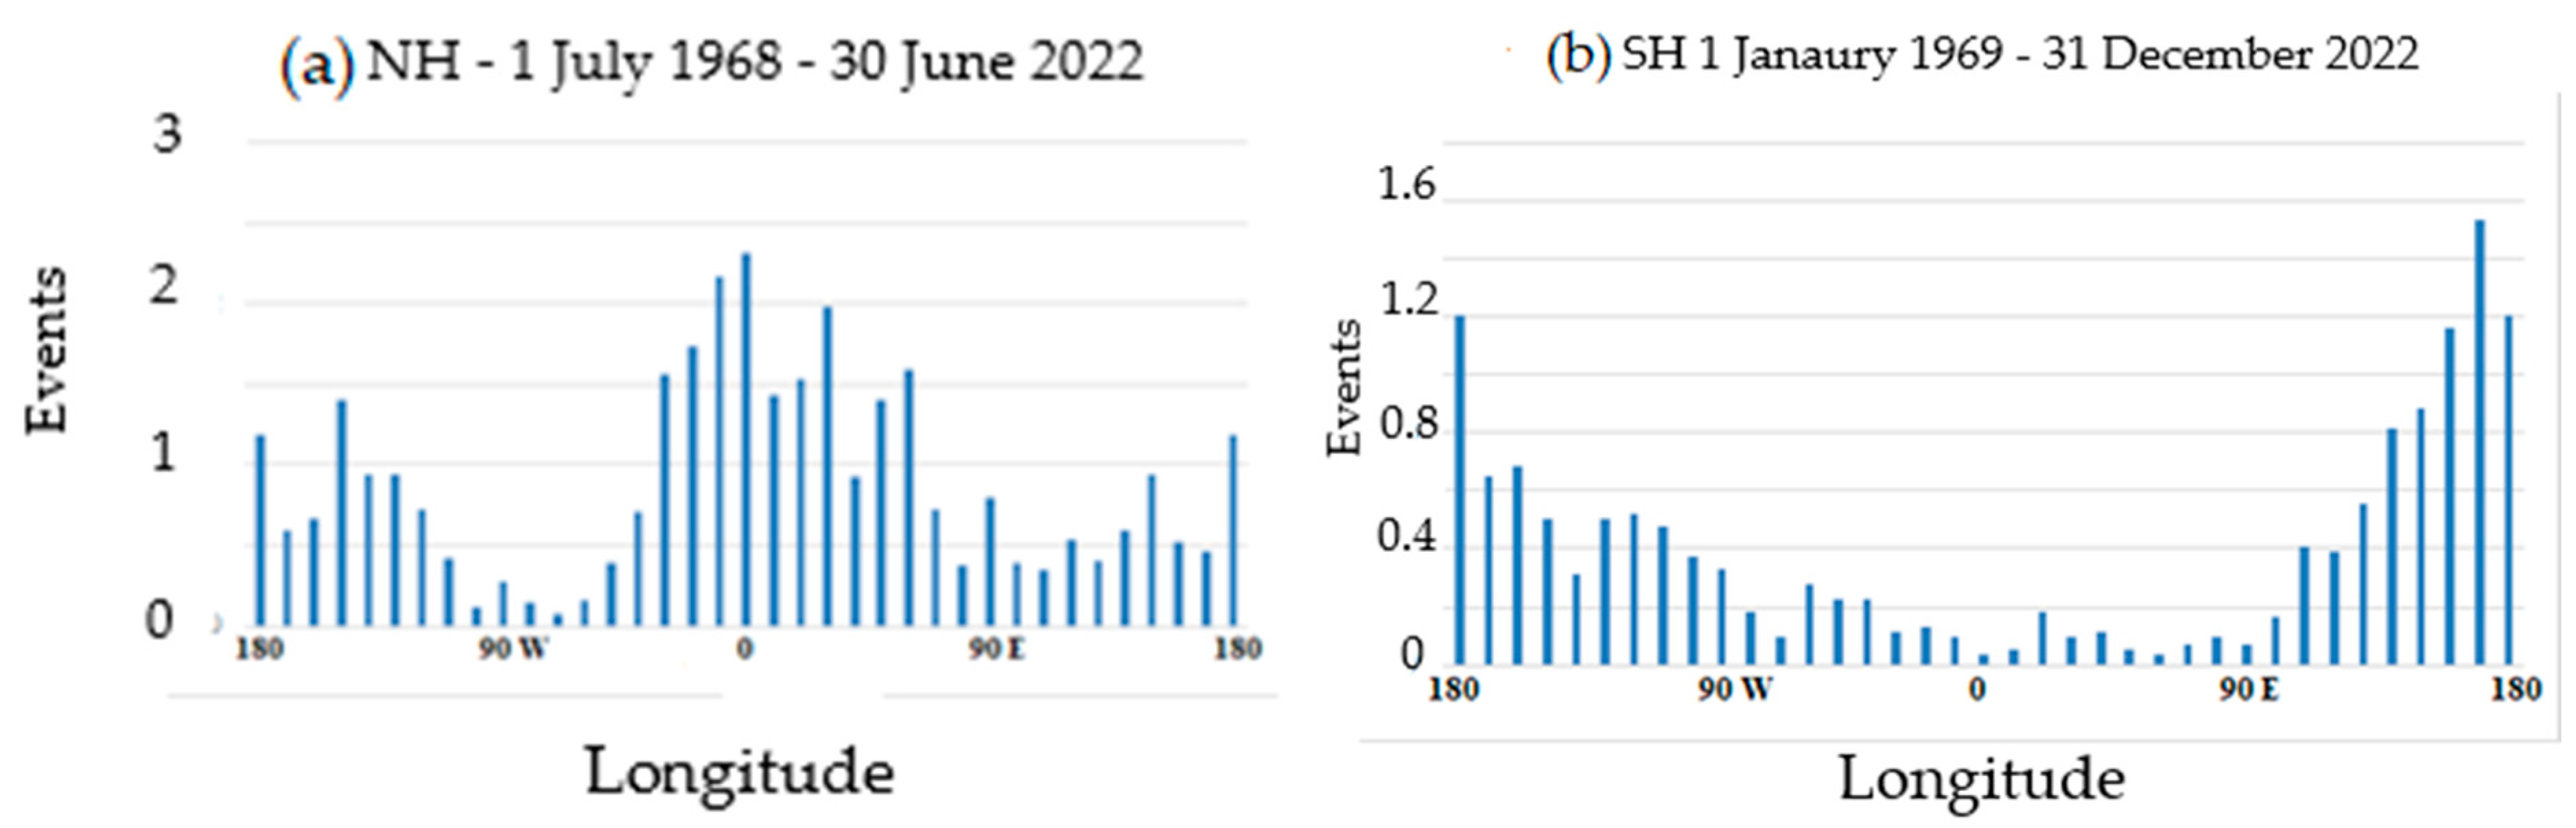
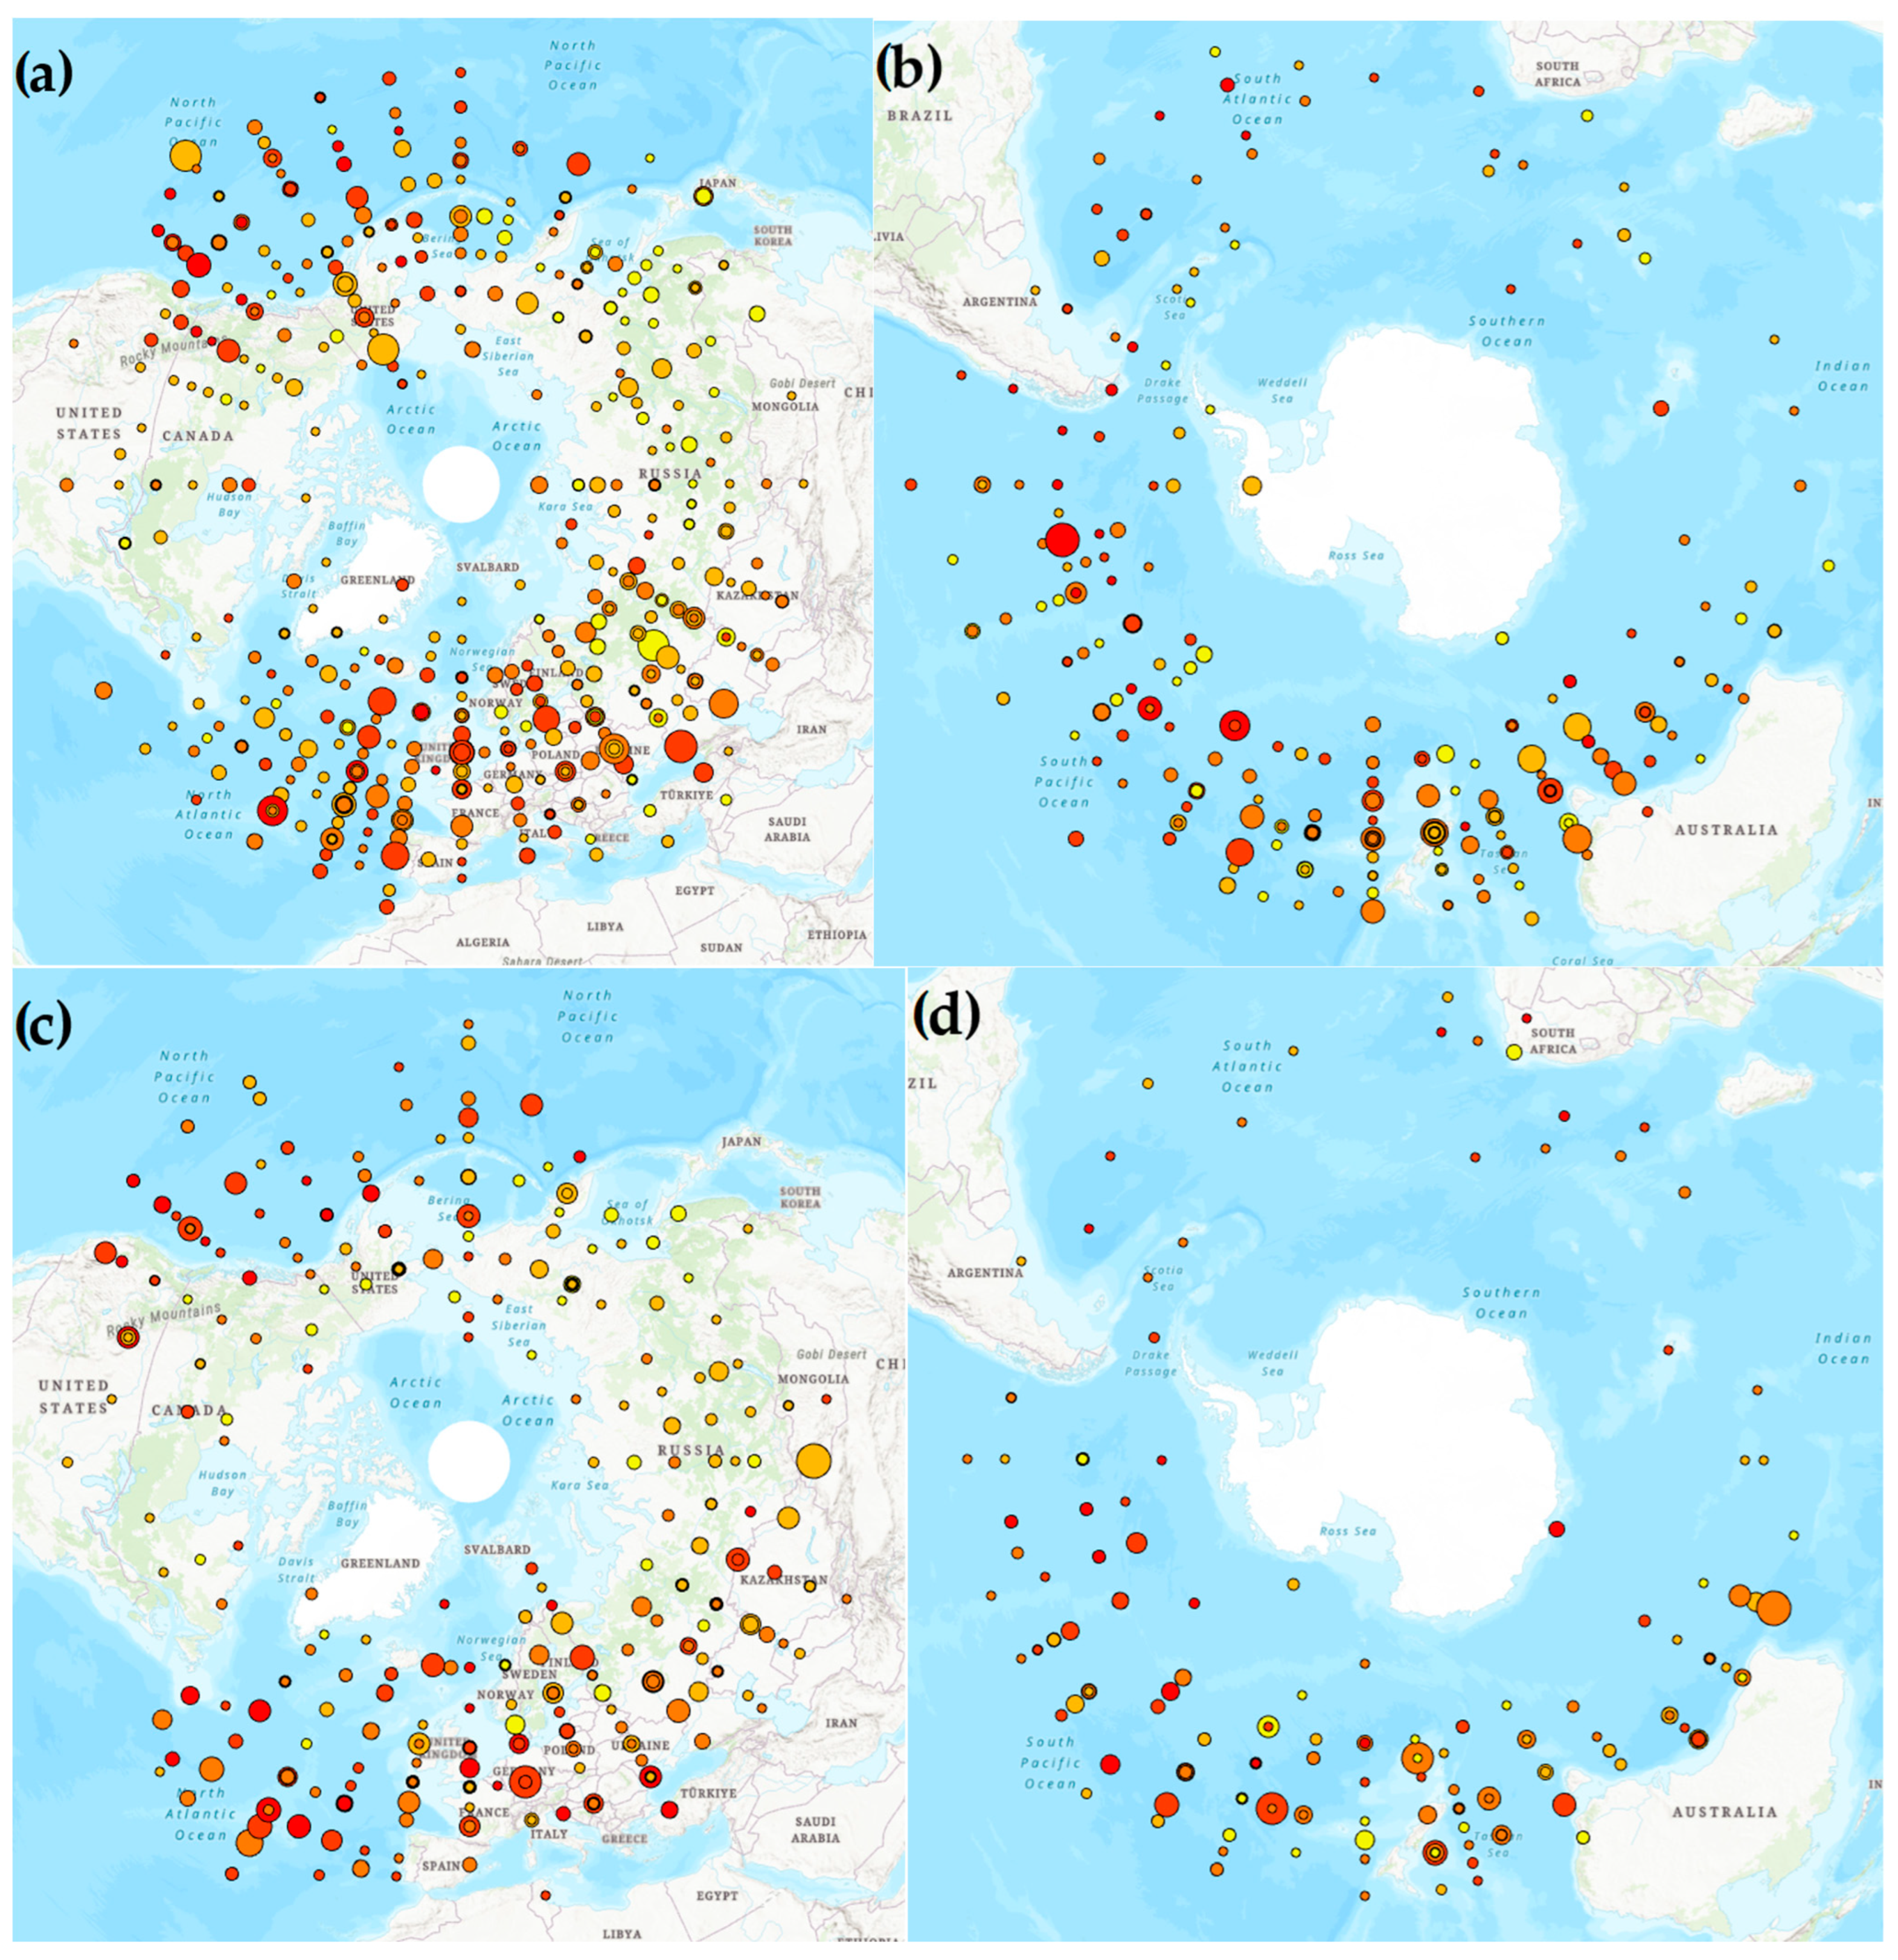
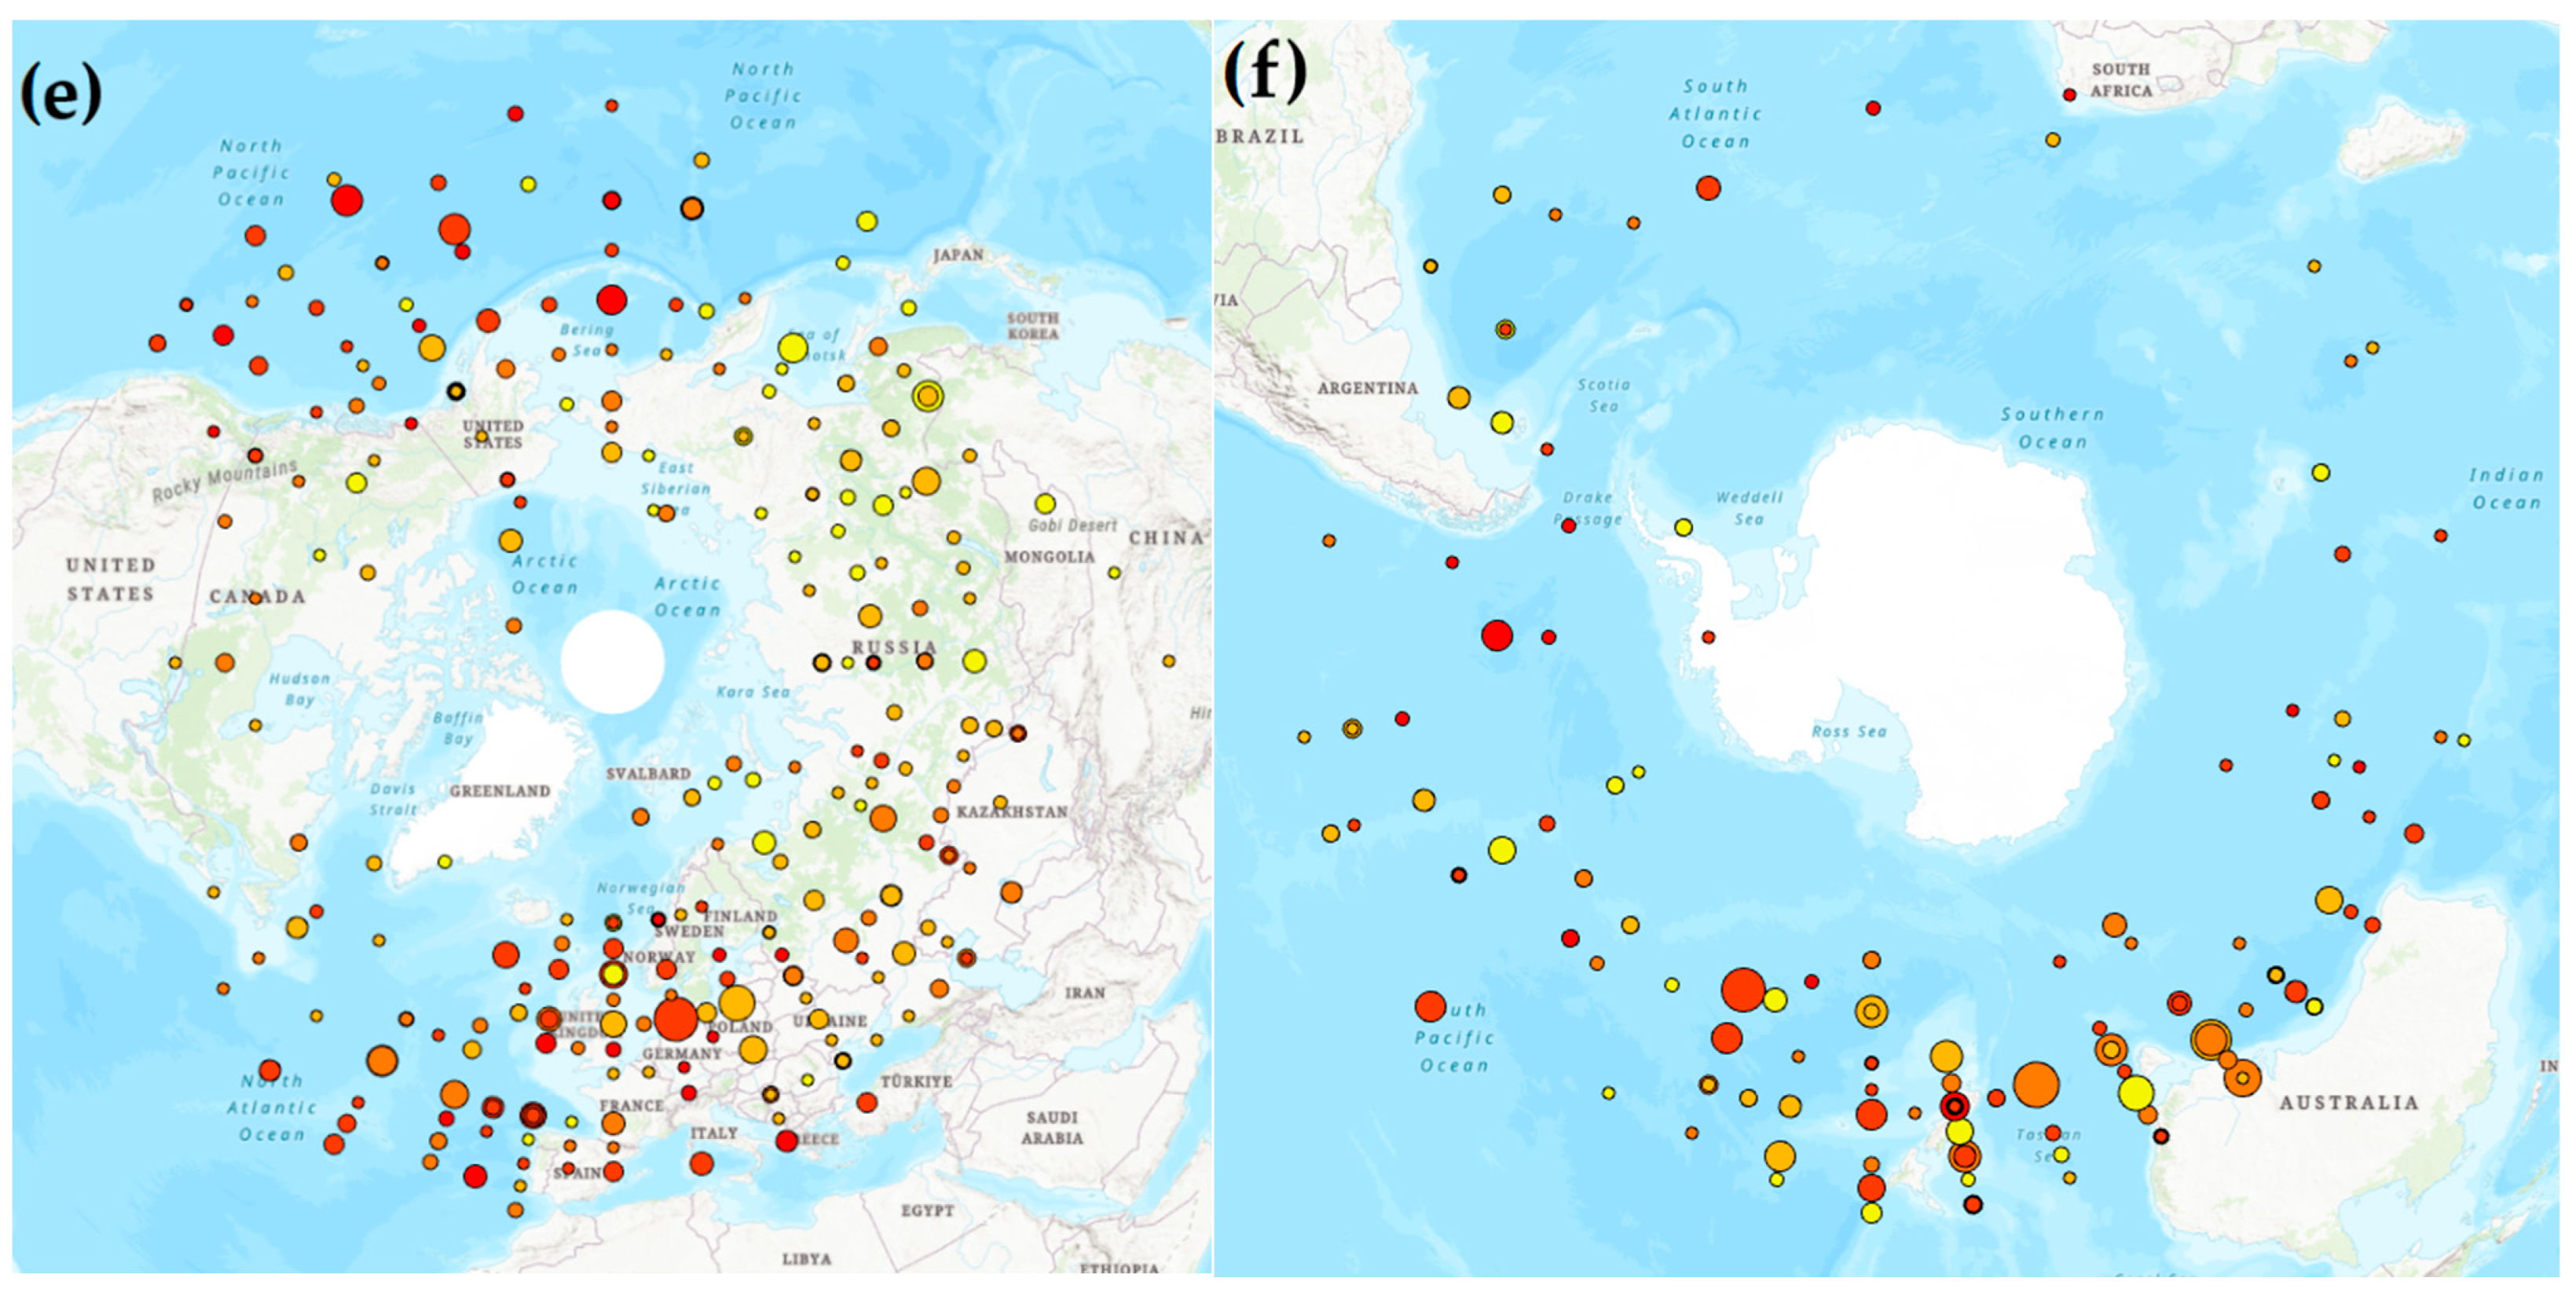
3. Results
3.1. Comparison to the Previous Climatologies
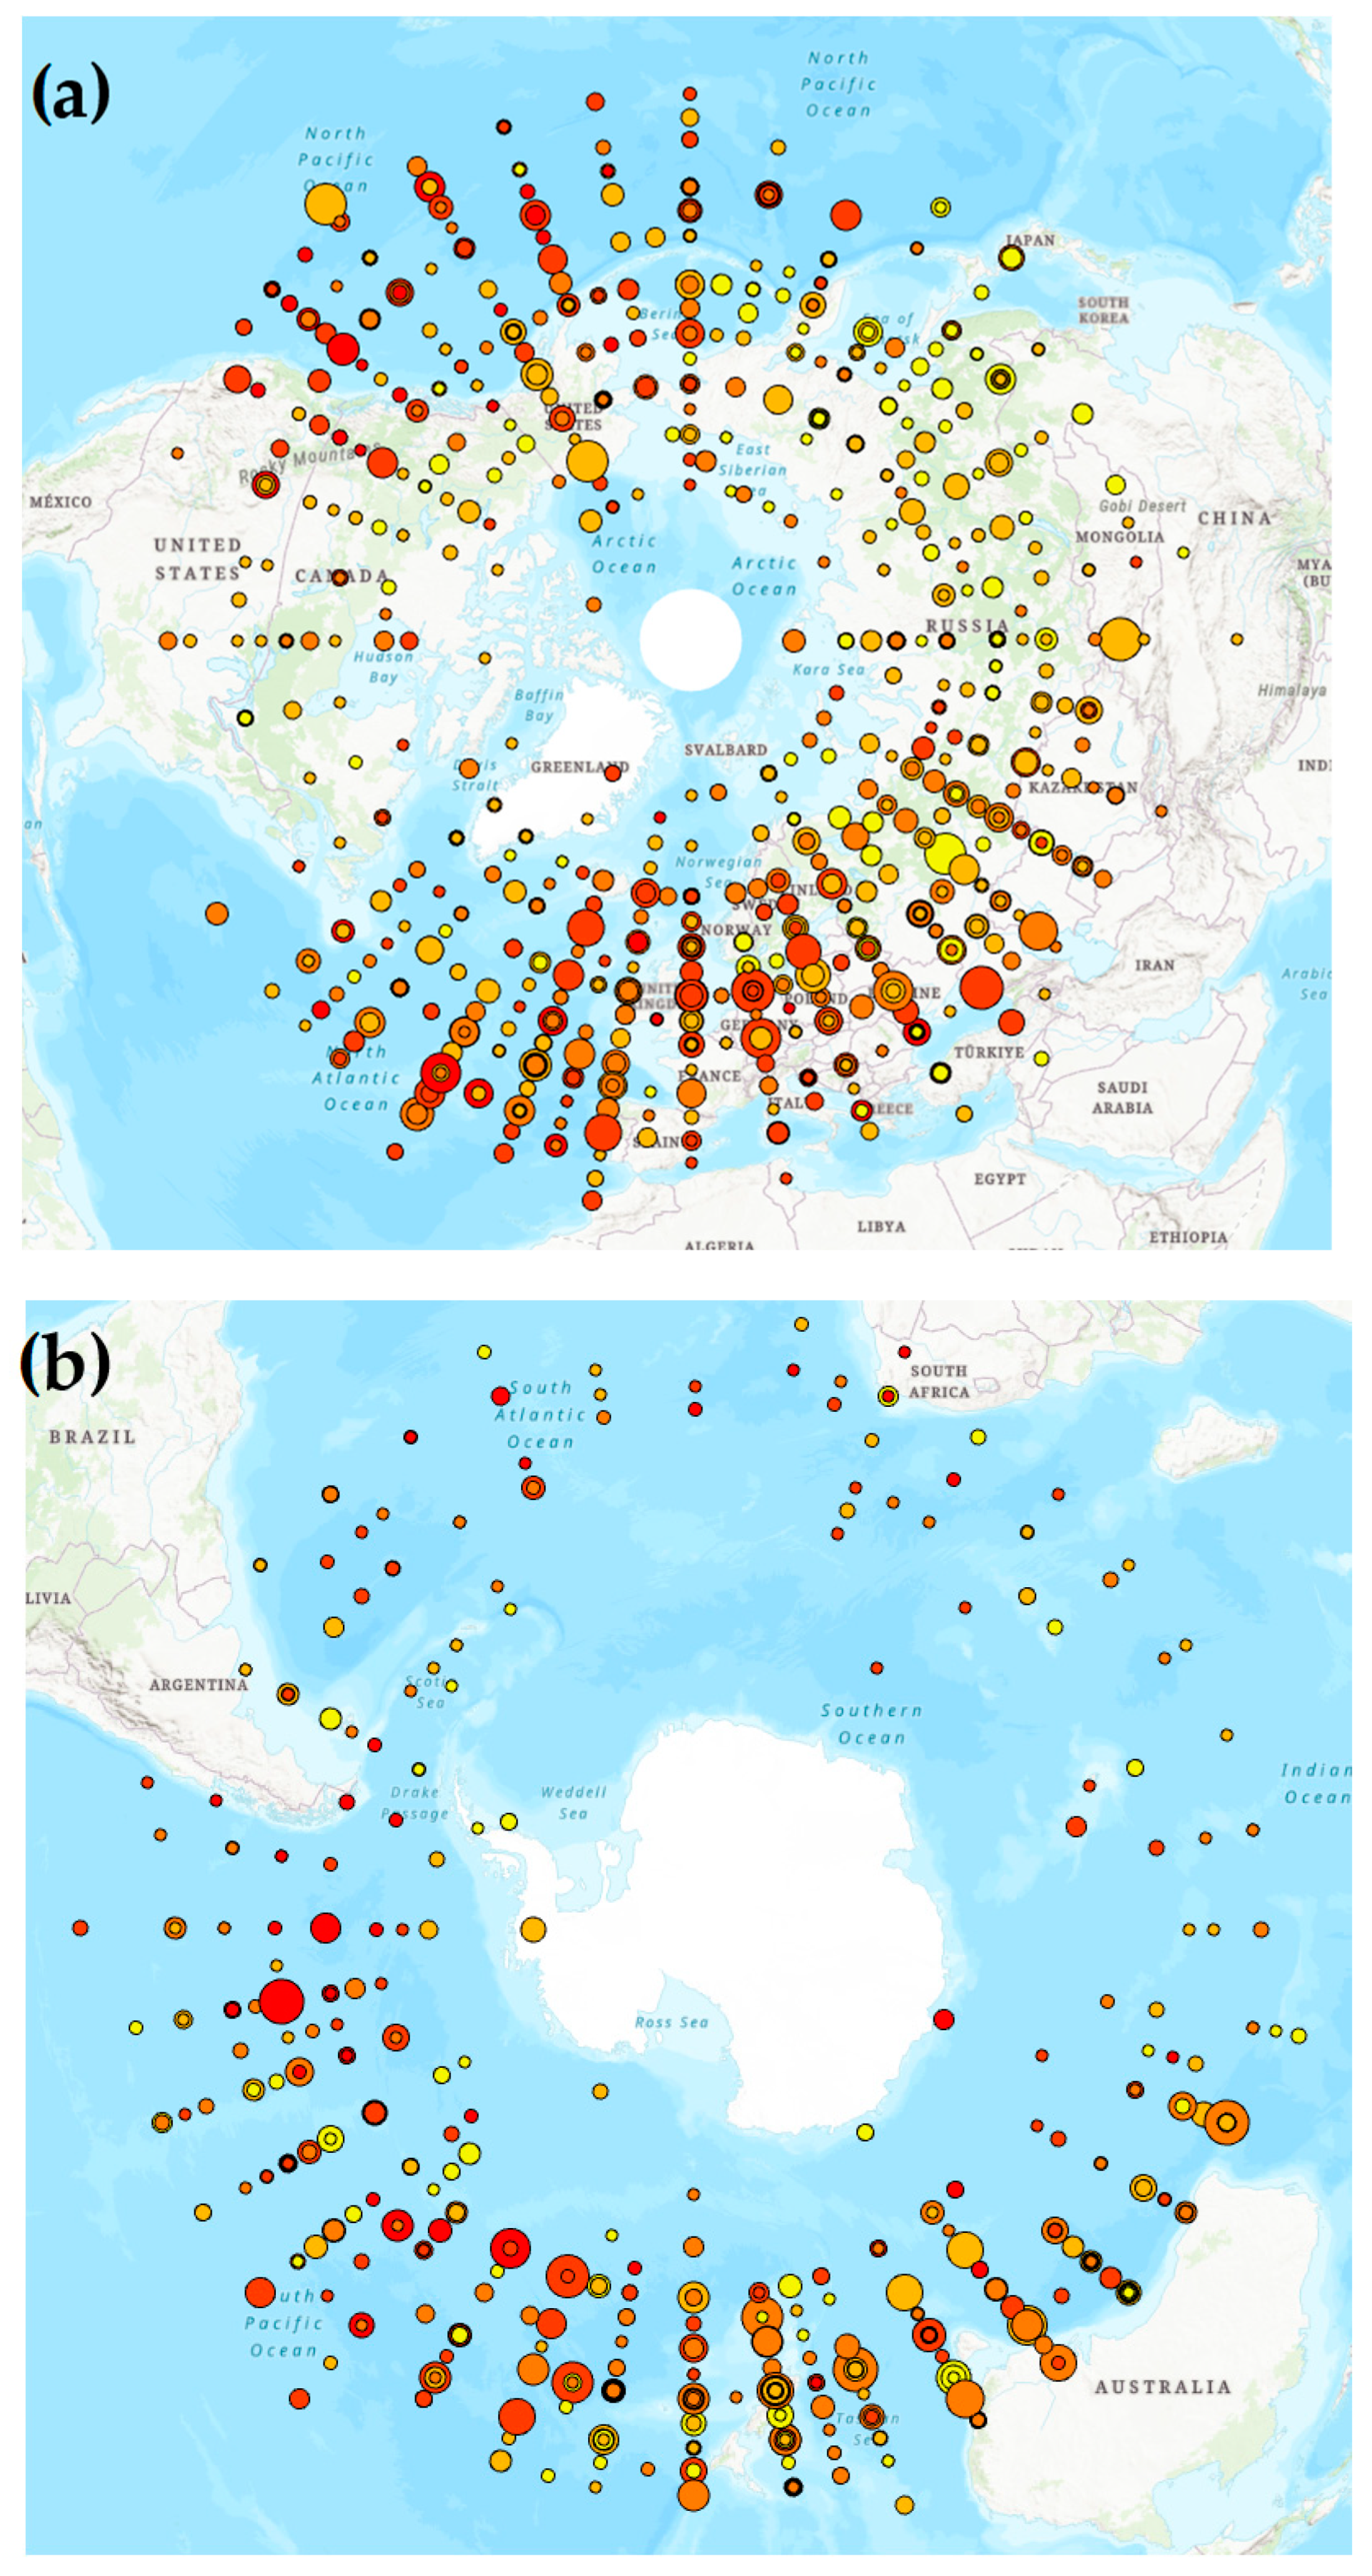
3.2. Results Using GIS
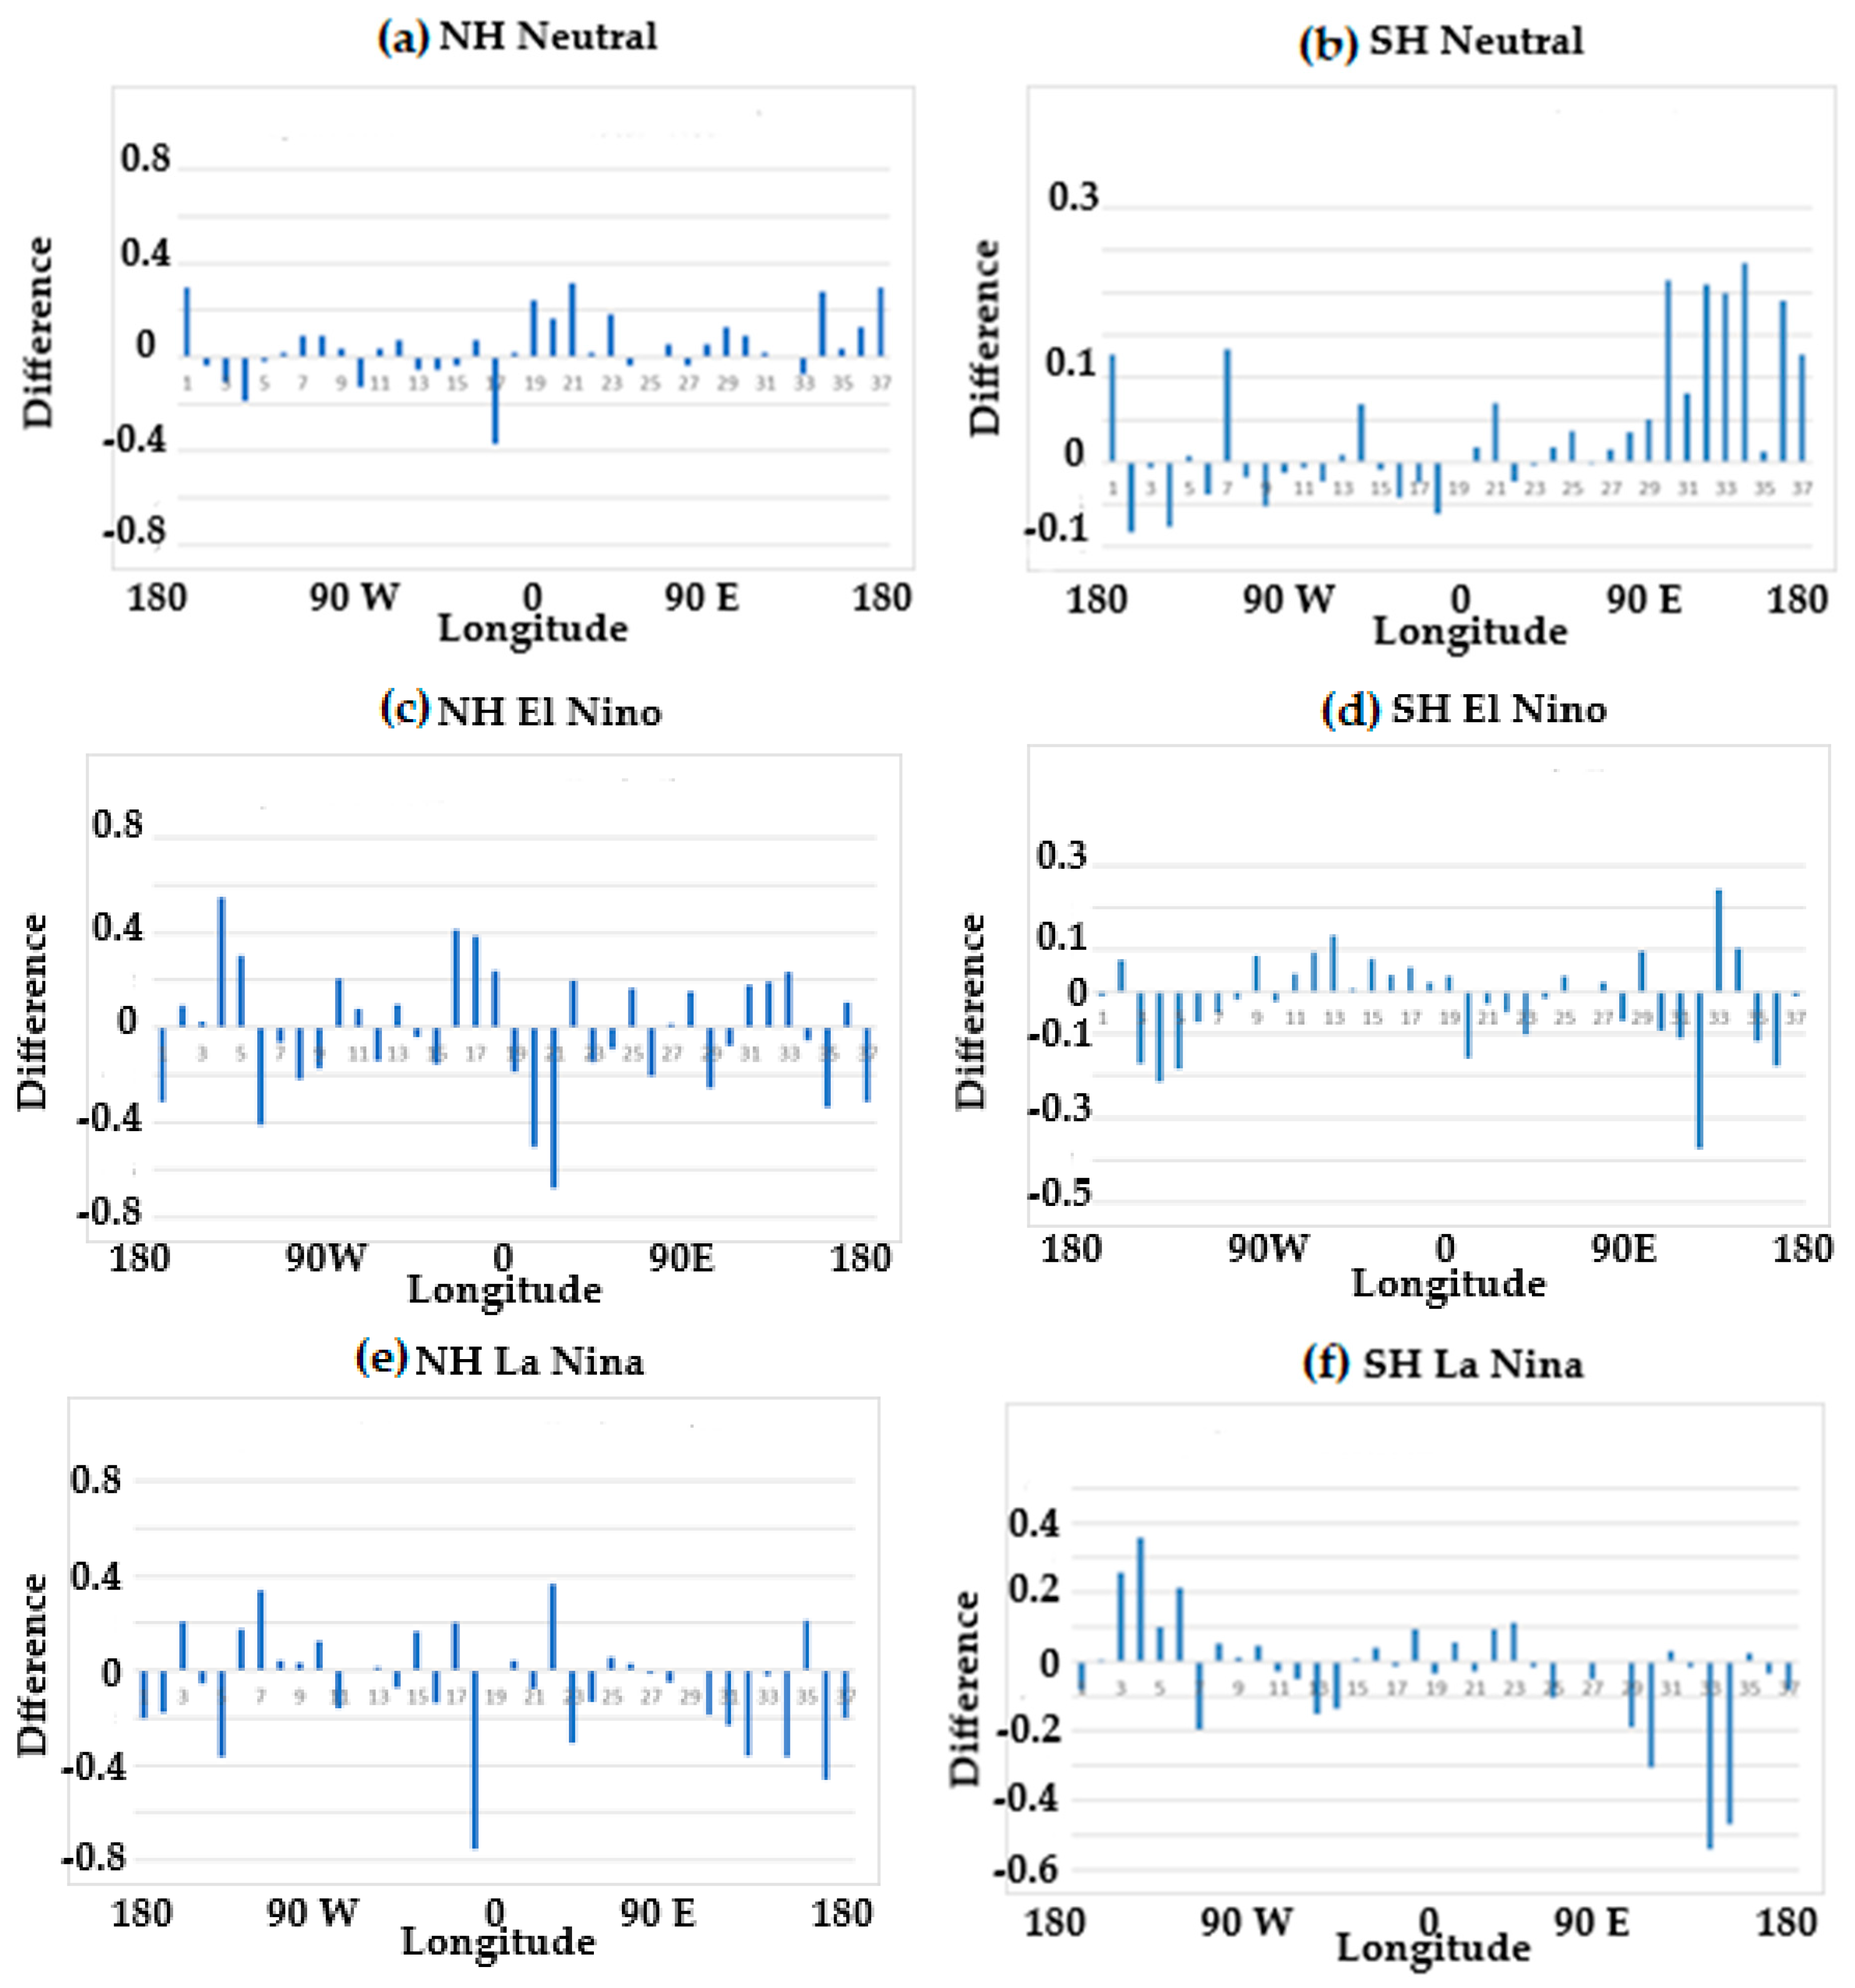
3.3. Interannual Variability Using GIS
4. Discussion
5. Conclusions
Author Contributions
Funding
Institutional Review Board Statement
Informed Consent Statement
Data Availability Statement
Acknowledgments
Conflicts of Interest
References
- Lupo, A.R.; Smith, P.J. Climatological features of blocking anticyclones in the Northern Hemisphere. Tellus 1995, 47, 439–456. [Google Scholar] [CrossRef] [Green Version]
- Wiedenmann, J.M.; Lupo, A.R.; Mokhov, I.I.; Tikhonova, E.A. The climatology of blocking anticyclones for the Northern and Southern Hemisphere: Block intensity as a diagnostic. J. Clim. 2002, 15, 3459–3474. [Google Scholar] [CrossRef]
- Lupo, A.R.; Jensen, A.D.; Mokhov, I.I.; Timazhev, A.V.; Eichler, T.E.; Efe, B. Changes in global blocking character during the most recent decades. Atmosphere 2019, 10, 92. [Google Scholar] [CrossRef] [Green Version]
- Lupo, A.R. Atmospheric Blocking Events: A Review. Ann. New York Acad. Sci. Spec. Issue Year Clim. Sci. Res. 2021, 1504, 5–24. [Google Scholar] [CrossRef] [PubMed]
- Lejenäs, H.; Økland, H. Characteristics of Northern Hemisphere blocking as determined from a long time series of observational data. Tellus 1983, 35, 350–362. [Google Scholar] [CrossRef]
- Pinheiro, M.C.; Ullrich, P.A.; Grotjahn, R. Atmospheric blocking and intercomparison of objective detection methods: Flow field characteristics. Clim. Dyn. 2019, 53, 4189–4216. [Google Scholar] [CrossRef] [Green Version]
- Tibaldi, S.; Molteni, F. On the operational predictability of blocking. Tellus 1990, 42, 343–365. [Google Scholar]
- Elliott, R.D.; Smith, T.B. A study of the effects of large-blocking highs on the general circulation in the Northern Hemisphere westerlies. J. Meteorol. 1949, 6, 67–85. [Google Scholar] [CrossRef]
- Dole, R.M.; Gordon, N.D. Persistent anomalies of the extratropical Northern Hemisphere wintertime circulation: Geographical distribution and regional persistence characteristics. Mon. Weather Rev. 1983, 111, 1567–1586. [Google Scholar] [CrossRef]
- Pelly, J.L.; Hoskins, B.J. A new perspective on blocking. J. Atmos. Sci. 2003, 60, 743–755. [Google Scholar] [CrossRef]
- Schwierz, C.; Croci-Maspoli, M.; Davies, H.C. Perspicacious indicators of atmospheric blocking. Geophys. Res. Lett. 2004, L06125. [Google Scholar] [CrossRef]
- Davini, P.; Cagnazzo, C.; Gualdi, S.; Navarra, A. A bidimensional diagnostics, variability, and trends of Northern Hemisphere blocking. J. Clim. 2012, 25, 6496–6509. [Google Scholar] [CrossRef]
- Woollings, T.; Barriopedro Cepero, D.; Methven, J.; Son, S.-W.; Harvey, B.; Martius, O.; Sillmann, J.; Lupo, A.R.; Seneviratne, S. Blocking and it’s response to climate change. Curr. Clim. Change Rep. 2018, 4, 287–300. [Google Scholar] [CrossRef] [PubMed] [Green Version]
- Kalnay, E.; Kanamitsu, M.; Kistler, R.; Collins, W.; Deaven, D.; Gandin, L.; Iredell, M.; Saha, S.; White, G.; Woollen, J.; et al. The NCEP/NCAR 40-year reanalysis project. Bull. Am. Meteorol. Soc. 1996, 77, 437–471. [Google Scholar] [CrossRef]
- NCEP/NCAR Reanalyses Project. Available online: http://www.esrl.noaa.gov/psd/data/reanalysis/reanalysis.shtml (accessed on 24 October 2022).
- University of Missouri Blocking Archive. Available online: http://weather.missouri.edu/gcc (accessed on 24 October 2022).
- Newberry, R.G.; Lupo, A.R.; Jensen, A.D.; Rodriges-Zalipynis, R.A. An analysis of the spring-to-summer transition in the West Central Plains for application to long range forecasting. Atmos. Clim. Sci. 2016, 6, 375–393. [Google Scholar] [CrossRef] [Green Version]
- Center for Ocean and Atmosphere Prediction Studies. Available online: http://www.coaps.fsu.edu (accessed on 11 May 2017).
- Bove, M.C.; Elsner, J.B.; Landsea, C.W.; Niu, X.; O’Brien, J.J. Effects of El Niño on U.S. Landfalling Hurricanes, Revisited. Bull. Amer. Meteor. Soc. 1998, 79, 2477–2482. [Google Scholar] [CrossRef]
- Hu, Z.Z.; Huang, B. Interferential Impact of ENSO and PDO on Dry and Wet Conditions in the U.S. Great Plains. J. Clim. 2009, 19, 5500–5518. [Google Scholar] [CrossRef]
- Birk, K.; Lupo, A.R.; Guinan, P.E.; Barbieri, C.E. The interannual variability of midwestern temperatures and precipitation as related to the ENSO and PDO. Atmofera 2010, 23, 95–128. [Google Scholar]
- Mantua, N.J.; Hare, S.R.; Zhang, Y.; Wallace, J.M.; Francis, R.C. A Pacific Interdecadal Climate Oscillation with Impacts on Salmon Production. Bull. Amer. Meteor. Soc. 1997, 78, 1069–1079. [Google Scholar] [CrossRef]
- Minobe, S. A 50–70-Year Climatic Oscillation over the North Pacific and North America. Geophys. Res. Lett. 1997, 24, 683–686. [Google Scholar] [CrossRef] [Green Version]
- Yuchechen, A.E.; Lakkis, S.G.; Canziani, P.O. The Southern Hemisphere blocking index revisited. Atmosphere 2022, 13, 1343. [Google Scholar] [CrossRef]
- Burkhardt, J.P.; Lupo, A.R. The planetary and synoptic-scale interactions in a Southeast Pacific blocking episode using PV diagnostics. J. Atmos. Sci. 2005, 62, 1901–1916. [Google Scholar] [CrossRef] [Green Version]
- Sinclair, M.R. A climatology of anticyclones and blocking for the Southern Hemisphere. Mon. Weather Rev. 1996, 124, 245–263. [Google Scholar] [CrossRef]
- Marques, R.F.C.; Rao, V.B. Interannual variations of blockings in the Southern Hemisphere and their energetics. J. Geophys. Res. 2000, 105, 4625–4636. [Google Scholar] [CrossRef] [Green Version]
- Oliveira, F.N.M.; Carvalhoc, L.M.V.; Ambrizzi, T. A new climatology for southern hemisphere blockings in the winter and the combined effect of ENSO and SAM phases. Int. J. Climatol. 2014, 34, 1676–1692. [Google Scholar] [CrossRef] [Green Version]
- O’Kane, T.J.; Monselesan, D.P.; Risbey, J.S. A Multiscale Reexamination of the Pacific–South American Pattern. Mon. Weather Rev. 2017, 145, 379–402. [Google Scholar] [CrossRef]
- Eichler, T.; Higgins, W. Climatology and ENSO-Related Variability of North American Extratropical Cyclone Activity. J. Clim. 2004, 19, 2076–2093. [Google Scholar] [CrossRef]
- Liao, C.; Xu, H.; Deng, J.; Zhang, L. Interannual Relationship between ENSO and Atlantic Storm Track in Spring Modulated by the Atlantic Multidecadal Oscillation. Atmosphere 2018, 9, 419. [Google Scholar] [CrossRef] [Green Version]
- Solman, S.A.; Menendez, C.G. ENSO-Related Variability of the Southern Hemisphere Winter Storm Track over the Eastern Pacific–Atlantic Sector. J. Atmos. Sci. 2002, 59, 2128–2140. [Google Scholar] [CrossRef]


| El Niño | Neutral | La Niña |
|---|---|---|
| 1969 | 1968 | 1967 |
| 1972 | 1977–1981 | 1970–1971 |
| 1976 | 1983–1985 | 1973–1975 |
| 1982 | 1989–1990 | 1988 |
| 1986–1987 | 1992–1996 | 1998–1999 |
| 1991 | 2000–2001 | 2007 |
| 1997 | 2003–2005 | 2010 |
| 2002 | 2008 | 2017 |
| 2006 | 2011–2013 | 2020–2021 |
| 2009 | 2016 | |
| 2014–2015 | 2019 | |
| 2018 |
| NH | Occurrence (Events) | Duration (Days) | Intensity |
| El Niño (14) | 15.1/9.8/7.1 | 9.7/8.4/8.8 | 3.39/3.04/2.65 |
| Neutal (27) | 14.0/8.6/7.6 | 9.4/9.0/8.9 | 3.30/3.28/2.59 |
| La Niña (13) | 14.9/10.1/8.7 | 9.4/8.6/8.6 | 3.34/3.26/2.57 |
| Total (54) | 14.5/9.3/7.7 | 9.5/8.7/8.8 | 3.33/3.21/2.60 |
| SH | Occurrence (events) | Duration (days) | Intensity |
| El Niño (14) | 1.3/10.9/2.2 | 6.2/8.1/7.8 | 3.04/2.98/2.81 |
| Neutral (26) | 1.3/9.8/1.3 | 6.1/7.8/6.8 | 2.82/2.82/2.70 |
| La Niña (14) | 1.4/11.2/2.0 | 6.8/7.9/7.2 | 2.80/2.84/2.65 |
| Total (54) | 1.3/10.3/1.7 | 6.3/8.0/7.4 | 2.87/2.87/2.72 |
Disclaimer/Publisher’s Note: The statements, opinions and data contained in all publications are solely those of the individual author(s) and contributor(s) and not of MDPI and/or the editor(s). MDPI and/or the editor(s) disclaim responsibility for any injury to people or property resulting from any ideas, methods, instructions or products referred to in the content. |
© 2023 by the authors. Licensee MDPI, Basel, Switzerland. This article is an open access article distributed under the terms and conditions of the Creative Commons Attribution (CC BY) license (https://creativecommons.org/licenses/by/4.0/).
Share and Cite
Ethridge, E.D.; Efe, B.; Lupo, A.R. A One-Dimensional Blocking Index Becomes Two-Dimensional Using GIS Technology. Sci 2023, 5, 15. https://doi.org/10.3390/sci5020015
Ethridge ED, Efe B, Lupo AR. A One-Dimensional Blocking Index Becomes Two-Dimensional Using GIS Technology. Sci. 2023; 5(2):15. https://doi.org/10.3390/sci5020015
Chicago/Turabian StyleEthridge, Eli D., Bahtiyar Efe, and Anthony R. Lupo. 2023. "A One-Dimensional Blocking Index Becomes Two-Dimensional Using GIS Technology" Sci 5, no. 2: 15. https://doi.org/10.3390/sci5020015