
Explaining Personal and Public Pro-Environmental Behaviors
Sociology Program, Texas Woman’s University, Denton, TX 76204, USA
*
Author to whom correspondence should be addressed.
Sci 2023, 5(1), 6; https://doi.org/10.3390/sci5010006
Submission received: 10 September 2022
/
Revised: 11 November 2022
/
Accepted: 31 January 2023
/
Published: 7 February 2023
(This article belongs to the Section Environmental and Earth Science)
Abstract
:A global crisis generated by human-made climate change has added urgency to the need to fully understand human pro-environmental behaviors (PEBs) that may help slow down the crisis. Factors influencing personal and public PEBs may or may not be the same. Only a few studies have empirically investigated the determinants of personal and public PEBs simultaneously, but they contain major limitations with mixed results. This study develops a conceptual model for explaining both personal and public PEBs that incorporate demographic, socioeconomic, political, and attitudinal variables, and their direct and indirect effects. Using the latest available data from the 2010 General Social Survey and structural equation modeling (SEM), we tested the determinants of both personal and public PEBs in the United States. The results reveal that environmental concerns, education, and political orientation demonstrate similar significant impacts on both personal and public PEBs, but income, gender, race, urban/rural residency, region, and party affiliation have differential effects on these behaviors. Age, cohort, and religion have no significant effect on both types of behaviors. Our results confirm some existing findings; however, they challenge the findings of much of the literature.
1. Introduction
A global crisis generated by human-made climate change has added urgency to the need to fully understand human pro-environmental behaviors (PEBs) that may help slow down the crisis. Since the modern environmental movement in the United States began in the early 1960s, there has been plenty of research on environmental behaviors. However, much more research has focused on personal PEBs (e.g., driving less, recycling, and saving water), or what Hunter, Hatch, and Johnson termed private or “household-oriented” environmental activities [1], compared with public PEBs (e.g., petitioning, protesting), or what Hunter et al. dubbed “community/society-oriented” environmental actions [1,2,3]. In particular, only a few studies [1,4,5,6,7] have empirically investigated the determinants of personal and public PEBs simultaneously, but they contain major limitations with mixed results. Briscoe et al.’s latest study [4] used data from the U.S. Intermountain West, which had a very low response rate (13.8%, fewer than 500 cases), focused on gender differences in personal and public PEBs, and did not include some key variables, such as age, race, religion, and political party affiliation. Thus, their findings cannot be generalized to the U.S. population. Similarly, Feng and Reisner’s study [5] relied on a small provincial sample of 347 residents in Shaanxi, China, which had few predictors, resulting in very limited generalizability, even if the trustworthiness of the results can be assumed. Hunter et al. [1] did use large cross-national samples of 22 countries or entities from the International Social Survey Program (ISSP) in 1993, but they were only interested in cross-national gender variation in personal and public PEBs, and the results could be different a couple of decades later. Following in Hunter et al.’s footsteps, Hadler and Haller [6] also used the ISSP cross-national samples of 23 countries or entities collected in 2000–2002, but they focused on the effects of world society and national contexts, and their regression models combined cases from all 23 countries. Hadler and Haller’s study [7] is descriptive and does not address the determinants of personal and public PEBs at all. Hence, we do not know much about whether factors that influence environmental behaviors have the same or differential effects on personal and public PEBs at the national level in the United States.
Moreover, typically, existing studies examine either environmental concern or environmental behavior and assume that environmental concern will translate into PEB. We believe that environmental concern should be treated as an intervening variable that mediates the relationships between structural variables and environmental behaviors. Few studies have investigated how environmental concern mediates the effects of demographic, socioeconomic, and political variables on PEBs. Chung et al.’s study [8], which is based on an online survey of 518 U.S. adults, is an exception; however, their measures of environmental beliefs, as well as their measures of PEBs, are different from ours. Another exception is Rajapaksa et al.’s study [9], which uses data with different measurements collected through the internet and personal interview surveys in Mumbai, India; however, the setting in a developing country is different from that of the USA. It is important to distinguish environmental concern from environmental behavior and understand how environmental concern mediates the relationships between structural factors and environmental behaviors. Empirically, the existing literature has identified some potential predictors of PEBs, either personal or public, such as gender, age, race, religion, residence, income, education, and political ideology (see, for example, [1,3,4,10,11,12,13,14,15,16]); however, the results of empirical tests are mixed or inconclusive. The mixed or inconclusive results may be in part attributed to the use of a small or biased sample with 150 to a few hundred cases or a very low response rate and inappropriate statistical techniques (see, for example, [2,3,4,5,10]).
Hence, there is a need for studies that are grounded in new analytical frameworks, nationally representative samples, and suitable statistical methods for both types of PEBs. The present study is such an endeavor to fill the void in the literature and to further our understanding of the determination of PEBs. We understand that individual pro-environmental actions cannot fully resolve major problems, such as climate change, but collectively individuals can make important contributions through pro-environmental actions [17]. Individualized environmental actions at the micro level, and collective environmental movements and legislation at the macro level, can together more effectively reduce environmental problems [18,19,20].
In this study, we define PEBs as individual actions or conduct that contribute to environmental protection and sustainability. There are different ways to pigeonhole PEBs, such as domain-based behaviors [21,22], energy reduction vs. efficiency improvement behaviors [23,24], intent-oriented vs. impact-oriented behaviors [21,25], and visible vs. invisible behaviors [21]. However, in the literature [1,4,6,26], PEBs are typically grouped into two categories: personal (or private) or public. Personal PEBs refer to actions beneficial to environmental protection and sustainability in the personal or private sphere through individual endeavors. Personal PEBs cover a range of domains, such as waste reduction (e.g., recycling, composting), conservation (e.g., conserving water, driving less, carpooling, using transit, reducing energy use), green consumer behaviors (e.g., avoiding the purchase of products with a lot of plastic and useless packing, avoiding the purchase of fruits and vegetables grown with pesticides or chemicals, avoiding the purchase of products harmful to the environment), and the use of energy-efficient equipment and services (e.g., installing energy-efficient heating system, purchasing hybrid vehicles). Public PEBs refer to actions conducive to environmental protection and sustainability in the public sphere. Public PEBs may include two types: activism such as protesting, signing petitions, donating to environmental causes, joining pro-environment organizations; and non-activist public-sphere activities, such as sharing resources, volunteering time for environmental concerns, and supporting for environmental policies [21]. There may be other terms, such as consumer actions, ecological actions, citizen actions, political actions, legal actions, and environmental activism, but they may not exhaustively or accurately cover certain types of PEBs. We prefer personal and public PEBs since they can cover all types of PEBs in two categories and are commonly used and easily understood. We operationalize personal PEBs by a latent variable built on indicators pertinent to driving less, recycling more, buying pesticide- or chemical-free products, saving water, reducing fuel, and buying environmentally friendly products. Similarly, we operationalize public PEBs by a latent variable based on indicators related to environmentally related petitions, donations, and protests or demonstrations.
In this paper, we propose a structural equation model (SEM) and hypotheses for predicting both personal and public PEBs based on a review of the literature and theorization. We have tested the determinants of both personal and public PEBs, using the latest available data from General Social Survey 2010 and structural equation modeling. The results reveal both common and differential determinants of both personal and public PEBs. We discuss the implications of the findings.
2. Conceptual Model and Hypotheses
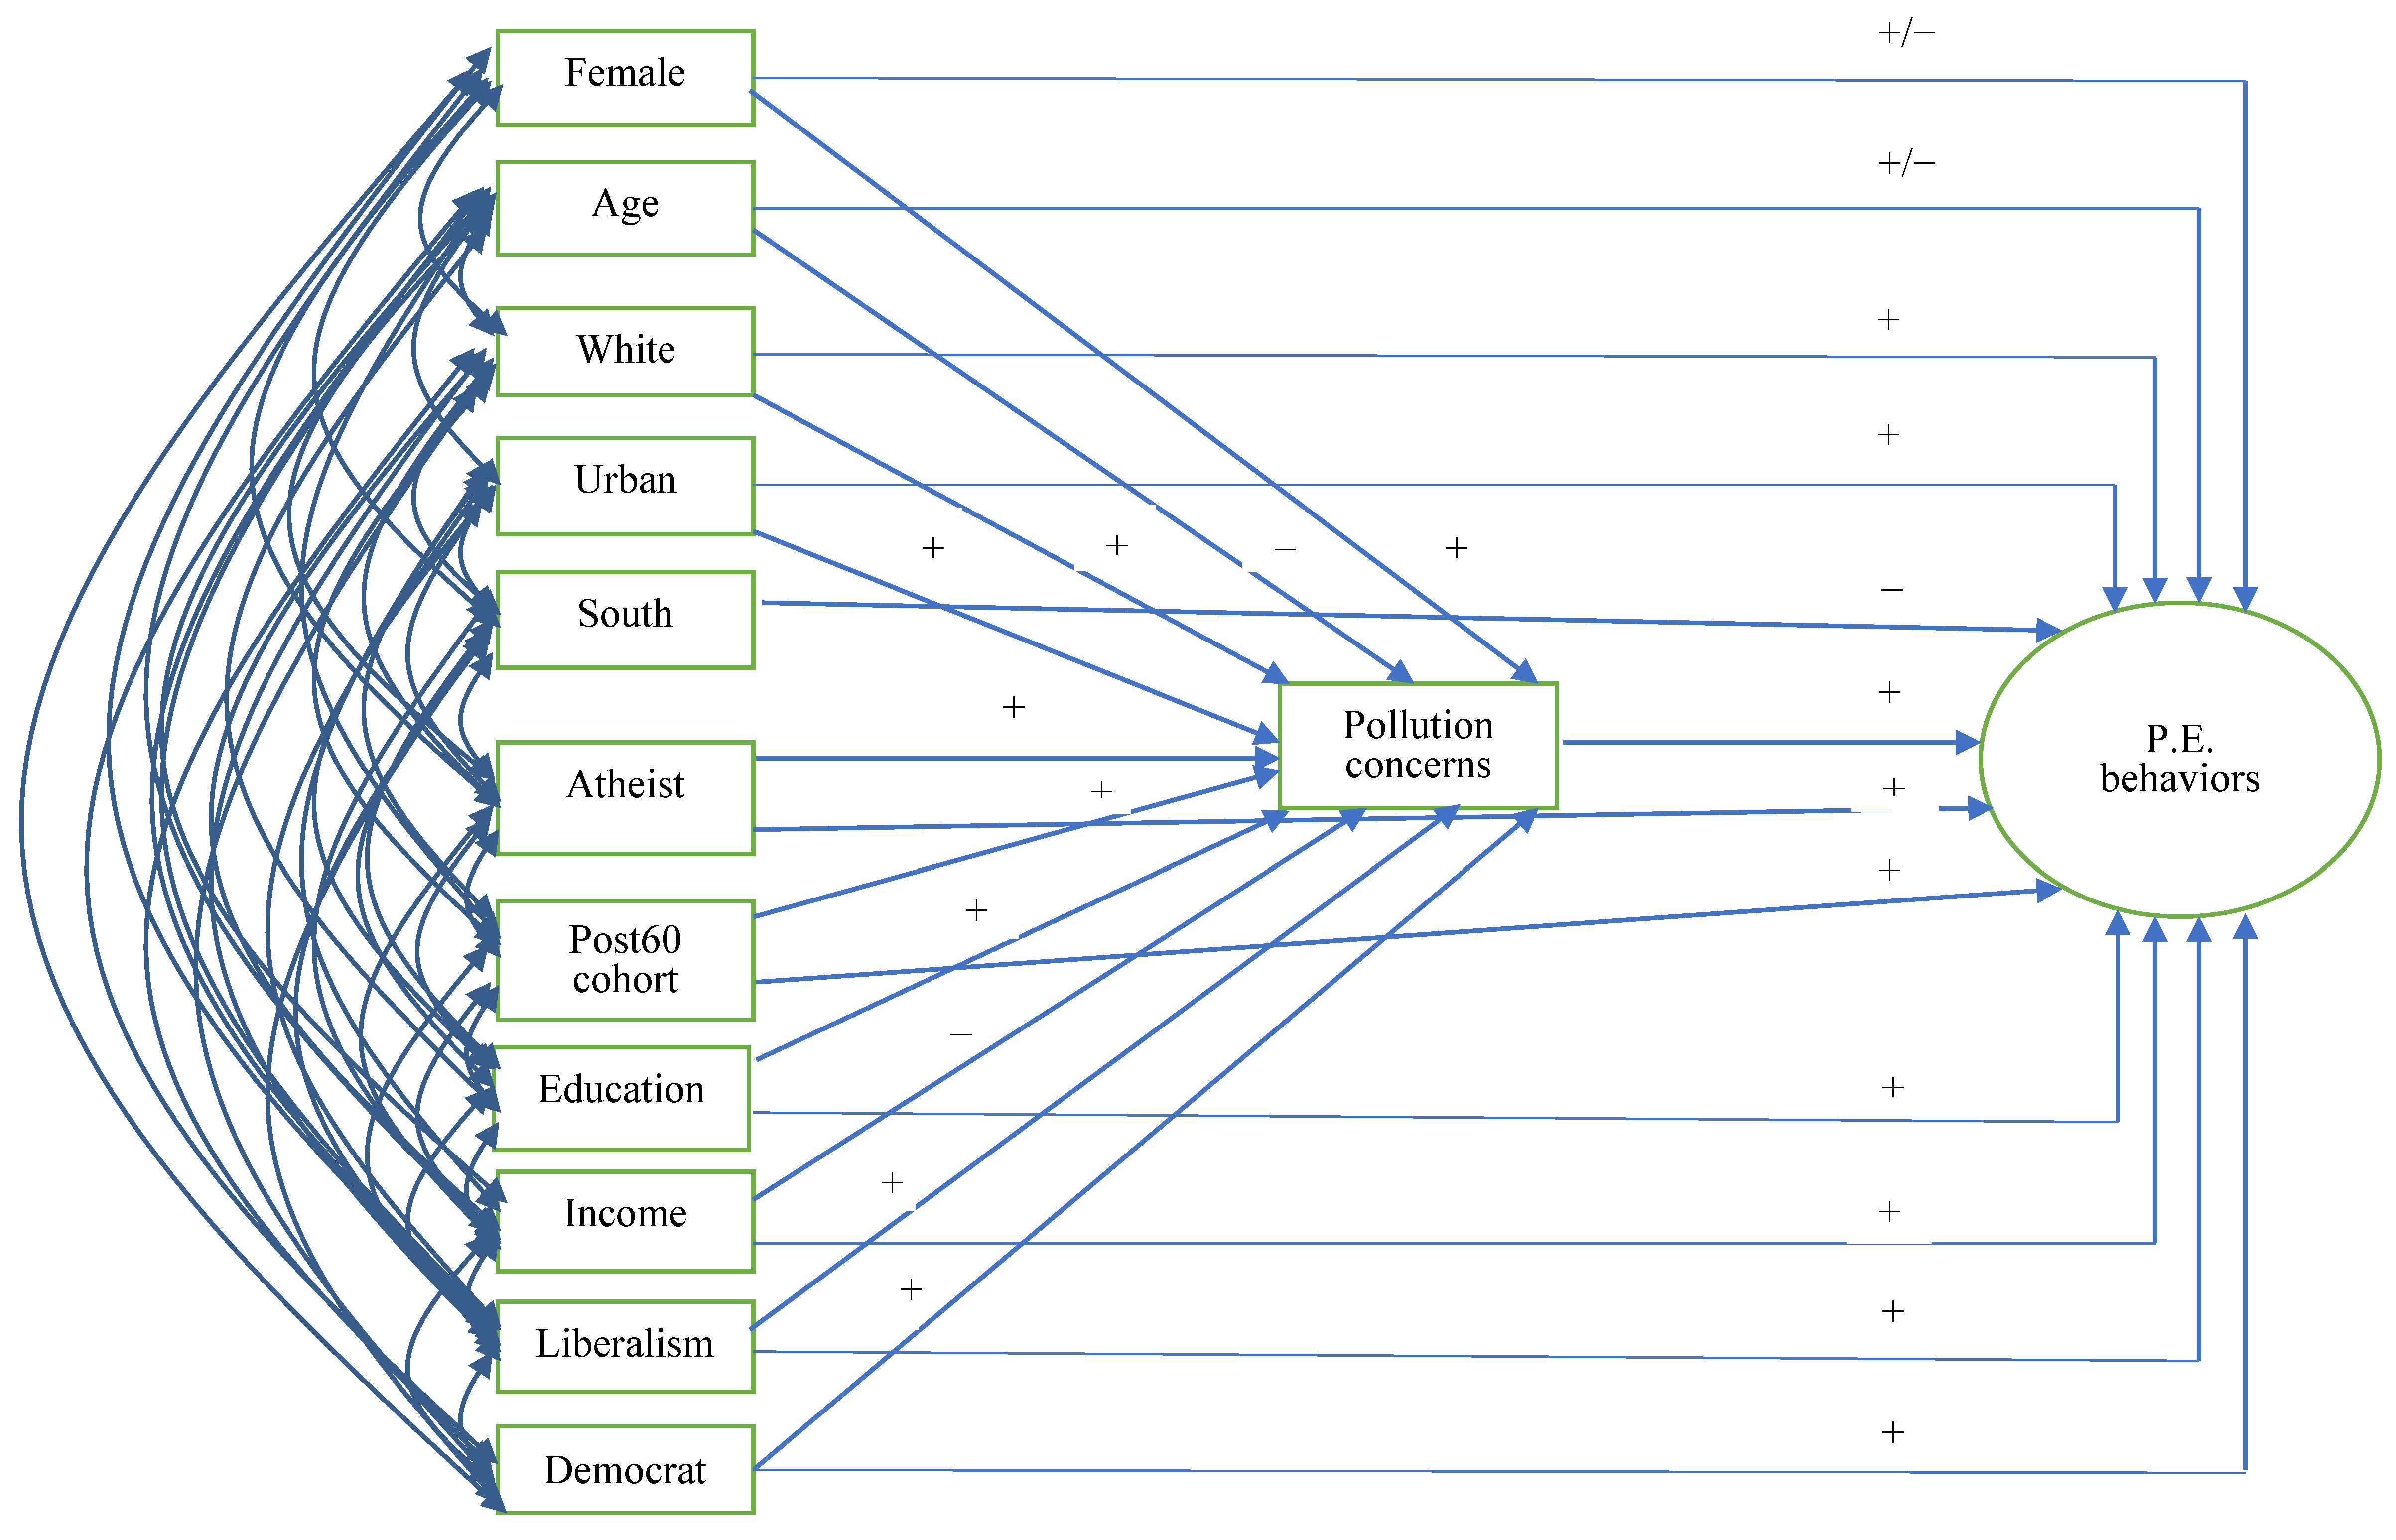
We believe that PEBs are determined by a host of factors that include, but are not limited to, concern about the environment, demographic characteristics, socioeconomic status, and political factors. Individual differences in these characteristics explain differences in individual PEBs or actions. Moreover, demographic, socioeconomic, and political factors shape PEBs not only directly but also indirectly through environmental concern. Figure 1 presents our general conceptual model in a path diagram intended to guide our empirical tests of the SEM for determinants of PEBs. These determinants may influence personal PEBs and public PEBs in the same fashion or in different manners. Our model differs from most existing studies by treating PEBs as a latent variable and using environmental concern as a mediating variable. This section elaborates this conceptual model and specifies how the variables in the diagram influence personal and public PEBs.
2.1. Environmental Concern
As shown in Figure 1, the factors that most directly impact PEBs are environmental concerns or, more specifically, concerns about pollutions based on available data in this study. Beliefs or attitudes shape actions. Existing studies have also reported that environmental concern increases PEBs, such as propensity to volunteer, purchasing behaviors, energy consumption, and sustainable food consumption [9,14,27,28,29,30,31,32]. Hence, we hypothesize that individuals with greater concern about the environment are more likely to engage in PEBs than those with less concern, all else being equal.
2.2. Demographic Characteristics
Many demographic characteristics can differentiate individuals in their PEBs. These characteristics may comprise gender, age, cohort, race, religion, residency, and region. Gender has both direct and indirect effects on PEBs. A number of studies have detected significant gender differences in PEBs [1,3,33,34]. Women typically are more likely to partake in PEBs than men [1,34]. However, women and men differ in personal and public PEBs. Women’s participation in PEBs appears to be personal or private in nature [35,36], but men’s participation in PEBs tends to be public in nature, such as engaging in protests [35,37,38]. The gender difference in personal and public PEBs may be explained by gender socialization, environmental threats to families and communities, and the feminization of environmental responsibility [1,4,34]. In light of these findings, we hypothesize that, controlling for other variables, women are more likely to engage in personal PEBs than men, but are less likely to engage in public PEBs than men. It is essential to note that women may have a lower rate of participation in the mainstream environmental movements than men, but they are more likely than men to participate in environmental justice movements through their identity as mothers [39,40,41]. Furthermore, women have typically shown more environmental concern than men [1,34]. Hence, we expect that gender can indirectly impact PEBs by increasing environmental concern.
Age may make a difference in environmental behaviors, but evidence on how age affects environmental behaviors is at best inconclusive. An earlier meta-analysis [29] found a negative correlation between age and responsible environmental behaviors. Johnson et al. [14] argued that pro-environmental activities are negatively correlated with age because of decreasing energy and stamina associated with age. In light of this line of reasoning, one will expect an inverse relationship between age and PEBs. In contrast, a recent meta-analysis of studies from 1970 to 2010 [42] revealed that while age has a negligible effect on most environmental variables, for PEBs, older people are more likely to engage with nature, avoid environmental harm, and conserve raw materials and natural resources than younger ones. Possible reasons include that compared to younger people, older people are more conscientious [43] and value frugality [44]. Hence, a competing hypothesis is that there is a positive relationship between age and PEBs. For environmental concern, most studies e.g., [16,45,46] and recent Gallup polls [47] show that younger people are more concerned about environmental quality and threats, such as climate change, than older people. Thus, we hypothesize that age has a negative indirect effect on PEBs through environmental concern.
Cohort should be distinguished from age because while age reflects changes in individual life course, birth cohort reflects changes in the larger historical environment and events that shape the norms, values, beliefs, and attitudes of those born in the same years. Cohort can influence PEBs because the environmental movement can change the norms, values, beliefs, and attitudes of newer generations especially about environmental protection. Since the cohorts born after the onset of the environmental movement in the 1960s in the U.S. have greater exposure to the idea and importance of environmental protection, we expect that the post-1960s cohorts are more likely to engage in PEBs than their pre-1960s counterparts. Existing studies also found that later cohorts have greater environmental concern than earlier cohorts [48,49]. Hence, we anticipate that being in the post-1960s cohort indirectly increases PEBs as they should have greater environmental concern. It is important but challenging to simultaneously assess the effects of age and cohort. As Yang [50] noted, for aggregate population data, the independent effects of age, period, and cohort cannot be estimated simultaneously because of the linear dependency among age, period, and cohort; however, for repeated cross-sectional surveys at the individual level, such as the GSS, it is possible to examine the independent effects of age, period, and cohort simultaneously because the liner dependency is not inevitable and can be broken. Recoding age to create the cohort variable cannot solve the age cohort linear dependency problem. Fortunately, the GSS created a separate cohort variable that can break its linear dependency on age.
Urban/rural residency directly and indirectly influences environmental behaviors. Prior research offers mixed results about urban–rural differences in environmental behaviors. Earlier studies reveal that urban residents are more likely to take pro-environmental actions than rural residents [16,45,46,51]. Reasons include urban residents’ greater exposure to pollution, greater concern about environmental problems, and more concern about the over-use of natural resources compared with rural residents [16,45,46,52]. More recent research shows that rural populations encountered more environmental injustice and greater exposure to pollutants than urban population in recent decades [53,54]; however, this line of research does not address PEBs. Nonetheless, using data from Spain and Canada, Berenguer et al. [10] and Huddart-Kennedy et al. [13] found that rural residents showed a greater sense of environmental responsibility and higher participation rates in PEBs than their urban counterparts. Still, using survey data from the Southern Appalachian ecoregion, Jones et al. [55] detected no significant urban/rural difference in PEBs, and Johnson et al. [14] showed mixed evidence of urban/rural differences depending on the specific PEBs. In light of the U.S. evidence on PEBs, we hypothesize that for the U.S. as a whole, controlling for other factors, urban residents are more likely to engage in PEBs than rural residents. Additionally, on the basis of existing evidence regarding environmental concern cited above, we assume that urban residency increases PEBs indirectly by increasing environmental concern. We are nevertheless open to the possibility that rural residents’ greater PEBs observed in other countries may be applicable to the U.S. at the national level.
Region of residency may also make a difference in environmental behaviors. Regions in the United States vary in political atmosphere and therefore attitudes toward environmental issues. The South may be considered the most conservative region and may be less favorable to environmental protection than other regions of the country. Thus, we expect that Southerners are less likely to favor environmental protection and take pro-environmental actions than those in other regions, holding other variables constant. However, we do not believe that Southerners are less concerned about the environment or pollution than residents in other regions and therefore do not assume an indirect effect of region on PEBs via environmental concern.
There are racial differences in PEBs. A classic study by Johnson et al. [14] using the 2000 National Survey on Recreation and the Environment found that blacks and foreign-born Latinos were less likely to partake in several environmental behaviors (i.e., recycling, joining environmental groups, and environmental reading) than whites. Using a stratified random sample of 720 respondents from Detroit PMSA, Parker and McDonough [56] also reported that African Americans exhibited significantly lower scores in recycling, composting, and reducing plastic use than European Americans. Based on these findings from the existing literature, we expect that, all else being equal, whites are more likely than minority groups to engage in either personal or public PEBs. Minority groups may be even less likely to take part in public PEBs than whites because they have less power than whites. Nevertheless, the observed white–non-white difference in environmental behaviors is complex because environmentalism mostly reflects the interests of whites and wealthier people [57]. However, if we take the indirect effect of race into account, the relationship between race and PEBs may be different. More recent studies e.g., [58,59,60,61] revealed that non-white minorities consistently expressed greater concerns about climate change, pollution, environmental threats, and environmental protection than whites. These results are not surprising because, as a result of the environmental justice movements since the 1980s, there has been a growing recognition of the disproportionate impacts of environmental injustice and inequality on non-white communities. Hence, we expect that considering whites’ lower level of environmental concern than non-whites, the overall difference between whites and non-whites may be relatively small.
The relationship between religion and PEBs is not well established. However, a couple of studies [12,62] did find various bivariate or multivariate associations between religious variables (including conservative eschatology, religious tradition, and religious commitment) and environmental attitudes or concerns, depending on the populations (e.g., clergy, religious activists, party activists, voting public). The most important argument or finding of these studies is that religious fundamentalism is less environmentally friendly, with secular citizens most likely to be pro-environment [12,62]. Note that the religion–environment nexus in these studies pertains to environmental attitudes or concerns rather than environmental behaviors. Extending this line of argument or finding, we hypothesize that secular residents are more likely to participate in PEBs than their non-secular counterparts, holding other variables constant. This hypothesis is based on the grounds that secular or non-religious residents do not need to accept the mastery-over-nature theological tenet of the Judeo–Christian tradition and its otherworldly eschatology and often emphasize post-material values, such as quality of life [63]. In addition, we expect that secularization increases PEBs through environmental concern because secular residents are more concerned about the environment than their non-secular counterparts, as mentioned above.
2.3. Socioeconomic Status
Socioeconomic status influences PEBs through knowledge, attitudes, and interests. While quite a few socioeconomic characteristics may be potentially linked to PEBs, two variables are particularly salient: education and income. Education increases knowledge about environmental issues; as a result, more educated people should be more likely to take pro-environmental actions than less educated people [9,14,64]. Hence, we expect that education is positively correlated with PEBs. Since education also increases environmental concern [9,14,64], we hypothesize that education can indirectly increase PEBs via environmental concern.
The effect of income on PEBs is not uniform in the literature. Some researchers reported a small positive effect of income on PEBs [29]. Others found that people with a higher income were less likely to take part in recycling activities [65]. It is also common sense that lower-income people are less likely to drive and more likely to use public transit. Still, some studies detected no effect of income on PEBs [22,66]. In light of the traditional argument that people with a higher class status, as measured by income, education, and occupational status, are more concerned about social problems, including environmental problems, we expect that income should be positively associated with PEBs. In addition, since people with a higher income may be less likely to be negatively impacted by environmental problems, they may have less concern about the environment. Thus, income can indirectly influence PEBs through environmental concern.
2.4. Political Factors
Since environmental problems have political roots, political factors are expected to impact people’s environmental concern and behavior. Prior research has suggested that liberals were more likely to show concern about environmental quality, to be sympathetic to environmental causes, and to take pro-environmental actions than conservatives [67,68]. Political ideology is correlated with economic liberalism and PEBs [69]. Hence, we expect that, other things being equal, a higher level of liberalism is associated with a higher level of PEBs. Additionally, since political ideology is correlated with environmental concern [70], liberalism can increase PEBs indirectly through a higher level of environmental concern.
The existing literature suggests that Democrats are more likely to partake in PEBs than Republicans [2,3,46,71]. The reason is that Republicans tend to represent the interests of business and industry, which are concerned about the costs of business and favor less government intervention; however, Democrats are more likely to favor environmental reforms that require government intervention and protect the environment for wider society. Hence, we hypothesize that Democrats are more likely to take part in PEBs than non-Democrats. It is evident that in more recent years partisanship has had important impact on environmental concern, especially on the issue of climate change [72,73,74]. Thus, we expect that party affiliation can also indirectly influence PEBs through environmental concern because Democrats have a higher level of environmental concern than non-Democrats.
3. Materials and Methods
3.1. Data and Sample
The present study utilizes data from the 2010 General Social Survey (GSS) administered by the National Opinion Research Center (NORC) at the University of Chicago. From its inception in 1972 until its latest survey, the GSS only surveyed environmental behaviors three times, in 1998, 2000, and 2010, and some variables were only surveyed once or twice (including three indicators for personal PEBs used in this study). We decided to use GSS 2010 because it is the latest dataset that contains key variables on both personal and public PEBs. GSS 2010 is a nationally representative sample of the non-institutionalized U.S. adult population aged 18 or over based on probability sampling.
Since the GSS only selected one respondent per household for survey, respondents in a larger household had a smaller chance of being selected than those in a smaller household. To address this bias, we used the weight variable designed by the GSS to weight the data so that the findings can be generalized to the U.S. adult population. We also re-ran AMOS using the unweighted data and obtained the same results as the weighted data. We restricted our analysis to the respondents who provided valid answers to our outcome variables—personal and public PEBs (described below). The restriction yielded a sample of 1423 cases for both personal and public PEBs.
3.2. Endogenous Variables
In this study, our main interest lies in finding similar and different determinants of the latent variables or factors for personal and public PEBs instead of specific PEBs. Hence, our ultimate endogenous variables are PEBs, which consist of two latent variables or underlying factors: personal PEBs and public PEBs. The first latent variable is personal PEBs, built upon the following six indicators: (1) driving less, based on the following question: “how often do you cut back on driving a car for environmental reasons?”; (2) recycling cans or bottles, based on the following question: “how often do you make a special effort to sort glass or cans or plastic or papers and so on for recycling?”; (3) buying pesticide-free fruits or vegetables, based on the following question: “how often do you make a special effort to buy fruits and vegetables grown without pesticides or chemicals?”; (4) saving water, based on the following question: “how often do you choose to save or re-use water for environmental reasons?”; (5) reducing fuel, based on the following question: “how often do you reduce the energy or fuel you use at home for environmental reasons?”; and (6) avoiding non-environmentally friendly products, based on the following question: “how often do you avoid buying certain products for environmental reasons?” All boldface words and underlines are originals in the survey questionnaire. Indicators 4, 5, and 6 were only surveyed in 2010. There are four response categories for each of these six indicators: Always (1), Often (2), Sometimes (3), and Never (4). These four response categories were reverse coded so that a higher number indicates a higher level of pro-environmental engagement. A fifth category (either do not have a car or do not have the option to recycle or purchase pesticide-free products) for indicators 1–3, which was not available for indicators 4–6, was recoded as missing because it is inconsistent across the six indicators and would make the variables not ordinal. Before testing the SEM causal model, we performed a confirmatory factor analysis for the measurement model of personal PEBs using principal components analysis as the extraction method and varimax with Keiser normalization as the rotation method. Only one set of factor loadings was generated among these six behaviors after factor rotation, suggesting that only one factor underlies the covariation of these six indicators. All six indicators are good or excellent measurements of the personal PEBs factor, as evidenced by the factor loadings (0.709 for drive less, 0.554 for recycling, 0.671 for buying pesticide-free fruits or vegetables, 0.640 for saving water, 0.720 for reducing fuel, and 0.775 for avoiding non-green products). This factor explains roughly 46.5% of the covariance among these personal PEBs.
The second latent variable is public PEBs, constructed on the following three indicators: (1) signing a petition, based on the following question: “in the last five years, have you signed a petition about an environmental issue?”; (2) donating money, based on the following question: “in the last five years, have you given money to an environmental group?”; and (3) participating in a protest or demonstration, based on the following question: “in the last five years, have you taken part in a protest or demonstration about an environmental issue?” Each of these three indicators has two response categories: Yes (1) and No (2). These indicators were dummy coded. Prior to testing the SEM causal model, we conducted a confirmatory factor analysis for the measurement model of public PEBs using principal components analysis as the extraction method and varimax with Keiser normalization as the rotation method. The factor rotation generated only one set of factor loadings, indicating that there is only one underlying dimension among the three indicators. The factor loadings signify that all three indicators are good or great measures of the public environmental behaviors factor (0.822 for signing a petition, 0.797 for donating money, and 0.526 partaking demonstrations). This factor explains nearly 53% of the covariance among the three indicators.
3.3. Mediating Variable
Our mediating variable is concerns about pollution, which represents environmental concern. We created an index for concerns about pollution by summing the following five indicators: (1) concern about car pollution, based on the following question: “in general, do you think that air pollution caused by cars is…”; (2) concern about nuclear pollution, based on the following question: “in general, do you think that nuclear power stations are…”; (3) concern about chemical pollution, based on the following question: “in general, do you think that pesticides and chemicals used in farming are…”; (4) concern about industrial pollution, based on the following question: “in general, do you think that air pollution caused by industry is…”; and (5) concern about water pollution, based on the following question: “in general, do you think that pollution of America’s rivers, lakes, and streams is…” There are five response categories for each of these indicators: Extremely Dangerous (1), Very Dangerous (2), Somewhat Dangerous (3), Not Very Dangerous (4), and Not Dangerous (5). These response categories were reverse coded to show an increasing level of concern before summation. Compared with factor score, the index is easily interpretable, with a higher score indicating a higher level of concern. The Cronbach alpha for this index is 0.779, suggesting that the indicators are good measures of this index. Technically speaking, concern about pollution is also an endogenous variable as it is influenced by the exogenous variables. In our study, it serves as the intervening variable between the exogenous variables and PEBs.
3.4. Exogenous Variables
Our exogenous variables include demographic, socioeconomic, and political variables, such as gender, age, cohort, urban/rural residency, region, race, religion, education, income, political orientation, and political party affiliation. Gender is a dummy variable coded 1 for female and coded 0 for male. Age is a continuous variable measured by years. Using the cohort variable in the GSS, we created a dummy variable for the post-1960s cohort, coded 1 for the post-1960s cohorts after the commencement of the environmental movement in the U.S. and coded 0 for the earlier cohorts. We created a dummy variable for urban residency, coded 1 for living in an urban area and coded 0 for living in a rural area (i.e., counties having no towns of 10,000 population or more). South is a dummy variable, which is coded 1 for the South and 0 for other regions. We constructed a dummy variable for white with non-white as the reference category. No religion (also labeled atheists or secularists) is a dummy variable coded 1 for no religion and coded 0 for all religions. Two socioeconomic variables are included. Education is a continuous variable measured by years of schooling completed. Income is a continuous variable measured by respondent’s personal inflation-adjusted income converted to constant USD 2000. Because of its very large numbers, we divided income by 1000 so the unit is USD 1000. We included two political variables. One is liberalism, which is an ordinal variable with seven categories ranging from extremely conservative (=1) to extremely liberal (=7). We created a dummy variable for Democrat, which is coded 1 for Democrat and coded 0 for non-Democrat.
3.5. Limitations of the Data
Limitations of the data should be noted. A main limitation is that the data for this study are cross-sectional and were collected in 2010 and therefore may not capture changes over time and any new developments in attitudes and behaviors after 2010. A second limitation is that there are numerous indicators of personal and public PEBs, but we can only use those available in GSS 2010. A third limitation is that while personal PEBs are under the volition of the respondents, some public PEBs, such as signing a petition, may be constrained by the availability of such a petition. Finally, some predictors of PEBs such as community and policy variables, are not available in GSS 2010 and cannot be included in the analysis. These limitations notwithstanding, as the latest available national data representative of the U.S. adult population, GSS 2010 remains the best source of data for this study because it is still valuable and can help fill the gaps in the literature and advance our knowledge about the determinants of PEBs.
3.6. Method of Data Analysis
We used SEM to test our conceptual model and hypotheses. SEM is most appropriate for our study for several reasons. First, our model considers both direct and indirect effects of predictors on PEBs. Second, we included latent variables, such as personal PEBs and public PEBs. Third, SEM can test our measurement models and causal models simultaneously. Fourth, by taking into account error terms, SEM produces more accurate estimates. We implemented SEM through AMOS partly because AMOS has an advantage of handling missing data through maximum likelihood (ML) missing data procedures [75]. Since the values of our latent endogenous variables are factor scores and we have a large sample (N = 1423) that meets the normality and independence assumptions, ML is an appropriate estimation method and also the most widely used estimation technique in SEM.
4. Results
4.1. Descriptive Statistics
Table 1 presents the descriptive statistics of the predictor variables of the sample. The mean of a dummy variable can be interpreted as a percentage after multiplying it by 100. Women made up roughly 56% of the sample vs. about 44% of men. The average age was about 48 years old with a standard deviation of about 17 years. A total of 56% of the respondents belonged to the post-1960 cohort. The racial composition included 75% whites and 25% non-whites. A large majority of the respondents (88.8%) resided in urban areas, and about 11% lived in rural areas. Southerners constituted almost 38% of the sample. Slightly over 18% of the respondents identified as having no religion. On average, respondents had roughly 13.4 years of schooling, or some college. The mean income in constant USD 2000 was about USD 29,572. The mean of liberalism (3.888) on a 7-point scale indicated that typical respondents were middle-of-the road in terms of political orientation. Approximately 35% were Democrats and 65% non-Democrats. Finally, the mean for the concerns about pollution index was 18.8 out of 25, suggesting that respondents were quite concerned about pollution.
4.2. SEM: Personal Pro-Environmental Behaviors
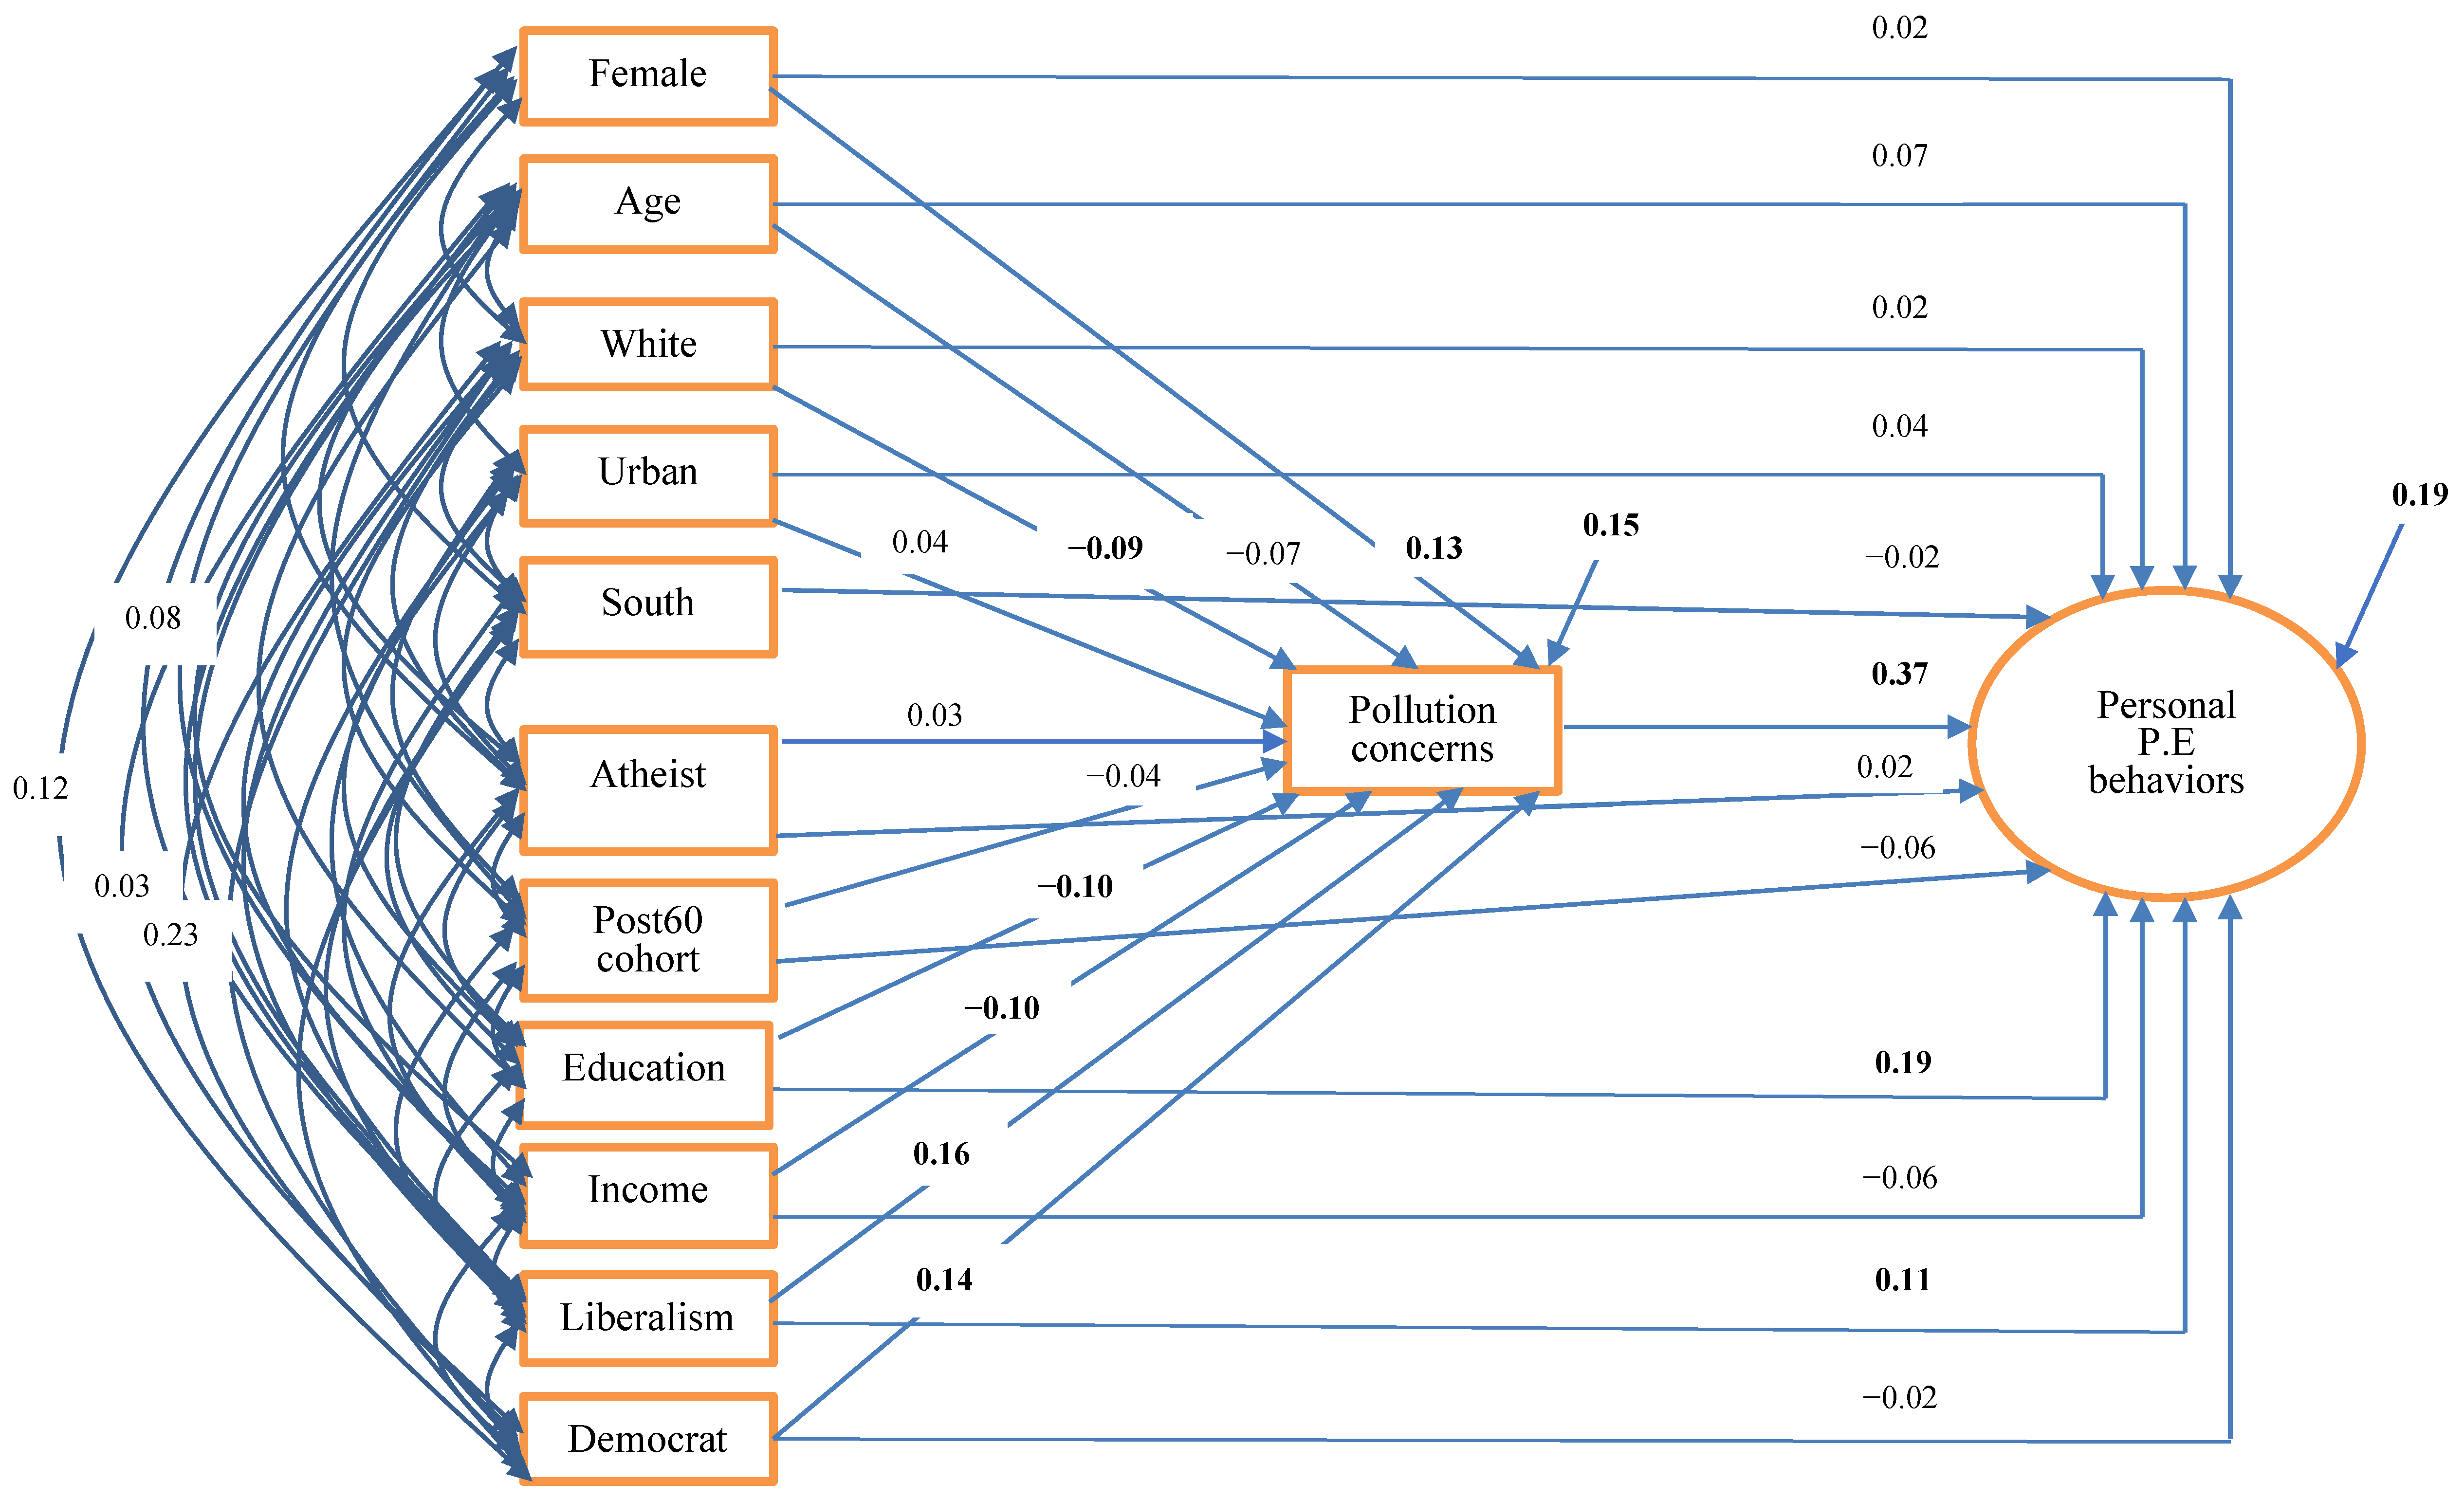
Figure 2 presents the standardized estimates of the structural equation model predicting personal PEBs. To make this diagram less complicated and readable, this model omits the measurement model for the latent variable representing personal PEBs and the many correlation coefficients that make the graph too crowded or illegible. We assume that correlations exist among most pairs of exogenous variables except for the following pairs: female and post-1960s cohort, female and age, female and urban, female and education, Democrat and education, Democrat and post-1960s cohort, Democrat and no religion (or atheist), South and age, and South and post-1960s cohort. AMOS was able to generate the estimates with some missing values for the whole sample. This model fits the data well, as indicated by the satisfactory values of goodness-of-fit measures: NFI = 0.932, CFI = 0.946, IFI = 0.947, RMSEA = 0.048, and NC = 4.289.
Figure 2 shows the standardized regression coefficients. Table 2 displays the standardized direct, indirect, and total effects of the predictors on the latent variable for personal PEBs. As evident in Figure 2 and Table 2, concerns about pollution had a significant, sizable direct and total effect (β = 0.365) on personal PEBs. The coefficient indicates that as concerns about pollution increased, so did personal PEBs. This result provides strong support for our hypothesis.
The two socioeconomic predictors included in this study (i.e., education and income) had significant total effects on personal PEBs. Consistent with our hypothesis, education had a significant positive direct effect (β = 0.187) on personal PEBs. Education also had a significant but unexpected effect on concerns about pollution (β = −0.10) and therefore a negative indirect effect (β = −0.035) on personal PEBs. Despite this, the total effect of education (β = 0.152) remained positive and significant, suggesting that the higher the level of education, the greater the involvement in personal environmental protection activities.
As shown in Figure 2 and Table 2, income had an unexpected insignificant negative direct effect (β = −0.064) on personal PEBs; however, income had an expected significant negative effect on pollution concerns and therefore a negative indirect effect on personal PEBs (β = −0.035). The total effect was negative and significant (β = −0.099). The negative association between income and personal PEBs is contradictory to our expectation. The results suggest that people with a higher income were less likely to partake in personal environmental behaviors. This was maybe because richer people care less about the financial benefits of actions, such as driving less, saving a few cents through recycling, and reducing fuel consumption, compared with poorer ones.
We include two political predictors. As anticipated, liberalism had a significant positive direct effect and a positive indirect effect via pollution concerns on personal PEBs. The total effect of liberalism was also significant. However, in terms of direct effect, there was no significant difference between Democrats and non-Democrats in personal PEBs. In terms of indirect effect, Democrats were indeed more concerned about pollution and therefore more likely to engage in personal PEBs. Overall, the total effect of being a Democrat is small and insignificant.
None of the demographic predictors had a significant effect on personal PEBs. As shown in Figure 2 and Table 2, in terms of direct effect, there was no statistically significant difference between women and men in personal PEBs, although women were slightly more likely to take part in personal environmental protection activities than men. Women were significantly more concerned about pollution than men (β = 0.13) and therefore indirectly more likely to engage in personal pro-environmental actions. As can be seen in Table 2, the indirect effect of gender (β = 0.049) more than doubled its direct effect (β = 0.022). The total effect of gender (β = 0.071) was marginal. Thus, the evidence is not strong enough to support our hypothesis about the effect of gender on personal PEBs.
As shown in Figure 2 and Table 2, the direct effect of age (β = 0.066) was positive but statistically insignificant at the 0.05 level. Since age was negatively associated with pollution concerns, the indirect effect of age on personal PEBs was negative (β = −0.022), leading to the total effect of 0.044. This result suggests that overall age did not make a significant difference in personal PEBs, although older people were somewhat more likely to engage in personal PEBs than younger people.
Table 2 shows that the direct effect of being white on personal PEBs (β = 0.017) was positive but not significant at the 0.05 level, but whites were significantly less concerned about pollution than non-whites (Figure 2), with a small negative indirect effect (β = −0.033). The total effect of being white (−0.016) was negative but not statistically significant at the 0.05 level.
Contrary to our hypothesis, either directly or indirectly, urban residents appeared to be not significantly different from rural residents in personal PEBs, despite all of the positive direct, indirect, and total effects of urban residency. Additionally, at odds with our hypothesis despite the expected negative sign, Southerners were not much different from people in other regions of the country in personal PEBs. Secular residents or those who were affiliated with no religion were slightly more likely to take part in personal PEBs than non-secular residents or religious people, but none of the direct, indirect, and total effects were large enough to be significant. Additionally, unexpectedly, the direct, indirect, and total effects of post-1960s cohort on personal PEBs were negative and insignificant.
In terms of the total effects, concerns about pollution appear to be the most important predictor of personal environmental protection behaviors, followed by liberalism, education, and income.
Despite the focus of our study on the latent variables for PEBs, we tested six SEM models for the six specific personal PEBs separately since some prior studies (e.g., [76]) detected some interesting differences across certain personal PEBs. To avoid lengthening the paper, we only show the standardized total effects of the predictors on these behaviors in Table 3 (six additional figures and six additional tables of decomposed effects are available upon request). The models fit the data nearly perfectly, as shown by the model–fit statistics at the bottom of the table. As displayed in Table 3, the most consistent finding is that concerns about pollution increased personal PEBs across all six behaviors. Education significantly increased four out of six behaviors, except for buying pesticide-free fruits or vegetables and saving water. Liberalism had a significant positive effect on five of the six behaviors, except for saving water. There are other intriguing findings. For example, women differed significantly from men only in buying pesticide-free fruits or vegetables. Age was positively correlated with all six behaviors but only significantly with recycling. Compared with non-whites, whites had a significantly lower level of driving less and buying pesticide-free fruits or vegetables but a significantly higher level of recycling. Urban residents significantly drove less than rural residents. Southerners recycled significantly less frequently than residents in other regions. Coinciding with common sense, people with a higher income had a significantly lower frequency of driving less, saving fuel, and avoiding non-green products than those with a lower income. Party affiliation and secularization made no difference in any of the six behaviors.
4.3. SEM: Public Pro-Environmental Behaviors
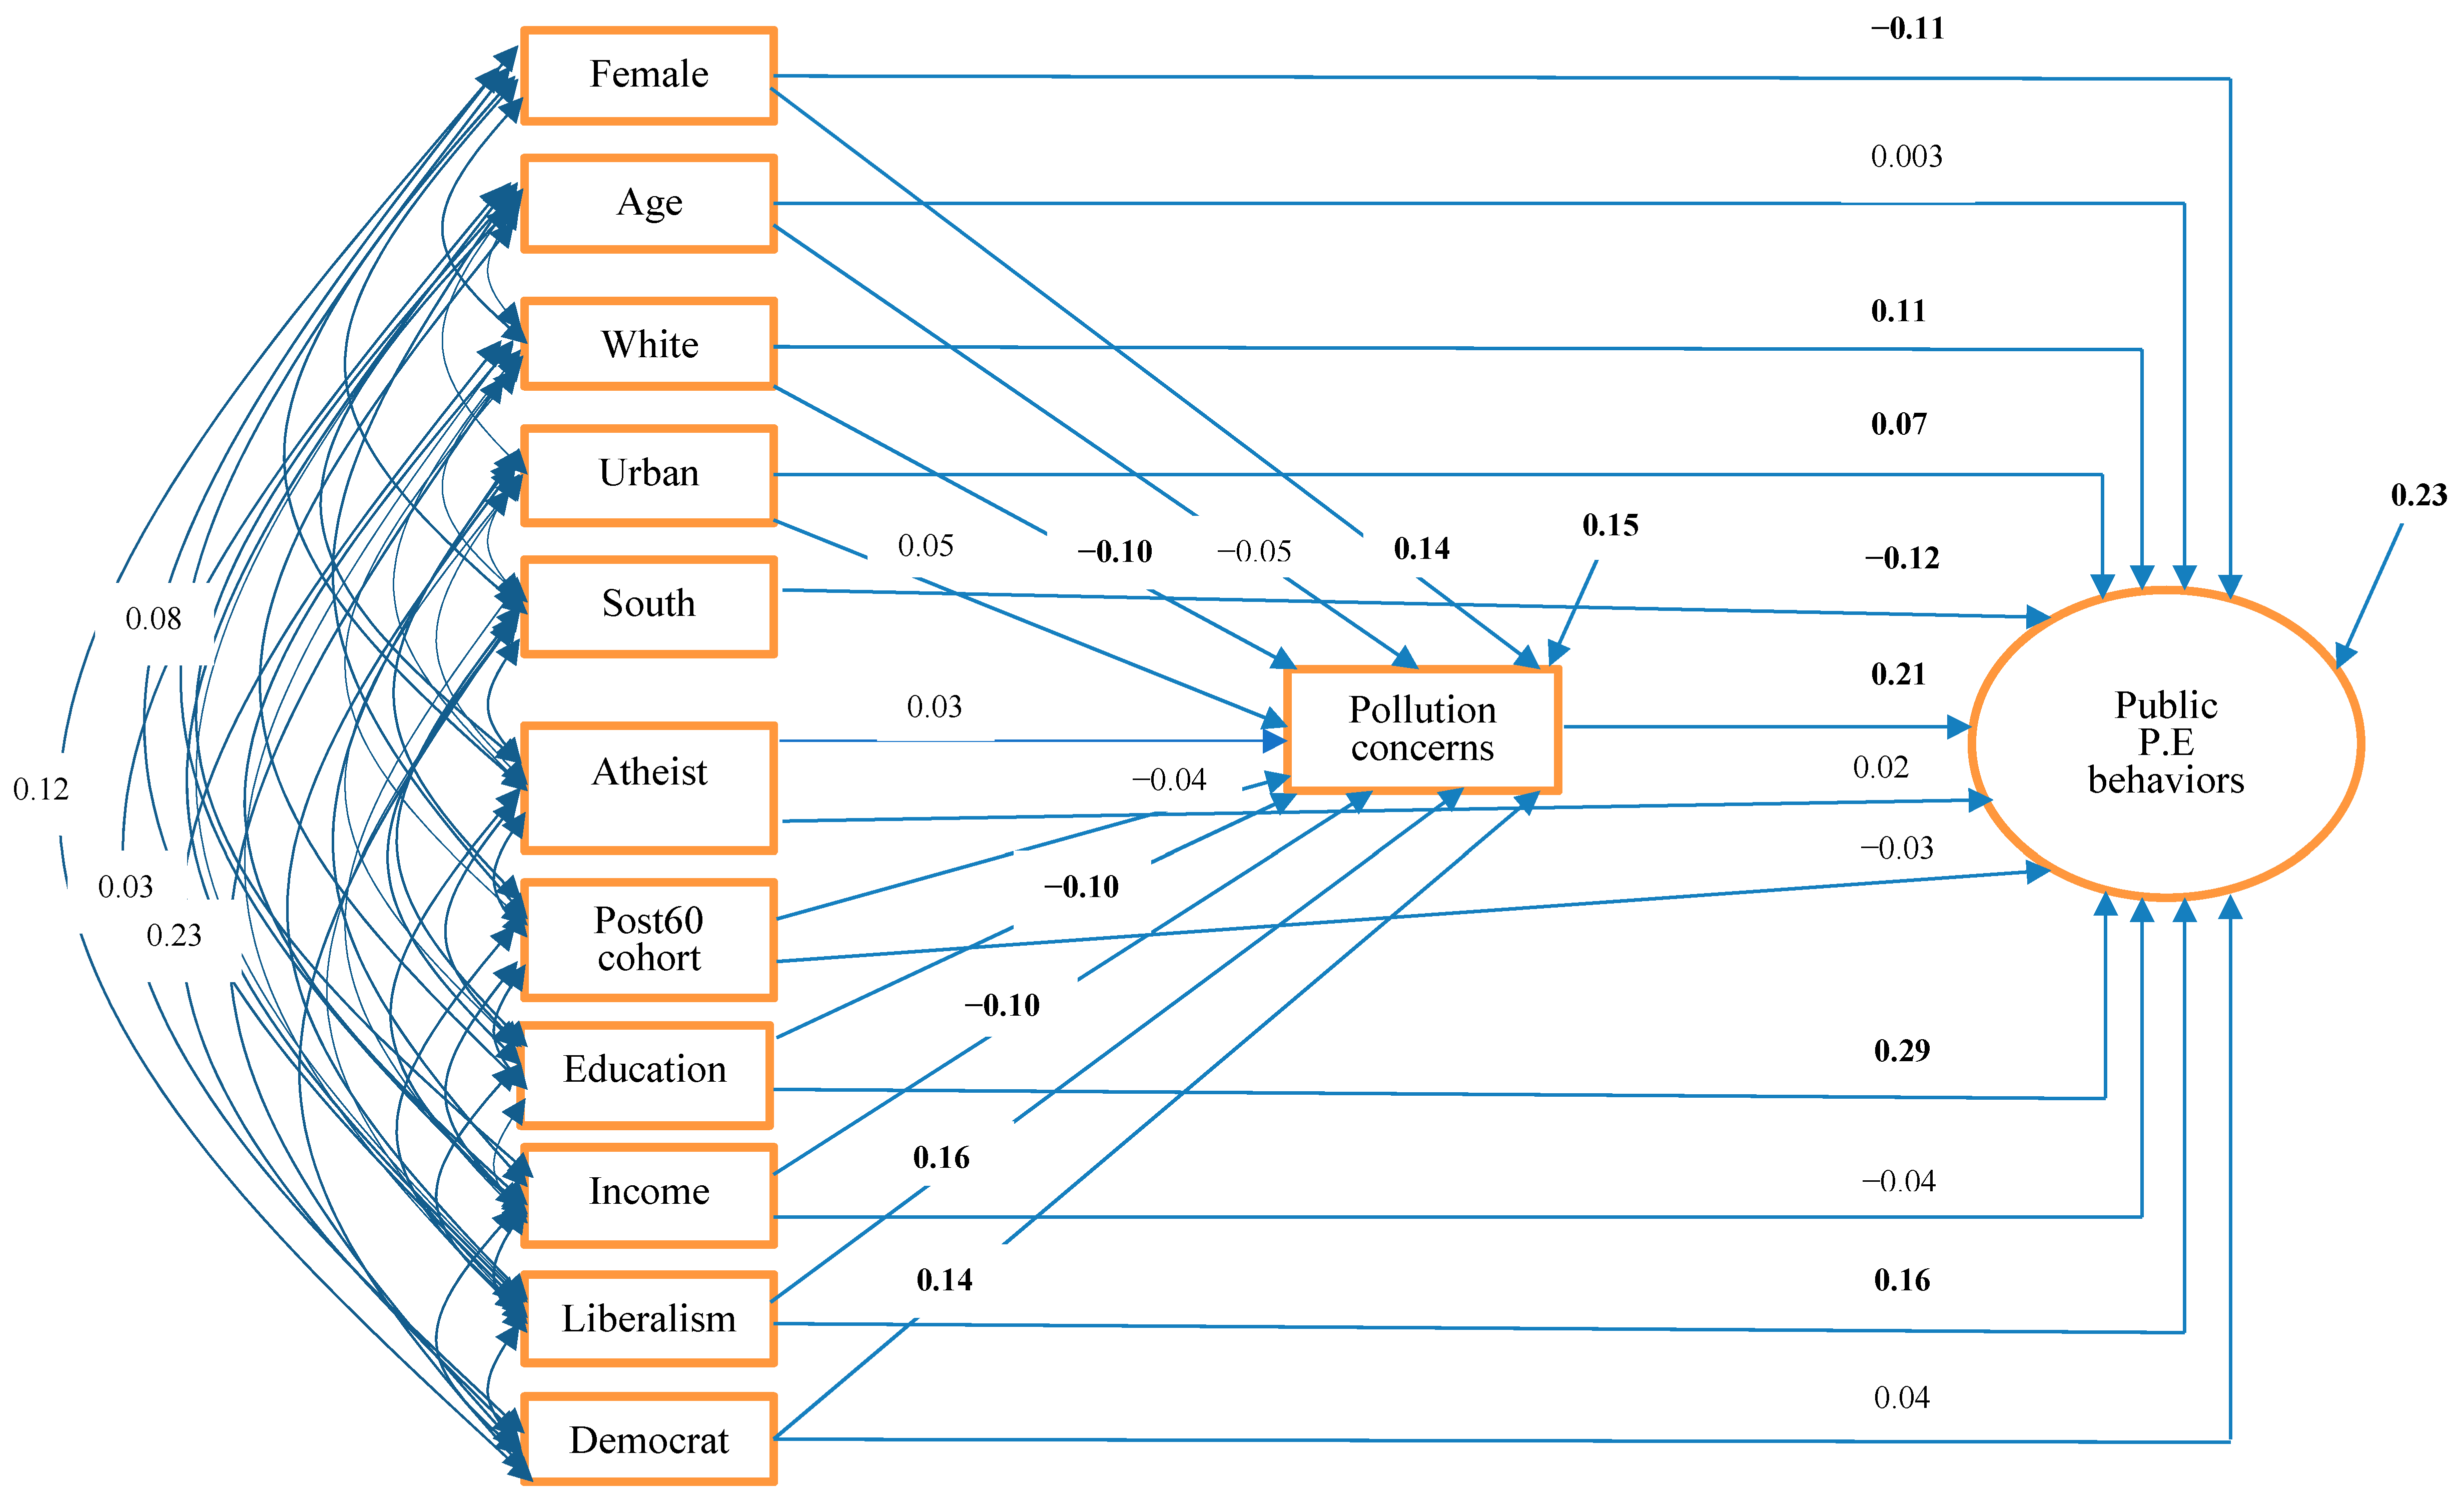
Figure 3 displays the standardized estimates of the structural equation model predicting public PEBs. To make this diagram less crowded, this model omits the measurement model for the latent variable representing public PEBs and many correlation coefficients. We assume correlations among most pairs of exogenous variables except for the following pairs: female and post-1960s cohort, female and age, female and urban, female and education, Democrat and education, Democrat and post-1960s cohort, Democrat and no religion (or atheist), South and age, and South and post-1960s cohort. AMOS was able to generate the estimates with some missing values for the whole sample. The goodness-of-fit measures (NFI = 0.982, CFI = 0.992, IFI = 0.992, RMSEA = 0.024, and NC = 1.799) indicate that this model fits the data very well.
Figure 3 presents the standardized regression coefficients. Table 4 shows the standardized direct, indirect, and total effects of the predictors on the latent variable for public PEBs. It is evident from Figure 3 and Table 4 that concerns about pollution had a significant direct and total effect (β = 0.209) on public PEBs. The coefficient indicates that concerns about pollution were positively correlated with public PEBs. This evidence is in agreement with our hypothesis.
The two socioeconomic predictors included in this study (i.e., education and income) had mixed effects on public PEBs. In line with our hypothesis, education had a significant sizable positive direct effect (β = 0.294) on public PEBs. Education also had a significant, but unexpected, effect on concerns about pollution (β = −0.10) and therefore a negative indirect effect (β = −0.022) on public PEBs. In spite of this, the total effect of education (β = 0.272) remained positive and significant, indicating that education increased public PEBs.
However, the effect of income was insignificant, albeit positive, as hypothesized. Figure 3 and Table 4 show that income had an expected but insignificant positive direct effect (β = 0.037) on public PEBs, and income also had an expected significant negative effect on pollution concerns and therefore a negative indirect effect on public PEBs (β = −0.02). The total effect was trivial and insignificant (β = 0.017).
The effects of the political predictors on public PEBs are consistent with our hypotheses. As hypothesized, liberalism had a significant positive direct effect and a positive in-direct effect via pollution concerns on public PEBs. The total effect of liberalism was also significant (β = 0.19). Although the direct effect (β = 0.035) and indirect effect (β = 0.03) of being Democrat on public PEBs were both relatively small, the combined or total effect of being Democrat was significant (β = 0.065).
Several demographic variables had a significant effect on public PEBs. As shown in Figure 3 and Table 4, in terms of direct effect, women were significantly less likely than men to engage in public PEBs. On the other hand, women were significantly more concerned about pollution than men (β = 0.14) and therefore indirectly more likely to engage in public pro-environmental actions (β = 0.029). After the indirect effect offsets some direct effects, the total effect of gender (β = 0.084) was still significant and negative. The evidence lends support to our hypothesis that women are less likely than men to engage in public PEBs.
As shown in Figure 3 and Table 4, whites were significantly more likely than non-whites to participate in public PEBs directly (β = 0.111). Since whites were significantly less concerned about pollution than non-whites (Figure 3), the indirect effect of being white was small and negative (β = −0.020). After some offset, the total effect of being white (0.091) was still positive and statistically significant at the 0.05 level. This evidence largely coincides with our hypothesis.
Directly, urban residents were significantly more likely than rural residents to take part in public PEBs. Adding the small positive indirect effect, the total effect of urban residency (β = 0.075) was positive and significant at the 0.05 level. The results are in line with our hypothesis. Additionally, consistent with our hypothesis, Southerners were significantly less likely to engage in public PEBs than those in other regions.
On the other hand, age appeared to play an insignificant role in public PEBs, whether directly or indirectly. Similarly, the post-1960s cohort was not much different from the pre-1960s cohort in public PEBs in any way. Secularization also had insignificant direct, indirect, and total effects on public PEBs, despite the positive sign of the coefficients.
In terms of the total effects, the following continuous or ordinal variables had the greatest effects on public PEBs in the order of importance: education, concerns about pollution, and liberalism. The dummy variables in the order of importance included region, race, gender, urban residency, and party affiliation.
In spite of the focus of our study on the latent variables for PEBs, we also tested three SEM models for the three specific public PEBs separately (three additional figures and three additional tables of decomposed effects are available upon request). Table 5 presents the standardized total effects of the predictors on these behaviors. The models fit the data nearly perfectly, as shown by the model–fit statistics at the bottom of the table. It is evident from Table 5 that concerns about pollution had a cross-the-board positive effect on all three public PEBs. Both education and liberalism significantly increased petitions and donations but not protesting. Whites were significantly more likely to sign petitions and donate money than non-whites. Urban residents were significantly more likely to sign petitions than rural residents. Secular residents were significantly more likely to protest than their non-secular counterparts. Income was positively associated with donation but negatively related with protesting. Southerners were significantly less likely to sign petitions and donate money for environmental causes than non-Southerners. Women were significantly less likely than men to sign petitions but not significantly different from men in donation or protesting. Age, cohort, and party affiliation had no significant effect on any of the three behaviors.
5. Discussion and Conclusions
This study proposes a conceptual model for explaining both personal and public PEBs and tests the model and hypotheses using the latest available nationally representative data from GSS 2010 and SEM. The results reveal that environmental concern, education, and liberalism demonstrate similar significant positive impacts on both personal and public PEBs; however, income, gender, race, urban/rural residency, region, and party affiliation have differential effects on personal and public PEBs. Age, cohort, and religion have no significant effects on both outcome variables.
Specifically, this study finds that, in line with our hypothesis, concerns about pollution consistently increased both personal and public PEBs and that this variable is the most important predictor of personal PEBs and the second most important predictor of public PEBs. These results confirm findings in the literature [14,28,29,30,31,32,76], suggesting that concerns about the environment oftentimes translate into PEBs [10]. Education is also found to have a positive and sizable effect on both personal and public PEBs. The higher the level of education, the greater the personal and public PEBs (β = 0.152 for personal PEBs and β = 0.272 for public PEBs). These results lend support to our hypothesis and align with findings in the literature [9,14,15,29,64], suggesting that education is a positive force for environmental protection.
Our study detects a significant positive effect of liberal ideology on both personal and public PEBs. Liberalism affects both types of behaviors directly and indirectly in the positive direction, and its effects are quite large. The findings appear to fall in line with our hypothesis and findings in the literature [67,68]. The findings also suggest that liberal orientation can translate into personal and public PEBs.
We found that income has differential effects on personal and public PEBs. We detected a significant negative total effect of personal income on personal PEBs. This finding is at odds with our hypothesis and the argument of Hines et al. [29]; however, it is consistent with the finding of Ferrara and Missios [65]. A plausible explanation is that richer people may care less about saving a bit of money from driving and reducing gasoline consumption than poorer people. Our separate analyses in Table 3 indeed confirm that income was negatively correlated with driving less, reducing fuel, and buying non-green products. On the other hand, we found that income had no effect on public PEBs.
Several demographic predictors show different effects on personal and public PEBs. Many of our findings challenge or depart from findings in the literature. One of these findings pertains to gender difference. While McCright and Xiao [26] claimed robust gender differences in environmental behaviors across time and nations, our results indicate that gender differences may not be very robust. For personal PEBs, women did not differ significantly from men, although they had a higher level of environmental concern and were somewhat more likely to engage in personal pro-environmental acts than men. This finding definitely challenges the established conclusion that women overshadow men in personal PEBs [1,4,5,6,14,33,35,36]. It also points to the importance of controlling for important predictors in order to accurately assess the gender differences in personal PEBs; however, it may suggest that this gender difference may have diminished to the point of insignificance in recent years. On the other hand, we found that women were less likely than men to participate in public PEBs. This finding is consistent with the results in some existing studies [35,37,38], but it is contradictory to the results of some other studies [1,36]. It is important to understand that despite their lower rates of participation in the mainstream environmental movements through demonstrations, petitions, and leadership in environmental organizations, women are indeed more likely than men to participate in environmental justice movements as mothers [39,40,41].
Our findings evince that contrary to our expectation, there was no significant difference between whites and non-whites in personal PEBs, holding other variables constant. This result largely coincides with Newman and Fernandes’s [3] finding, which they labeled as “consumer behavior”. Our separate analyses reveal that whites had a significantly lower frequency of driving less and buying pesticide-free fruits or vegetables but a higher frequency of recycling than non-whites (Table 3). We also validated that whites indeed had a significantly lower level of concern about pollution than non-whites. Our findings suggest that non-whites’ greater environmental concerns compared with whites may not have translated into personal PEBs yet. However, as hypothesized, whites were significantly more likely to participate in public PEBs than non-whites despite their lower level of environmental concerns. Since very few studies have tested racial differences in PEBs rather than in environmental attitudes or concerns, our results call for further verification in future research. It would also be desirable to differentiate among other races in PEBs if data permit so.
We found that urban residents were more likely than rural residents to engage in public PEBs; however, the urban–rural difference in personal PEBs was not large enough to reach statistical significance at the 0.05 level. These findings from the United States provide partial support for our hypothesis and corroborate findings in most existing studies [16,45,46], despite contradicting the results of Berenguer et al. [10] and Huddart-Kennedy et al. [13], which are based on data from Spain and Canada, respectively.
This study detects no regional variation in personal PEBs. However, we found that Southerners were significantly less likely to take part in public PEBs than residents in other parts of the U.S. These results suggest that Americans in different parts of the country may behave similarly in personal environmental protection acts, such as driving less, reducing fuel, saving water, buying green, and avoiding non-green products. One exception is that Southerners did have a lower frequency of recycling than non-Southerners (Table 3). Nevertheless, people in more conservative regions, such as the South, will engage in fewer political acts for environmental causes, such as petitions and donations, than those in other regions.
Our hypothesis that Democrats are more likely than non-Democrats to engage in PEBs is supported for public PEBs but rejected for personal PEBs. Our findings partly validate and partly contest the claims in the existing literature [2,3,46,71]. These findings suggest that political party affiliation may have differential effects on personal and public PEBs. They also speak against judging individual PEBs solely based on party affiliation.
Our findings reject both hypotheses of an inverse relationship [14,29] and a positive relationship [42] between age and PEBs. Our results show no statistically significant relationship between age and both personal and public PEBs, although older people were slightly more likely to take part in personal PEBs than younger ones. Our results also confirm that older people were somewhat less concerned about pollution than younger ones; however, the difference did not reach statistical significance at the 0.05 level. Evidently, environmental attitudes or concerns are not identical to environmental behaviors (see, for example, [16,46,68]).
Our results also provide no support for our hypothesis that the post-1960s cohorts after the onset of the environmental movement are more likely to take part in PEBs than their pre-1960s counterparts. The evidence reveals no significant difference between the post-1960s and pre-1960s cohorts in both personal and public PEBs. Thus, we cannot make the assumption that people’s behaviors conform to the norms of the time they were born into.
Our hypothesis that secular residents are more likely to participate in PEBs than non-secular residents is not borne out. The evidence shows that secular residents were not significantly different from non-secular residents in both personal and public PEBs, albeit they were slightly more concerned about pollution and a bit more likely to partake in PEBs than their non-secular counterparts. These findings appear to challenge the arguments of Guth et al. [12] and Hand and Van Liere [62].
A major contribution of the current study to the literature is that this study analyzes the determinants of both personal and public PEBs simultaneously by developing a structural equation model and using the latest available nationally representative data from GSS 2010 and an appropriate statistical technique—SEM. Unlike most studies, we treat personal and public PEBs as latent variables and environmental concern as a mediating variable. Our findings suggest that the determinants of personal and public PEBs are similar in some cases but different in others. Our results confirm some existing findings but challenge many of those reported in the literature. Our findings call for a reassessment of the effects of some demographic, socioeconomic, and political variables on PEBs in the age of climate change using new data. Since GSS 2010 is a nationally representative sample, our findings can be generalized to the U.S. population; however, we caution against the generalization of our findings to other countries.
Knowledge about the determinants of PEBs gained from this study will help guide policies and practices for environmental protection in the future and will help decelerate the global crisis generated by anthropogenic climate change. For instance, our findings about the consistent and large impacts of concerns about pollution on PEBs suggest that raising an awareness of pollution appears to be an effective way of combating human-made climate change. Increasing education will also help increase PEBs and therefore slow down the global environmental crisis. On the other hand, knowledge about the differential effects of income, gender, race, urban residency, region, and party affiliation on personal and public PEBs suggests that different ways of motivating different groups for different types of pro-environmental activities will be most effective in promoting PEBs and in alleviating the effect of human-made climate change.
Author Contributions
Conceptualization, P.Q.Y. and M.L.W.; methodology, P.Q.Y.; software, P.Q.Y.; validation, P.Q.Y.; formal analysis, P.Q.Y. and M.L.W.; writing—original draft preparation, M.L.W.; writing—review, editing, and revisions, P.Q.Y.; visualization, P.Q.Y.; supervision, P.Q.Y. All authors have read and agreed to the published version of the manuscript.
Funding
This research received no external funding.
Institutional Review Board Statement
Ethical review and approval were waived for this study because it uses public-use data that require no approval.
Informed Consent Statement
Not applicable.
Data Availability Statement
Publicly available data were used for this study. The data set is available online at https://gss.norc.org/get-the-data (accessed on 16 September 2018).
Acknowledgments
An earlier version of this paper was presented at the 7th Annual International Conference on Architecture, Civil, & Environment Engineering in Singapore on 27–28 May 2019. We appreciate the feedback of anonymous reviewers during the peer review process.
Conflicts of Interest
The authors declare no conflict of interest.
References
- Hunter, L.M.; Hatch, A.; Johnson, A. Cross-national gender variation in environmental behaviors. Soc. Sci. Q. 2004, 85, 677–694. [Google Scholar] [CrossRef]
- Konisky, D.M.; Milyo, J.; Richardson, L.E., Jr. Environmental policy attitudes: Issues, geographical scale, and political trust. Soc. Sci. Q. 2008, 89, 1066–1085. [Google Scholar] [CrossRef]
- Newman, T.P.; Fernandes, R. A re-assessment of factors associated with environmental concern and behavior using the 2010 General Social Survey. Environ. Educ. Res. 2016, 22, 153–175. [Google Scholar] [CrossRef]
- Briscoe, M.D.; Givens, J.E.; Hazboun, S.O.; Krannich, R.S. At home, in public, and in between: Gender differences in public, private and transportation pro-environmental behaviors in the US Intermountain West. Environ. Sociol. 2019, 5, 374–392. [Google Scholar] [CrossRef]
- Feng, W.; Reisner, A. Factors influencing private and public environmental protection behaviors: Results from a survey of residents in Shaanxi, China. J. Environ. Manag. 2011, 92, 429–436. [Google Scholar] [CrossRef] [PubMed]
- Hadler, M.; Haller, M. Global activism and nationally driven recycling: The influence of world society and national contexts on public and private environmental behaviors. Int. Sociol. 2011, 26, 315–345. [Google Scholar] [CrossRef]
- Hadler, M.; Haller, M. A shift from public to private environmental behavior: Findings from Hadler and Haller (2011) revised and extended. Int. Sociol. 2013, 28, 484–489. [Google Scholar] [CrossRef]
- Chung, M.G.; Kang, H.; Dietz, T.; James, P.; Liu, J. Activating values for encouraging pro-environmental behavior: The role of religious fundamentalism and willingness to sacrifice. J. Environ. Stud. Sci. 2019, 9, 371–385. [Google Scholar] [CrossRef]
- Rajapaksa, D.; Islam, M.; Managi, S. Pro-environmental behavior: The role of public perception in infrastructure and the social factors for sustainable development. Sustainability 2018, 10, 937. [Google Scholar] [CrossRef]
- Berenguer, J.; Corraliza, J.A.; Martin, R. Rural-urban differences in environmental concern, attitudes, and actions. Eur. J. Psychol. Assess. 2005, 1, 128–138. [Google Scholar] [CrossRef]
- Dietz, T.; Stern, P.C.; Guagnano, G.A. Social structural and social psychological bases of environmental concern. Environ. Behav. 1998, 30, 450–471. [Google Scholar] [CrossRef]
- Guth, J.L.; Green, J.C.; Kellstedt, L.A.; Smidt, C.E. Faith and the environment: Religious beliefs and attitudes on environmental policy. Am. J. Political Sci. 1995, 39, 364–382. [Google Scholar] [CrossRef]
- Huddart-Kennedy, E.; Beckley, T.M.; McFarlane, B.L.; Nadeau, S. Rural-urban differences in environmental concern in Canada. Rural Sociol. 2009, 74, 309–329. [Google Scholar] [CrossRef]
- Johnson, C.Y.; Bowker, J.M.; Cordell, H.K. Ethnic variation in environmental belief and behavior: An examination of the new ecological paradigm in a social psychological context. Environ. Behav. 2004, 36, 157–186. [Google Scholar] [CrossRef]
- Rampedi, I.T.; Ifegbesan, A.P. Understanding the determinants of pro-environmental behavior among South Africans: Evidence from structural equation model. Sustainability 2022, 14, 3218. [Google Scholar] [CrossRef]
- Van Liere, K.D.; Dunlap, R.E. The social bases of environmental concern: A review of hypotheses, explanations and empirical evidence. Public Opin. Q. 1980, 44, 181–197. [Google Scholar] [CrossRef]
- Steg, L. Values, norms, and intrinsic motivation to act pro-environmentally. Annu. Rev. Environ. Resour. 2016, 41, 277–292. [Google Scholar] [CrossRef]
- Jaeger, A.B. Forging hegemony: How recycling became a popular but inadequate response to accumulating waste, social problems. Soc. Probl. 2018, 65, 395–415. [Google Scholar] [CrossRef]
- MacBride, S. Recycling Reconsidered; MIT Press: Boston, MA, USA, 2011. [Google Scholar]
- Schnaiberg, A. Plastic policies, prologue and parable: Reframing recycling. Environ. Technol. Soc. 1994, 77, 1–3. [Google Scholar]
- Stern, P.C. Toward a coherent theory of environmentally significant behavior. J. Soc. Issues 2000, 56, 407–424. [Google Scholar] [CrossRef]
- Whitmarsh, L.; O’Neill, S. Green identity, green living? The role of pro-environmental self-identity in determining consistency across diverse pro-environmental behaviors? J. Environ. Psychol. 2010, 30, 305–314. [Google Scholar] [CrossRef]
- Barr, S.; Gilg, A.W.; Ford, N. The household energy gap: Examining the divide between habitual- and purchase-related conservation behaviours. Energy Policy 2005, 33, 1425–1444. [Google Scholar] [CrossRef]
- Inskeep, B.D.; Attari, S.Z. The water short list: The most effective actions U.S. households can take to curb water use. Environ. Sci. Policy Sustain. Dev. 2014, 56, 4–15. [Google Scholar] [CrossRef]
- Whitmarsh, L. Behavioural responses to climate change: Asymmetry of intentions and impacts. J. Environ. Psychol. 2009, 29, 13–23. [Google Scholar] [CrossRef]
- McCright, A.M.; Xiao, C. Gender and environmental concern: Insights from recent work and for future research. Soc. Nat. Resour. 2014, 27, 1109–1113. [Google Scholar] [CrossRef]
- Barkan, S. Explaining public support for the environmental movement: A civic voluntarism model. Soc. Sci. Q. 2004, 85, 913–937. [Google Scholar] [CrossRef]
- Fransson, N.; Garling, T. Environmental concern: Conceptual definitions, measurement methods, and research findings. J. Environ. Psychol. 1999, 19, 369–382. [Google Scholar] [CrossRef]
- Hines, J.M.; Hungerford, H.R.; Tomera, A.N. Analysis and synthesis of research on responsible environmental behavior: A meta-analysis. J. Environ. Educ. 1987, 18, 1–8. [Google Scholar] [CrossRef]
- Minton, A.P.; Rose, R.L. The effects of environmental concern on environmentally friendly consumer behavior: An exploratory study. J. Bus. Res. 1997, 40, 37–48. [Google Scholar] [CrossRef]
- Tatic, K.; Cinjarevic, M. Relationship between environmental concern and green purchasing behavior. Interdiscip. Manag. Res. 2010, 6, 801–810. [Google Scholar]
- Urban, J.; Scasny, M. Exploring domestic energy-saving: The role of environmental concern and background variables. Energy Policy 2012, 47, 69–80. [Google Scholar] [CrossRef]
- Dzialo, L. The feminization of environmental responsibility: A quantitative cross-national analysis. Environ. Sociol. 2017, 3, 427–437. [Google Scholar] [CrossRef]
- Zelezny, L.C.; Chua, P.P.; Aldrich, C. Elaborating on gender differences in environmentalism. J. Soc. Issues 2000, 56, 443–457. [Google Scholar] [CrossRef]
- Blocker, T.J.; Eckberg, D.L. Environmental issues as women’s issues: General concerns and local hazards. Soc. Sci. Q. 1989, 70, 586–593. [Google Scholar]
- Tindall, D.B.; Davies, S.; Mauboule, C. Activism and conservation behavior in an environmental movement: The contradictory effects of gender. Soc. Nat. Resour. 2003, 16, 909–932. [Google Scholar] [CrossRef]
- Davidson, D.J.; Freudenburg, W.R. Gender and environmental risk concerns: A review and analysis of available research. Environ. Behav. 1996, 28, 302–329. [Google Scholar] [CrossRef]
- McStay, J.; Dunlap, R.E. Male-female differences in concern for environmental quality. Int. J. Women Stud. 1983, 6, 291–301. [Google Scholar]
- Bell, S.E.; Braun, Y.A. Coal, identity, and the gendering of environmental justice activism in central Appalachia. Gend. Soc. 2010, 24, 794–813. [Google Scholar] [CrossRef]
- Culley, M.R.; Angelique, H.L. Women’s gendered experiences as long-term Three Mile Island activists. Gend. Soc. 2003, 17, 445–461. [Google Scholar] [CrossRef]
- Peeples, J.A.; DeLuca, K.M. The truth of the matter: Motherhood, community, and environmental justice. Women’s Stud. Commun. 2006, 29, 59–87. [Google Scholar] [CrossRef]
- Wiernik, B.M.; Ones, D.S.; Dilchert, S. Age and environmental sustainability: A meta-analysis. J. Manag. Psychol. 2013, 28, 826–856. [Google Scholar] [CrossRef]
- Roberts, B.W.; Walton, K.E.; Viechtbauer, W. Patterns of mean-level change in personality traits across the life course: A meta-analysis of longitudinal studies. Psychol. Bull. 2006, 132, 1–25. [Google Scholar] [CrossRef] [PubMed]
- Smola, K.W.; Sutton, C.D. Generational differences: Revisiting generational work values for the new millennium. J. Organ. Behav. 2002, 23, 363–382. [Google Scholar] [CrossRef]
- Arcury, T.A.; Christianson, E.H. Rural-urban differences in environmental knowledge and actions. J. Environ. Educ. 1993, 25, 19–25. [Google Scholar] [CrossRef]
- Jones, R.E.; Dunlap, R.E. The social bases of environmental concern: Have they changed over time? Rural Sociol. 1992, 57, 28–47. [Google Scholar] [CrossRef]
- Reinhart, R.J. Global Warming Age Gap: Young Americans Most Worried. Available online: https://news.gallup.com/poll/234314/global-warming-age-gap-younger-americans-worried.aspx) (accessed on 7 May 2021).
- Nawrotzki, R.J.; Pampel, F.C. Cohort change and the diffusion of environmental concern: A cross-national analysis. Popul. Environ. 2013, 35, 1–25. [Google Scholar] [CrossRef]
- Pampel, F.C.; Hunter, L.M. Cohort change, diffusion, and support for environmental spending in the United States. Am. J. Sociol. 2012, 118, 420–448. [Google Scholar] [CrossRef]
- Yang, Y. Social inequalities in happiness in the United States, 1972-2004: An age-period-cohort analysis. Am. Sociol. Rev. 2008, 73, 204–226. [Google Scholar] [CrossRef]
- Safford, T.; Cutler, M.; Henly, M.; Norman, K.C.; Levin, P.S. Urban-Rural Differences in Concern about the Environment and Jobs in the Puget Sound Region. University of New Hampshire: Carsey Institute, USA. 2012. Available online: https://core.ac.uk/download/pdf/72048635.pdf (accessed on 8 May 2021).
- Bennett, K.; McBeth, M.K. Contemporary Western rural USA economic composition: Potential implications for environmental policy and research. Environ. Manag. 1998, 22, 371–381. [Google Scholar] [CrossRef]
- Jones, C.C. Environmental justice in rural context: Land-application of biosolids in Central Virginia. Environ. Justice 2011, 4, 220–233. [Google Scholar] [CrossRef]
- Kelly-Reif, K.; Wing, S. Urban-rural exploitation: An underappreciated dimension of environmental injustice. J. Rural Stud. 2016, 47, 350–358. [Google Scholar] [CrossRef]
- Jones, R.E.; Fly, J.M.; Cordell, H.K. How green is my valley? Tracking rural and urban environmentalism in the Southern Appalachian ecoregion. Rural Sociol. 1999, 64, 482–499. [Google Scholar] [CrossRef]
- Parker, J.D.; McDonough, M.H. Environmentalism of African Americans: An analysis of the subculture and barriers theories. Environ. Behav. 1999, 31, 155–177. [Google Scholar] [CrossRef]
- Purifoy, D. On the Stubborn Whiteness of Environmentalism. Inside Higher Ed. Available online: https://www.insidehighered.com/advice/2018/06/22/how-environmentalism-academe-today-excludes-people-color-opinion (accessed on 8 May 2021).
- Macias, T. Environmental risk perception among race and ethnic groups in the United States. Ethnicities 2016, 16, 111–129. [Google Scholar] [CrossRef]
- Medina, V.; DeRonda, A.; Ross, N.; Curtin, D.; Jia, F. Revisiting environmental belief and behavior among ethnic groups in the U.S. Front. Psychol. 2019, 10, 629. [Google Scholar] [CrossRef]
- Pearson, A.R.; Ballew, M.T.; Naiman, S.; Schuldt, J.P. Race, class, gender and climate change communication. In Oxford Research Encyclopedia of Climate Science; Von Storch, H., Ed.; Oxford University Press: New York, NY, USA, 2017; Available online: https://oxfordre.com/climatescience/view/10.1093/acrefore/9780190228620.001.0001/acrefore-9780190228620-e-412 (accessed on 9 May 2021). [CrossRef]
- Whittaker, M.; Segura, G.M.; Bowler, S. Racial/ethnic group attitudes toward environmental protection in California: Is “environmentalism” still a white phenomenon? Political Res. Q. 2005, 58, 435–447. [Google Scholar] [CrossRef]
- Hand, C.M.; Van Liere, K.D. Religion, mastery-over-nature, and environmental concern. Soc. Forces 1984, 63, 555–570. [Google Scholar] [CrossRef]
- Inglehart, R. Cultural Shift; Princeton University Press: Princeton, NJ, USA, 1990. [Google Scholar]
- Meyer, A. Does education increase pro-environmental behaviors? Evidence from Europe. Ecol. Econ. 2015, 116, 108–121. [Google Scholar] [CrossRef]
- Ferrara, I.; Missios, P. Recycling and water diversion effectiveness: Evidence from Canada. Environ. Resour. Econ. 2005, 30, 221–238. [Google Scholar] [CrossRef]
- De Silva, D.G.; Pownall, R.A. Going green: Does it depend on education, gender or income? Appl. Econ. 1996, 46, 573–586. [Google Scholar] [CrossRef]
- Currie, S.; Choma, B. Sociopolitical ideology and the morality of green behaviour. Environ. Politics 2017, 27, 1–20. [Google Scholar] [CrossRef]
- Daniels, D.P.; Krosnick, J.A.; Tichy, M.P.; Tompson, T. Public opinion on environmental policy in the United States. In Handbook of U.S. Environmental Policy; Kraft, M., Kamieniecki, S., Eds.; Oxford University Press: New York, USA, 2012; pp. 461–486. [Google Scholar]
- Moyano-Díaz, E.; Palomo-Vélez, G.; Vergara-Bravo, J. Political ideology, economic liberalism and pro-environmental behaviour. Psyecology 2019, 10, 127–150. [Google Scholar] [CrossRef]
- Cruz, S.M. The relationships of political ideology and party affiliation with environmental concern: A meta-analysis. J. Environ. Psychol. 2017, 53, 81–91. [Google Scholar] [CrossRef]
- Dunlap, R.E.; Xiao, C.; McCright, A.M. Politics and environment in America: Partisan and ideological cleavages in public support for environmentalism. Environ. Politics 2001, 10, 23–48. [Google Scholar] [CrossRef]
- Guber, D.L. A cooling climate for change? Party polarization and the politics of global warming. Am. Behav. Sci. 2013, 57, 93–115. [Google Scholar] [CrossRef]
- McCright, A.M. Political orientation moderates Americans’ beliefs and concern about climate change: An editorial comment. Clim. Chang. 2011, 104, 243–253. [Google Scholar] [CrossRef]
- McCright, A.M.; Dunlap, R.E. The politicization of climate change and polarization in the American public’s views of global warming, 2001–2010. Sociol. Q. 2011, 52, 155–194. [Google Scholar] [CrossRef]
- Tabachnick, B.G.; Fidell, L. Using Multivariate Statistics, 7th ed.; Pearson: New York, NY, USA, 2019. [Google Scholar]
- Allen, S.; Dietz, T.; McCright, A.M. Measuring household energy efficiency behaviors with attention to behavioral plasticity in the United States. Energy Res. Soc. Sci. 2015, 10, 133–140. [Google Scholar] [CrossRef]
Figure 1.
Conceptual model predicting pro−environmental (P.E.) behaviors.

Figure 2.
Standardized estimates of structural equation model predicting personal pro-environmental (P.E.) behaviors (measurement model and some correlations not shown; boldface indicates significant at the 0.05 or lower level).
Figure 2.
Standardized estimates of structural equation model predicting personal pro-environmental (P.E.) behaviors (measurement model and some correlations not shown; boldface indicates significant at the 0.05 or lower level).

Figure 3.
Standardized estimates of structural equation model predicting public pro-environmental (P.E.) behaviors (measurement model and some correlations not shown; boldface indicates significant at the 0.05 or lower level).
Figure 3.
Standardized estimates of structural equation model predicting public pro-environmental (P.E.) behaviors (measurement model and some correlations not shown; boldface indicates significant at the 0.05 or lower level).


Table 1.
Means and standard deviations (SD) of predictor variables used in the analysis,.GSS 2010, N = 1423.
Table 1.
Means and standard deviations (SD) of predictor variables used in the analysis,.GSS 2010, N = 1423.
| Variables | Mean | SD |
|---|---|---|
| Female | 0.560 | 0.496 |
| Age | 48.036 | 17.443 |
| Whites | 0.750 | 0.435 |
| Urban | 0.888 | 0.312 |
| South | 0.377 | 0.486 |
| Post60 cohort | 0.560 | 0.492 |
| No religion | 0.184 | 0.389 |
| Education | 13.418 | 0.308 |
| Income | 29,572.000 | 28,704.260 |
| Liberalism (7-point scale) | 3.888 | 1.467 |
| Democrat | 0.353 | 0.471 |
| Concerns about pollution | 18.833 | 3.394 |
Table 2.
Decomposition of the standardized effects of predictors on personal pro-environmental behaviors, GSS 2010, N = 1423.
Table 2.
Decomposition of the standardized effects of predictors on personal pro-environmental behaviors, GSS 2010, N = 1423.
| Predictor | Direct Effect | Indirect Effect | Total Effect |
|---|---|---|---|
| Concerns about pollution | 0.365 *** | NA | 0.365 *** |
| Female | 0.022 | 0.049 | 0.071 |
| Age | 0.066 | −0.022 | 0.044 |
| White | 0.017 | −0.033 | −0.016 |
| Urban | 0.037 | 0.016 | 0.053 |
| South | −0.023 | NA | −0.023 |
| Atheist | 0.017 | 0.010 | 0.027 |
| Post60 cohort | −0.056 | −0.016 | −0.072 |
| Education | 0.187 *** | −0.035 | 0.152 *** |
| Income in $1000 | −0.064 | −0.035 | −0.099 * |
| Liberalism | 0.108 *** | 0.057 | 0.165 *** |
| Democrat | −0.024 | 0.050 | 0.026 |
* p ≤ 0.05, *** p ≤ 0.001. NA—Not applicable. NFI = 0.932, CFI = 0.946, IFI = 0.947, RMSEA = 0.048, NC = 4.289.
Table 3.
Standardized total effects of predictors on specific personal pro-environmental behaviors, GSS 2010, N = 1423.
Table 3.
Standardized total effects of predictors on specific personal pro-environmental behaviors, GSS 2010, N = 1423.
| Predictor | Drive Less | Recycle | Buy Pesticide- Free Fruits/Veges | Save Water | Reduce Fuel | Avoid Non-Green Products |
|---|---|---|---|---|---|---|
| Concerns about pollution | 0.230 *** | 0.179 *** | 0.234 *** | 0.164 *** | 0.230 *** | 0.269 *** |
| Female | 0.018 | 0.024 | 0.093 ** | 0.042 | 0.046 | 0.044 |
| Age | 0.028 | 0.114 * | 0.027 | 0.021 | 0.050 | 0.009 |
| White | −0.078 ** | 0.056 * | −0.066 * | −0.006 | −0.022 | 0.035 |
| Urban | 0.056 * | 0.038 | 0.015 | 0.015 | 0.040 | 0.033 |
| South | −0.015 | −0.180 *** | 0.016 | −0.006 | −0.007 | 0.016 |
| Atheist | 0.037 | −0.016 | −0.012 | −0.012 | 0.008 | 0.052 |
| Post60 cohort | −0.127 ** | −0.041 | 0.044 | 0.005 | −0.055 | −0.048 |
| Education | 0.067 * | 0.147 *** | 0.035 | 0.019 | 0.080 ** | 0.166 *** |
| Income in $1000 | −0.133 *** | 0.035 | −0.004 | −0.068 | −0.071 * | −0.078 * |
| Liberalism | 0.157 *** | 0.090 ** | 0.084 * | 0.039 | 0.091 ** | 0.134 *** |
| Democrat | −0.015 | 0.011 | 0.035 | −0.014 | 0.025 | 0.037 |
* p ≤ 0.05, ** p ≤ 0.01, *** p ≤ 0.001. Driving less: NFI = 0.998, CFI = 1.000, RMSEA = 0.000, NC = 0.427; Recycling: NFI = 0.998, CFI = 1.000, RMSEA = 0.000, NC = 0.422; Buying pesticide-free fruits/veges: NFI = 0.998, CFI = 1.000, RMSEA = 0.000, NC = 0.428; Saving water: NFI = 0.998, CFI = 1.000, RMSEA = 0.000, NC = 0.428; Reducing fuel: NFI = 0.998, CFI = 1.000, RMSEA = 0.000, NC = 0.427; Avoiding non-green products: NFI = 0.998, CFI = 1.000, RMSEA = 0.000, NC = 0.426.
Table 4.
Decomposition of the standardized effects of predictors on public pro-environmental behaviors, GSS 2010, N = 1423.
Table 4.
Decomposition of the standardized effects of predictors on public pro-environmental behaviors, GSS 2010, N = 1423.
| Predictor | Direct Effect | Indirect Effect | Total Effect |
|---|---|---|---|
| Concerns about pollution | 0.209 *** | NA | 0.209 *** |
| Female | −0.113 *** | 0.029 | −0.084 * |
| Age | 0.003 | −0.011 | −0.008 |
| White | 0.111 *** | −0.020 | 0.091 * |
| Urban | 0.065 * | 0.010 | 0.075 * |
| South | −0.116 *** | NA | −0.116 *** |
| Atheist | 0.018 | 0.006 | 0.024 |
| Post60 cohort | −0.029 | −0.008 | −0.037 |
| Education | 0.294 *** | −0.022 | 0.272 *** |
| Income in $1000 | 0.037 | −0.020 | 0.017 |
| Liberalism | 0.158 *** | 0.032 | 0.190 *** |
| Democrat | 0.035 | 0.030 | 0.065 * |
* p ≤ 0.05, *** p ≤ 0.001. NA – Not applicable. NFI = 0.982, CFI = 0.992, IFI = 0.992, RMSEA = 0.023, NC = 1.799.
Table 5.
Standardized total effects of predictors on specific public pro-environmental behaviors, GSS 2010, N = 1423.
Table 5.
Standardized total effects of predictors on specific public pro-environmental behaviors, GSS 2010, N = 1423.
| Predictor | Signing Petition | Donating Money | Protesting |
|---|---|---|---|
| Concerns about pollution | 0.126 *** | 0.177 *** | 0.064 * |
| Female | −0.084 ** | −0.028 | −0.016 |
| Age | −0.020 | 0.018 | −0.018 |
| White | 0.065 * | 0.060 * | 0.031 |
| Urban | 0.071 * | 0.021 | 0.034 |
| South | −0.097 *** | −0.054 * | −0.030 |
| Atheist | 0.023 | −0.013 | 0.080 ** |
| Post60 cohort | −0.052 | 0.008 | 0.006 |
| Education | 0.216 *** | 0.160 *** | 0.033 |
| Income in $1000 | −0.028 | 0.100 ** | −0.087 * |
| Liberalism | 0.137 *** | 0.132 *** | 0.022 |
| Democrat | 0.045 | 0.039 | 0.061 |
* p ≤ 0.05, ** p ≤ 0.01, *** p ≤ 0.001. Signing petition: NFI = 0.998, CFI = 1.000, IFI = 1.000, RMSEA = 0.000, NC = 0.431; Donating money: NFI = 0.998, CFI = 1.000, IFI = 1.000, RMSEA = 0.000, NC = 0.428; Protesting: NFI = 0.998, CFI = 1.000, IFI = 1.000, RMSEA = 0.000, NC = 0.430.
Disclaimer/Publisher’s Note: The statements, opinions and data contained in all publications are solely those of the individual author(s) and contributor(s) and not of MDPI and/or the editor(s). MDPI and/or the editor(s) disclaim responsibility for any injury to people or property resulting from any ideas, methods, instructions or products referred to in the content. |
© 2023 by the authors. Licensee MDPI, Basel, Switzerland. This article is an open access article distributed under the terms and conditions of the Creative Commons Attribution (CC BY) license (https://creativecommons.org/licenses/by/4.0/).
Share and Cite
MDPI and ACS Style
Yang, P.Q.; Wilson, M.L. Explaining Personal and Public Pro-Environmental Behaviors. Sci 2023, 5, 6. https://doi.org/10.3390/sci5010006
AMA Style
Yang PQ, Wilson ML. Explaining Personal and Public Pro-Environmental Behaviors. Sci. 2023; 5(1):6. https://doi.org/10.3390/sci5010006
Chicago/Turabian StyleYang, Philip Q., and Michaela LaNay Wilson. 2023. "Explaining Personal and Public Pro-Environmental Behaviors" Sci 5, no. 1: 6. https://doi.org/10.3390/sci5010006