Review on Alzheimer Disease Detection Methods: Automatic Pipelines and Machine Learning Techniques


Abstract
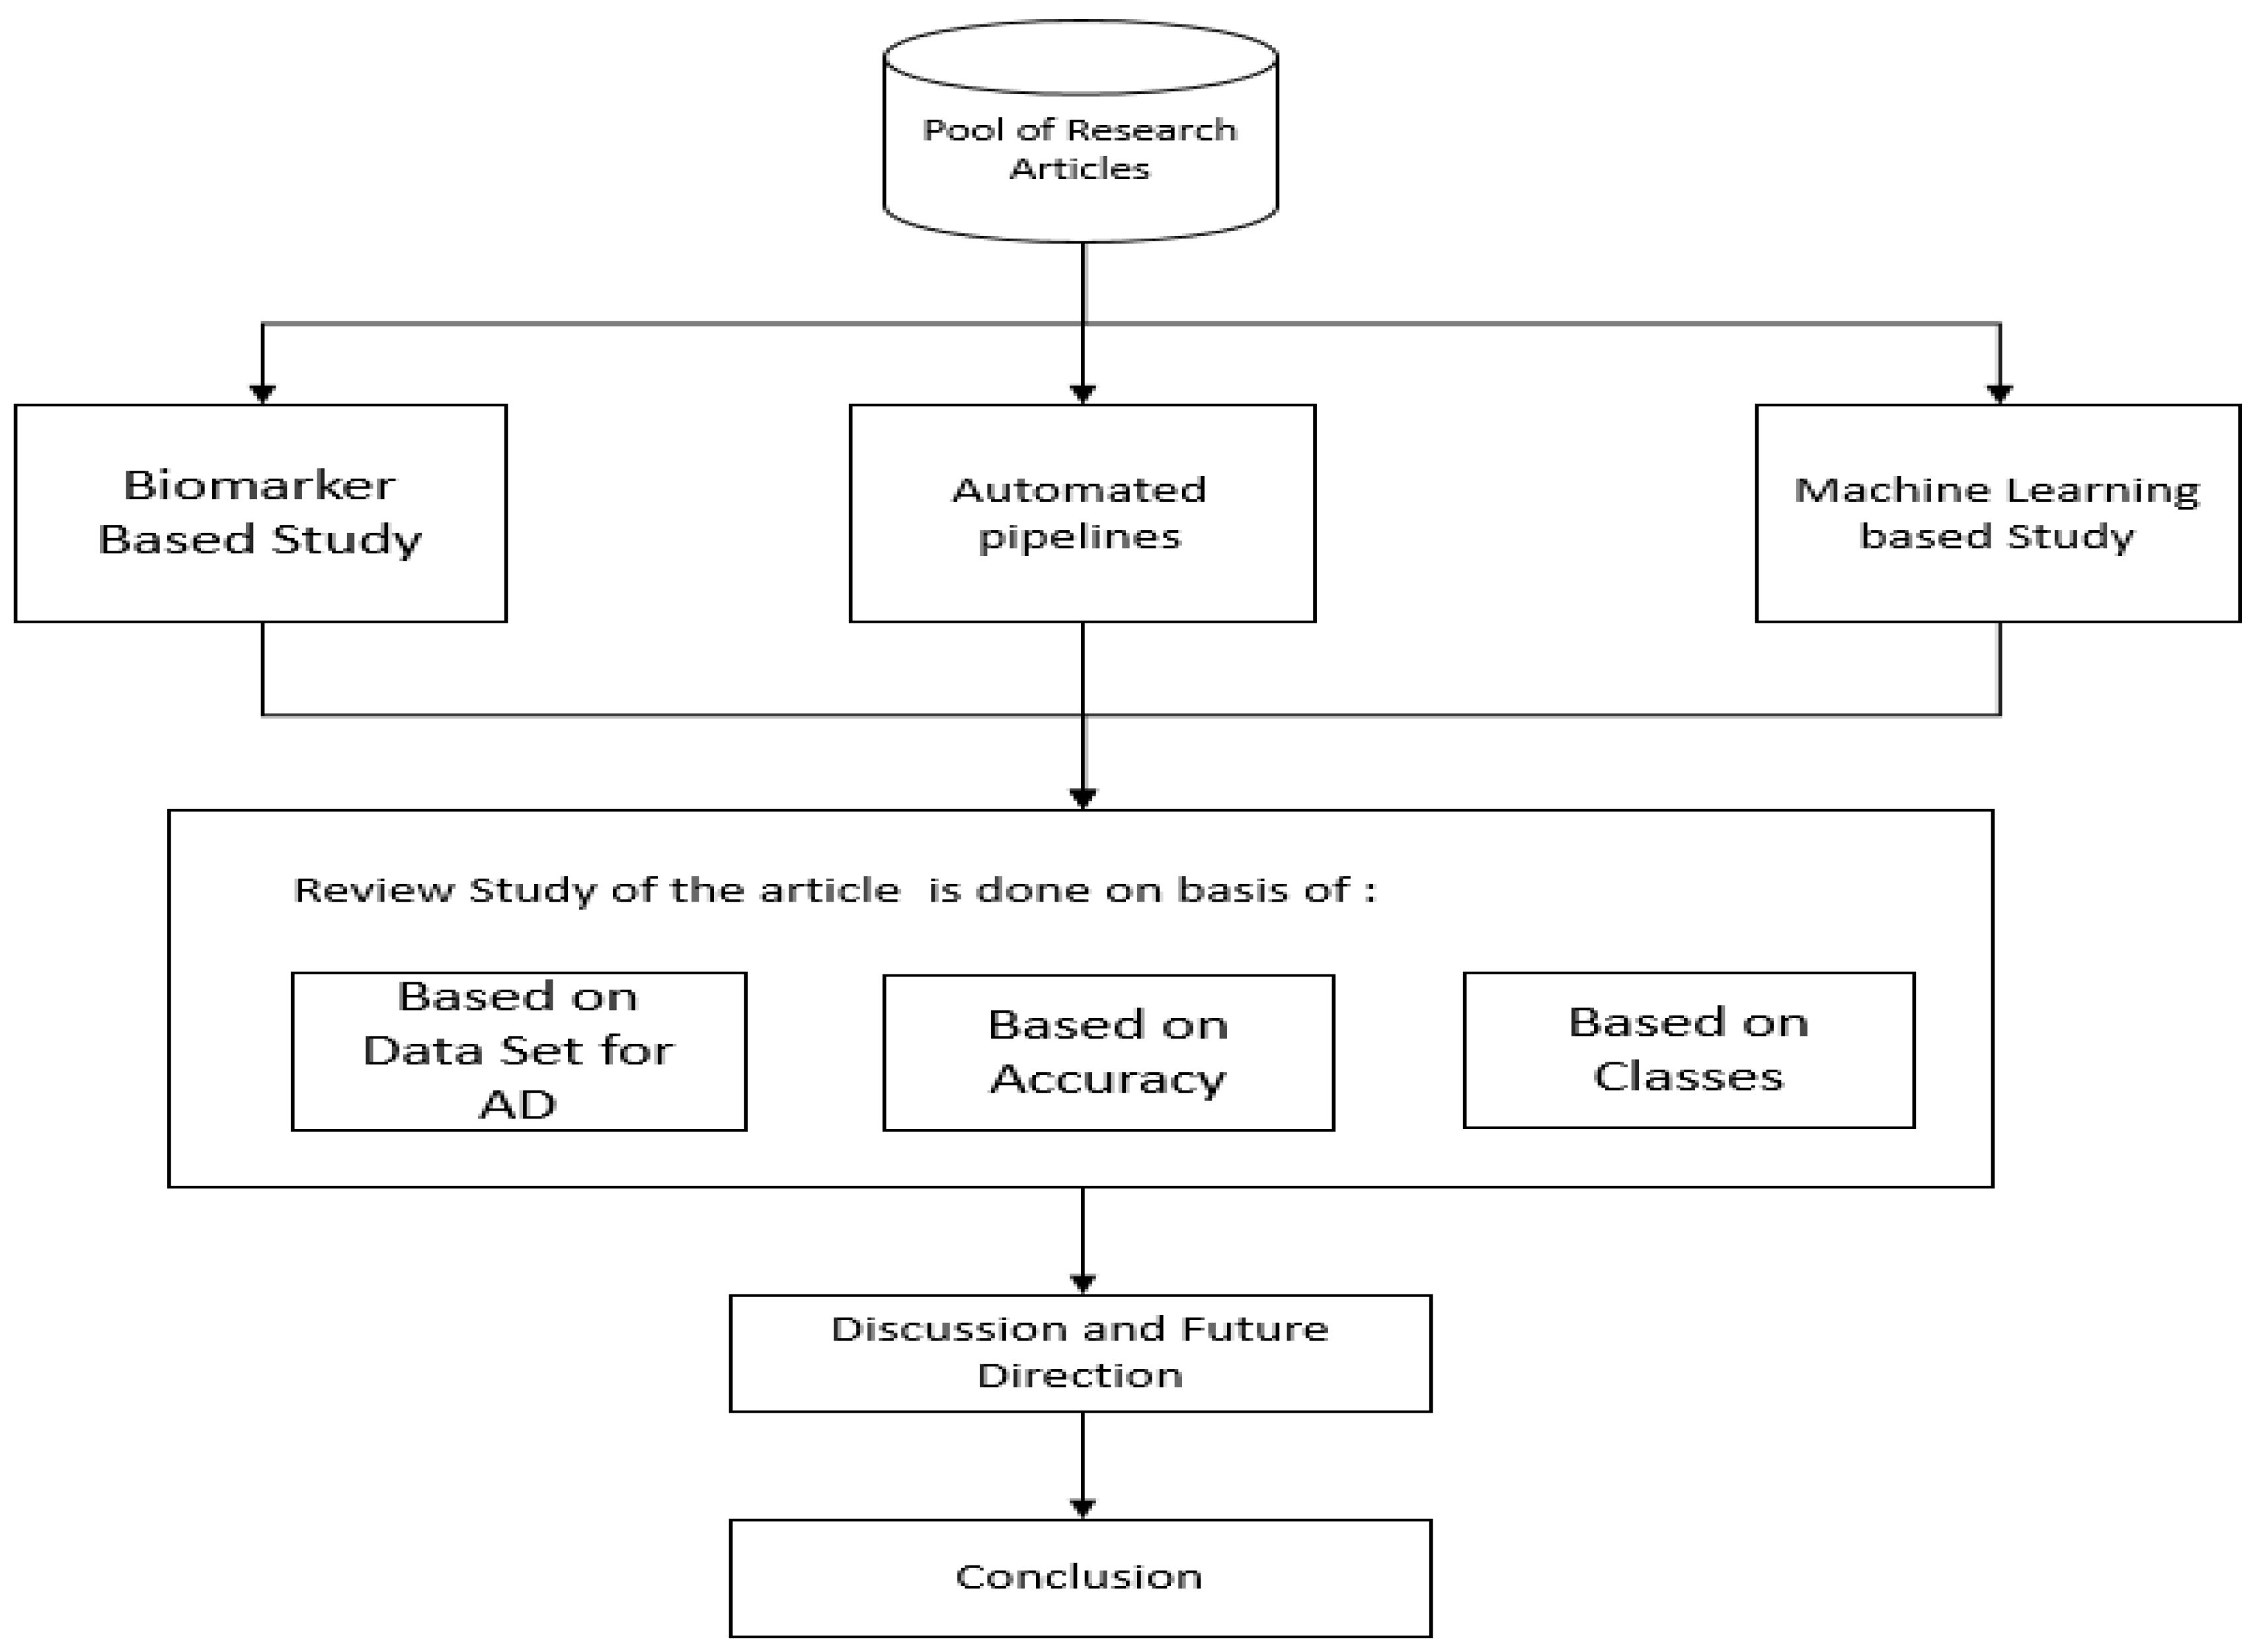
:1. Introduction
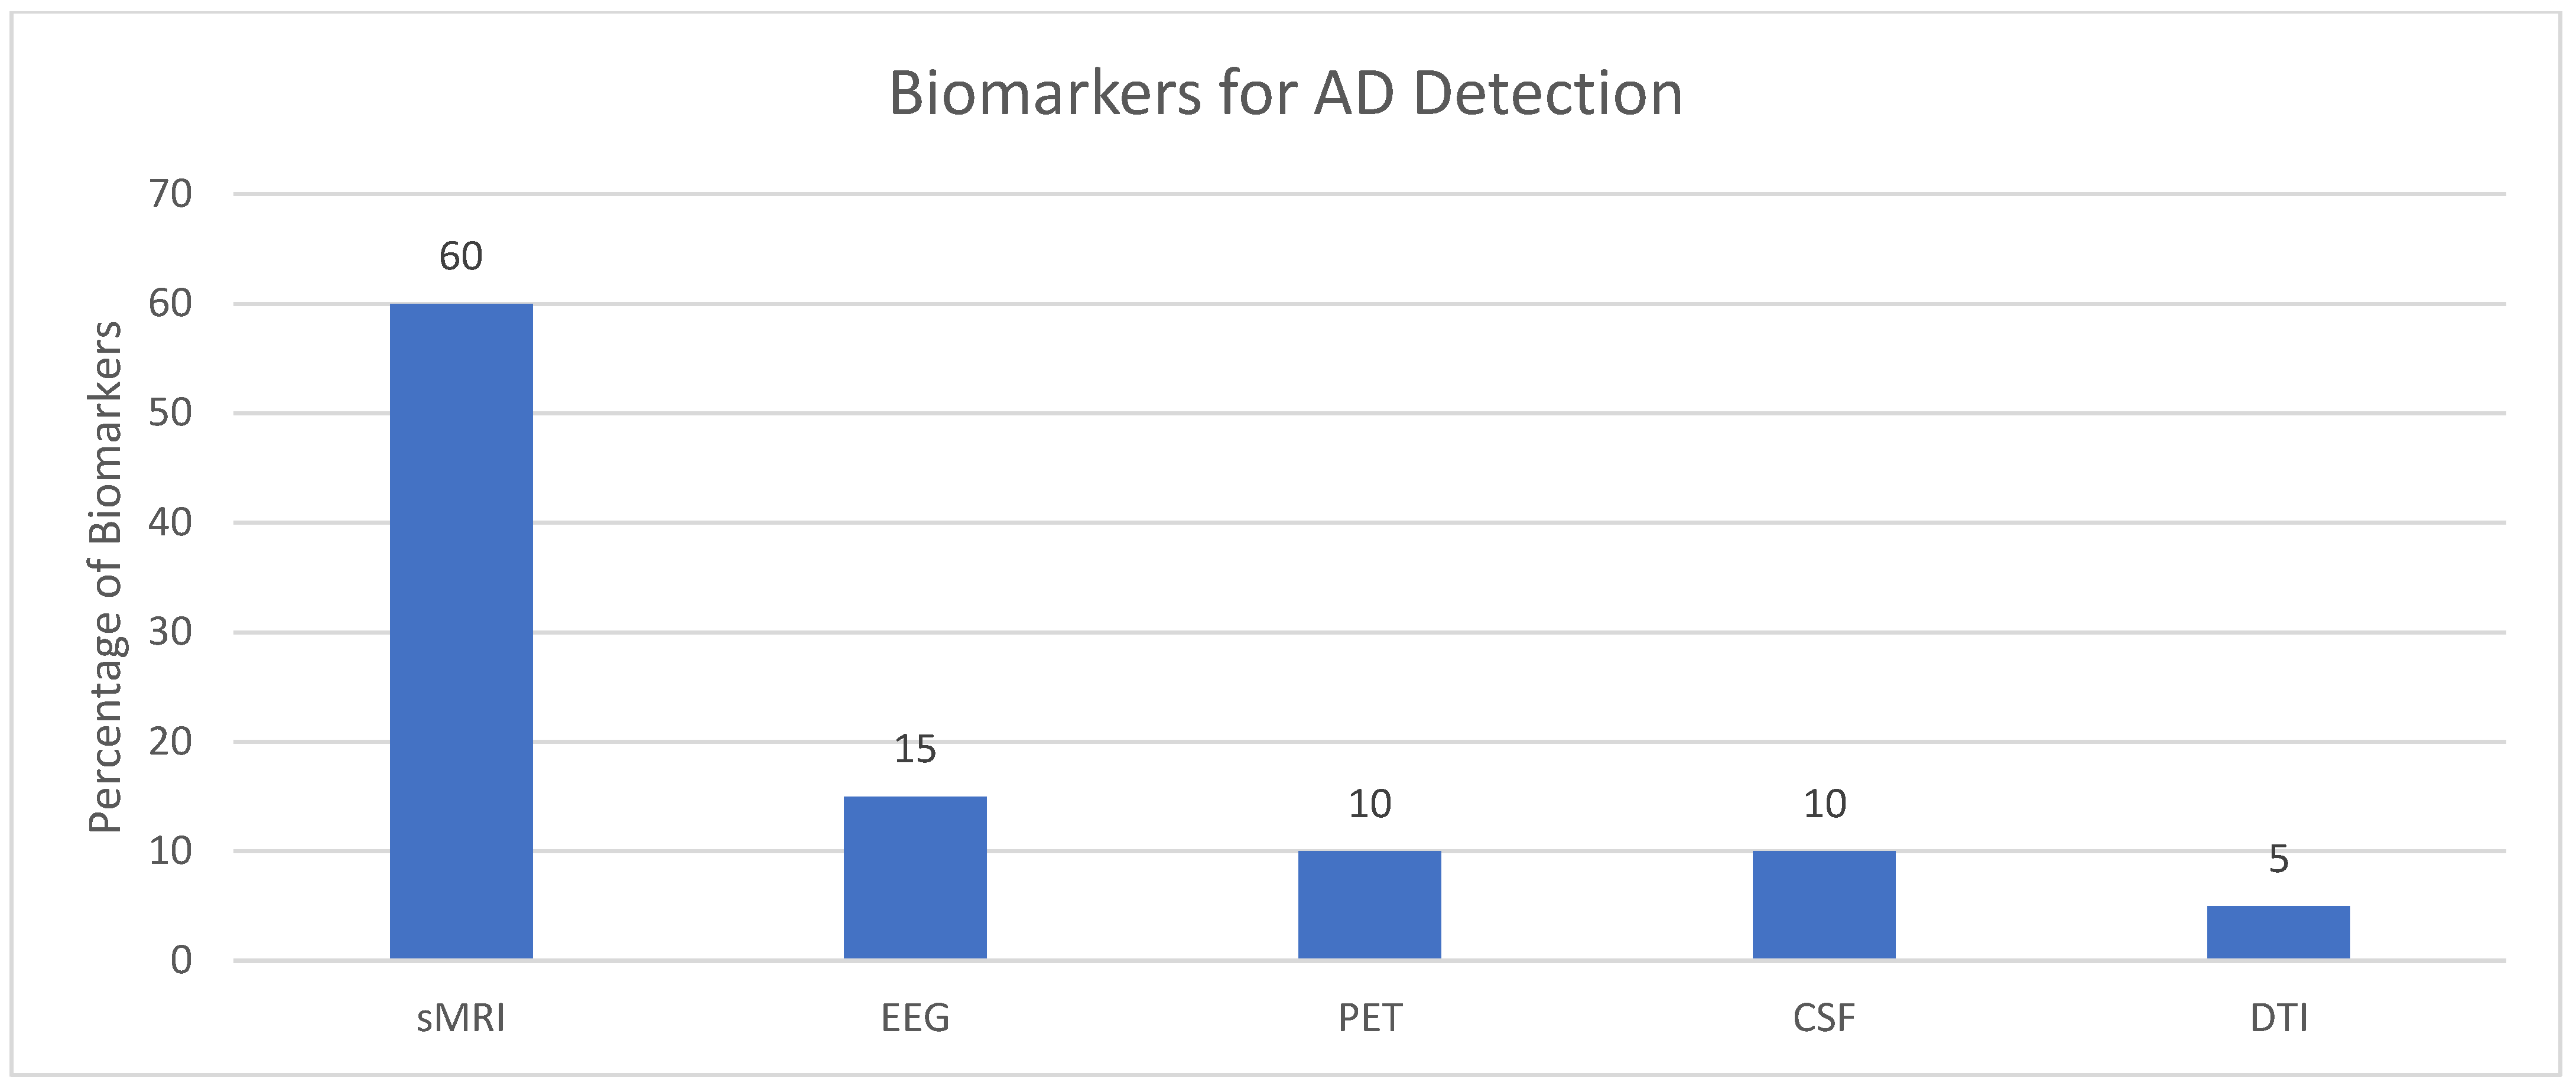
2. Biomarker Modalities
3. Automated Pipeline
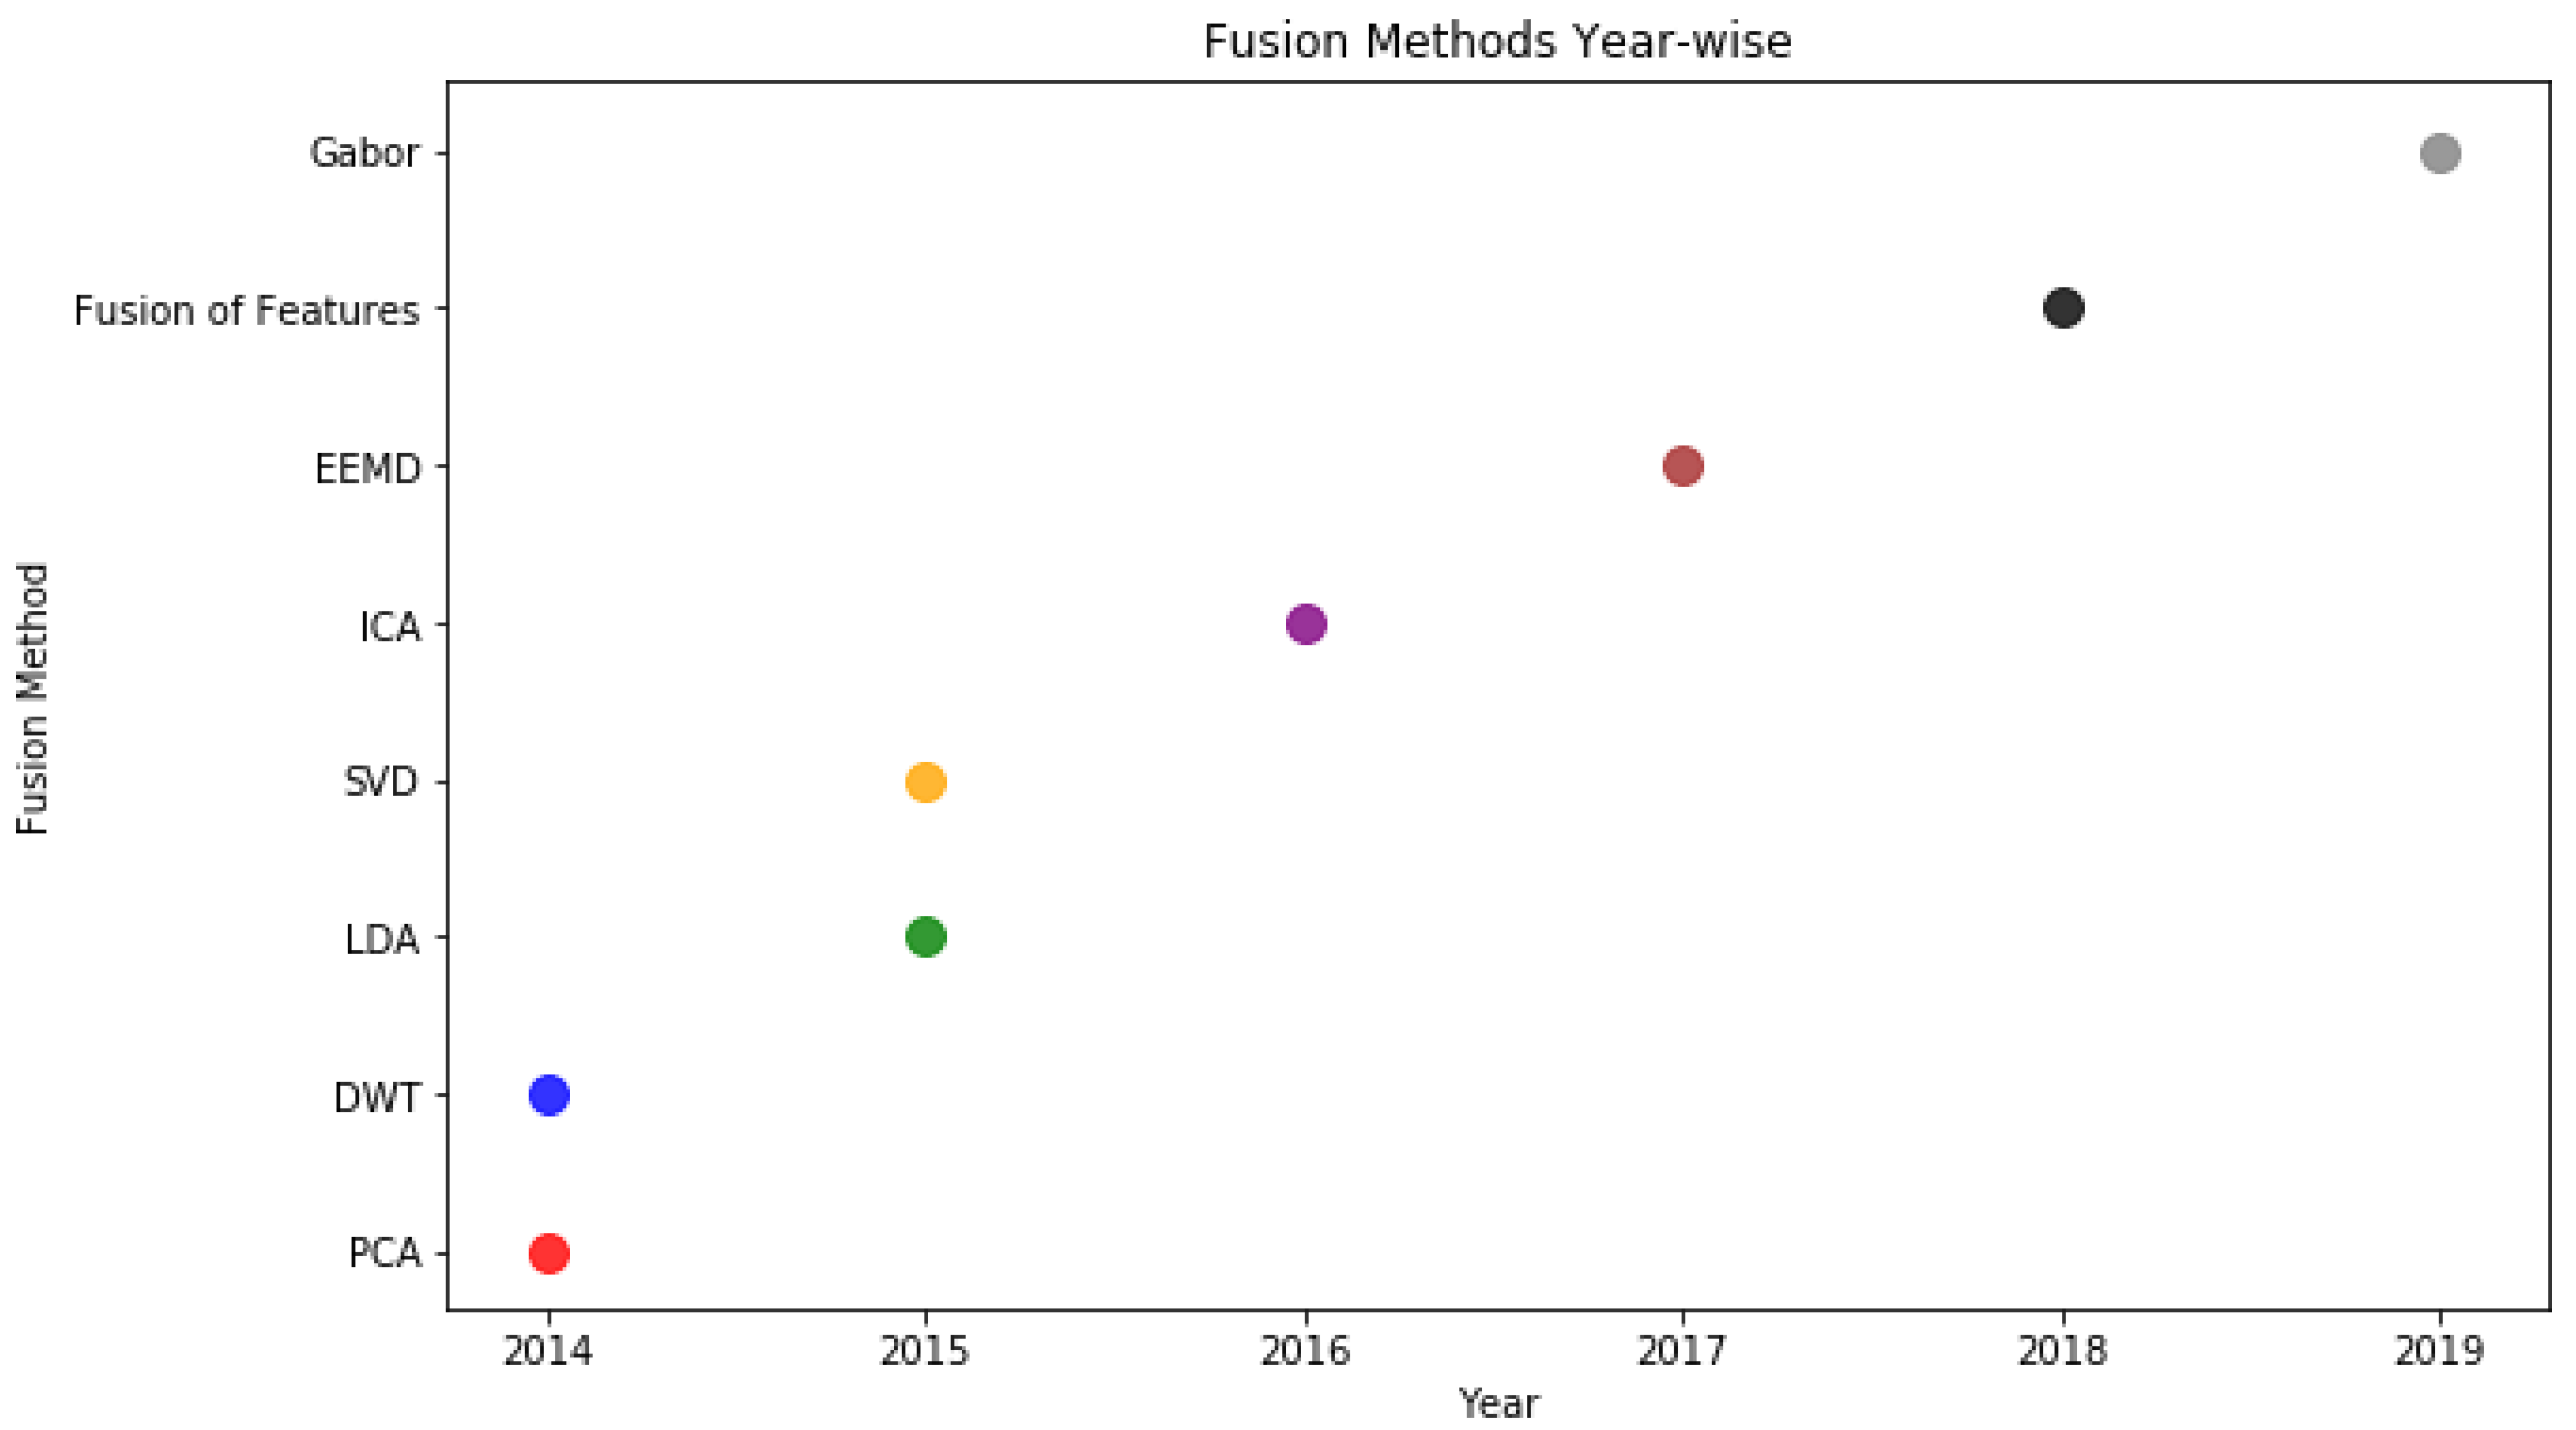
Fusion Based Methods
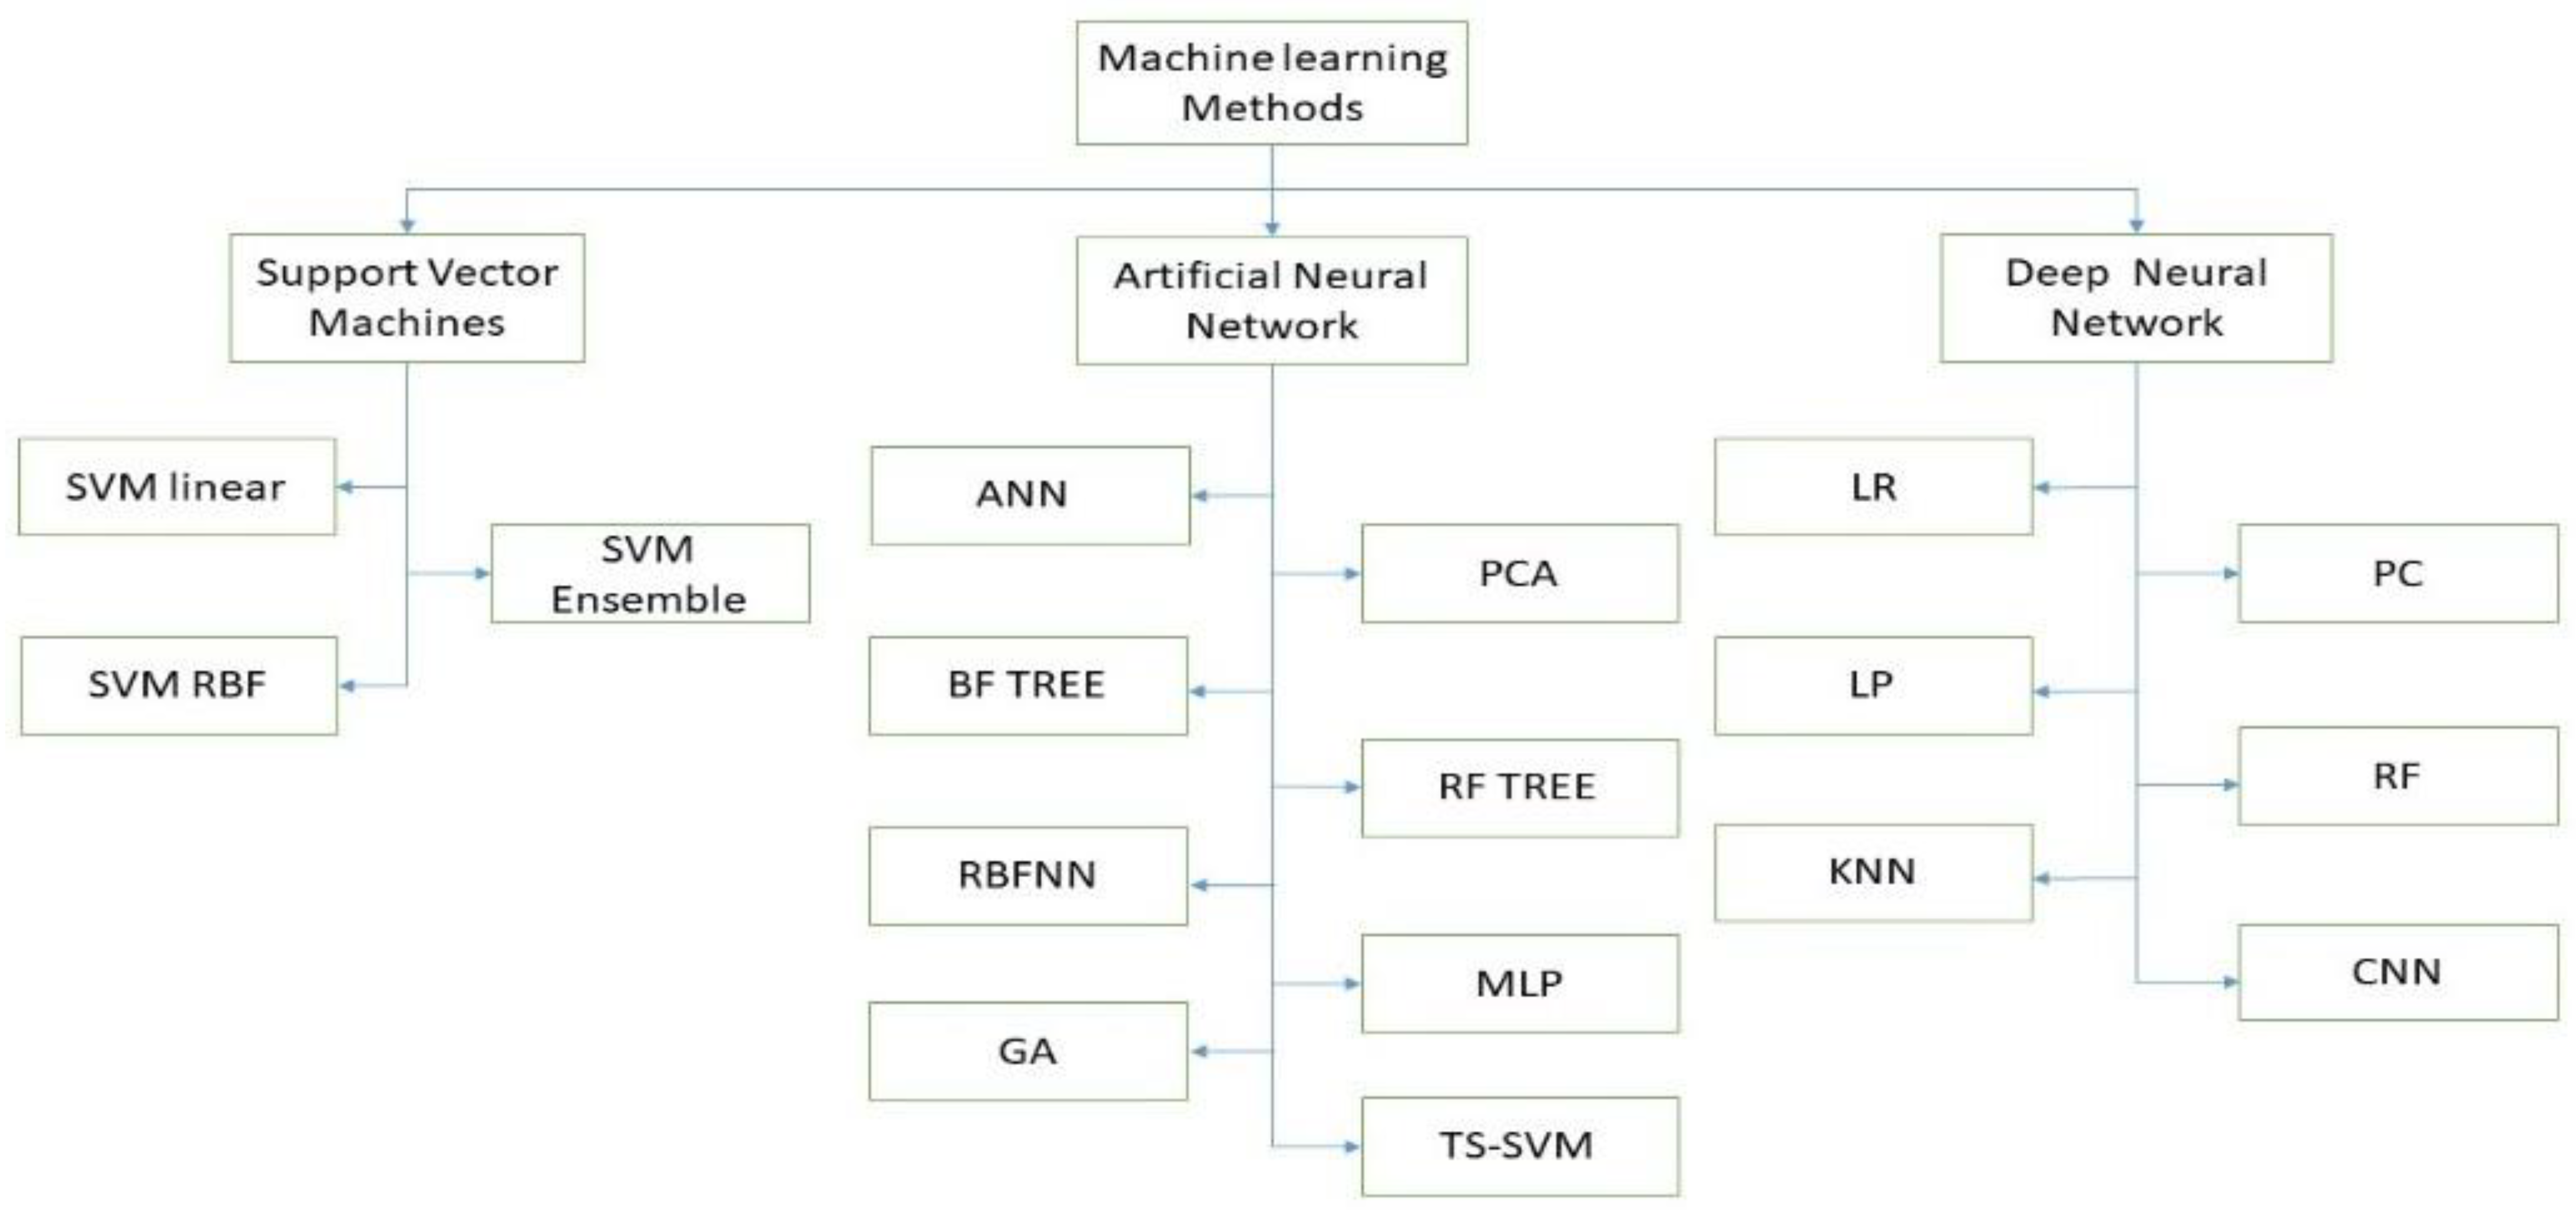
4. Machine Learning Methods
5. Discussion
6. Future Directions and Challenges
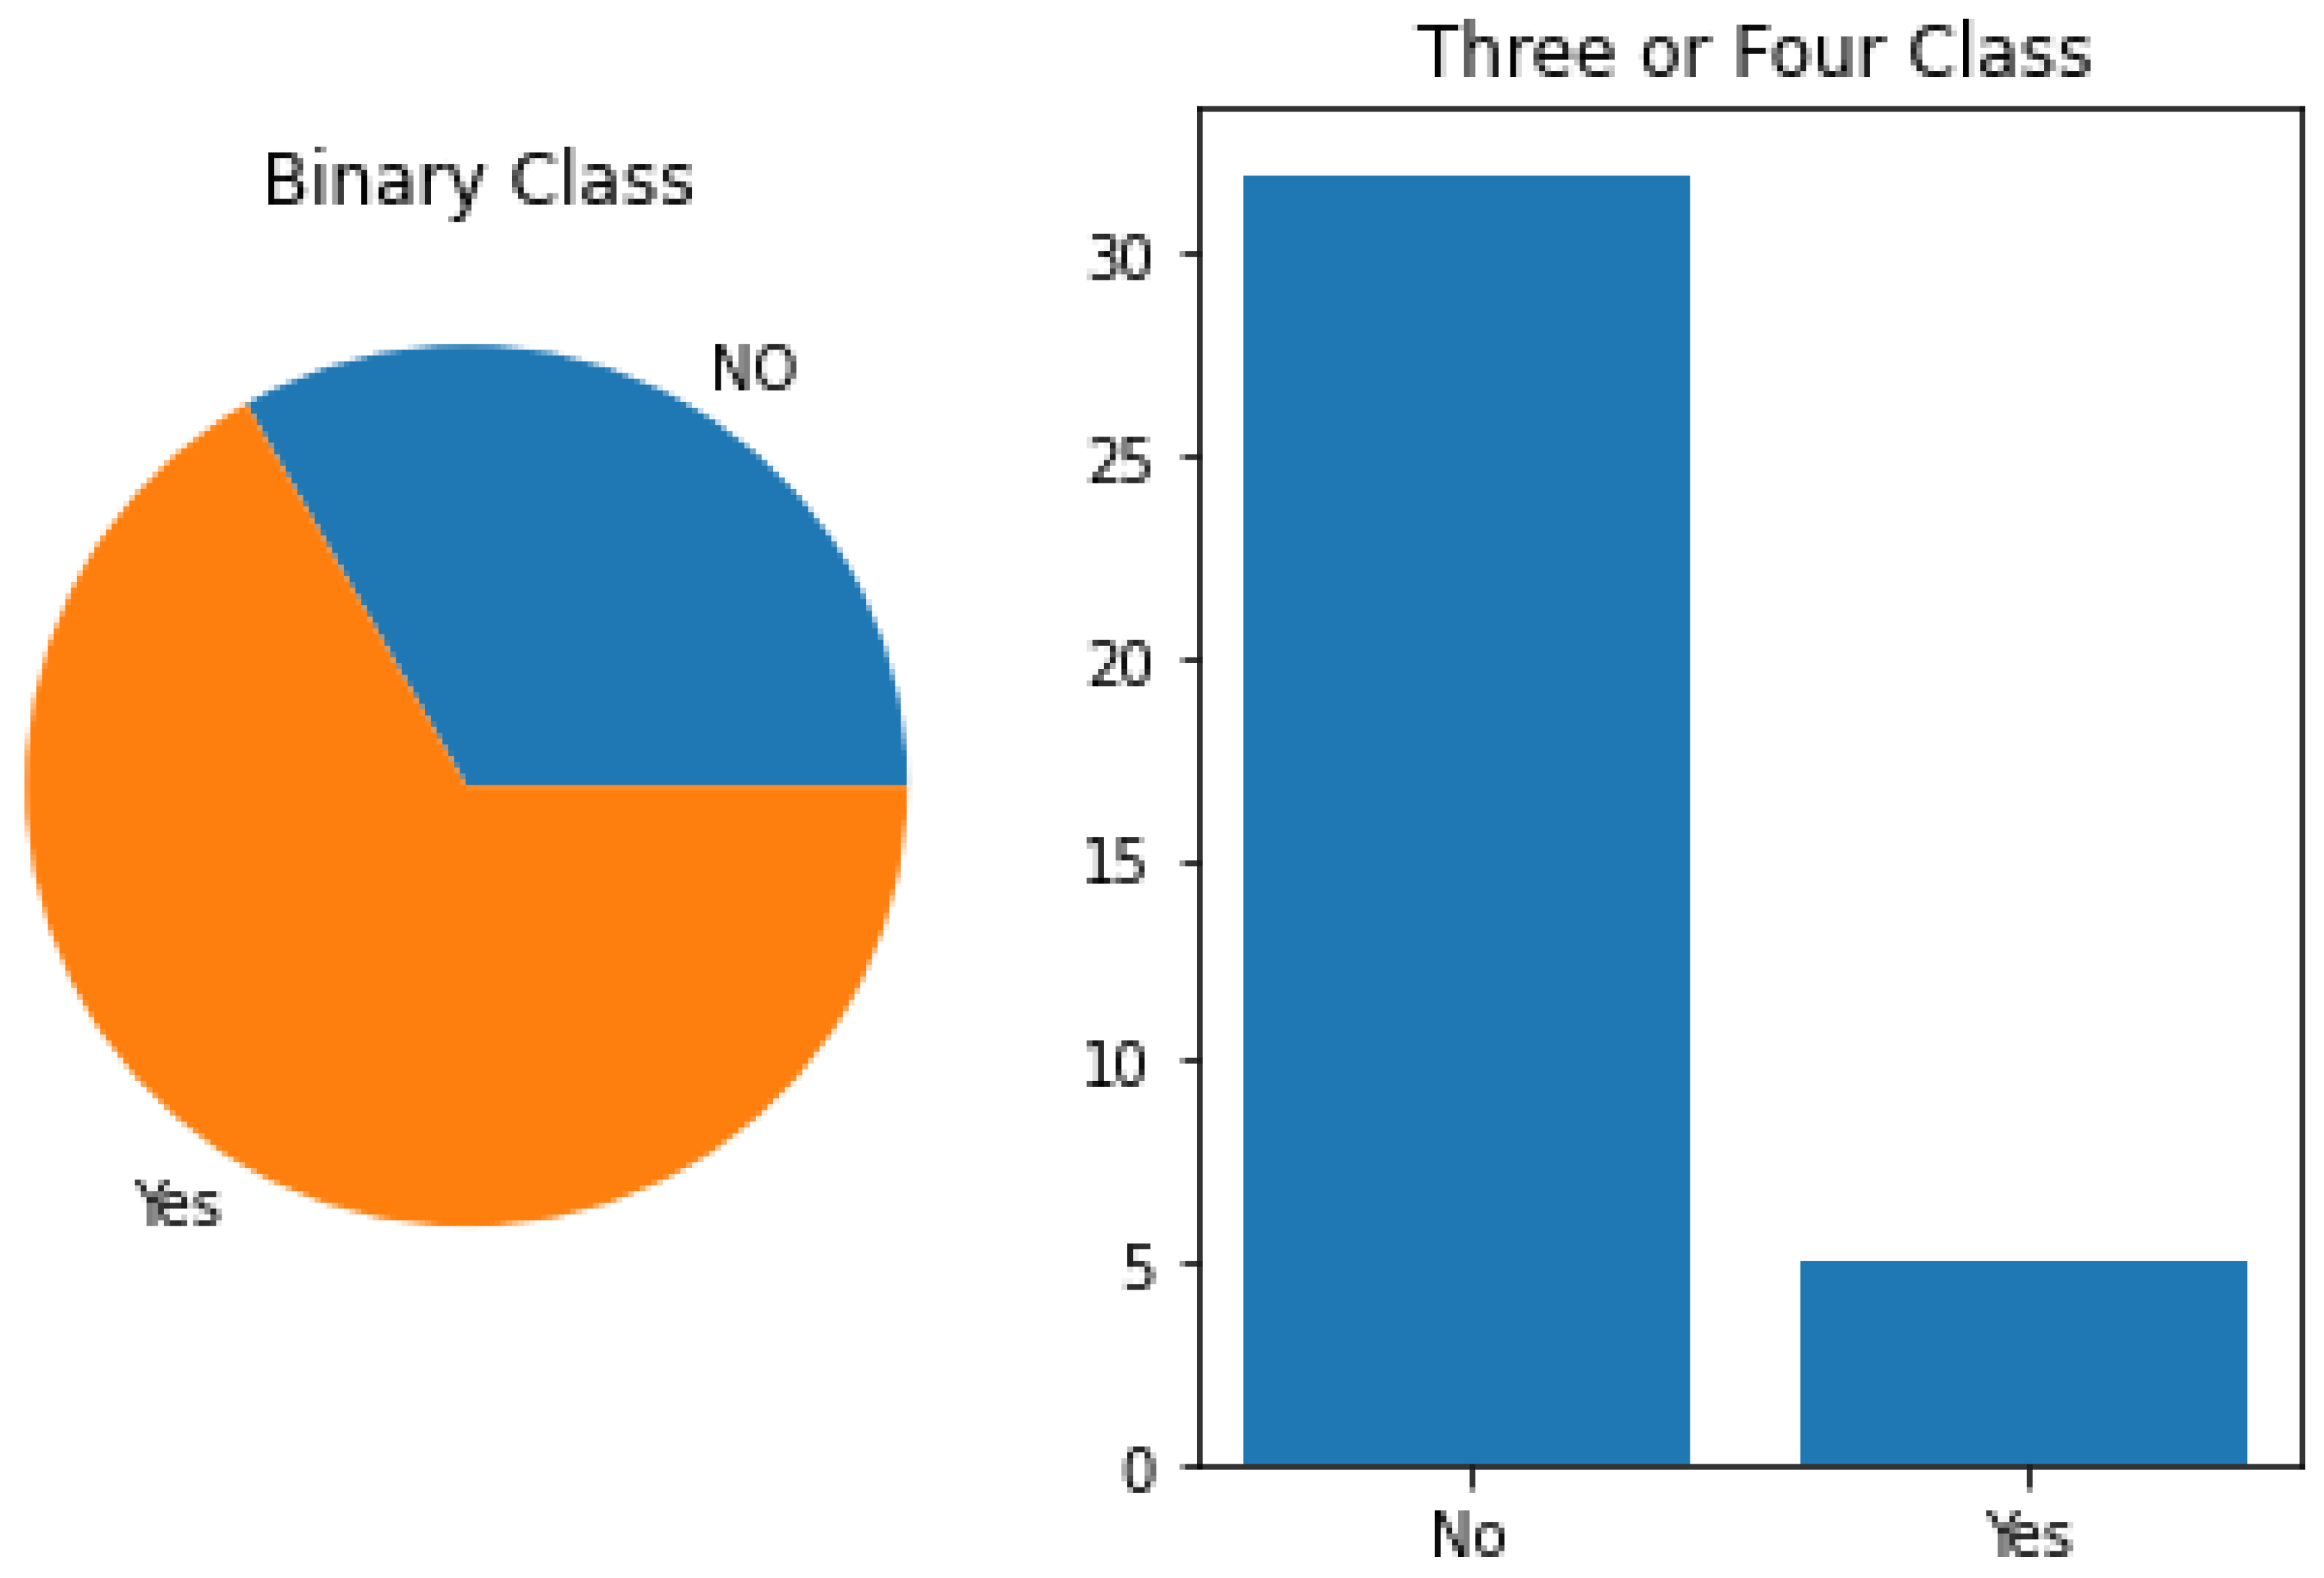
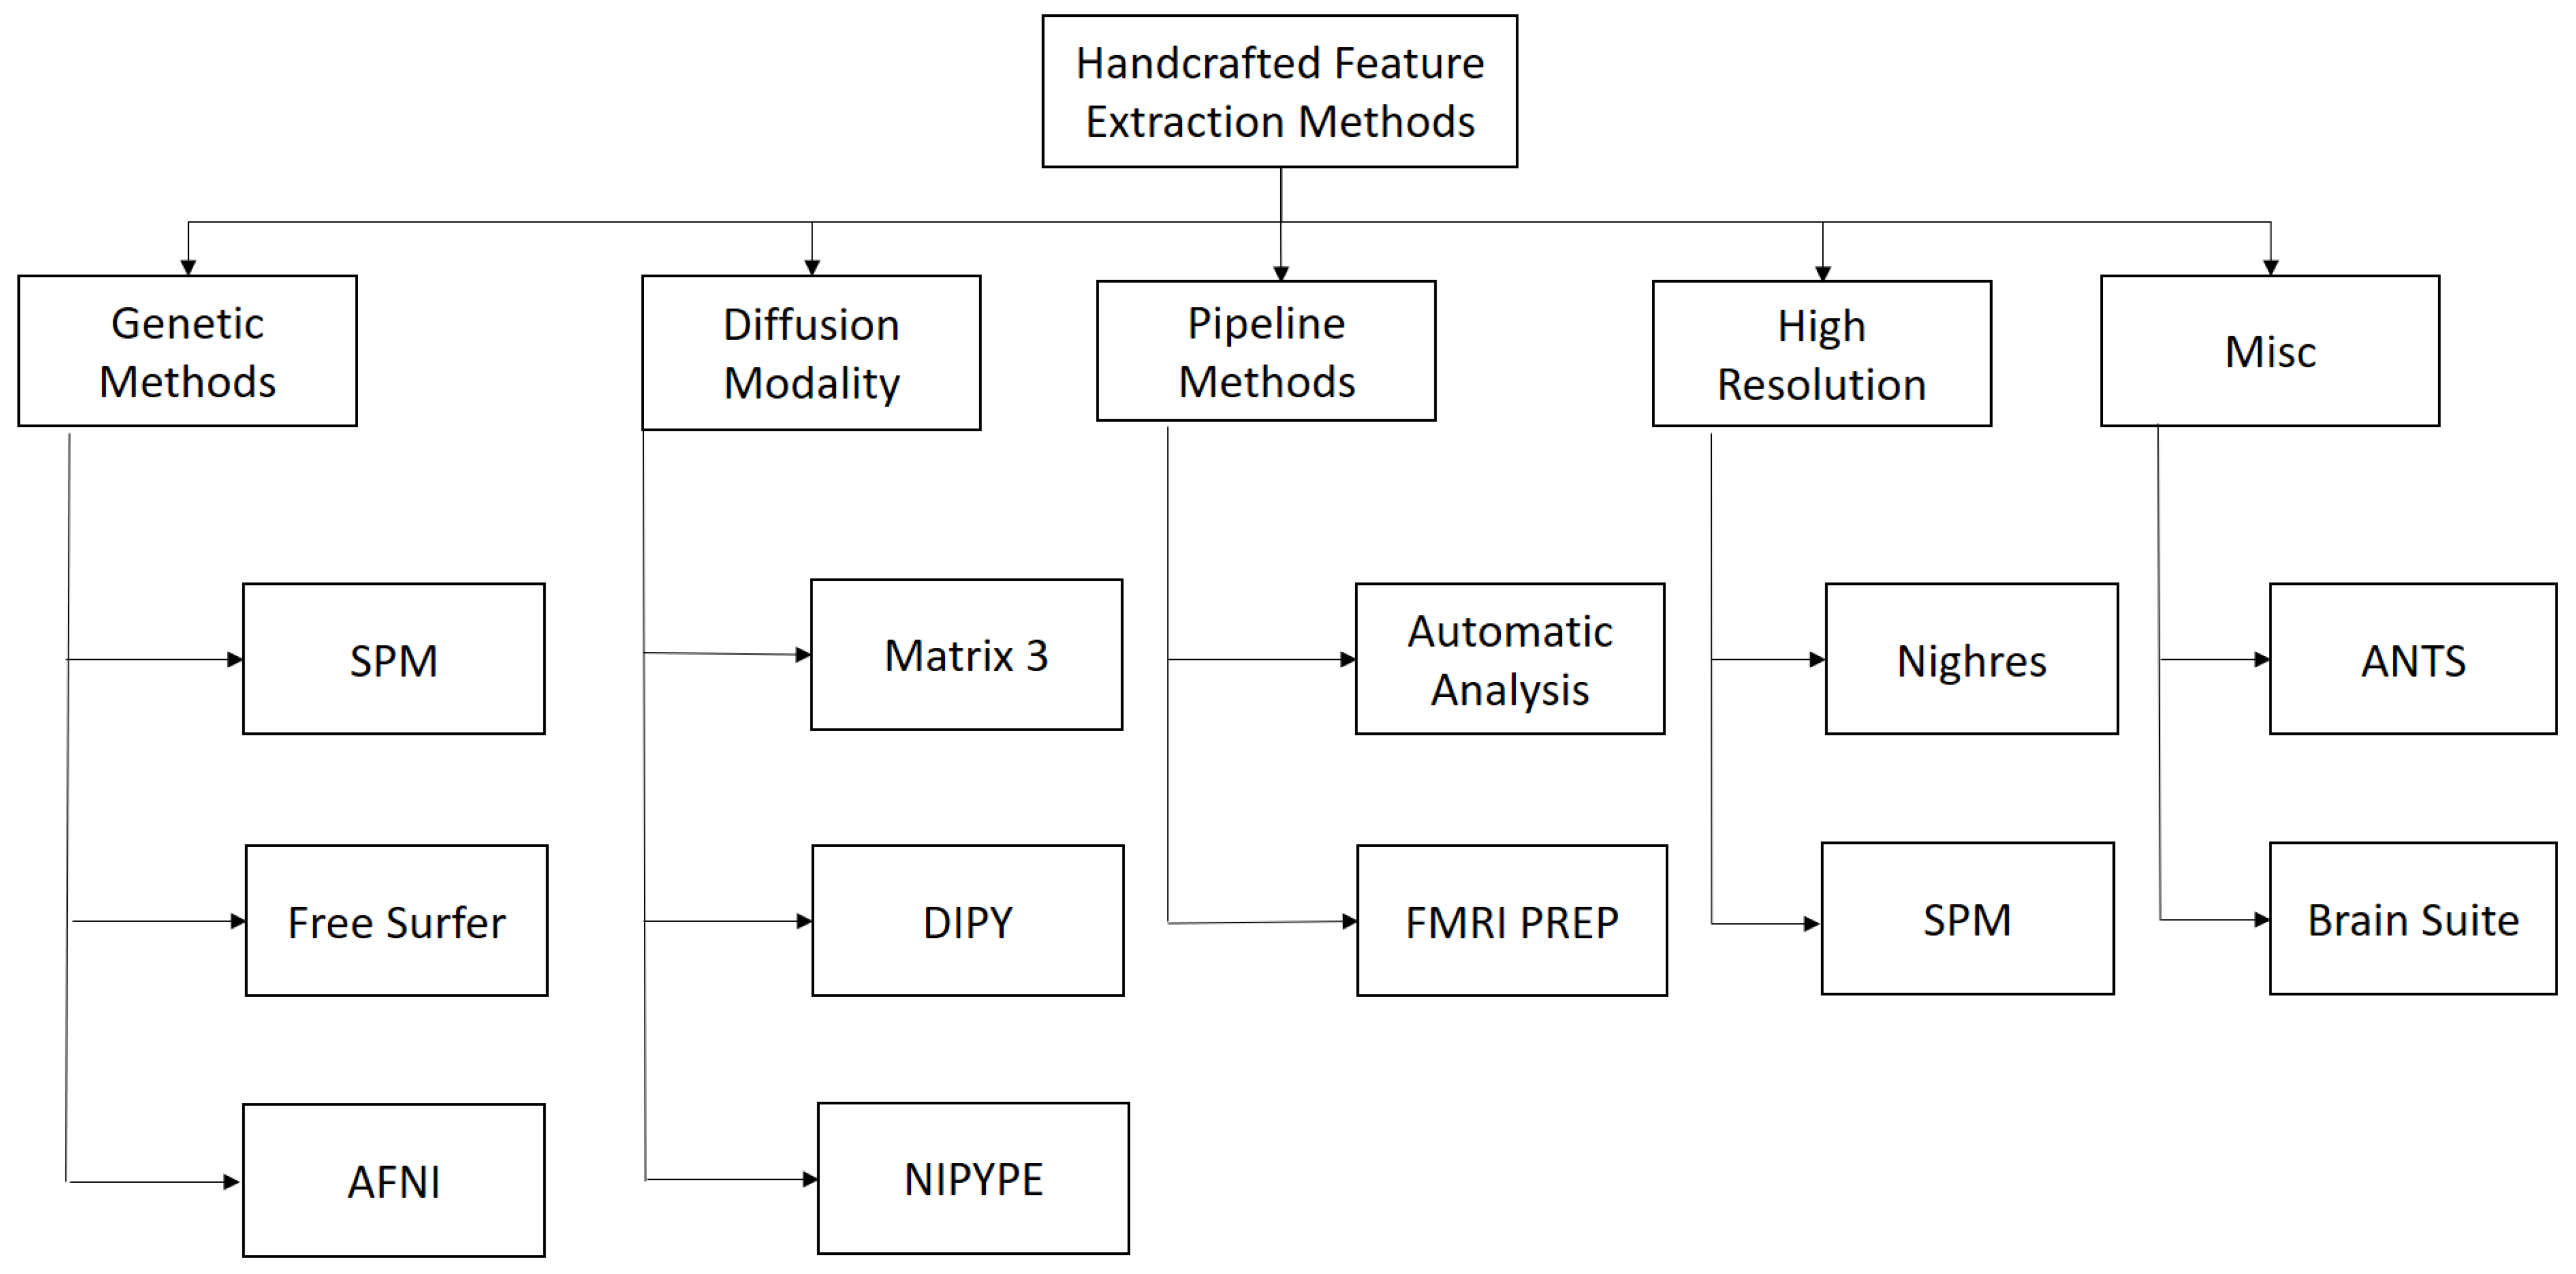
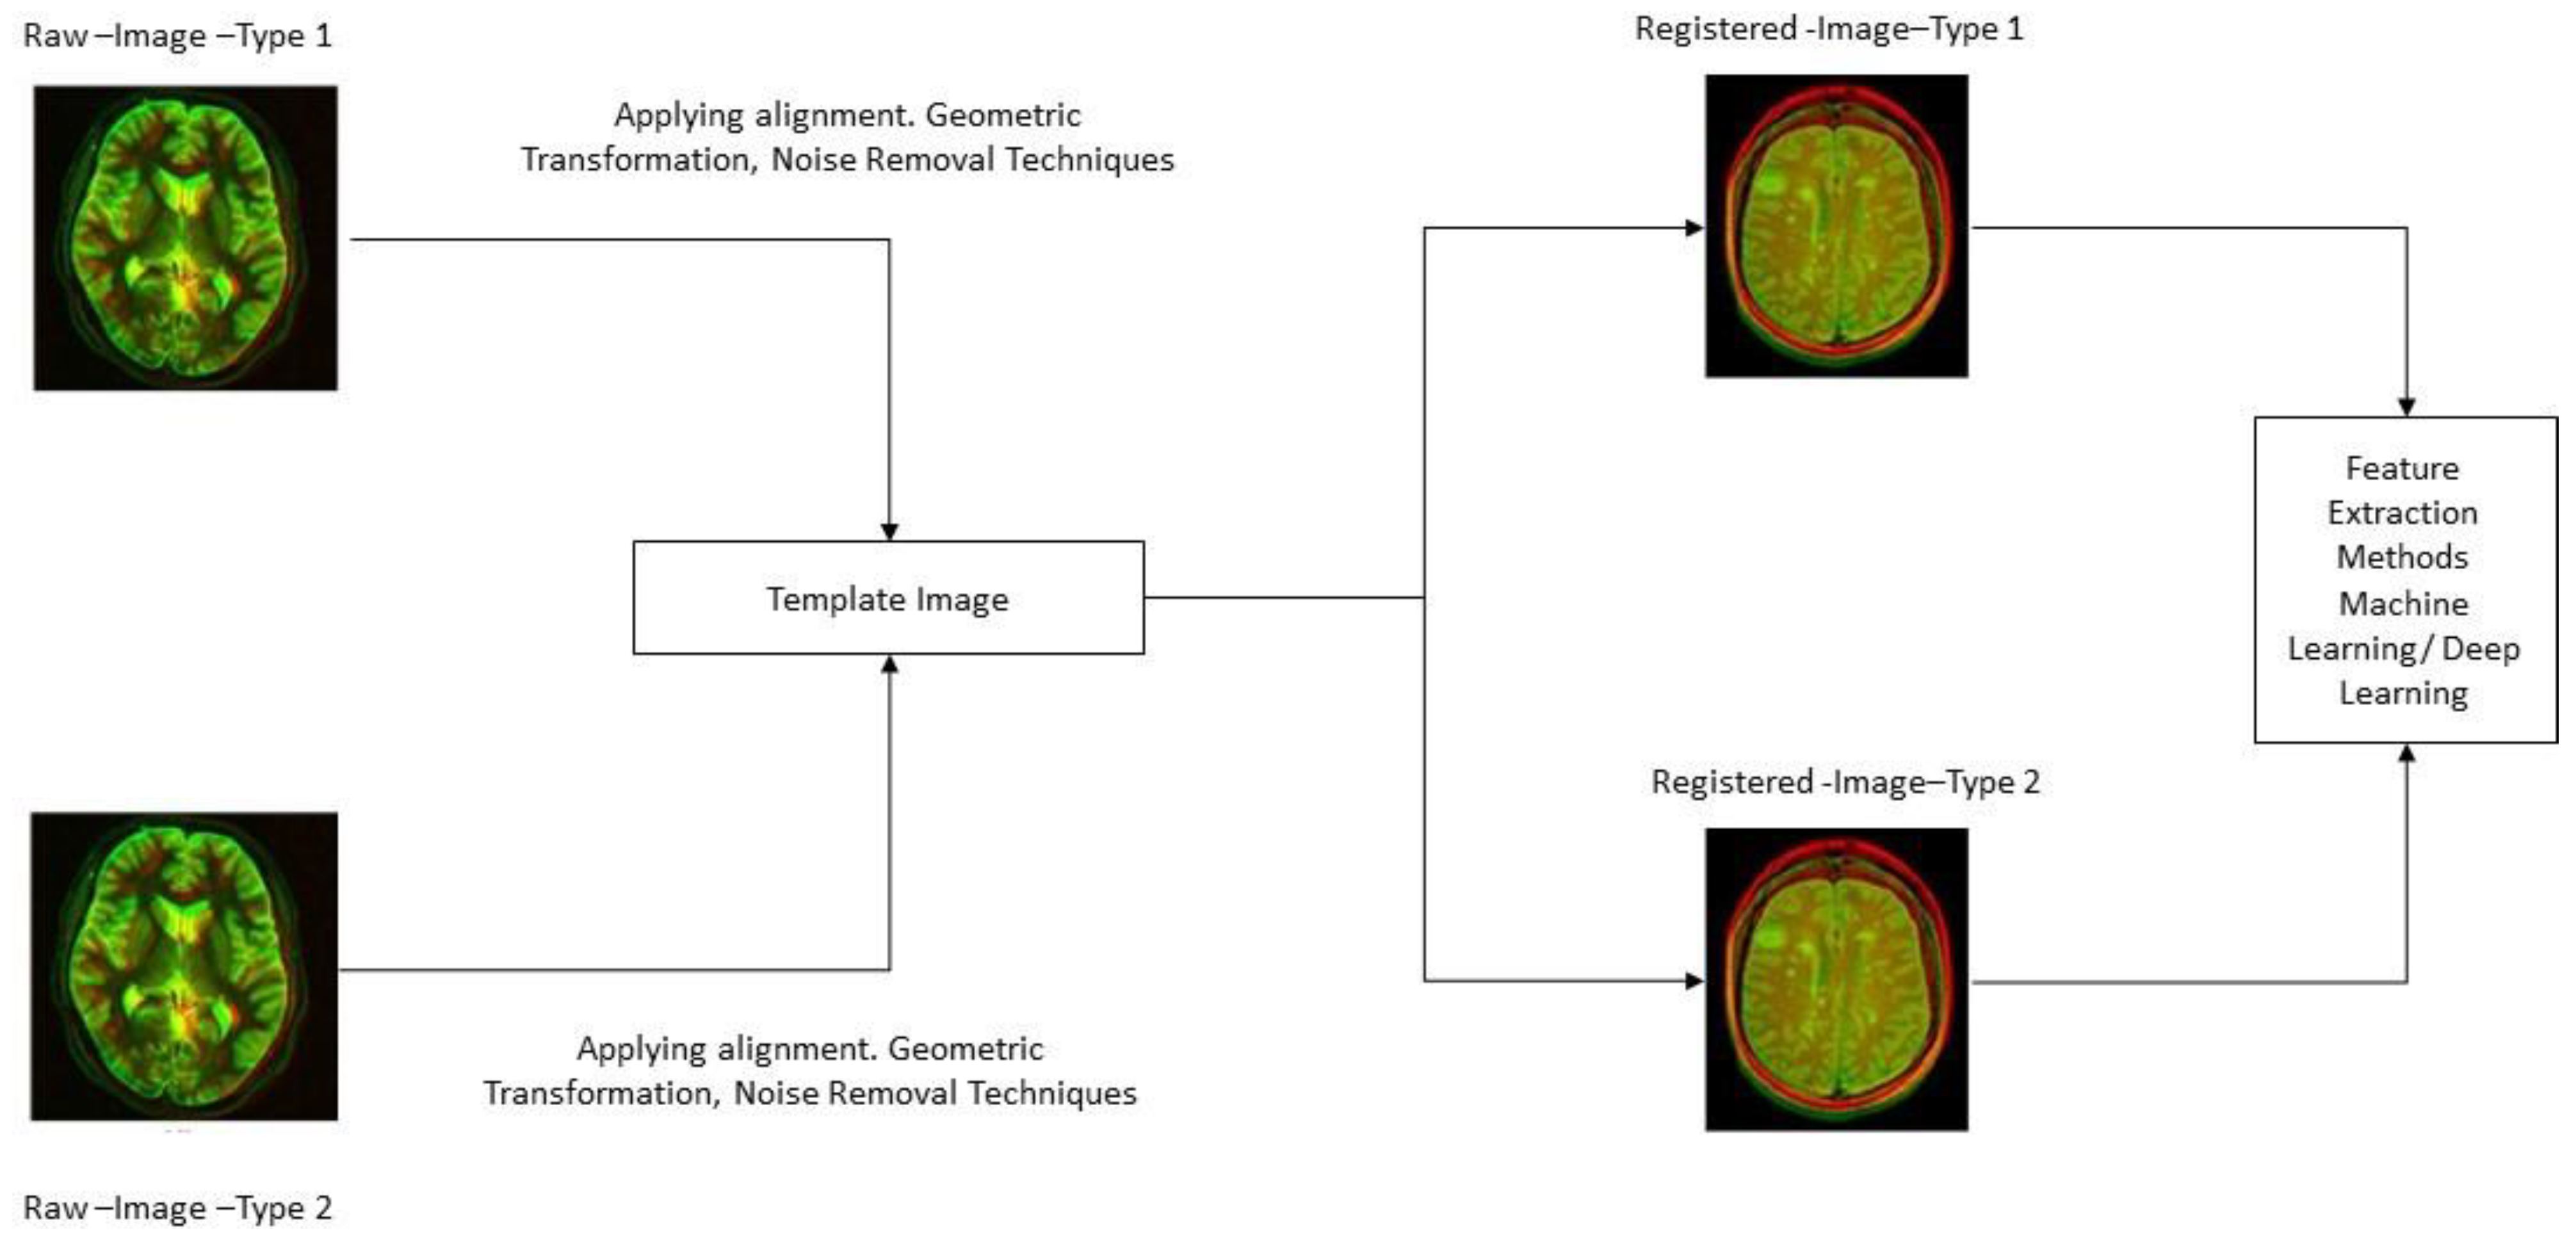
- Biomarker methods achieve high accuracy in binary classification for AD detection, they fall short in multi-group classification, indicating the need for improvement. To address this, handcrafted feature extraction and classification through Machine Learning Approaches are suggested. Multi-modality approaches require proper registration and preprocessing of the biomarker to overcome specific issues.
- In the recommendations, such as the Handcrafted Feature Extraction method, Fusion methods, and Machine/Deep Learning methods, for detecting AD and various classes of AD. Previous research has been conducted on Handcrafted Feature Extraction methods in binary or single modes to detect AD. However, fusion approaches have not been as successful researched or adopted in multi-modality and levels of investigation for AD detection is required. To improve fusion approaches, different image modalities can be used. Additionally, there have been significant advances in both conventional and non-conventional approaches to feature extraction and categorization strategies.
- Two approaches using Machine Learning Deep Learning can be employed to develop a model for detecting AD. The first method involves creating a model based on features, while the second method extracts features to build a model for detecting AD and their classes. Both of these methods have been used in several studies to detect AD. While binary classes have been accurately identified, non-conventional approaches are needed to improve accuracy for more than two classes. Structural bio markers in handcrafted feature extraction methods have shown promising results, but there is potential for multi-modal improvement in the classification of AD patients. Machine Learning approaches, particularly SVM, have enhanced the accuracy of classification and are increasingly utilized to automatically detect AD and its classes.
7. Conclusions
Author Contributions
Funding
Institutional Review Board Statement
Informed Consent Statement
Data Availability Statement
Conflicts of Interest
References
- Caine, D. Posterior Cortical Atrophy: A Review of the Literature. Neurocase 2004, 10, 382–385. [Google Scholar] [CrossRef]
- Albert, A.L.W.M.L.; Feldman, R.G. The ‘subcortical dementia’ of progressive supranuclear palsy. J. Neurol. Neurosurg. Psychiatry 1974, 37, 121–130. [Google Scholar] [CrossRef] [PubMed] [Green Version]
- Goenka, S.T. AlzVNet: A volumetric convolutional neural network for multiclass classification of Alzheimer’s disease throughmultiple neuroimaging computational approaches. Biomed. Signal. Process. Control. 2022, 74, 103500. [Google Scholar] [CrossRef]
- Soares, H.D.; Potter, W.Z.; Pickering, E.; Kuhn, M.; Immermann, F.W.; Shera, D.M.; Ferm, M.; Dean, R.A.; Simon, A.J.; Swenson, F.; et al. Plasma biomarkers associated with the apolipoprotein E genotype and Alzheimer disease. Arch. Neurol. 2012, 69, 1310–1317. [Google Scholar] [CrossRef] [Green Version]
- Beckett, L.A.; Harvey, D.J.; Gamst, A.; Donohue, M.; Kornak, J.; Zhang, H.; Kuo, J.H.; Alzheimer's Disease Neuroimaging Initiative. The Alzheimer’s Disease Neuroimaging Initiative: Annual change in biomarkers and clinical outcomes. Alzheimers Dement. 2010, 6, 257–264. [Google Scholar] [CrossRef] [Green Version]
- Goenka, S.T. Deep learning for Alzheimer prediction using brain biomarkers. Artif. Intell. Rev. 2021, 54, 4827–4871. [Google Scholar] [CrossRef]
- Sid, H.H.; Bryant, E.O. Blood-based biomarkers for Alzheimer disease: Mapping the road to the clinic. Nat. Rev. Neurol. 2018, 14, 639–652. [Google Scholar]
- Afzal, S.; Maqsood, M.; Khan, U.; Mehmood, I.; Nawaz, H.; Aadil, F.; Song, O.-Y.; Nam, Y. Alzheimer Disease Detection Techniques and Methods: A Review. Int. J. Interact. Multimed. Artif. Intell. 2021, 6, 26–38. [Google Scholar] [CrossRef]
- Marwa, E.G.; Moustafa, H.E.D.; Khalifa, F.; Khater, H.; AbdElhalim, E. An MRI-based deep learning approach for accurate detection of Alzheimer’s disease. Alex. Eng. J. 2023, 63, 211–221. [Google Scholar]
- Bandyopadhyay, A.; Ghosh, S.; Bose, M.; Singh, A.; Othmani, A.; Santosh, K.C. Alzheimer’s Disease Detection Using Ensemble Learning and Artificial Neural Networks. In Proceedings of the Recent Trends in Image Processing and Pattern Recognition, 5th International Conference, RTIP2R 2022, Kingsville, TX, USA, 1–2 December 2022; pp. 12–21. [Google Scholar]
- Balaji, P.; Chaurasia, M.A.; Bilfaqih, S.M.; Muniasamy, A.; Alsid, L.E.G. Hybridized Deep Learning Approach for Detecting Alzheimer’s Disease. Biomedicines 2023, 11, 149. [Google Scholar] [CrossRef]
- Goel, T.; Sharma, R.; Tanveer, M.; Suganthan, P.N.; Maji, K.; Pilli, R. Multimodal Neuroimaging based Alzheimer’s Disease Diagnosis using Evolutionary RVFL Classifier. IEEE J. Biomed. Health Inform. 2023. [Google Scholar] [CrossRef]
- Rahim, N.; El-Sappagh, S.; Ali, S.; Muhammad, K.; Ser, J.D.; Abuhmed, T. Prediction of Alzheimer’s progression based on multimodal Deep-Learning-based fusion and visual Explainability of time-series data. Inf. Fusion 2023, 92, 363–388. [Google Scholar] [CrossRef]
- Fouladi, S.; Safaei, A.A.; Arshad, N.I.; Ebadi, M.J.; Ahmadian, A. The use of artificial neural networks to diagnose Alzheimer’s disease from brain images. Multimed. Tools Appl. 2022, 81, 37681–37721. [Google Scholar] [CrossRef]
- Fouladi, S.; Safaei, A.A.; Mammone, N.; Ghaderi, F.; Ebadi, M.J. Efficient deep neural networks for classification of alzheimer’s disease and mild cognitive impairment from scalp EEG recordings. Cogn. Comput. 2022, 14, 1247–1268. [Google Scholar] [CrossRef]
- Schuff, S.G.M.N. Hippocampal atrophy patterns in mild cognitive impairment and Alzheimer’s disease. Hum. Brain Mapp. 2010, 31, 1339–1347. [Google Scholar]
- Aisen, J.C.P.S. Drug development in Alzheimer’s disease: The path to 2025. Alzheimer’s Res. Ther. 2016, 8, 1–12. [Google Scholar]
- Qu, C.G.Q. Multi-stream multi-scale deep convolutional networks for Alzheimer’s disease detection using MR images. Neuro-Comput. 2019, 350, 60–69. [Google Scholar]
- Haris, M.; Yadav, S.K.; Rizwan, A.; Singh, A.; Cai, K.; Kaura, D.; Wang, E.; Davatzikos, C.; Trojanowski, J.Q.; Melhem, E.R.; et al. T1rho MRI and CSF biomarkers in diagnosis of Alzheimer’s disease. Neuroimage Clin. 2015, 7, 598–604. [Google Scholar] [CrossRef] [Green Version]
- Shi, J.; Zheng, X. Multimodal neuroimaging feature learning with multimodal stacked deep polynomial networks for diagnosis of Alzheimer’s disease. IEEE J. Biomed. Health Inf. 2017, 22, 173–183. [Google Scholar] [CrossRef]
- Spiegelhalter, D.J.; Abrams, K.R.; Myles, J.P. Myles. Bayesian Approaches to Clinical Trials and Health-Care Evaluation; John Wiley & Sons: New York, NY, USA, 2004; Volume 13. [Google Scholar]
- Guintivano, J.; Brown, T. Identification and replication of a combined epigenetic and genetic biomarker predicting suicide and suicidal behaviors. Am. J. Psychiatry 2014, 171, 1287–1296. [Google Scholar] [CrossRef]
- Archer, P.E.H.A. Microglia, amyloid, and cognition in Alzheimer’s disease: An [11C](R) PK11195-PET and [11C] PIB-PET study. Neurobiol. Dis. 2008, 32, 412–419. [Google Scholar]
- Stefansson, T.J.H. Variant of TREM2 associated with the risk of Alzheimer’s disease. N. Engl. J. Med. 2013, 368, 107–116. [Google Scholar]
- Kam, A.E.M.K. Obstructive sleep apnea and its treatment in aging: Effects on Alzheimer’s disease biomarkers, cognition, brain structure and neurophysiology. Neurobiol. Dis. 2020, 145, 105054. [Google Scholar]
- Gomez-Isla, R.J.K.T. Use of structural magnetic resonance imaging to predict who will get Alzheimer’s disease. Ann. Neurol. Off. J. Am. Neurol. Assoc. Child Neurol. Soc. 2000, 47, 430–439. [Google Scholar]
- Blennow, J.L.M.K. The clinical use of cerebrospinal fluid biomarker testing for Alzheimer’s disease diagnosis: A consensus paper from the Alzheimer’s Biomarkers Standardization Initiative. Alzheimers Dement. 2014, 10, 808–817. [Google Scholar]
- Noguchi, S.; Murakami, K. Apolipoprotein E genotype and Alzheimer’s disease. Lancet 1993, 342, 91728–91733. [Google Scholar] [CrossRef]
- Schwartz, L.H.; Seymour, L.; Litière, S.; Ford, R.; Gwyther, S.; Mandrekar, S.; Shankar, L.; Bogaerts, J.; Chen, A.; Dancey, J.; et al. RECIST 1.1-Standardisation and disease-specific adaptations: Perspectives from the RECIST Working Group. Eur. J. Cancer 2016, 62, 138–145. [Google Scholar] [CrossRef] [Green Version]
- Tucholka, A.; Grau-Rivera, O.; Falcon, C.; Rami, L.; Sánchez-Valle, R.; Lladó, A.; Gispert, J.D.; Molinuevo, J.L.; the Alzheimer’s Disease Neuroimaging Initiative. Structural Connectivity Alterations Along the Alzheimer’s Disease Continuum: Reproducibility Across Two Independent Samples and Correlation with Cerebrospinal Fluid Amyloid-β and Tau. J. Alzheimers Dis. 2018, 61, 1575–1587. [Google Scholar] [CrossRef] [Green Version]
- Marcel, J.R.M.S. Person authentication using brainwaves (EEG) and maximum a posteriori model adaptation. IEEE Trans. Pattern Anal. Mach. Intell. 2007, 29, 743–752. [Google Scholar] [CrossRef] [Green Version]
- Wang, J.; Jin, C.; Zhou, J.; Zhou, R.; Tian, M.; Lee, H.J.; Zhang, H. PET molecular imaging for pathophysiological visualization in Alzheimer’s disease. Eur. J. Nucl. Med. Mol. Imaging 2023, 50, 765–783. [Google Scholar] [CrossRef]
- Bonakdarpour, B.; Takarabe, C. Brain Networks, Clinical Manifestations, and Neuroimaging of Cognitive Disorders: The Role of Computed Tomography (CT), Magnetic Resonance Imaging (MRI), Positron Emission Tomography (PET), and Other Advanced Neuroimaging Tests. Clin. Geriatr. Med. 2023, 39, 45–65. [Google Scholar] [CrossRef]
- Islam, Y.Z. Brain MRI analysis for Alzheimer’s disease diagnosis using an ensemble system of deep convolutional neural networks. Brain Inf. 2018, 5, 1–14. [Google Scholar] [CrossRef] [Green Version]
- Yildirim, A.M.T.O. Convolutional neural networks for multi-class brain disease detection using MRI images. Comput. Med. Imaging Graph. 2019, 78, 101673. [Google Scholar]
- Farooq, A.; Anwar, S.; Awais, M.; Rehman, S. A deep CNN based multi-class classification of Alzheimer's disease using MRI. In Proceedings of the 2017 IEEE International Conference on Imaging Systems and Techniques (IST), Beijing, China, 18–20 October 2017; pp. 1–6. [Google Scholar]
- Fang, X.; Liu, Z.; Xu, M. Ensemble of deep convolutional neural networks based multi-modality images for Alzheimer's disease diagnosis. IET Image Process. 2020, 14, 318–326. [Google Scholar] [CrossRef]
- Nazir, M.M.F. Transfer learning assisted classification and detection of Alzheimer’s disease stages using 3D MRI scans. Sensors 2019, 19, 2645. [Google Scholar]
- Salehi, A.W.; Baglat, P.; Sharma, B.B.; Gupta, G.; Upadhya, A. A CNN model: Earlier diagnosis and classification of Alzheimer disease using MRI. In Proceedings of the 2020 International Conference on Smart Electronics and Communication (ICOSEC), Trichy, India, 10–12 September 2020; pp. 156–161. [Google Scholar]
- Mahmood, R.; Ghimire, B. Automatic detection and classification of Alzheimer's Disease from MRI scans using principal component analysis and artificial neural networks. In Proceedings of the 2013 20th International Conference on Systems, Signals and Image Processing (IWSSIP), Bucharest, Romania, 7–9 July 2013; pp. 133–137. [Google Scholar]
- Ebrahimi, A.; Luo, S.; Chiong, R.; the Alzheimer's Disease Neuroimaging Initiative. Deep Sequence Modelling for Alzheimer’s Disease Detection Using MRI. Comput. Biol. Med. 2021, 134, 104537. [Google Scholar] [CrossRef] [PubMed]
- Escott-Price, V.; Shoai, M.; Pither, R.; Williams, J.; Hardy, J. Polygenic score prediction captures nearly all common genetic risk for Alzheimer’s disease. Neurobiol. Aging 2017, 49, 214–221. [Google Scholar] [CrossRef] [Green Version]
- Vandewater, P.J.L. Genetic algorithm with logistic regression for prediction of progression to Alzheimer’s disease. BMC Bioinform. 2014, 15, S11. [Google Scholar]
- Galasko, D.; Xiao, M. Synaptic biomarkers in CSF aid in diagnosis, correlate with cognition and predict progression in MCI and Alzheimer’s disease’, Alzheimer’s & Dementia: Translational Research &. Clin. Interv. 2019, 5, 871–882. [Google Scholar]
- Preische, O.; Schultz, S.A.; Apel, A.; Kuhle, J.; Kaeser, S.A.; Barro, C.; Gräber, S.; Kuder-Buletta, E.; LaFougere, C.; Laske, C.; et al. Serum neurofilament dynamics predicts neurodegeneration and clinical progression in presymptomatic Alzheimer’s disease. Nat. Med. 2019, 25, 277–283. [Google Scholar] [CrossRef]
- Herrera, L.J.; Rojas, I.; Pomares, H.; Guillén, A.; Valenzuela, O.; Baños, O. Classification of MRI images for Alzheimer's disease detection. In Proceedings of the 2013 International Conference on Social Computing, Alexandria, VA, USA, 8–14 September 2013; pp. 846–851. [Google Scholar]
- Jeffrey, J.L.S.; Petrella, R. Predicting cognitive decline in subjects at risk for Alzheimer disease by using combined cerebrospinal fluid, MR imaging, and PET biomarkers. Radiology 2013, 266, 583–591. [Google Scholar]
- Edwin, E.G.M.T.H. Amyloid-β PET-Correlation with cerebrospinal fluid biomarkers and prediction of Alzheimer’s disease diagnosis in a memory clinic. PLoS ONE 2019, 14, 221365. [Google Scholar]
- Chételat, G.; Desgranges, B.; de la Sayette, V.; Viader, F.; Eustache, F.; Baron, J.-C. Mild cognitive impairment: Can FDG-PET predict who is to rapidly convert to Alzheimer’s disease? Neurology 2003, 60, 1374–1377. [Google Scholar] [CrossRef] [PubMed]
- Pradhaban, D.G. Hippocampal and entorhinal atrophy in mild cognitive impairment: Prediction of Alzheimer disease. Neurology 2007, 68, 828–836. [Google Scholar]
- Gavidia-Bovadilla, G.; Kanaan-Izquierdo, S.; Mataró-Serrat, M.; Perera-Lluna, A.; Alzheimer’s Disease Neuroimaging Initiative. Early prediction of Alzheimer’s disease using null longitudinal model-based classifiers. PLoS ONE 2017, 12, e0168011. [Google Scholar] [CrossRef] [PubMed] [Green Version]
- Daly, E.; Zaitchik, D. Predicting conversion to Alzheimer disease using standardized clinical information. Arch. Neurol. 2000, 57, 675–680. [Google Scholar] [CrossRef] [Green Version]
- Tabert, M.H.; Manly, J.J.; Liu, X.; Pelton, G.H.; Rosenblum, S.; Jacobs, M.; Zamora, D.; Goodkind, M.; Bell, K.; Stern, Y.; et al. Neuropsychological prediction of conversion to Alzheimer disease in patients with mild cognitive impairment. Arch. Gen. Psychiatry 2006, 63, 916–924. [Google Scholar] [CrossRef] [Green Version]
- de Leon, M.J.; Golomb, J.; George, A.E.; Convit, A.; Tarshish, C.Y.; McRae, T.; De Santi, S.; Smith, G.; Ferris, S.H.; Noz, M. The radiologic prediction of Alzheimer disease: The atrophic hippocampal formation. Am. J. Neuroradiol. 1993, 14, 897–906. [Google Scholar]
- Tang, C.R.M.X. A summary risk score for the prediction of Alzheimer disease in elderly persons. Arch. Neurol. 2010, 67, 835–841. [Google Scholar]
- Mielke, K.O.M.M. DTI analyses and clinical applications in Alzheimer’s disease. J. Alzheimers Dis. 2011, 26, 287–296. [Google Scholar]
- Mellon, E.A.; Pilkinton, D.T.; Clark, C.M.; Elliott, M.A.; Witschey, W.R.; Borthakur, A.; Reddy, R. Sodium MR imaging detection of mild Alzheimer disease: Preliminary study. Am. J. Neuroradiol. 2009, 30, 978–984. [Google Scholar] [CrossRef] [PubMed] [Green Version]
- Stern, Y.; Tang, M.X. Predicting time to nursing home care and death in individuals with Alzheimer disease. JAMA 1997, 277, 806–812. [Google Scholar] [CrossRef] [PubMed]
- Tierney, M.C.; Szalai, J.P.; Snow, W.G.; Fisher, R.H. The prediction of Alzheimer disease: The role of patient and informant perceptions of cognitive deficits. Arch. Neurol. 1996, 53, 423–427. [Google Scholar] [CrossRef] [PubMed]
- Prestia, A.; Caroli, A. Prediction of dementia in MCI patients based on core diagnostic markers for Alzheimer disease. Neurology 2013, 80, 1048–1056. [Google Scholar] [CrossRef] [PubMed] [Green Version]
- Ebrahimi, A.; Luo, S.; Chiong, R. Introducing transfer learning to 3D ResNet-18 for Alzheimer’s disease detection on MRI images. In Proceedings of the 2020 35th International Conference on Image and Vision Computing New Zealand (IVCNZ), Wellington, New Zealand, 25–27 November 2020; pp. 1–6. [Google Scholar]
- Mehmood, A.; Maqsood, M.; Bashir, M.; Shuyuan, Y. A deep Siamese convolution neural network for multi-class classification of Alzheimer disease. Brain Sci. 2020, 10, 84. [Google Scholar] [CrossRef] [Green Version]
- Ebrahimi, A.; Luo, S.; the Alzheimer’s Disease Neuroimaging Initiative. Convolutional neural networks for Alzheimer’s disease detection on MRI images. J. Med. Imaging 2021, 8, 024503. [Google Scholar] [CrossRef]
- Mehmood, A.; Yang, S.; Feng, Z.; Wang, M.; Ahmad, A.S.; Khan, R.; Maqsood, M.; Yaqub, M. A transfer learning approach for early diagnosis of Alzheimer’s disease on MRI images. Neuroscience 2021, 460, 43–52. [Google Scholar] [CrossRef]
- Chui, K.T.; Gupta, B.B.; Alhalabi, W.; Alzahrani, F.S. An MRI scans-based Alzheimer’s disease detection via convolutional neural network and transfer learning. Diagnostics 2022, 12, 1531. [Google Scholar] [CrossRef]
- Liu, S.; Masurkar, A.V.; Rusinek, H.; Chen, J.; Zhang, B.; Zhu, W.; Fernandez-Granda, C.; Razavian, N. Generalizable deep learning model for early Alzheimer’s disease detection from structural MRIs. Sci. Rep. 2022, 12, 17106. [Google Scholar] [CrossRef]
- Lahmiri, S. Integrating convolutional neural networks, kNN, and Bayesian optimization for efficient diagnosis of Alzheimer’s disease in magnetic resonance images. Biomed. Signal Process. Control 2023, 80, 104375. [Google Scholar] [CrossRef]
- Carcagnì, P.; Leo, M.; Del Coco, M.; Distante, C.; De Salve, A. Convolution Neural Networks and Self-Attention Learners for Alzheimer Dementia Diagnosis from Brain MRI. Sensors 2023, 23, 1694. [Google Scholar] [CrossRef] [PubMed]
- Islam, M.M.; Yang, H.C.; Poly, T.N.; Jian, W.S.; Li, Y.C.J. Deep learning algorithms for detection of diabetic retinopathy in retinal fundus photographs: A systematic review and meta-analysis. Comput. Methods Programs Biomed. 2020, 191, 105320. [Google Scholar] [CrossRef] [PubMed]
- Bernstein, A.; Akzhigitov, R.; Kondrateva, E.; Sushchinskaya, S.; Samotaeva, I.; Gaskin, V. MRI brain imagery processing software in data analysis. In Proceedings of the 13th International Conference, MDA, New York, NY, USA, 7–10 July 2018; pp. 61–74. [Google Scholar]
- Liu, C.L.M. Hierarchical fully convolutional network for joint atrophy localization and Alzheimer’s disease diagnosis using structural MRI. IEEE Trans. Pattern Anal. Mach. Intell. 2018, 42, 880–893. [Google Scholar]
- Wee, C.Y.; Yap, P.T.; Shen, D. Prediction of Alzheimer’s disease and mild cognitive impairment using cortical morphological patterns. Hum. Brain Mapp. 2013, 34, 3411–3425. [Google Scholar] [CrossRef] [Green Version]
- Beheshti, I. Feature-ranking-based Alzheimer’s disease classification from structural MRI. Magn. Reson. Imaging 2016, 34, 252–263. [Google Scholar] [CrossRef] [PubMed]
- Dalboni da Rocha, J.L.; Bramati, I.; Coutinho, G.; Tovar Moll, F.; Sitaram, R. Fractional Anisotropy changes in Parahippocampal Cingulum due to Alzheimer’s Disease. Sci. Rep. 2020, 10, 2660. [Google Scholar] [CrossRef] [Green Version]
- Gupta, Y.; Lama, R.K.; Kwon, G.R.; Alzheimer's Disease Neuroimaging Initiative. Prediction and classification of Alzheimer’s disease based on combined features from apolipoprotein-E genotype, cerebrospinal fluid, MR, and FDG-PET imaging biomarkers. Front. Comput. Neurosci. 2019, 13, 72. [Google Scholar] [CrossRef] [Green Version]
- Gupta, Y.; Lee, K.H.; Choi, K.Y.; Lee, J.J.; Kim, B.C.; Kwon, G.R. National Research Center for Dementia, Alzheimer’s Disease Neuroimaging Initiative. Early diagnosis of Alzheimer’s disease using combined features from voxel-based morphometry and cortical, subcortical, and hippocampus regions of MRI T1 brain image. PLoS ONE 2019, 14, e0222446. [Google Scholar] [CrossRef] [Green Version]
- Wei, R.; Chuhan, L.; Fogelson, N.; Li, L. Prediction of Conversion from Mild Cognitive Impairment to Alzheimer’s Disease Using MRI and Structural Network Features. Front. Aging Neurosci. 2016, 8, 76. [Google Scholar] [CrossRef] [Green Version]
- Ramprashad, C.S.M.A. A comparison of FreeSurfer-generated data with and without manual intervention. Front. Neurosci. 2015, 9, 379. [Google Scholar]
- Wellington, H.; Paterson, R.W.; Suárez-González, A.; Poole, T.; Frost, C.; Sjöbom, U.; Slattery, C.F.; Magdalinou, N.K.; Lehmann, M.; Portelius, E.; et al. CSF neurogranin or tau distinguish typical and atypical Alzheimer disease. Ann. Clin. Transl. Neurol. 2018, 5, 162–171. [Google Scholar] [CrossRef] [PubMed]
- Ben, B.O.A. Recognition of Alzheimer’s disease and Mild Cognitive Impairment with multimodal image-derived biomarkers and Multiple Kernel Learning. Neurocomputing 2017, 220, 98–110. [Google Scholar]
- Kauppi, K.; Fan, C.C.; McEvoy, L.K.; Holland, D.; Tan, C.H.; Chen, C.-H.; Andreassen, O.A.; Desikan, R.S.; Dale, A.M.; the Alzheimer's Disease Neuroimaging Initiative. Combining polygenic hazard score with volumetric MRI and cognitive measures improves prediction of progression from mild cognitive Impairment to Alzheimer’s disease. Front. Neurosci. 2018, 12, 260. [Google Scholar] [CrossRef] [PubMed] [Green Version]
- Hallikainen, M.I. Alzheimer’s Disease Neuroimaging Initiative. Rey’s Auditory Verbal Learning Test scores can be predicted from whole brain MRI in Alzheimer’s disease. Neuroimage Clin. 2016, 13, 415–427. [Google Scholar]
- Cao, P.; Shan, X. Sparse shared structure based multi-task learning for MRI based cognitive performance prediction of Alzheimer’s disease. Pattern Recognit. 2017, 72, 219–235. [Google Scholar] [CrossRef]
- Sulaimany, S.; Khansari, M.; Zarrineh, P.; Daianu, M.; Jahanshad, N.; Thompson, P.M.; Masoudi-Nejad, A. Predicting brain network changes in Alzheimer’s disease with link prediction algorithms. Mol. Biosyst. 2017, 13, 725–735. [Google Scholar] [CrossRef]
- Zhang, X.C.H. Extraction of dynamic functional connectivity from brain grey matter and white matter for MCI classification. Hum. Brain Mapp. 2017, 38, 5019–5034. [Google Scholar]
- Ahmed, O.B.; Mizotin, M.; Benois-Pineau, J.; Allard, M.; Catheline, G.; Amar, C.B. Alzheimer's Disease Neuroimaging Initiative—Alzheimer’s disease diagnosis on structural MR images using circular harmonic functions descriptors on hippocampus and posterior cingulate cortex. Comput. Med. Imaging Graph. 2015, 44, 13–25. [Google Scholar] [CrossRef]
- Amoroso, N.; Monaco, A.; Tangaro, S.; Alzheimer’s DiseaseNeuroimaging Initiative. Topological Measurements of DWI Tractography for Alzheimer’s Disease Detection. Comput. Math. Methods Med. 2017, 2017, 527162. [Google Scholar] [CrossRef] [Green Version]
- Prasad, G.; Nir, T.M.; Toga, A.W.; Thompson, P.M. Tractography density and network measures in Alzheimer's disease. In Proceedings of the 2013 IEEE 10th International Symposium on Biomedical Imaging, San Francisco, CA, USA, 7–11 April 2013; pp. 692–695.
- Myers, S.J.S.N. Prediction of Alzheimer’s disease using individual structural connectivity networks. Neurobiol. Aging 2012, 33, 2756–2765. [Google Scholar]
- Kuceyeski, A.R.A.; Zhang, Y. Linking white matter integrity loss to associated cortical regions using structural connectivity information in Alzheimer’s disease and fronto-temporal dementia: The Loss in Connectivity (LoCo) score. Neuroimage 2012, 61, 1311–1323. [Google Scholar] [CrossRef] [PubMed] [Green Version]
- Long, X.; Chen, L.; Jiang, C.; Zhang, L.; Chen, K.; Alzheimer’s Disease Neuroimaging Initiative. Prediction and classification of Alzheimer disease based on quantification of MRI deformation. PLoS ONE 2017, 12, e0173372. [Google Scholar] [CrossRef] [PubMed] [Green Version]
- Guo, H.; Siu, W.; D’Arcy, R.C.; Black, S.E.; Grajauskas, L.A.; Singh, S.; Zhang, Y.; Rockwood, K.; Song, X. MRI assessment of whole-brain structural changes in aging. Clin. Interv. Aging 2017, 12, 1251–1270. [Google Scholar] [CrossRef] [PubMed] [Green Version]
- Lee, P.; Ryoo, H.; Park, J.; Jeong, Y.; Alzheimer’s Disease Neuroimaging Initiative. Morphological and microstructural changes of the hippocampus in early MCI: A study utilizing the Alzheimer’s disease neuroimaging initiative database. J. Clin. Neurol. 2017, 13, 144–154. [Google Scholar] [CrossRef] [Green Version]
- Lopes, S.V.R. Cerebral Hypoperfusion and Hypometabolism Detected by Arterial Spin Labeling MRI and FDG-PET in Early-Onset Alzheimer’s Disease. J. Neuroimaging 2016, 26, 207–212. [Google Scholar]
- de Vos, F.; Schouten, T.M.; Hafkemeijer, A.; Dopper, E.G.; van Swieten, J.C.; de Rooij, M.; van der Grond, J.; Rombouts, S.A. Combining multiple anatomical MRI measures improves Alzheimer’s disease classification. Hum. Brain Mapp. 2016, 37, 1920–1929. [Google Scholar] [CrossRef] [PubMed]
- Moon, W.J.; Park, J.Y.; Yun, W.S.; Jeon, J.Y.; Moon, Y.S.; Kim, H.; Kim, H.; Kwak, K.-C.; Lee, J.M.; Han, S.H. H. A comparison of substantia nigra T1 hyperintensity in parkinson’s disease dementia, Alzheimer’s disease and age-matched controls: Volumetric analysis of neuromelanin imaging. Korean J. Radiol. 2016, 17, 633–640. [Google Scholar] [CrossRef] [Green Version]
- de Mendonça, L.J.C.; Ferrari, R.J.; Initiative, A.D.N. Alzheimer’s disease classification based on graph kernel SVMs constructed with 3D texture features extracted from MR images. Expert Syst. Appl. 2023, 211, 118633. [Google Scholar] [CrossRef]
- Du, Y.; Zhang, S.; Qiu, Q.; Zhang, J.; Fang, Y.; Zhao, L.; Wei, W.; Wang, J.; Wang, J.; Li, X. The effect of hippocampal radiomic features and functional connectivity on the relationship between hippocampal volume and cognitive function in Alzheimer’s disease. J. Psychiatr. Res. 2023, 158, 382–391. [Google Scholar] [CrossRef]
- Zheng, X.; Cawood, J.; Hayre, C.; Wang, S.; Group, A.D.N.I. Computer assisted diagnosis of Alzheimer’s disease using statistical likelihood-ratio test. PLoS ONE 2023, 18, e0279574. [Google Scholar] [CrossRef]
- Ingala, S.; van Maurik, I.S.; Altomare, D.; Wurm, R.; Dicks, E.; van Schijndel, R.A.; Zwan, M.; Bouwman, F.; Schoonenboom, N.; Boelaarts, L. Clinical applicability of quantitative atrophy measures on MRI in patients suspected of Alzheimer’s disease. Eur. Radiol. 2022, 32, 7789–7799. [Google Scholar] [CrossRef] [PubMed]
- Prescott, J.W.; Doraiswamy, P.M.; Gamberger, D.; Benzinger, T.; Petrella, J.R.; Network, D.I.A. Diffusion tensor MRI structural connectivity and PET amyloid burden in preclinical autosomal dominant Alzheimer disease: The DIAN cohort. Radiology 2022, 302, 143–150. [Google Scholar] [CrossRef]
- Hedges, E.P.; Dimitrov, M.; Zahid, U.; Vega, B.B.; Si, S.; Dickson, H.; McGuire, P.; Williams, S.; Barker, G.J.; Kempton, M.J. Reliability of structural MRI measurements: The effects of scan session, head tilt, inter-scan interval, acquisition sequence, FreeSurfer version and processing stream. Neuroimage 2022, 246, 118751. [Google Scholar] [CrossRef] [PubMed]
- shii, K.; Willoch, F.; Minoshima, S.; Drzezga, A.; Ficaro, E.P.; Cross, D.J.; Kuhl, D.E.; Schwaiger, M. Statistical brain mapping of 18F-FDG PET in Alzheimer’s disease: Validation of anatomic standardization for atrophied brains. J. Nucl. Med. 2001, 42, 548–557. [Google Scholar]
- Arce-Santana, E.; Campos-Delgado, D.U.; Alba, A. A non-rigid multimodal image registration method based on particle filter and optical flow. In Proceedings of the Advances in Visual Computing: 6th International Symposium, ISVC 2010, Las Vegas, NV, USA, 29 November–1 December 2010; pp. 35–44. [Google Scholar]
- Abdou, A. Literature review: Efficient deep neural networks techniques for medical image analysis. Neural. Comput. Appl. 2022, 34, 5791–5812. [Google Scholar] [CrossRef]
- Kelly, W.S.K.W.; Zou, H. Simultaneous truth and performance level estimation (STAPLE): An algorithm for the validation of image segmentation. IEEE Trans. Med. Imaging 2004, 23, 903–921. [Google Scholar]
- Liu, M.; Zhang, D. Hierarchical fusion of features and classifier decisions for Alzheimer’s disease diagnosis. Hum. Brain Mapp. 2014, 35, 1305–1319. [Google Scholar] [CrossRef] [Green Version]
- Zhu, X.; Suk, H.I.; Shen, D. A novel matrix-similarity based loss function for joint regression and classification in AD diagnosis. NeuroImage 2014, 100, 91–105. [Google Scholar] [CrossRef] [Green Version]
- Lei, B.; Chen, S.; Ni, D.; Wang, T. Discriminative Learning for Alzheimer’s Disease Diagnosis via Canonical Correlation Analysis and Multimodal Fusion. Front. Aging Neurosci. 2016, 8, 77. [Google Scholar] [CrossRef] [Green Version]
- Bhateja, V.; Moin, A. Multispectral medical image fusion in Contourlet domain for computer based diagnosis of Alzheimer’s disease. Rev. Sci. Instrum. 2016, 87, 74303. [Google Scholar] [CrossRef]
- Platero, C. Combining a Patch-based Approach with a Non-rigid Registration-based Label Fusion Method for the Hippocampal Segmentation in Alzheimer’s Disease. Neuroinformatics 2017, 15, 165–183. [Google Scholar] [CrossRef] [PubMed]
- Tong, T.; Gray, K. Multi-modal classification of Alzheimer’s disease using nonlinear graph fusion. Pattern Recognit. 2017, 63, 171–181. [Google Scholar] [CrossRef]
- Tan, X.; Liu, Y.; Li, Y.; Wang, P.; Zeng, X.; Yan, F.; Li, X. Localized instance fusion of MRI data of Alzheimer’s disease for classification based on instance transfer ensemble learning. Biomed. Eng. Online 2018, 17, 1–17. [Google Scholar] [CrossRef] [PubMed] [Green Version]
- Rajalingam, B.; Priya, R.; Bhavani, R. Medical Image Fusion based on Hybrid Algorithms for Neuro cysticercosis and Neoplastic Disease Analysis. J. Mech. Contin. Math. Sci. 2019, 14, 171–187. [Google Scholar] [CrossRef] [Green Version]
- Punjabi, A.; Martersteck, A. Neuroimaging modality fusion in Alzheimer’s classification using convolutional neural networks. PLoS ONE 2019, 14, 225759. [Google Scholar] [CrossRef]
- Dimitriadis, S.I.; Liparas, D.; Tsolaki, M.N.; Alzheimer's Disease Neuroimaging Initiative. Random forest feature selection, fusion and ensemble strategy: Combining multiple morphological MRI measures to discriminate among healhy elderly, MCI, cMCI and Alzheimer’s disease patients: From the Alzheimer’s disease neuroimaging initiative (ADNI) database. J. Neurosci. Methods 2018, 302, 14–23. [Google Scholar]
- Abuhmed, T.; El-Sappagh, S.; Alonso, J.M. Robust hybrid deep learning models for Alzheimer’s progression detection. Tamer Abuhmed Shak. El-Sappagh 2021, 213, 106688. [Google Scholar] [CrossRef]
- El, S.; Saleh, S.H. Alzheimer’s disease progression detection model based on an early fusion of cost-effective multimodal data. Future Gener. Comput. Syst. 2021, 115, 680–699. [Google Scholar]
- De, A.; Chowdhury, A.S. DTI based Alzheimer’s disease classification with rank modulated fusion of CNNs and random forest. Expert Syst. Appl. 2021, 169, 114338. [Google Scholar] [CrossRef]
- Arco, J.E.; Ramírez, J.; Górriz, J.M.; Ruz, M.; Alzheimer’s Disease Neuroimaging Initiative. Data fusion based on searchlight analysis for the prediction of Alzheimer’s disease. Expert Syst. Appl. 2021, 185, 115549. [Google Scholar] [CrossRef]
- Zhang, Y.; Wang, S. Alzheimer’s disease multiclass diagnosis via multimodal neuroimaging embedding feature selection and fusion. Inf. Fusion 2021, 66, 170–183. [Google Scholar] [CrossRef]
- Wang, Y.; Liu, X.; Yu, C. Assisted diagnosis of Alzheimer’s disease based on deep learning and multimodal feature fusion. Complexity 2021, 2021, 1–10. [Google Scholar] [CrossRef]
- Rohanian, M.; Hough, J.; Purver, M. Multi-modal fusion with gating using audio, lexical and disfluency features for Alzheimer’s dementia recognition from spontaneous speech. arXiv 2021, arXiv:2106.09668. [Google Scholar]
- Zhang, Z.; Xi, X.; Luo, X.; Jiang, Y.; Dong, J.; Wu, X. Multimodal image fusion based on global-regional-local rule in NSST domain. Multimed. Tools Appl. 2021, 80, 2847–2873. [Google Scholar] [CrossRef]
- Villatoro-Tello, E.; Dubagunta, S.P.; Fritsch, J.; Ramírez-de-la-Rosa, G.; Motlicek, P.; Magimai-Doss, M. Late Fusion of the Available Lexicon and Raw Waveform-Based Acoustic Modeling for Depression and Dementia Recognition. In Proceedings of the Interspeech, Brno, Czechia 30 August–3 September 2021; pp. 1927–1931. [Google Scholar]
- Bosnić, Z.; Bratić, B.; Ivanović, M.; Semnic, M.; Oder, I.; Kurbalija, V.; Stankov, T.V.; Ignjatović, V.B. Improving Alzheimer’s disease classification by performing data fusion with vascular dementia and stroke data. J. Exp. Theor. Artif. Intell. 2021, 33, 1015–1032. [Google Scholar] [CrossRef]
- Zhao, Y.; Long, Z.; Ding, Y.; Jiang, T.; Liu, J.; Li, Y.; Liu, Y.; Peng, X.; Wang, K.; Feng, M.; et al. Dihydroartemisinin meliorates learning and memory in Alzheimer’s disease through promoting autophagosome-lysosome fusion and autolysosomal degradation for Aβ clearance. Front. Aging Neurosci. 2020, 12, 47. [Google Scholar] [CrossRef] [PubMed]
- Mishra, S.; Dutta, M. Modality feature fusion based Alzheimer’s disease prognosis. Optik 2023, 272, 170347. [Google Scholar] [CrossRef]
- Ismail, W.N.; PP, F.R.; Ali, M.A. A Meta-Heuristic Multi-Objective Optimization Method for Alzheimer’s Disease Detection Based on Multi-Modal Data. Mathematics 2023, 11, 957. [Google Scholar] [CrossRef]
- Song, J.; Zheng, J.; Li, P.; Lu, X.; Zhu, G.; Shen, P. An effective multimodal image fusion method using MRI and PET for Alzheimer's disease diagnosis. Front. Digit. Health 2021, 3, 637386. [Google Scholar] [CrossRef]
- Wang, K.; Liang, M. Altered functional connectivity in early Alzheimer’s disease: A resting-state fMRI study. Hum. Brain Mapp. 2007, 28, 967–978. [Google Scholar] [CrossRef]
- Davatzikos, C.; Resnick, S.M.; Wu, X.; Parmpi, P.; Clark, C.M. Individual patient diagnosis of AD and FTD via high-dimensional pattern classification of MRI. Neuroimage 2008, 41, 1220–1227. [Google Scholar] [CrossRef] [PubMed] [Green Version]
- McEvoy, L.K.; Fennema-Notestine, C.; Roddey, J.C.; Hagler, D.J., Jr.; Holland, D.; Karow, D.S.; Pung, C.J.; Brewer, J.B.; Dale, A.M. Alzheimer disease: Quantitative structural neuroimaging for detection and prediction of clinical and structural changes in mild cognitive impairment. Radiology 2009, 251, 195–205. [Google Scholar] [CrossRef] [PubMed] [Green Version]
- Ramírez, J.; Górriz, J.M. Computer aided diagnosis system for the Alzheimer’s disease based on partial least squares and random forest SPECT image classification. Neurosci. Lett. 2010, 472, 99–103. [Google Scholar] [CrossRef] [PubMed]
- Termenon, M. A two stage sequential ensemble applied to the classification of Alzheimer’s disease based on mri features. Neural Process. Lett. 2012, 35, 1–12. [Google Scholar] [CrossRef]
- Suk, H.I.; Shen, D. Deep learning-based feature representation for AD/MCI classification. In Proceedings of the Medical Image Computing and Computer-Assisted Intervention–MICCAI 2013: 16th International Conference, Nagoya, Japan, 22–26 September 2013; pp. 583–590. [Google Scholar]
- Hsu, R.C.F.C. Alzheimer’s disease risk assessment using large-scale machine learning methods. PLoS ONE 2013, 8, 77949. [Google Scholar]
- Liu, S.; Liu, S. Multimodal neuroimaging feature learning for multiclass diagnosis of Alzheimer’s disease. IEEE Trans. Biomed. Eng. 2014, 62, 1132–1140. [Google Scholar] [CrossRef] [Green Version]
- Asgari, H.D.M.; Kaye, J. Predicting mild cognitive impairment from spontaneous spoken utterances. Dement. Transl. Res. Amp 2017, 3, 219–228. [Google Scholar] [CrossRef]
- Basaia, S.; Agosta, F. Automated classification of Alzheimer’s disease and mild cognitive impairment using a single MRI and deep neural networks. Neuroimage Clin. 2019, 21, 101645. [Google Scholar] [CrossRef]
- Wang, H.; Shen, Y.; Wang, S.; Xiao, T.; Deng, L.; Wang, X.; Zhao, X. Ensemble of 3D densely connected convolutional network for diagnosis of mild cognitive impairment and Alzheimer’s disease. Neurocomputing 2019, 333, 145–156. [Google Scholar] [CrossRef]
- Shi, M.; Caudle, W.M. Biomarker discovery in neurodegenerative diseases: A proteomic approach. Neurobiol. Dis. 2009, 35, 157–164. [Google Scholar] [CrossRef] [PubMed] [Green Version]
- Tran, F.L.L. A robust deep model for improved classification of AD/MCI patients. IEEE J. Biomed. Health Inf. 2015, 19, 1610–1616. [Google Scholar]
- Sarraf, S.; Tofighi, G. Deep learning-based pipeline to recognize Alzheimer’s disease using fMRI data. In Proceedings of the 2016 Future Technologies Conference (FTC), San Francisco, CA, USA, 6–7 December 2016; pp. 816–820. [Google Scholar]
- Suk, H.I.; Lee, S.W.; Shen, D.; Alzheimer’s Disease Neuroimaging Initiative. Hierarchical feature representation and multimodal fusion with deep learning for AD/MCI diagnosis. Neuroimage 2014, 101, 569–582. [Google Scholar] [CrossRef] [PubMed] [Green Version]
- Jo, T.; Nho, K.; Saykin, A.J. Deep learning in Alzheimer’s disease: Diagnostic classification and prognostic prediction using neuroimaging data. Front. Aging Neurosci. 2019, 11, 220. [Google Scholar] [CrossRef] [PubMed] [Green Version]
- Ebrahimi-Ghahnavieh, A.; Luo, S.; Chiong, R. Transfer learning for Alzheimer’s disease detection on MRI images. In Proceedings of the 2019 IEEE International Conference on Industry 4.0, Artificial Intelligence, and Communications Technology (IAICT), Bali, Indonesia, 1–3 July 2019; pp. 133–138. [Google Scholar]
- Feng, C.; Elazab, A.; Yang, P.; Wang, T.; Zhou, F.; Hu, H.; Xiao, X.; Lei, B. Deep learning framework for Alzheimer’s disease diagnosis via 3D-CNN and FSBi-LSTM. IEEE Access 2019, 7, 63605–63618. [Google Scholar] [CrossRef]
- Bi, X.; Wang, H. Early Alzheimer’s disease diagnosis based on EEG spectral images using deep learning. Neural Netw. 2019, 114, 119–135. [Google Scholar] [CrossRef] [PubMed]
- Folego, G.; Weiler, M.; Casseb, R.F.; Pires, R.; Rocha, A. Alzheimer’s disease detection through whole-brain 3D-CNN MRI. Front. Bioeng. Biotechnol. 2020, 8, 534592. [Google Scholar] [CrossRef]
- Allioui, H.; Sadgal, M.; Elfazziki, A. Utilization of a convolutional method for Alzheimer disease diagnosis. Mach. Vis. Appl. 2020, 31, 25. [Google Scholar] [CrossRef]
- Hussain, E.; Hasan, M.; Hassan, S.Z.; Azmi, T.H.; Rahman, M.A.; Parvez, M.Z. Deep learning based binary classification for Alzheimer’s disease detection using brain mri images. In Proceedings of the 2020 15th IEEE Conference on Industrial Electronics and Applications (ICIEA), Kristiansand, Norway, 9–13 November 2020; pp. 1115–1120. [Google Scholar]
- Mamun, M.; Shawkat, S.B.; Ahammed, M.S.; Uddin, M.M.; Mahmud, M.I.; Islam, A.M. Deep Learning Based Model for Alzheimer’s Disease Detection Using Brain MRI Images. In Proceedings of the 2022 IEEE 13th Annual Ubiquitous Computing, Electronics & Mobile Communication Conference (UEMCON), New York, NY, USA, 26–29 October 2022; pp. 0510–0516. [Google Scholar]
- Abbas, S.Q.; Chi, L.; Chen, Y.P.P. Transformed domain convolutional neural network for Alzheimer’s disease diagnosis using structural MRI. Pattern Recognit. 2023, 133, 109031. [Google Scholar] [CrossRef]
- Maringanti, H.B.; Mishra, M.; Pradhan, S. Machine learning and deep learning models for early-stage detection of Alzheimer’s disease and its proliferation in human brain. In Artificial Intelligence for Neurological Disorders; Academic Press: Cambridge, MA, USA, 2023. [Google Scholar]


| Question | Description |
|---|---|
| Q1 | How can Medical Image Modalities be used for the detection of Alzheimer’s disease and its various classes? |
| Q2 | Does Multi-Modality Diagnosis approach improve the diagnosis accuracy of Alzheimer Disease? |
| Q3 | Handcrafted features or deep learning-based solutions can be used to detect AD diseases. Which method provides the highest chance of detecting the disease? |
| S.No | Biomarkers | Description |
|---|---|---|
| 1 | Clinical Biomarker | A clinical trial is an analysis of data, from the micro (patient care) to the macro (clinical trials), that are used in healthcare research (wide applications within a health system) [21]. Clinical trials collected this data for analysing patient outcomes. Novel pharmaceuticals, treatment approaches, devices, and other research are tested in clinical trials. |
| 2 | Genetic Biomarker | Genetic samples contain sensitive information about an individual’s health and well-being. An individual’s inherited or acquired genetic characteristics can be determined by DNA and RNA analysis [22]. |
| 3 | Positron Emission Tomography (PET) | PET is required for analysing cholesterol levels and amyloid proportions in the brain. This biomarker allows for the measurement of glucose levels in various parts of the brain and the identification of different subjects with AD. A tesla scanner is capable of performing both Gamma Ray and PET imaging in patients with AD using the Amyloid detection method developed by [23]. |
| 4 | Biospecimen Biomarker | The biospecimen data is information about the physical sample taken from an AD patient and prepared for sequencing analysis [24]. A structural quantification of the brain involves the collection of information from different parts of the brain that exhibit minor structural changes and mobility in. Using these biomarkers, one can track every function of the neuroanatomical structure when a patient suffers from any deficiency in their ageing process [25]. |
| 5 | Structural Magnetic Resonance Imaging (s MRI) | MRI provides anatomical details about the brain. In AD patients, hydrogen atoms and resonance enable structural visualization through magnetic resonance imaging, both in static and magnetic fields Varghese et al. (2013). Structure analysis, volumetric analysis, cortical thickness measurement, voxel-based analysis, longitudinal analysis, and anatomical morphology are all performed by imaging techniques [26]. |
| 6 | Cerebrospinal Fluid (CSF) | The proportions of proteins in CSF biomarkers determine whether a particular biomarker is applicable for AD detection. CSF analysis can be used to find differences between AD patients and healthy individuals based on the proportion of Aβ protein. Diagnoses are made by examining the reduction or increase in Aβ [27]. Aβ, Aβ40, Aβ42 proteins are found in the brain region as is phosphorylated tau (p-tau) and tau protein total (t-tau). |
| 7 | (APOE e4) | The neuro region, the lung region, and the heart region of the human body are influenced by genetic influences. This information is crucial to diagnosing and detecting AD patients [28]. A genetic biomarker assists in diagnosing the e4 allele of Apo lipoprotein E (APOE e4) in the brain which leads to the development of Alzheimer’s symptoms and limits the production of amyloid in the brain. |
| 8 | Fluid Attenuated Inversion Recovery (FLAIR) | A flare image, also called a fluid-attenuated inversion recovery image, is a diagnostic method for AD detection. This biomarker can provide information regarding an unwanted lesion in the brain or a lesion which suppresses CSF’s role in the brain [29]. The Flair Modality continues to use the T2 weighted proportion. It also contains information about the white matter remaining in the different parts of the brain affected by AD. |
| 9 | Diffusion Tensor Imaging (DTI) | The diffusion tensor imaging (DTI) technique uses isotropic diffusion to assess the brain’s axonal (white matter) structure. Diffusion tensor imaging is utilized to determine the diffusivity of water molecules in tissue in order to identify the fibre bundles gathered in the affected region of the brain of AD patients [30]. Water molecules stagger communication between neurons when they do not flow regularly in the brain. This leads to progressive memory loss, eventually leading to AD. |
| 10 | EEG (Electroencephalography) | Brainwaves are measured by EEG. Routine EEGs have a regular frequency and shape. The electrical conductivity of AD patients’ tissues varies between individuals and over time. Prolonged EEGs are used for detecting AD Marcel and del R [31]. Consequently, the detection of AD becomes smooth and provides a higher rate of precision than any other detection method. |
| 11 | PET (Positron Emission Tomography) | PET is a form of functional imaging technique that employs a radioactive tracer to evaluate the metabolic activity of diverse areas of the brain. PET scans can offer data on how different parts of the brain are performing, including how they react to different stimuli, and can be employed to identify ailments such as AD, Parkinson’s disease, and epilepsy [32]. |
| 12 | CT (Computed Tomography) | CT scanning is a type of imaging that uses X-rays to generate representations of the brain without any invasive measures. With CT scans, the size and shape of different sections of the brain, along with any irregularities, can be determined. This method is commonly used to detect conditions such as tumours, intracerebral bleeding, and stroke [33]. |
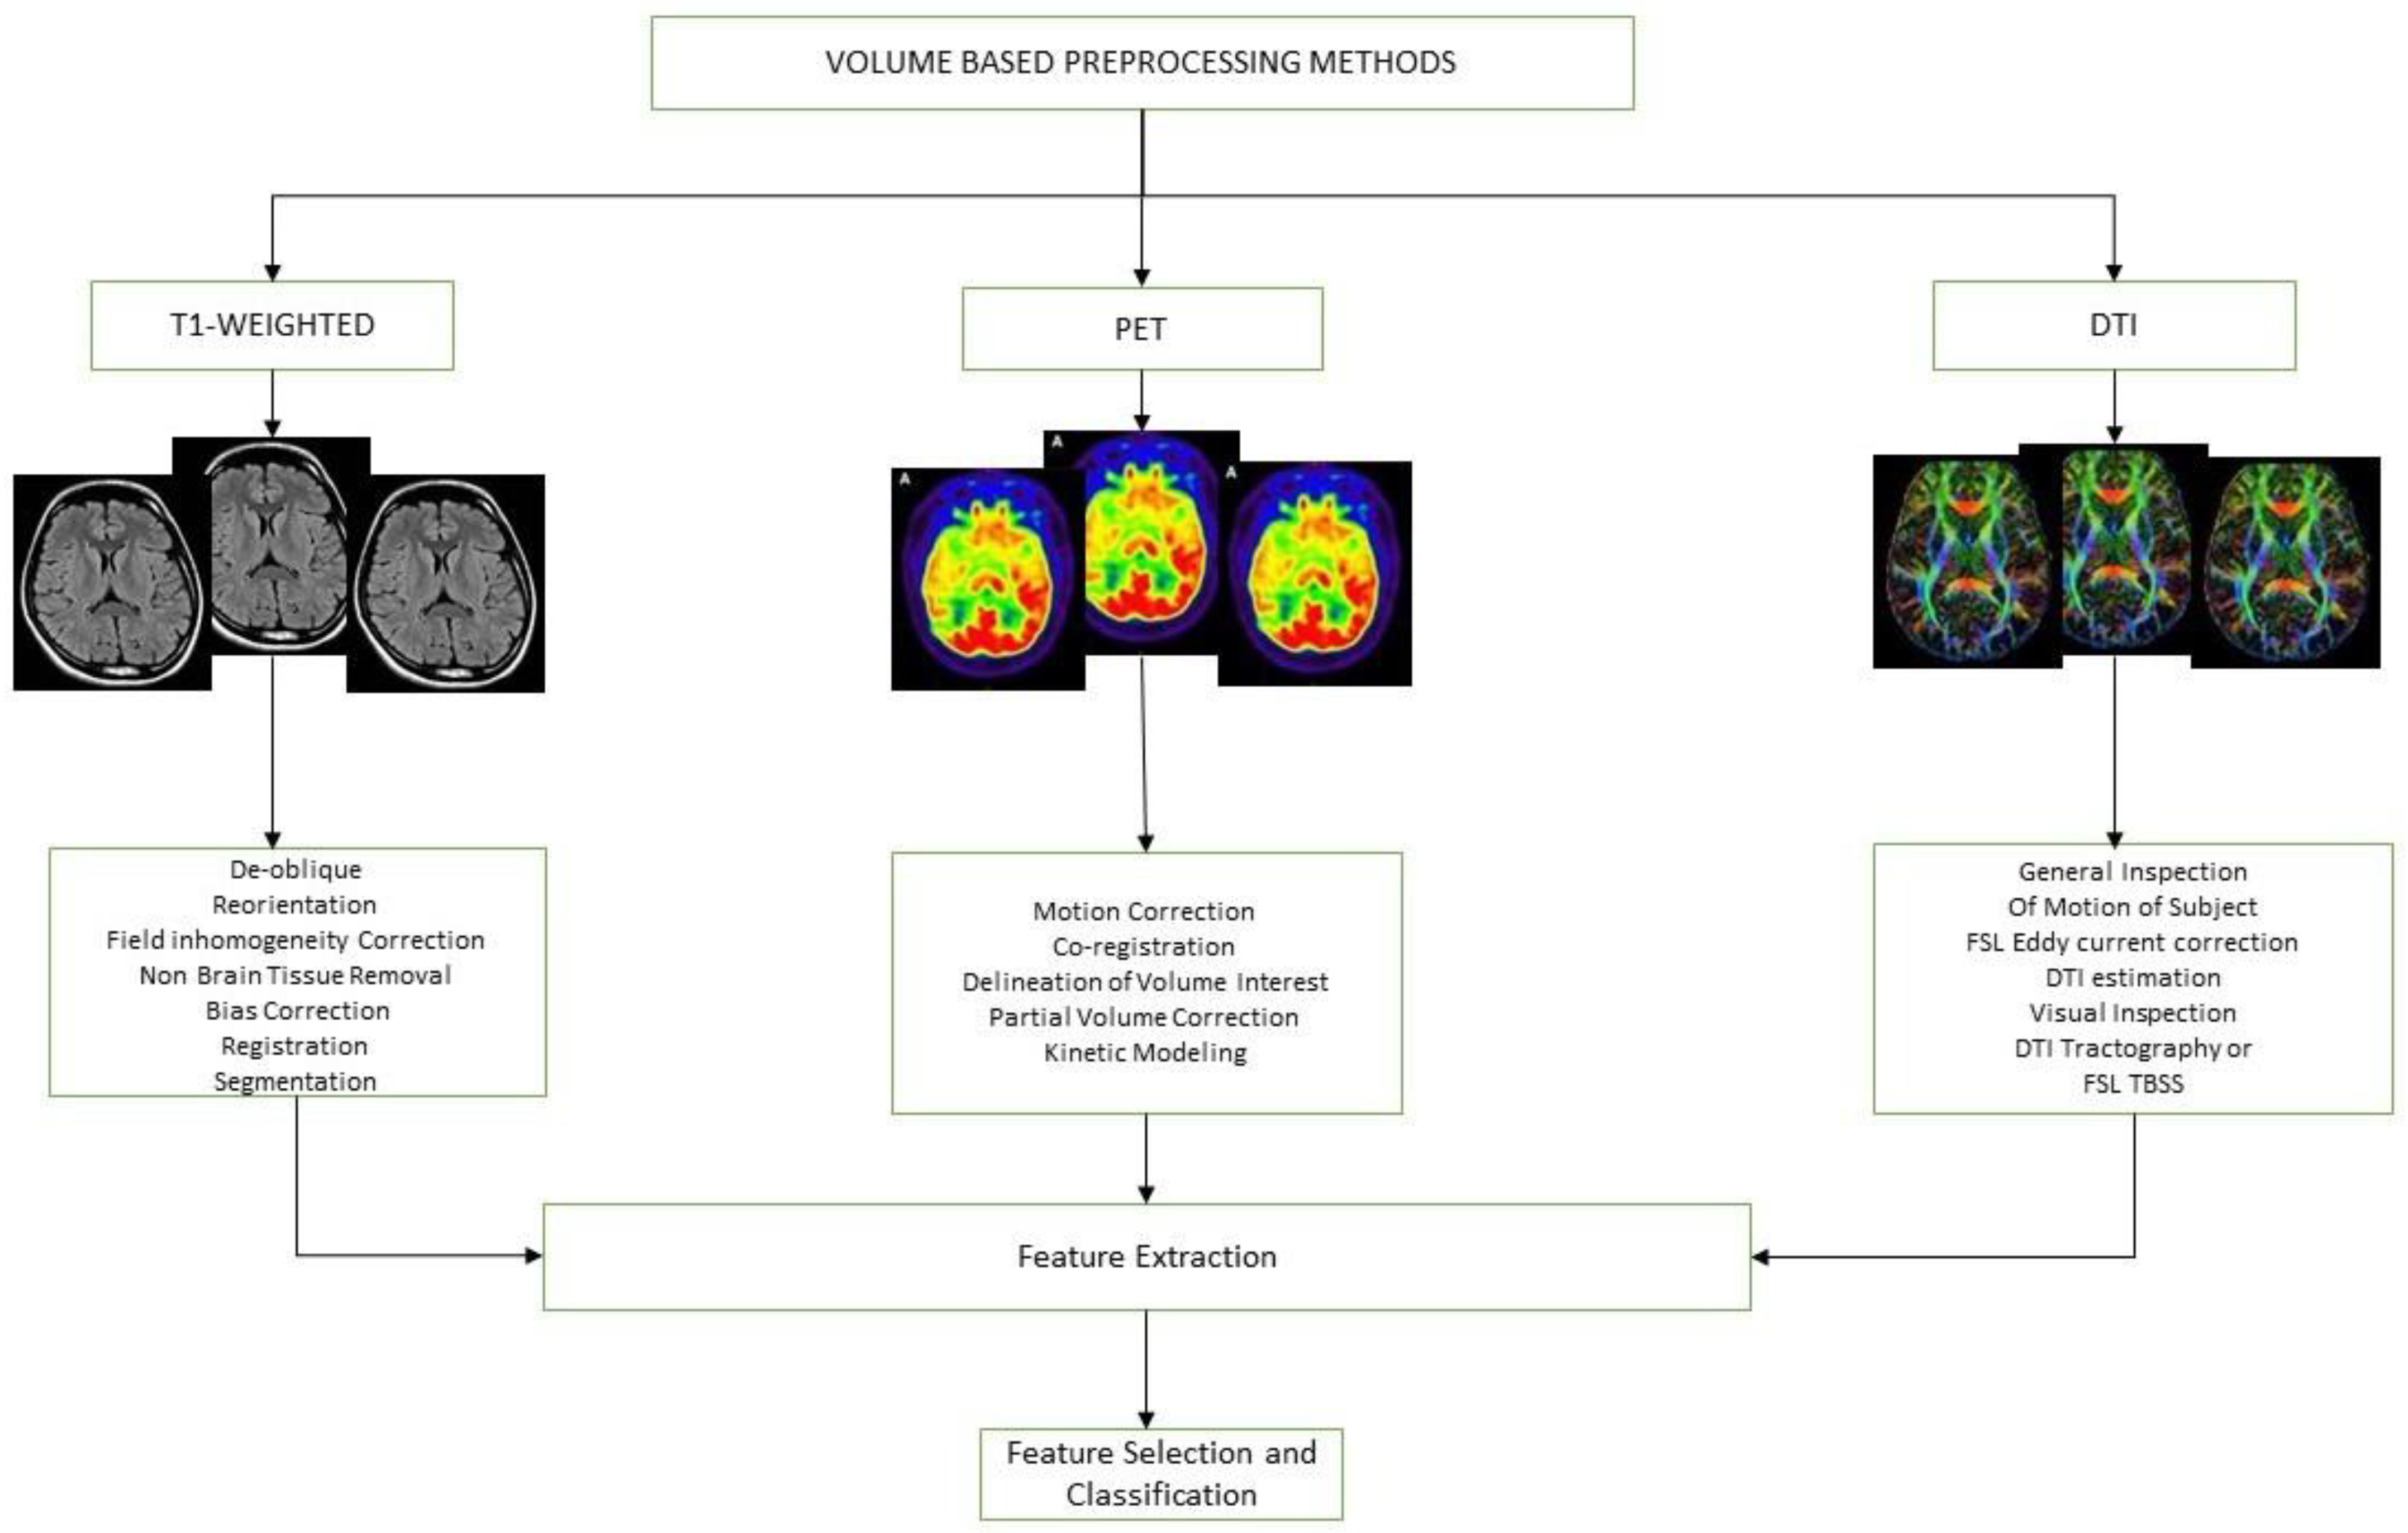
| S.No | Preprocessing Methods | Description |
|---|---|---|
| 1 | De-Oblique | De-oblique pre-processing is a technique used to reduce the effects of perceptive distortion. This technique works by rotating the images, reducing any perspective distortion and allowing for easy interpretation. |
| 2 | Field Inhomogeneity Correction | This pre-processing method also helps in the removal of artifacts from the data. It helps remove the intensity of tissues not in the observed mean intensity. |
| 3 | Bias Correction | This method is used to correct the non-uniform shading in an image. In this technique, the low pass filter is used to remove the high frequency. |
| 4 | Non Brain Tissue Removal | This is the pre-processing of the removal of non-brain tissue from the captured image. Non-brain tissue removal is accomplished through a combination of techniques, including segmentation, morphological operations, and filtering. |
| 5 | FSL and Eddy Current | This FSL contain the approach to quantify the temporal dynamic of the Image, which is based on Fourier Transformation. Eddy Current pre-processing is used to identify the small changes in an image through the Eddy Current flows at the time the image is recorded. |
| S.No | Authors | Data Base | Year | Biomarker | Binary Class | Multi Class | Accuracy |
|---|---|---|---|---|---|---|---|
| 1 | [34] | OASIS DATABASE | 2018 | MRI | ✓ | X | 92% AD |
| 2 | [35] | HAVARD MEDICAL SCHOOL | 2019 | MRI | ✓ | X | Multiclass 95.23 |
| 3 | [36] | ADNI | 2017 | MRI | X | ✓ | AD vs. NC 98.88 |
| 4 | [37] | ADNI | 2020 | MRI | X | ✓ | AD vs. NC 99.20 |
| 5 | [38] | OASIS DATABASE | 2019 | MRI | ✓ | ✓ | 92.85% AD |
| 6 | [39] | ADNI | 2020 | MRI | ✓ | ✓ | 99% AD |
| 7 | [40] | OASIS | 2013 | MRI | ✓ | X | 90% AD |
| 8 | [41] | ADNI | 2021 | MRI | ✓ | X | 92% AD |
| 9 | [18] | ADNI | 2019 | BIO SPECIMEN | ✓ | X | 99.67% AD |
| 10 | [42] | GERAD1 | 2017 | GENETIC | X | X | 90% AD |
| 11 | [43] | ADNI, AIBL | 2014 | MRI | ✓ | X | MCI to AD.86% |
| 12 | [44] | ADNI | 2019 | CSF, PET | ✓ | X | CSF Abeta-42, Neuronal Pentraxin decreased |
| 13 | [45] | DIAN | 2019 | CSF | X | ✓ | NLF rate changed to AD |
| 14 | [46] | ADNI | 2013 | AD, MCI | X | X | 92% AD |
| 15 | [47] | ADNI | 2013 | CSF, MRI, PET | ✓ | X | Misclassification 41.3% to 28.4% |
| 16 | [48] | ADNI | 2019 | PET, CSF | X | X | 94% AD |
| 17 | [49] | ADNI | 2003 | FDG, PET | ✓ | X | Detected AD |
| 18 | [50] | ADNI | 2007 | MRI | ✓ | X | AD 86.8 |
| 19 | [51] | ADNI | 2017 | MRI | ✓ | X | AD-HC: 94.11%, MCI-HC: 83.77% |
| 20 | [52] | NICDS, ADRDA | 2000 | MRI | X | X | 88.6% AD |
| 21 | [53] | PRIVATE HOSPITAL DATA | 2006 | MRI | X | X | MCI to AD 86% |
| 22 | [54] | PRIVATE Data Set | 1993 | CT, MR | X | X | 91% AD |
| 23 | [55] | PRIVATE Data Set | 2010 | GENETIC | ✓ | X | 28 Score in AD |
| 24 | [56] | PRIVATE | 2011 | CLINICAL | X | X | CDE, MMSE score is high in AD |
| 25 | [57] | PRIVATE | 2009 | MRI | ✓ | X | AD, HC |
| 26 | [58] | NINCDS-ADRDA | 1997 | MRCLINICAL | X | X | 95% AD |
| 27 | [59] | PRIVATE | 1996 | CLINICAL | X | X | predicted AD |
| 28 | [60] | ADNI | 2013 | PET | ✓ | X | 64% MCI |
| 29 | [61] | ADNI | 2020 | MRI | ✓ | X | 96.8% AD vs. CN |
| 30 | [62] | OASIS Data Set | 2020 | MRI | ✓ | X | 97.75% AD vs. CN |
| 31 | [63] | MNIST Data Set | 2021 | MRI | ✓ | X | AD vs. Healthy 96.8 |
| 32 | [64] | ADNI | 2021 | MRI | ✓ | X | AD vs. NC 98.73 |
| 33 | [65] | OASIS | 2022 | MRI | ✓ | X | AD vs. NC 98.99 |
| 34 | [66] | ADNI | 2022 | MRI | ✓ | X | AD vs. NC 85.12 |
| 35 | [67] | OASIS | 2023 | MRI | ✓ | X | AD vs. NC 95.48 |
| 36 | [68] | ADNI | 2023 | MRI | ✓ | X | 77% ADNI, 76% OASIS |
| S.No | Author | Data Set | Year | Automated Pipelines | Multiple Class | Binary Class | Accuracy |
|---|---|---|---|---|---|---|---|
| 1 | [73] | ADNI | 2016 | SPM12 and VBM | X | ✓ | AD vs. HC 99.93 |
| 2 | [74] | NCRD | 2020 | SPM12 | X | ✓ | AD vs. CN 93.33 |
| 3 | [75] | ADNI | 2019 | SPM12 and FSL | X | ✓ | HC vs. mAD, p < 0.001, p < 0.001 |
| 4 | [76] | ADNI | 2019 | ANT Tool and SPM12 | X | ✓ | AD vs. HC 98.33 |
| 5 | [77] | ADNI | 2016 | FREE SURFER | X | ✓ | MCnc vs. MCic = 73.91 |
| 6 | [78] | ADNI | 2015 | FSL | X | ✓ | CN vs. AD = 0.82 |
| 7 | [79] | Private | 2018 | SPM | X | X | CSF parameter, AP (p = 0.03) |
| 8 | [77] | ADNI | 2016 | NON-Conventional | X | X | AD = 79.9% |
| 9 | [30] | ADNI | 2018 | FSL, ANOVA | X | X | Only CSF and Tau Comparison |
| 10 | [80] | ADNI | 2017 | SPM8 | X | ✓ | AD vs. NC = 88, AD vs. MCI = 75 |
| 11 | [81] | ADNI | 2018 | FREE SURFER | X | ✓ | MCI to AD p = 1.07 × 10⁻⁵ |
| 12 | [82] | ADNI | 2016 | Verbal Learning Data | X | ✓ | AD vs. MCI = R = 0.43, R = 0.050 |
| 13 | [83] | ADNI | 2017 | FREE SURFER | X | X | NA |
| 14 | [84] | ADNI | 2017 | NON Conventional | X | X | NC to EMCI = 0.45 |
| 15 | [85] | ADNI | 2017 | NEURO QUANT, NEURO READER | X | ✓ | AD vs. MCI = 0.69 |
| 16 | [55] | Private | 2010 | IBM SPSS | X | X | AD = 0.90 |
| 17 | [86] | ADNI | 2015 | FSL | X | X | AD vs. NC = 90.2 |
| 18 | [87] | ADNI | 2017 | FSL | X | ✓ | NC vs. AD= 95 |
| 19 | [88] | ADNI | 2013 | FSL | X | ✓ | CN vs. AD = 90% |
| 20 | [89] | Klinikum Rechts-deisar | 2012 | FSL | X | ✓ | AD vs. MCI = 95 |
| 21 | [90] | ADNI | 2012 | SPM | X | ✓ | AD (R = 0.51, p = 2.2 × 10⁻¹) |
| 22 | [91] | ADNI | 2017 | Free Surfer | X | ✓ | mAD vs. HC = 96.51 |
| 23 | [92] | ADNI | 2017 | MMSE | X | X | NA |
| 24 | [93] | ADNI | 2017 | FSL | X | X | Changes in Hippocampus observed in EMCI |
| 25 | [94] | Private | 2016 | Free Surfer | X | ✓ | AD (p < 0.05) |
| 26 | [95] | ADNI | 1920 | FSL | X | X | AD = 0.98 |
| 27 | [96] | ADNI | 2016 | MIPAV, SPSS | X | X | AD = 0.001, p < 0.005 |
| 28 | [97] | ADNI | 2023 | SVM | X | ✓ | AD vs. CN 0.92 |
| 29 | [98] | ADNI | 2023 | Free Surfer | X | ✓ | Changes in Hippocampus |
| 30 | [99] | ADNI | 2023 | Computer Assisted | X | ✓ | AD 89% |
| 31 | [100] | Amsterdam Dementia Cohort (ADC) | 2022 | Free Surfer | X | ✓ | AD vs. NC 98% |
| 32 | [101] | ADNI | 2022 | Free Surfer | X | ✓ | EYO and white matter corelation |
| 33 | [102] | ADNI | 2022 | Free Surfer | X | ✓ | Cortical Thickness Calculated |
| S.No | Author | Date Set | Year | Subjects | Fusion Methods | Results | Feature Level Fusion | Pixel Level Fusion |
|---|---|---|---|---|---|---|---|---|
| 1 | [107] | ADNI | 2014 | ADNI AD, NC | fusion of classifiers | AD vs. NC = 92% | ✓ | X |
| 2 | [108] | ADNI | 2014 | MRI and (FDG-PET), AD 204, MCI 76, 128 MCI, 101 NC | fusion of classifiers | AD vs. NC = 93.35% | ✓ | X |
| 3 | [109] | ADNI | 2016 | 93 AD, 204 MCI 76 MCI, (MCI-C), 128 MCI (MCI-NC), and 101 NC | Multi modal fusion MRI-PET | AD vs. NC, MCI vs. NC 96.93 and 82.75 | X | ✓ |
| 4 | [110] | ADNI | 2016 | CT and PET | Multispectral fusion for CT and PET Modalities | Multispectral fusion shows the Promising result | X | ✓ |
| 5 | [111] | ADNI | 2017 | 44 CN, 45 MCI and 45 AD, LCCN 52, 97 MCI, and 13 AD | Label Fusion | automatic segmentations | X | ✓ |
| 6 | [112] | ADNI | 2017 | 147 AD, 75 MCI and 35 (NC). | Multi-Modality Fusion | AD vs. NC 98 % | X | ✓ |
| 7 | [113] | PRIVATE | 2018 | 411 AD and 540 NC | Multi fusion | Effective ness of ITL was more | ✓ | X |
| 8 | [114] | ADNI | 2019 | AD CT, MRI and SPECT | Fusion of features | Fusion approach of NCST and NSst provides better | ✓ | X |
| 9 | [115] | ADNI | 2019 | AD | Fusion of Imaging Modalities | MRI + PET modality acceptable ACC | X | ✓ |
| 10 | [116] | ADNI | 2018 | 60 HC, 60 MCI, 60 cMCI, 60 AD | Fusion of Features | Modalities based Fusion | ✓ | X |
| 11 | [117] | ADNI | 2021 | CT, MR | Multispetial Fusion | AD 702 ACC | X | ✓ |
| 12 | [118] | ADNI | 2021 | 419 CN, 473 MCI, 140 MCI | Decision Fusion | 84.73 ACC | ✓ | X |
| 13 | [119] | ADNI | 2021 | AD, CN, EMCI, LMCI | Decision Level Fusion | 92.6 ACC | ✓ | X |
| 14 | [120] | ADNI | 2021 | MRI, MCI, AD | Decision Level Fusion | 80.9 ACC | ✓ | X |
| 15 | [121] | ADNI | 2021 | AD, MCI | Multimodal Fusion | MRI + PET = 0.97 ACC | X | ✓ |
| 16 | [122] | ADNI | 2021 | AD | Feature Level Fusion | 90% ACC | ✓ | X |
| 17 | [123] | ADNI | 2021 | AD | Adversely Hyper-graph Fusion | 93.0 ACC | ✓ | X |
| 18 | [124] | ADNI | 2021 | 95 AD, 160 MCI | Image Fusion | 94.11 ACC | X | ✓ |
| 19 | [125] | ADReSS | 2021 | AD | Late Fusion | 84–90 ACC | ✓ | X |
| 20 | [126] | Private Data | 2020 | 29 HC, 27 MCI | Attribute Level Fusion | 94% HC vs. MCI | ✓ | X |
| 21 | [127] | Private Data | 2020 | AD | Auto phagosome-lysosome fusion | Pathological intervention | X | ✓ |
| 22 | [128] | ADNI | 2023 | MRI, PET and DTI | Feature Level Fusion | 99% AD | X | ✓ |
| 23 | [129] | ADNI | 2023 | MRI, PET | Feature Level Fusion | AD vs. CN 93.3 | X | ✓ |
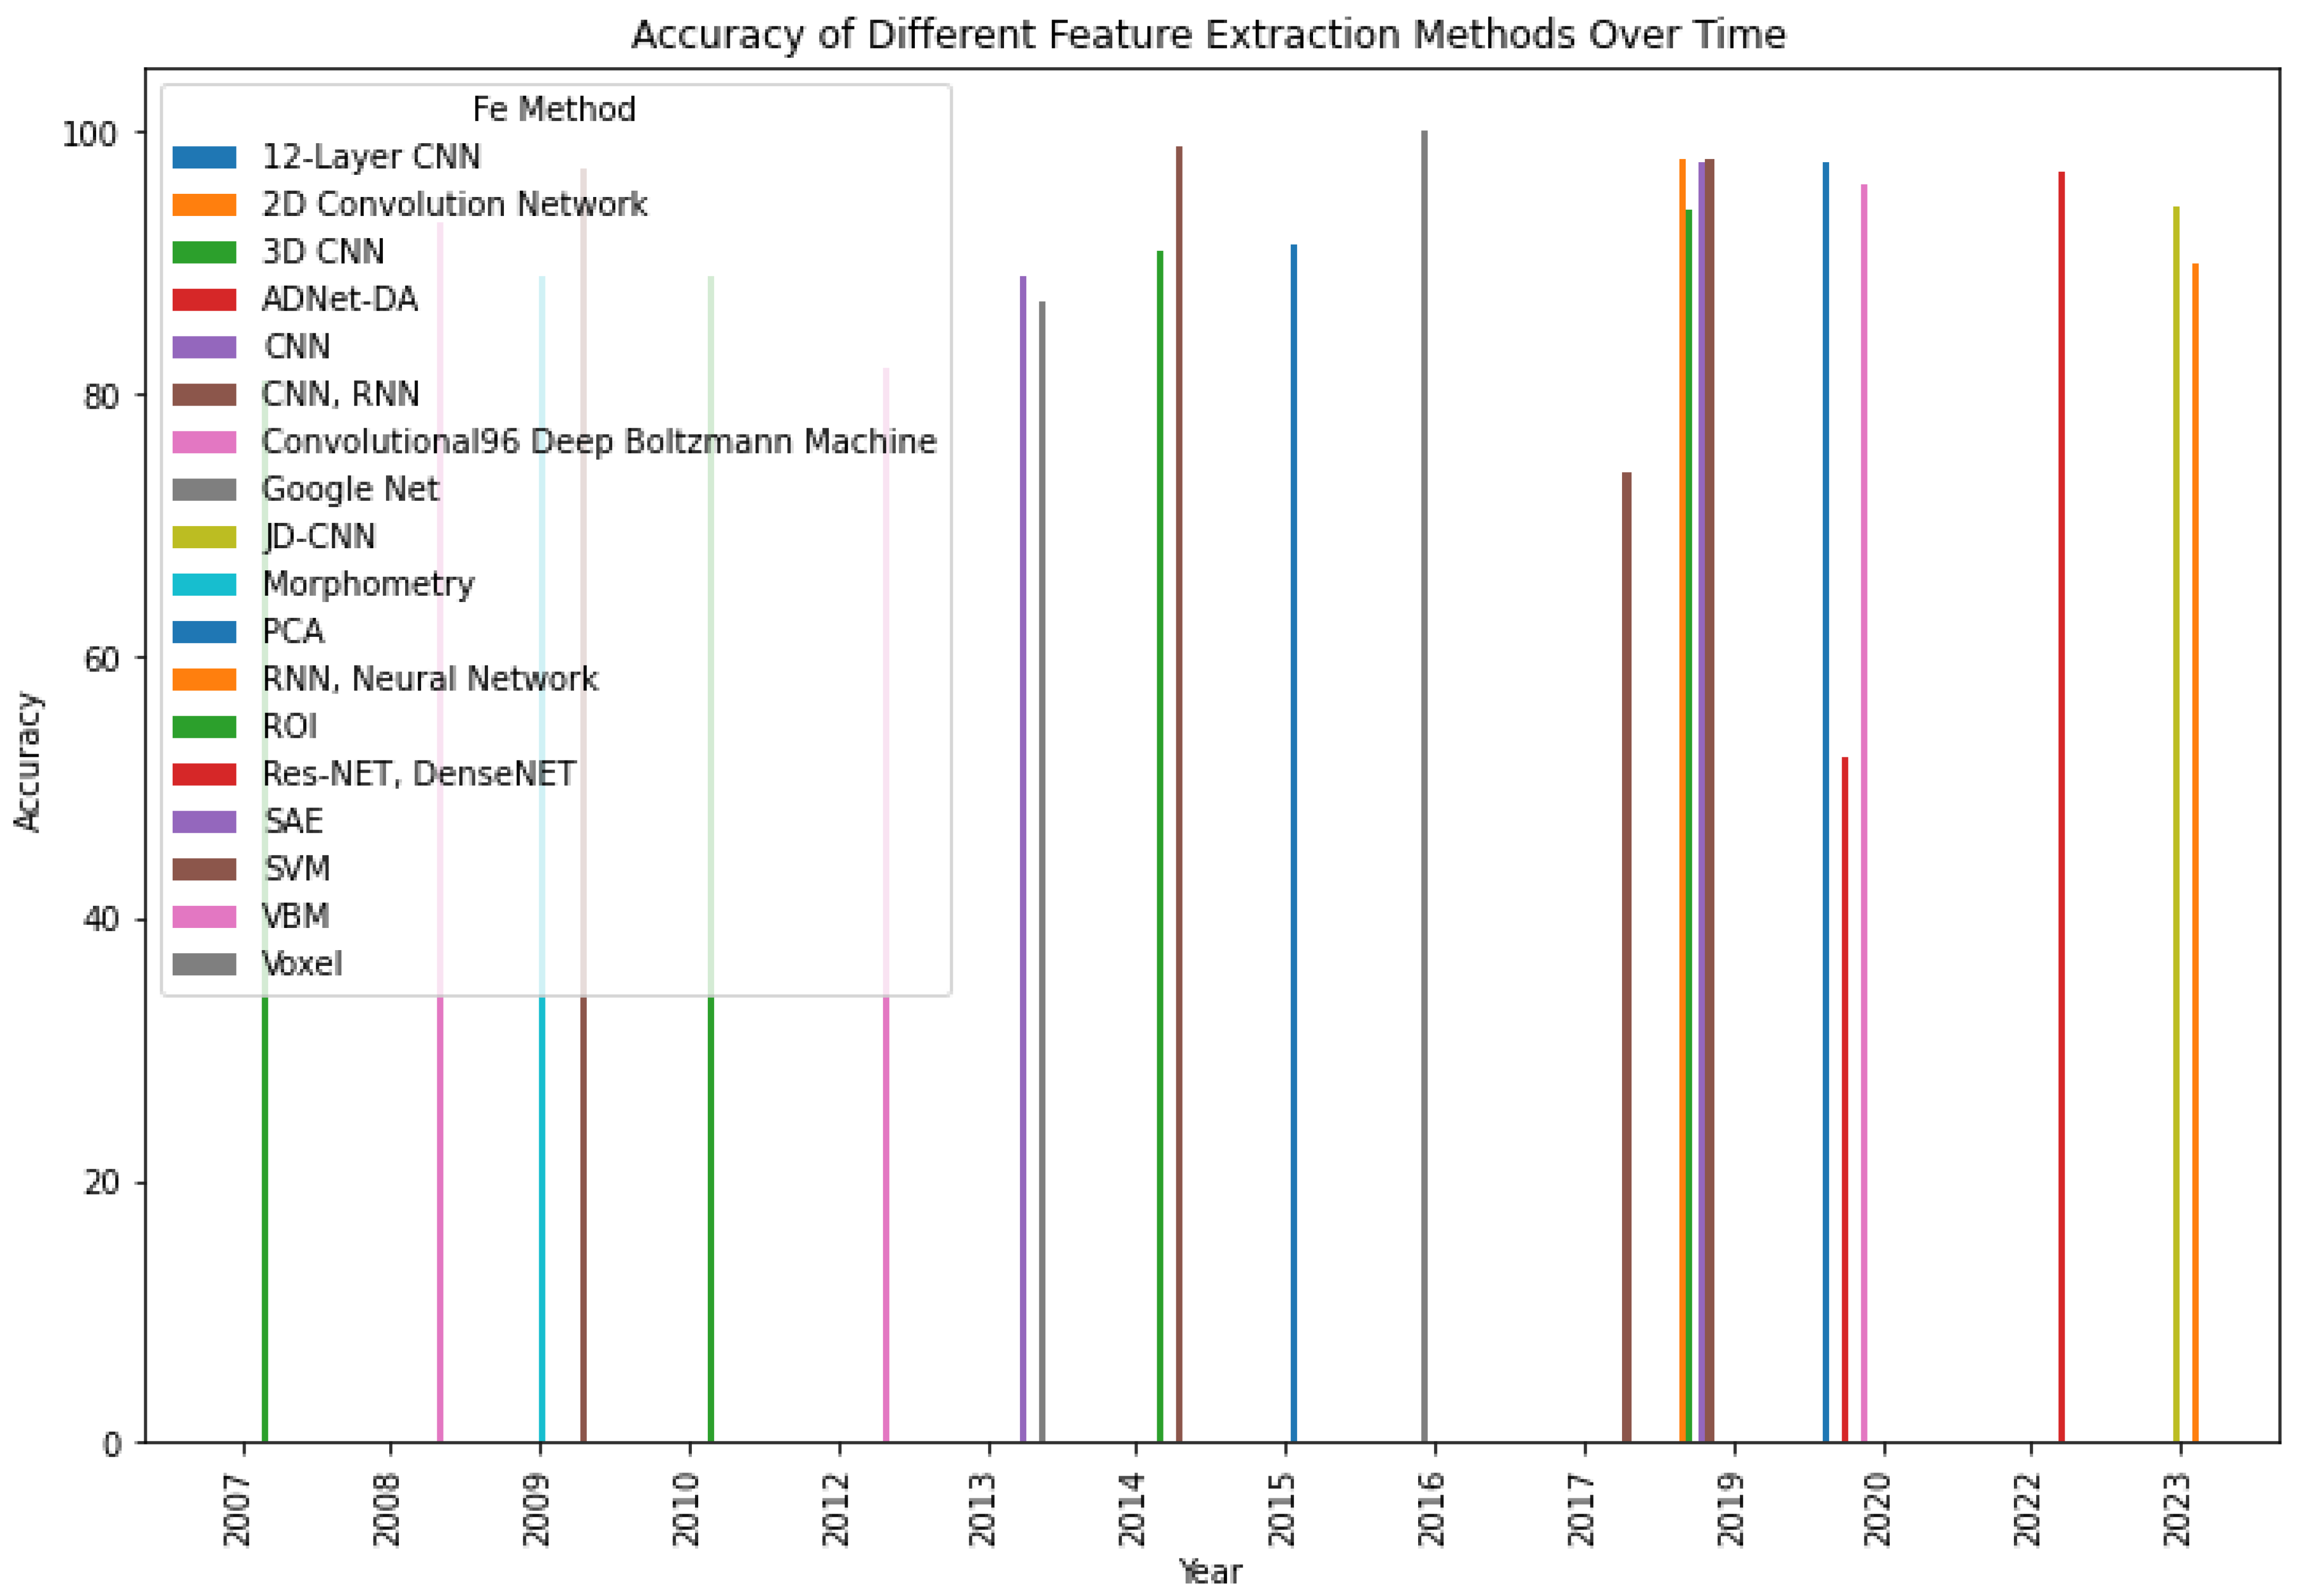
| S.No | Article | Data Base | Year | Modality | F E Methods | Accuracy | Multi Class | Binary Class |
|---|---|---|---|---|---|---|---|---|
| 1 | [131] | AD, CN | 2007 | fMRI | ROI | 81 | X | ✓ |
| 2 | [132] | CN, FTD | 2008 | MRI, PET | VBM | 93 | X | ✓ |
| 3 | [133] | CN, AD | 2009 | sMRI | Morphometry | 89 | X | ✓ |
| 4 | [134] | CN, AD | 2010 | SPECT | ROI | 89 | ✓ | ✓ |
| 5 | [135] | CN, AD | 2012 | sMRI | VBM | 82 | ✓ | ✓ |
| 6 | [136] | CN, MCI | 2013 | sMRI | SAE | 89 | X | ✓ |
| 7 | [137] | CN, AD | 2013 | sMRI | Voxel | 87 | X | ✓ |
| 8 | [138] | CN, MCI | 2014 | sMRI | ROI | 91 | X | ✓ |
| 9 | [139] | AD | 2017 | sMRI | SVM | 74 | X | ✓ |
| 10 | [140] | MCI CN | 2019 | sMRI | CNN | 98 | X | ✓ |
| 11 | [141] | AD CN | 2019 | sMRI | CNN | 97.52 | ✓ | ✓ |
| 12 | [142] | AD ADNI | 2009 | MRI | SVM | 97.13 | X | ✓ |
| 13 | [143] | ADNI | 2015 | MRI, PET | PCA | 91.4 | X | ✓ |
| 14 | [144] | ADNI | 2016 | FMRI | Google Net | 100 | X | ✓ |
| 15 | [145] | ADNI | 2014 | MRI | SVM | 98.8 | X | ✓ |
| 16 | [146] | ADNI | 2019 | MRI | CNN, RNN | 98 | X | ✓ |
| 17 | [147] | ADNI | 2019 | MRI | 2D Convolution Network | 98 | X | ✓ |
| 18 | [148] | ADNI | 2019 | MRI | 3D CNN | 94 | X | ✓ |
| 19 | [149] | EEG, ADNI | 2019 | MRI | Convolutional96 Deep Boltzmann Machine | 96 | X | ✓ |
| 20 | [150] | ADNI | 2020 | sMRI | ADNet-DA | 52.3 | X | ✓ |
| 21 | [151] | OASIS | 2020 | sMRI | 12-Layer CNN | 97.75 | X | ✓ |
| 22 | [152] | ADNI | 2020 | sMRI | Hog-CNN | 98 | X | ✓ |
| 23 | [153] | ADNI | 2022 | sMRI | Res-NET, DenseNET | 97 | X | ✓ |
| 24 | [154] | ADNI | 2023 | sMRI | JD-CNN | 94.20 | X | ✓ |
| 25 | [155] | ADNI | 2023 | sMRI | RNN, Neural Network | 90 | X | ✓ |
Disclaimer/Publisher’s Note: The statements, opinions and data contained in all publications are solely those of the individual author(s) and contributor(s) and not of MDPI and/or the editor(s). MDPI and/or the editor(s) disclaim responsibility for any injury to people or property resulting from any ideas, methods, instructions or products referred to in the content. |
© 2023 by the authors. Licensee MDPI, Basel, Switzerland. This article is an open access article distributed under the terms and conditions of the Creative Commons Attribution (CC BY) license (https://creativecommons.org/licenses/by/4.0/).
Share and Cite
Shukla, A.; Tiwari, R.; Tiwari, S. Review on Alzheimer Disease Detection Methods: Automatic Pipelines and Machine Learning Techniques. Sci 2023, 5, 13. https://doi.org/10.3390/sci5010013
Shukla A, Tiwari R, Tiwari S. Review on Alzheimer Disease Detection Methods: Automatic Pipelines and Machine Learning Techniques. Sci. 2023; 5(1):13. https://doi.org/10.3390/sci5010013
Chicago/Turabian StyleShukla, Amar, Rajeev Tiwari, and Shamik Tiwari. 2023. "Review on Alzheimer Disease Detection Methods: Automatic Pipelines and Machine Learning Techniques" Sci 5, no. 1: 13. https://doi.org/10.3390/sci5010013