Figure 1 presents the applied ultrasonic squared pulse (a) and the system’s response/birefringence signal (b) measured at 24 °C from a DSP solution with a concentration of 3.18 mM. The frequency of the ultrasonic wave used was fixed at 770 KHz. When the acoustic field is on, the corresponding rise in birefringence trace is assigned to the orientation mechanism, while the decay of the birefringence signal is attributed to the disorientation–randomization process. In the transient birefringence region, the observed different profiles for the rise (field on) and decay (field off) relaxation mechanisms with distinct relaxation times indicate that the mechanisms underlying both processes are not necessarily the same. Indeed, the orientation relaxation is a process that is forced by the applied acoustic field, while the disorientation relaxation is a spontaneous rotational diffusion process. During the orientation process, the radiation pressure, caused by the ultrasonic wave, induces a turning torque in the molecules that are forced to reorient along the ultrasound propagation direction. The birefringence signal saturates when all the molecules are fully aligned, and this region defines the stationary birefringence region with an almost constant value of Δ
n. The orientation process, the stationary birefringence region, and the randomization processes are shown in
Figure 1b.
In the above equations, Δ
nmax and
τ are the maximum steady-state birefringence value and the relaxation time of the rise and decay regions, respectively. Parameter
β is the polydispersity factor and reveals the width of the relaxation time distribution. A simple exponential function is obtained for
β = 1, and the birefringence signal in this case is characteristic of fully monodispersed samples. In
Figure 1b, open circles and solid line represent experimental birefringence data and fitting curves according to Equations (3) and (4) for the field on and field off regions, respectively.
The characteristic relaxation time
τ of the decay trace is related to the average rotational diffusion coefficient
Dr of the particles through the equation [
4,
5]:
In general, the diffusion coefficient is directly linked to the particle size and can be used to estimate the dimensions of the shape of the particles.
The birefringence signal may provide information concerning the charge distribution, the particle’s size and shape, as well as the presence of permanent and/or induced dipoles. The ratio of the contribution of permanent to induced dipole moments in the orientation process of the DSP molecules can be estimated as [
5]:
where
S1 and
S2 are the areas under the birefringence rise and decay, respectively. In the limiting case where
S1/
S2 = 1, the permanent-to-induced ratio of dipole moments equals zero (
R = 0). This means that the studied molecules have no permanent dipole moments, or these are negligible compared to the induced dipole moments. The second limiting case is
S1/
S2 = 4. In this case,
R becomes infinity (
R→∞), which means that the permanent dipoles take over the orientation mechanism.
The rotational diffusion coefficient
Dr in rad
2/s or Hz is related to the effective hydrodynamic radius
r of the molecule through the Stokes–Einstein–Debye relationship:
where
kB is the Boltzmann constant,
T is the absolute temperature, and
ηs is the shear (dynamic) viscosity of the solvent. The denominator in Equation (7) corresponds to the friction.
3.1. Concentration Dependent Birefringence
By analyzing the transient region of the birefringence signal, one is able to gain important information concerning the dynamical behavior of the studied system. In
Figure 2a, we present the concentration effect on the polydispersity parameter
β. It seems that the organization and disorganization process is characterized by a constant and rather narrow distribution of the relaxation times with a value close to one. Analogous behavior is exhibited by the rotational diffusion coefficient D
r presented in
Figure 2b. The observed behavior of the polydispersity parameter and the rotation diffusion coefficient with mole fraction is more or less as expected since the concentration variation is limited in the highly diluted region below 4 mM. On the other hand, the ratio of the contribution of permanent to induced dipole moments in the orientation process for the aqueous DSP solutions reveals a completely different behavior with increasing solution concentration. From
Figure 2c, it seems that the ratio R decreases monotonically with increasing mole fraction. Furthermore, it reveals a sudden change at a specific mole fraction signifying a cross-over of two different regions that are related to the self-association (dimerization) mechanism exhibited by the DSP molecules for concentrations above 2.82 mM [
13].
3.2. Frequency Effect on Birefringence Signals
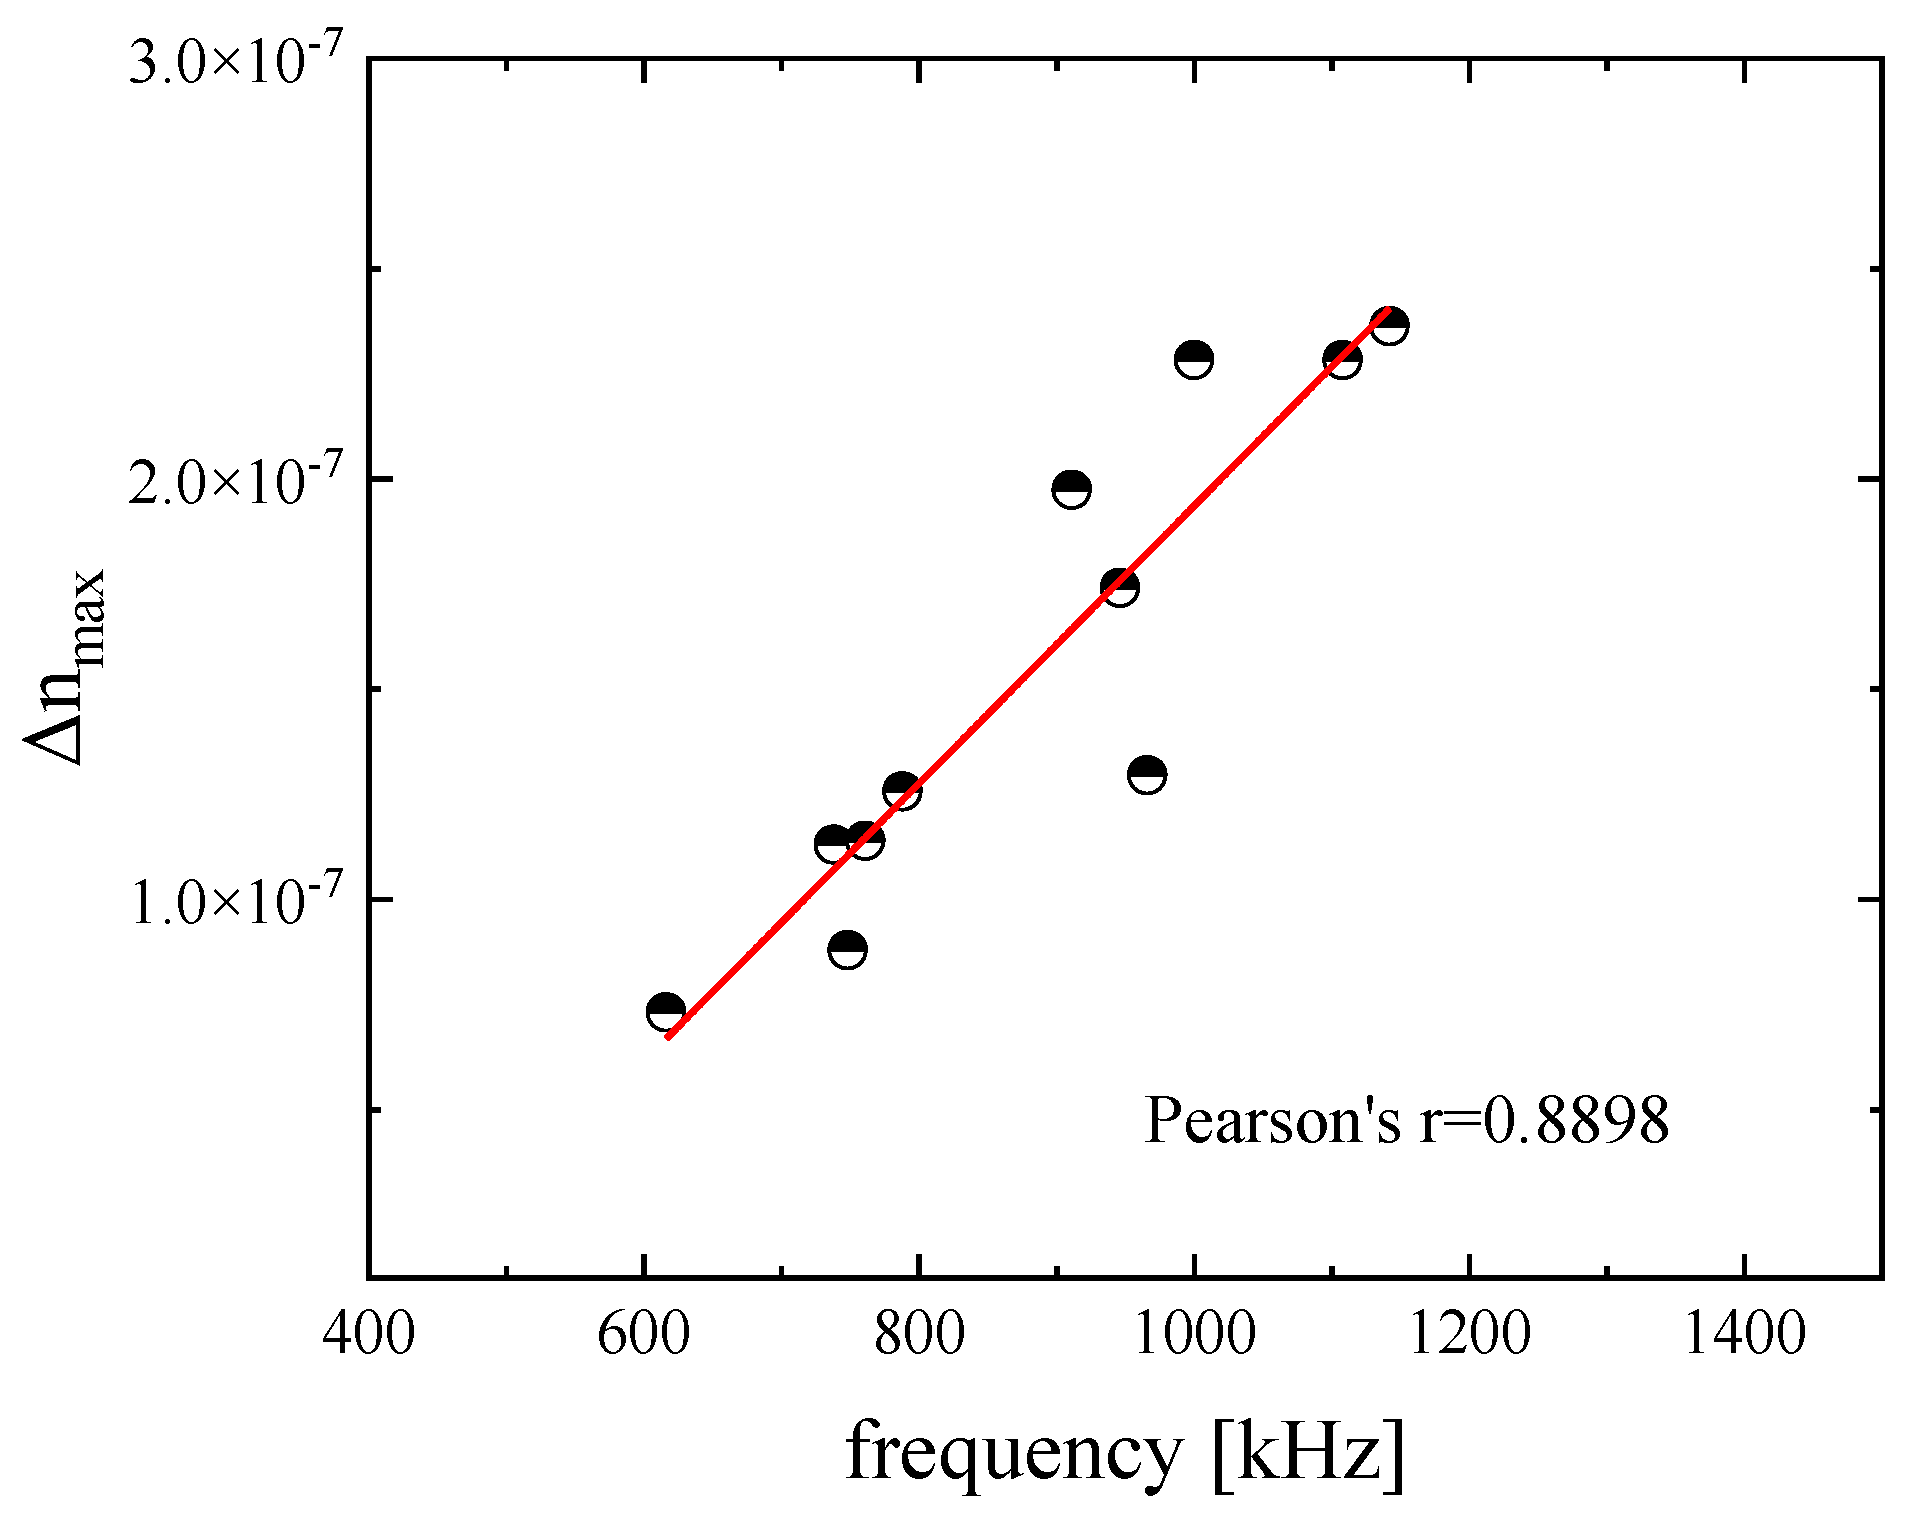
The maximum value of the birefringence signal, the so-called static birefringence, as a function of ultrasonic frequency is presented in
Figure 3 for a DSP aqueous solution with concentration 2.55 mM at 20 °C.
The results seem to follow a nearly linear dependency with a Pearson’s coefficient equal to r = 0.8898.
The root mean square of the acoustically induced birefringence, Δ
nrms, that is induced by the applied ultrasonic field is given by [
18,
19]:
where Δ
ε is the anisotropy in the dielectric constant in the case where all molecules are oriented in one direction,
ρ is the solution density,
A is the quadratic expansion coefficient of free energy, and
c0 is the ultrasound speed measured in the low-frequency limit. In the above equation are also involved the ultrasonic intensity
Wu, the angular frequency
ω = 2
πf of the ultrasound wave, and the translation–reorientation coupling parameter
Rc estimated as [
20]:
In Equation (9), parameters
μ and
ν are the so-called viscosity constant parameters and
ηs represents the dynamic or shear viscosity. The linear birefringence observed in
Figure 3 is justified based on Equation (8), where the ultrasonically induced birefringence is proportional to the frequency of the ultrasound.
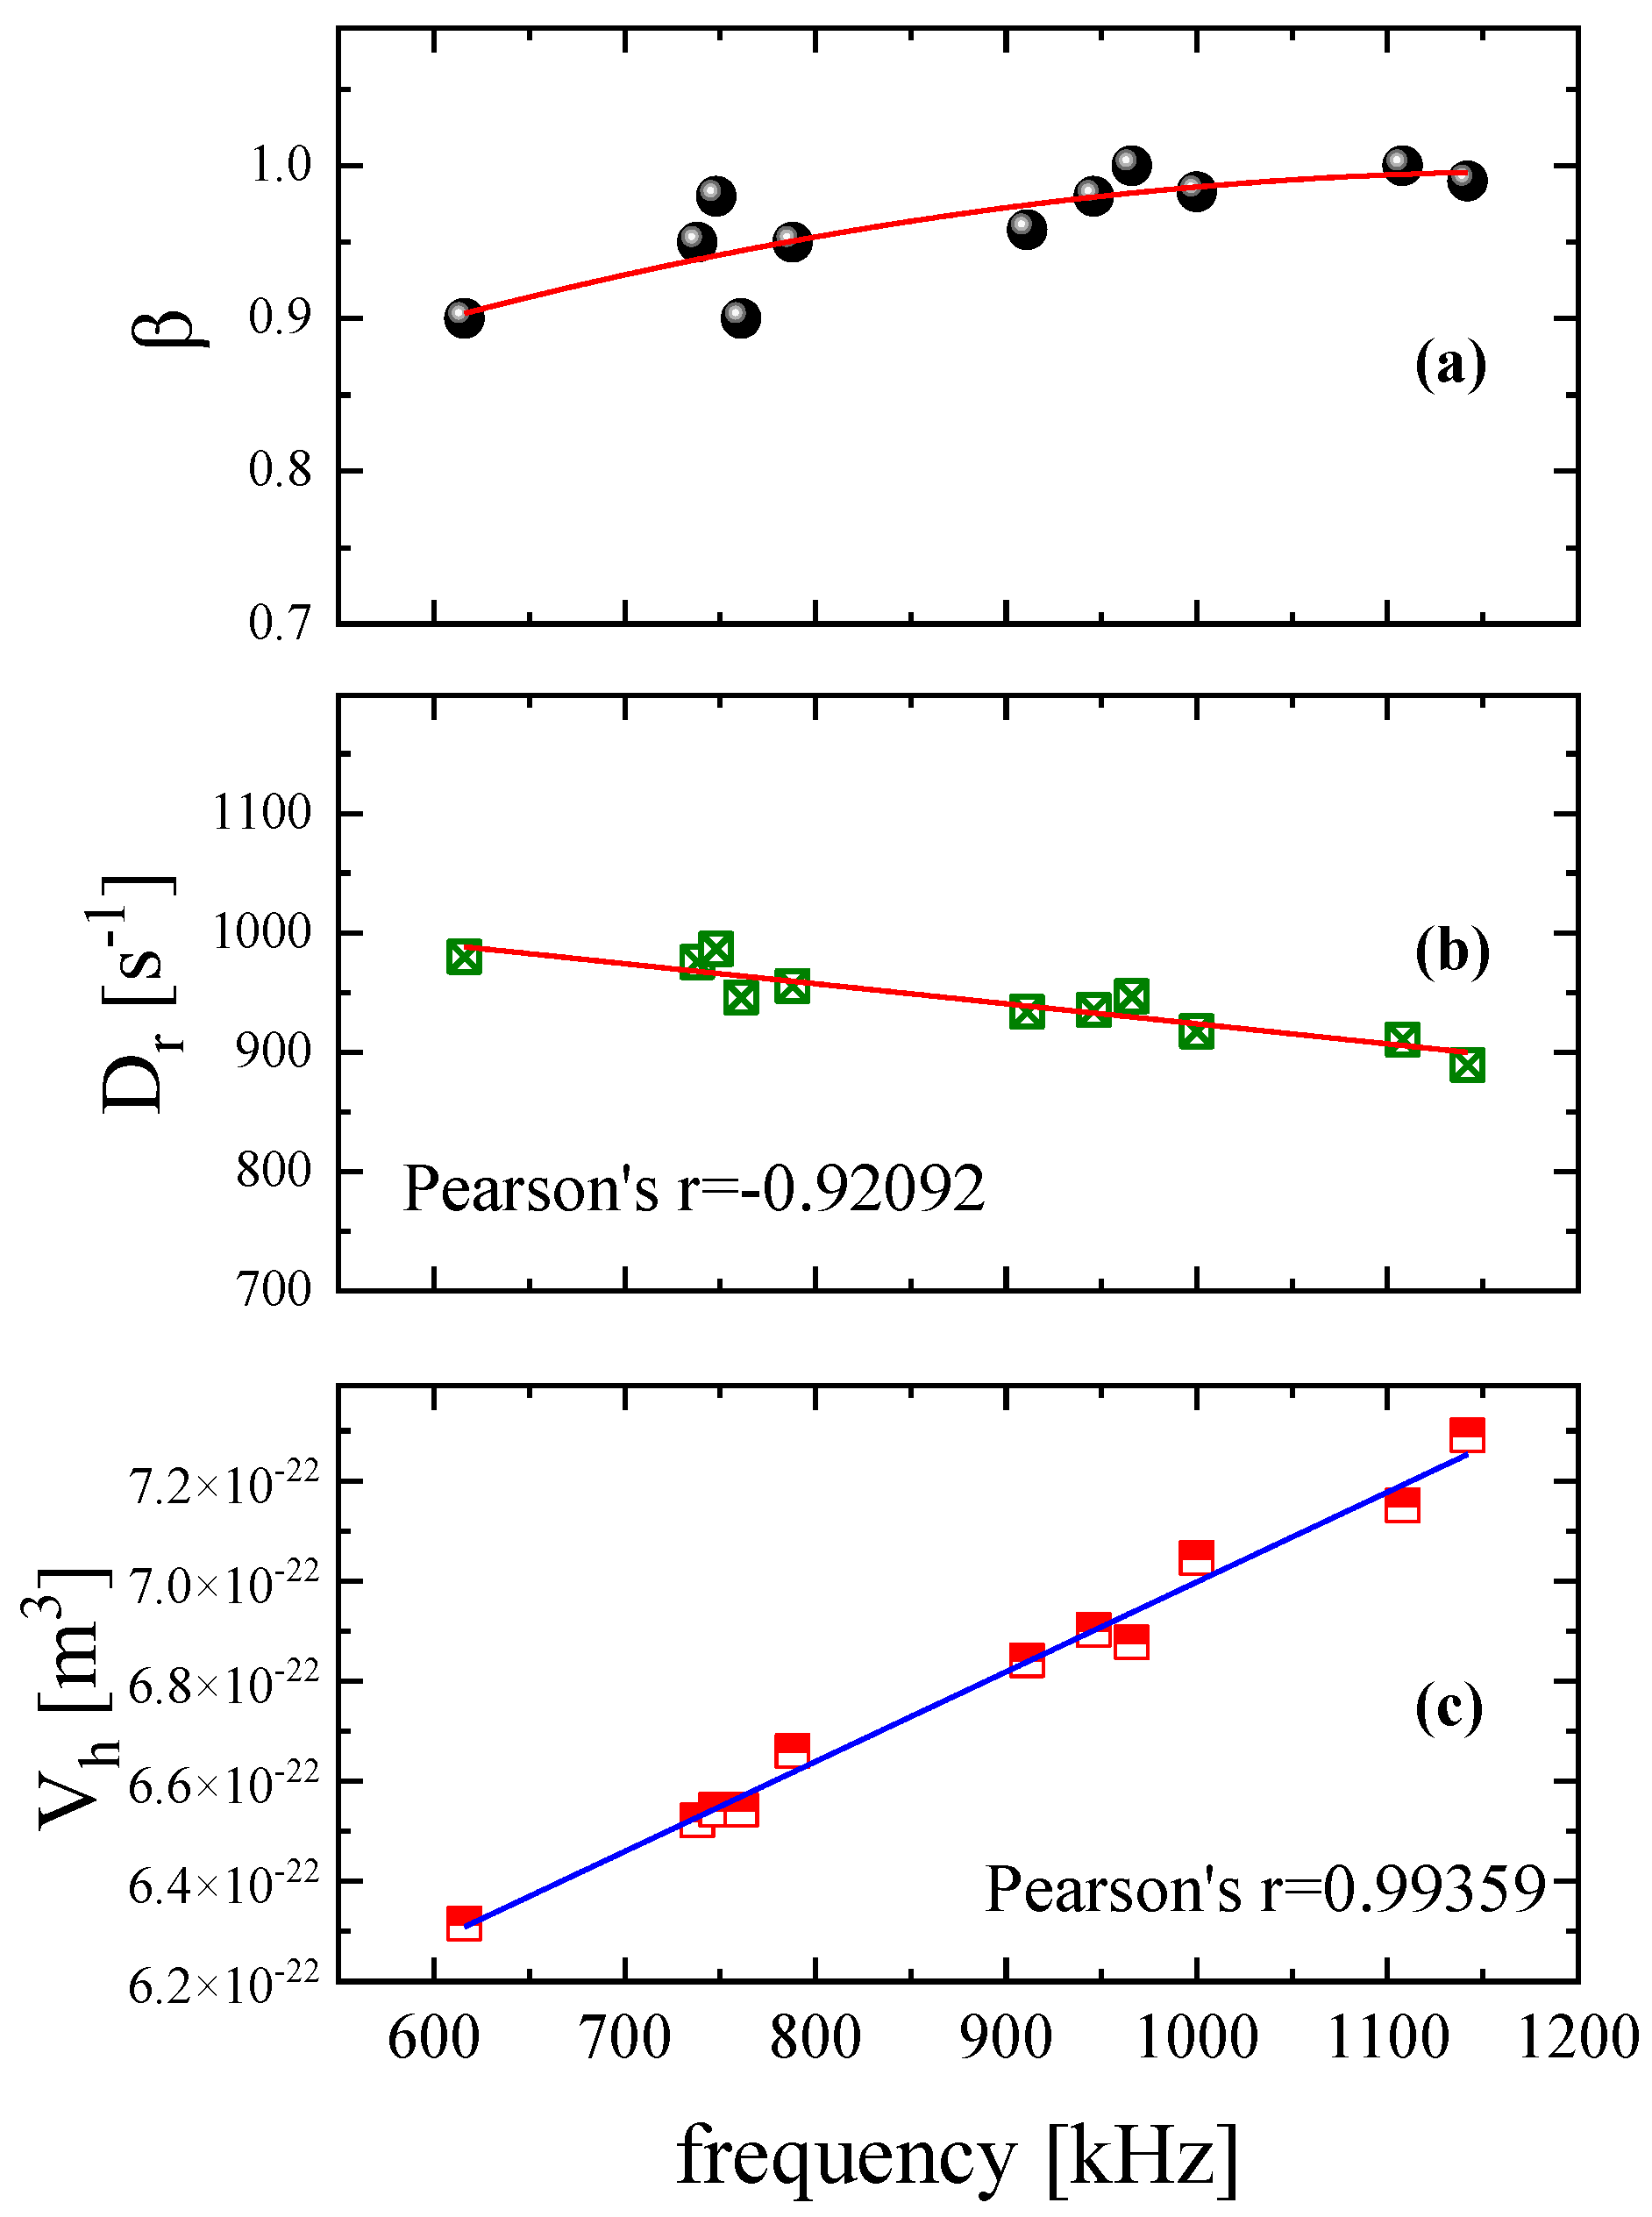
In
Figure 4a, we present the polydispersity parameter
β variation with frequency. The results reveal that the parameter increases slightly with frequency reaching the limiting value of
β = 1 in the high ultrasonic frequency limit. The rotational diffusion coefficient, shown in
Figure 4b, exhibits the opposite behavior with frequency. This coefficient is related to rotational mobility and is the characteristic value of the Brownian rotation of a particle. Thus, this quantity is important in studies of the alignment of non-spherical particles that are subjected to an external field, such as the acoustic field in our case. From
Figure 4b, it seems that faster ultrasonic pulses induce a lower rotational diffusion coefficient.
It is also interesting to note that the rotational diffusion is linearly correlated to ultrasonic frequency as is evidenced by the Pearson’s coefficient (
r = −0.92092). An analogous linear behavior, although with positive slope, exhibits the estimated hydrodynamic volume presented in
Figure 4c. In general, the hydrodynamic volume of a particle in solution is the sum of the time-average of the particle’s volume and the volume of the solvent molecules that are associated with this one. Since the spectral features of the birefringence signal are strongly related to the size and the shape of the particles dissolved in solution, the hydrodynamic volume can be easily estimated based on Equation (7). With the term particle, we refer to single- or macro-molecules, aggregate systems, and colloidal systems of any type. The hydrodynamic volume is linearly correlated with the ultrasonic frequency and faster acoustic pulses induce larger hydrodynamic volumes. Initially, we performed a linear fitting of the experimental data, and we examined the calculated Pearson’s r value. When the absolute value of the Pearson’s parameter was estimated below 0.75, a linear function is inadequate to fit the experimental values and the linear correlation is questionable. Subsequently, we performed a second-order polynomial fitting of the data.
When a longitudinal ultrasonic field is applied to a solution composed of molecules with ellipsoidal shape, then the rotational diffusion coefficient and the ultrasonically induced birefringence are related through the equation [
21,
22]:
where
Ν0 is the number density of the ellipsoids and
is the mean refractive index. The two parameters,
a1 and
a2, are the polarizabilities of the ellipsoid that are parallel and perpendicular to the principal axis. The rest of the symbols in Equation (10) have their usual meanings. We already have seen that the static birefringence is linearly dependent on the ultrasonic frequency (
Figure 3) and, from Equation (10), it seems that birefringence is inversely analogous to the rotational diffusion coefficient. Thus, the linear variation of the rotational diffusion coefficient with a negative slope is fully justified.
3.3. Ultrasonic Intensity Effect on Birefringence Signals
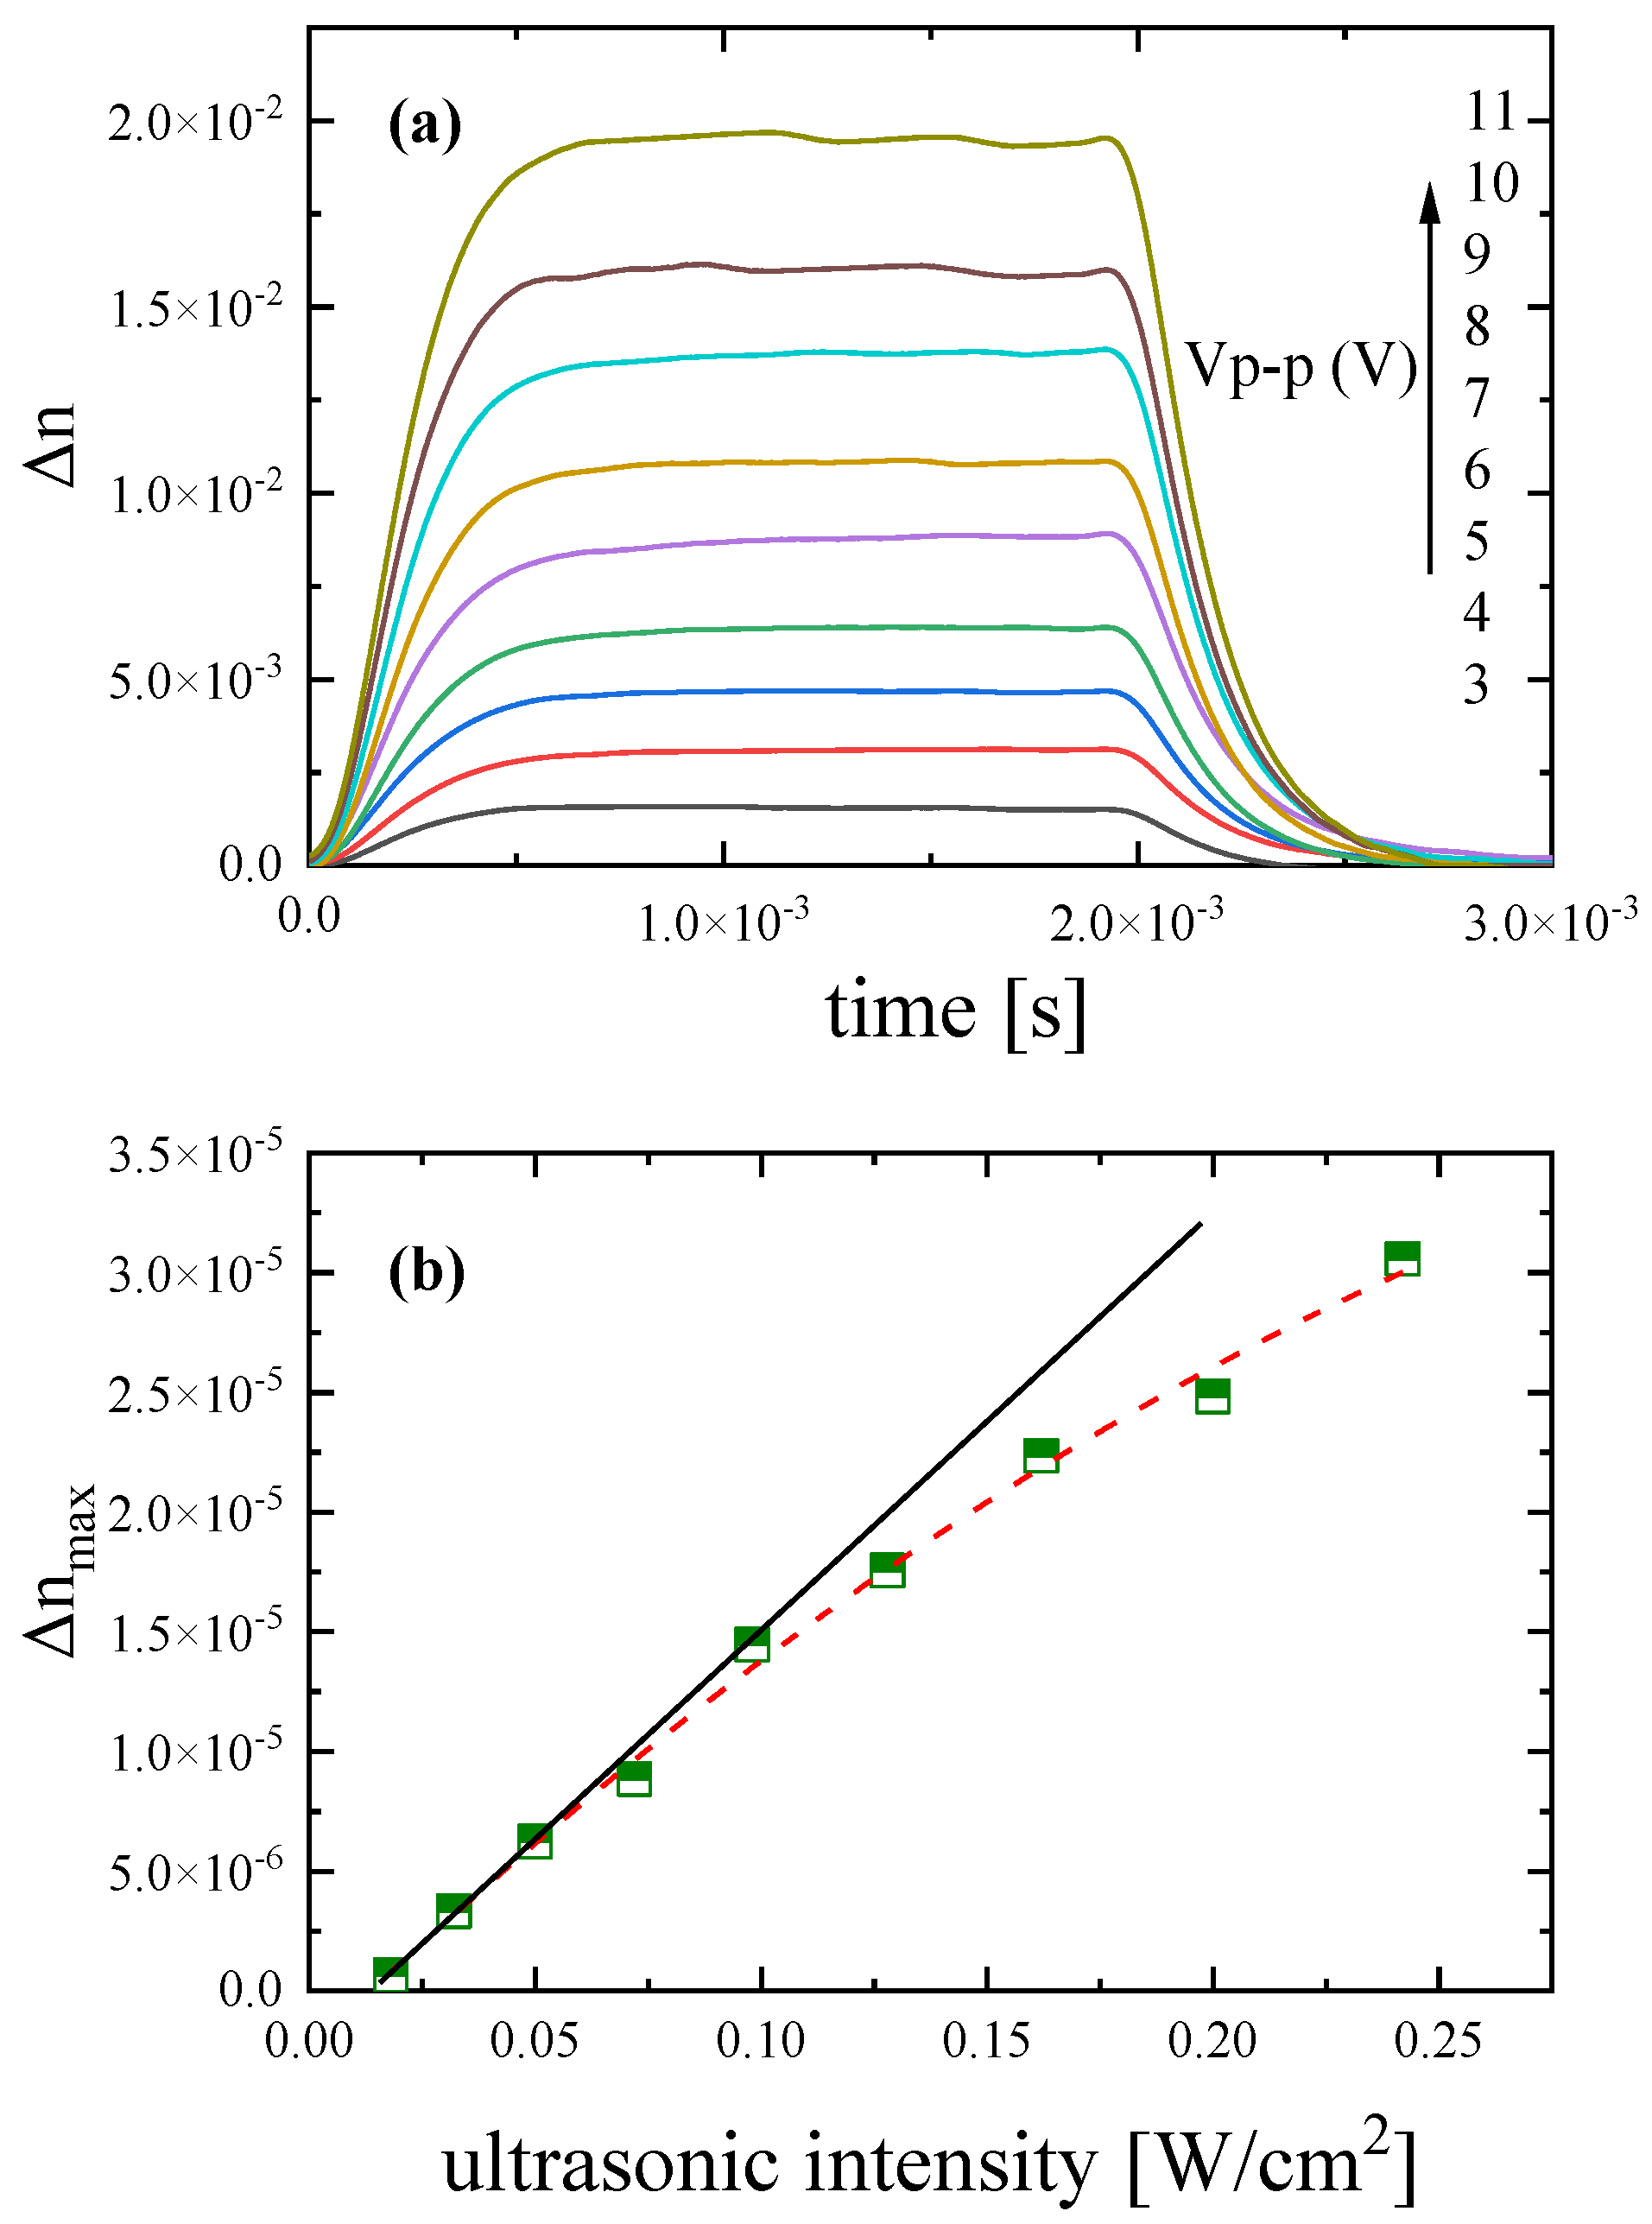
The variation of the ultrasonically induced birefringence signal with the acoustic field intensity is presented in
Figure 5a for several peak-to-peak voltage values applied to the piezoelectric element. The power of the ultrasonic field was limited to below 0.5 W/cm
2 in order to establish the absence of any absorption and scattering of the acoustic waves in the modulation that would require a high-powered and focused ultrasonic field. Furthermore, the frequency of the ultrasonic wave was in the MHz and not in the low-kHz region required to trigger sonochemistry effects. The influence of the power of the laser at the sample, which is below 5 mW, is also negligible. The application of higher voltage leads to a higher ultrasonic field with higher intensity, since the following relation holds [
23]:
It seems from Equation (10) that the birefringence trace is proportional to the square root of the ultrasonic intensity or equivalently proportional to the ultrasonic amplitude. In addition, the ultrasonic amplitude is proportional to the voltage applied to the transducer, and, thus:
It is interesting to note that the birefringence signals presented in
Figure 5a all start from zero for
t = 0 and all decay to zero without presenting a kind of anisotropy hysteresis or any other anomalous birefringence behavior. Initially, the solution is completely isotropic. The application of the external acoustic field forces the molecule to align along the direction of the ultrasonic wave propagation. The birefringence saturates when all particles are completely aligned. After shutting down the field, the oriented particles are completely randomized leading to a fully isotropic liquid, indicating that the effect of the acoustic pressure on the system is reversible and reproducible.
The maximum birefringence values Δ
nmax as a function of ultrasonic intensity are presented in
Figure 5b. The Δ
nmax values correspond to the constant maximum value of the birefringence signal (plateau) in the stationary region or, equivalently, the birefringence at the equilibrium state after complete alignment of the particles (orientation process). At low ultrasonic fields, a linear relationship is observed between Δ
nmax values and ultrasonic intensity W
u while, for higher fields, birefringence tends to saturate following a Langevin behavior. The experimental results were fitted adequately with the relation [
24]:
where
L2(
ξ) is the first-order or usual Langevin function and
ξ is a Langevin parameter related to the dipole moments of the particles. For the low acoustic field for the Langevin parameter, the relation
ξ << 1 holds.
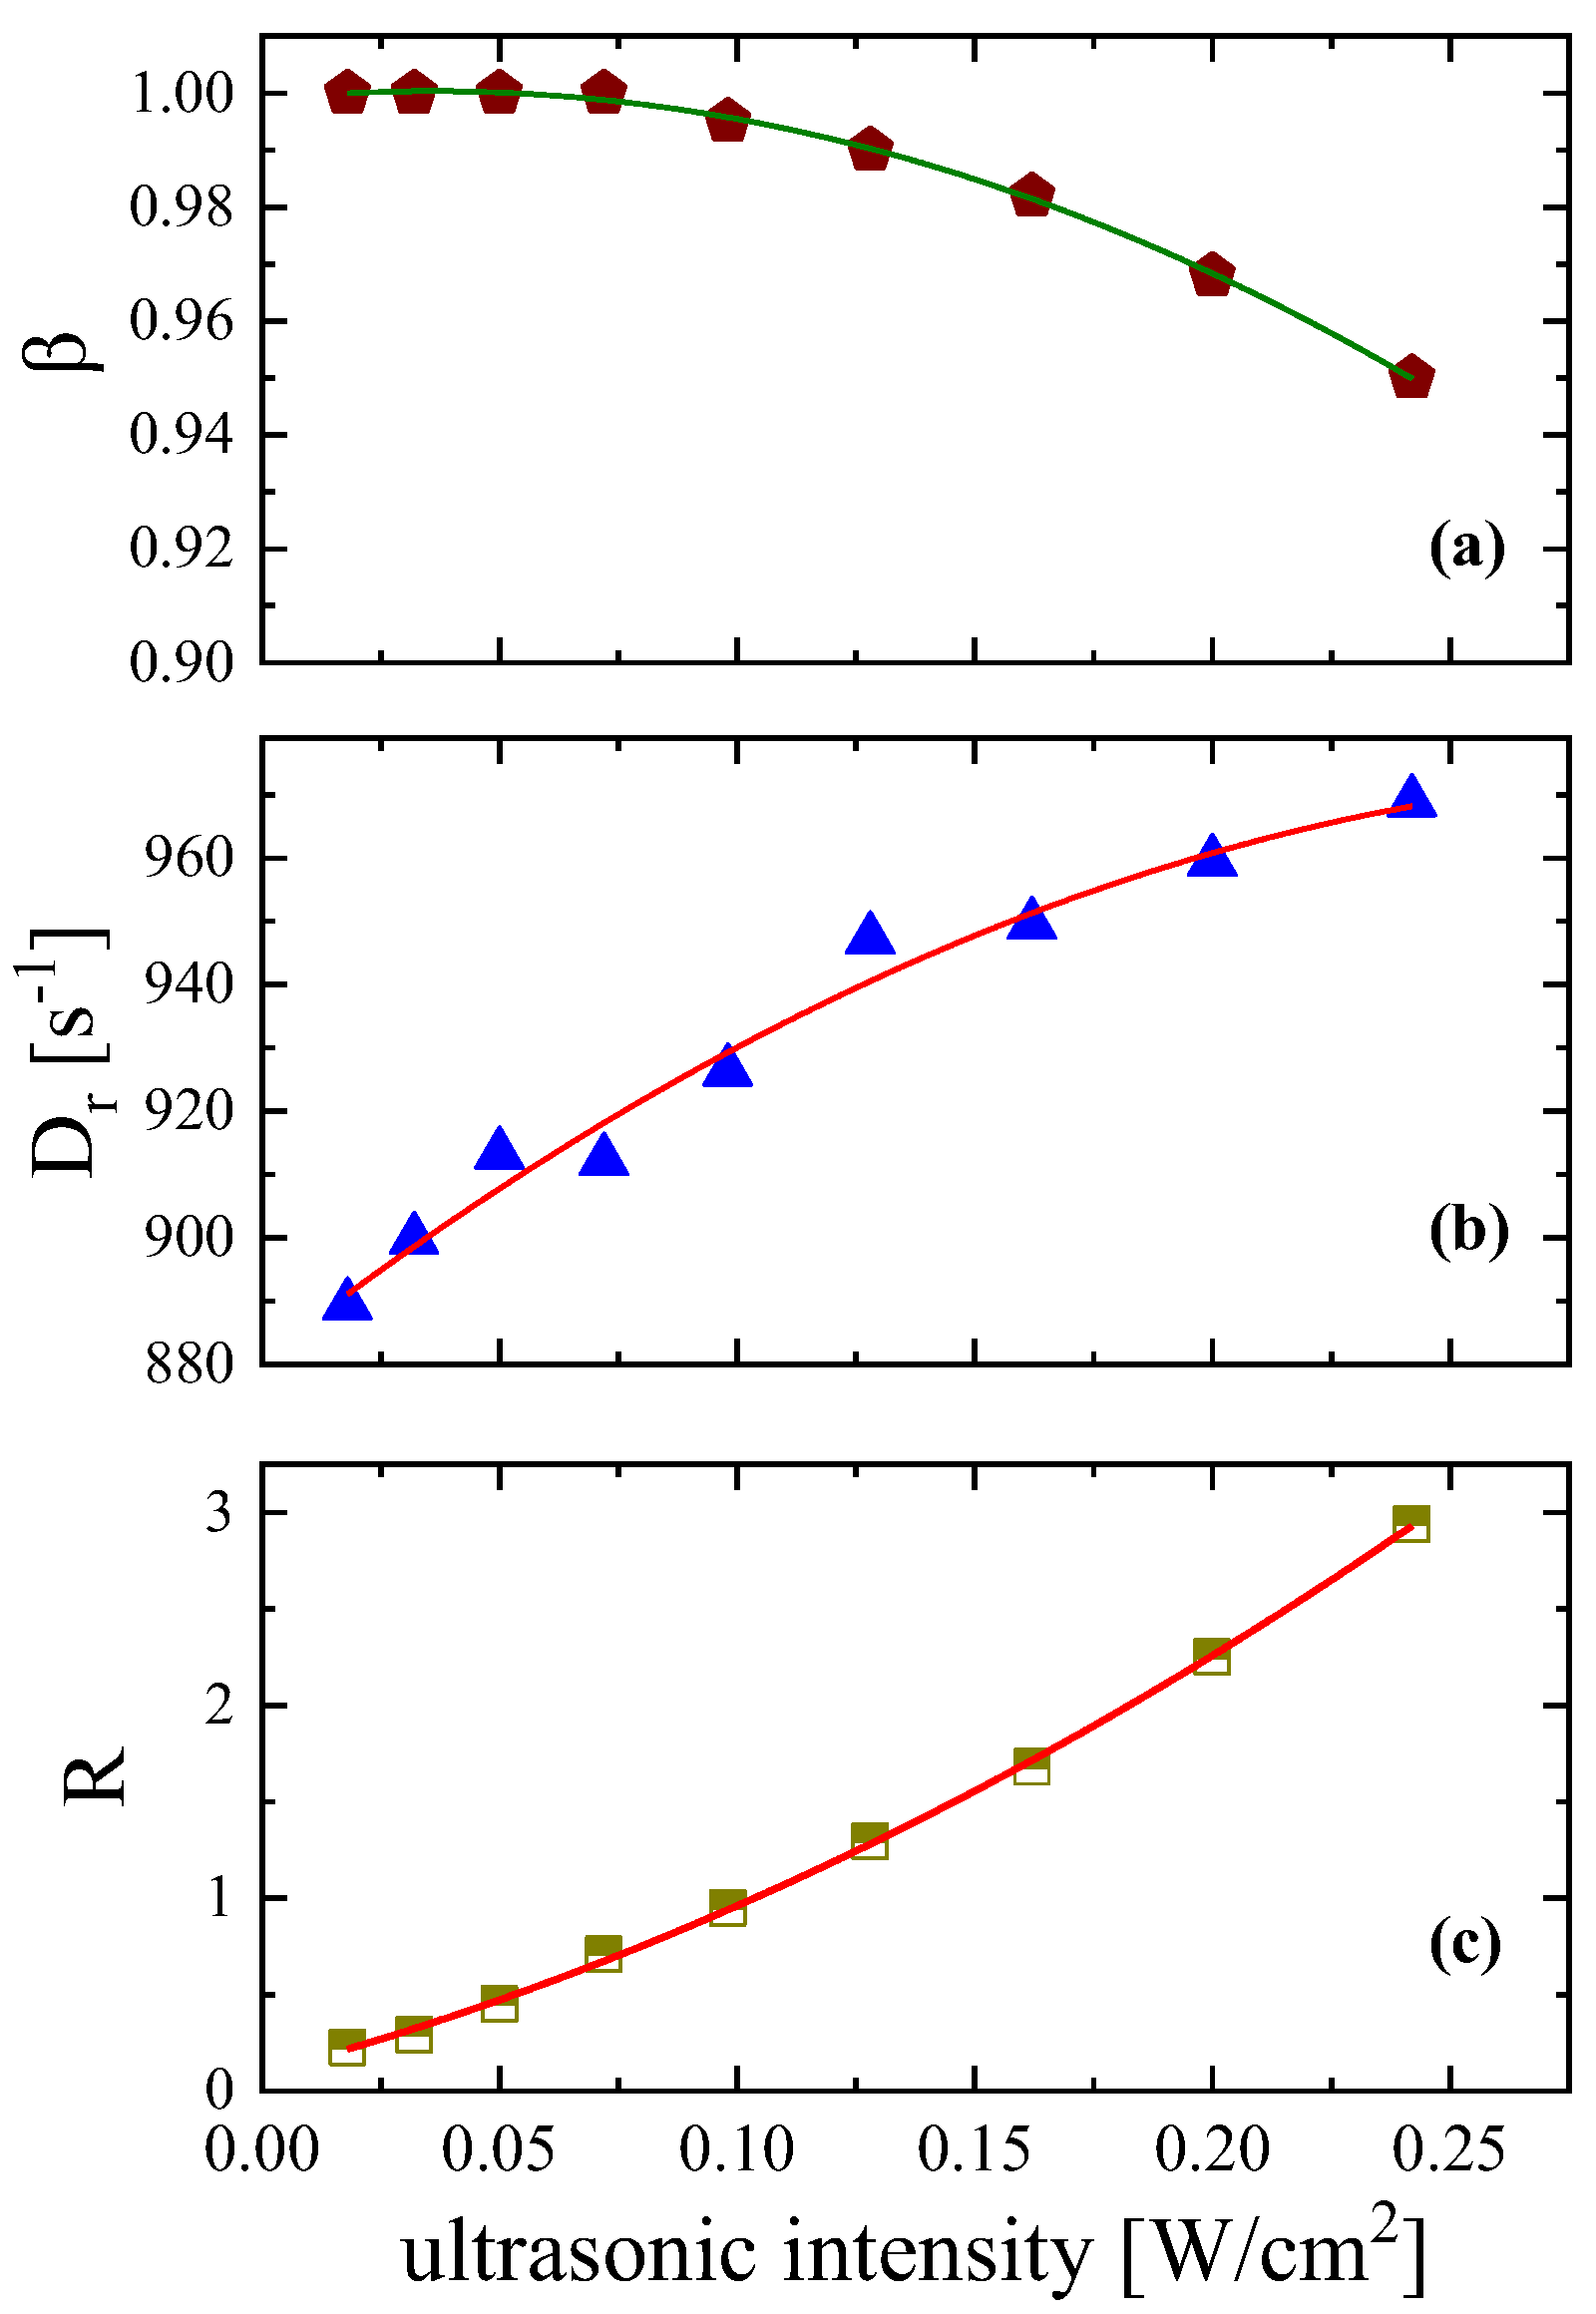
In
Figure 6a, the polydispersity parameter
β variation is presented as a function of ultrasonic intensity. The results reveal that the width of the relaxation time distribution
β decreases from the limiting value of
β = 1 with increasing the intensity of the acoustic field. The variation of the exponent
β of the stretched exponential functions (Equations (3) and (4)) was found to be slightly dependent on the ultrasonic field intensity considering that the value
β = 0.95 is reached at the highest ultrasonic intensity. The rotational diffusion coefficient, presented in
Figure 6b, increases, exhibiting the exact opposite behavior. From
Figure 6b, it seems that stronger ultrasonic fields induce a higher rotational diffusion coefficient. This behavior is explained considering that the
Dr coefficient is related to rotational mobility, which is enhanced at higher fields. An increasing trend is also observed in
Figure 6c for the ratio
R of the contribution of permanent to induced dipole moments in the orientation process for the aqueous DSP solution with a concentration of 2.55 mM.
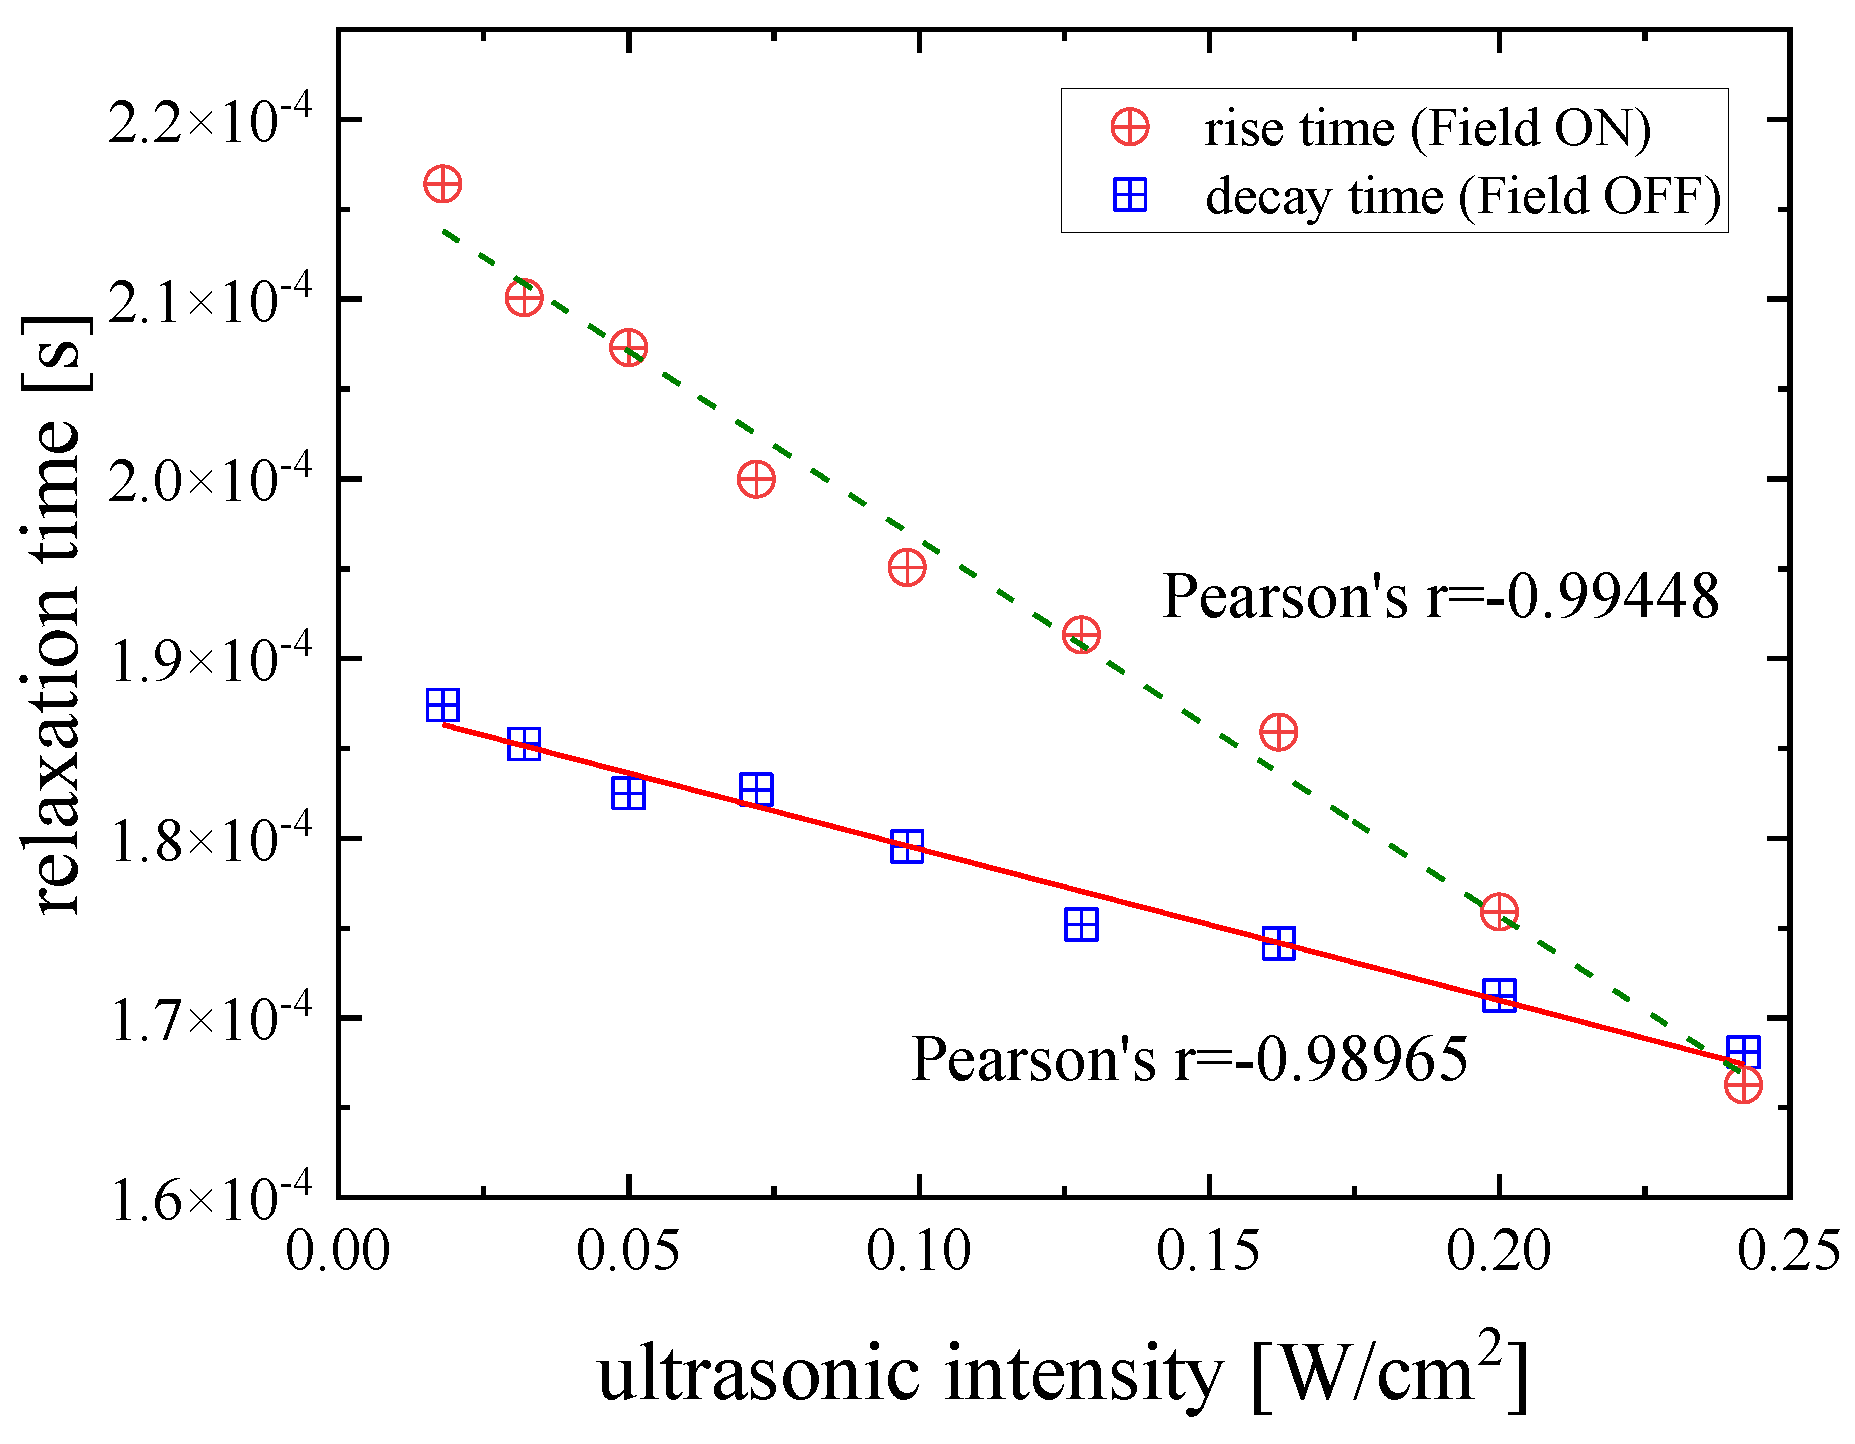
Figure 7 shows the variation of the characteristic relaxation times with ultrasonic intensity for the orientation and disorientation processes that correspond to the rise and decay regions of the birefringence traces for a DSP solution with a concentration of 2.55 mM under isobaric and isothermal conditions. The relaxation times were estimated by fitting the birefringence signals with Equations (3) and (4) for the field on and field off regions, respectively. Both sets of relaxation times follow an almost perfect linear dependency with Pearson’s coefficient equal to
r = −0.99448 for the orientation process and
r = −0.98965 for the disorientation process.
A stronger acoustic field triggers a more intense driving force in the particles and, thus, the system exhibits higher birefringence. Furthermore, the time that is required for the system to reach the equilibrium state is shorter. The fact that the decay and rise relaxation times are different implies that the processes in the field on and off regimes are attributed to completely different mechanisms. It seems that the rise times are slower compared to the decay times, indicating that the orientation process in the field on regions is slower than the randomization process occurring in the field off regions. The relatively slow relaxation time values presented in
Figure 7 for both orientation and disorientation processes are indicative of a collective molecular motion over a long range, since the reorientational relaxation time of an isolated molecule is in the order of 10
−8 to 10
−9 s.
3.4. Temperature Dependent Birefringence
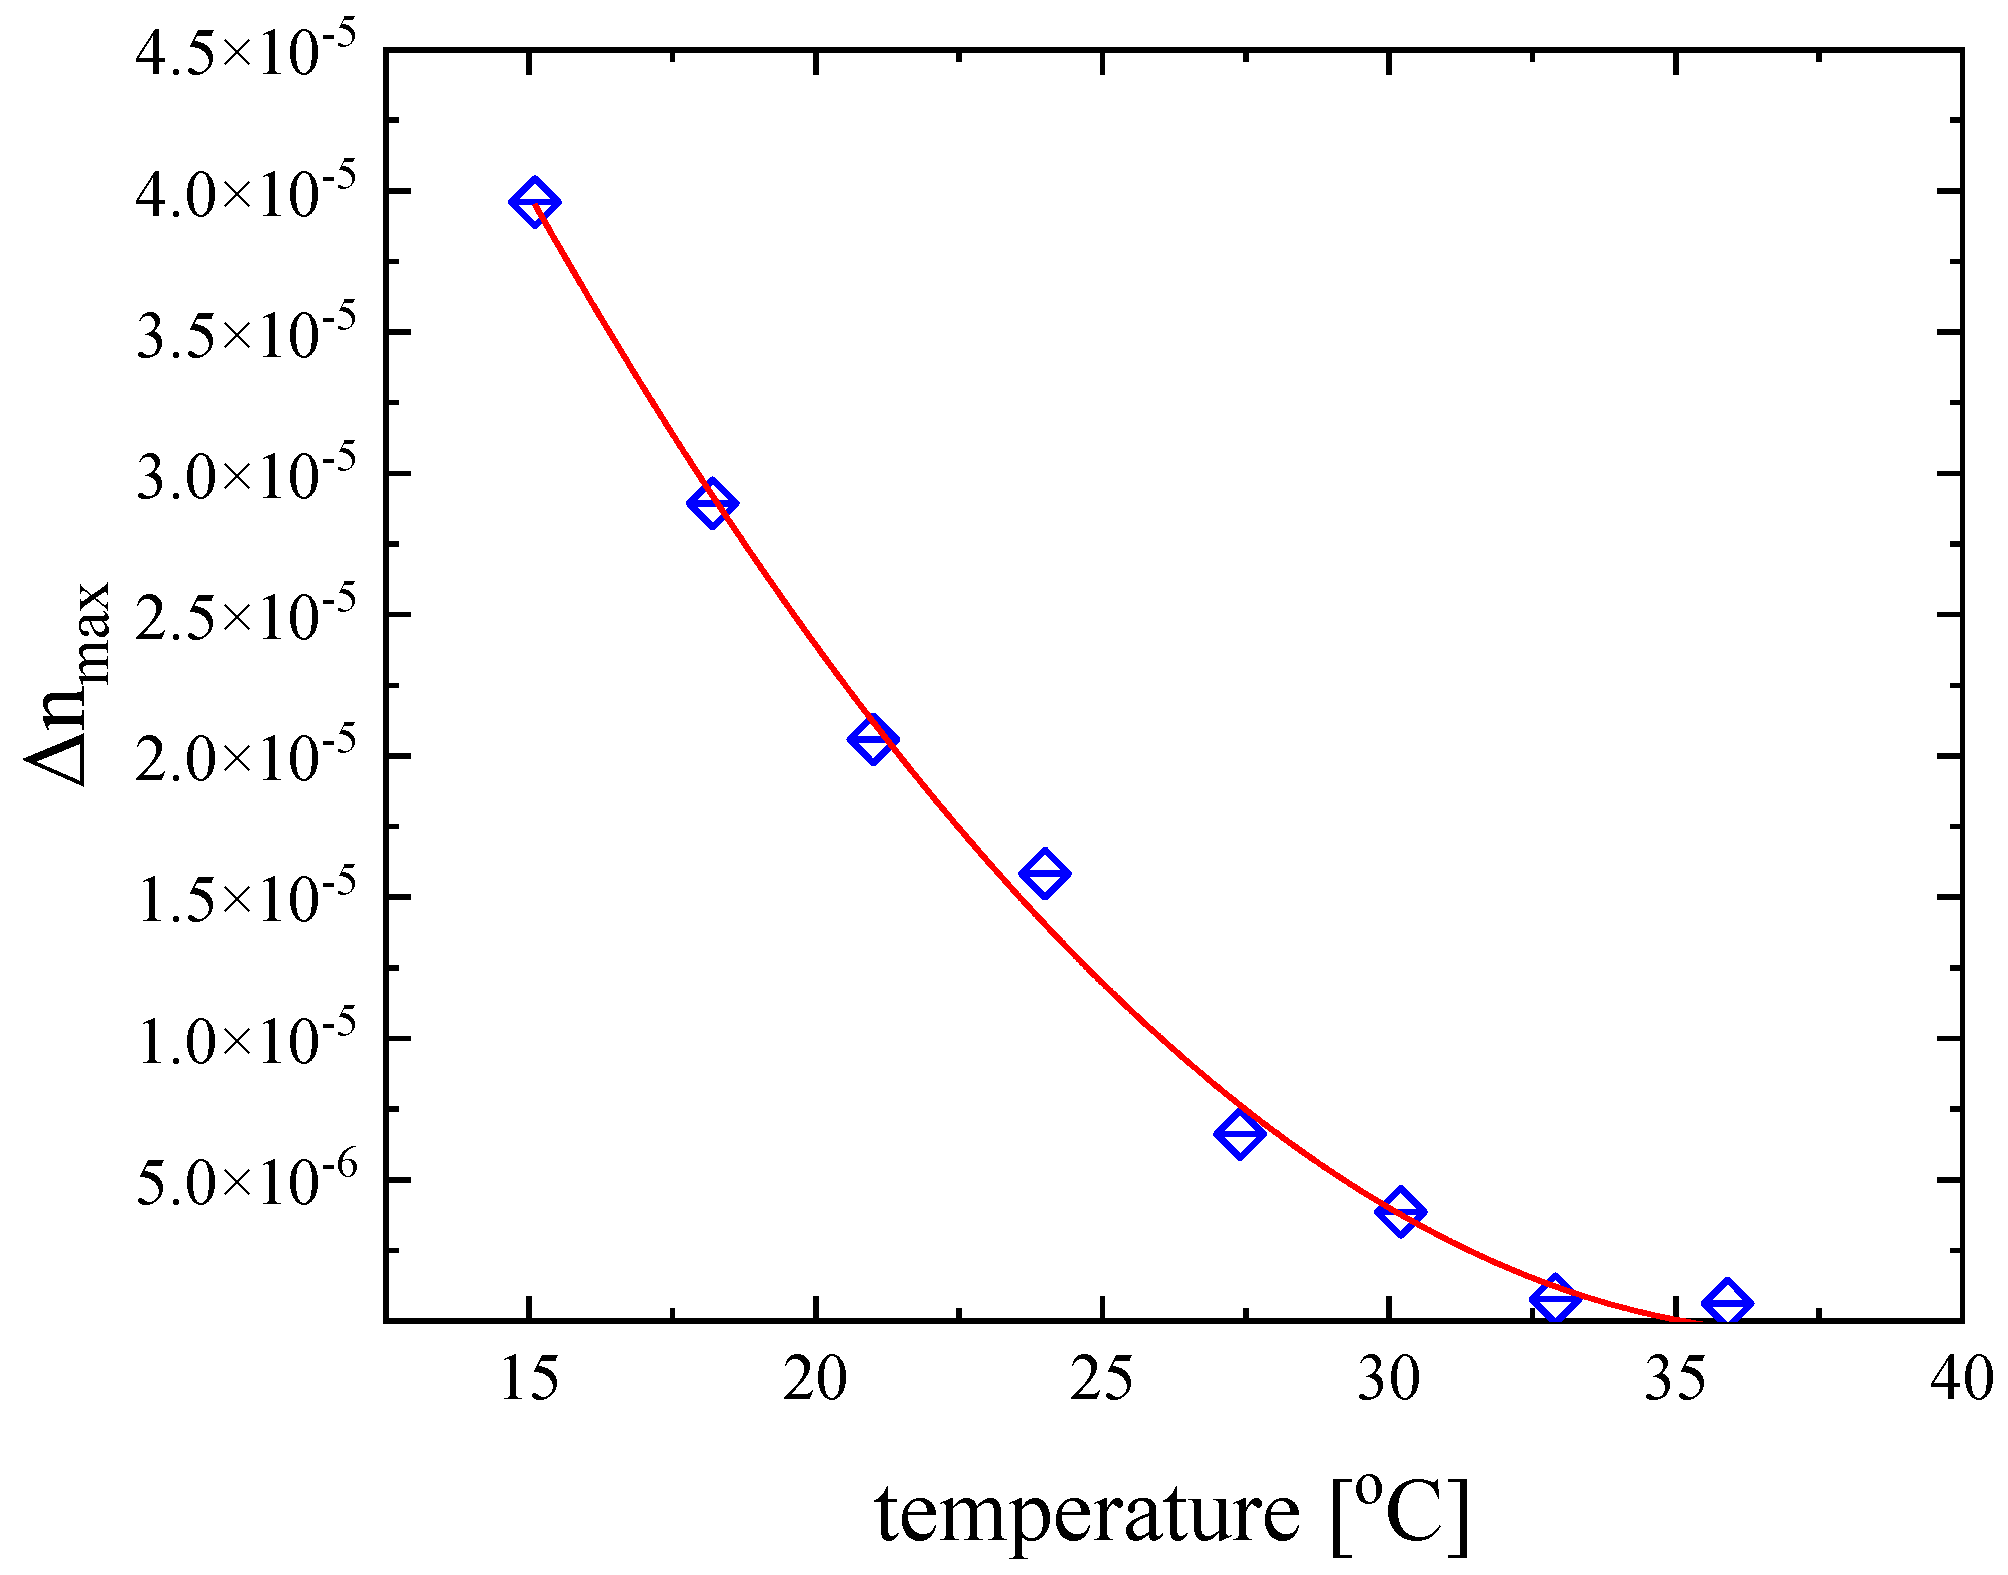
The study of the maximum (static) birefringence signal static birefringence as a function temperature may progress on the comprehensive understanding of the fast molecular orientation dynamics induced by the external acoustic field. In
Figure 8, we present the temperature dependence of Δ
nmax for the DSP aqueous solution with a concentration of 2.55 mM under isobaric conditions. The results reveal a monotonous decreasing trend with increasing temperature and it tends to saturate at the higher temperature. As seen from Equation (8), birefringence is, among others, a function of shear viscosity, density, refractive index, and sound velocity. All these physical properties are temperature dependent and, thus, the maximum birefringence values are also temperature dependent.
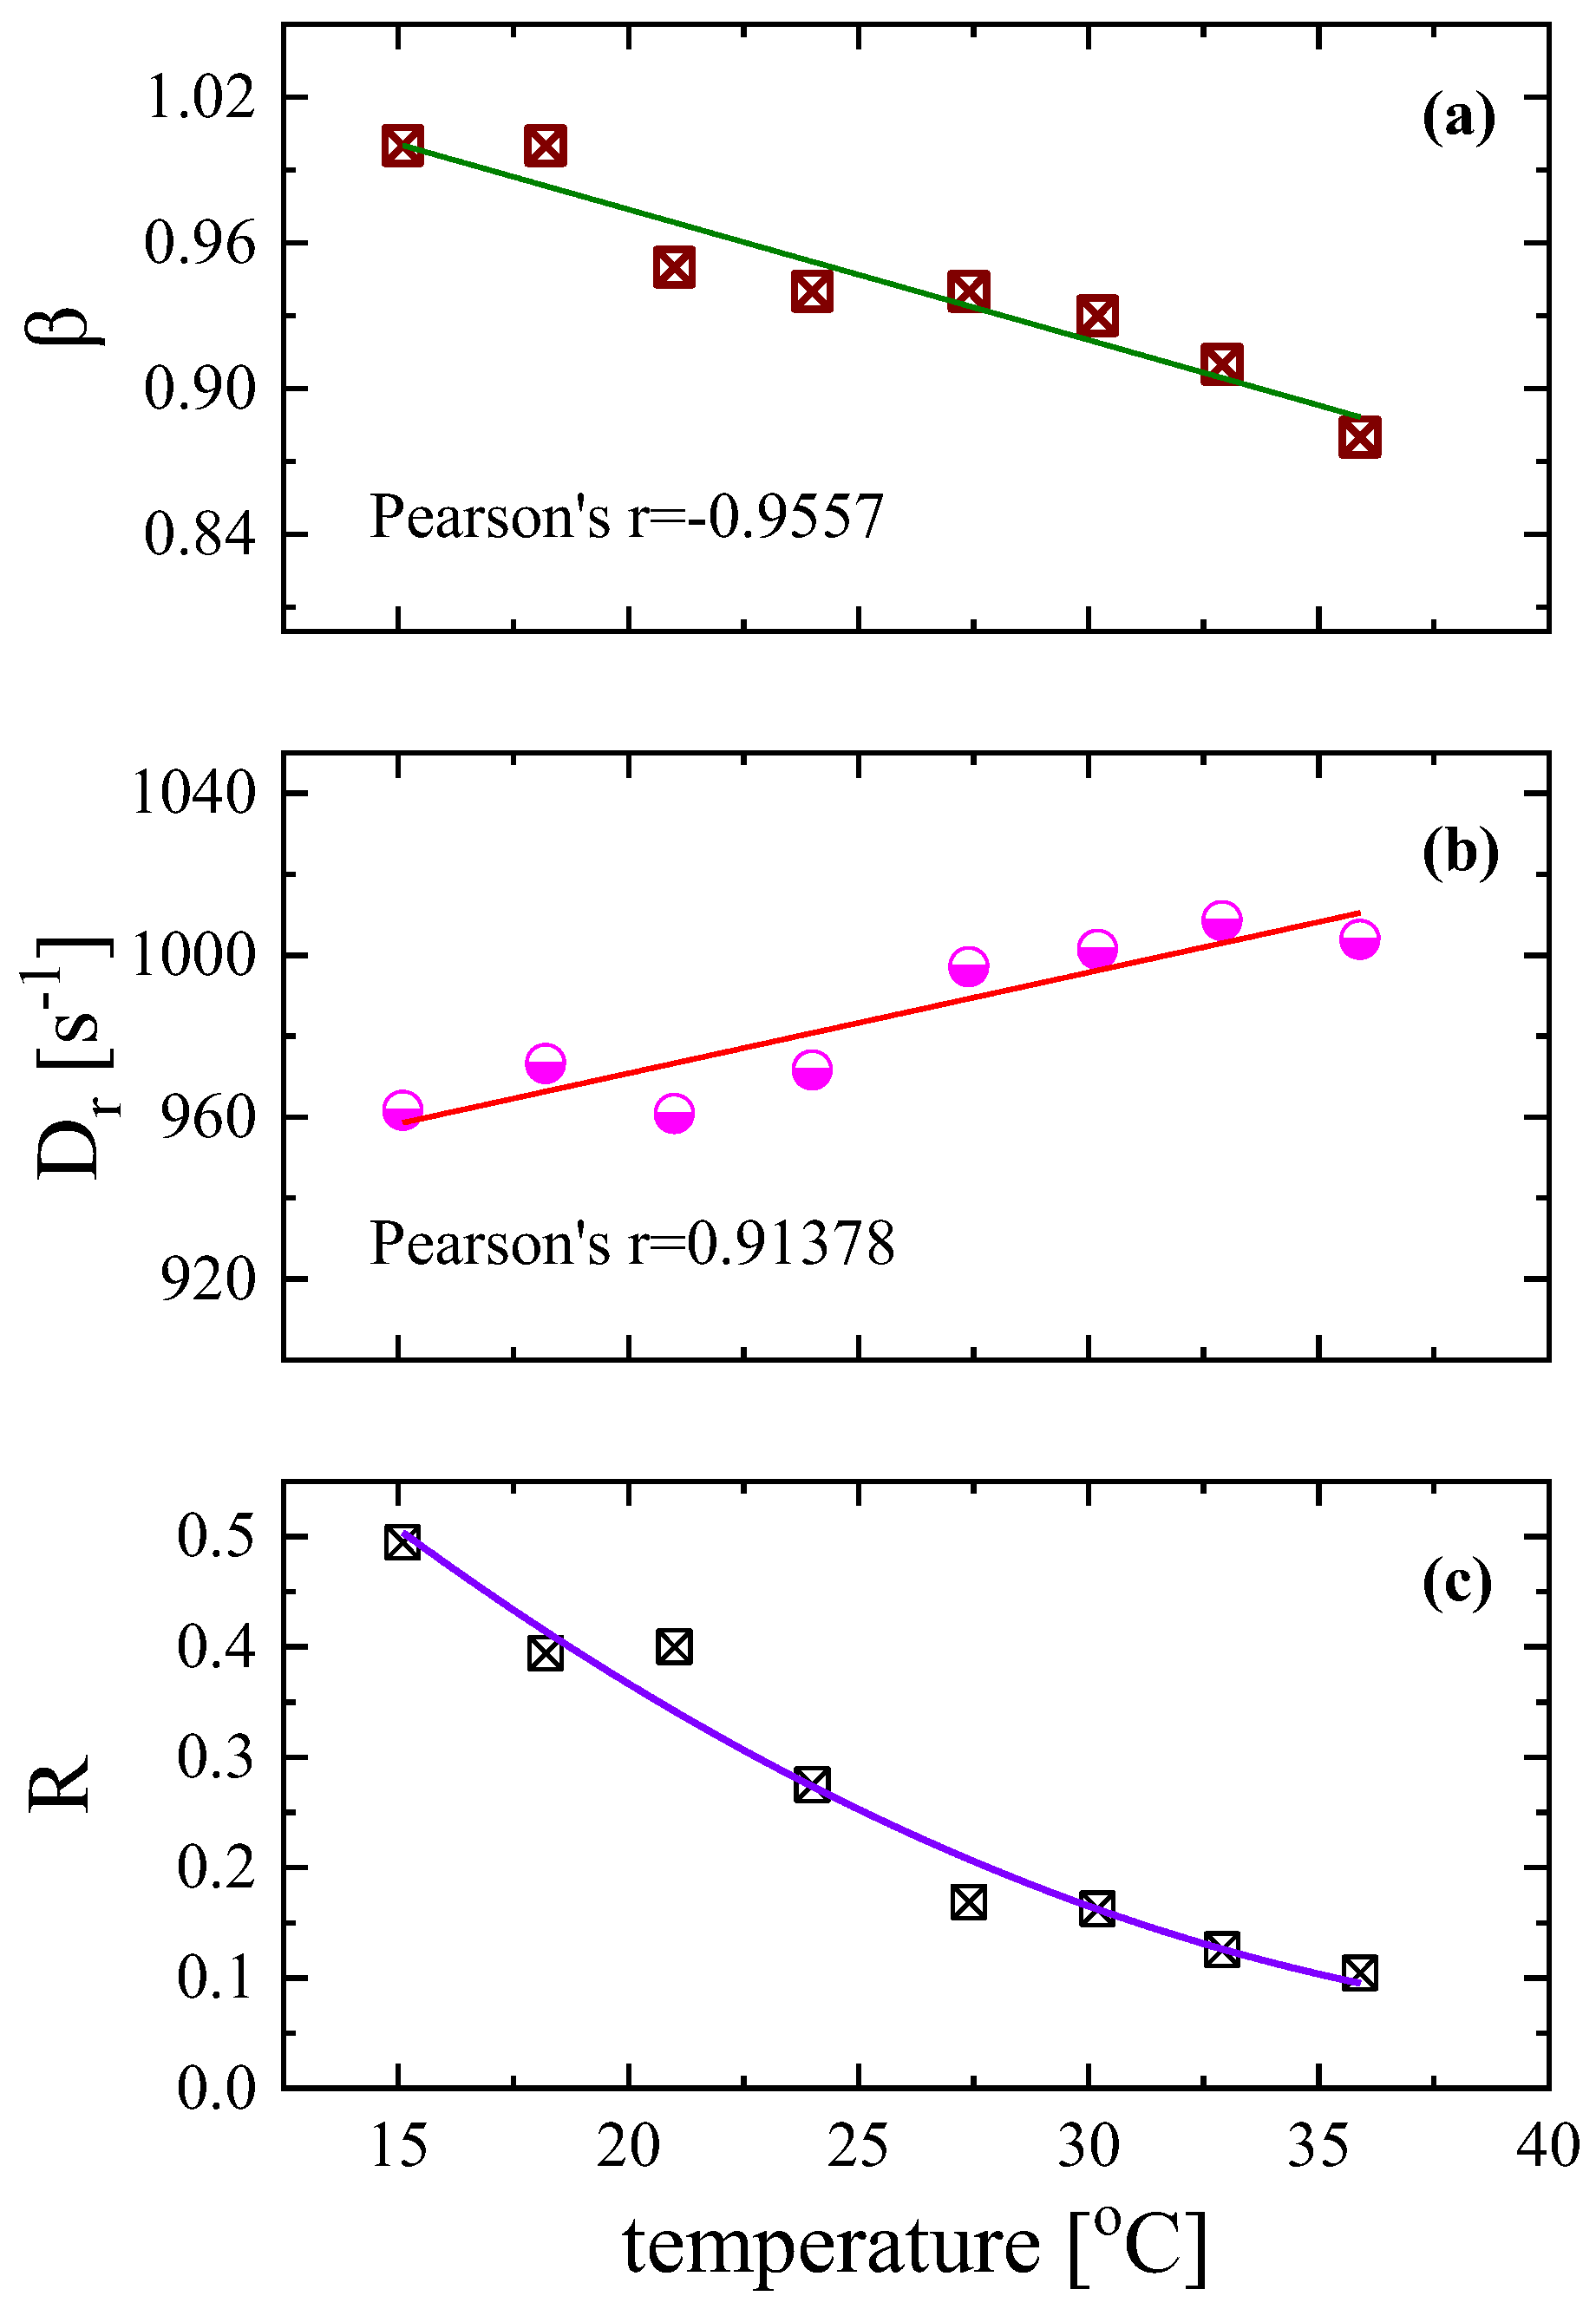
The polydispersity parameter
β is also found to be temperature dependent as seen in
Figure 9a, and seems to follow a decreasing trend from the limiting value of
β = 1 to lower values with increasing temperature, which means that, at higher temperatures, the size of the rotating particles follows a wider distribution. The variation of the exponent
β of the stretched exponential functions (Equations (3) and (4)) was found to be almost linearly dependent on temperature as is evidenced by the Pearson’s parameter value equal to
r = −0.9557. The rotational diffusion coefficient, presented in
Figure 9b, also in this case, exhibits the exact opposite behavior. It seems that the rotational diffusion coefficient increases linearly with temperature with Pearson’s
r = 0.91378. This behavior is more or less expected since the D
r coefficient is related to rotational mobility, which is enhanced with increasing temperature. The ratio
R of the contribution of permanent to induced dipole moments, presented in
Figure 9c, for the aqueous DSP solution with a concentration of 2.55 mM decreases monotonically, with increasing temperature revealing that the number of induced dipoles is enhanced at higher temperatures.
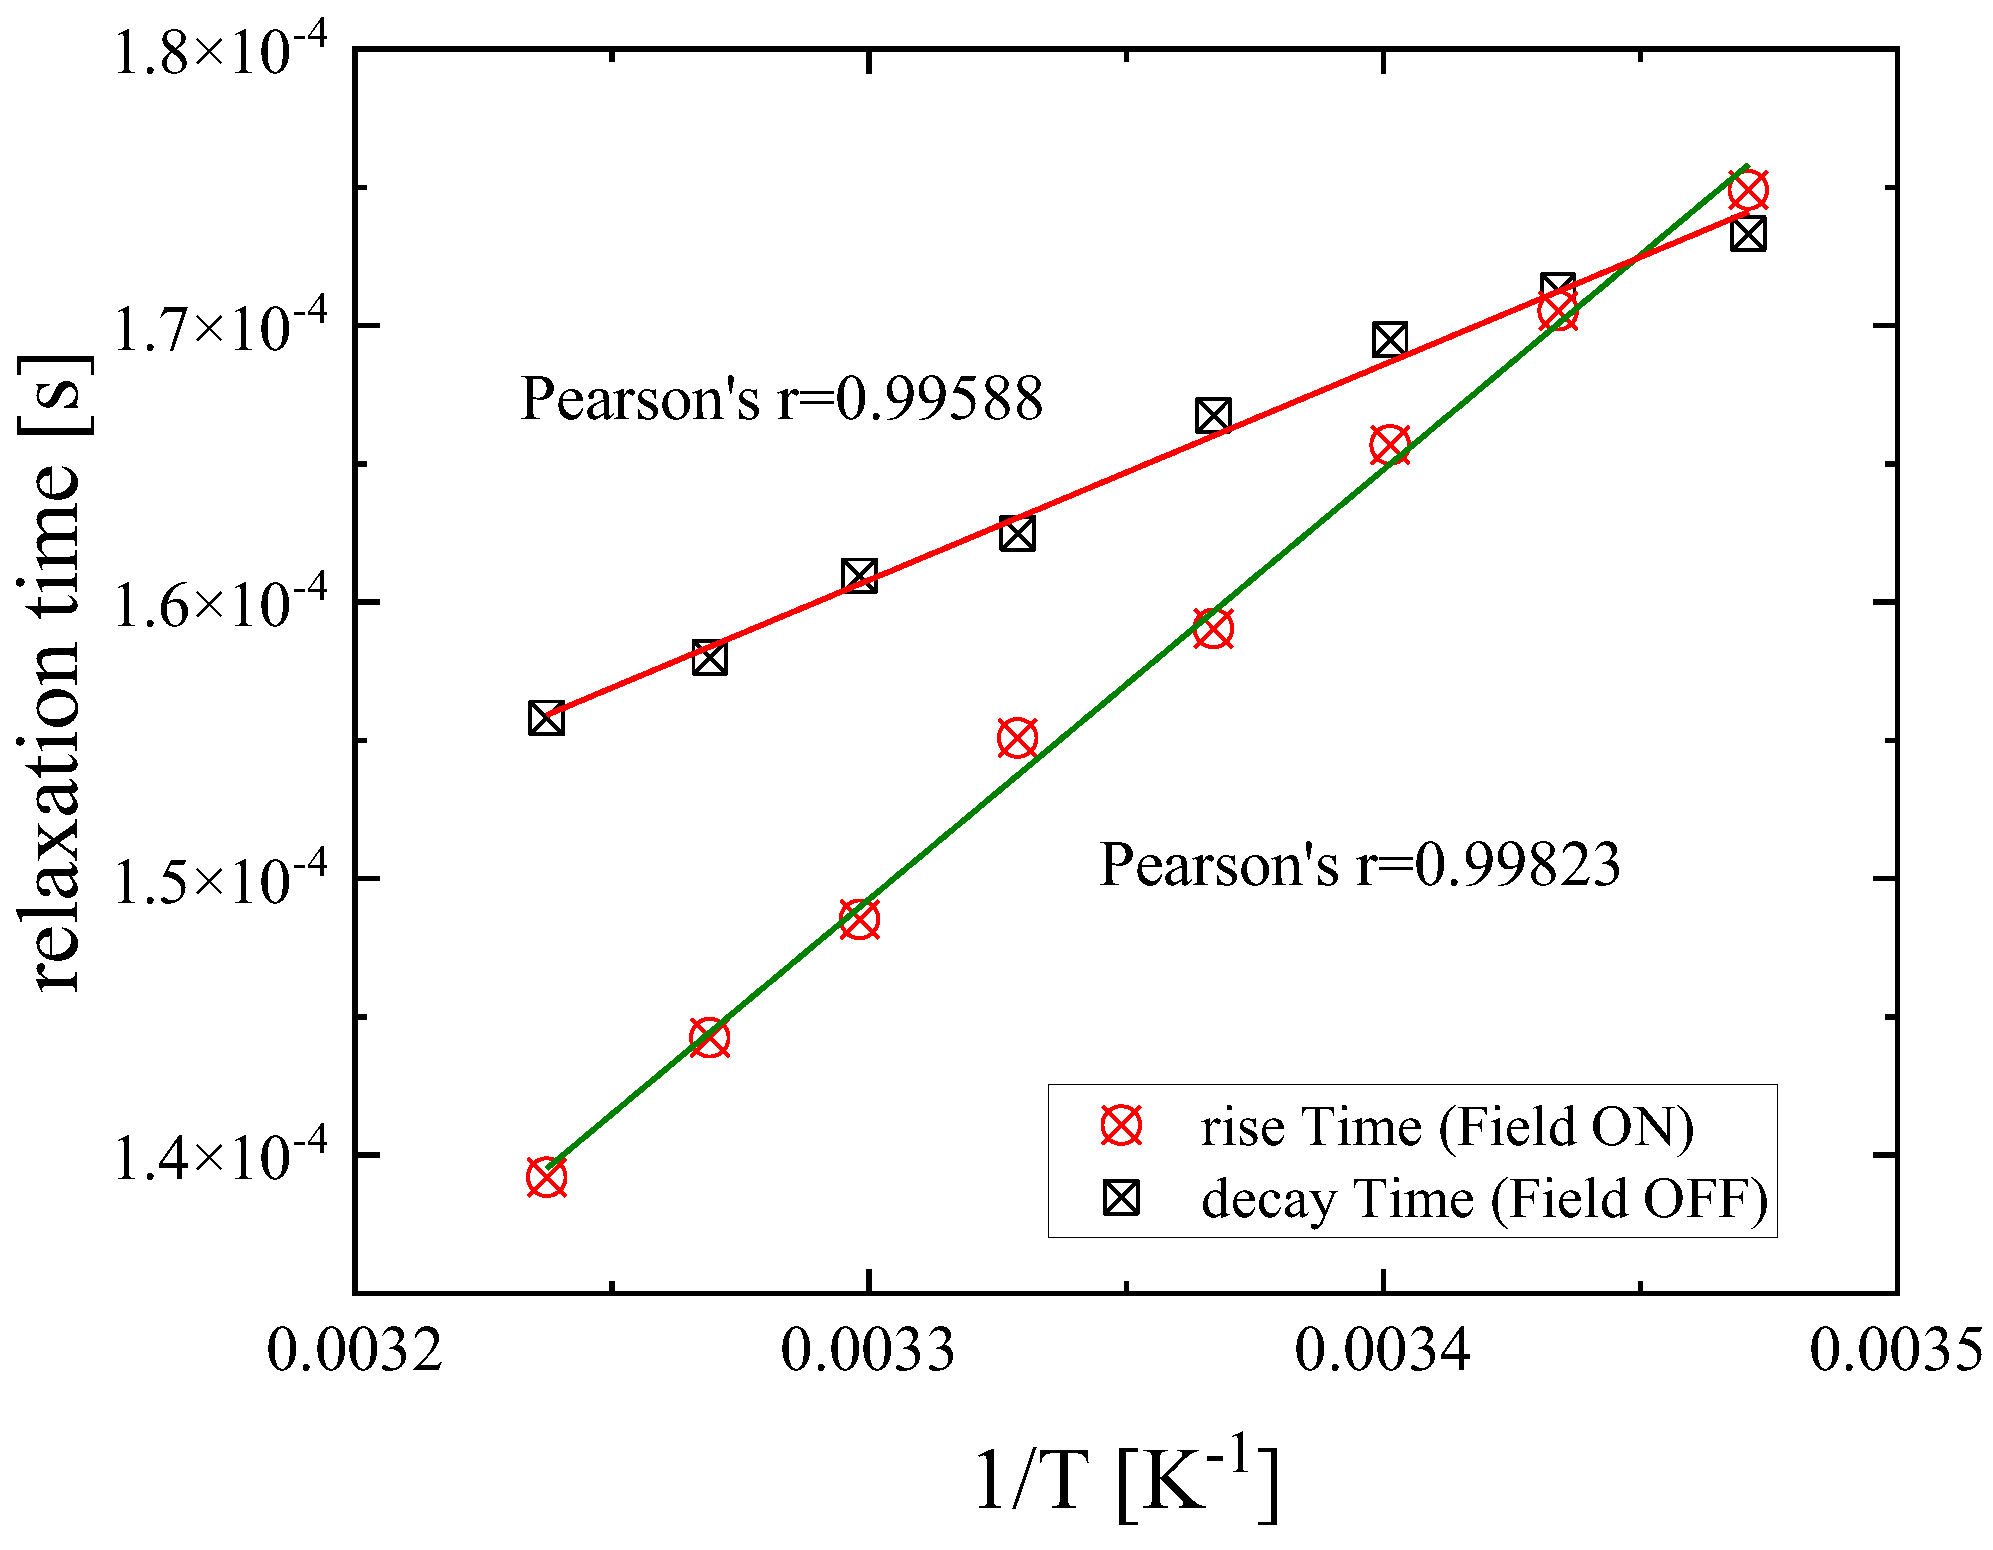
As is observed in
Figure 10, the characteristic relaxation times for both orientation and randomization regions were found to be linearly dependent on reciprocal temperature, and the corresponding Pearson’s parameters were estimated equal to
r = 0.99588 and
r = 0.99823. Furthermore, the relatively slow relaxation times for both orientation and disorientation processes are indicative of a collective molecular motion over a long range.
The hydrodynamic volume
Vh of the particle is related to the relaxation time of the disorientation regions through the following equation [
1,
25,
26,
27,
28]:
The so-obtained values of the hydrodynamic volume as a function of temperature are presented in
Figure 11, where a clear linear increasing trend is observed as Equation (14) predicts. The theoretical molar volume of the DSP monomer is
Vm = 5.27 × 10
−28 m
3. The calculation of the theoretical molar volume was performed on the optimized structure of the DSP molecule. The optimized structure was estimated in a vacuum environment at the B3LYP level of theory combined with the 6-311++G(d,p) basis set and tight optimization convergence criteria. The origin of the difference between molecular and hydrodynamic volume is yielded on the further self-assembling of the DSP molecules into larger super-molecular aggregates that become acoustically susceptible and birefringent. The inherent intermolecular interaction among the DSP molecules through hydrogen bonding or neat proton transfer results in a molecular pair that appears intrinsically anisotropic. This behavior of the DSP system, which involves the mutual interaction of all molecules, indicates a system structurally and dynamically perplexed. The system studied in this work cannot be considered as a simple ensemble of individual and spatially dispersed anisotropic units in a uniform solvent matrix. On the contrary, the organization of the DSP molecules can be considered as a percolated structure of the DSP molecules through dipole–dipole and dipole-induced dipole interactions. The mobility of aggregates in a medium is a fundamental property that can be readily measured and depends on several interweaving factors. Mobility strongly affects the aggregate transport, dispersal, and the kinetics of their continued growth via aggregation. The size of the aggregate as measured by the hydrodynamic volume provides a measure for the number of primary particles or monomers that make up the aggregate. As the monomer number falls to one, the aggregate is no longer fractal. Another significant factor is the flow regions, which is determined largely by the aggregate’s linear size in comparison to the molecular mean free path of the molecules of the medium in which it is moving. The aggregates are clusters of DSP molecules with a self-similar structure over a finite range of length scales.


