Article

Accuracy of Measuring Rebar Strain in Concrete Using a Diffractometer for Residual Stress Analysis

1
Graduate School of Science and Technology, Tokyo University of Science, 2641 Yamazaki, Noda 278-8510, Chiba, Japan
2
Faculty of Science and Technology, Tokyo University of Science, 2641 Yamazaki, Noda 278-8510, Chiba, Japan
3
Department of Fire Engineering, Building Research Institute, 1 Tachihara, Tsukuba 305-0802, Ibaraki, Japan
4
Building Department, National Institute for Land and Infrastructure Management, 1 Tachihara, Tsukuba 305-0802, Ibaraki, Japan
5
Materials Sciences Research Center, Japan Atomic Energy Agency, 2-4 Shirakata, Tokai, Naka 319-1195, Ibaraki, Japan
*
Author to whom correspondence should be addressed.
Quantum Beam Sci. 2023, 7(2), 15; https://doi.org/10.3390/qubs7020015
Submission received: 9 February 2023 / Revised: 22 April 2023 / Accepted: 24 April 2023 / Published: 10 May 2023

Abstract

:
Neutron diffraction is a noncontact method that can measure the rebar strain inside concrete. In this method, rebar strain and stress are calculated using the diffraction profile of neutrons irradiated during a specific time period. In general, measurement accuracy improves with the length of the measurement time. However, in previous studies, the measurement time was determined empirically, which makes the accuracy and reliability of the measurement results unclear. In this study, the relationship between the measurement time and the measurement standard deviation was examined for reinforced concrete specimens under different conditions. The aim was to clarify the accuracy of the measurement of rebar stress using the neutron diffraction method. It was found that if the optical setup of the neutron diffractometer and the conditions of the specimen are the same, there is a unique relationship between the diffraction intensity and the rebar stress standard deviation. Furthermore, using this unique relationship, this paper proposes a method for determining the measurement time from the allowable accuracy of the rebar stress, which ensures the accuracy of the neutron diffraction method.

1. Introduction

The local bond behavior between rebar and concrete can be evaluated by measuring the stress in the rebar inside the concrete. In previous studies [1,2,3], bond behavior was evaluated by applying strain gauges to the rebars inside the concrete and using them to measure the stress distribution of the rebars. Although the strain gauge method is characterized by its extremely high measurement accuracy, there is concern that applying the strain gauge to the rebar and handling the lead wire itself may affect the bond behavior. In addition, it is challenging to evaluate the stresses inside the cross-section of the rebar because the strain gauge can only measure the stress on the surface of the rebar, which is where the strain gauge is attached.
In contrast, the neutron diffraction method has attracted attention as a measurement method that can evaluate the rebar strain inside concrete using non-destructive and non-contact methods [4]. Neutrons also have excellent permeability through concrete and steel, which makes it possible to determine the stresses inside the rebar cross section. For these reasons, the neutron diffraction method has been applied to evaluate the strain distribution in bond tests of common [5,6,7], corroded [6], and hot-dip galvanized rebars [8]. In particular, previous studies [4,5] have reported that rebar stress distributions measured by neutron diffraction and strain gauge methods give different results, indicating the effectiveness of the neutron diffraction method in evaluating bond behavior.
However, very few studies have been conducted on the neutron diffraction measurement method for reinforced concrete [4,9,10]. In the neutron diffraction method, the rebar strain and stress are calculated by fitting the diffraction profiles of neutrons irradiated during a specific time period [4,5,6,7,8,9,10]. In general, the longer the measurement time, the clearer the diffraction profiles of the neutrons measured in the experiment. The clearer the diffraction profile, the more accurately the diffraction angle and lattice spacing can be calculated, resulting in more accurate measured values. However, the measurement time was determined empirically in most previous neutron diffraction studies on reinforced concrete specimens. For this reason, the accuracy and reliability of the rebar stress measured in previous studies are still to be determined. Moreover, the accurate measurement of the rebar stress is important for understanding the bonding behavior. Therefore, it is necessary to clarify the accuracy of the measured rebar stress obtained using the neutron diffraction method to ensure the accuracy and reliability of the measurements using this method and to understand the bond behavior between the rebar and concrete in more detail. Furthermore, if the measurement time can be determined from the allowable accuracy of the rebar stress, it is important to ensure the accuracy and reliability of the measurement results.
In this study, the relationship between measurement time and accuracy was examined for reinforced concrete specimens with different cross-sectional shapes, measurement positions, and cover thicknesses to clarify the accuracy of the measurements using neutron diffraction methods. This study provides new insight into the measurement accuracy of the rebar stresses inside the concrete as measured by neutron diffraction methods, which enhances our understanding of the applicability of this method in the field of concrete engineering.

2. Materials and Methods

2.1. Concrete Materials Used and Mix Proportion

Table 1 lists the materials used for the concrete in this experiment, and Table 2 lists the concrete mix proportions. Table 2 shows the compressive strength, fc, and static modulus of elasticity, Ec, on the test day (23 days after mixing and forming). The values on the test day were obtained under the same curing conditions as the specimens shown in Section 2.2.

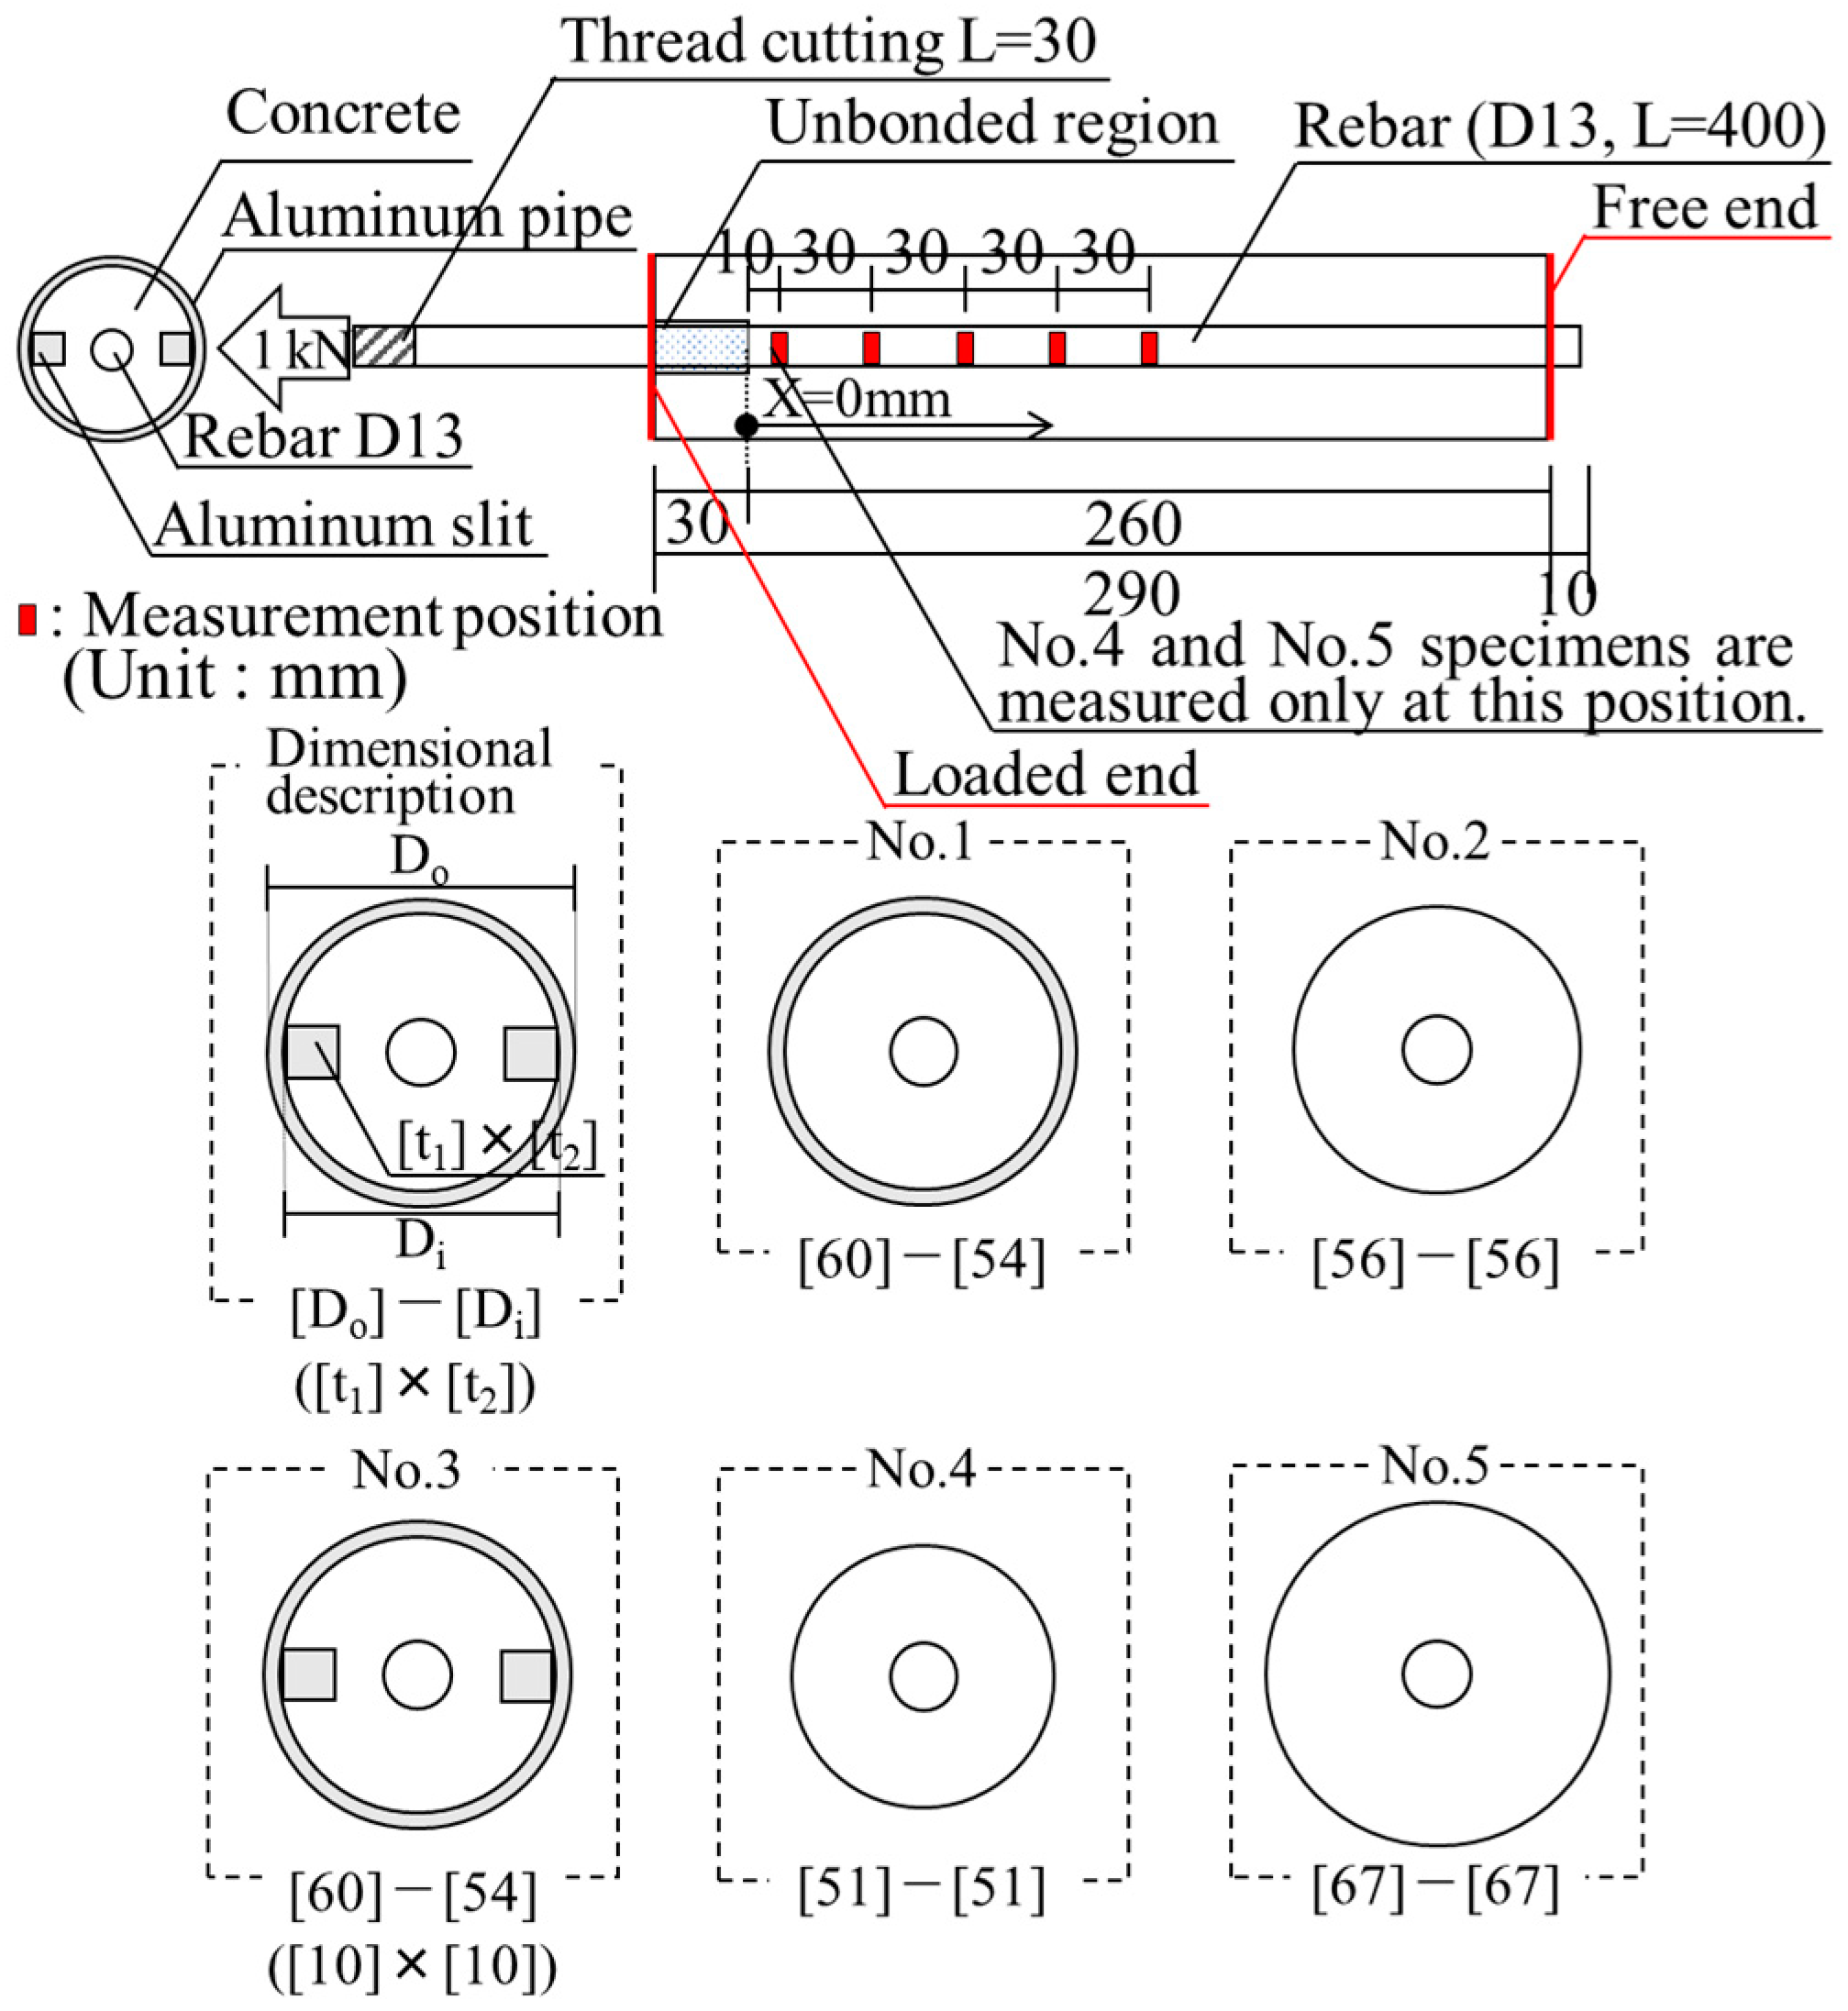
2.2. Experimental Parameters and Test Specimens

Figure 1 presents an overview of the specimens used in the experiment. The experimental parameters are presented in Table 3. Because the neutron permeability of concrete is lower than that of aluminum, the cross-sectional shapes of the specimens and cover thickness were set as experimental variables to qualitatively evaluate the effects of concrete and aluminum in the neutron transmission path on the measurement accuracy of the rebar stress. In addition, in specimen Nos. 1 and 3, the moisture loss from the concrete surface was suppressed by the aluminum pipe during the drying process, which will be described later. Therefore, in specimen Nos. 1 and 3, the moisture content in the concrete was non-uniform because of the drying from the two ends, the loaded and free ends (as shown in Figure 1). The measurement position was set as an experimental variable to qualitatively evaluate the effect of the concrete moisture state on the rebar stress measurement accuracy. The terms “No.” in Table 3 correspond to those shown in Figure 1.
The specimens were prepared by placing a 400 mm-long rebar in concrete with the cross-sectional shape shown in Figure 1. The rebar was bonded with concrete over a length of 260 mm, and a 30 mm unbonded region was provided on the loading end. The unbonded region was created by removing the installed rubber hose at the time of casting after curing. The rebar used in this experiment was a commercially available D13 deformed bar (SD295, carbon steel) based on JIS G 3112 “Steel bars for concrete reinforcement”.
For the specimens unconstrained by an aluminum sleeve (specimen Nos. 2, 4, and 5), the concrete specimen was cast in a mold made of PVC pipe and demolded after hardening. The specimens constrained by an aluminum sleeve (specimen Nos. 1 and 3) were prepared by using the aluminum pipe as the mold. The aluminum slit in specimen No. 3 was installed by attaching a 10 mm × 10 mm aluminum square pillar to the aluminum pipe with a room-temperature curing adhesive before concrete casting. When aluminum and concrete come into contact, there is concern that hydrogen bubbles may form in the concrete [11]. Therefore, a two-component modified epoxy resin paint was sprayed on the contact surface of the aluminum pipe to suppress chemical reactions.
The specimens were demolded 48 h after concrete casting and cured in water at 20 °C for 7 days. The specimens were then dried at 20 °C and 60% RH for 24 h. The specimens were dried in the constant temperature chamber at 40 °C for 11 days of aging and at 60 °C for a further 20 days of aging. After drying, the specimens were sealed with aluminum tape to prevent moisture absorption. A neutron diffraction method was used over four days, beginning on aging day 21. One specimen was used for each parameter in the neutron diffraction method.

2.3. Experimental Method

2.3.1. Overview of Measuring Rebar Strain

An angular dispersion type of neutron diffraction experiment was performed using the diffractometer for residual stress analysis (RESA) at the Japan Research Reactor No. 3 (JRR-3) of the Japan Atomic Energy Agency (JAEA). Neutrons are scattered when they hit individual atoms, and diffraction occurs when scattered neutrons interfere with each other if the Bragg diffraction condition in Equation (1) is satisfied:
2 d sin θ = n λ
where d is the lattice spacing, θ is the diffraction angle, n is the diffraction order, and λ is the wavelength of incident neutrons.
The lattice spacing of the crystal lattice changes when a load is applied to the material. The change in the lattice spacing can be translated into a change in the diffraction angle by differentiating Equation (1) to form Equation (2).
ε = d d 0 d 0 = 2 θ 2 θ 0 2 · cot 2 θ 0 2
where ε is the elastic strain, d0 is the lattice spacing in the initial state, and θ0 is the diffraction angle in the initial state.
The elastic strain can be calculated by measuring the change in diffraction angle Δθ.
An overview of the RESA is shown in Figure 2. Thermal neutrons of a single wavelength were extracted from the research reactor, and neutrons shaped by an incident Cd slit irradiated the sample. The neutrons diffracted by the sample were detected using a one-dimensional 3He detector. The detector measured the diffraction intensity of each diffraction angle of neutrons for a certain period (5 min in this experiment). Assuming that the relationship between the diffraction angle and the diffraction intensity follows a Gaussian distribution and that the peak diffraction angle 2θ is obtained by fitting. From this peak diffraction angle, the lattice spacing d is obtained using Equation (1), and the elastic strain, ε, is calculated using Equation (2).
The actual area to be measured by the RESA is the square column area (gauge volume) shown in Figure 2, which is determined by the size of the incident Cd slit and the width of the radial collimator. The elastic strain was calculated using the average value of the volume. The diffraction plane used in this study was the (110) plane. The wavelength of the incident neutrons was 1.72 Å, the size of the incident Cd slit was 5 × 10 mm, and the width of the radial collimator was 5 mm.

2.3.2. Loading Method and Measurement Position

Figure 2 presents an overview of the loading machine used in this experiment. A load cell and disc spring were placed on a hydraulic jack fixed to the loading machine, and one side of the specimen was fixed to the load machine through a rod extended from the rebar. A tensile force was introduced into the rebar by pushing the spring through the jack.
Figure 1 shows the measurement positions of the rebar stress for specimen Nos. 1–3. Rebar stress measurements were performed at five positions: 10, 40, 70, 100, and 130 mm from the beginning of the bonded region (0 mm). The measurement position of 130 mm in specimen No. 1 was not measured. For specimen Nos. 4 and 5, measurements were taken only at one measurement position, 10 mm from the beginning of the bonded region. The measurement results in Section 3.1 and Section 3.3 were all taken at the 10 mm measurement position.
Table 4 lists the total measurement times for each measurement position. The total measurement time per measurement position was set for each specimen so that the lattice spacing (da), which is assumed to be the actual value, is sufficiently accurate, as described in Section 2.4.1. The applied load was set to 1 kN for all specimens to avoid any misalignment of the specimens during the measurement and the generation of large stresses at the measurement position.

2.4. Analysis Methods

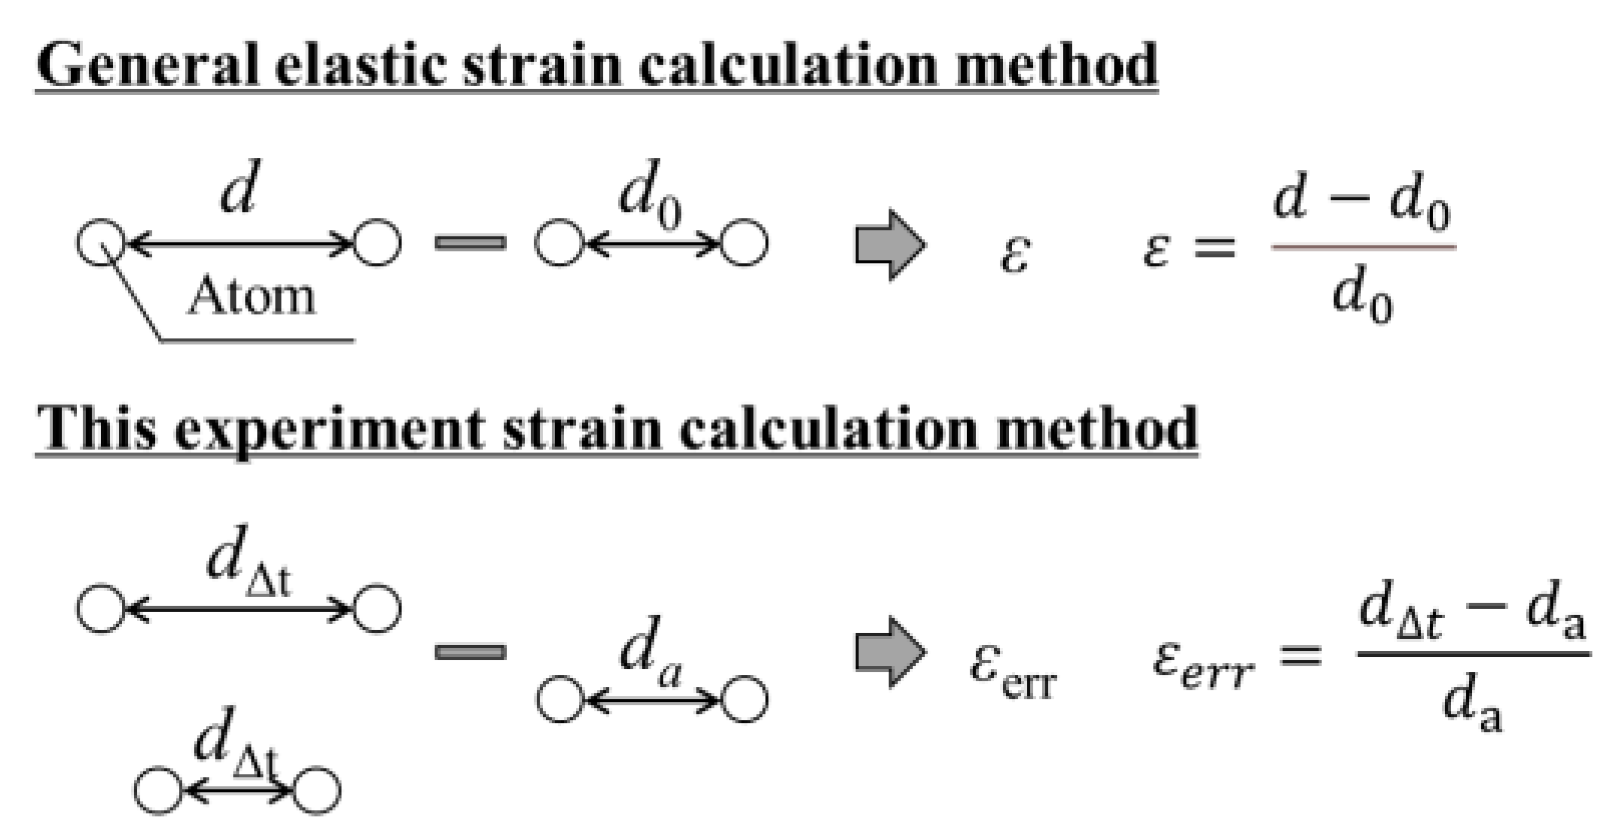
2.4.1. Variation of Rebar Stress Calculation

The analytical methods used in this study are described below. In this experiment, n measurements of 5 min each were made up to the times shown in Table 4 at each measurement position. Figure 3 shows an example of the relationship between the diffraction angle and diffraction intensity obtained from a 5-min measurement. The upper part of the figure shows an approximate Gaussian curve fitting equation analyzed using the graphing software Igor Pro. In this experiment, the peak diffraction angle (2θ), peak intensity (PI), and background intensity (BG) were obtained by fitting the relation between the diffraction angle and diffraction intensity obtained from a 5-min measurement (shown in Figure 3). For measurement results longer than 10 min, shown in Section 3 and Section 4 below, 2θ was calculated by averaging the 5-min measurement result over n times. The PI and BG values were calculated by adding the results over n times.
This experiment aimed to clarify the accuracy of rebar stress measurements using the neutron diffraction method. Therefore, in this experiment, the variation in stress at a certain measurement time was examined under the assumption that the lattice spacing obtained at the total measurement time shown in Table 4 is d0, as shown in Equation (2). Assuming that the lattice spacing obtained at the total measurement time is the actual value (da), and substituting the lattice spacing obtained at a certain measurement time (Δt) for dΔt and the lattice spacing obtained at the total measurement time for da, the variation in strain at a certain measurement time (εerr) is calculated using Equation (3). Figure 4 shows an image of the lattice strain variation during this experiment. In this experiment, the variation of rebar stresses was calculated by multiplying the strain variation by the diffraction elastic constants of the rebar (20.0 GPa). Although to determine the diffraction elastic constants, it is necessary to measure the strain under the application of the known uniaxial stress [12], in this experiment, the stress was calculated assuming the diffraction elastic constants of 20.0 GPa.
ε err = d t d a d a
where εerr is the strain variation, dΔt is the lattice spacing obtained at a certain measurement time, and da is the lattice spacing obtained during the total measurement time.
Figure 5 shows, as an example, the relation between measurement time and rebar stress obtained at the 10 mm position of specimen No. 3. The rebar stress shown in the figure was calculated by multiplying the diffraction elastic constants of the rebar by εerr calculated from Equation (3). Section 3 and Section 4 below discuss the experimental results by investigating the standard deviation (SD) of the variation of the rebar stress shown in Figure 5.

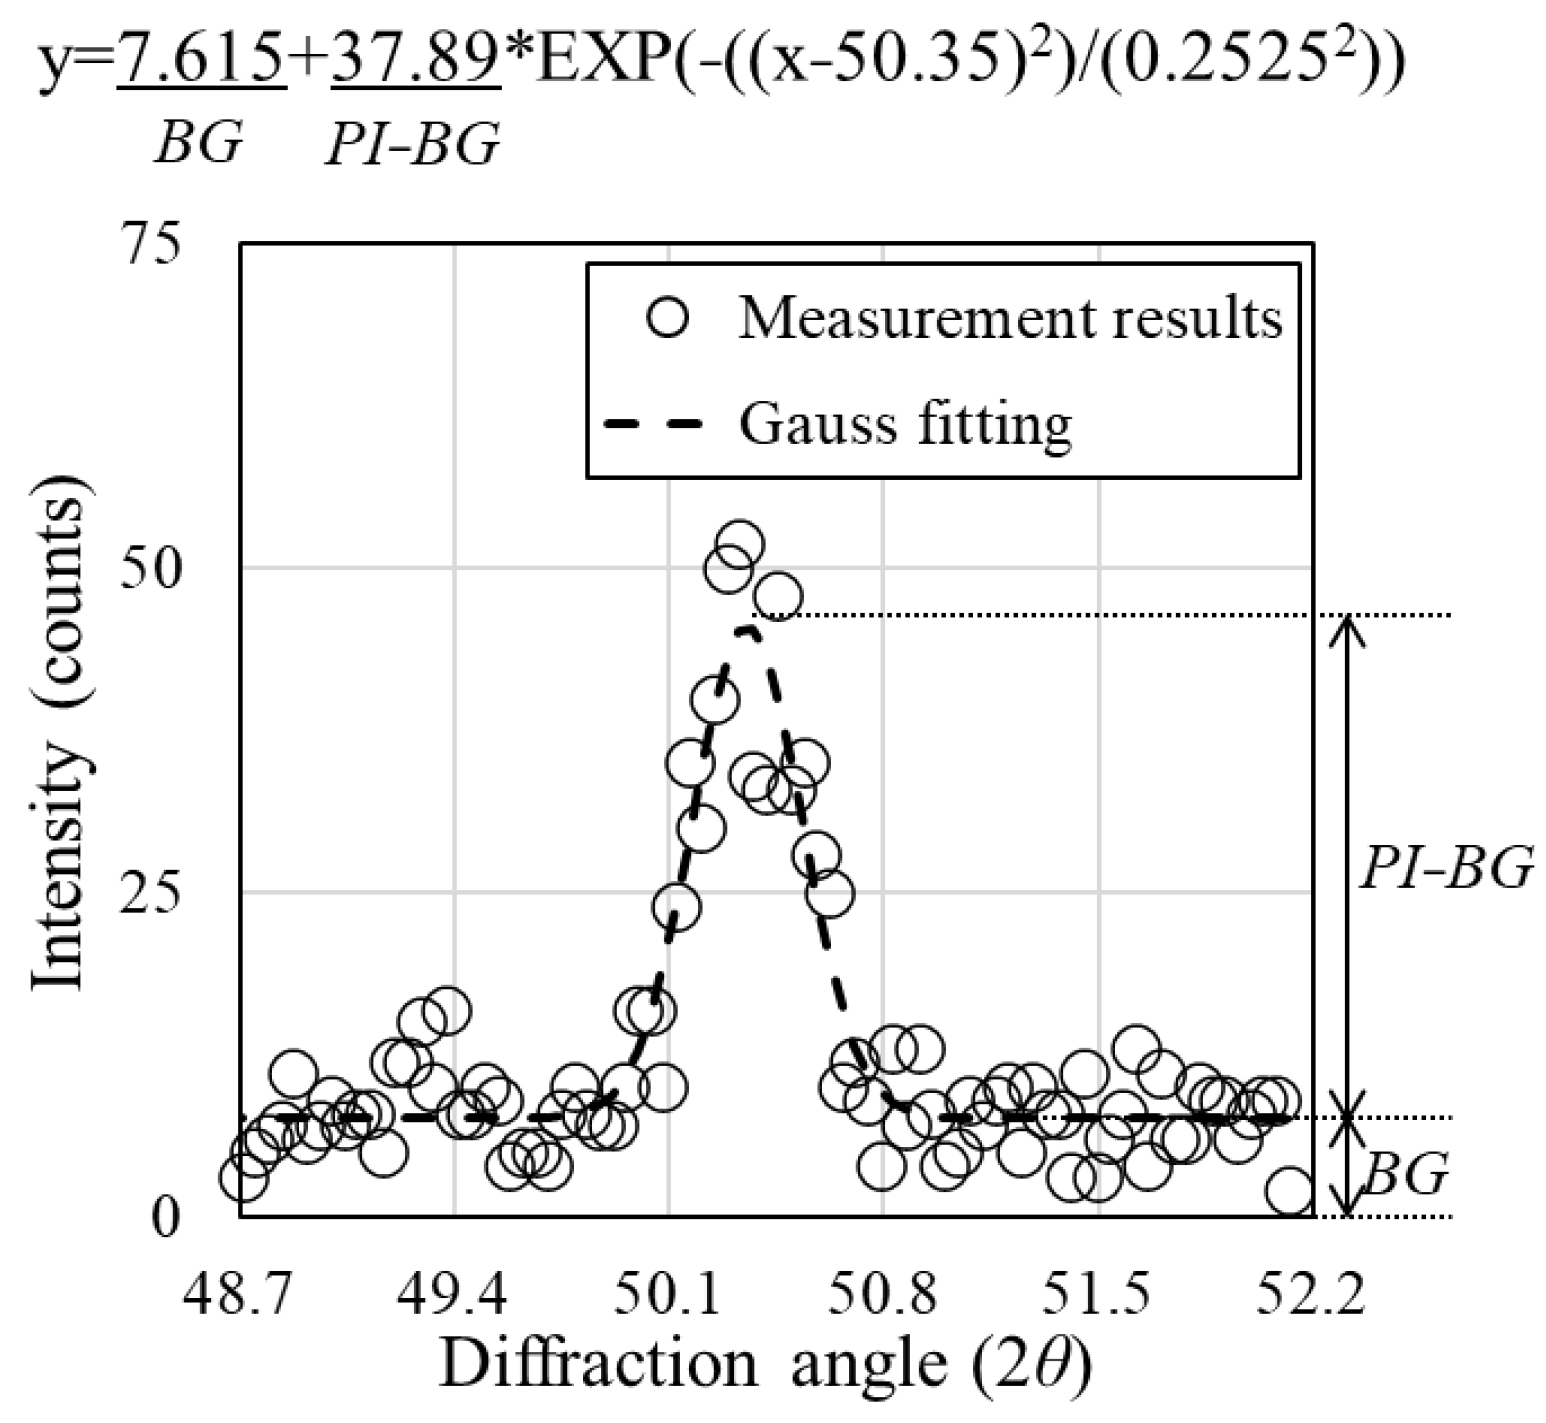
2.4.2. Analysis Method Sensitivity

Section 2.4.1 outlines the method for calculating the SD of the measured rebar stress, which is discussed in Section 3 below. However, in neutron diffraction method measurements, data for 30 min are rarely obtained in the form of six measurements of 5 min each. In general, the relation between diffraction angle and diffraction intensity is more often obtained as one measurement over 30 min [4,9,10]. Therefore, in this section, the relationship between measurement time and SD was calculated for the 10 mm measurement positions of specimen Nos. 2 and 3 according to the analysis method described above (Ave). The relation between the diffraction angle and diffraction intensity obtained from the 5-min measurement was then added n times to create a single dataset. The relation between measurement time and SD was then calculated (Sum). The influence of the analysis method on the measurement results was examined by comparing Ave and Sum.
Figure 6 shows the relationship between the measurement time and the SD. The figure shows that the measurement results were similar for the two analysis methods. Therefore, in Section 3, the measurement accuracy was examined further using the analysis method described above in Section 2.4.1 (Ave).

3. Measurement Accuracy Results

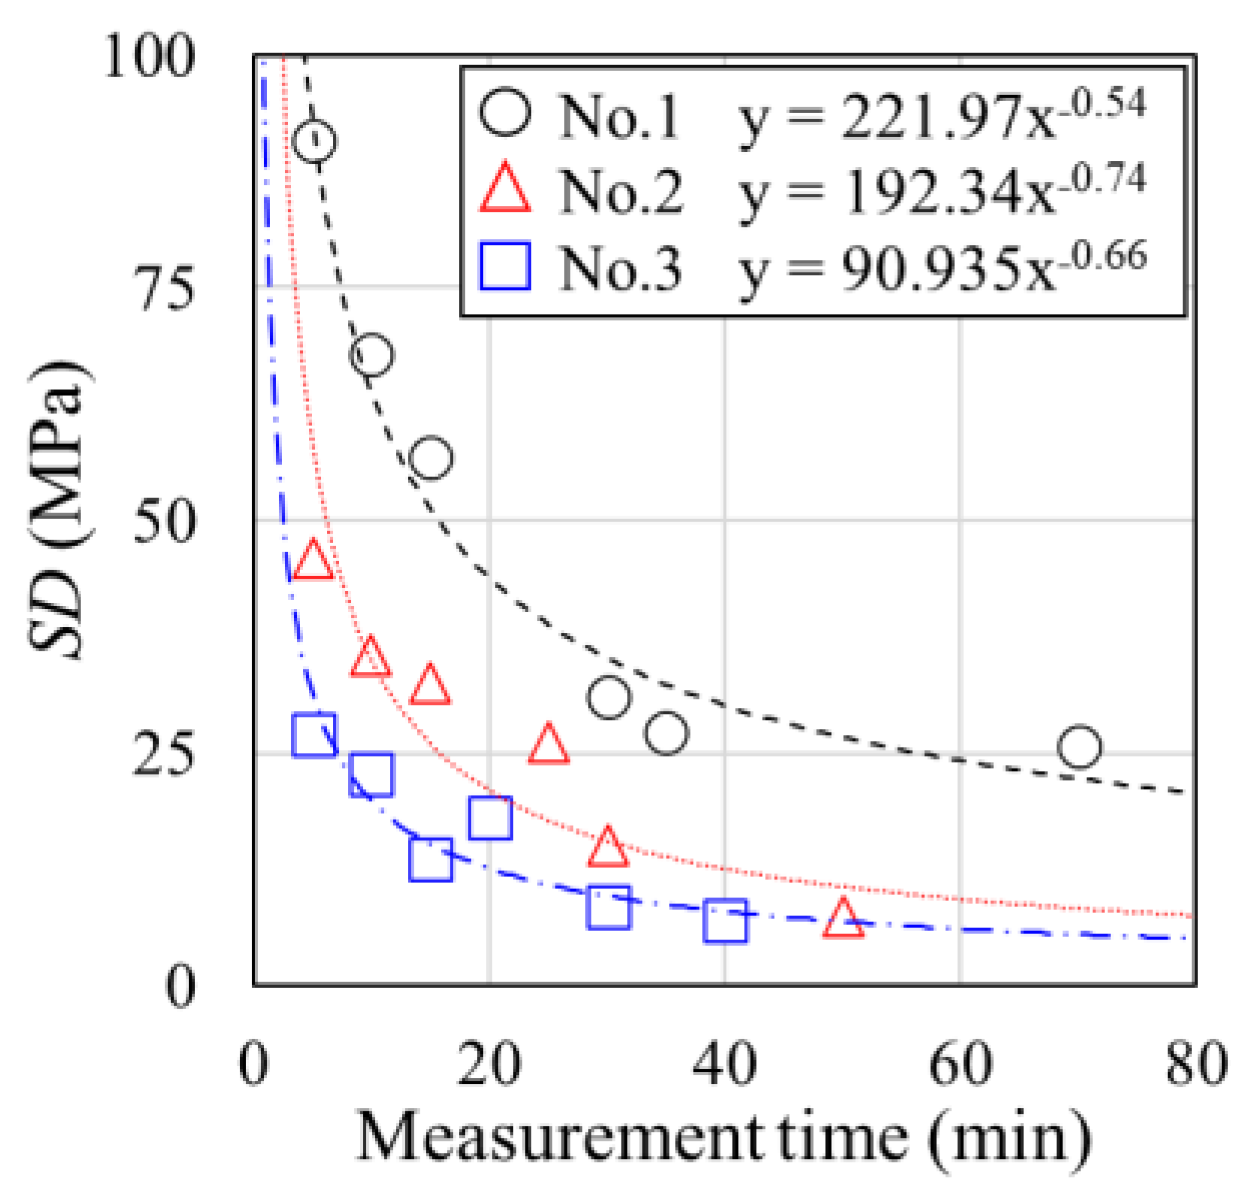
3.1. Cross-Sectional Shape Sensitivity

Figure 7 shows the relationship between the measurement time and the diffraction intensity for different cross-sectional shapes, and Figure 8 shows the relationship between the measurement time and the SD. Figure 9 and Figure 10 show the same relationships, respectively, for different measurement positions. Figure 11 and Figure 12 show the same relationships, respectively, for different cover thicknesses. Figure 8, Figure 10, and Figure 12 also show the power approximation equation.
As shown in Figure 7, the rate of increase in diffraction intensity with increasing measurement time increases in the specimen order of No. 3, No. 2, and No. 1. Figure 8 also shows that specimen No. 3 has better measurement accuracy than the other specimens, even over a relatively short measurement time.

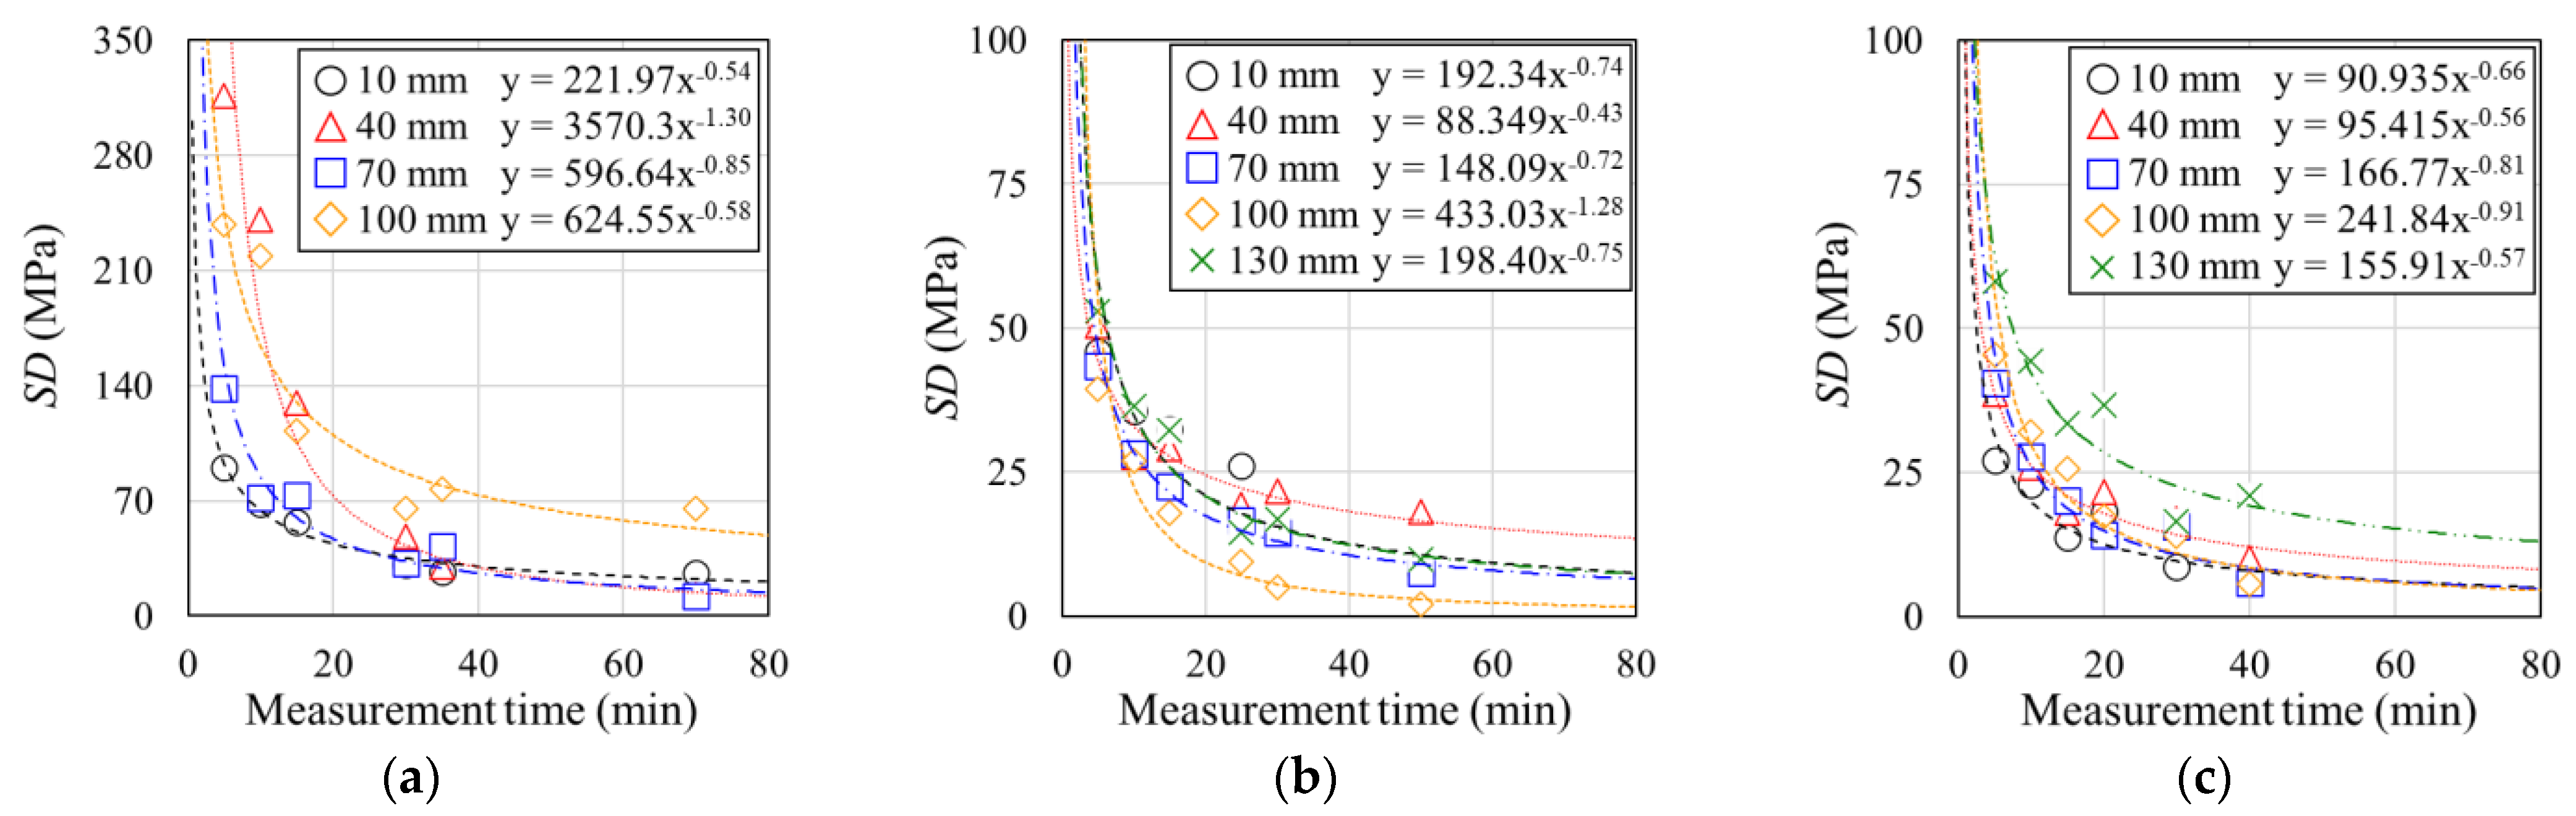
3.2. Sensitivity to Measurement Position

Focusing on the results of specimen Nos. 1 and 3, the rate of increase in intensity with increasing measurement time tends to decrease as the PI decreases from 10 mm to 130 mm (shown in Figure 9). Figure 10 also shows that the closer the measurement position is to 10 mm, the higher the measurement accuracy that can be obtained in a shorter measurement time. However, focusing on the value of the vertical axis in Figure 10, it can be seen that specimen No. 1, where the rate of increase in intensity is small, has a significant variation in rebar stress, even at the same measurement time as specimen Nos. 2 and 3.
Focusing on the result of specimen No. 2, the effect of the measurement position on the diffraction intensity is small. Furthermore, the difference in measurement accuracy due to the measurement position was smaller than that of specimen Nos. 1 and 3.

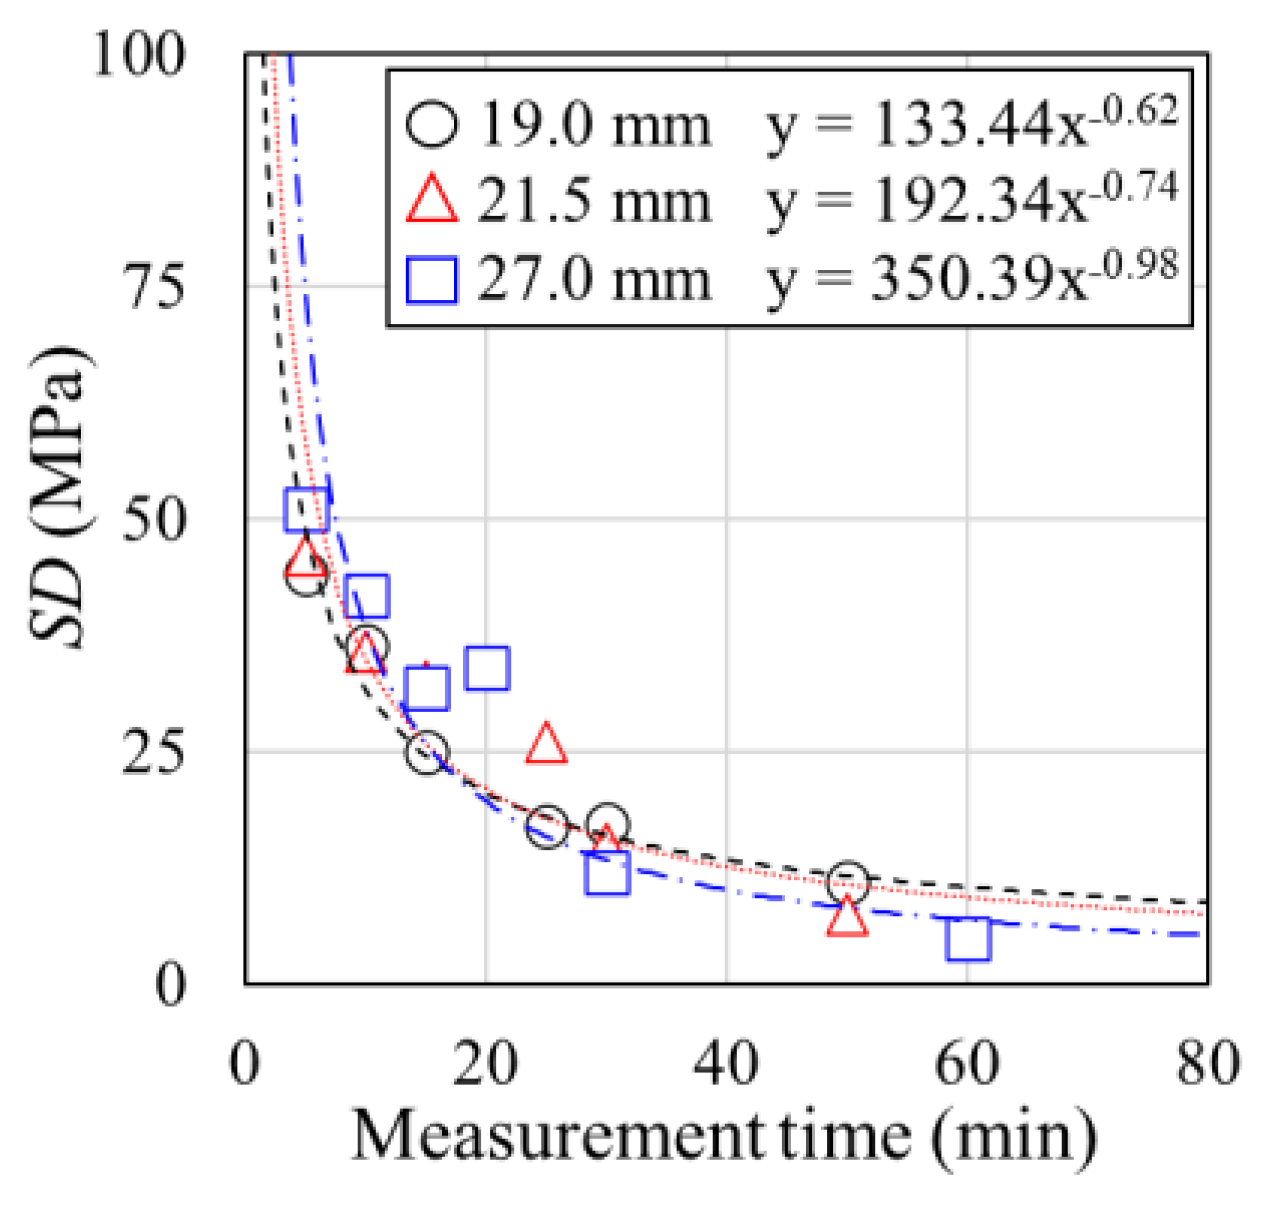
3.3. Sensitivity to Cover Thickness

As shown in Figure 11, the increase in PI and BG with increasing measurement time was more significant for specimens with a smaller cover thickness. Figure 12 also shows that the effect of the cover thickness on the measurement accuracy is small compared with the other experimental parameters.

4. Discussion

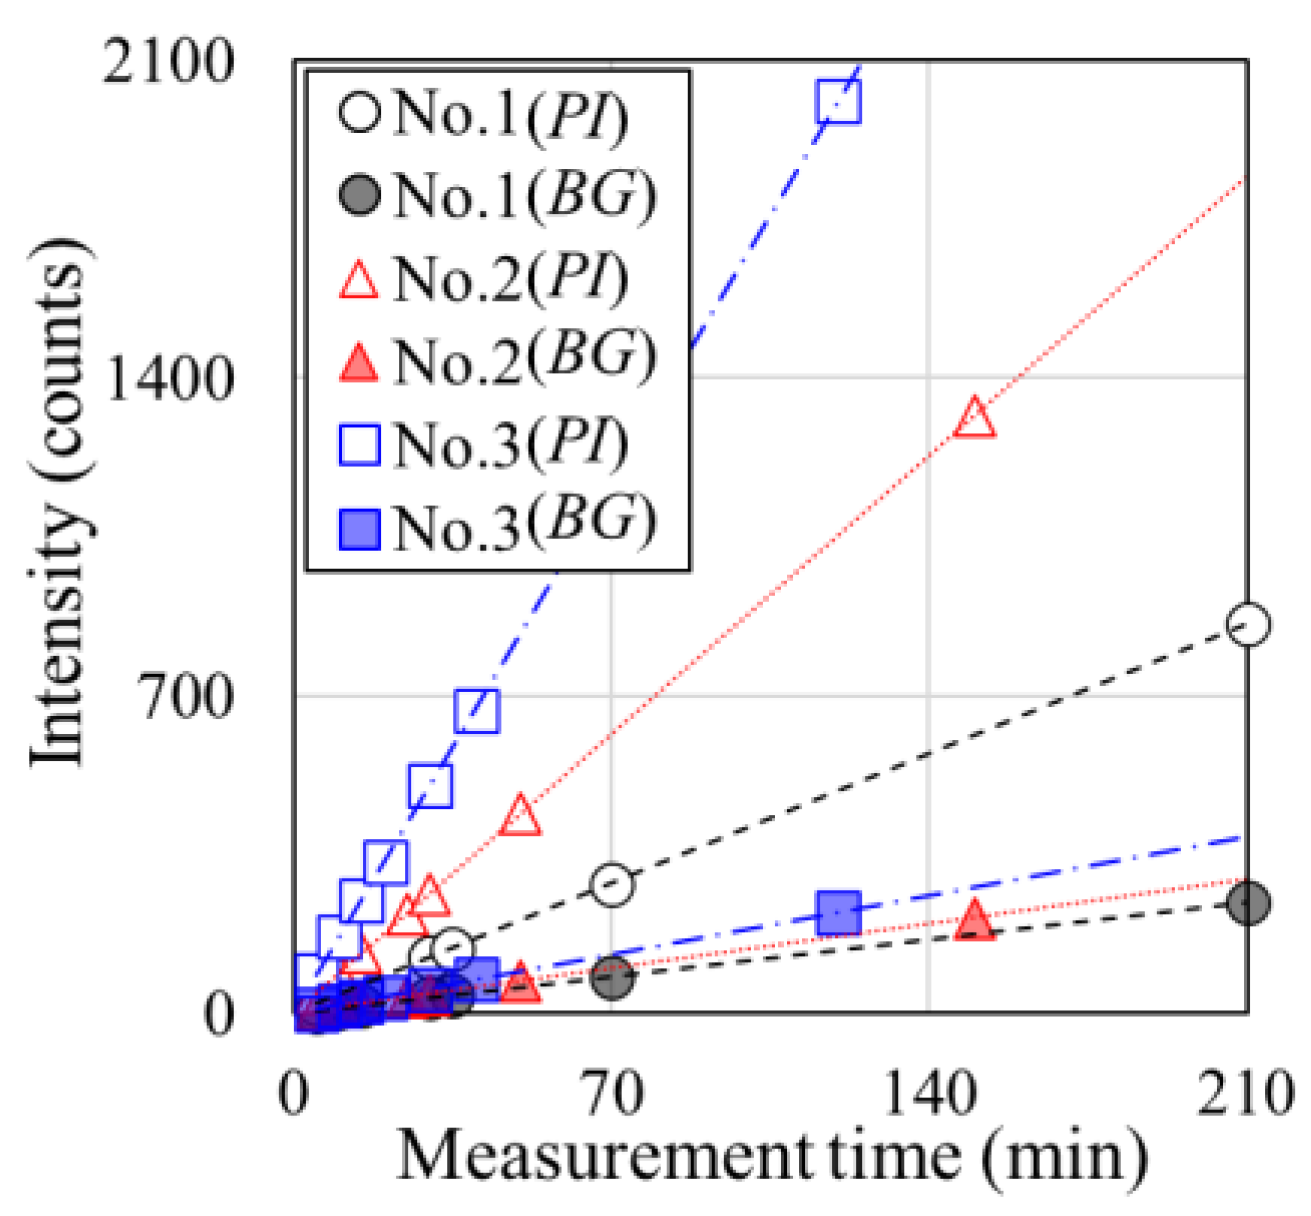
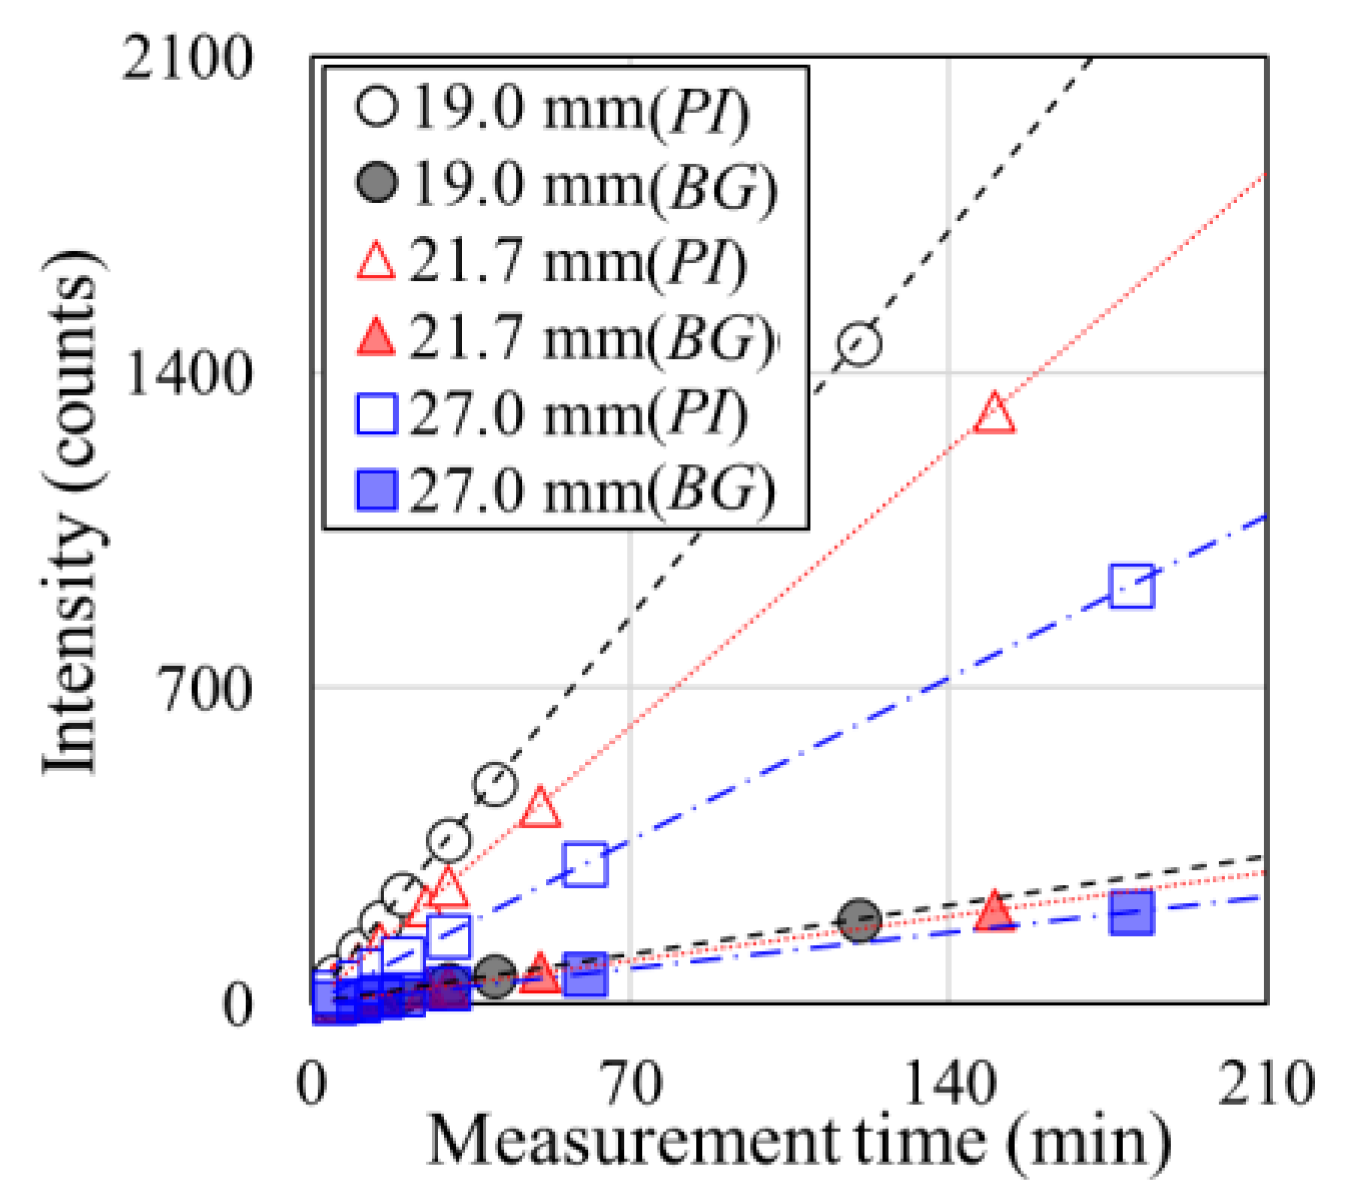
4.1. Effects of Different Factors on Diffraction Intensity

In reinforced concrete specimens, neutron attenuation occurs primarily because of the hardened cement in the concrete (CSH, Ca (OH)2, etc.) and water (H2O) in the voids. This is because the mass attenuation coefficient of neutrons is substantial for H atoms [9,13,14]. Therefore, in this experiment, the increase in diffraction intensity with measurement time was much more significant for specimen Nos. 3 and 4, where the amount of hardened cement in the neutron transmission path is small (as shown in Figure 7 and Figure 11).
For specimens constrained by aluminum sleeves, such as specimen Nos. 1 and 3, the drying of the concrete proceeds only from two sides: the loaded and free ends. This is because the aluminum pipe intercepts water loss during the drying process. Therefore, in specimen Nos. 1 and 3, the moisture content gradient is due to drying on the two sides. For this reason, differences in the diffraction intensities due to the measurement position were observed for specimen Nos. 1 and 3 (as shown in Figure 9).

4.2. Effect of Diffraction Intensity on Accuracy

The variations in the rebar stress with respect to the measurement time tend to be smaller at the measurement positions where the increase in intensity is significant, such as specimen No. 3 at the 10 mm measurement position in Figure 9c. In addition, as shown in Figure 9a, the variation in rebar stress with measurement time tends to be more significant for specimens with a smaller increase in intensity than for the other specimens. Therefore, the SD of the rebar stress was affected by its intensity at that measurement time. However, if the increase in BG is as significant as the increase in PI, the Gaussian distribution shown in Figure 3 is also expected to be unclear. Therefore, in this section, the relationship between the intensity of the difference between PI and BG (PIBG) and SD is discussed.
Figure 13 shows the relationship between PI−BG and SD for all the measurement points obtained in Section 3. The figure shows the approximation equation and the coefficient of determination for the power approximation. Figure 14 shows the same information with the results from a previous study [15] and without a concrete cover added (i.e., for the rebar-only). Figure 13 shows that the SD tends to decrease as PIBG increases, suggesting that the relationship between the two is unique. On the other hand, the SD in this analysis is calculated by assuming the result of the total measurement time to be the actual value (see Section 2.4). At a measurement position where the PIBG at the total measurement time is insufficient, there is concern that the reliability of the da measurement value itself, which is assumed to be the actual value, may decrease. Therefore, we examined the effect of the total PIBG on the power-approximation coefficient of determination.
Figure 15 shows the relationship between the range of PIBG at the total measurement time and the coefficient of determination. The figure shows that the coefficient of determination of the power approximation is stable when only measurement positions with PIBG > 600 counts at the total measurement time are analyzed. Kanematsu et al. [10] have previously reported that the measured stress shows a stable trend when PI > 700 counts, and a PI > 700 counts is equivalent to PIBG > 600 counts in this analysis. Therefore, it can be inferred that the SD at the measurement positions where PIBG at the total measurement time >600 counts is a reliable value in this analysis.
Figure 14 shows the relationship between PIBG and SD at the measurement position where the total PIBG > 600 counts. In addition, in a previous study [15], a specimen with the same cross-sectional shape as specimen No. 2 in this experiment was irradiated for a series of 36 measurements of 5 min each. Although the diffractometer, diffraction plane, slit size, and radial collimator are the same as in this experiment, the neutron wavelength in the previous study was 2.08 Å, which is >1.72 Å of this study. Figure 14 also shows the relationship between PIBG and SD obtained in the previous study [15]. In addition, the results of the measurement of the position without a concrete cover (rebar-only) in this experiment are also shown in the figure. The rebar-only measurements were performed 24 times for 1 min. The figure shows that the relationship between PIBG and SD is unique and that the coefficient of determination of the power approximation equation is high. In addition, the relationship between PIBG and SD for rebar-only, where the diffraction intensity and total PIBG are very high, shows a similar trend to the power approximation equation in Figure 14. This indicates that, under the same optical setup as in this experiment, the power approximation equation shown in Figure 14 is valid for reinforced concrete specimens under different conditions.
The relationship between PIBG and SD in the previous study [15] had a higher measurement accuracy than in this experiment at the same PIBG. It is inferred that the wavelength of the neutrons used in this experiment, λ, influences this. Focusing on Equation (1), it can be observed that as λ increases, the change in θ with respect to the change in d increases. Therefore, it can be inferred that in the previous study [15], λ is more significant than that in this experiment, and the measurement accuracy is better. This is because the change in θ was measured at a higher resolution. However, as shown in Equation (4), the slope of PIBG becomes more extensive because the energy is more significant when λ is small.
λ = 0.9045 U
where U is the energy (meV).

4.3. Measurement Accuracy Verification

Section 4.2 presented a unique relationship applicable under the same optical setup as that in this experiment. However, the equation in Figure 14 is expected to change when the optical setup, such as neutron wavelength, diffraction plane, slit size, and radial collimator width, is different. This equation is also expected to change when the target materials are different. Therefore, when applying the neutron diffraction method for rebar stress measurement, it is necessary to calculate the relationship between PIBG and SD for each optical setup and the material to be measured and to clarify the variation in rebar stress caused by the experiment.
Figure 16 shows an example of determining the measurement time for the rebar stress measurements. In this experiment, the relationship between the PIBG and SD was calculated mainly for positions with a concrete cover. However, as described in Section 4.2 above, similar measurement results can be obtained for the rebar-only measurement (as shown in Figure 14). The measurement time for the rebar-only measurement can be significantly reduced. This is because the diffraction intensity is exceptionally high compared with the concrete cover position. Therefore, in the procedure proposed in Figure 16, the accuracy was verified from the measurement results obtained for the rebar alone.
Following the procedure shown in the figure, the required measurement time was calculated from the allowable SD to ensure the accuracy and reliability of the measured rebar stress. Note that the value of PIBG of 600 counts or more, as shown in Figure 16, is based on the condition of this experiment; therefore, it is necessary to set an appropriate value on the safe side for applications.

5. Conclusions

This study examined the measurement accuracy of rebar stress obtained by the neutron diffraction method using reinforced concrete specimens under different conditions of continuous neutron irradiation for 5 min. The following findings were obtained from the neutron diffraction intensities and SDs of the rebar stress in this study:
  • The increase in diffraction intensity with increasing measurement time is more significant because of the installation of aluminum slits and decreasing cover thickness, resulting in decreased hardened cement and water contents in the neutron transmission path.
  • For specimens where the increase in diffraction intensity with an increase in measurement time is significant, the measurement accuracy tends to be high in short-time measurements.
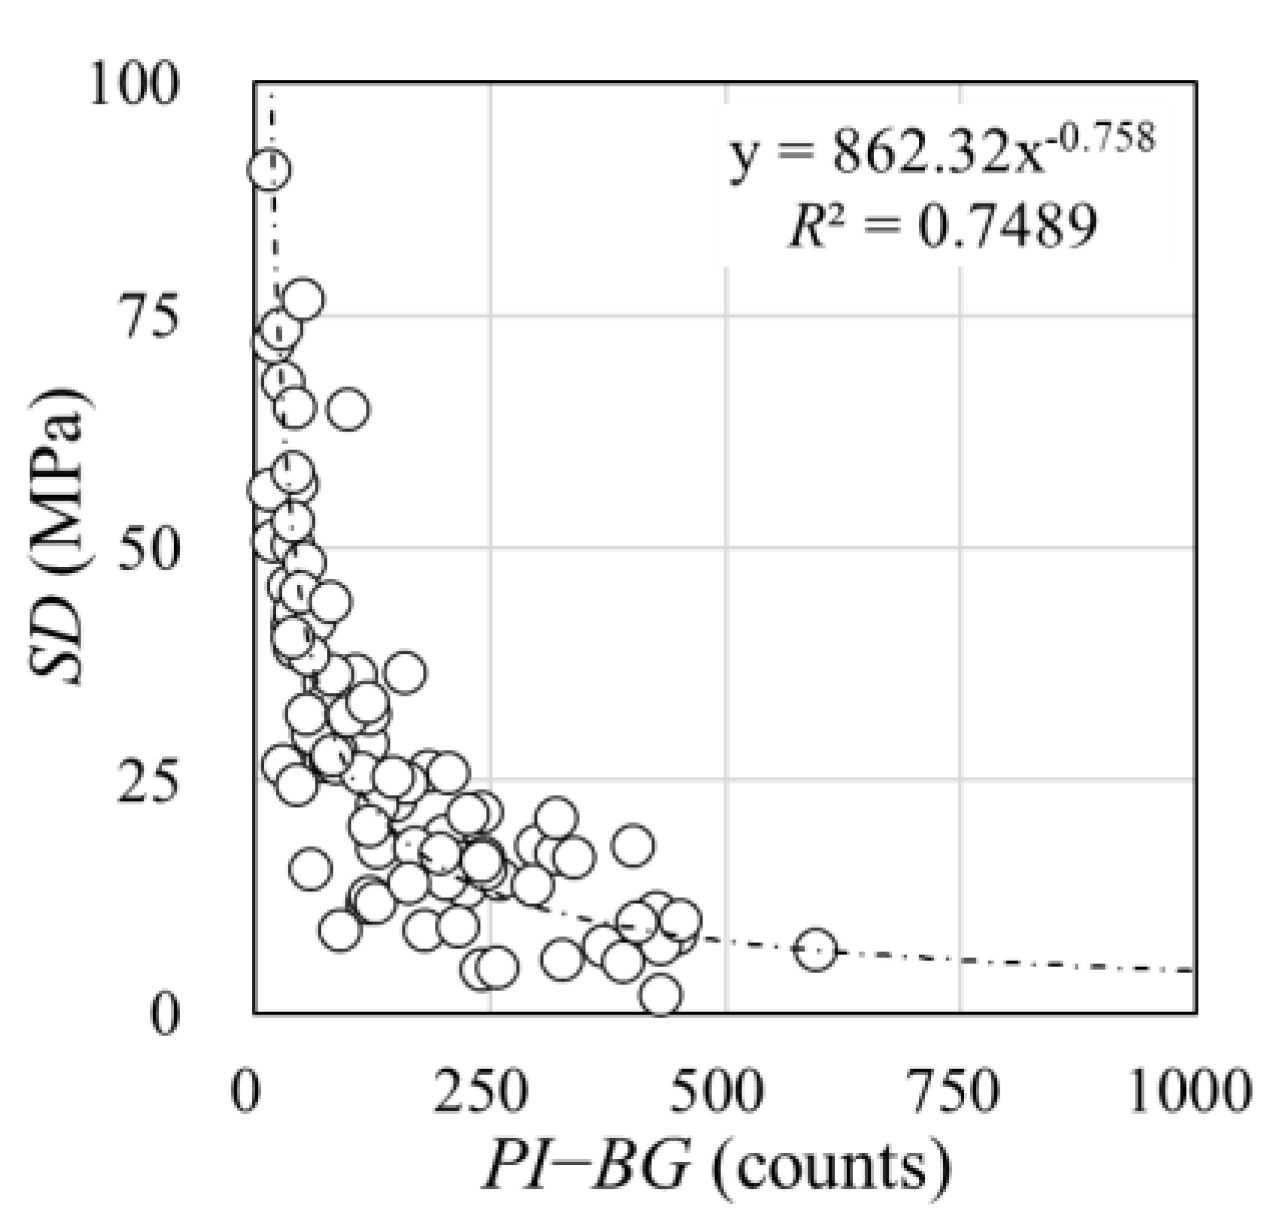
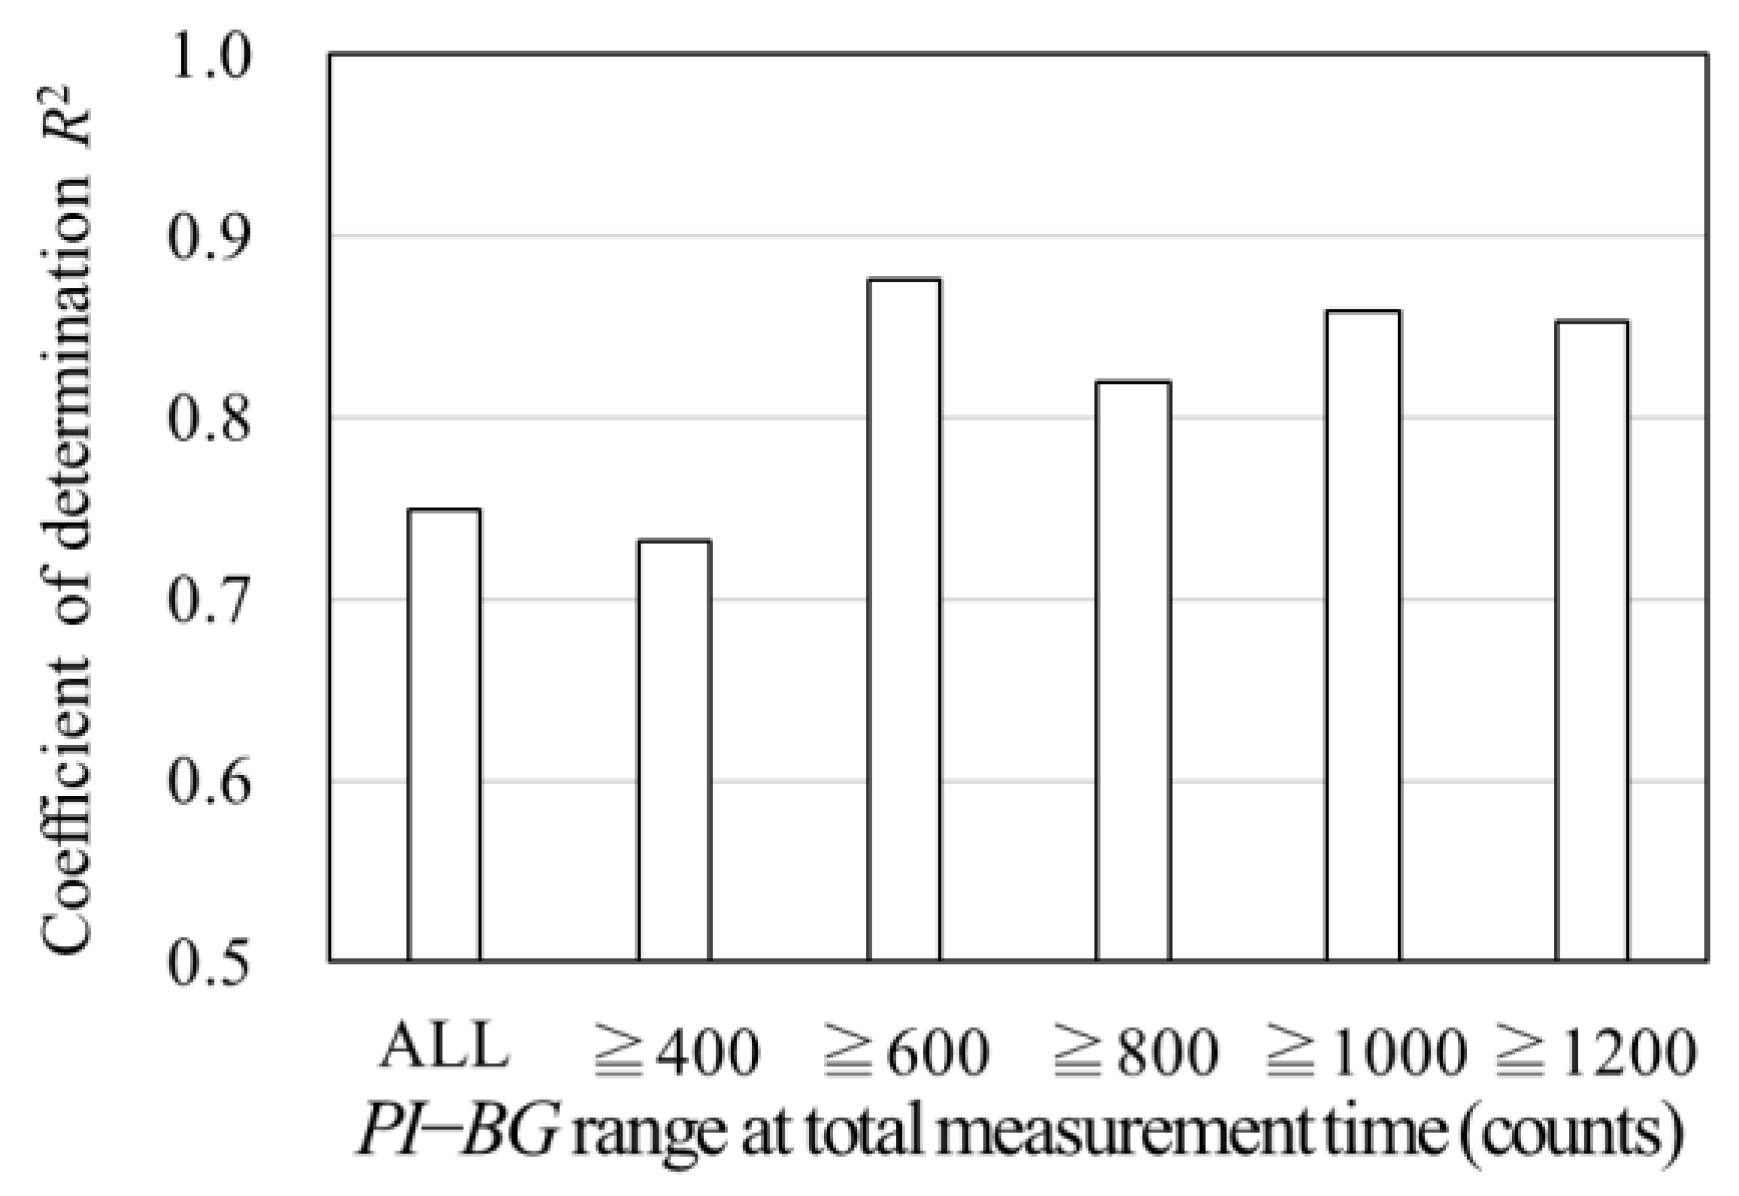
  • Under the conditions of this experiment, the analytical results tend to be stable when PIBG > 600 counts.
  • The SD of the rebar stress decreases as PIBG increases, and the relationship between the two values is expressed by a power approximation equation.
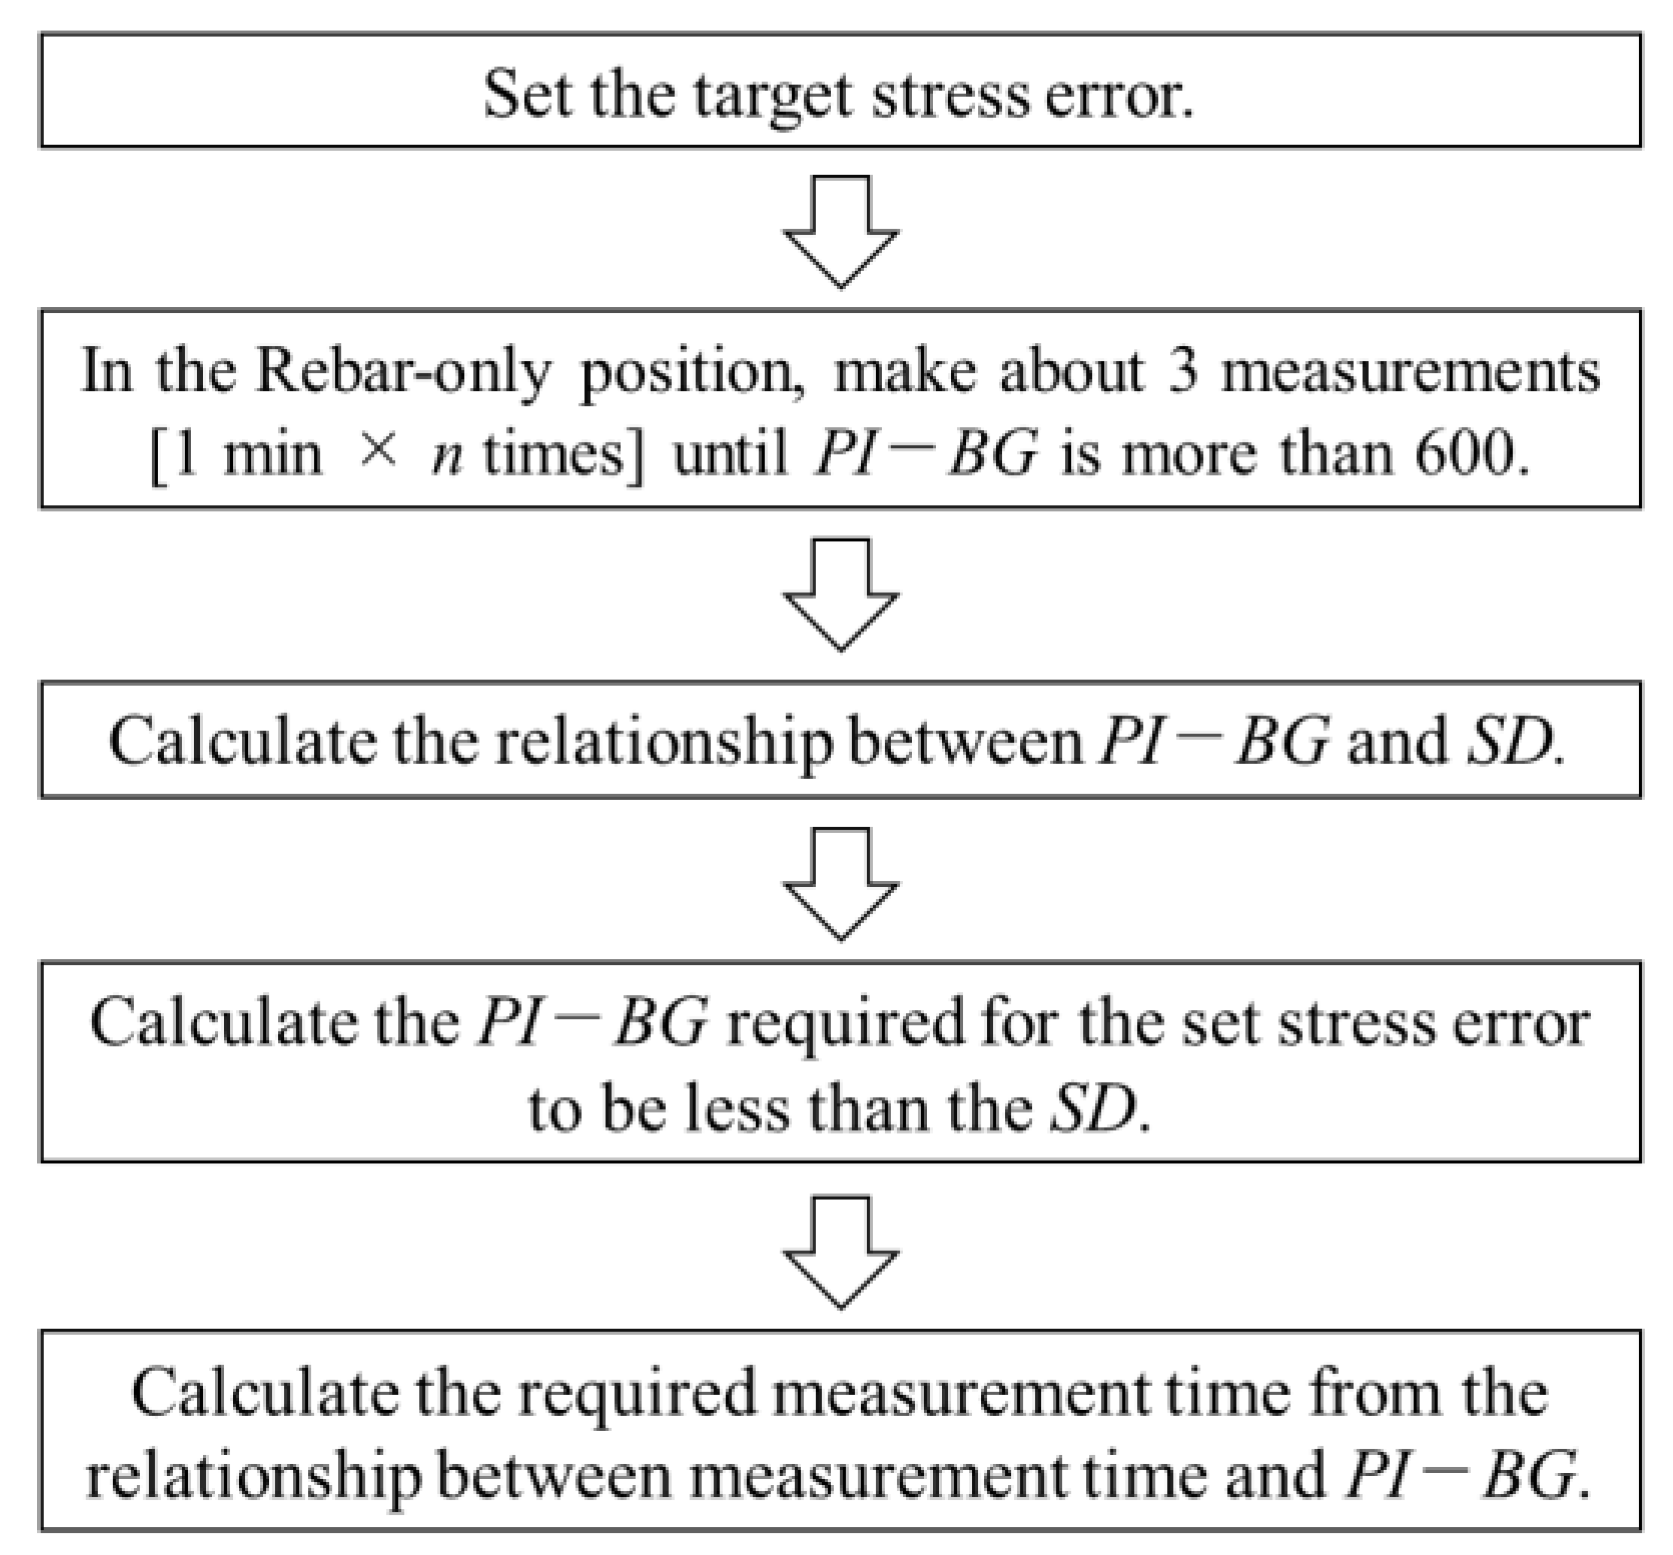
  • By calculating the required measurement time from the SD of the rebar stress following the procedure in Figure 16, it is possible to ensure the reproducibility and reliability of the rebar stress even for reinforced concrete specimens with different measurement conditions.

Author Contributions

Conceptualization, A.Y. and M.K. (Manabu Kanematsu); Investigation, A.Y. and S.M.; Methodology, A.Y., K.K. and M.K. (Manabu Kanematsu); Formal analysis, A.Y.; Project administration, A.Y. and M.K. (Manabu Kanematsu); Resources, A.Y., M.K. (Mayu Kawakami) and S.M.; Validation, A.Y. and S.M.; Supervision, M.K. (Manabu Kanematsu); Visualization, A.Y.; Writing—original draft, A.Y., J.K., Y.N. and M.K. (Manabu Kanematsu); Funding acquisition, Y.M., Y.N., T.M., S.M. and M.K. (Manabu Kanematsu). All authors have read and agreed to the published version of the manuscript.

Funding

This research was funded by JSPS KAKENHI, grant number JP20H02302.

Data Availability Statement

No new data were created or analyzed in this study. Data sharing is not applicable to this article.

Acknowledgments

This work was performed under the Shared Use Program of JAEA Facilities (Proposal No. I537).

Conflicts of Interest

The authors declare no conflict of interest.

References

  1. Nilson, A.H. Internal Measurement of Bond Slip. ACI J. Proc. 1972, 69, 439–441. [Google Scholar] [CrossRef]
  2. McHenry, D.E.; Walker, W.T. Laboratory Measurements of Stress Distribution in Reinforcing Steel. ACI J. Proc. 1948, 44, 1041–1054. [Google Scholar] [CrossRef]
  3. Shima, H.; Chou, L.L.; Okamura, H. Micro and Macro Models for Bond in Reinforced Concrete. J. Fac. Eng. Univ. Tokyo 1987, 39, 133–194. [Google Scholar]
  4. Suzuki, H.; Kanematsu, M.; Kusunoki, K. Neutron Diffraction Studies on Strain Evaluation of Rebar in Reinforced Concrete. Powder Diffr. 2009, 24, S68–S71. [Google Scholar] [CrossRef]
  5. Suzuki, H.; Kusunoki, K.; Hatanaka, Y.; Mukai, T.; Tasai, A.; Kanematsu, M.; Kabayama, K.; Harjo, S. Measuring Strain and Stress Distributions Along Rebar Embedded in Concrete Using Time-of-Flight Neutron Diffraction. Meas. Sci. Technol. 2014, 25, 025602. [Google Scholar] [CrossRef]
  6. Suzuki, H.; Kusunoki, K.; Kanematsu, M.; Tasai, A.; Hatanaka, Y.; Tsuchiya, N.; Bea, S.; Shiroishi, S.; Sakurai, S.; Kawasaki, T.; et al. Application of Neutron Stress Measurement to Reinforced Concrete Structure. In Proceedings of the 2nd International Symposium on Science at J-PARC, Ibaraki, Japan, 12–15 July 2014. [Google Scholar] [CrossRef]
  7. Suzuki, H.; Kusunoki, K.; Kanematsu, M.; Mukai, T.; Harjo, S. Structural Engineering Studies on Reinforced Concrete Structure Using Neutron Diffraction. In Proceedings of the International Conference on Residual Stresses (ICRS) 2016, Sydney, Australia, 3–7 July 2016. [Google Scholar] [CrossRef]
  8. Kobayashi, K.; Suzuki, H.; Nishio, Y.; Kanematsu, M. Evaluation of Bond Performance of Reinforced Concrete Using Hot-Dip Galvanized Rebar by Neutron Diffraction. J. Struct. Constr. Eng. AIJ 2021, 86, 1026–1035. (In Japanese) [Google Scholar] [CrossRef]
  9. Kusunoki, K.; Kabayama, K.; Mukai, T.; Hatanaka, Y. Experimental Study on Bonding Action with Neutron Measuring System. Proc. JCI 2009, 31, 619–624. Available online: https://data.jci-net.or.jp/data_pdf/31/031-01-2104.pdf (accessed on 8 February 2023). (In Japanese).
  10. Kanematsu, M.; Ota, T.; Suzuki, Y.; Noguchi, T. Neutron Diffraction Studies on Strain Evaluation of Rebar Around Cracks. Proc. JCI 2011, 33, 1853–1858. Available online: https://data.jci-net.or.jp/data_pdf/33/033-01-1303.pdf (accessed on 8 February 2023). (In Japanese).
  11. Lin, Y.; Leong, B.S.; Hu, Z.-T.; Yang, E.-H. Autoclaved Aerated Concrete Incorporating Waste Aluminum Dust as Foaming Agent. Constr. Build. Mater. 2017, 148, 140–147. [Google Scholar] [CrossRef]
  12. Tanaka, K.; Akiniwa, Y.; Hayashi, M. Neutron Diffraction Measurements of Residual Stresses in Engineering Materials and Components. Mater. Sci. Res. Int. 2002, 8, 165–174. [Google Scholar] [CrossRef] [PubMed]
  13. Kanematsu, M.; Maruyama, I.; Noguchi, T.; Tsuchiya, N. Quantification of Water Penetration into Concrete through Cracks by Neutron Radiography. Nucl. Instrum. Methods Phys. Res. Sect. A Accel. Spectrometers Detect. Assoc. Equip. 2009, 605, 154–158. [Google Scholar] [CrossRef]
  14. Perfect, E.; Cheng, C.-L.; Kang, M.; Bilheux, H.Z.; Lamanna, J.M.; Gragg, M.J.; Wright, D.M. Neutron Imaging of Hydrogen-Rich Fluids in Geomaterials and Engineered Porous Media: A review. Earth-Sci. Rev. 2014, 129, 120–135. [Google Scholar] [CrossRef]
  15. Kobayashi, K.; Yasue, A.; Kim, J.; Nishio, Y.; Miyazu, Y.; Mukai, T.; Kanematsu, M. The Effect on the Measurement Time of Neutron Diffraction Method on the Accuracy of Measuring Rebar Stress. In Proceedings of the Summaries of Technical Papers of Annual Meeting, AIJ, Materials and Construction, Hokkaido, Japan, 5–9 September 2022. (In Japanese). [Google Scholar]
Figure 1. Schematic diagram of the specimens and measurement positions.
Qubs 07 00015 g001
Figure 2. Schematic diagram of strain measurement of rebar by the RESA and loading equipment used in this experiment.
Qubs 07 00015 g002
Figure 3. Relation between diffraction angle and intensity.
Qubs 07 00015 g003
Figure 4. Image of the lattice strain variation in this experiment.
Qubs 07 00015 g004
Figure 5. Relation between measurement time and stress (σ = E·εerr), (No. 3, 10 mm).
Qubs 07 00015 g005
Figure 6. Relation between measurement time and SD: (a) specimen No. 1, 10 mm; and (b) specimen No. 3, 10 mm. SD stands for standard deviation and was calculated according to Section 2.4.1.
Qubs 07 00015 g006
Figure 7. Measurement time and intensity in Series 1 (cross-sectional shape).
Qubs 07 00015 g007
Figure 8. Measurement time and SD in Series 1 (cross-sectional shape).
Qubs 07 00015 g008
Figure 9. Measurement time and intensity in Series 2 (measurement position): specimens (a) No. 1, (b) No. 2, and (c) No. 3.
Qubs 07 00015 g009
Figure 10. Measurement time and SD in Series 2 (measurement position): specimens (a) No. 1, (b) No. 2, and (c) No. 3.
Qubs 07 00015 g010
Figure 11. Measurement time and intensity in Series 3 (cover thickness).
Qubs 07 00015 g011
Figure 12. Measurement time and SD in Series 3 (cover thickness).
Qubs 07 00015 g012
Figure 13. Relation between PIBG and SD (All measurement positions).
Qubs 07 00015 g013
Figure 14. Relation between SD and PIBG (total PIBG ≥ 600 counts).
Qubs 07 00015 g014
Figure 15. Relation between R2 and the PIBG range.
Qubs 07 00015 g015
Figure 16. Method of determining measurement time (as shown in Figure 7, Figure 9, Figure 11, and Figure 14).
Qubs 07 00015 g016
Table 1. Concrete materials used in this study.
MaterialsTypes and Properties
Water (W)Deionized water
Cement (C)High early-strength Portland cement. Density: 3.14 g/cm3
Fine aggregate (S)Land sand from the Oi river. Absolute dry density: 2.58 g/cm3
Coarse aggregate (G)Crushed stone from Ome. Maximum particle size: 10 mm
Absolute dry density: 2.66 g/cm3
Chemical admixture (Ad)Lignin sulfonate, oxycarboxylate, and polycarboxylic acid compounds
Table 2. Concrete mix proportions and properties.
W/C
(%)
Unit Weight (kg/m3)Ad (g)Slump *
(cm)
Air
(%)
fc (Test Day *)
(MPa)
Ec (Test Day *)
(GPa)
fc (28 Days *)
(MPa)
WCSG
60175294850950C × 1.7%19.64.739.423.841.1
* “Slump” is a parameter of the consistency of the concrete and was measured in accordance with JIS (Japanese Industrial Standards) A 1101 “Method of test for slump of concrete”. * “Test day” is the day of the experiment of the neutron diffraction method. * “28 days” means that it is cured for 28 days under standard curing conditions.
Table 3. Experimental parameters.
SeriesParameters
Series 1: Cross-sectional shape of the neutron pathNo. 1, No. 2, No. 3 (as shown in Figure 1.)
Series 2: Measurement position (mm) (No. 1, No. 2, No. 3)10, 40, 70, 100, 130 (as shown in Figure 1.)
Series 3: Cover thickness (mm)19.0 (No. 4), 21.5 (No. 2), 27.0 (No. 5)
Table 4. Total measurement time.
Specimen No.Measurement Time (min)
No. 1210 (5 × 42 times) [10, 40, 70, 100 mm]
No. 2150 (5 × 30 times) [10, 40, 70, 100, 130 mm]
No. 3120 (5 × 24 times) [10, 40, 70, 100, 130 mm]
No. 4120 (5 × 24 times) [10 mm]
No. 5180 (5 × 36 times) [10 mm]
The value in [ ] indicates the measurement position.
Disclaimer/Publisher’s Note: The statements, opinions and data contained in all publications are solely those of the individual author(s) and contributor(s) and not of MDPI and/or the editor(s). MDPI and/or the editor(s) disclaim responsibility for any injury to people or property resulting from any ideas, methods, instructions or products referred to in the content.

