Article

Relationship between Internal Stress Distribution and Microstructure in a Suspension-Sprayed Thermal Barrier Coating with a Columnar Structure

1
Graduate School of Engineering, Chiba University, Chiba 263-8522, Japan
2
Graduate School of Science and Engineering, Chiba University, Chiba 263-8522, Japan
3
Faculty of Education, Niigata University, Niigata 950-2181, Japan
4
Research Center for Materials Science, Nuclear Science Research Division, Japan Atomic Energy Agency, Sayo 679-5148, Japan
5
Diffraction and Scattering Promotion Office, Japan Synchrotron Radiation Research Institute, Sayo 679-5148, Japan
*
Author to whom correspondence should be addressed.
Quantum Beam Sci. 2023, 7(2), 14; https://doi.org/10.3390/qubs7020014
Submission received: 11 February 2023 / Revised: 20 March 2023 / Accepted: 21 March 2023 / Published: 3 May 2023

Abstract

:
The suspension plasma spray (SPS) method is expected to become a novel coating method because it can achieve various microstructures using a suspension with submicron spray particles. Thermal barrier coatings (TBCs) with a columnar structure, which might achieve high strain tolerance, can be obtained using the SPS technique. This study evaluated the internal stress distribution of the suspension-plasma-sprayed thermal barrier coating (SPS-TBC) with different columnar structures using hybrid measurement using high-energy synchrotron X-ray diffraction analysis and laboratory low-energy X-rays. The relationship between the microstructure and the internal stress distribution of the SPS-TBC was discussed on the basis of the experimental results. In addition, the in-plane internal stress was decreased by decreasing the column diameter. The thin columnar microstructure of the SPS-TBC has superior strain tolerance. The internal stresses in the SPS-TBC are periodic decrements caused by stress relaxation in porous layers in its column.

1. Introduction

Thermal barrier coatings (TBCs) have been widely applied to blades and vanes in hot section components of land-based gas turbines and aero engines because the turbine inlet temperature of the operating gas reaches 1600 °C or higher to achieve high efficiency [1,2,3,4]. The typical TBCs are composed of the yttria-stabilized zirconia type ceramic top coat to insulate against heat conduction and an oxidation-resistant metallic bond coating containing Co, Ni, Cr, Al, Y, etc. In general, the atmospheric plasma spray (APS) technique has been used as a coating method for the TBC top coat of land-based gas turbines. During the APS process, the spray powders with tens of micrometers are deposited onto the bond coat surface as melted or half-melted by the plasma flame of a spray gun. The deposited lamellar microstructure of APS-TBCs with many inter-splat pores has a good heat-shielding effect. However, because APS-TBC has relatively low strain tolerance, its thermal cycle fatigue resistance is inferior to the electric beam physical vapor-deposited (EB-PVD) TBC with a columnar structure. Many studies have been conducted for the durability [5,6,7] and mechanical properties [8,9,10] of APS-TBCs and EB-PVD TBCs. APS-TBCs have a lamellar microstructure, including pores and low thermal conductivity [11]. On the other hand, EB-PVD TBCs have a columnar structure with excellent thermal stress relaxation proper-ties; however, they are not suitable for large components because of their coating process in vacuums [12].
The importance of renewable energy systems, represented by solar and wind power generation systems, has recently increased to achieve a low carbon emission society. However, the supply capacity of such renewable energy systems is sensitive to the season’s conditions and weather. For example, the short-time power fluctuation in the solar power generation system reaches 25% of total capacity. Hence, other power generation systems are needed as back-up suppliers. The land-based gas turbines are excellent as a supply–demand adjustment generation system to absorb the fluctuation of renewable energy systems because of their superb bootability and high flexibility [13]. However, the hot section components in supply–demand adjustment gas turbine systems, such as turbine blades and vane, are exposed to more severe service conditions. In such cases, TBCs must have low thermal conductivity as an APS-TBC and excellent thermal shock resistance as an EB-PVD TBC. The suspension plasma spray (SPS) technique is expected to be a novel coating method that can produce various microstructures, such as dense, porous, columnar coatings, etc., because of its ability to control a coated microstructure using a suspension of submicron-sized fine powder [14,15,16,17,18,19,20,21,22,23]. Many recent efforts have been made to research microstructure control [16,17,18], thermal properties [18,19], damage morphologies [17,19,21], etc., in the suspension-plasma-sprayed thermal barrier coatings (SPS-TBCs). The authors experimentally demonstrated that TBCs with a cauliflower-like columnar microstructure deposited by the SPS technique exhibit high thermal cycle fatigue resistance compared with the conventional APS-TBC [24]. In addition, they revealed the effect of the microstructure of the SPS-TBC with a cauliflower-like columnar micro-structure on thermal cycle fatigue lives, that is, the fine columnar structure has higher resistance to thermal cycle fatigue [25].
Turbine blades and vanes with TBC are subjected to complex and cyclic internal stress during the operation because of the thermal coefficient mismatch between the top coat as well as the substrate and thermally grown oxide generated at the interface between the top coat and bond coat; consequently, the thermal cycle damage, such as the delamination, and cracking of the top coat, occurs [25,26]. Therefore, internal stress measurements have been conducted in the TBC system using X-rays [9,27,28]. One of the authors developed a hybrid method by using high-energy X-rays from synchrotron radiation of which the penetration depth from the surface is more profound than 10 μm and low-energy X-rays with a shallow penetration of less than 1 μm and measured the internal stress distribution in APS-TBCs and EB-PVD TBCs by using the hybrid method [29,30,31]. Knipe et al. investigated the in situ measurement of strain response in EB-PVD TBC with a columnar structure under the thermal gradient using a high-energy synchrotron X-ray [32]. However, no investigation has been conducted to evaluate the internal stress distribution in SPS-TBCs with a cauliflower-like microstructure.
This study evaluated the internal stress distribution of the SPS-TBC with different columnar structures using hybrid measurement using high-energy synchrotron X-ray diffraction analysis and laboratory low-energy X-rays. Furthermore, the relationship between the microstructure and the internal stress distribution of the SPS-TBC was discussed on the basis of the experimental results.

2. Experimental Procedures

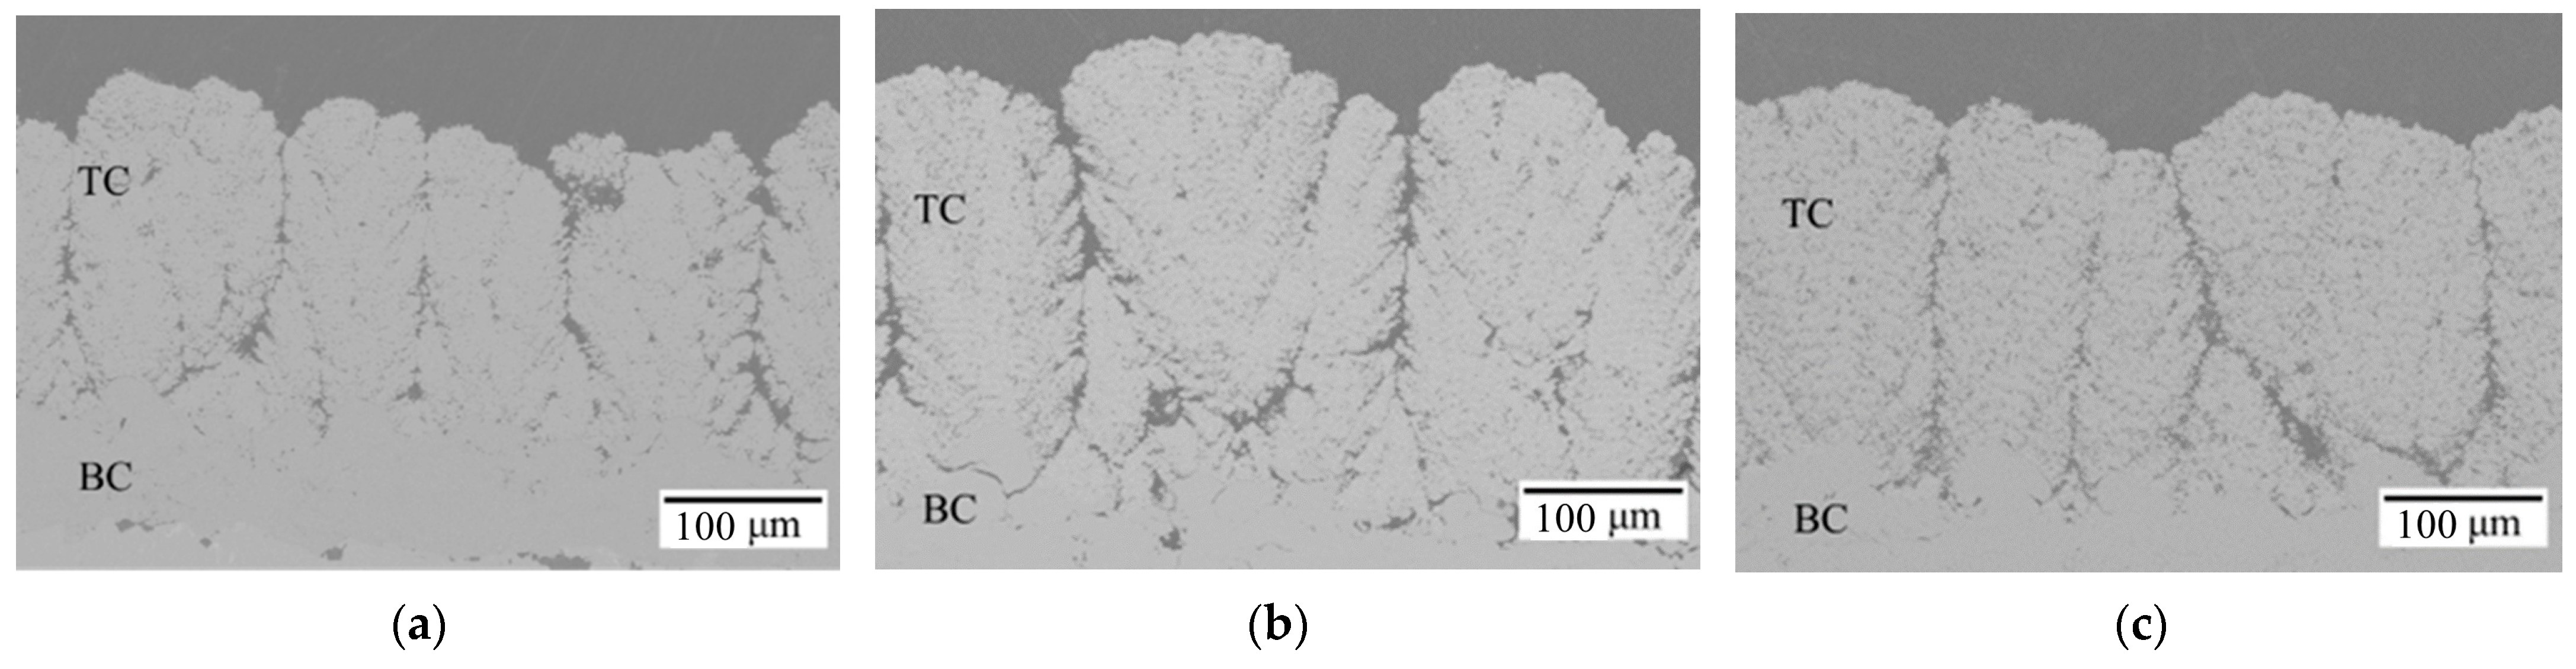
2.1. Materials and Specimen Preparation

In this study, eight weight present yttria-stabilized zirconia (8YSZ) were used as the ceramic thermal insulate top coat. Three types of specimens with a ceramic top coat containing columns with different diameters were prepared using the suspension plasma spray technique. Each type of specimen was denoted as SPS-F, SPS-B, and SPS-C specimens, respectively. Zhou et al. reported that the spray surface condition (the metallic bond coat surface) could control the column structure of the SPS-TBC [33]. In this study, however, the suspension feedstock supply rate during the suspension plasma spray process was controlled to change the microstructure of the samples; the suspension feedstock rate was increased in the order of SPS-C > SPS-B > SPS-F (the bond coat surface in each specimen was in the same condition, and the stand-off distance was 70 mm in fixed).
The conventional polycrystalline Ni-base superalloy IN738LC was utilized as the substrate material. The preparation method of substrate specimens was as follows. First, the disk specimens with 1.2 mm thickness were cut from a round bar of IN738LC by wire electric discharge machining. After the electrical cutting process, the machining heat-affected zone on the spray surface of the substrate specimen was removed by mechanical polishing. The final geometry of the substrate specimen was 1 mm in thickness and 20 mm in diameter. The CoNiCrAlY bond coat was sprayed on the substrate disk using the high-velocity oxide fuel (HVOF) technique with JP-5000 as a spray torch. The bond coat thickness was approximately 100 μm. The suspension with fine 8YSZ spray particles with sub-micrometer diameters was sprayed on the bond coat surface using a plasma spray torch (100HE). The top coat of all type specimens had a thickness of approximately 200 μm. The spray conditions of the top coat and bond coat are listed in Table 1.
The cross-sectional microstructures of the specimens are shown in Figure 1. The top coat of each specimen has a columnar structure with different column diameters. The laminated structure consistent with dense and porous layers can be observed in the column (the details are shown later). The column diameter of each specimen, d, was represented by their diameter at the half TC thickness from the results of SEM observations. The column diameter, d, of the SPS-F, SPS-B, and SPS-C specimens were approximately 100, 120, and 180 μm, respectively.
All specimens were pre-thermally exposed before the X-ray analysis using a muffle furnace at 1000 °C for 300 h. The pre-thermal exposure aimed to generate a TGO layer at the interface between the top coat and the bond coat and to apply the in-plane biaxial tensile loading in the top coat. In this study, the in-plane biaxial tensile loading in the top coat was applied by using the deformation of the substrate caused by the pre-thermal exposure. Figure 2 shows the results of the substrate surface profile of the specimen (after removing the top coat by polishing) measured from the cross-sectional image before and after the pre-thermal exposure. As shown in Figure 2, the specimen was deformed convexly after the pre-thermal exposure. Consequently, the in-plane tensile load in the top coat was applied. By using elastic finite analysis, the in-plane strain at the top-coat/bond-coat interface caused by substrate deformation was estimated to be 0.12% in tension. Therefore, substrate deformation during the pre-thermal exposure occurred because of the release of residual stress in the substrate and bond coat, which was induced by bond coat spraying and shot blasting on the substrate surface [34].
After pre-thermal exposure, the top coat surface was polished by using diamond paste with a diameter of 9, 3, and 1 μm to prepare the top coat thickness to 100 μm. In this study, the original TC thickness after the suspension plasma spray process, in other words, the distance between the original TC surface and the TC/BC interface, was measured from the difference in the thickness of each specimen before and after the TC spray. The TC thickness of each specimen was controlled by the removed thickness by polishing from the original TC surface before the X-ray analysis.

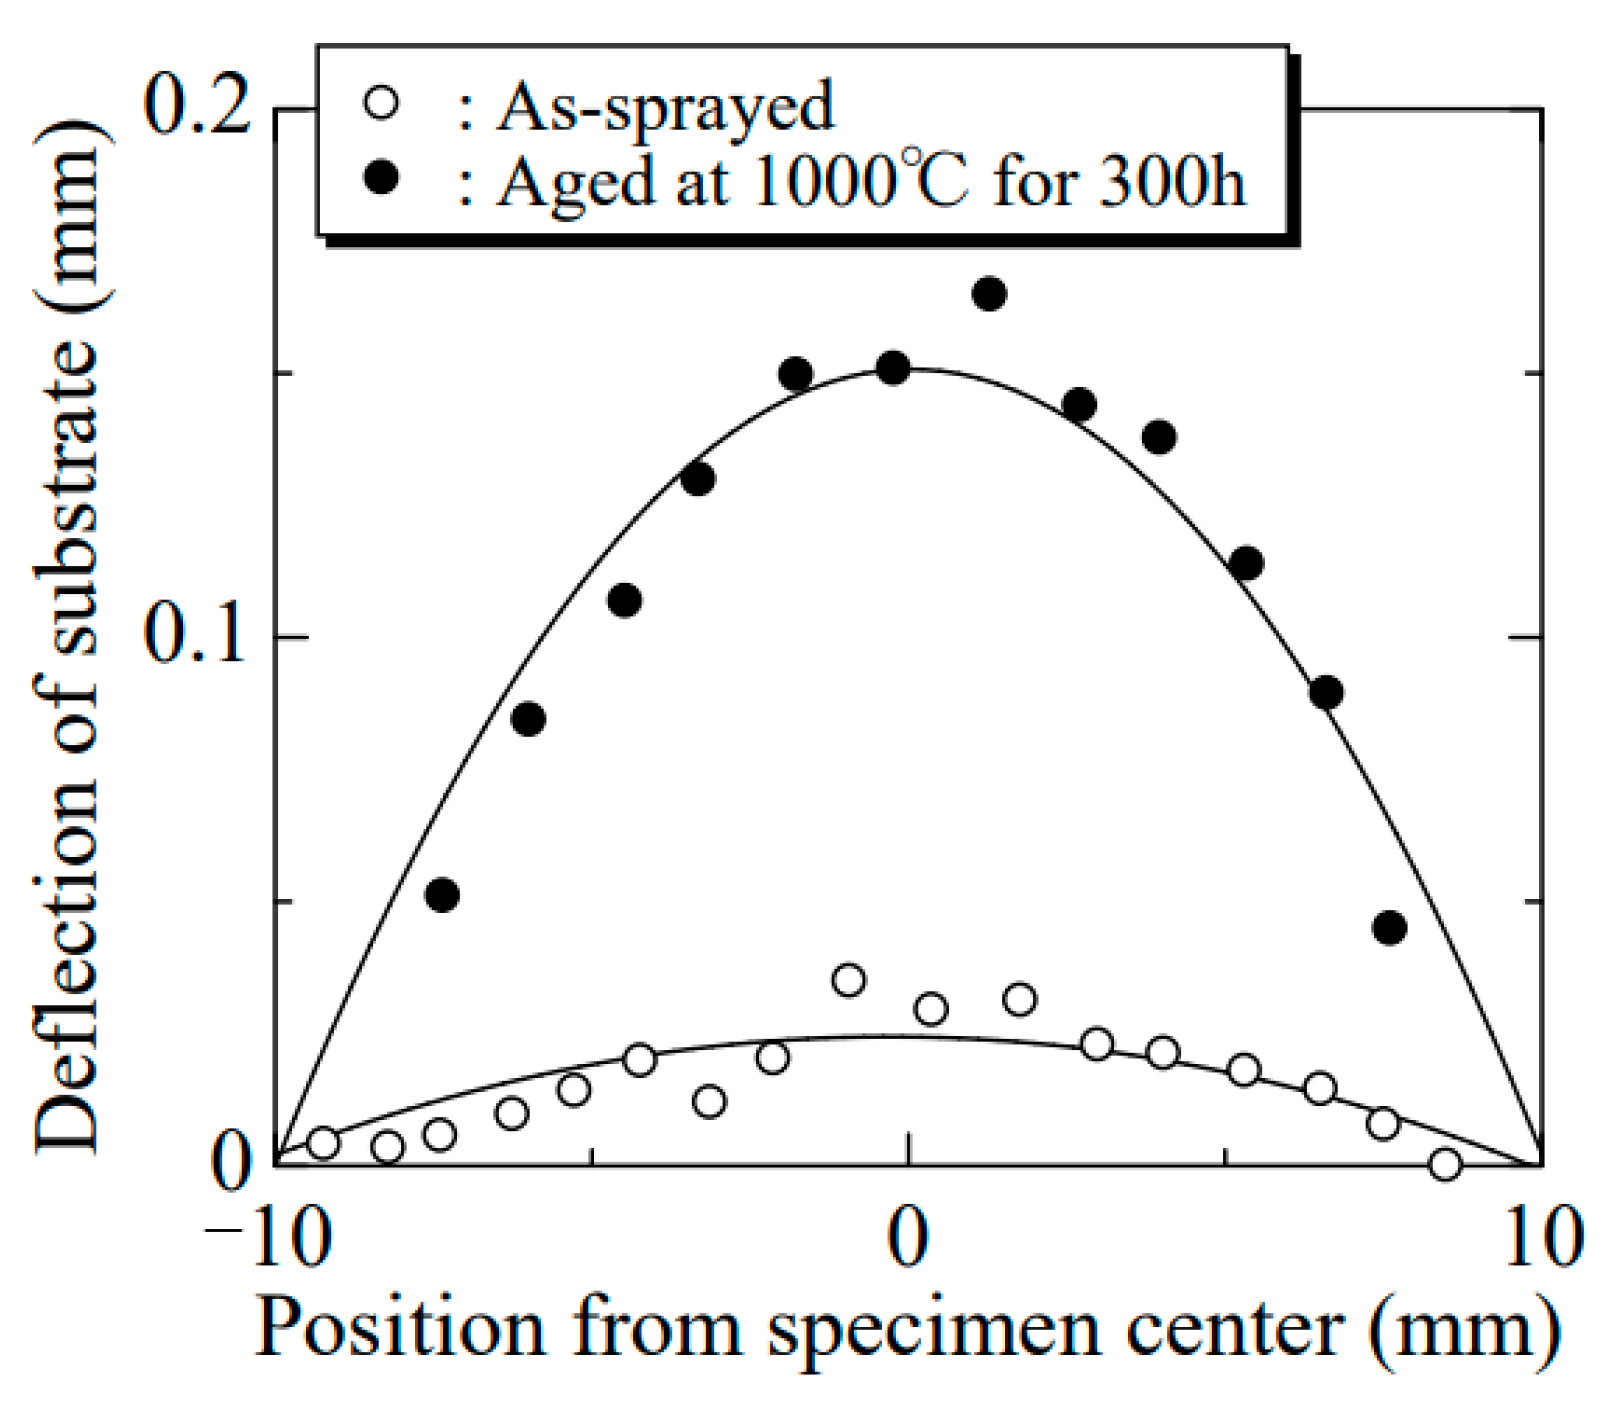
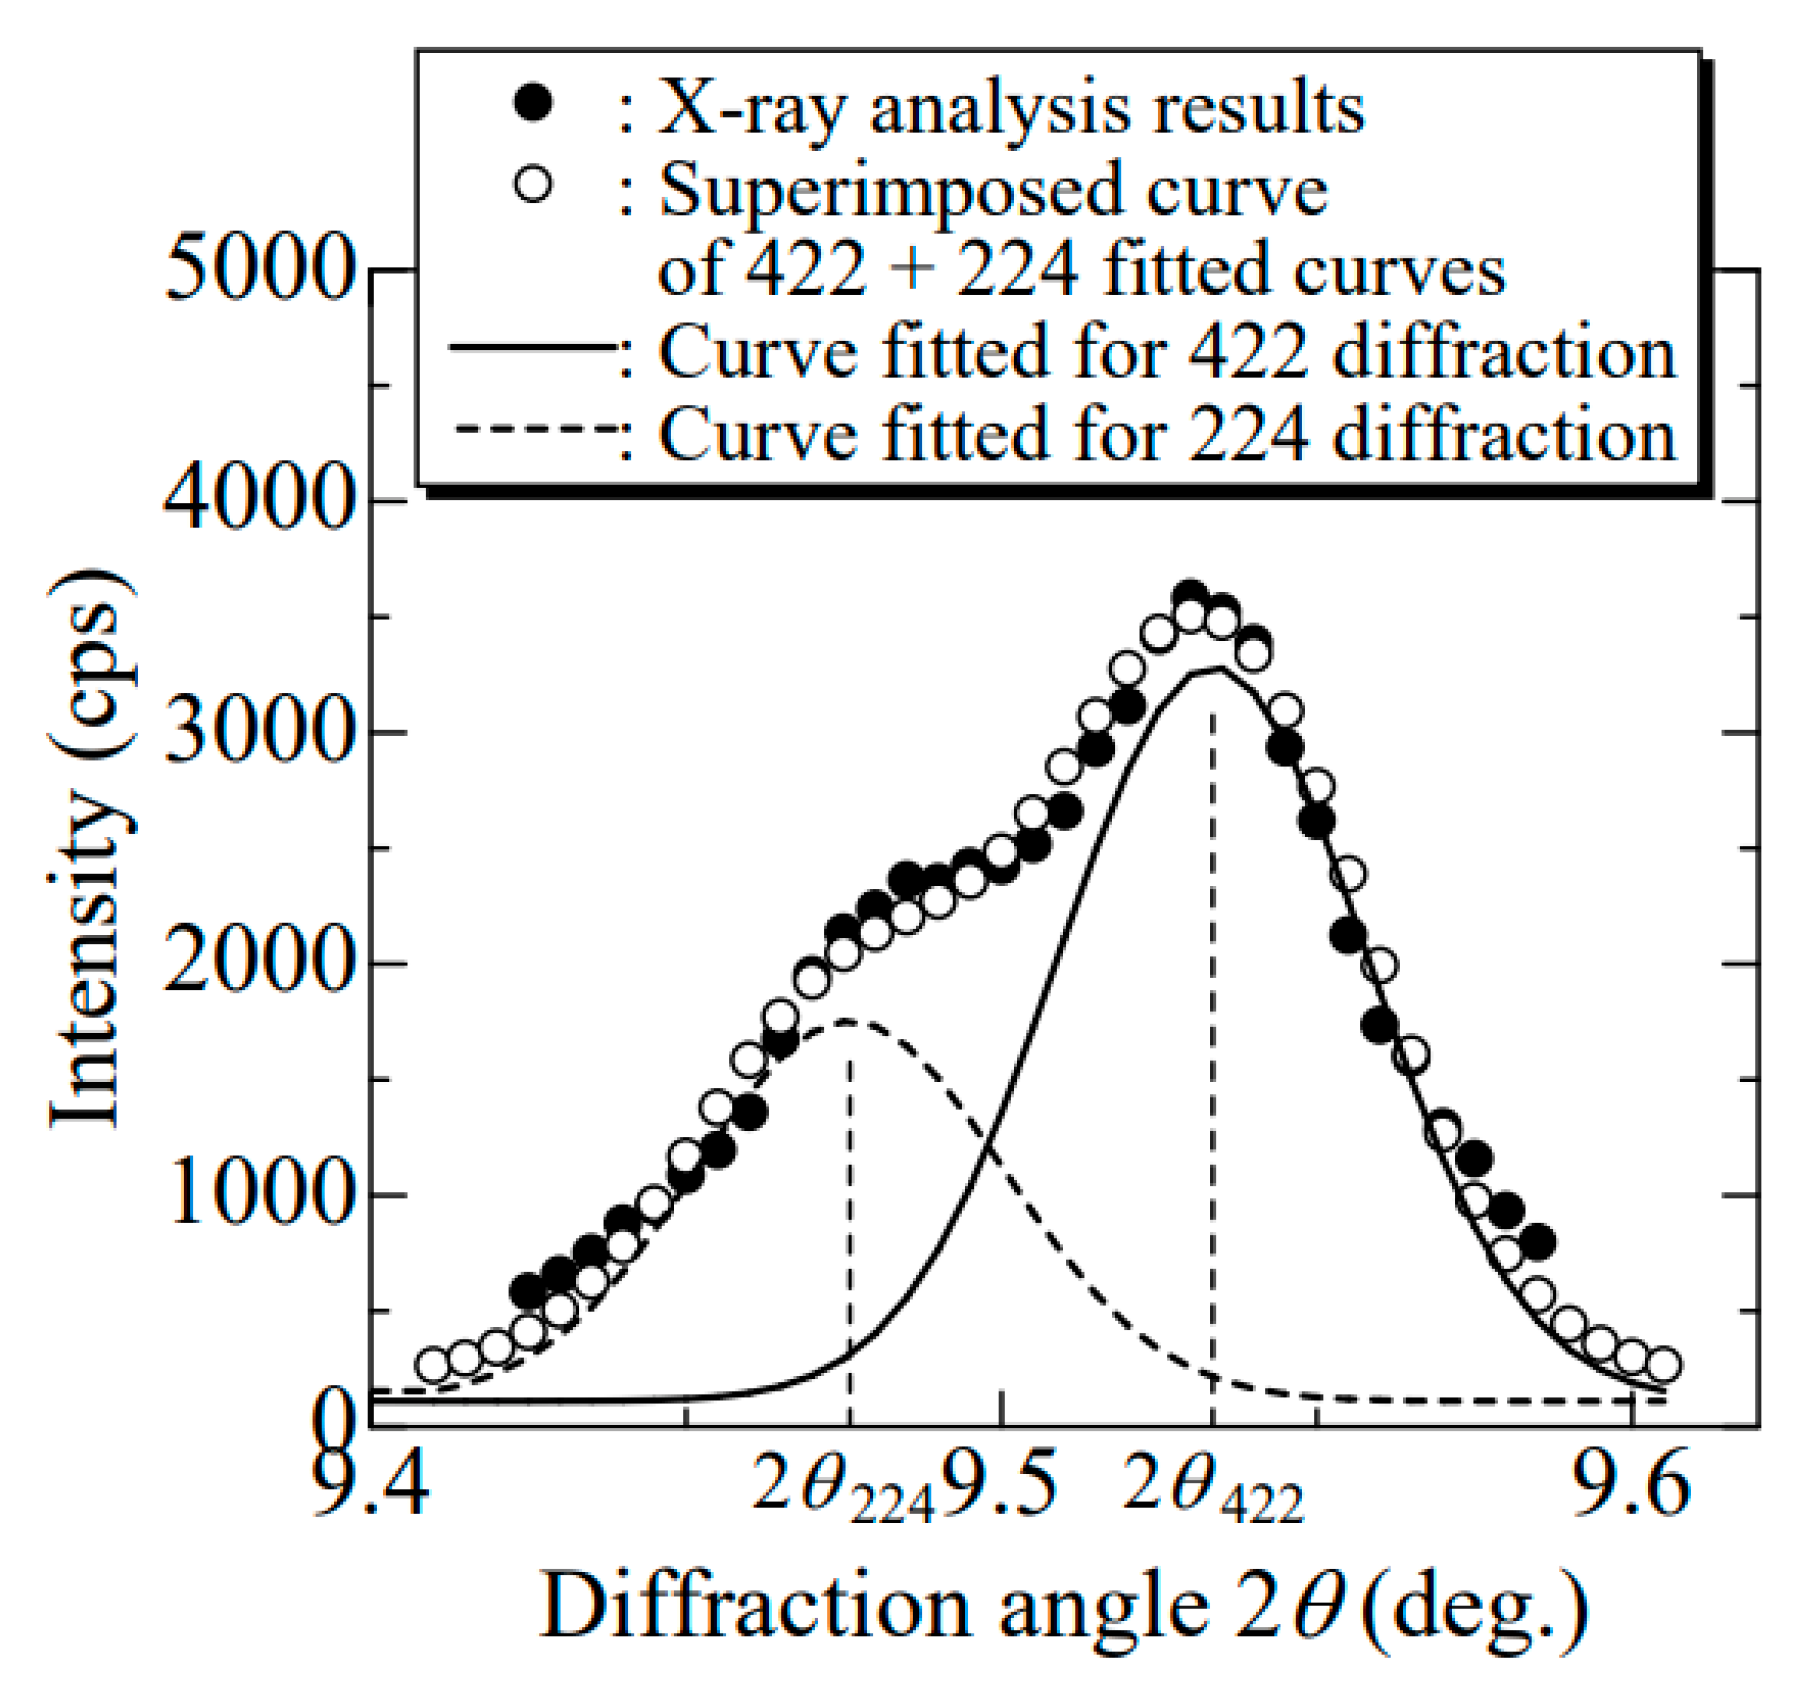
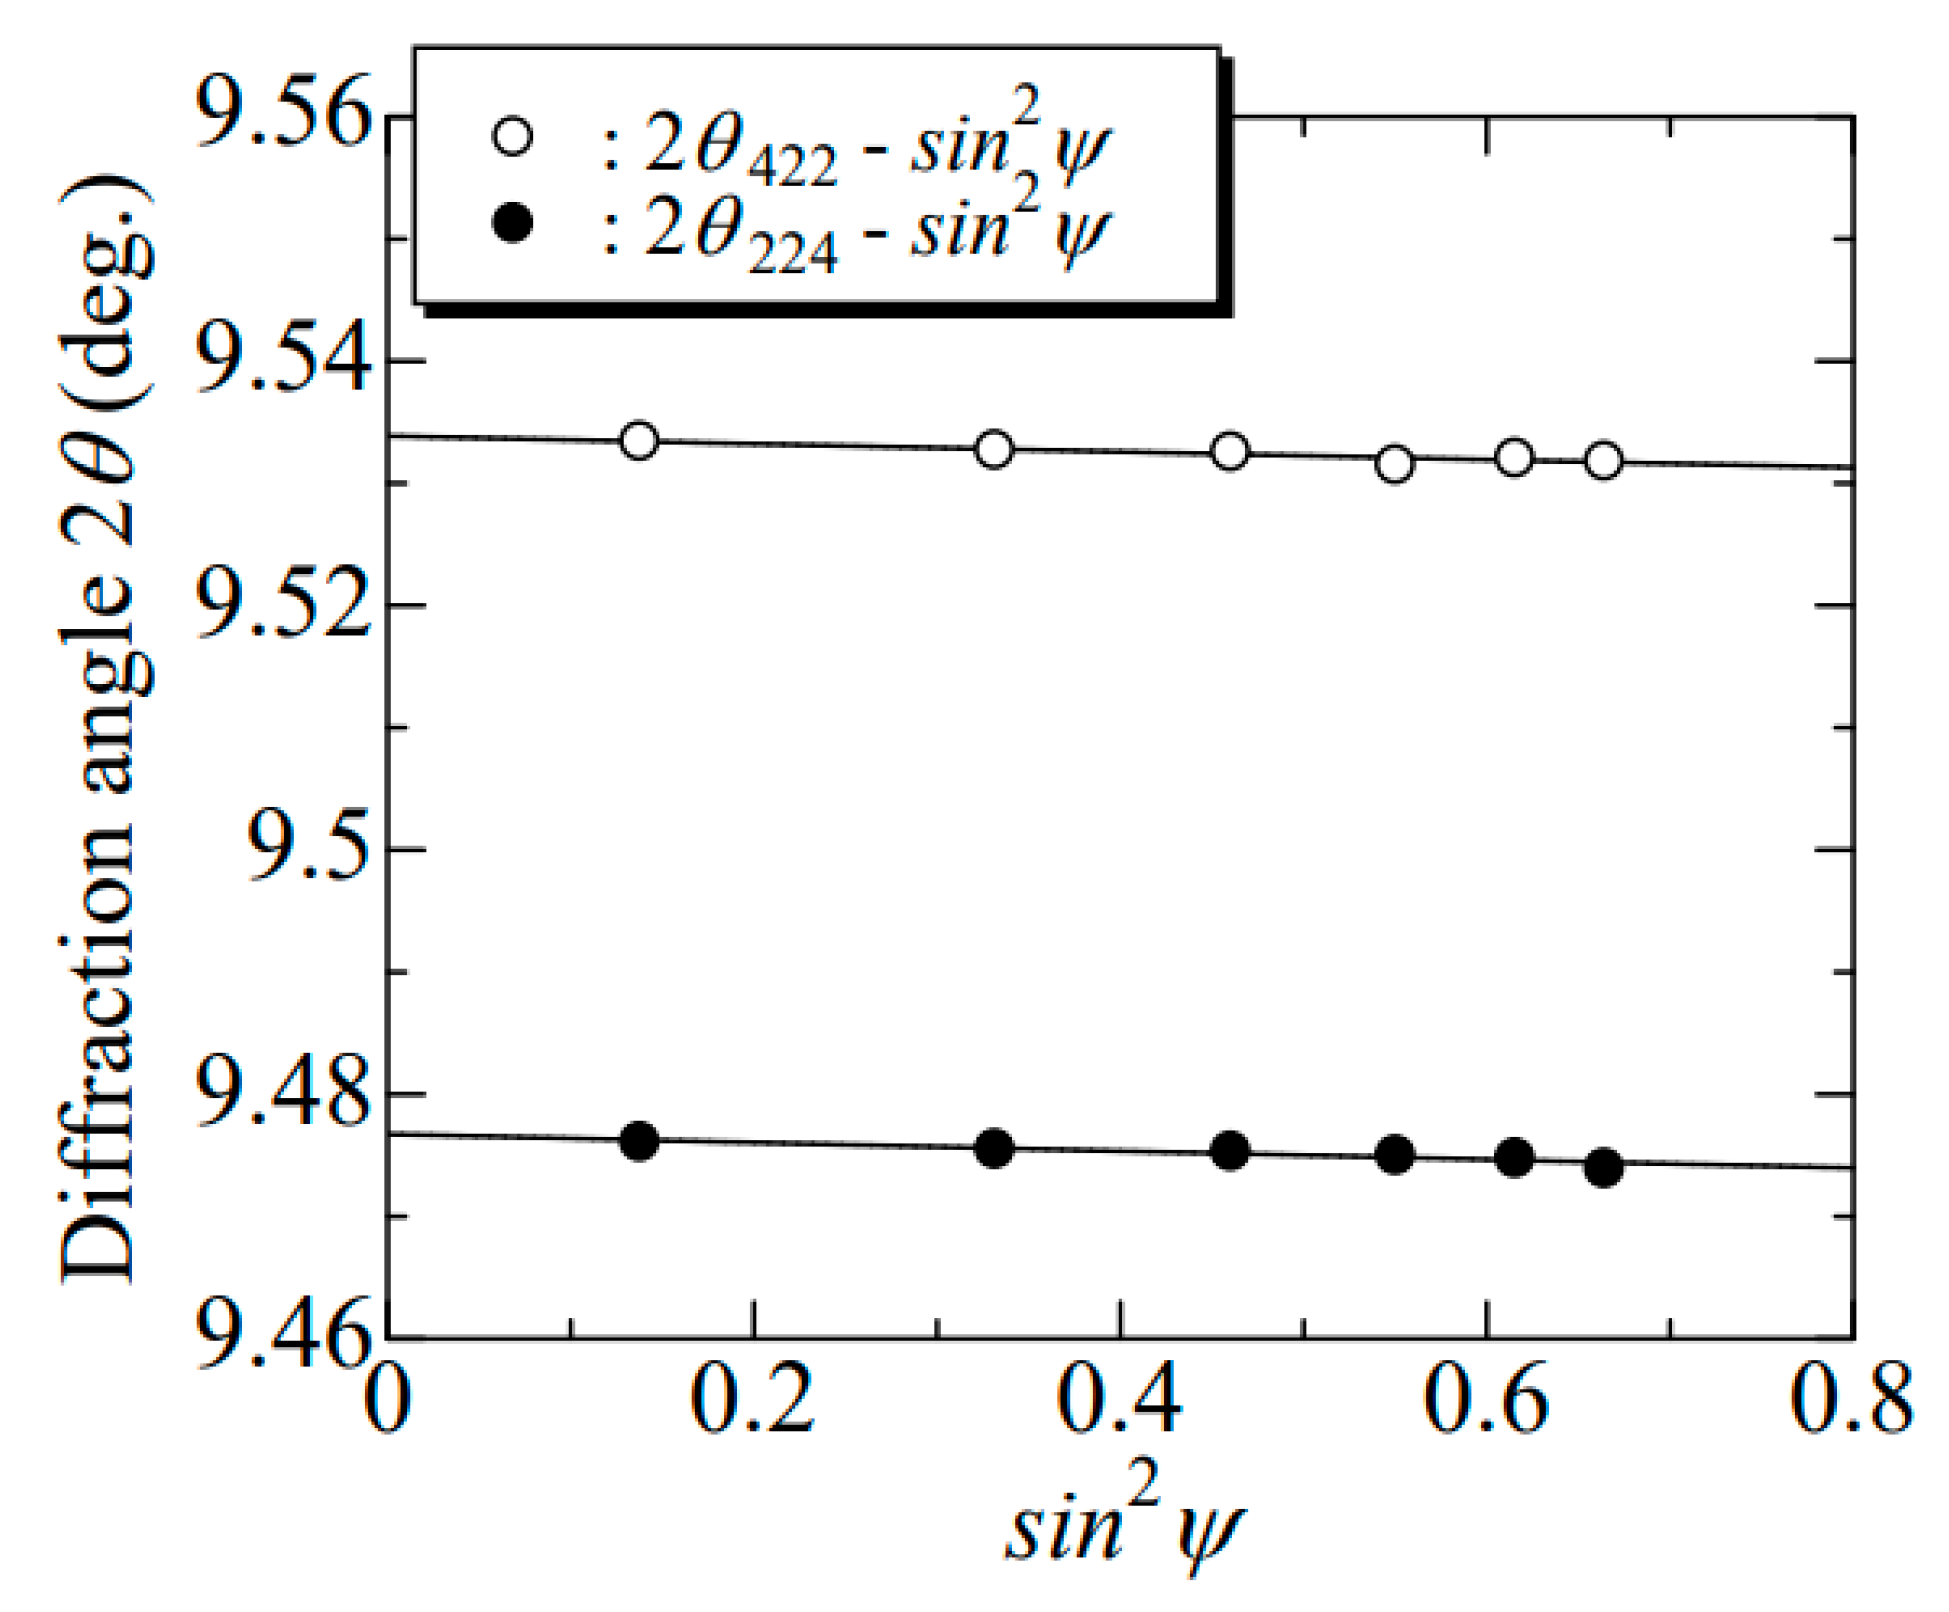
2.2. Hybrid X-ray Deflection Analysis to Measure the Internal Stress in SPS-TBC

This study evaluated the internal stress distribution in the top coat of SPS-TBC using the hybrid method using high-energy synchrotron X-ray diffraction analysis and laboratory low-energy X-rays [35]. The difference between high- and low-energy X-rays is their penetration depth from the sample surface due to their energy difference. The former has a penetration depth more profound than 10 μm, whereas on the other hand, the latter less than 1 μm. The detail of the measurement method is described below.
Considering that the equi-biaxial stress sat in the in-plane direction, it can be assumed for the top coat of TBCs, the relationship between the stress components and the measured diffraction angle θ is represented as follows:
2 θ = 2 θ 0 2 1 + ν x E x σ i n σ o u t tan θ 0 sin 2 ψ 2 E x σ o u t tan θ 0 + 4 ν x E x σ i n tan θ 0
where θ 0 is the diffraction angle for a strain-free condition; σ i n and σ o u t are the stress components for the in-plane and out-of-plane direction, respectively. E x and ν x are Young’s modulus and Poisson’s ratio for X-ray analysis, respectively.
Considering that the low-energy X-rays for general X-ray stress measurement used in a laboratory have a shallow penetration depth, the stress evaluated by using low-energy X-rays is limited to the stress state at the sample surface. In addition, the evaluation area is in the plane stress condition ( σ o u t 0 ). The following equation can be obtained by partial differentiation using sin 2 ψ , which is shown in Equation (1):
2 θ sin 2 ψ = 2 1 + ν x E x σ i n tan θ 0
Hence, the in-plane stress, σ i n , can be obtained from the gradient of the 2 θ sin 2 ψ curve. The stress evaluated with low-energy X-rays, σ X - r a y , is equal to the in-plane stress, which is calculated as follows:
σ X - r a y = σ i n
In this study, the distribution of the in-plane stress, σ i n , was obtained by the sequential polishing method [29], in which σ i n is measured by sequentially reducing the specimen thickness by polishing. In contrast, the stress state is far from the plane stress condition because of its deeper penetration depth when high-energy synchrotron X-rays are used for the stress analysis. Thus, the gradient of the 2 θ s i n 2 ψ diagram measured by high-energy synchrotron X-rays is calculated as follows:
2 θ sin 2 ψ = 2 1 + ν x E x σ i n σ o u t tan θ 0
Thus, the stress measured by high-energy synchrotron X-rays, σ s y n , is measured as follows:
σ s y n = σ i n σ o u t
The X-ray penetration depth is varied with its incident angle; however, the effect of it on the experimental result is not huge then, negligible for simplicity in the following analysis.
The internal stress distribution of σ i n σ o u t was obtained by using the s i n 2 ψ method with a side-inclination configuration [29,30,31]. Internal stress measurements were conducted using high-energy synchrotron X-rays with a four-circle goniometer at the beamline BL02B1 in Japan Synchrotron Research Institute, SPring-8. The measurement conditions are summarized in Table 2. Figure 3 shows the diffraction profile obtained by high-energy synchrotron X-rays. The diffractions from ZrO2 (422) and (224) were used, considering the X-ray penetration depth and reflection intensity. The scintillator (Ohyo Koken Kogyo Co., Ltd., Tokyo, Japan, SP-10) was used to measure the intensity of the X-ray diffraction profile in this study. The used scintillator consisted of the scintillator substance and the photomultiplier tube. The single transparent crystal of thallium-activated sodium iodine, Nal(Tl), was used as the scintillator substance. When diffracted radiation reaches the scintillator, it is absorbed by the Nal(Tl) scintillator and converted into fluorescent light. The converted fluorescent light is converted and amplified by the photomultiplier tube into an electrical pulse for counting. In this study, a long solar slit was installed at the front of the scintillation counter to suppress the broadening of the diffraction profile.
On the other hand, the in-plane stress in the ceramic top coat, σ i n , was obtained by using low-energy X-rays in the laboratory. The low-energy X-ray measurement was conducted using the cos α method with Pulstec Industries μ-X360s25. Table 3 shows the measurement conditions. In this study, the internal stress distribution in the TC was evaluated by repeating the X-ray stress measurements after polishing the TC surface to reduce the TC thickness.

3. Results and Discussion

Solid symbols in Figure 4 represent typical diffraction profiles obtained by the sin 2 ψ method with a side-inclination configuration using high-energy X-rays. As shown in Figure 4, the profiles of the (422) and (224) diffraction planes of ZrO2 overlap within the selected 2 θ diffraction angle range between 9.4° and 9.6°. The profiles of the (422) and (224) diffraction planes were approximated by Gaussian functions in the present study, and the superimposed (422) and (224) diffraction profiles expressed by the following equation were fitted with the least-square approximation to the profiles measured by high-energy X-rays.
  A 422 e x p θ θ 422 B 422 + A 224 e x p θ θ 224 B 224
where, θ 422 and θ 224 are the peak diffraction angles for the profiles of (422) and (224) diffraction planes, respectively, and A 422 , A 224 , B 422 ,   B 224 are the fitting constants. The first and second terms in Equation (6) correspond to the (422) and (244) diffraction profiles, respectively. Then, the peak diffraction angles for the (422) and (224) diffraction planes, θ 422 and θ 224 , respectively, were obtained from the approximated profiles. Figure 5 shows the typical relationship between the peak diffraction angles ( 2 θ 422 and 2 θ 224 ) and sin 2 ψ obtained from the approximate curves. σ s y n   = σ i n σ o u t was obtained from the 2 θ 422 sin 2 ψ and 2 θ 224 sin 2 ψ relations using Equations (4) and (5).
Figure 6 shows the internal stress distribution of σ s y n for each specimen. The horizontal axis in Figure 6 exhibits the position of the measurement point from the TC/BC interface. For high-energy X-ray analysis, the distance in Figure 6 was calculated from the difference in the thickness of TC (= distance between the TC/BC interface and the TC surface) and the penetration depth of the X-ray. On the other hand, in the case of low-energy analysis, the horizontal axis means the TC thickness after sequential polishing. As shown in Figure 6, the stress distribution of σ X - r a y evaluated with low-energy X-rays is also represented. In addition, no differences in σ s y n in each specimen obtained from profiles of the (422) and (224) diffraction planes of ZrO2 were observed. Moreover, the σ s y n for each specimen is decreased periodically. The periodic decrement in the σ s y n distribution will be discussed later.
The distribution of σ s y n evaluated by high-energy synchrotron X-rays was compared with σ X - r a y evaluated with low-energy X-rays. Although σ s y n in each specimen was almost comparable to σ X - r a y except for the presence or absence of the periodic decrease in stress distributions, as shown in Figure 6. The results in Figure 6 indicate that σ s y n was almost equal to the in-plane stress component, σ i n , and no out-of-plane stress component was applied ( σ o u t 0 ), not only at the surface of the top coat but also inside the top coat (at the positions from the TC/BC interface ranging between 65 and 80 μm).
Figure 7 shows the influence of the microstructure of the ceramic top coat on the internal stress distribution obtained from experiments using high-energy synchrotron X-rays. As shown in Figure 7, σ s y n was the average value evaluated from profiles of the (422) and (224) diffraction planes of ZrO2. σ s y n decreased with decreasing the column diameter of the top coat. The results in Figure 7 indicate that the thinner the column microstructure of the SPS-TBC, the higher the strain tolerance. Our previous investigation about the influence of the microstructure on the thermal cycle fatigue strength in the SPS-TBC revealed that the thermal cycle fatigue life increased with decreasing the column diameter [24]. Based on the results shown in Figure 7, the superior thermal cycle fatigue strength of the thin column microstructure of the SPS-TBC was achieved by high strain tolerance. However, it was reported that, in an EB-PVD TBC, the residual internal stress decreased with increasing the column diameter [29]. The microstructure of EB-PVD TBC was controlled by the rotation rate of the substrate in the EB-PVD process. The column diameter of the EB-PVD TBC increased with increasing the rotation rate of the substrate. In addition, the porosity in the column also increased with increasing the rotation rate and affected the residual internal stress. The effect of the pore in the column of SPS-TBC will be discussed later.
As shown in Figure 6, the periodical decrement in the internal stress distribution of σ s y n was observed, although it was not in the results obtained by low-energy X-rays. On the other hand, porous layers were periodically in the SPS-TBC column (Figure 8). Figure 9 shows the periods of the low internal stress layer and the porous one as a function of the column diameter. As shown in Figure 9, both periods were almost identical, indicating that the internal stress was released at the porous layer. In addition, the porous layer period was proportionate to the column diameter. The internal stress of the EB-PVD TBC with a columnar structure was reduced with increasing the porosity [29]. It was not easy to measure the porosity of the tested SPS-TBCs from the cross-sectional SEM images. However, it seems from Figure 1 that the area fraction of pores in the column increased with increasing the column diameter. Therefore, not only the volume fraction of pores but also the density of the periodic porous layers in the column, in other words, the period of the porous layer, might affect the reduction of internal stress in the SPS-TBC. Based on these results, the higher thermal fatigue strength of the SPS-F specimen might also be related to the higher density of the porous layer, which can reduce internal stress.
As shown in Figure 6, the periodic stress decrement cannot be observed in the stress distribution evaluated by low-energy X-rays. As mentioned above, the low-energy X-rays for general X-ray stress measurement used in a laboratory have a shallow penetration depth. Therefore, the stress evaluated using low-energy X-rays is limited to the stress state at the sample surface. Considering that the porous layer at the specimen surface was detached during polishing, the stress decrement layer cannot be evaluated using low-energy X-rays. These results indicate that the internal stress distribution, including the periodic decrement, can be only evaluated using high-energy synchrotron X-rays.

4. Summary Remarks

This study investigated the internal stress of the SPS-TBC with different columnar structures using hybrid measurements, including high-energy synchrotron X-ray diffraction analysis and laboratory low-energy X-rays. Stress distributions ranging between 65 and 80 μm from the top-coat/bond-coat interface were obtained when in-plane biaxial tensile loading was applied in the top coat.
The following conclusions were drawn:
(1)
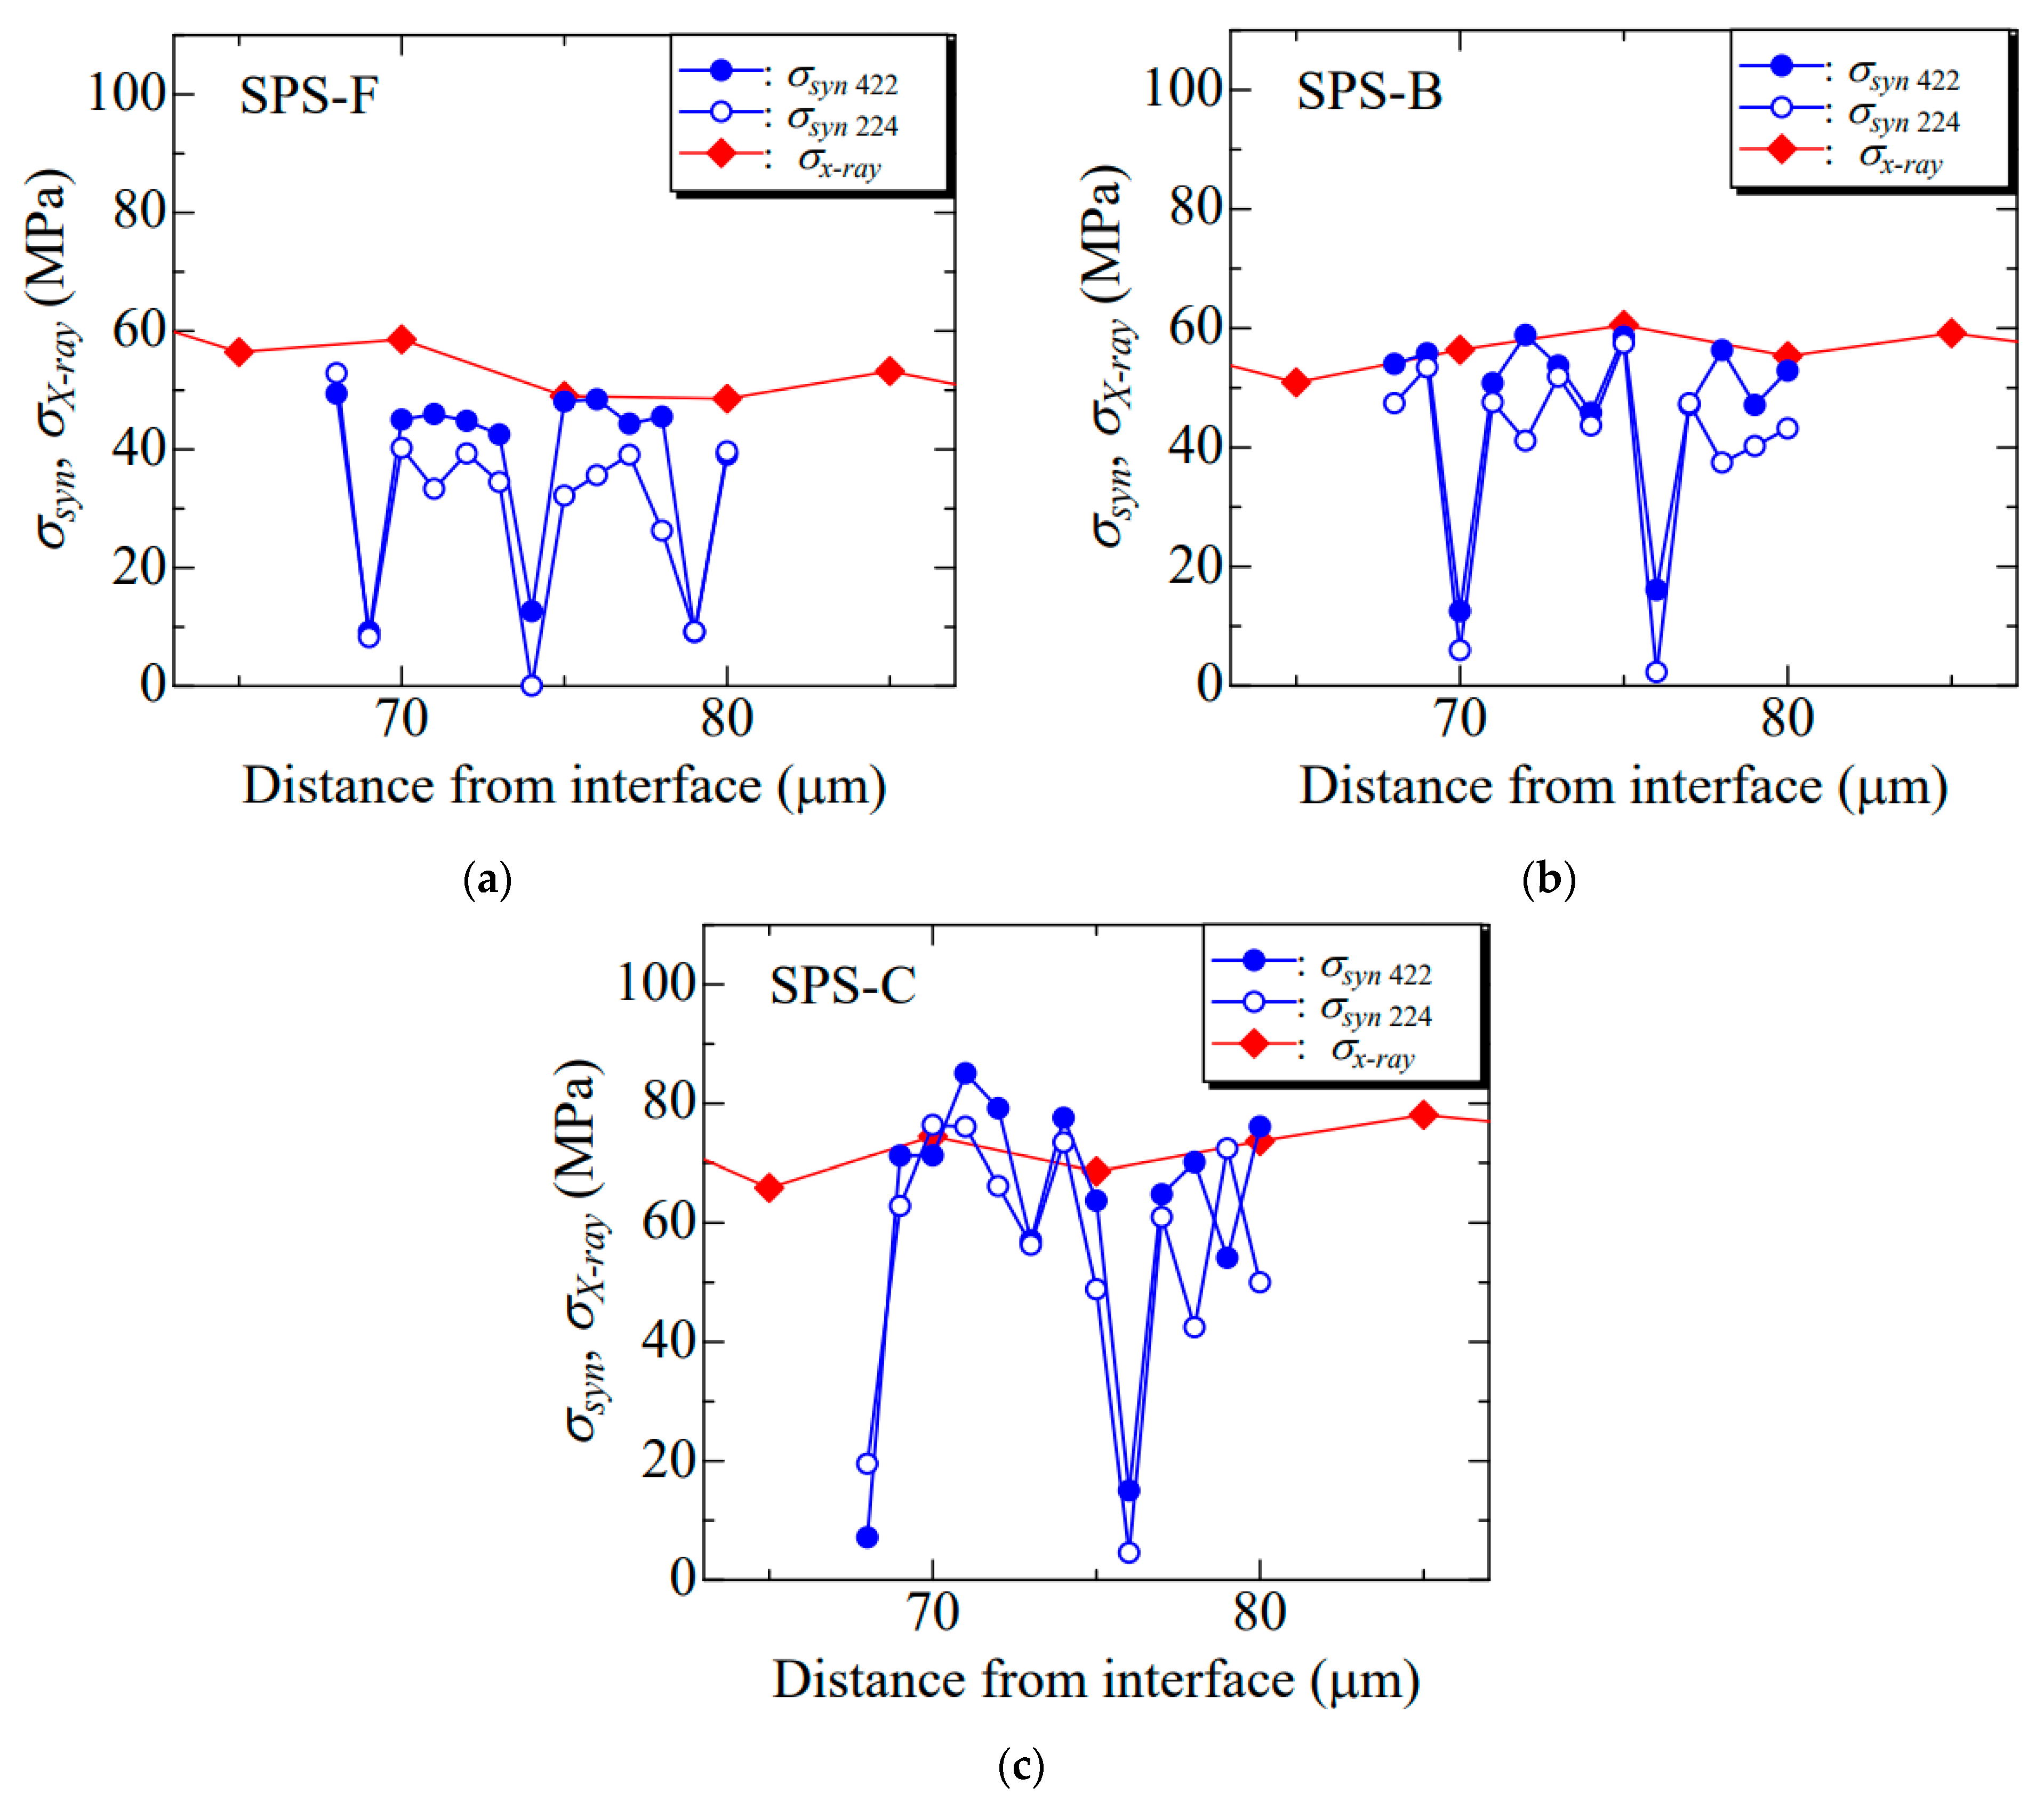
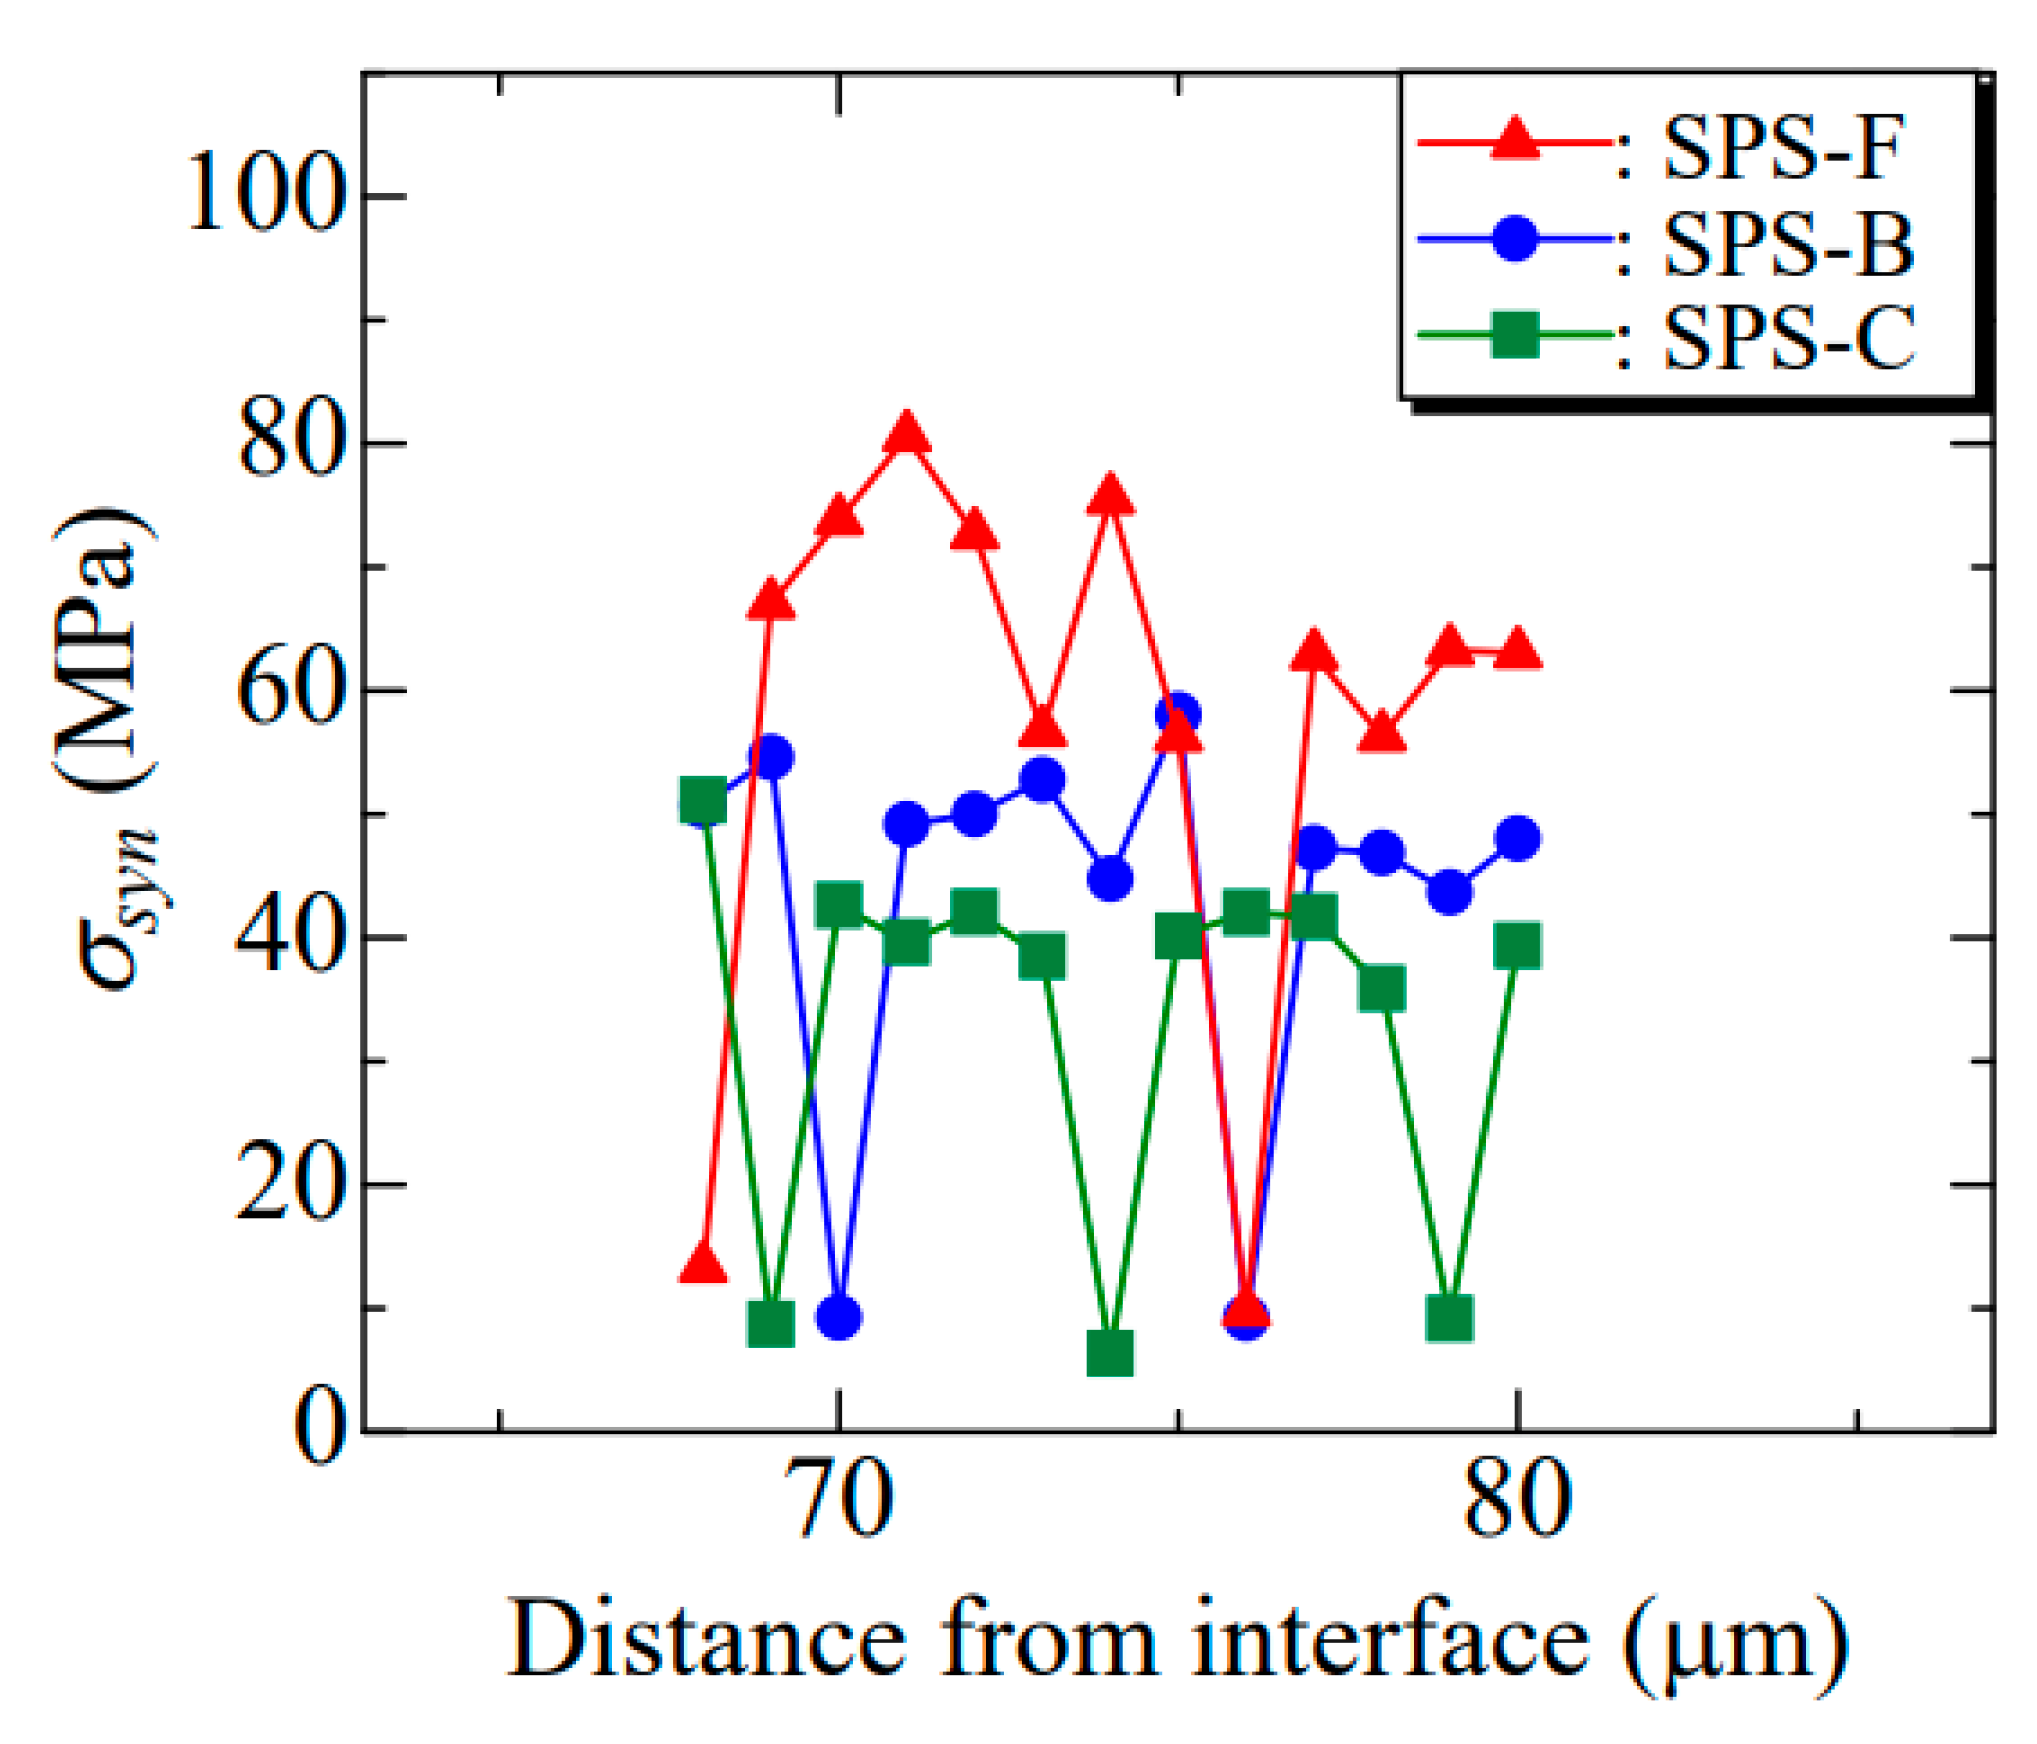
In the top coat of the SPS-TBC, the internal stress was almost in the in-plane stress state, and the out-of-plane stress component was practically equal to zero;
(2)
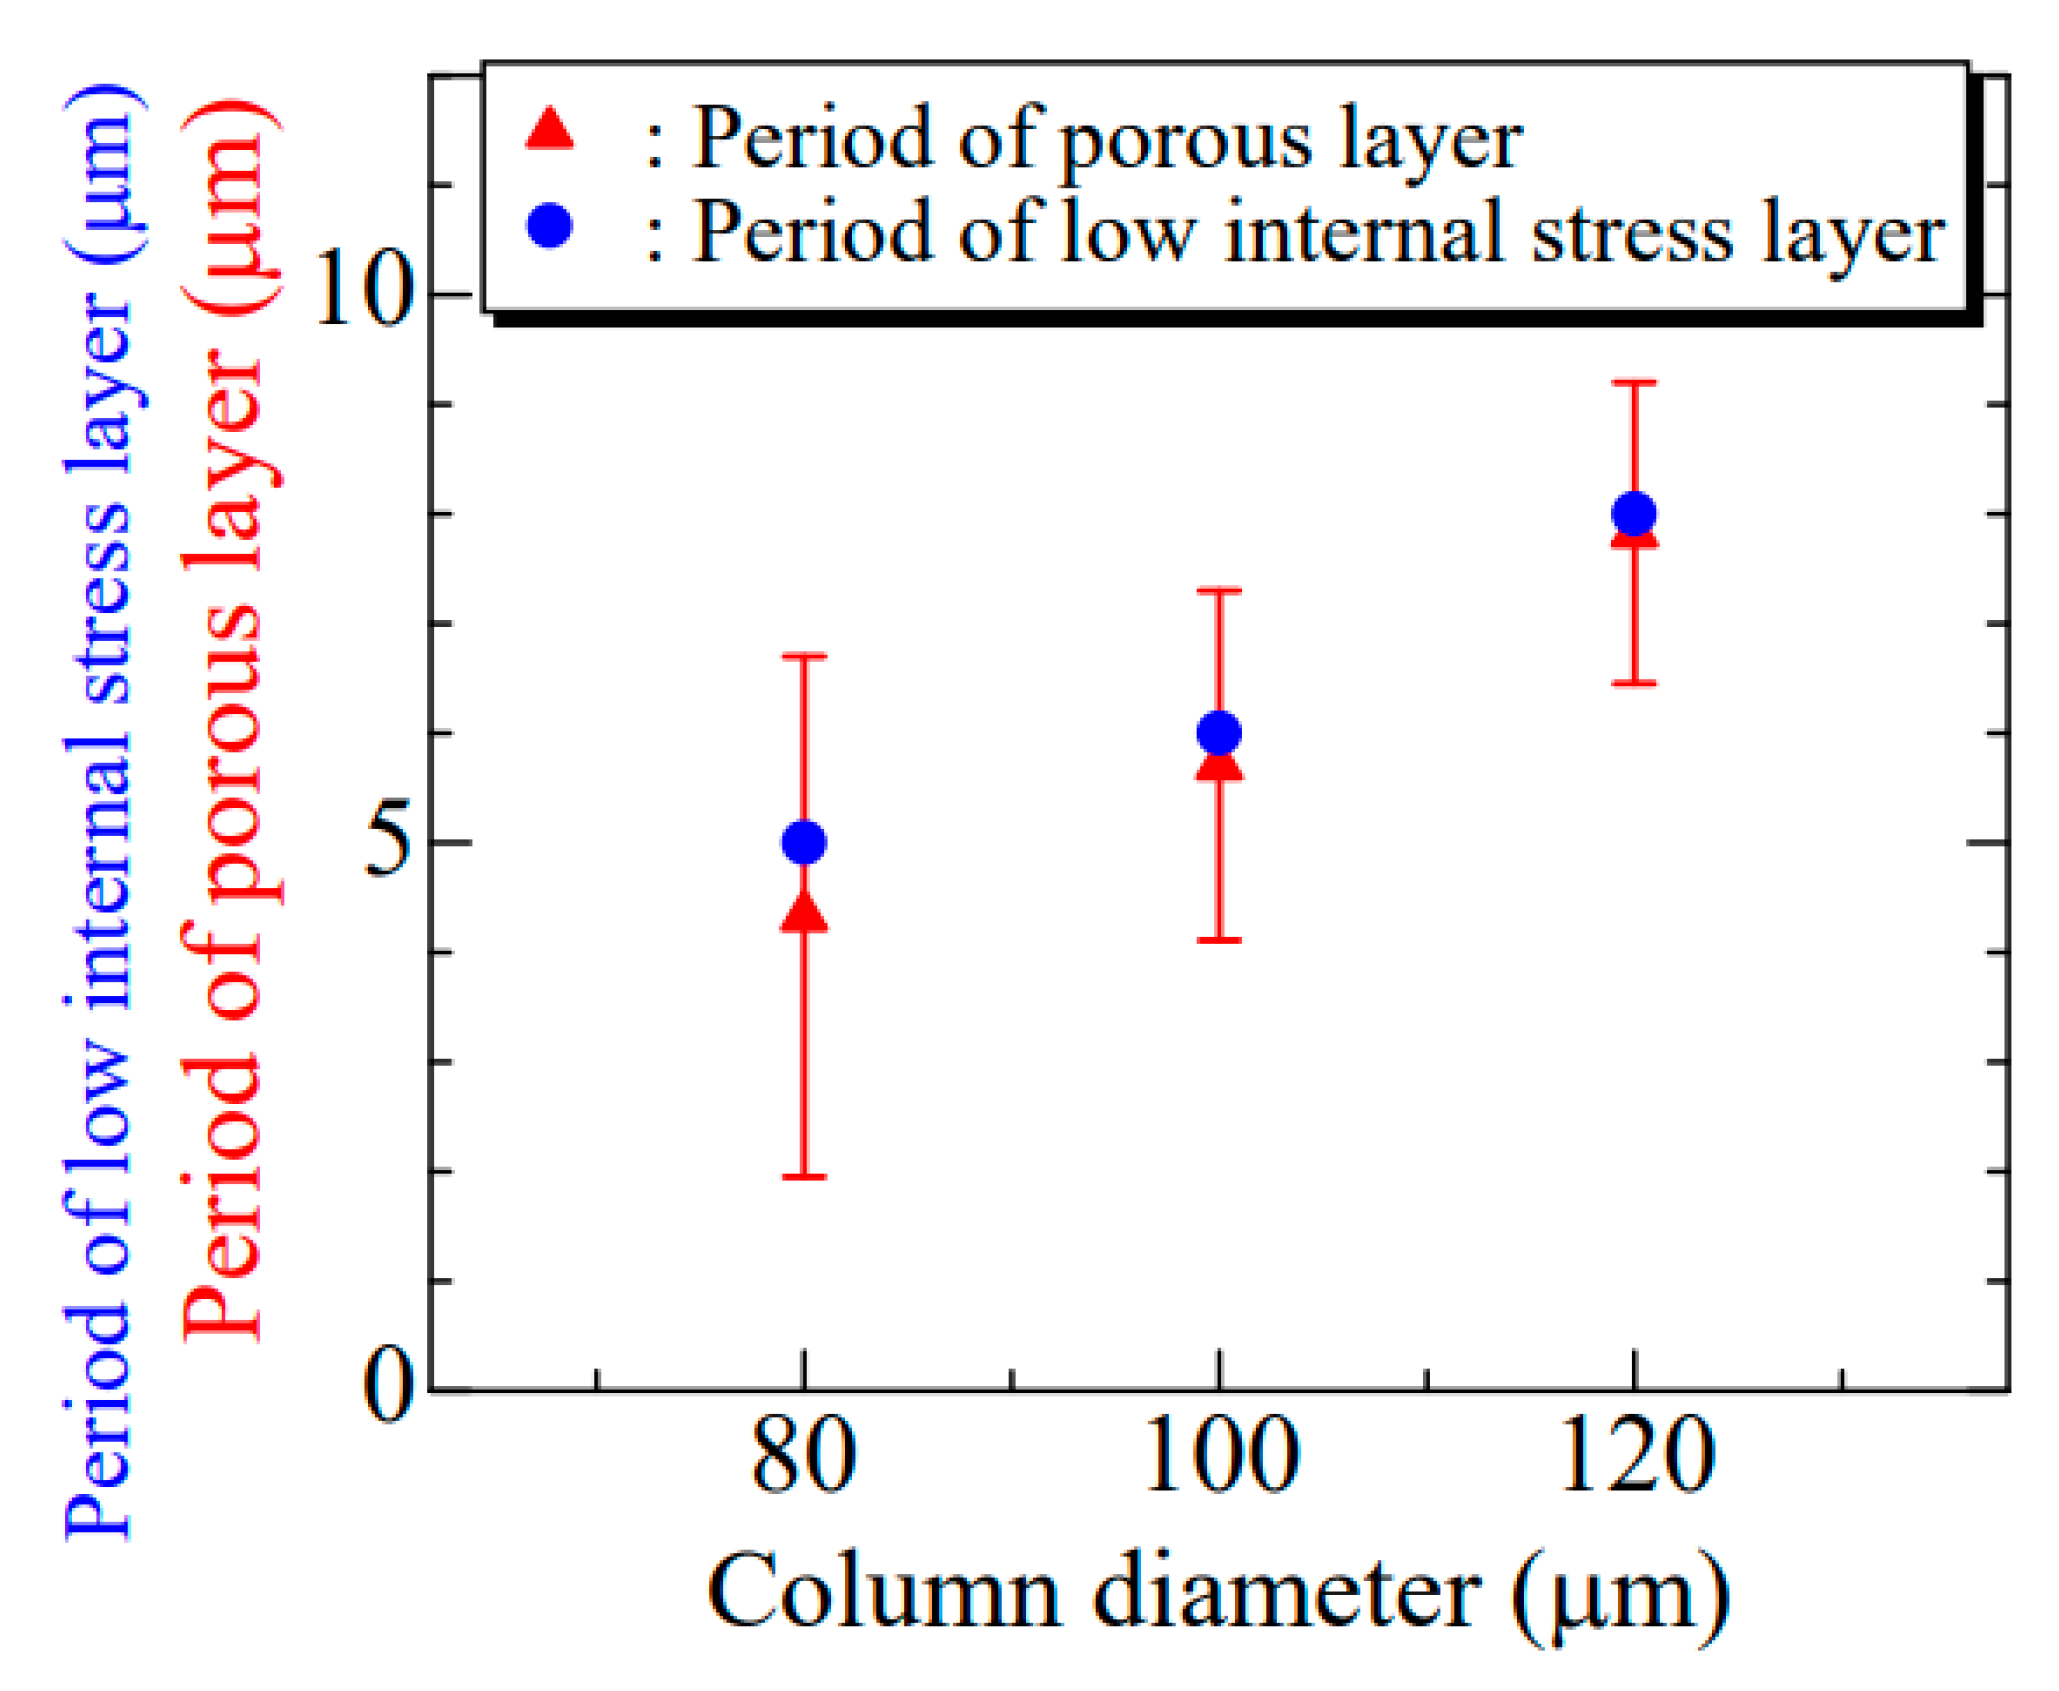
The in-plane internal stress in the top coat decreased by decreasing the column diameter. The thin column microstructure of the SPS-TBC had superior strain tolerance;
(3)
In measuring internal stress using high-energy synchrotron X-rays, periodic stress decrements were observed in the internal stress distribution because internal stress was released at the porous layer.

Author Contributions

Y.Y.: conceptualization, methodology, data curation, writing—original draft, writing—review and editing, visualization, supervision, project administration, funding acquisition. K.S. (Keisuke Shinomiya): investigation, data curation, visualization. T.O.: investigation, data curation, visualization. K.S. (Kenji Suzuki): methodology, investigation. T.S.: methodology, investigation. Y.N.: methodology, investigation. All authors have read and agreed to the published version of the manuscript.

Funding

This research was funded by the Japan Society for the Promotion of Science (JSPS) KAKENHI Grant Number 21K03768.

Data Availability Statement

Data will be made available on request.

Acknowledgments

The first author appreciated the financial support from the Japan Society for the Promotion of Science (JSPS) KAKENHI Grant Number 21K03768. The synchrotron radiation experiments were carried out at SPring-8 with approval of the Japan Synchrotron Radiation Research Institute (Proposal No. 2020A1605, 2021B1716 and 2022B0554). The authors are obliged to T. Hamada, Y. Habu, K. Takaki (TOCALO Co., Ltd., Hyogo, Japan), and H. Suzuki (Pulstec Industrial Co., Ltd., Shizuoka, Japan) for their assistance in the experiments.

Conflicts of Interest

The authors declare no conflict of interest.

References

  1. Padture, N.P.; Gell, M.; Jordan, E.H. Thermal barrier coatings for gas-turbine engine applications. Science 2002, 296, 280–284. [Google Scholar] [CrossRef]
  2. Vaßen, R.; Kaßner, H.; Stuke, A.; Hauler, F.; Hathiramani, D.; Stöver, D. Advanced thermal spray technologies for applications in energy systems. Surf. Coat. Technol. 2008, 202, 4432–4437. [Google Scholar] [CrossRef]
  3. Bakan, E.; Vasßen, R. Ceramic top coats of plasma-sprayed thermal barrier coatings: Materials, Processes, and Properties. J. Therm. Spray Technol. 2017, 26, 992–1010. [Google Scholar]
  4. Li, G.-R.; Yang, G.-J.; Chen, X.-F.; Li, C.-X.; Li, C.-J. Strain/sintering co-induced multiscale structural changes in plasma-sprayed thermal barrier coatings. Ceram. Int. 2018, 44, 14408–14416. [Google Scholar] [CrossRef]
  5. Yamazaki, Y.; Schmidt, A.; Scholz, A. The determination of delamination resistance in thermal barrier coating system by four-point bending tests. Surf. Coat. Technol. 2006, 201, 744–754. [Google Scholar] [CrossRef]
  6. Trunova, O.; Beck, T.; Herzog, R.; Steinbrech, R.W.; Singheiser, L. Damage mechanisms and lifetime behavior of plasma sprayed thermal barrier coating systems for gas turbines—Part I: Experiments. Surf. Coat. Technol. 2008, 202, 5027–5032. [Google Scholar] [CrossRef]
  7. Yamazaki, Y.; Yoshida, T.; Fukanuma, H.; Ohno, N. Thermal Cycle Damage and Residual Adhesion Strength in a Thermal Barrier Coating. J. Soc. Mater. Sci. Jpn. 2009, 58, 168–174. [Google Scholar] [CrossRef]
  8. Yamazaki, Y.; Kinebchi, T.; Fukanuma, H.; Ohno, N. Influence of the spray process parameters and the thermal exposure on the mechanical properties of the free-standing air-plasma sprayed thermal barrier coating. J. Jpn. Therm. Spray Soc. 2007, 44, 88–95. [Google Scholar]
  9. Yamazaki, Y. Correlation between the mechanical properties and splat microstructures of an air plasma sprayed thermal barrier coatings. J. Solid Mech. Mater. Eng. 2008, 2, 1275–1286. [Google Scholar] [CrossRef]
  10. Okazaki, M.; Yamagishi, S.; Yamazaki, Y.; Ogawa, K.; Waki, H.; Arai, M. Adhesion Strength of Ceramic Top Coat in Thermal Barrier Coatings Subjected to Thermal Cycles: -Effects of Thermal Cycle Testing Method and Environment. Int. J. Fatigue 2013, 53, 33–39. [Google Scholar] [CrossRef]
  11. Arikawa, H.; Kojima, Y. Heat Resistant Coatings for Gas Turbine Materials. J. Surf. Finish. Soc. Jpn. 2001, 52, 11–15. [Google Scholar]
  12. Matsumoto, K.; Kawagishi, K.; Harada, H. Development of Thermal Barrier Coating Technology. Mater. Jpn. 2013, 52, 469–474. [Google Scholar] [CrossRef]
  13. Watanabe, K.; Takahashi, T. Development of Gas Turbine Based on Energy Planning of Japan and Issues on GTCC Contributing to Stability of Electric Power System. J. Gas Turbine Soc. Jpn. 2019, 47, 2–7. [Google Scholar]
  14. Schlegel, N.; Ebert, S.; Mauer, G.; Vaßen, R. Columnar-structured Mg-Al-spinel thermal barrier coatings (TBCs) by suspension plasma spraying (SPS). J. Therm. Spray Technol. 2015, 24, 144–151. [Google Scholar] [CrossRef]
  15. Schlegel, N.; Sebold, D.; Sohn, Y.; Mauer, G.; Vaßen, R. Cycling performance of a columnar-structured complex perovskite in a temperature gradient test. J. Therm. Spray Technol. 2015, 24, 1205–1212. [Google Scholar]
  16. Ganvir, A.; Curry, N.; Björklund, S.; Markocsan, N.; Nylén, P. Characterization of microstructure and thermal properties of YSZ Coatings obtained by axial suspension plasma spraying (ASPS). J. Therm. Spray Technol. 2015, 24, 1195–1204. [Google Scholar] [CrossRef]
  17. Guignard, A.; Maur, G.; Vaßen, R.; Stöver, D. Deposition and characteristics of submicronmeter-structured thermal barrier coatings by suspension plasma spraying. J. Therm. Spray Technol. 2012, 21, 416–424. [Google Scholar] [CrossRef]
  18. Ganvir, A.; Curry, N.; Markocsan, N.; Nylén, P.; Joshi, S.; Vilemova, M.; Pala, Z. Influence of microstructure on thermal properties of axial suspension plasma-sprayed YSZ thermal barrier coatings. J. Therm. Spray Technol. 2016, 25, 202–212. [Google Scholar] [CrossRef]
  19. Curry, N.; VanEvery, K.; Snyder, T.; Markocsan, N. Thermal Conductivity Analysis and Lifetime Testing of Suspension Plasma-Sprayed Thermal Barrier Coatings. Coatings 2014, 4, 630–650. [Google Scholar]
  20. Xu, P.; Meng, G.; Liu, G.; Cpyle, T.; Pershin, L.; Mostaghimi, J. Columnar-structured thermal barrier coatings deposited via the water-based suspension plasma spray process. J. Phys. D Appl. Phys. 2022, 55, 204001. [Google Scholar] [CrossRef]
  21. Curry, N.; Tang, Z.; Markocsan, N.; Nylén, P. Influence of bond coat surface roughness on the structure of axial suspension plasma spray thermal barrier coatings—Thermal and lifetime performance. Surf. Coat. Technol. 2015, 268, 15–23. [Google Scholar] [CrossRef]
  22. Curry, N.; Mahade, S.; Venkat, A.; Joshi, S. Erosion performance of suspension plasma spray thermal barrier coatings—A comparison with state of art coatings. Surf. Coat. Technol. 2022, 437, 12811. [Google Scholar] [CrossRef]
  23. Ma, X.; Ruggiero, P. Practical aspects of suspension plasma spray for thermal barrier coatings on potential gas turbine components. J. Therm. Spray Technol. 2018, 27, 591–602. [Google Scholar] [CrossRef]
  24. Yamazaki, Y.; Shinomiya, K.; Hamaguchi, T.; Habu, Y.; Takagi, K. Effect of the microstructure of suspension plasma-sprayed thermal barrier coatings on their thermal cycling damage. Surf. Coat. Technol. 2023, 456, 129269. [Google Scholar] [CrossRef]
  25. Wu, R.T.; Osawa, M.; Yokokawa, T.; Kawagishi, K.; Harada, H. Degradation Mechanisms of an Advanced Jet Engine Service-Retired TBC Component. J. Solid Mech. Mater. Eng. 2010, 4, 119–130. [Google Scholar] [CrossRef]
  26. Ito, A.; Kobayashi, D. Degradation evaluation of 1300 °C-class 1st-stage gas turbine blades after long-term service. In Proceedings of the International Gas Turbine Congress 2015, Tokyo, Japan, 15–20 November 2015; pp. 614–619. [Google Scholar]
  27. Matejicek, J.; Sampath, S. Intrinsic residual stresses in single splats produced by thermal spray processes. Acta Mater. 2001, 49, 1993–1999. [Google Scholar] [CrossRef]
  28. Chun, L.; Zhang, X.; Chen, Y.; Carr, J.; Jacques, S.; Behnsen, J.; Michiel, M.; Xiao, P.; Cernik, R. Understanding the residual stress distribution through the thickness of atmosphere plasma sprayed (APS) thermal barrier coatings (TBCs) by high energy synchrotron XRD; digital image correlation (DIC) and image based modelling. Acta Mater. 2017, 132, 1–12. [Google Scholar]
  29. Suzuki, K.; Shobu, T.; Wada, K.; Matsubara, H.; Kawamura, M. Microstructure and Residual Stress of EB-PVD TBCs Grown under Substrate Rotation. J. Soc. Mater. Sci. Jpn. 2008, 57, 674–680. [Google Scholar] [CrossRef]
  30. Suzuki, K.; Matsumoto, K.; Kubo, T.; Machiya, S.; Tanaka, K.; Akiniwa, Y. Analysis on Residual Stress in Electron Beam-Physical Vapor Deposited Thermal Barrier Coating using Hard Synchrotron X-rays. Trans. Jpn. Soc. Mech. Eng. Ser. A 2005, 71, 1523–1529. [Google Scholar] [CrossRef]
  31. Suzuki, K.; Kawamura, M.; Shobu, T.; Kubo, T.; Tanaka, K.; Akiniwa, Y. Residual stress and deformation characteristics of thermal barrier coatings on curved substrate. J. Soc. Mater. Sci. Jpn. 2006, 55, 634–640. [Google Scholar] [CrossRef]
  32. Knipe, L.; Manero, A.; Siddiqui, S.; Meid, C.; Wischek, J.; Okasinski, J.; Almer, J.; Karlsson, A.M.; Bartsch, M.; Raghavan, S. Strain response of thermal barrier coatings captured under extreme engine environments through synchrotron X-ray diffraction. Nat. Commun. 2014, 5, 4559. [Google Scholar] [CrossRef]
  33. Zhou, D.; Guillon, O.; Vassen, R. Development of YSZ thermal barrier coatings using axial suspension plasma spraying. Coatings 2017, 7, 120. [Google Scholar] [CrossRef]
  34. Yamazaki, Y.; Shinomiya, K.; Okumura, T.; Suzuki, K.; Shobu, T.; Nakamura, Y. Internal stress distribution in suspension plasma sprayed thermal barrier coating subjected to in-plane tensile loading. J. Jpn. Therm. Spray Soc. 2023, 60. In press. [Google Scholar]
  35. Suzuki, K.; Tanaka, K. Applications on High-Energy X-Rays to Stress Measurements of Thermal Barrier Coatings. Textures Microstruct. 2003, 35, 207–217. [Google Scholar] [CrossRef]
  36. Yamazaki, Y.; Morikawa, M.; Hamaguchi, T.; Habu, Y.; Ohide, Y.; Takagi, K. Relationship between the mechanical properties and structure of a suspension plasma-sprayed thermal barrier coating with columnar microstructure. Surf. Coat. Technol. 2022, 439, 128430. [Google Scholar] [CrossRef]
Figure 1. Microstructures of the top coat in SPS-TBCs: (a) SPS-F specimen; (b) SPS-B specimen; (c) SPS-C specimen [24]; TC: top coat, BC: bond coat.
Qubs 07 00014 g001
Figure 2. Geometry change of substrate by thermal aging [34].
Qubs 07 00014 g002
Figure 3. Typical diffraction profile obtained by high-energy synchrotron X-rays.
Qubs 07 00014 g003
Figure 4. Typical diffraction profile used to evaluate σ s y n ; SPS-B specimen [34].
Qubs 07 00014 g004
Figure 5. Typical 2 θ sin 2 ψ diagram used to evaluate σ s y n ; SPS-B specimen [34].
Qubs 07 00014 g005
Figure 6. Internal stress distribution evaluated by high- and low-energy X-rays: (a) SPS-F specimen; (b) SPS-B specimen; (c) SPS-C specimen.
Qubs 07 00014 g006
Figure 7. Effect of microstructure on internal stress distribution.
Qubs 07 00014 g007
Figure 8. Typical microstructure in the column of the SPS-TBCs: (a) SPS-F specimen; (b) SPS-B specimen; (c) SPS-C specimen.
Qubs 07 00014 g008
Figure 9. Periods of the low internal stress layer and the porous one as a function of the column diameter.
Qubs 07 00014 g009
Table 1. Spray conditions of the bond coat and top coat.
Bond CoatTop Coat
Spray methodHVOFSPS
Spray materialCoNiCrAlYEthanol-based YSZ suspension
(solid-phase content in suspension was 25 wt.%)
Spray torchJP-5000100HE
Plasma gasN/AAr + N2 + H2
(flow rate:199 SLPM)
Plasma powerN/A105 kW
Table 2. Conditions of stress measurement by synchrotron high-energy X-ray.
BeamlineBL02B1
Wave length0.01736 nm (71.4 KeV)
Size of slit (V × H)0.2 mm × 1.0 mm
Analysis methodConstant penetration depth method
(Side-inclination configuration)
CrystalZrO2
Diffraction plane(422) + (224)
2 θ 0 9.4992°
Stress constant [28]−11,492 MPa/deg
sin 2 ψ 0–0.7
Table 3. Conditions of stress measurement by low-energy X-ray.
Analysis methodcos α
Characteristic X-rayCr-Kα
Tube voltage30 V
Tube current1.2 mA
CrystalZrO2
Diffraction plane111
2 θ 0 15.2578°
Stress constant−193,160 MPa/deg
Young’s modulus [36]107 GPa
sin 2 ψ 0–0.7
Disclaimer/Publisher’s Note: The statements, opinions and data contained in all publications are solely those of the individual author(s) and contributor(s) and not of MDPI and/or the editor(s). MDPI and/or the editor(s) disclaim responsibility for any injury to people or property resulting from any ideas, methods, instructions or products referred to in the content.

