Article

Neutron Stress Measurement of W/Ti Composite in Cryogenic Temperatures Using Time-of-Flight Method

1
Department of Mechanical Engineering, Kobe City College of Technology, 8-3 Gakuenhigashi-Machi, Nishi-Ku, Kobe 651-2194, Japan
2
J-PARC Center, Japan Atomic Energy Agency, Tokai-Mura, Naka-Gun, Ibaraki 319-1195, Japan
3
Joining and Welding Research Institute, Osaka University, 11-1 Mihogaoka, Ibaraki, Osaka 567-0047, Japan
*
Author to whom correspondence should be addressed.
Quantum Beam Sci. 2023, 7(1), 8; https://doi.org/10.3390/qubs7010008
Submission received: 16 January 2023 / Revised: 21 February 2023 / Accepted: 3 March 2023 / Published: 7 March 2023

Abstract

:
In this study, the thermal stress alterations generated in a tungsten fiber reinforced titanium composite (W/Ti composite) were evaluated by the neutron stress measurement method at cryogenic temperatures. The W/Ti composite thermal loads were repeated from room temperature to the cryogenic temperature (10 K), and alterations in thermal residual stress were evaluated using the neutron in situ stress measurement method. In this measurement, the stress alterations in the titanium matrix and the tungsten fibers were measured. This measurement was carried out by TAKUMI (MLF-BL19) of J-PARC, a neutron research facility in the Japan Atomic Agency. The measurement method of TAKUMI is the time-of-flight (TOF) method. Owing to this measurement method, the measurement time was significantly shortened compared to the angle-dispersion type measurement by a diffractometer. As a result of the measurement, large compressive stresses of about 1 GPa were generated in the tungsten fibers, and tensile stresses of about 100 MPa existed in the titanium matrix. The thermal stresses due to the temperature change between room temperature and cryogenic temperature is caused by the difference of thermal expansions between the tungsten fibers and the titanium matrix, and these stress values can be approximated by a simple elastic theory equation.

1. Introduction

Fiber-reinforced metal composites (FRM) are composite materials which have a high specific strength and specific stiffness, as well as excellent wear resistance and environmental resistance. Compared to carbon fiber-reinforced plastic (CFRP), FRM is expected to be used in special environments. For example, in the case of long-term use in outer space developments, many problems exist, such as high vacuum, strong ultraviolet rays, temperature difference, radiation, and the presence of primitive oxygen [1]. The use of CFRP is difficult for these reasons, and FRM is promising in this field [1,2,3]. In addition, as a practical example, it has been used for parts in conditions of high temperature and/or high pressure such as piston heads of automobile engines [4,5].
On the other hand, the metal matrix of FRM itself has high strength and good weldability. For this reason, when compared to the view point of the joint problems, which is the weakest point of CFRP, FRM is more advantageous than CFRP because it is easier to joint and weld large structures and parts for high-pressure environments [6,7,8]. In this way, the feature of FRM is that it is assumed to be used in extreme environments.
In recent years, the development of materials with high strength for use in cryogenic environments such as liquefied natural gas (111 K) tanks and liquid hydrogen (23.6 K) tanks has progressed. In particular, in order to reduce fuel transportation costs, there is an urgent need to increase the strength and reduce the weight of cryogenic storage tanks. The application of composite materials is promising for high strength and weight reduction. However, in the case of CFRPs, there are many problems such as low-temperature embrittlement in the polymer matrix and generation of cracks [1]. On the other hand, FRMs are presumed to be advantageous for use at extremely low temperatures, because aluminum and titanium are often used as metal matrix without causing low-temperature embrittlement. It is also important that FRM is advantageous for jointing and welding, which are essential in the production of storage tanks.
Comparing the mechanical properties of titanium and aluminum at cryogenic temperatures [9,10], the specific strength of titanium is three times greater than that of aluminum, and the thermal conductivity of titanium is three orders of magnitude lower than that of aluminum. Furthermore, the coefficient of thermal expansion is about 30% that of aluminum, and titanium has higher corrosion resistance (especially seawater corrosion resistance) than aluminum. These properties make titanium superior to aluminum as a structural material in cryogenic and/or corrosive environments. Furthermore, titanium can be further enhanced by alloying it, such as Ti-6Al-4V. On the other hand, titanium has excellent properties as a structural material used at low temperatures; however, titanium is used as a single element rather than as a composite material at present. If titanium is reinforced with high-strength fiber, further improvement in performance can be expected; however, there are almost no research reports on titanium fiber-reinforced composites.
In this study, the W/Ti composite material was manufactured by reinforcing the titanium matrix with tungsten fibers. This W/Ti composite material was fabricated by a simple continuous spot-welding method that does not require special equipment such as a vacuum chamber or high-temperature furnace [11]. There is an important point here. Titanium has extremely high metal activity at high temperatures, so if other metals are added to high temperature molten titanium, it will easily react and the metals will diffuse into the titanium and disappear. Therefore, it is impossible to manufacture titanium base metal fiber-reinforced material using a casting method. On the other hand, the spot-welding method employed in this study is a method of joining the titanium matrix with tungsten fibers without completely melting. On the contrary, the semi-molten titanium diffuses slightly into tungsten fibers, and the bonding of the titanium matrix and the tungsten fibers becomes a metallurgical bond. As a result, the bonding between the titanium matrix and the tungsten fibers becomes strong.
In the future, the W/Ti composite investigated in this study may be used for tanks for cryogenic materials such as liquefied natural gas and liquid hydrogen, as well as for liquid hydrogen in addition to liquid oxygen tanks for rocket fuel for spaceships. However, the fundamental mechanical properties of W/Ti composites as structural materials have not yet been investigated in detail.
The purpose of this study is to evaluate thermal residual stresses generated inside the W/Ti composite at cryogenic environments. Commonly, in any fiber-reinforced composite, there is a large difference in thermal expansion coefficients between the matrix and the fiber. This mismatch causes the thermo-induce residual stresses in every composite material [12,13]. These thermal residual stresses are big problems which can never be avoided in all of the fiber-reinforced composite materials. Among such composite materials, the W/Ti composite manufactured in this study is expected to reduce thermal residual stresses because the thermal expansion coefficient of titanium matrix is smaller than that of aluminum and steel at cryogenic temperatures.
The existence of such thermal residual stresses is a very important parameter to consider in the design of strengths. Usually, these thermal residual stresses are superimposed with the initial residual stress generated depending on the thermal history during the manufacturing of the composite material and the thermal residual stress due to the temperature alterations in the environment in which the composite material is used. In this study, both the initial residual stress generated from the thermal history during fabrication and the thermal stresses generated from the environmental temperature alterations of the composite material were measured.
Since these thermal stresses are generated inside the W/Ti composite, it is necessary to nondestructively measure the internal stress while applying cryogenic temperature alterations to the W/Ti composite. The neutron stress measurement technique is useful for such nondestructive in situ measurements inside metals. Nondestructive internal stress evaluation is impossible using any other method. An effective method has been developed for analyzing the thermal stress in the internal position of composite materials using the neutron stress measurement technique [14,15]. This measurement method is essentially based on Hooke’s law with lattice spacing alterations.
At this time, the measurement was carried out by TAKUMI (MLF-BL19) of J-PARC, a neutron research facility at the Japan Atomic Agency. The measurement method of TAKUMI is the time-of-flight (TOF) method [16]. Owing to this measurement method, the measurement time was significantly shortened compared to the angle-dispersion type measurement by a diffractometer. Furthermore, since the measurement range of diffraction profiles became wide in one time measurement, it is possible to evaluate stresses on multiple diffraction planes. In this study, the W/Ti composite was set in a cryostat cooling system mounted on the sample table of TAKUMI to generate the cryogenic temperature states. The W/Ti composite thermal loads were repeated from room temperature (279 K) to the cryogenic temperature (10 K), and alterations in thermal residual stresses were evaluated by the neutron in situ stress measurement method. The stress alterations in the titanium matrix and the tungsten fibers were measured at each temperature.

2. Materials and Methods

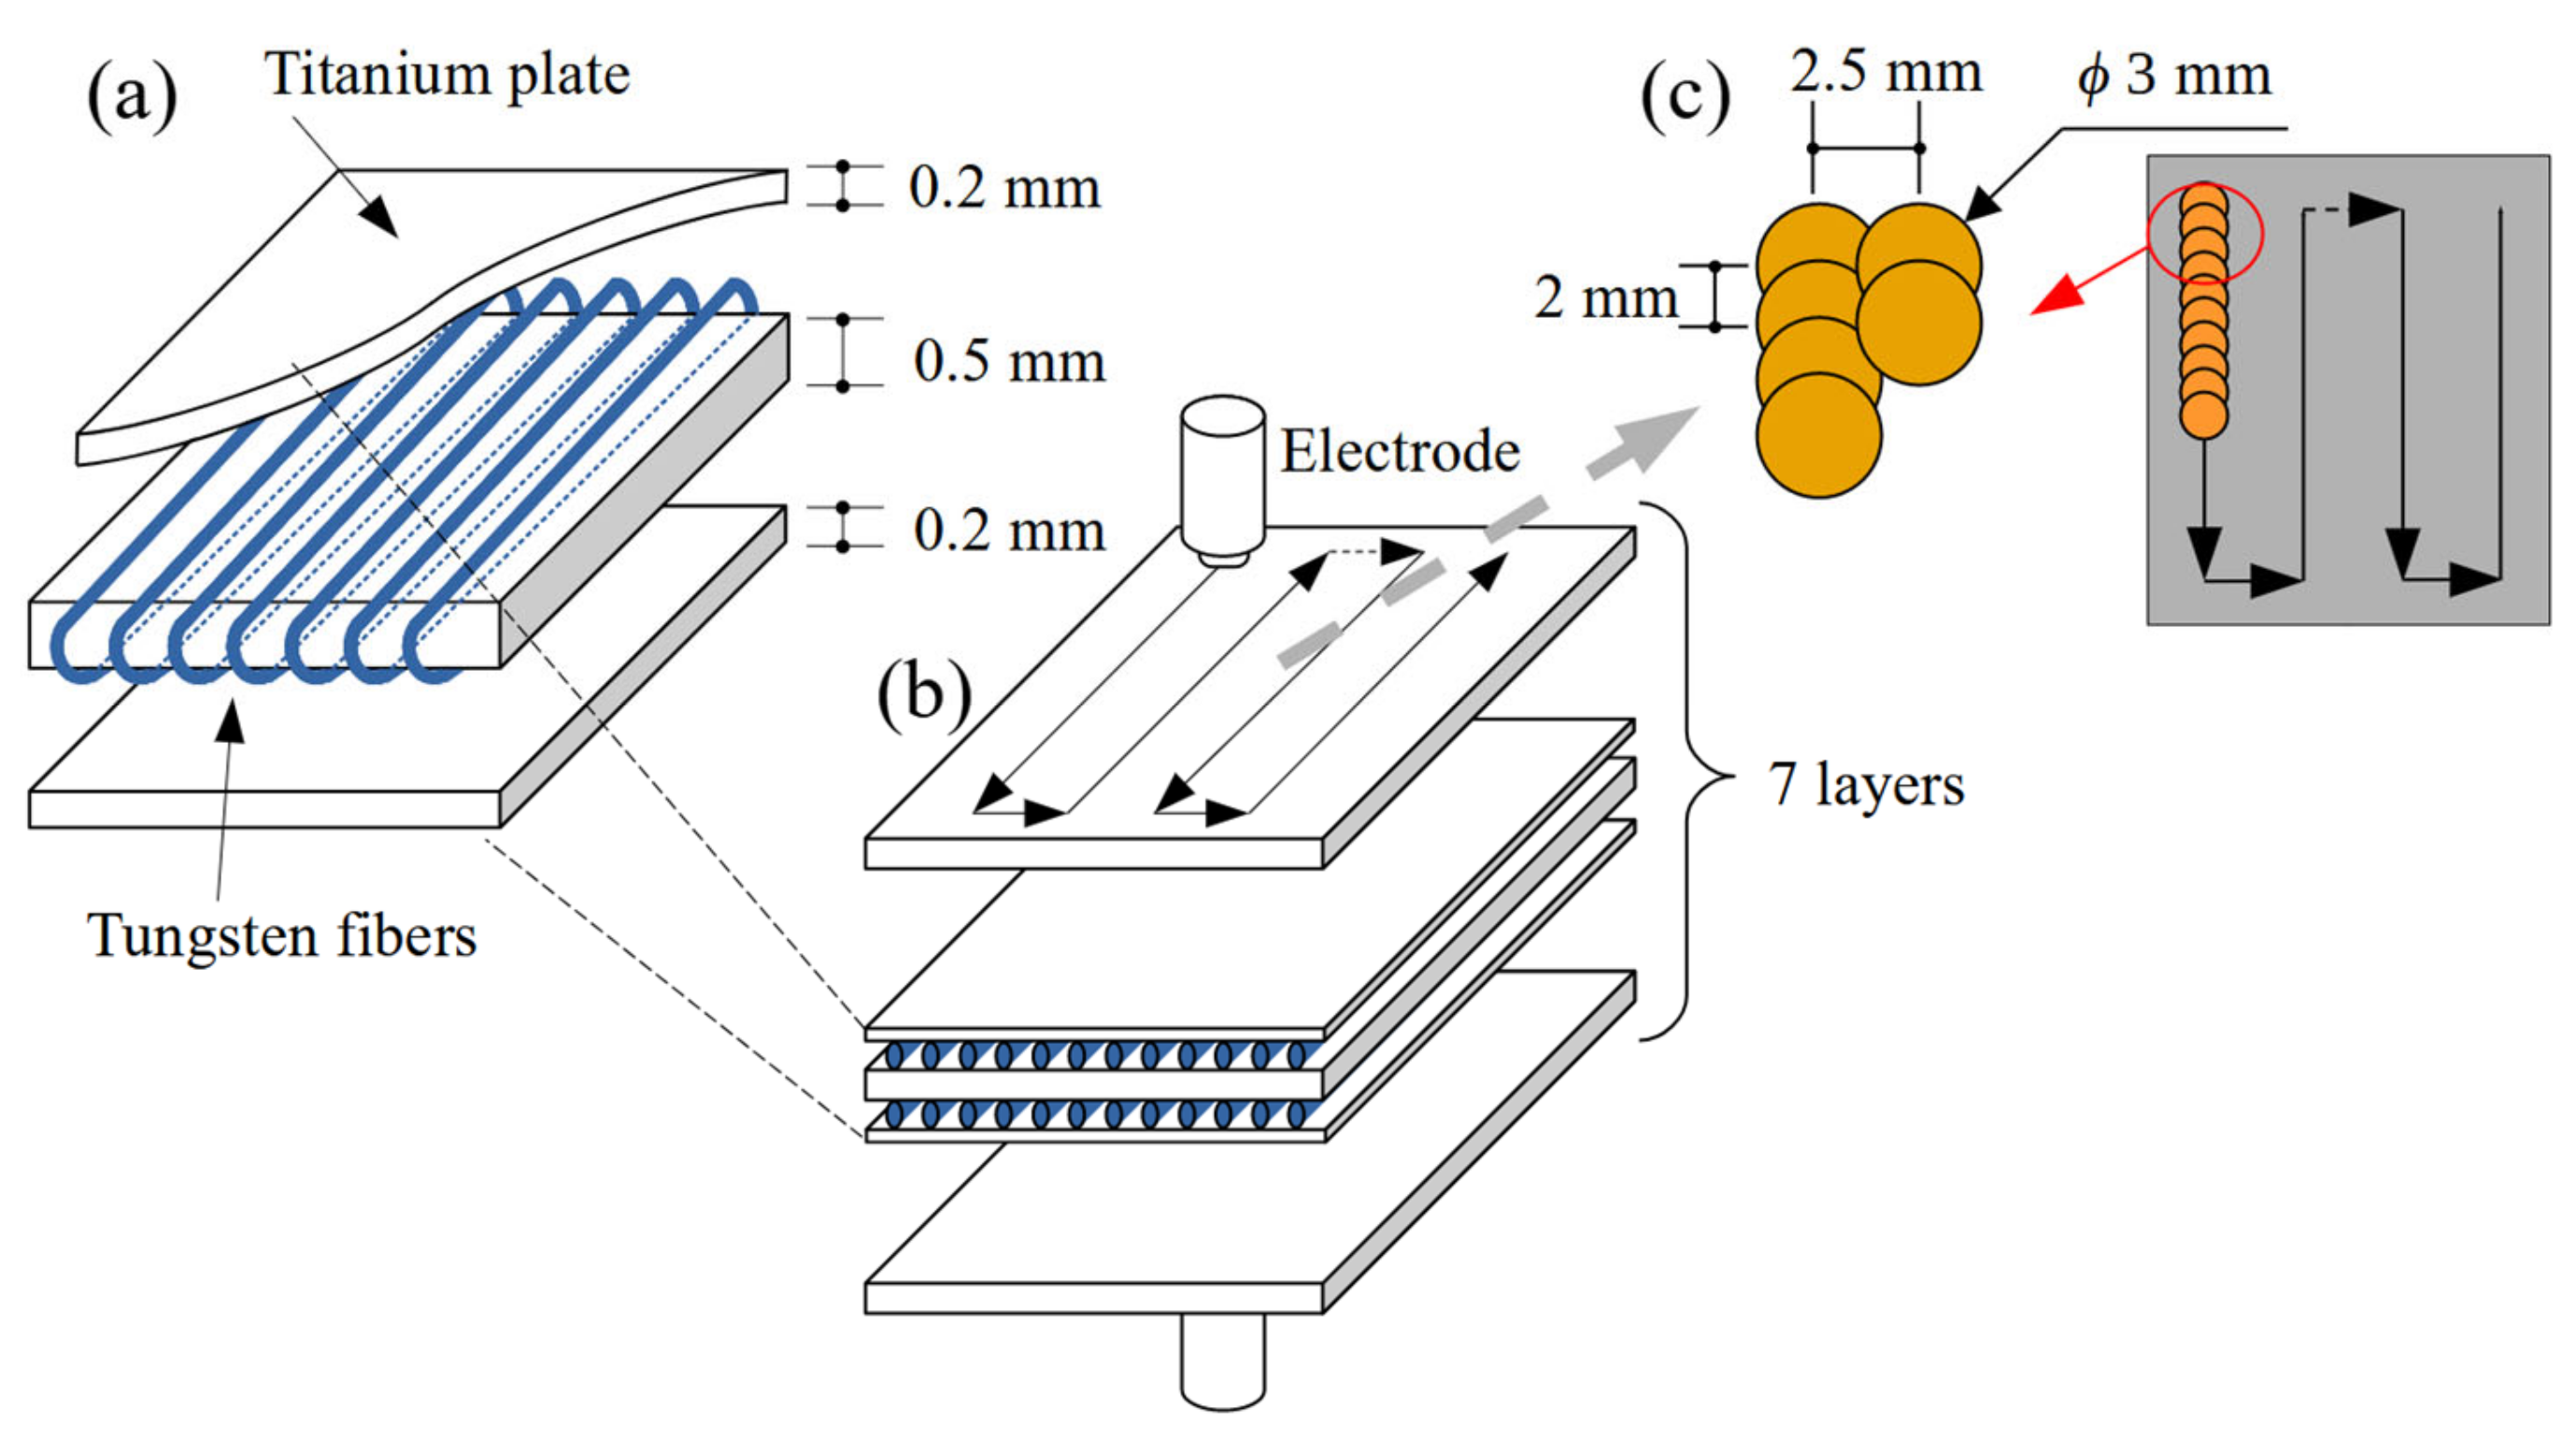
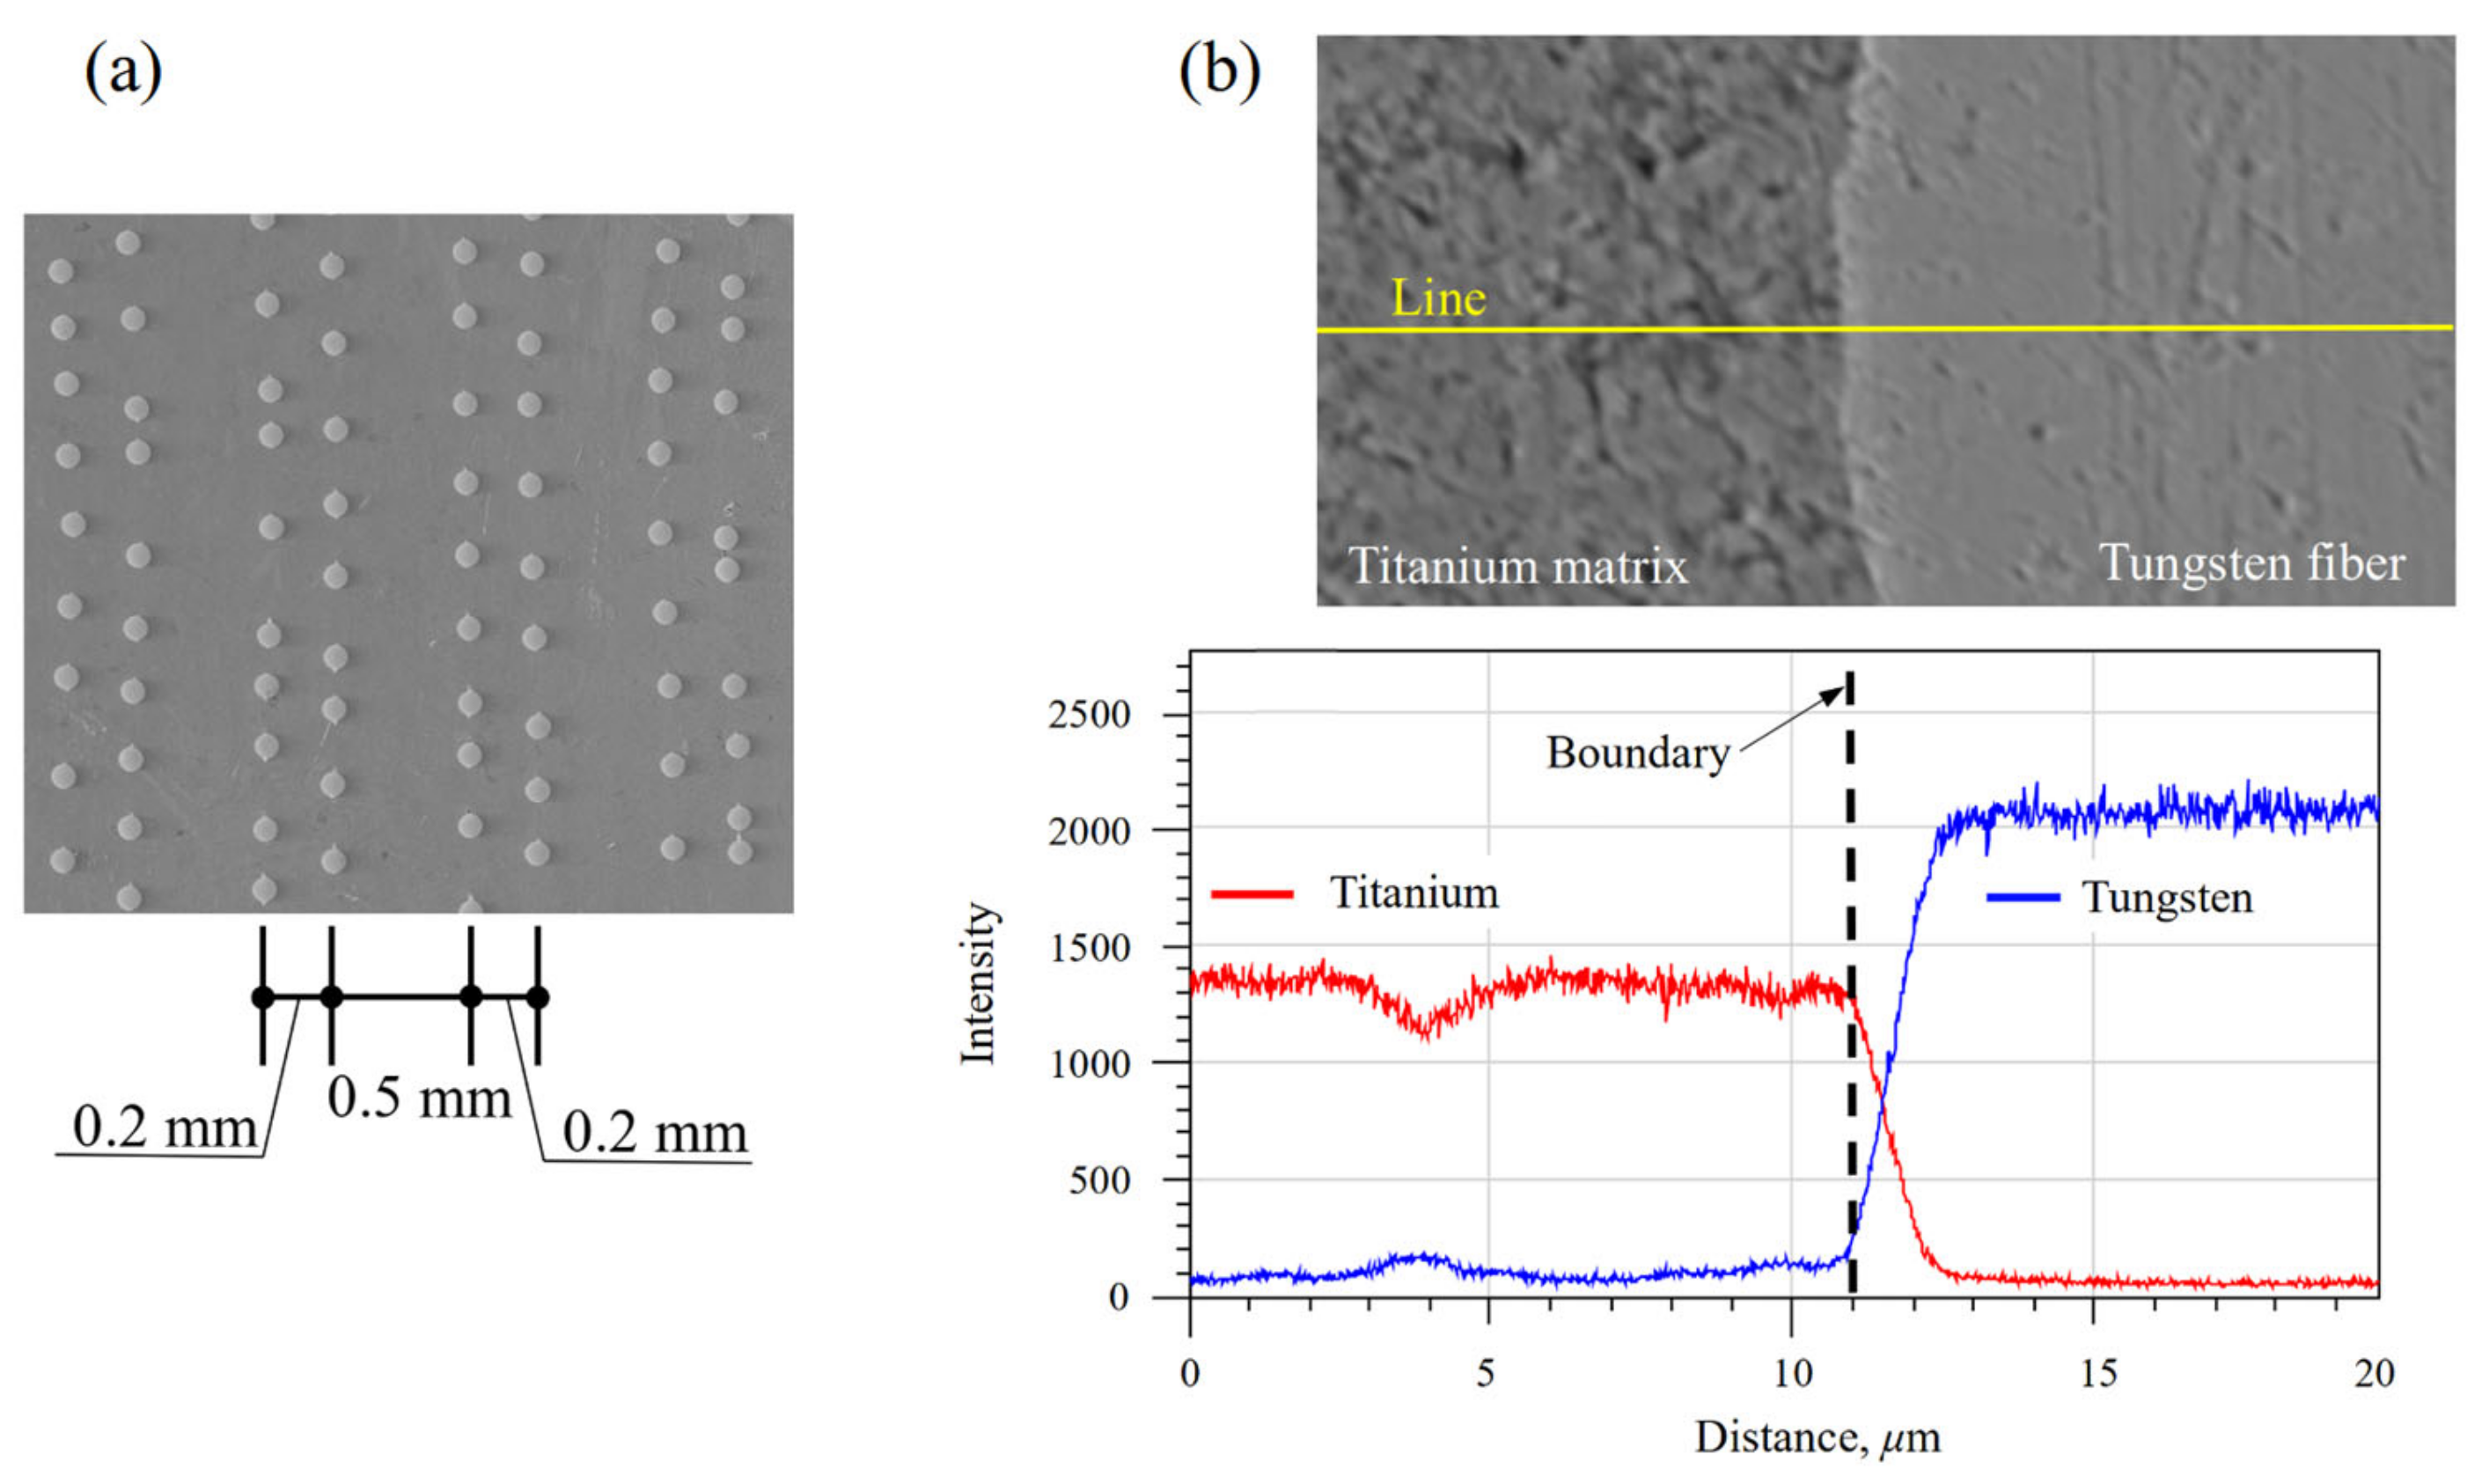
2.1. Preparation of Fiber Reinforced Material

The W/Ti composite was produced for this investigation. In this W/Ti composite, 99.99% purity tungsten fiber with 100 μm diameter and 99.9% purity industrial titanium plates of thickness 0.5 mm and 0.2 mm were used for the fiber phase and the matrix phase, respectively. In this study, the W/Ti composite was produced by the continuous spot welding method. This manufacturing method uses only a simple spot weld, and it does not need a vacuum chamber or a high temperature furnace such as existing common methods. The arranged tungsten fibers were held between titanium plates and fixed by spot welding. Furthermore, all surface areas were spot-welded continuously while moving these materials. This continuous spot-welding method supplements the small localized welds of spot welding when joining is required over the entire area of W/Ti composites. Finally, the tungsten fiber and the titanium plate were joined together to form the whole W/Ti composite. The coverage, which was a rate of welding area to the whole plate surface, became 150% for the W/Ti composite in this manufacturing.
Figure 1a–c show the schematic diagram of the manufacturing method for the W/Ti composite by continuous spot welding. Owing to a change in the thickness of the titanium plate and/or the spacing of the tungsten fiber arrangements, the volume ratio of the tungsten fibers could be freely adjusted in the W/Ti composite.
To prepare for this study, Figure 1a shows a titanium plate (0.5 mm thick) with tungsten fibers wound at regular intervals and sandwiched between other titanium plates (0.2 mm thick). As shown in Figure 1b, seven layers of these materials prepared in Figure 1a are stacked up and spot-welded. Figure 1c shows the overlapping condition of the welded part in the continuous spot-welding method, and the welding path on the surface of the W/Ti composite.
Figure 2a,b show SEM photographs of the W/Ti composite. Figure 2a is the SEM photograph of the cross-section of the W/Ti composite. The distances between the lines of tungsten fibers are about 0.5 mm and 0.2 mm. These arrangements depend upon the arrangement space of tungsten fibers and the thickness of titanium plates. Figure 2b shows the results of SEM component analysis focusing on boundary between the titanium matrix and the tungsten fibers.
The past measurement results confirmed that the titanium matrix diffuses into the tungsten fiber depending on the welding conditions such as current value, sample temperature, and coverage during continuous spot welding. In the SEM observation results in this study, it could be confirmed that the titanium matrix diffuses to the tungsten fiber side slightly beyond the boundary between titanium and tungsten. Furthermore, no oxide layer was observed between the titanium matrix and the tungsten fibers. This result indicates that the tungsten fibers and the titanium matrix are bonded metallurgically, rather than the titanium matrix simply covering the tungsten fibers.
The conditions of the spot welding are shown in Table 1. The final dimension of the W/Ti composite is 115 mm × 30 mm, with thickness of 7.0 mm. From this W/Ti composite, the measurement sample for the in situ thermal residual stress measurement of TAKUMI was cut off by 12 mm × 12 mm, with a thickness of 7.0 mm. The volume fraction of the tungsten fiber was about 5% in this sample.

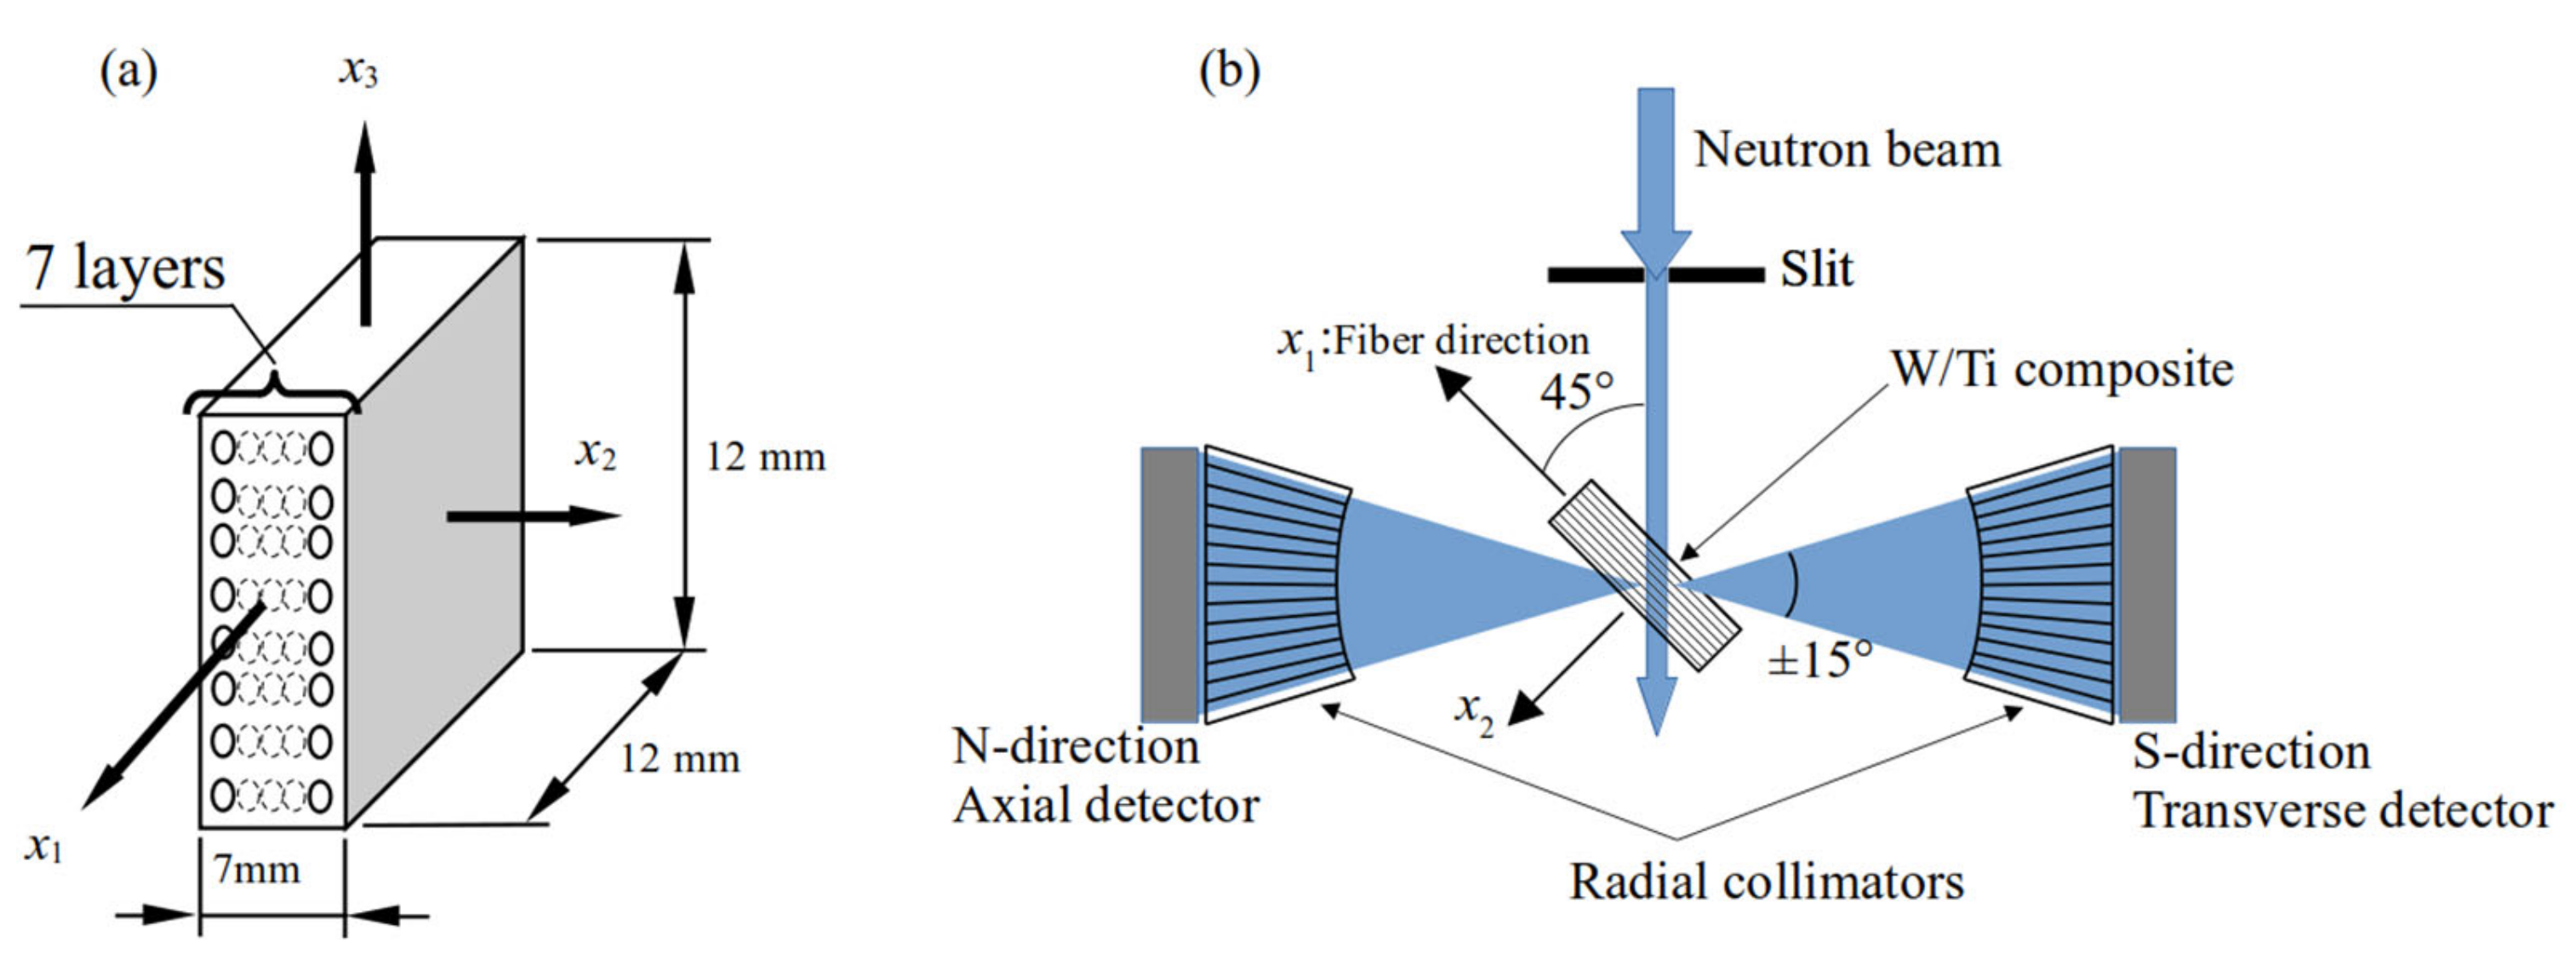
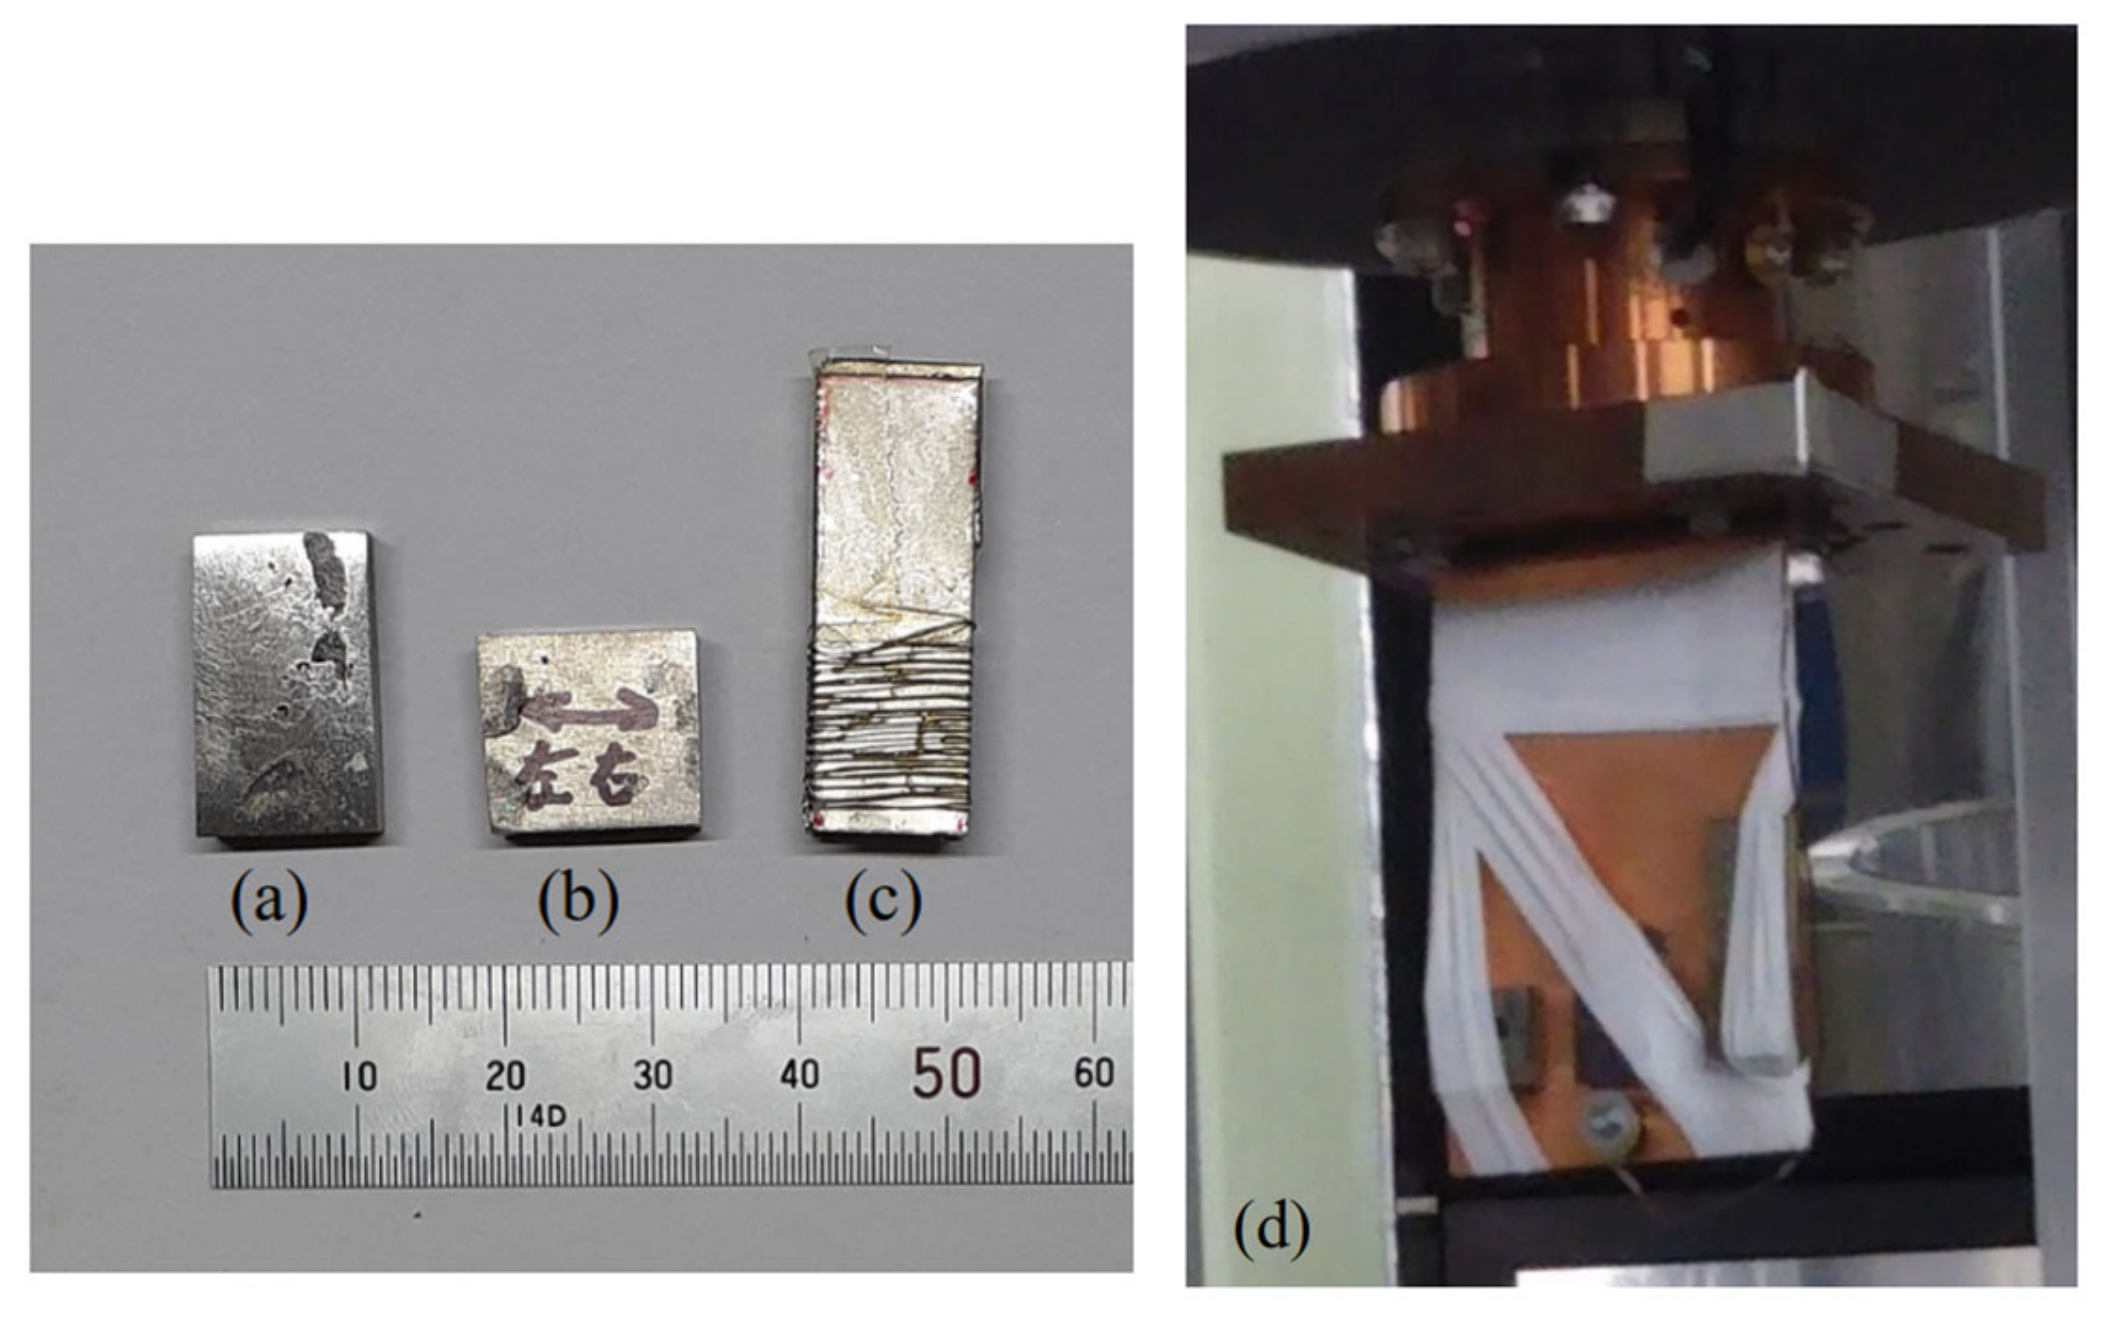
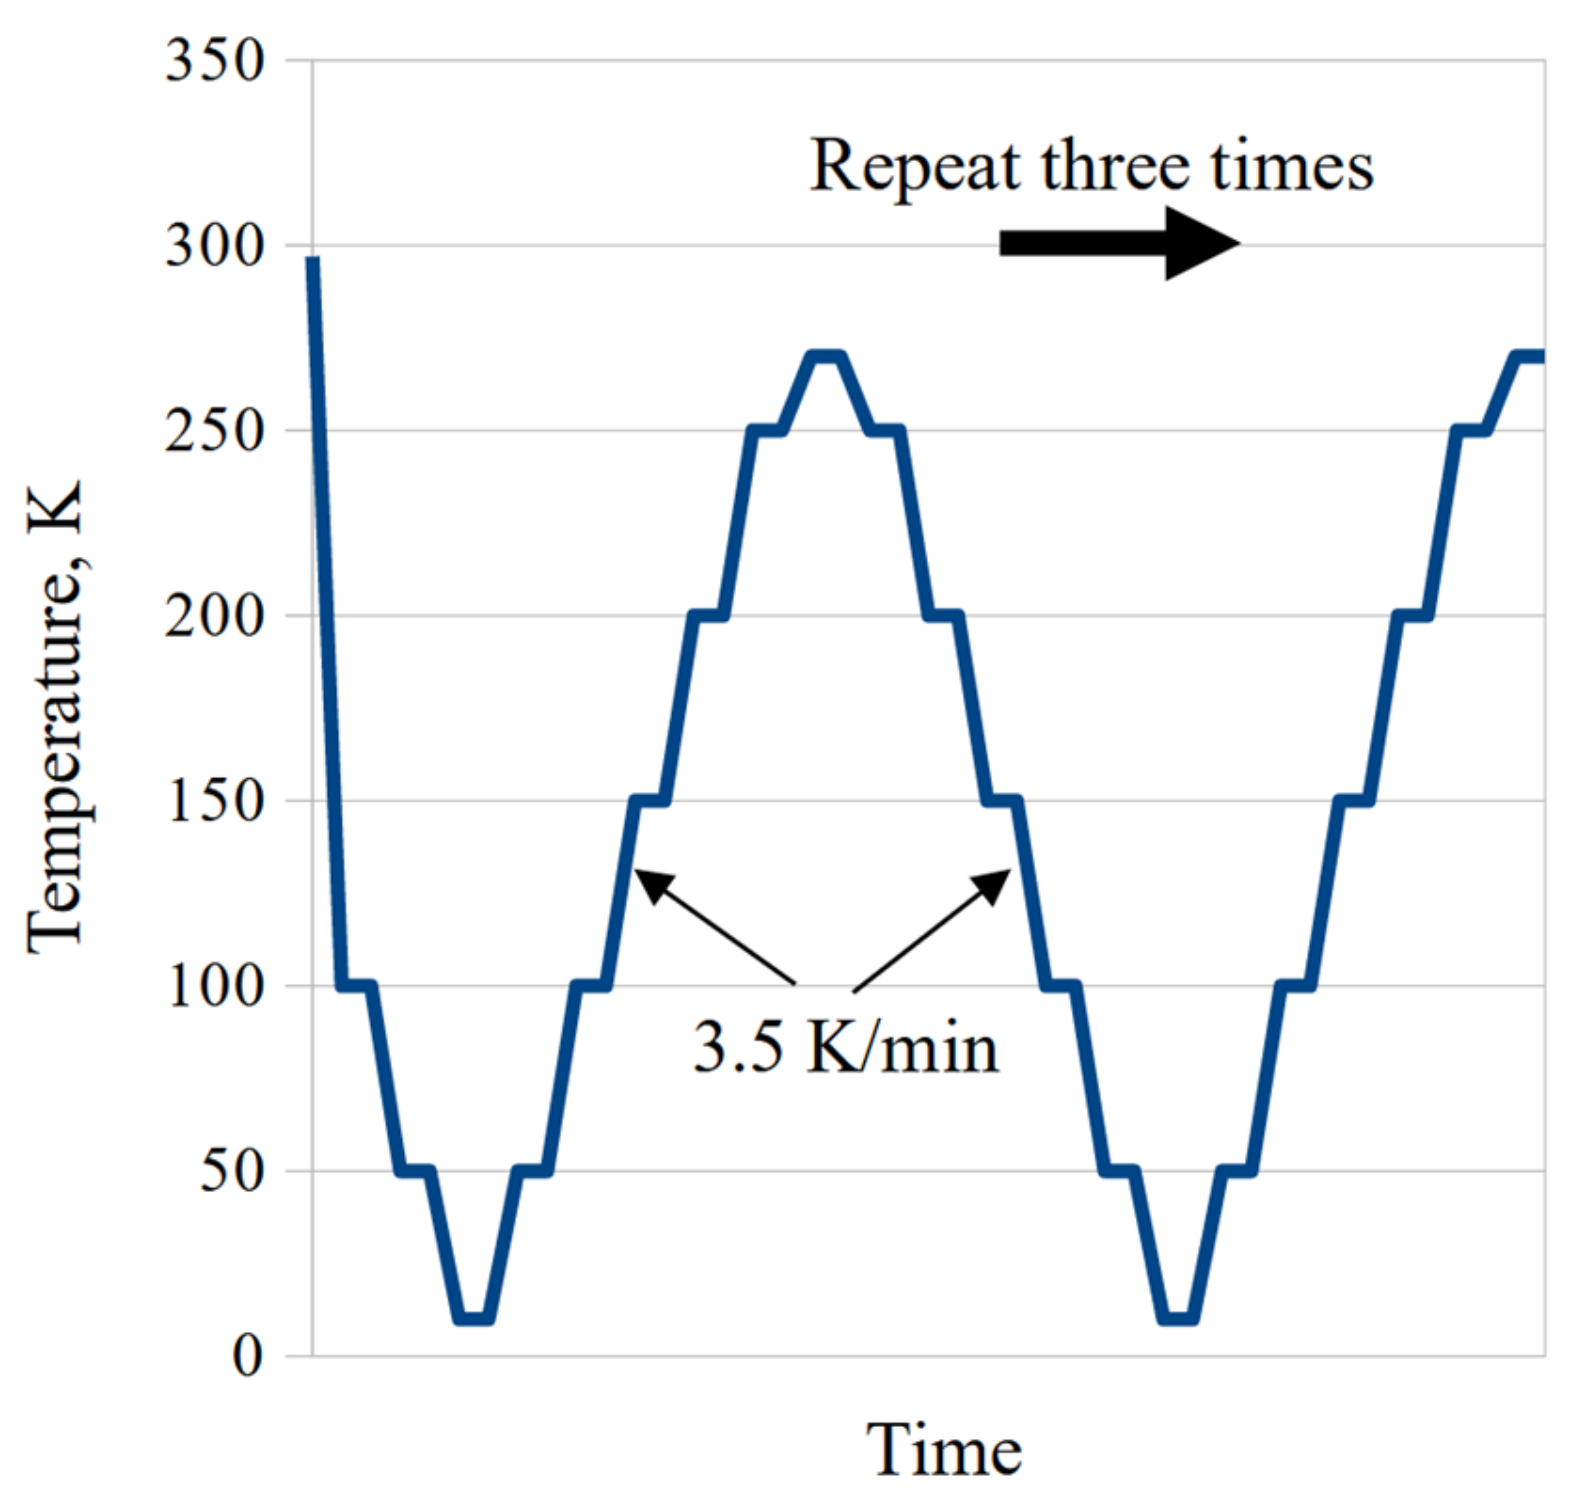
2.2. In Situ Thermal Stress Measurement

The W/Ti composite evaluated in this investigation is schematically shown in Figure 3a. The x1 axis is defined as parallel to the longitudinal direction of the tungsten fibers. The x2 and x3 axes are normal to the fiber direction. When stresses are calculated by Hooke’s equation, the strains in the three directions of x1, x2, and x3 are required. In this measurement, it was assumed that stresses and strains were almost equal in the x2 and x3 directions. Therefore, only two directions in the x1 axis and the x2 axis were measured by the neutron diffraction.
Figure 3b shows the setting condition of the W/Ti composite on the sample table of TAKUMI. Because TAKUMI has two detectors, it is possible to measure diffraction profiles in two directions with one time measurement. These directions in Figure 3b are recorded as the north (N) and south (S) directions in the measurement file names from the geographical construction position of TAKUMI(BL19). The sample of the W/Ti composite is set at a position tilted at 45° from the incident direction of the neutron beam. In the measurement results, the N-direction becomes measurement data of the longitudinal direction of the tungsten fibers (x1 direction), and the S-direction is the fiber normal direction (x2 = x3).
In the actual measurement, when the target temperature is reached, the TAKUMI sample stage is moved to the measurement position of three samples by sliding with the cryostat on it. Therefore, three time measurements are made for one temperature.
Figure 4a–d show photographs of three samples prepared for the in situ stress measurements. Figure 4a is a d0 sample of the titanium. This sample was manufactured by the spot weld of titanium plates without tungsten fibers. Figure 4b is the W/Ti composite material evaluated in this study. Figure 4c is a tungsten sample for d0 measurement, in which tungsten fiber is loosely wrapped around a titanium plate. These three samples were pasted to a copper plate by glue and tape. Figure 4d shows the sample setting condition on the cryostat cooling head. In this photograph, three samples were fixed with a thin white tape, so that they did not fall off from the copper plate due to shrinkage of cooling cycles. This white tape is a water leak prevention tape used for water pipe leaks. These measurement techniques are used by JAEA staff who assist the measurement on site. Such know-how is very important for actual measurement, and the authors were provided with full support by JAEA staff.
In this measurement, a sample of tungsten fibers wrapped around titanium plates was prepared for d0 measurement. However, the measurement accuracy of the measurement results deteriorated because the peaks of titanium and tungsten overlapped. In neutron stress measurement, d0 measurement in a stress-free state is very important. As an improvement method, when measuring d0 of several materials, it is necessary to measure the samples separately for d0 measurement without combining them.
In this study, stress alterations due to low-temperature cycling were measured by the in situ neutron stress measurement technique. During the measurement of TAKUMI, the recording of diffraction profile data using the time-of-flight method, sample movement, and temperature control of the cryostat system were centrally managed by the main computer system.
Figure 5 shows a schematic diagram of the temperature vs. the time program for the in situ stress measurement of the W/Ti composite by TAKUMI. Measurement temperatures are seven points of 270 K, 250 K, 200 K, 150 K, 100 K, 50 K, and 10 K. The rate of temperature change is about 3.5 K/min in the cool down and heat up stages. When the temperature came to a target position, it was held for about 15 min in order to stabilize; after that, the stress measurement started in every case. The temperature during measurement was held at ±0.1 °C. One cycle consists of the cool down stage and the heat up stage, and three cycles were repeated in this measurement.
The thermal residual stresses σ1 parallel to the longitudinal fiber direction and σ2 normal to the longitudinal fiber direction were measured using Hooke’s Equation (1).
σ 1 = E 1 + ν ε 1 + ν 1 2 ν ε 1 + ε 2 + ε 3 σ 2 = E 1 + ν ε 2 + ν 1 2 ν ε 1 + ε 2 + ε 3 σ 3 = E 1 + ν ε 3 + ν 1 2 ν ε 1 + ε 2 + ε 3
Table 2 shows the conditions of the in-situ neutron stress measurement. In this measurement, Young’s modulus E and Poisson’s ratio ν of the titanium matrix depend on the hkl diffraction plane. These material parameters were calculated from the Kroener model in the home page of “The Committee on X-ray Study on Mechanical Behavior of Materials, Japan” [17].
In this measurement, E and ν were constant for temperature, and thermal expansion coefficient α was considered for the temperature dependency. Specifically, these temperature dependencies were defined by results of the experimental measurement for titanium and tungsten in this study. The measurement time for one diffraction profile was about 10 min for each of the three samples explained in Figure 5. Lastly, the measuring time of one cycle in this measurement became about 4 h.
Furthermore, the simple elastic calculations of thermal expansions were performed and compared with experimental results. This calculation assumes the one axial loading model, and it is shown by the following theoretical equation:
σ W = E W E T i V T i E W V W + E T i V T i α W α T i Δ T σ T i = E W E T i V W E W V W + E T i V T i α T i α W Δ T ,
where suffixes denote the materials, E is Young’s modulus, α is the coefficient of thermal expansion, ΔT is the temperature difference, and V is the volume fraction of the tungsten fiber. Young’s modulus E and the thermal expansion coefficient α used the same parameters in Table 2, and the volume fraction was VW = 5% in this calculation. The initial stresses needed to calculate the residual stresses were supposed at the room temperature 300 K position. The measurement values in both the tungsten fiber and the titanium matrix were used for these initial residual stresses.

3. Results

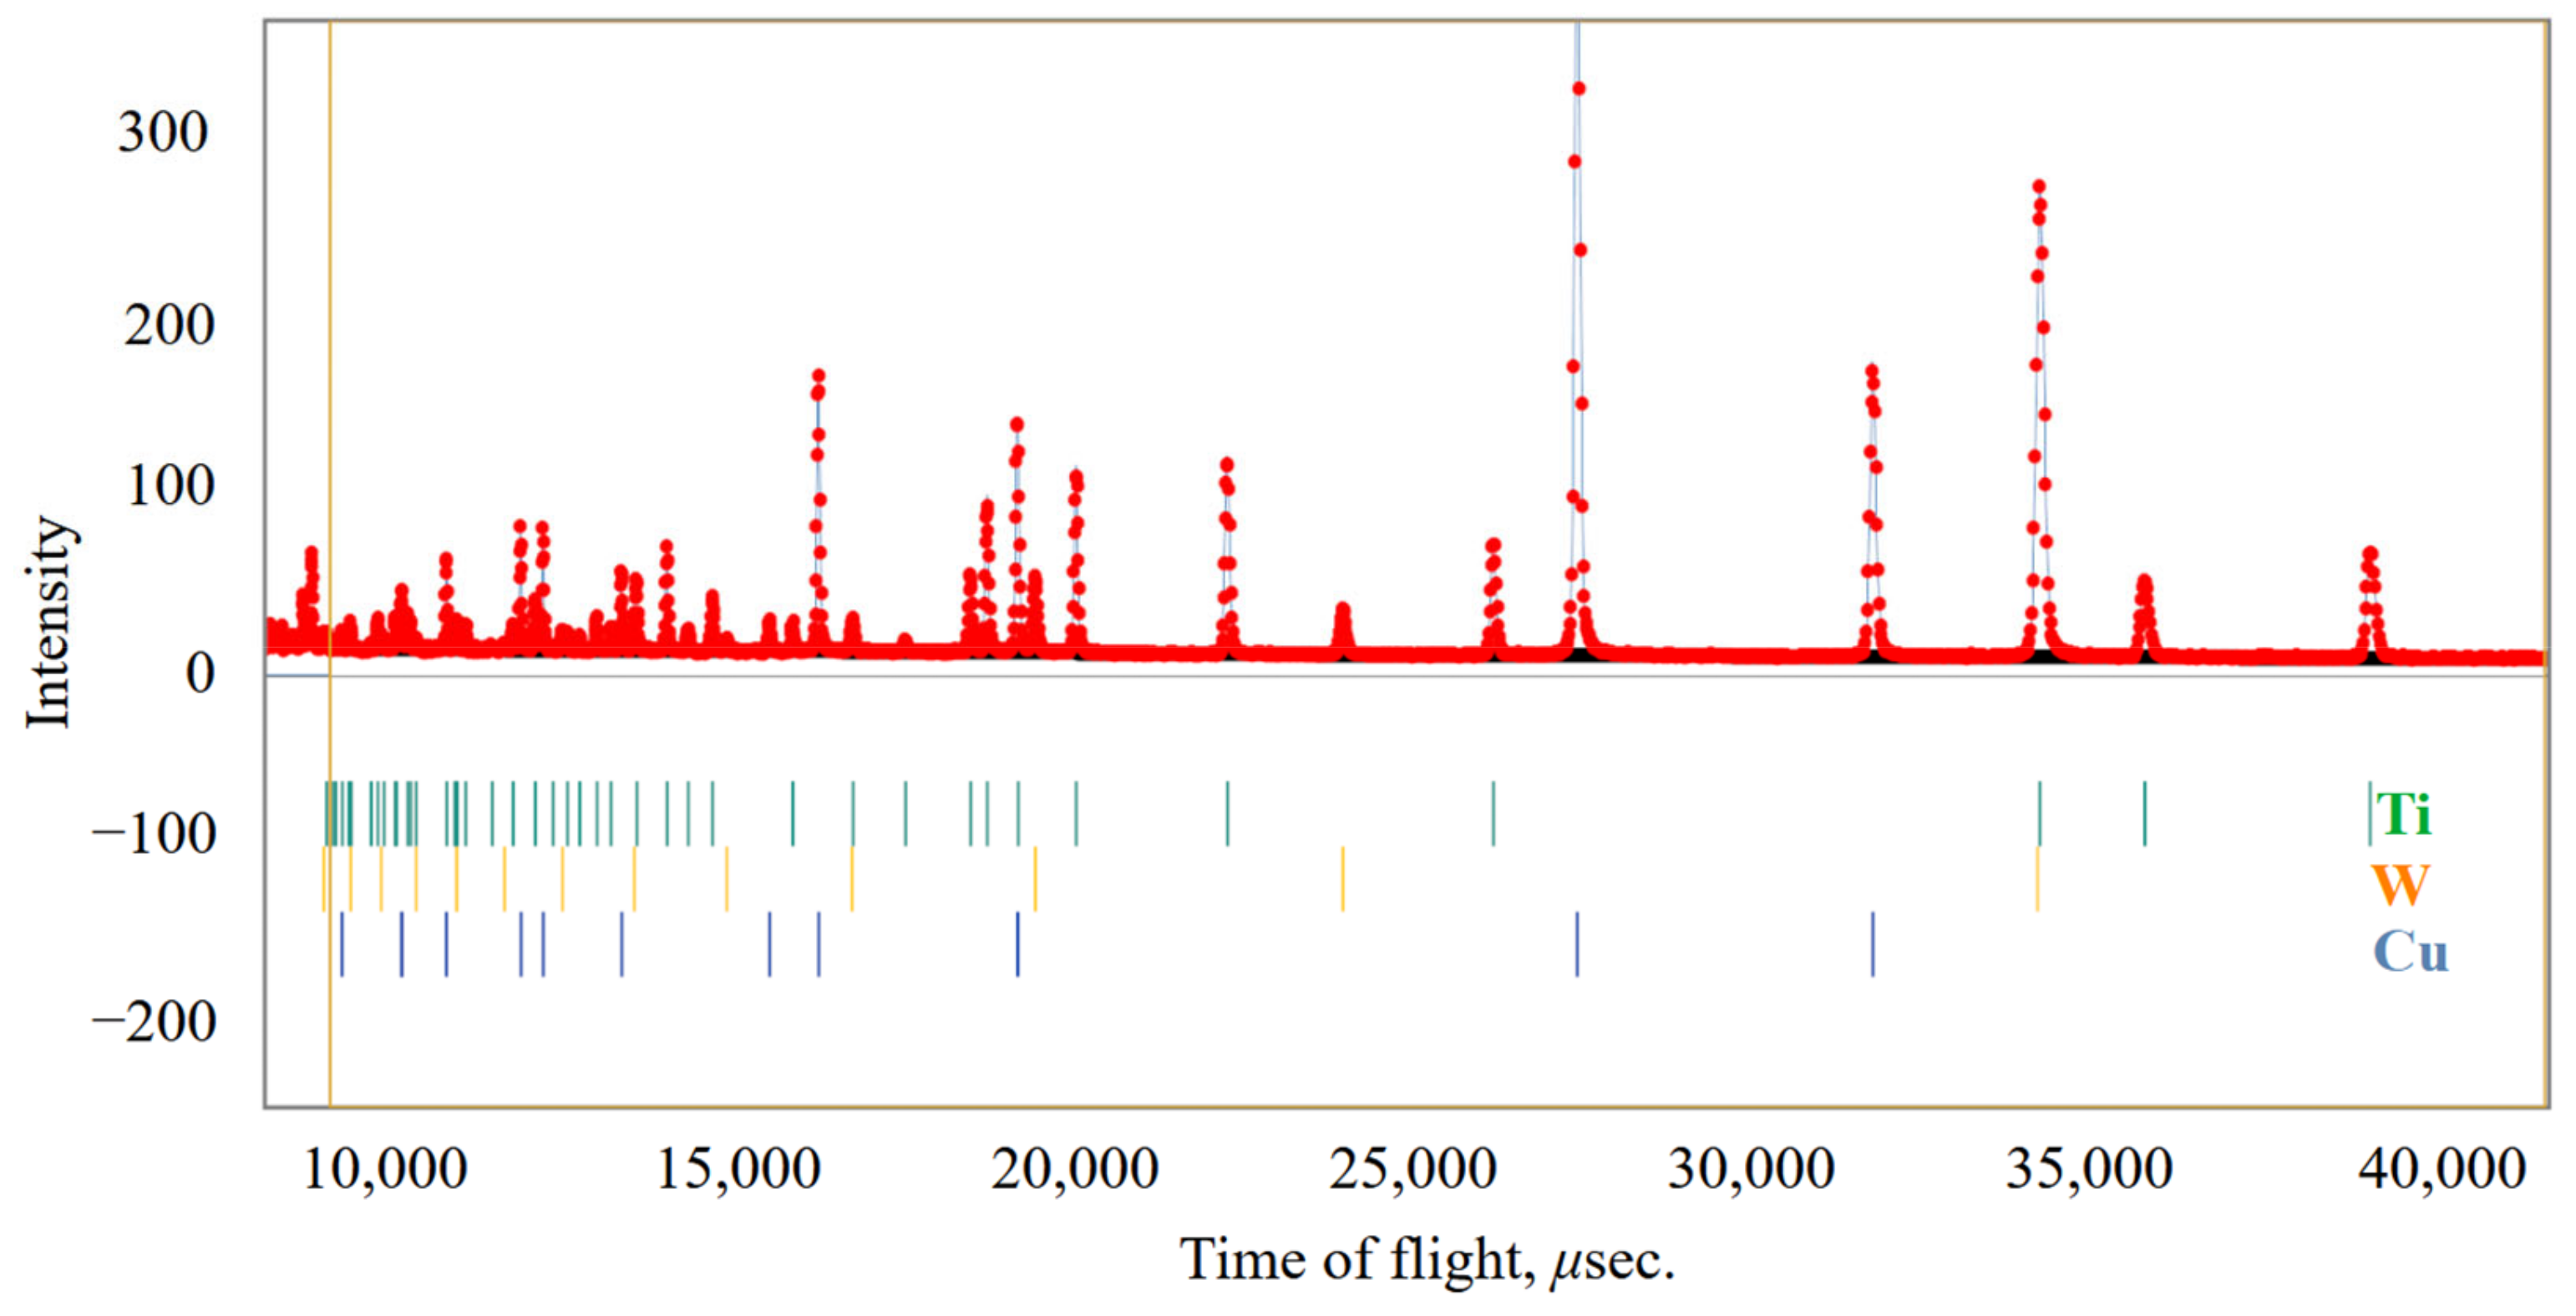
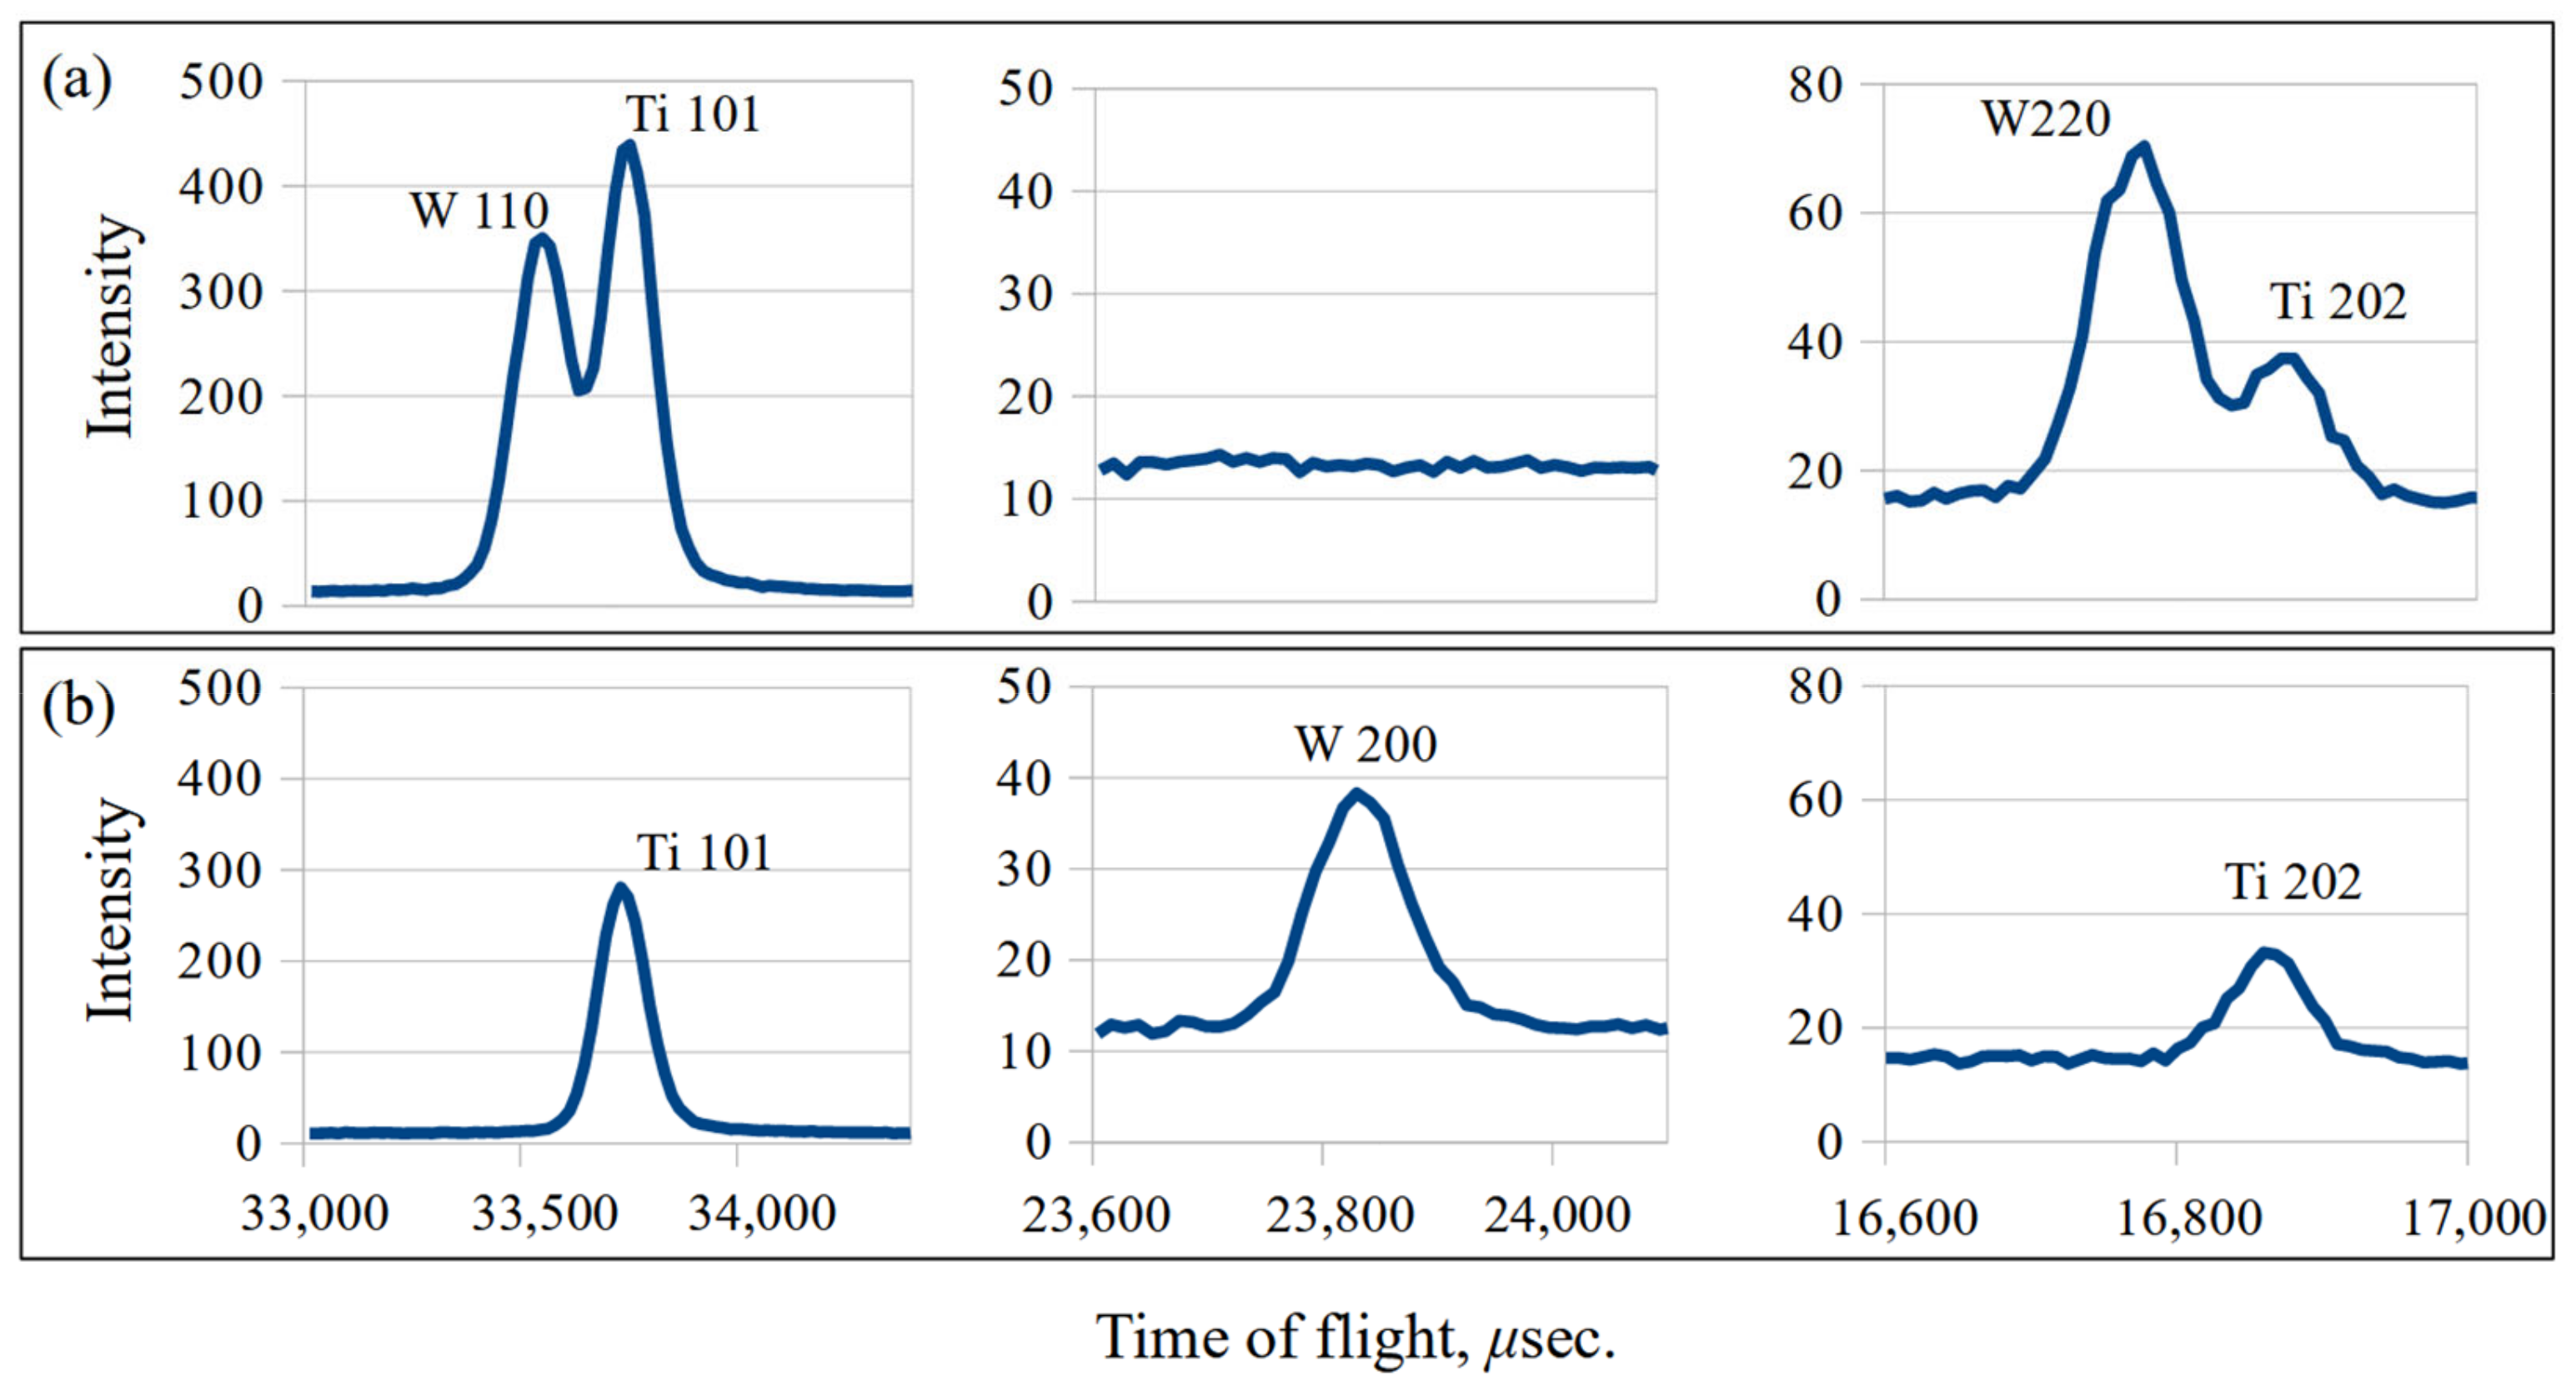
3.1. Diffraction Profile by the Time-of-Flight Method

Figure 6 shows an example of the diffraction profile measured by the TOF method of TAKUMI. In this profile data, diffraction peaks from the tungsten fibers and the titanium matrix of the W/Ti composite appeared, and diffraction peaks from the copper plate on which the samples were attached could be confirmed. This diffraction profile was obtained in a measurement time of 10 min. A very clear and wide range peak profile was obtained. This is a measurement result that cannot be obtained using the angular dispersion method with a goniometer, which the author has previously used. These diffraction profiles were peak-fitted using the Z-Rietveld software for Rietveld analysis [18]. However, when there are peak shifts in profiles, some peaks appear at irregular positions, and Z-Rietveld software can be fitted for any peaks independently of the constraints from Bragg’s equation. Therefore, the Z-Rietveld software was employed for the peak-fitting treatment in this study. The Z-Rietveld software is provided free of charge from the JAEA homepage.
Figure 7a,b show the comparison of the diffraction profile in the N-direction and the S-direction from W/Ti composites. In this figure, diffraction peaks from W110, W200, W220, Ti101, and Ti202 are compared. Figure 7a is the result of measurement in the N-direction, where W110 and W220 appear and W200 disappears. On the other hand, Figure 7b is the result of measurement in the S-direction, where W110 and W220 disappear and W200 appears. From these results, it was confirmed that the tungsten fibers have a strong 110 fiber preferential orientation form these results.
Previous reports also confirmed the existence of a strong 110 fiber preferential orientation in tungsten fibers. Furthermore, the 110 fiber preferential orientation of tungsten fibers was also confirmed in the raw material tungsten fibers before W/Ti production. The main cause is considered to be the drawing process when the fibers were manufactured. On the other hand, such an orientation was not confirmed in the diffraction line of titanium matrix. In this way, the disappearance of the diffraction peak due to the fiber preferential orientation is a serious problem when measuring with an angle dispersion goniometer. Due to the extremely long measurement time required by the angular dispersion method, it was not possible to measure the entire range of diffraction peaks in advance. However, the TOF method of TAKUMI can simultaneously measure many diffraction peaks in addition to the disappeared peak W200. Although some diffraction peaks of tungsten fibers disappeared in this W/Ti composite, tungsten has the properties of being completely isotropic, and it was assumed that the lattice spacing d measured at any diffraction plane would be the same value. Therefore, the average strains calculated from all tungsten diffraction peaks fitted by the Z-Rietveld software were evaluated in this study.

3.2. Strain Calculation by the TOF Method

In this study, the strains generated by temperature alterations were calculated from the measurement results of the TOF method of TAKUMI. The relationship between lattice spacing d and flight time t in the time-of-flight method is explained by the following equation
d = λ 2 s i n θ = 1 2 s i n θ h m L   ,
in this equation, h is Planck’s constant, m is the mass of a neutron, and L is the flight distance of neutrons, which is a constant value at the distance from the neutron source to TAKUMI (BL19). The diffraction angle θ is also a constant specific to the TAKUMI instrument. From Equation (3), it can be confirmed that the lattice spacing d is simply related to the flight time t by a constant value.
ε = d d 0 d 0 = T O F T O F 0 T O F 0   .
The strain ε in each direction is given by Equation (4). By substituting Equation (3) into Equation (4), the strain can be calculated using the flight time t. Since there is no need to convert to the lattice spacing d, the strain can be calculated very easily. From this result, strains were calculated directly from the measured values of the time of flight t in this study. The strain measurements are basically the relative changes of peak positions from the stress-free condition; therefore. as long as the data reduction processes are conducted with the same procedure for all conditions, the effect of data reduction in the peak position must be very small [19]. These experiments focused on the thermal stresses, and the change in the peak symmetry by cooling and heating was not observed. The change in the position of the measurement was performed only by changing the sample types (composite and two constituents as d0 samples) when the temperature was changed. For the same sample, the measurement was performed exactly at the same position. Moreover, the data analysis was conducted to refine the lattice constant using the Pawley method with many peaks; therefore. the effect of the energy distribution was also very small.

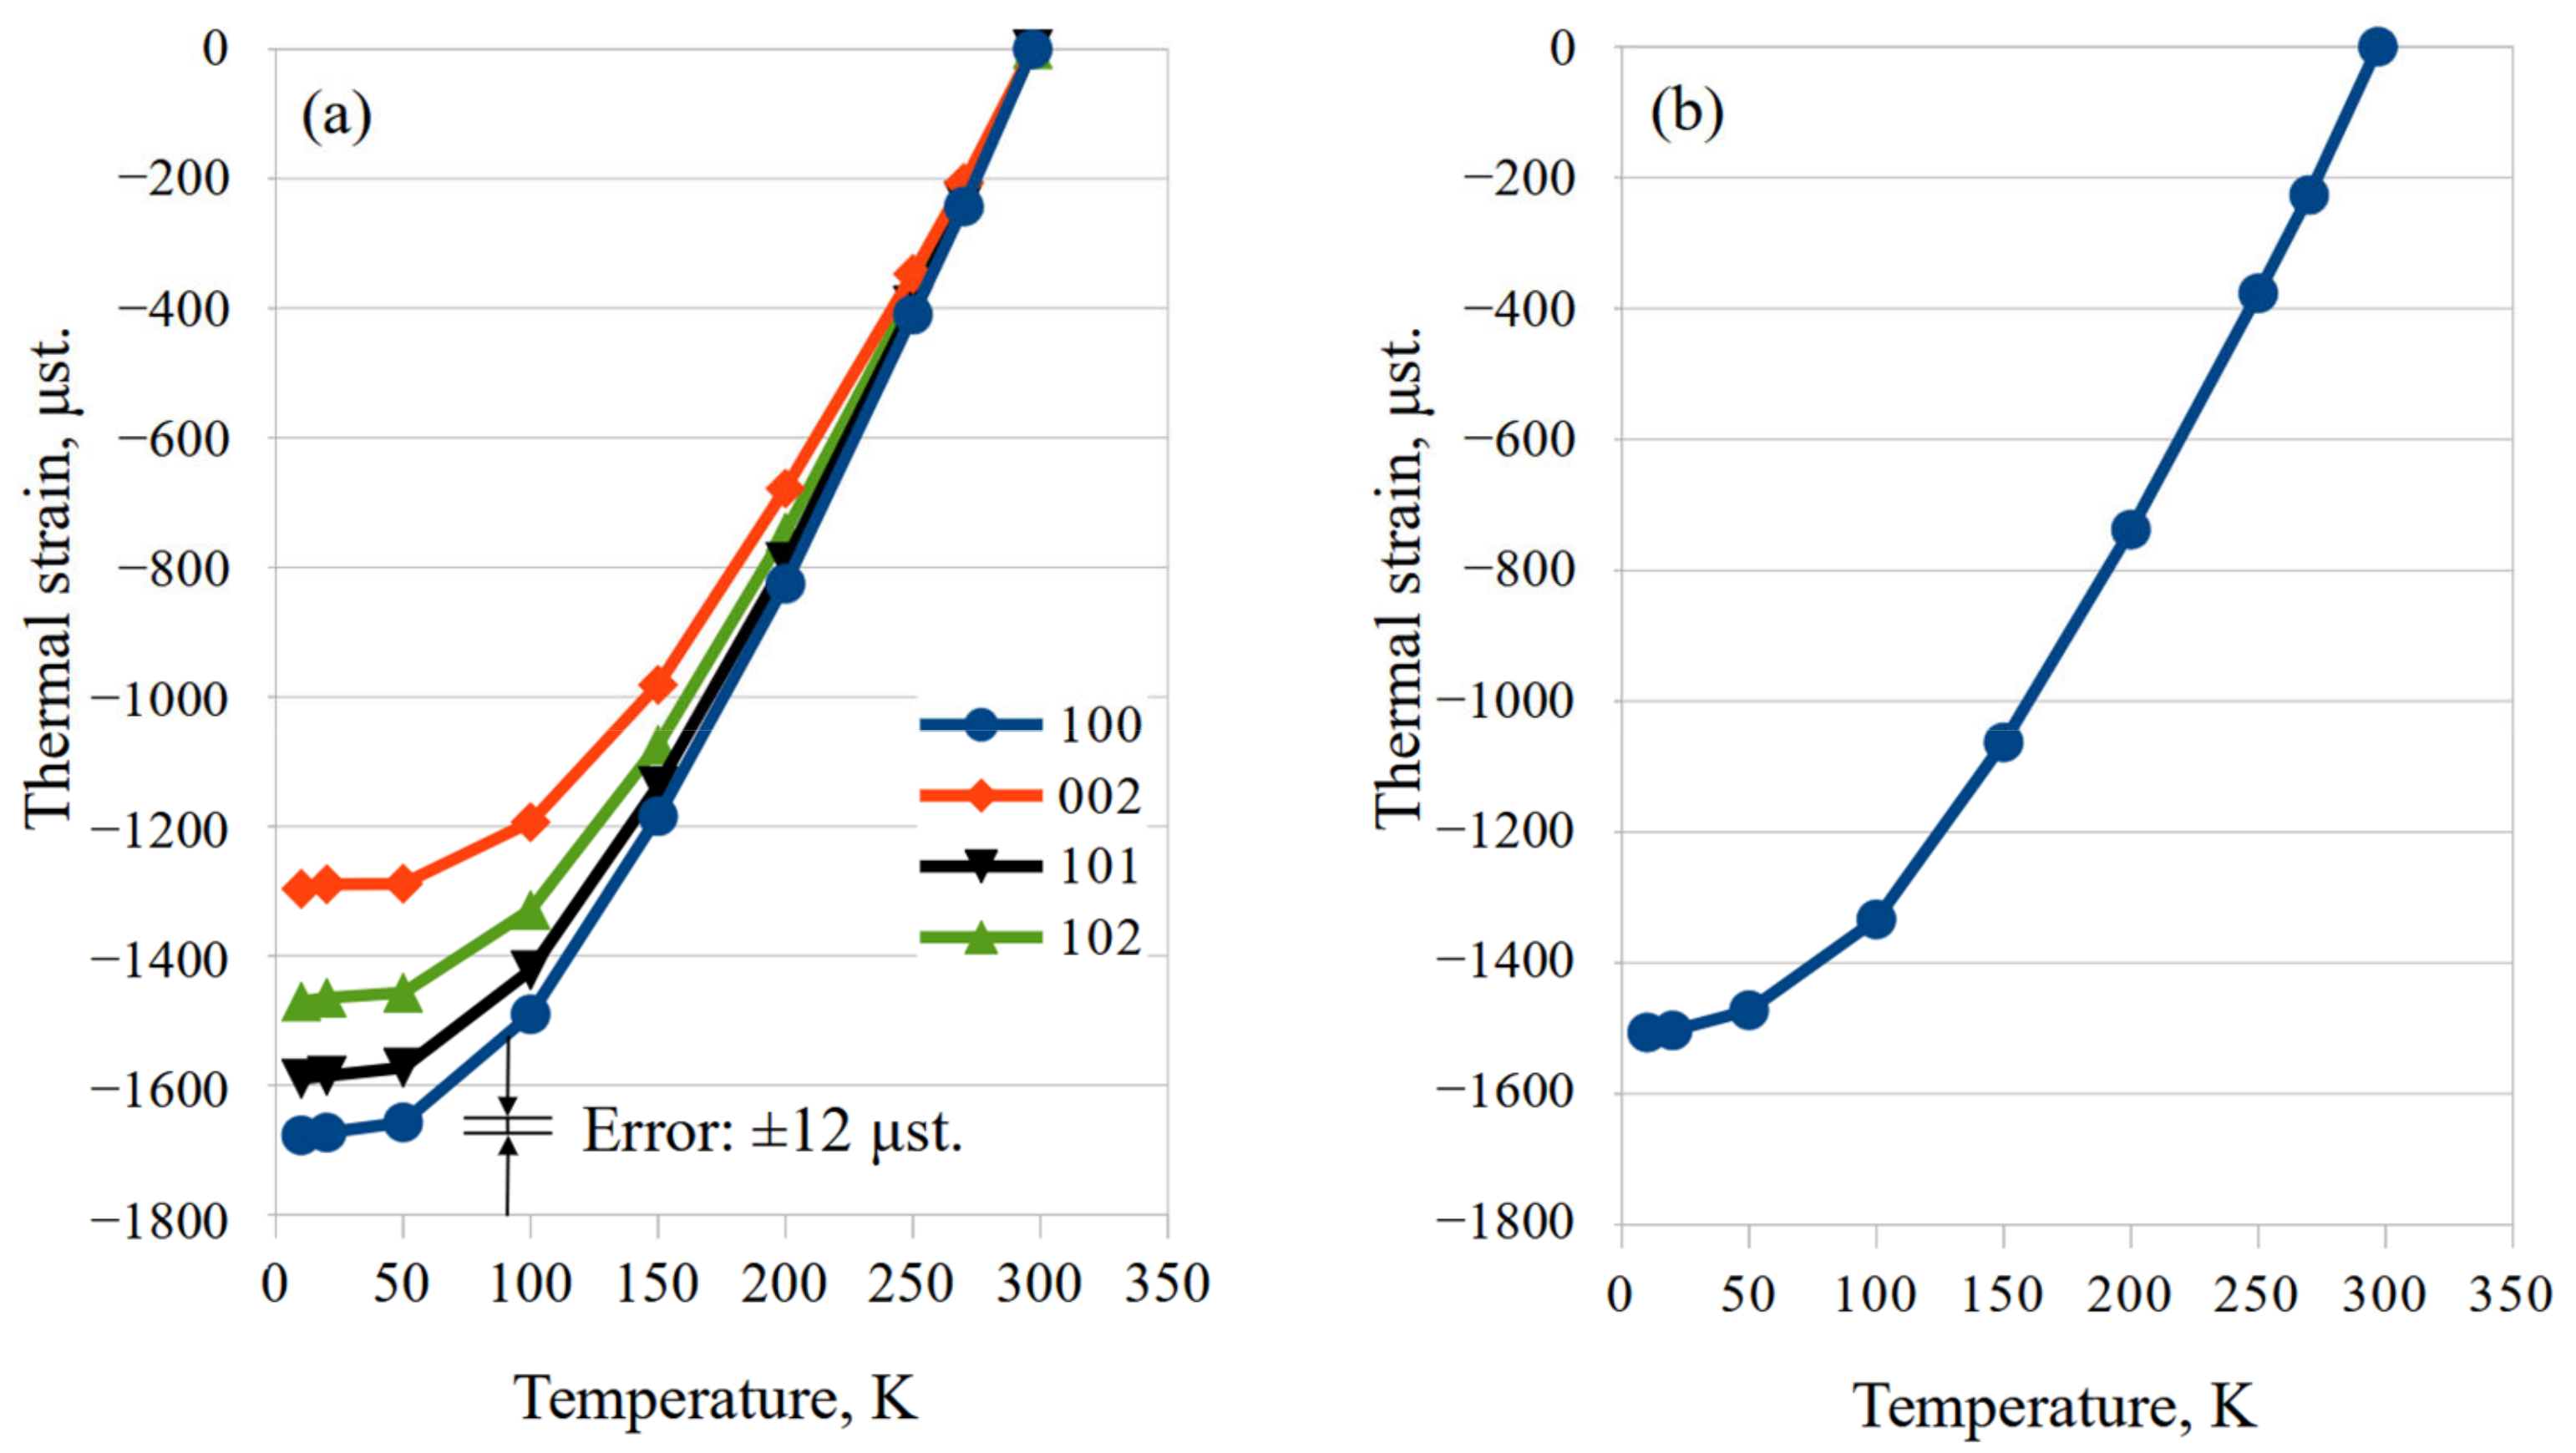
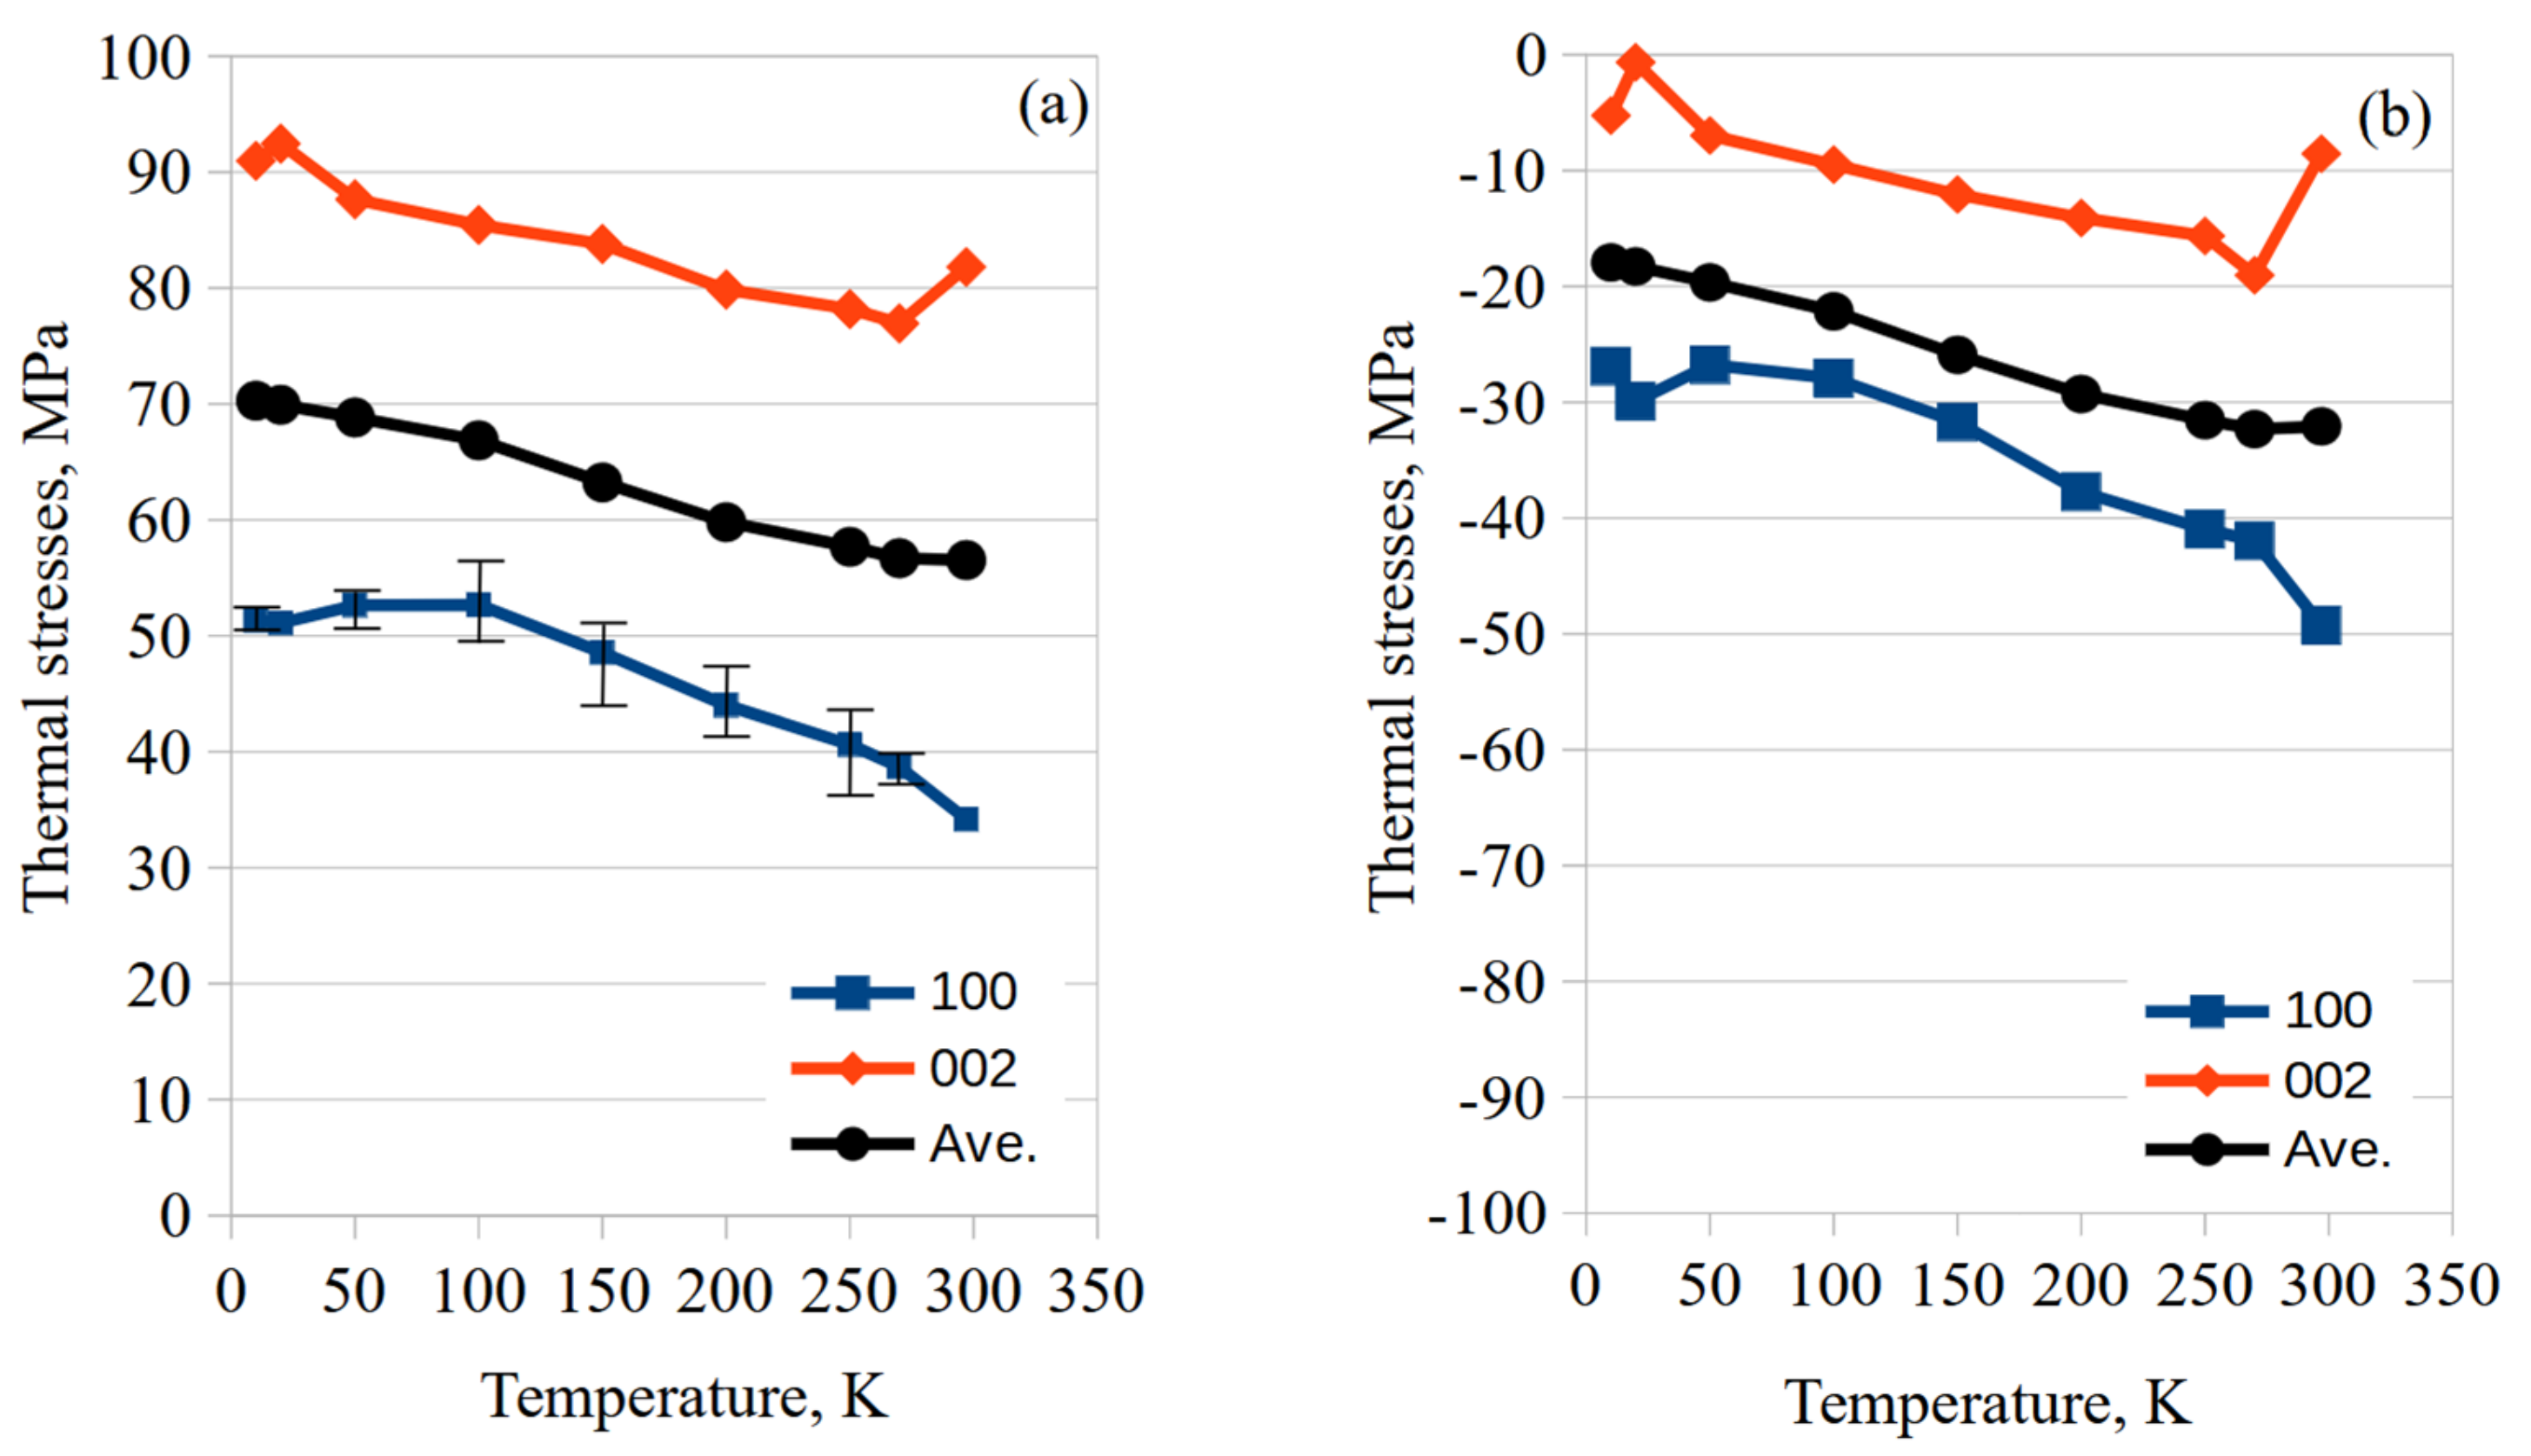
3.3. Results of Thermal Strains

Figure 8a,b show examples of thermal strain alterations from the results of the diffraction peaks measurement of the titanium matrix and the tungsten fibers in the W/Ti composite. These thermal strains were caused by thermal shrinkage in the longitudinal direction of fibers. These strains were calculated using the lattice spacing at room temperature as the initial value. However, the lattice spacing was not actually obtained; the TOF value was used as described above.
From this result, it can be confirmed that thermal strains were generated from thermal shrinkage due to temperature changes in both the titanium matrix and the tungsten fiber. Figure 8a shows the measurement results for titanium matrix. From these results, it can be confirmed that different thermal strains were generated in the titanium matrix depending on the hkl diffraction planes. Since the crystal system of α-titanium is a hexagonal structure, the thermal expansion coefficients of the a-axis and the c-axis are different. Therefore, different thermal strains were generated in each diffraction plane. In Figure 8a, the 100 plane with the largest strain corresponds to the a-axis of thermal strains, and the 002 plane with the smallest value corresponds to the c-axis in thermal strains. As the hexagonal crystal has many diffraction planes, thermal strains from other diffraction planes exist between the thermal strains of the a-axis and the c-axis. The Ti101 plane and the Ti102 planes are shown in Figure 8a as representatives. Error bars are displayed for the measurement results of the Ti100 plane in Figure 8a. Error bars indicate the scatter of thermal strain at each temperature. It can be inferred that the measurement was performed with high precision because the scatter of strains in each temperature was extremely small about ±12 μ strain. From the results of this measurement, it was confirmed that the alterations in thermal strain were generated by the thermal cycle changes along the same path in the case of temperature rise and temperature drop. These tendencies were the same for other diffraction planes, and the scatter in thermal strain at each temperature was very small. Therefore, the display of error bars on other diffraction planes was omitted.
Figure 8b shows the thermal strain alterations in the tungsten fibers. Only the average value is shown because the scatter in the strain value at each temperature was even smaller than the measurement results for titanium matrix. In the case of tungsten, since there is no anisotropy due to the diffraction planes, the thermal strains do not depend on the diffraction planes, and the same result was obtained regardless of which diffraction planes were selected. From both results, it was confirmed that the alterations in thermal strain were generated by the thermal cycle changes along the same path in the case of temperature rise and temperature drop. These results show the strain in both the titanium matrix and the tungsten fibers fluctuated the region of elastic deformation, indicating that plastic deformation does not occur.

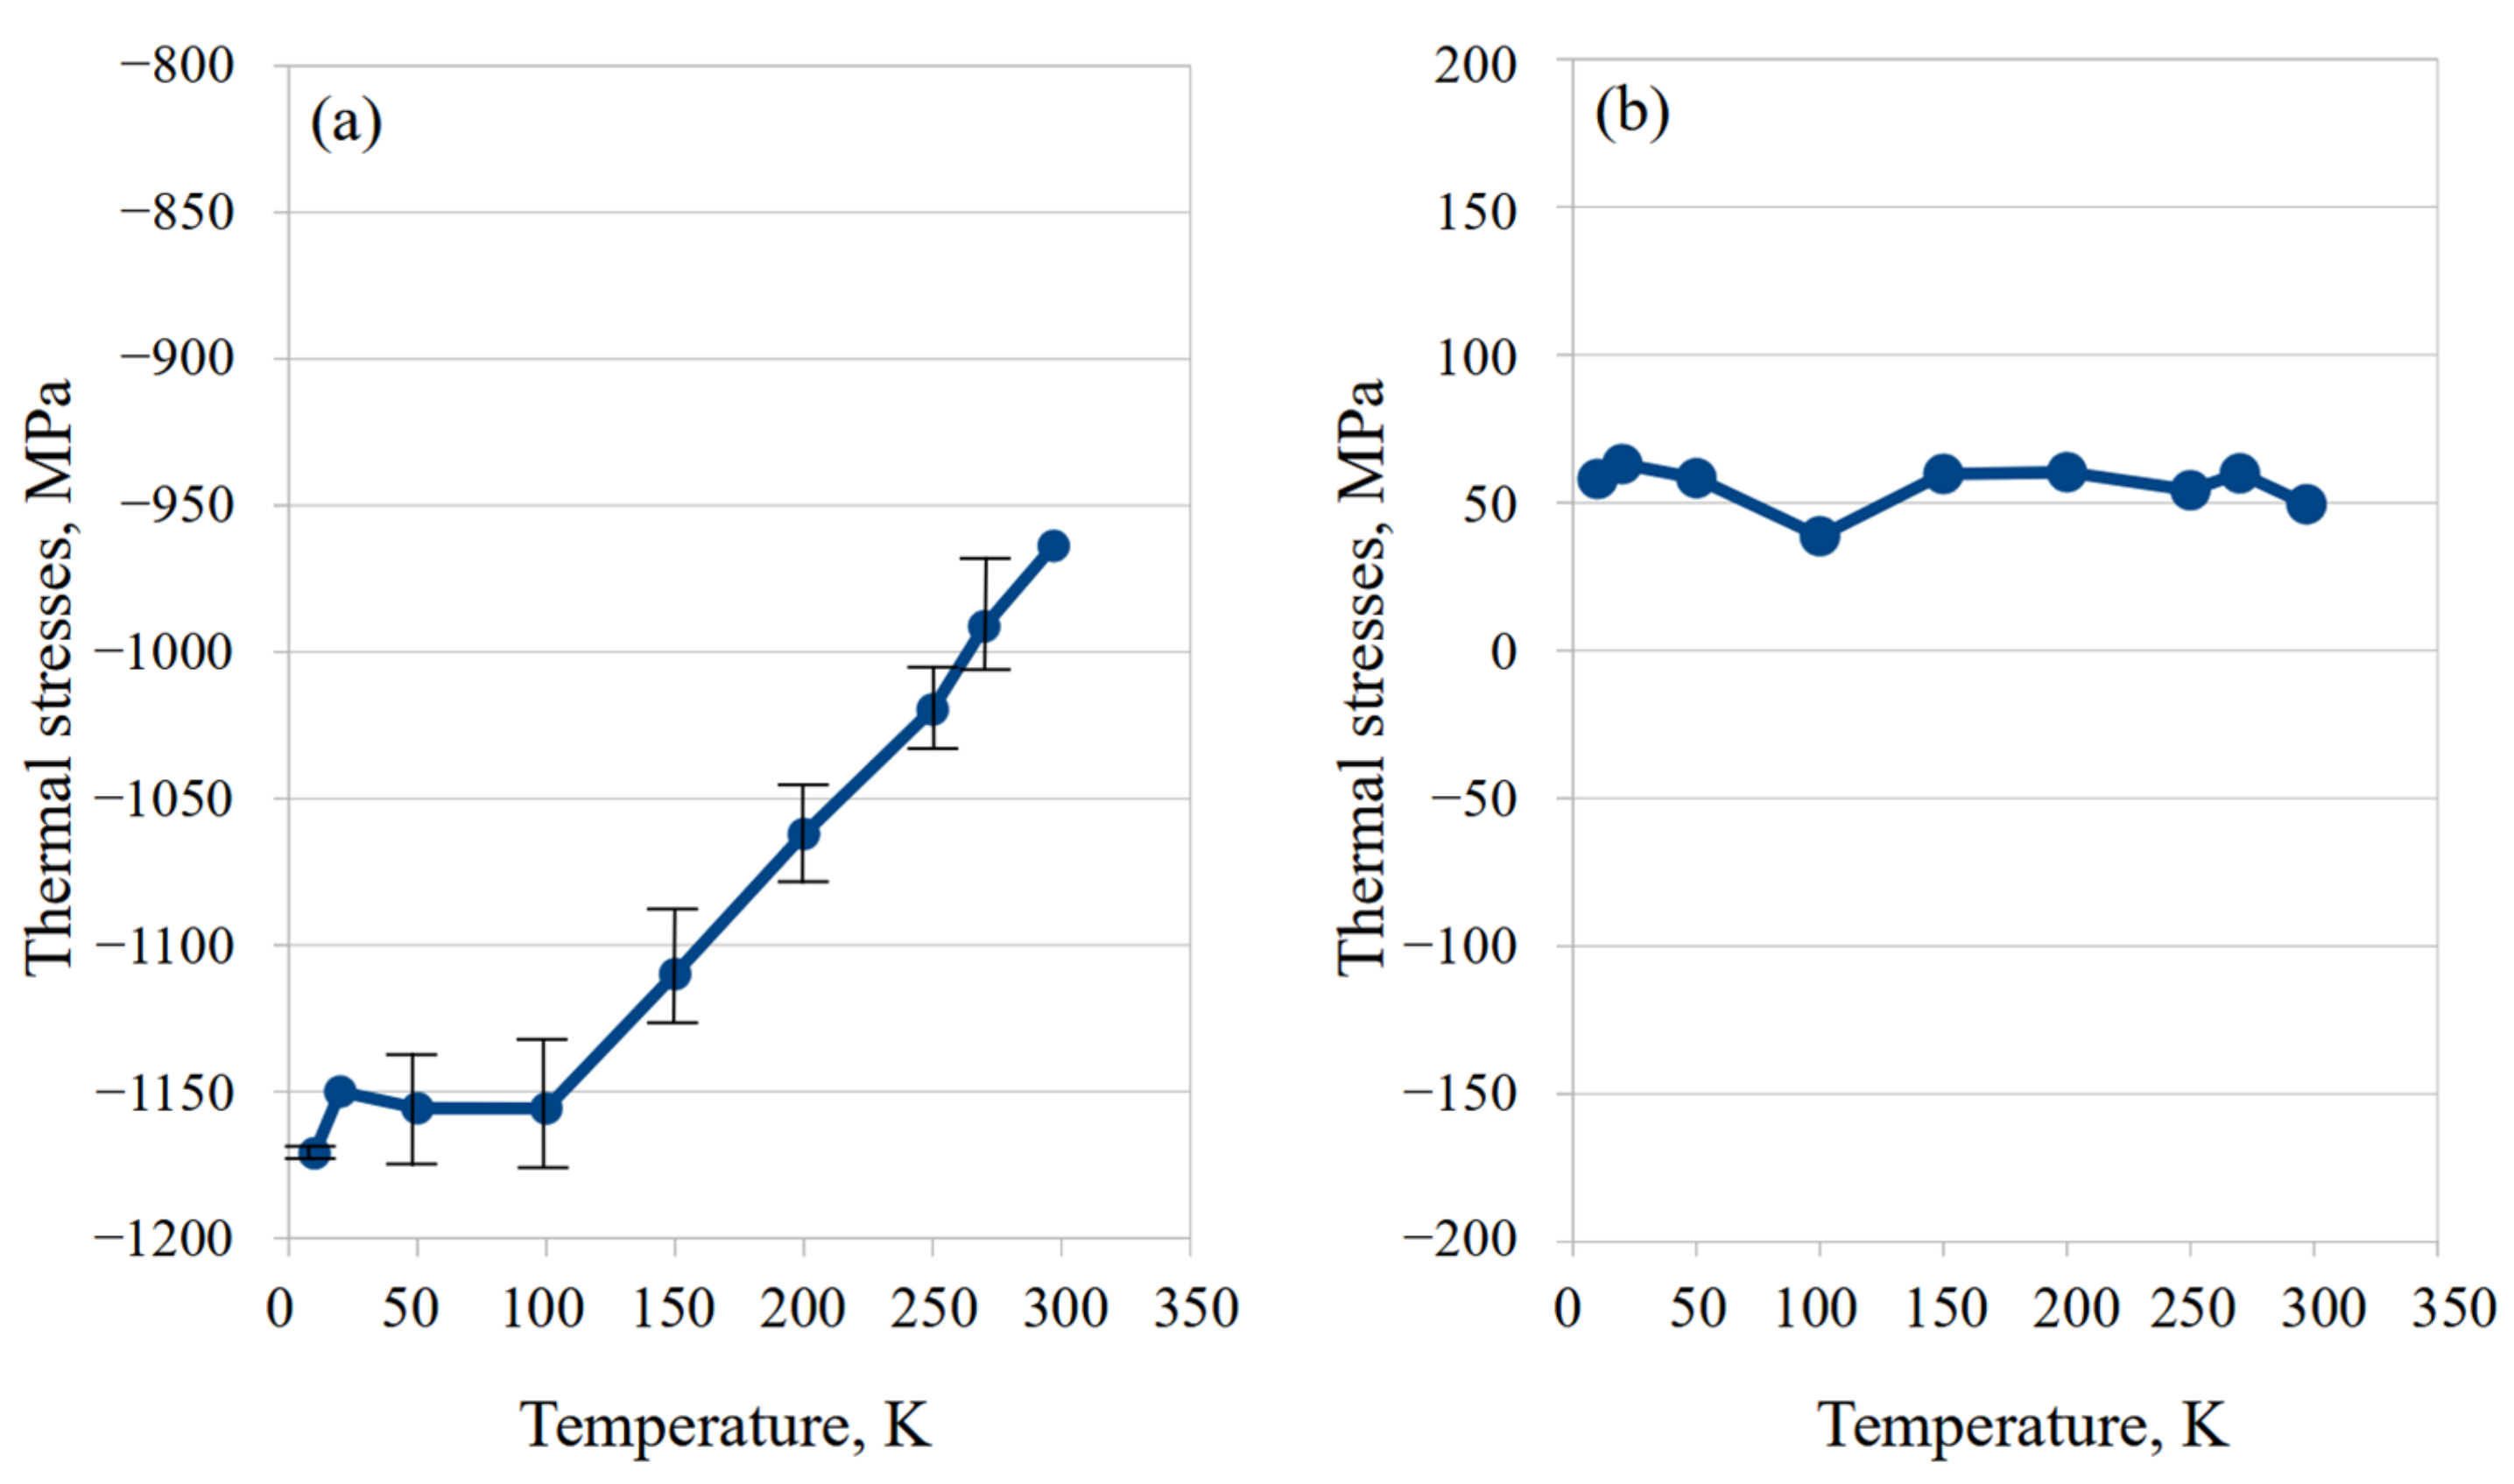
3.4. Results of Thermal Stress Alterations

Figure 9a, b show the stress alterations of the titanium matrix in the W/Ti composite. Figure 9a is the result of the longitudinal direction of tungsten fibers, and Figure 9b is the normal direction. Both of these figures show the stress values calculated from the 100 plane (a-axis), the 002 plane (c-axis), and the average stress values obtained from the four diffraction planes. According to Figure 9a in the longitudinal fiber direction, the 100 plane has the lowest stress values and the 002 plane has the highest stress values. The initial residual stress is 33 MPa on the 100 plane and 82 MPa on the 002 plane. The average value of the four diffraction planes is 57 MPa, which is the intermediate value of the initial residual stress of the 100 plane and the 002 plane. It can be inferred that these initial residual stresses were the thermal residual stresses generated in the process of manufacturing the W/Ti composite. Such initial residual stresses always occur in composite materials.
Thermal residual stresses shift to tensile stresses with decreasing temperature. The tendency of increase was qualitatively the same for all diffraction planes. The alteration of the stress value obtained from the average stress was 12 MPa during the temperature change from room temperature to 10 K. According to Figure 9b, all stress values in the normal to the fiber direction were compressive residual stresses. The tendency of stress alterations was the same as Figure 9a; it shifted to the tensile stress side and compressive stress decreased with decreasing temperature. The stress alteration from room temperature to 10 K was also the same value of 12 MPa.
From these results, it was confirmed that the stress alterations on the order of 10 MPa could be evaluated with high accuracy. This high measurement accuracy is an advantage of the TOF method in TAKUMI. This is an order of accuracy which cannot be obtained with the conventional angular dispersion type method using a goniometer.
Figure 10a,b show the stress alterations of tungsten fibers in W/Ti composites. Figure 10a is the longitudinal direction of the tungsten fiber, and Figure 10b is the normal direction. In the case of tungsten fiber, the intensity of the diffraction peak in the normal direction is very weak because of the 110 fiber preferential orientation. Therefore, the measurement results of each temperature show some scatter indicated by the error bars in this figure. According to Figure 10a, the thermal residual stresses in the fiber longitudinal direction were all compressive states. The initial residual stress was −963 MPa, and thermal residual stresses shifted to compressive stress with decreasing temperature. The alteration in the stress value was about 110 MPa between room temperature and 10 K temperature change. It was confirmed that the stress alteration in the tungsten fiber was approximately 10 times compared with the stress alteration of the titanium matrix. On the other hand, according to Figure 10b, all stress values in the normal to the fiber direction were tensile residual stress states. The initial residual stress was about 50 MPa. Although it is difficult to confirm from this figure, the stress alterations accompanying the decrease in temperature shifted slightly to the tensile side. The alteration in stress value was about 10 MPa.
From the results in Figure 9a and Figure 10a, comparing the stress states of the titanium matrix and the tungsten fibers in the longitudinal fiber direction, it can be found that the titanium matrix had tensile stresses and the tungsten fiber had compressive stresses. In addition, comparing the magnitude of stresses between the longitudinal fiber direction and the normal direction, it can be confirmed that the stress alterations in the longitudinal fiber direction was very large and dominant. It can be inferred that such states of thermal residual stresses were caused by the mismatch of thermal expansion between the titanium matrix and the tungsten fiber.
In the fiber longitudinal direction, since the thermal expansion of the titanium matrix was larger than that of the tungsten fiber, tensile residual stress was generated in the titanium matrix and compressive residual stress was generated in the tungsten fiber when the temperature decreased.
Conversely, in the fiber normal direction, the titanium matrix was in compression, and the tungsten fiber was in tension. These phenomena were opposite for the difference in thermal expansion. Since the stress value was small, it can be viewed as a measurement error. However, since it is not possible to examine this in detail at this time, it will be left as a future study.

4. Discussion

Figure 11a,b show a comparison between the results of thermal stresses calculated by Equation (2) and the measured results using the TOF method of TAKUMI. These results are in the longitudinal fiber direction. In the thermal stress calculations, the thermal expansion coefficients of the titanium matrix and tungsten fiber were calculated from the results of thermal strains measured from the d0 sample. For the Young’s modulus E, the macro of Young’s modulus in Table 2 was used for the thermal stress calculations for the titanium matrix. The initial residual stresses of the titanium matrix and tungsten fibers were σTi-initila = 56 MPa for titanium and σW-initial = −963 MPa for tungsten from the result of the stress measurement.
Figure 11a compares the calculated and measured thermal stresses in the titanium matrix. The average stresses of the six diffraction planes are used as a representative for the actual measurement results by the TOF method. First, the validity of the absolute values of the initial stress σTi-initial= 56 MPa of the titanium matrix and the initial stress σW-initial= −963 MPa of the tungsten fiber obtained from the measurement results is discussed. In general, residual stress in composite materials is considered to be dynamically balanced inside the material. The internal stress is balanced by being distributed according to the volume fraction of each phase composing the material. In the case of W/Ti composites, it is believed that the residual stresses of the titanium matrix and tungsten fibers are balanced according to the volume fraction of the titanium matrix and the tungsten fibers. This compound rule is represented by the following formula:
σ T i V T i + σ W V W = 0     ,
where V is the volume fraction for the titanium matrix and tungsten fibers in the W/Ti composite, and the suffix indicates each material. Since the volume fraction of tungsten fibers in the W/Ti composite in this study was about 5%, the first term of the Equation (5) is σTi × VTi = 56 × 0.95 = 53.2 and the second term is σW × VW = 963 × 0.05 = 48.15, which are very close values. According to the calculation result of Equation (5), the calculated volume fraction of tungsten fibers is slightly larger than 5%, which was 5.5%. For example, if the volume fraction of tungsten fibers is increased or decreased by 1%, the above magnitude relationship of stress values is a large variation. From this result, it can be confirmed that these measurements succeeded in accurately evaluating the stress balance between the titanium matrix and the tungsten fibers in this measurement.
Next, a comparison between the calculated thermal stresses and the measured values is considered. According to Figure 11a, when comparing the calculated and measured thermal expansion results, thermal residual stresses shifted to tensile stress when the temperature decreased in both calculated results and measured results. Although the tendencies of the experimental results and the calculated results coincided qualitatively, the absolute values of the calculated results and the measured results did not align at the same at each temperature when strictly compared. However, the difference between the calculation result and the actual measurement result at the lowest temperature of 10 K was only about 4 MPa. A higher accuracy is difficult to obtain in neutron stress measurements.
As shown in Figure 11b, the calculated and measured stress alterations in the tungsten fiber were in very good agreement. Since the scale on the vertical axis in Figure 11b is five times that of the titanium matrix in Figure 11a, it is difficult to read the difference in absolute values from this figure. However, the maximum difference between calculated and measured results was 22.8 MPa at 10 K. This value can also be said to be a very small difference between the measured results and the calculated results. The value of residual stress measured and/or calculated in this study must be added to the stress value that can be applied in strength design. In particular, it is important to consider the titanium matrix side where tensile residual stress is generated by cooling.
From the above results, it was confirmed that the stresses in the fiber longitudinal direction of the W/Ti composite coincided very well with the calculated results in terms of stress alterations in both the titanium matrix and the tungsten fibers. These calculations were obtained from a simple elastic theory of thermal expansion of titanium matrices and tungsten fibers in Equation (2). It was also confirmed that the measurement accuracy of the time-of-flight method using TAKUMI is extremely high.

5. Conclusions

(1)
Regarding the initial residual stress in the fiber longitudinal direction, compressive stresses existed in tungsten fibers, and tensile stresses existed in the titanium matrix.
(2)
Thermal residual stresses in tungsten fibers and the titanium matrix were changed to other states depending on temperature changes.
(3)
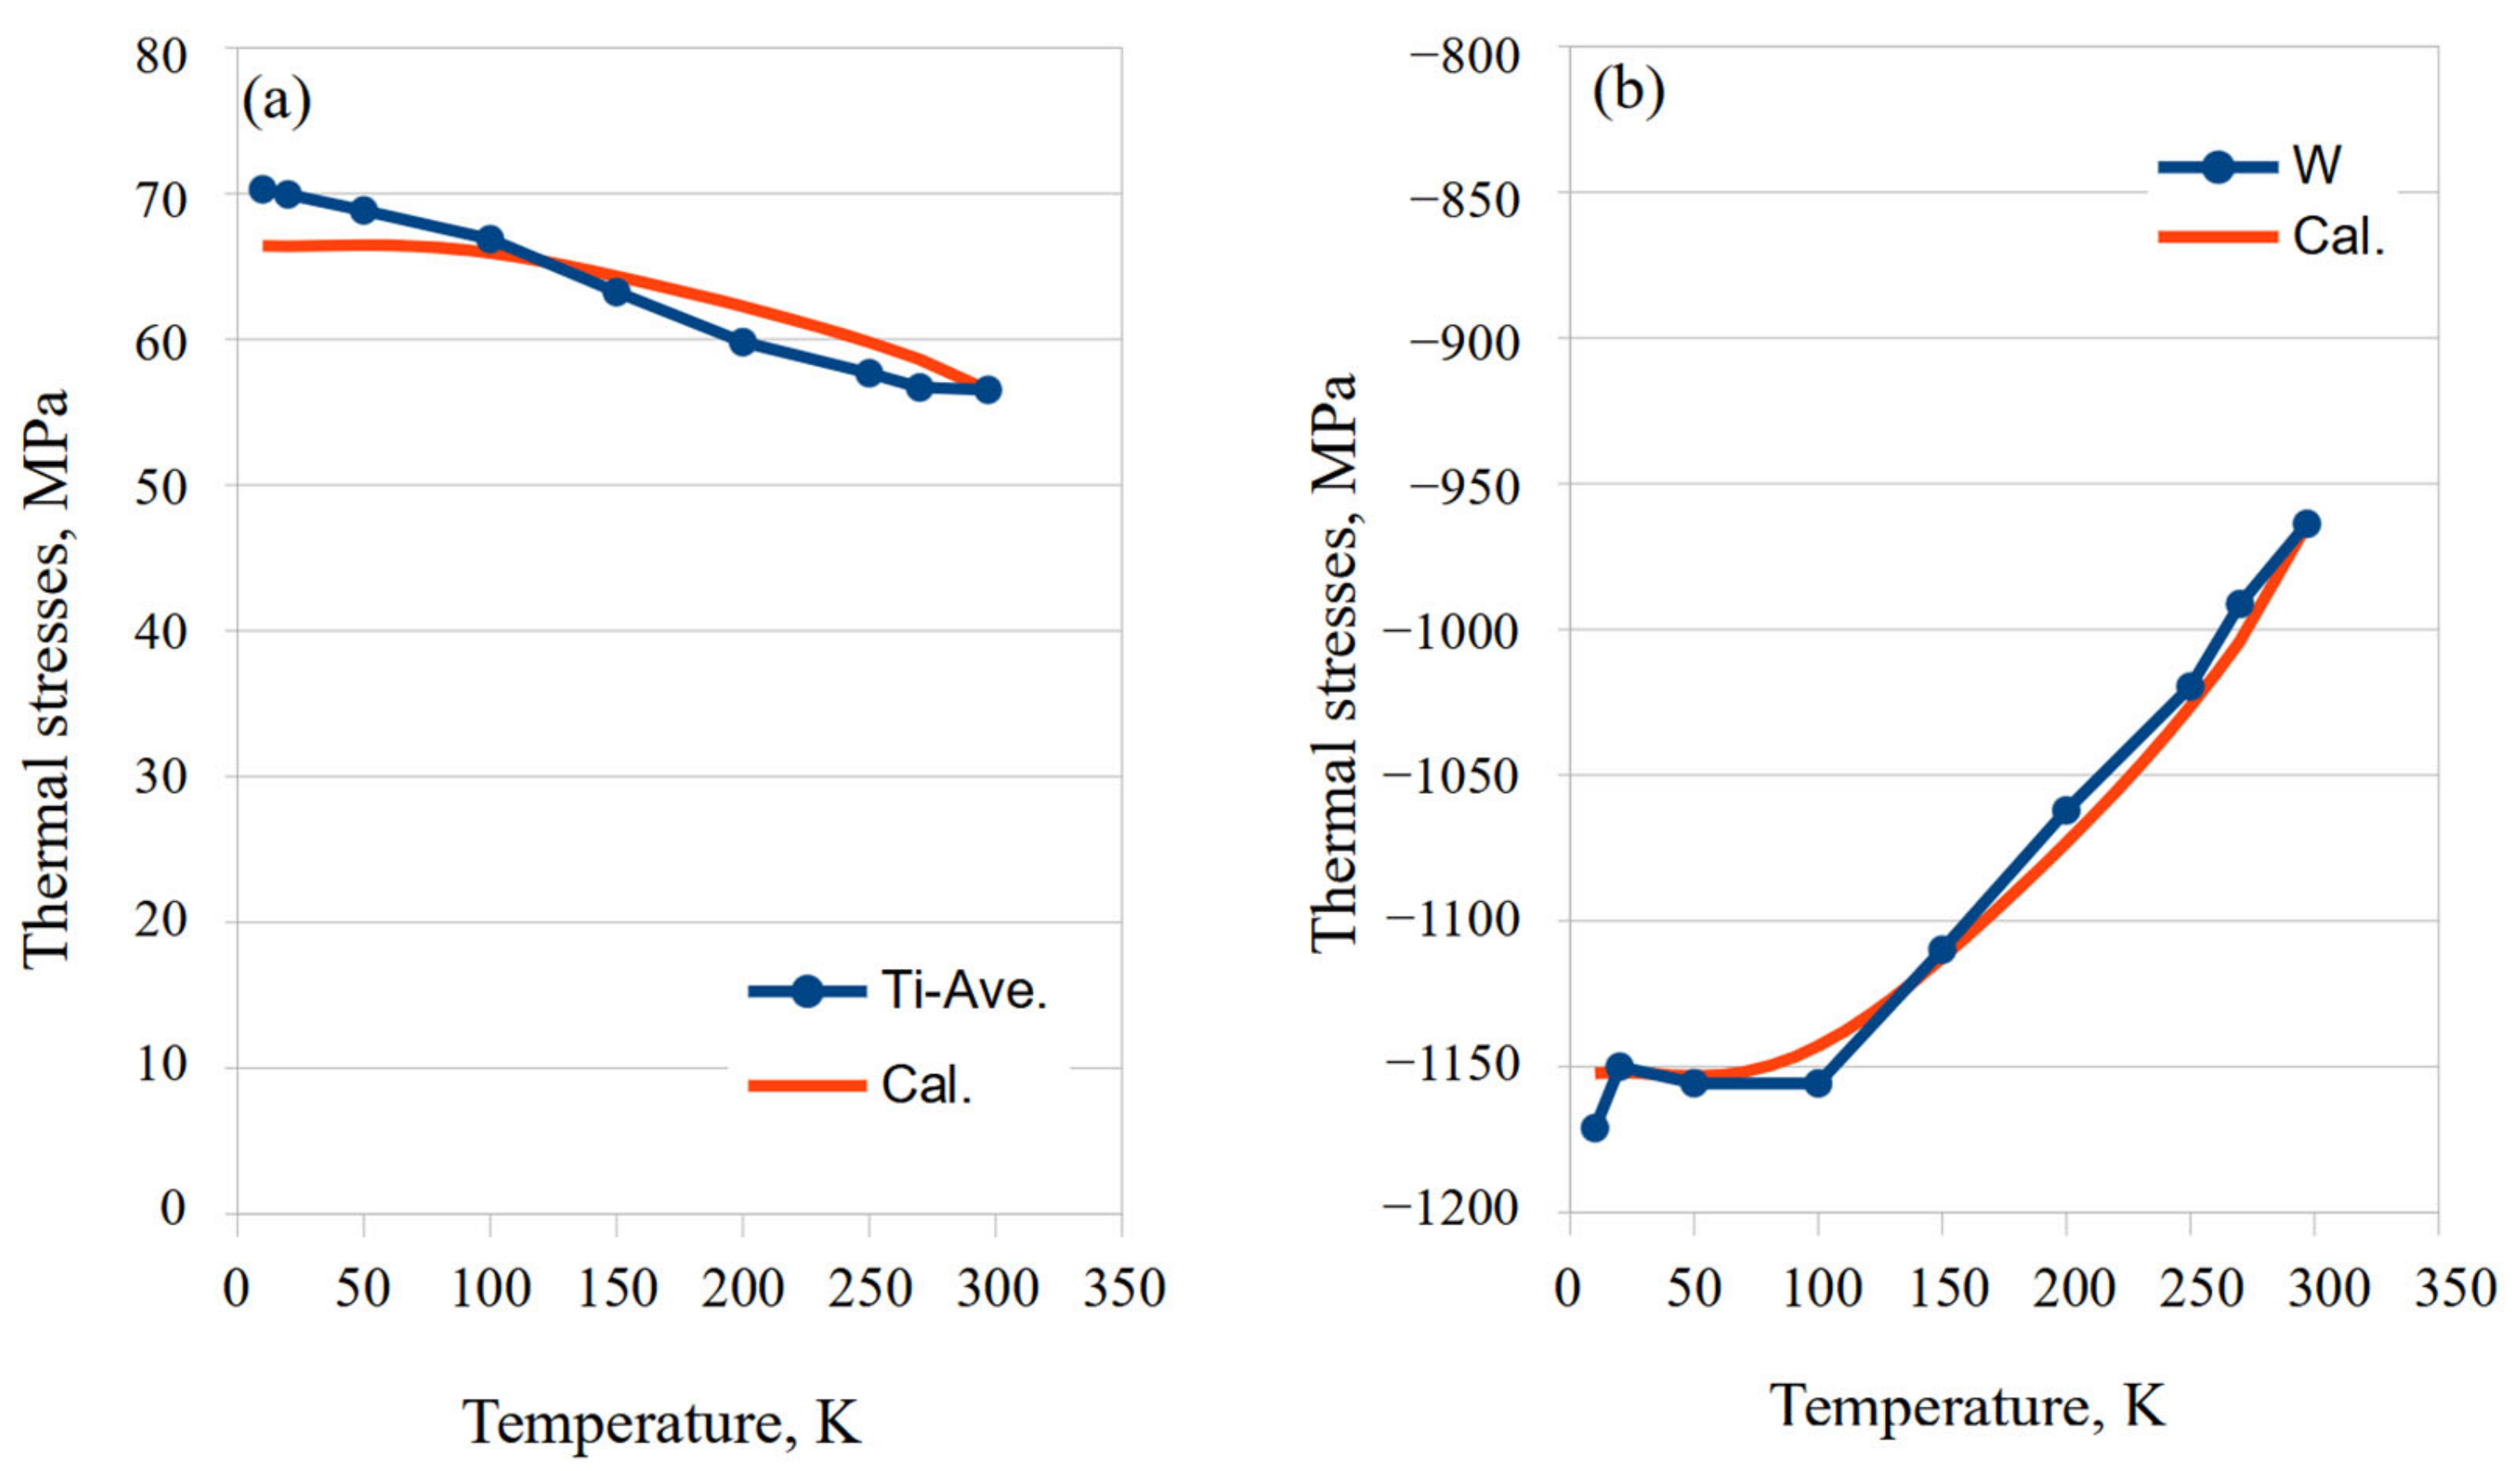
The main factor of thermal stress alterations was the difference in thermal expansion between tungsten fiber and titanium matrix, and the effect in the longitudinal direction of the fibers was dominant.
(4)
The alterations in thermal stresses followed the same path during temperature rise and temperature drop in the thermal cycle changes.
(5)
The simple elastic calculations and the measured results showed very good agreement, confirming the high measurement accuracy of the time-of-flight method using TAKUMI.

Author Contributions

S.H., T.K., T.Y., and W.G. are JAEA staff members. They set up the samples for TAKUMI and operated all equipment. M.N. prepared the samples, analyzed the experimental results, and wrote the manuscript. All authors discussed the results and reviewed the manuscript. All authors have read and agreed to the published version of the manuscript.

Funding

This research received no external funding.

Data Availability Statement

The data presented in this study are available on request from the corresponding author.

Acknowledgments

Neutron experiments were performed at TAKUMI installed at beamline BL19 in J-PARC with the approval of the Japan Atomic Energy Agency (JAEA). Acceptance number: 2019B129.

Conflicts of Interest

The authors declare no conflict of interest.

References

  1. Ogasawara, T.; Arai, N.; Fukumoto, R.; Ogawa, T.; Yokozeki, T.; Yoshimura, A. Titanium alloy foil-inserted carbon fiber/epoxy composites for cryogenic propellant tank application. Adv. Compos. Mater. 2013, 23, 129–149. [Google Scholar] [CrossRef]
  2. El Etri, H.; Korkmaz, M.E.; Gupta, M.K.; Gunay, M.; Xu, J. A state-of-the-art review on mechanical characteristics of different fiber metal laminates for aerospace and structural applications. Int. J. Adv. Manuf. Technol. 2022, 123, 2965–2991. [Google Scholar] [CrossRef]
  3. Smit, T.C.; Nobre, J.P.; Reid, R.G.; Wu, T.; Niendorf, T.; Marais, D.; Venter, A.M. Assessment and Validation of Incremental Hole-Drilling Calculation Methods for Residual Stress Determination in Fiber-Metal Laminates. Exp. Mech. 2022, 62, 1289–1304. [Google Scholar] [CrossRef]
  4. Ramesh, K.C.; Sagar, R. Fabrication of Metal Matrix Composite Automotive Parts. Int. J. Adv. Manuf. Technol. 1999, 15, 114–118. [Google Scholar] [CrossRef]
  5. Okamoto, S.; Taki, M.; Hagihara, T.; Fuyama, N. Material Properties on Metal Matrix Composite Used as Reinforcement for Pistons of Engines in Automobiles. Trans. Jpn. Soc. Mech. Eng. Ser. A 2007, 73, 368–371. [Google Scholar] [CrossRef] [Green Version]
  6. Asanuma, H.; Kato, K.; Mochizakl, T.; Hakoda, G.; Kurihira, H. Development of active materials based on fiber-reinforced metals. J. Adv. Sci. 2006, 18, 16–19. [Google Scholar] [CrossRef]
  7. Emamian, S.S.; Awang, M.; Yusof, F.; Sheikholeslam, M.; Mehrpouya, M. Improving the friction stir welding tool life for joining the metal matrix composites. Int. J. Adv. Manuf. Technol. 2020, 106, 3217–3227. [Google Scholar] [CrossRef]
  8. Hua, M.; Guo, W.; Law, H.W.; Ho, J.K.L. Half-transient liquid phase diffusion welding: An approach for diffusion welding of SiCp/A356 with Cu interlayer. Int. J. Adv. Manuf. Technol. 2007, 37, 504–512. [Google Scholar] [CrossRef]
  9. Ekin, J.W. Experimental Techniques for Low Temperature Measurements; Oxford University Press: Oxford, UK, 2008; pp. 50–52, 234–235. [Google Scholar]
  10. Network Database System for Thermophysical Property Data, The National Institute of Advanced Industrial Science and Technology (AIST). Available online: https://tpds.db.aist.go.jp/index_en.html (accessed on 5 January 2023).
  11. Nishida, M.; Haneoka, M.; Matsue, T.; Jing, T.; Hanabusa, T. Thermal Stress Estimation of Tungsten Fiber Reinforced Titanium Composite by In-situ X-ray Diffraction Method. Mat. Sci. Forum 2014, 768–769, 335–342. [Google Scholar]
  12. Ikeuchi, Y.; Matsue, T.; Hanabusa, T. X-ray Triaxial Evaluation of Thermal Residual Stresses in Continuous Alumina Fiber Reinforced Aluminum. In Proceedings of the 5th International Conference on Residual Stresses, Linköping, Sweden, 16–18 June 1997; Volume 2, pp. 958–963. [Google Scholar]
  13. Ikeuchi, Y.; Iga, K.; Hanabusa, T. X-ray Triaxial Evaluation of Thermal Residual Stress in Continuous Alumina Fiber Reinforced Aluminum Composite. J. Soc. Mat. Sci. Jpn. 1994, 43, 792–798. (In Japanese) [Google Scholar] [CrossRef]
  14. Nishida, M.; Muslih, M.R.; Ikeuchi, Y.; Minakawa, N.; Hanabusa, T. Low temperature in-situ stress measurement of w/cu composite by neutron diffraction. Int. J. Mod. Phys. B 2006, 20, 3668–3673. [Google Scholar] [CrossRef]
  15. Masayuki, N.; Muslih, M.; Ikeuchi, Y.; Minakawa, N.; Takao, H. Internal Stress Measurement of Fiber Reinforced Composite by Neutron Diffraction with In Situ Low Temperature Stress Measurement System. Mater. Sci. Forum 2005, 490–491, 239–244. [Google Scholar] [CrossRef]
  16. Clausen, B.; Brown, D.W.; Noyan, I.C. Engineering Applications of Time-of-Flight Neutron Diffraction. JOM 2012, 64, 117–126. [Google Scholar] [CrossRef]
  17. X-ray Elastic Constants by Krouner Model by The Committee on X-ray Study on Mechanical Behavior of Materials, Japan. Available online: https://x-ray.jsms.jp/x_database/index.html (accessed on 5 January 2023).
  18. Oishi, R.; Yonemura, M.; Nishimaki, Y.; Torii, S.; Hoshikawa, A.; Ishigaki, T.; Morishima, T.; Mori, K.; Kamiyama, T. Rietveld analysis software for J-PARC. Nucl. Instrum. Methods Phys. Res. Sect. A: Accel. Spectrometers Detect. Assoc. Equip. 2008, 600, 94–96. [Google Scholar] [CrossRef]
  19. Harjo, S.; Moriai, A.; Torii, S.; Suzuki, H.; Suzuya, K.; Morii, Y.; Arai, M.; Tomota, Y.; Akita, K.; Akiniwa, Y. Design of Engineering Diffractometer at J-PARC. Materi. Sci. Forum 2006, 524, 199–204. [Google Scholar] [CrossRef]
Figure 1. Schematic diagram of (a) 0.5 mm thick titanium plate with tungsten fibers wound at regular intervals and sandwiched between other 0.2 mm thick titanium plates; (b) seven layers of these materials prepared in (a) are stacked up and spot-welded; (c) the overlapping condition of the welded part in the continuous spot-welding method, and the welding path on the surface of W/Ti composite.
Qubs 07 00008 g001
Figure 2. SEM photographs of the W/Ti composite: (a) a photograph of the cross-section of the W/Ti composite; (b) SEM component analysis focusing on the boundary between the titanium matrix and the tungsten fibers.
Qubs 07 00008 g002
Figure 3. Schematic diagram of (a) coordinate system of W/Ti composite, and (b) sample setting and neutron measurement image.
Qubs 07 00008 g003
Figure 4. Photograph of the sample condition for the neutron measurement: (a) d0 sample of the titanium manufactured by the spot weld of titanium plates without tungsten fibers; (b) the W/Ti composite material; (c) tungsten sample for d0 measurement, where tungsten fiber is loosely wrapped around a titanium plate; (d) the sample setting condition on the cryostat cooling head. Three samples were fixed with a thin white water leak prevention tape.
Qubs 07 00008 g004
Figure 5. Schematic diagram of the temperature vs. time program for the in situ stress measurement of the W/Ti composite.
Qubs 07 00008 g005
Figure 6. One example of the diffraction profile measured using the time-of-flight method of TKUMI. These diffraction profiles were peak-fitted using the Z-Rietveld software.
Qubs 07 00008 g006
Figure 7. Comparison of the diffraction peaks in N-direction and S-direction. (a) N-direction: W110 and W220 appear. (b) S-direction: W110 and W220 disappear, and W200 appears.
Qubs 07 00008 g007
Figure 8. Alterations of thermal strains determined from the results of the diffraction peak measurements of (a) the titanium matrix and (b) the tungsten fibers in the W/Ti composite.
Qubs 07 00008 g008
Figure 9. Stress alterations of the titanium matrix in the W/Ti composite: (a) the longitudinal direction of tungsten fibers; (b) the normal direction.
Qubs 07 00008 g009
Figure 10. Stress alterations of tungsten in W/Ti composites: (a) the longitudinal direction of the tungsten fiber; (b) the normal direction.
Qubs 07 00008 g010
Figure 11. Comparison of calculated results from Equation (2) and measurement results in the longitudinal fiber direction: (a) results of the titanium matrix; (b) results of the tungsten fibers.
Qubs 07 00008 g011
Table 1. Conditions of spot welding.
Welding voltage (V) & current (A)200, 8.5
Welding pressure (kN)1.9
Holding time (msec.)200
Diameter of electrode (mm)11
Table 2. Conditions of neutron stress measurement by TAKUMI.
MLF beam power600 kW
Measurement materialW/Ti composite
Slit systemIncident slit: 5 × 10 mm
Detected 90° A, B banks
Measurement methodTime of Flight (TOF)
Measurement time600 sec./profile
Tungsten:
E: 388.69, ν: 0.2833
Young’s modulus E (GPa)
Poisson’s ratio ν
Titanium:
hkl,E,ν
100,110.86,0.3290
002,128.35,0.2976
101,123.41,0.3061
102,126.83,0.3002
Macro,114.70,0.3217
Disclaimer/Publisher’s Note: The statements, opinions and data contained in all publications are solely those of the individual author(s) and contributor(s) and not of MDPI and/or the editor(s). MDPI and/or the editor(s) disclaim responsibility for any injury to people or property resulting from any ideas, methods, instructions or products referred to in the content.

