
Overall Review on Recent Applications of Raman Spectroscopy Technique in Dentistry

1
LIBPhys—Laboratory of Instrumentation, Biomedical Engineering and Radiation Physics, 2829-516 Caparica, Portugal
2
NOVA School of Science and Technology, NOVA University Lisbon, Campus Caparica, 2829-516 Caparica, Portugal
Quantum Beam Sci. 2023, 7(1), 5; https://doi.org/10.3390/qubs7010005
Submission received: 5 December 2022
/
Revised: 15 January 2023
/
Accepted: 18 January 2023
/
Published: 1 February 2023
(This article belongs to the Special Issue Quantum Beam Science: Feature Papers 2022)
Abstract
:The present paper reviews the applications of Raman spectroscopy in dentistry in the past two decades. This technique is considered a highly promising optical modality, widely used for the chemical identification and characterization of molecular structures, providing detailed information on the structural arrangement, crystal orientations, phase, and polymorphism, molecular interactions and effects of bonding, chemical surrounding environment, and stress on samples. Raman spectroscopy has been appropriate to investigate both organic and inorganic components of dental tissues since it provides accurate and precise spectral information on present minerals through the observation of the characteristic energies of their vibrational modes. This method is becoming progressively important in biomedical research, especially for non-invasiveness, non-destructiveness, high biochemical specificity, low water sensitivity, simplicity in analyzing spectral parameters, near-infrared region capability, and in vivo remote potential by means of fiber-optics. This paper will address the application of Raman spectroscopy in different fields of dentistry, found to be the most relevant and prevalent: early recognition of carious lesions; bleaching products performance; demineralizing effect from low-pH foods and acidic beverages; and efficiency of remineralization agents. Additionally, this review includes information on fiber-optic remote probe measurements. All described studies concern caries detection, enamel characterization, and assessment indicating how and to what extent Raman spectroscopy can be applied as a complementary diagnostic method.
1. Introduction
In 1997, Tsuda and Arends [1] published a review paper on an upcoming subject of Raman applications, the study of dental hard tissues. More recently, Ramakrishnaiah et al. [2] updated this analysis with the review of Raman spectroscopy for the analysis of tooth structure and applications for oral hard tissues pathologies, such as diagnosis of early dental caries and developmental disorders of enamel and dentin, identification of oral microbial flora and characterization of dental biomaterials. Since then, Raman spectroscopy has been frequently used in research on early caries determination, as well as in the diagnostics of other causes of enamel demineralization resulting in daily activities and pharmaceutical routines.
This paper will address the application of Raman spectroscopy in different fields of research of enamel in dentistry, found to be the most relevant and prevalent:
- (a)
- Early recognition of carious lesions;
- (b)
- Bleaching products performance;
- (c)
- Other pharmaceutical products;
- (d)
- Demineralizing effect from low-pH foods and beverages with erosive potential;
- (e)
- Remineralization agents;
- (f)
- Raman fiber-optic probes for in vivo and in vitro remote applications.
Tooth enamel (Figure 1) is the most highly mineralized and hardest tissue in the human body [1,2,3,4] and covers and protects the anatomic crown of the tooth [1,2,3]. It resists chewing forces and protects the internal layers, dentin, and pulp. Enamel mineralization is an essential property that correlates positively with the mechanical behavior of tissues such as bone [4,5] and teeth [3,5,6]. Dental enamel contains approximately 95–96% weight mineral in the crystalline form of hydroxyapatite (HAp), up to 1–2% of organic material, mostly protein, such as amelogenin, ameloblastin, tuftelin and enamelin (responsible for enamel growth and development), and approximately 3–4% water by weight [1,2,3,6,7,8,9].
Despite all research studies dedicated to the development of improved methods for the early detection of dental carious lesions, in clinical practice, caries detection is still mostly limited to conventional visual and visual–tactile tools, such as sharp explorers and dental radiographs [11]. Conventional clinical diagnostic methods that are frequently used for detecting cavitated lesions are characterized by insufficient sensitivity and specificity for the early detection of carious lesions [3]. For instance, dental radiographs are useful in detecting larger, advanced dental caries, but limited image resolution and poor radiographic contrast of early carious lesions confer radiographs reduced sensitivity for detecting early-stage dental caries [11,12,13].
Raman technique is an emerging bio-photonic tool, proving to be a very useful molecular spectroscopic analytical technique, with many different applications in many distinct research areas. Raman scattering phenomenon was first observed by Dr. C. V. Raman in 1928, who has been awarded a Nobel Prize for this work; however, it is only lately that Raman spectroscopy has emerged as an important analytical method across several industries and clinical applications. This form of vibrational spectroscopy [14], is presently considered a viable optical method for biomedical applications mainly due to its uniqueness and precise results, fingerprint identification and non-destructive and non-invasive modality to analyze molecular composition [11,14]. The main particularity of this technique is that when light arrives to an examined sample, a small part of it is scattered in several different directions. When these light photons are scattered from a molecule or crystal, most photons are elastically dispersed. The larger part of the scattered photons has the same frequency and, consequently, wavelength, as the incident photons. However, a small fraction of light (approximately 1 in 107 photons) is scattered at optical frequencies different from, and usually lower than, the frequency of the incident photons. The process causing this inelastic scatter is known as the Raman effect. Therefore, if the photons are elastically scattered, the process is called Rayleigh scattering. If, contrarily, the photons are inelastically dispersed, the process is called Raman scattering. If the scattered photons have lower frequency than the incident photons, these are known as Stokes scattering. If the photons are scattered with a higher frequency, this process is called anti-Stokes scattering (as shown in (as shown in Figure 2) [14].
Raman spectroscopy has shown to be a very suitable modality to analyze inorganic superficial tissue (such as phosphate and carbonate), since it is possible to acquire accurate spectroscopic information on present minerals through the observation of the characteristic energies of their vibrational modes [15]. This method is becoming progressively important in biomedical research, especially for its minimal to non-invasiveness, non-destructiveness, high biochemical specificity, low water sensitivity, capability to work in the near-infrared (NIR) region, and remote and in vivo potential by means of fiber-optics [11,15].
This versatile technique is widely employed due to the simplicity and easiness to measure tissue samples, dry or within a solution, which is highly compatible with the physiological condition. It shows no sensitivity to the state or shape of the examined specimen or material; however, it is highly sensitive to chemical, morphological, and structural changes, according to the case, and provides the possibility to perform measurements in vivo. It is considered by many an excellent and powerful tool for local analysis by using the laser beam as a monochromatic light source (laser signal and Raman scattered photons can be easily transmitted and efficiently collected by optical fibers over short or long distances for remote analysis). This technique provides a fast detection and identification of different molecules (chemical composition and structural arrangement) and minerals (morphology and crystal orientation), since Raman spectra can be acquired quickly (short duration time, varying from seconds to a few minutes, depending on the examined area). It can be employed for real-time monitoring (for different types of samples, in distinct research areas, in this case, dentistry). Raman spectra can be obtained and collected even from a very small volume sample (<1 μm in diameter), usually used in the analysis of micron-level sample contaminants, presence of porphyrins due to bacterial activity, defects, or deposition of extremely thin superficial layers (such as dental films) and the examination of surface micro-structures and orientation. Moreover, automated chemical analysis can be rapidly performed by any user, with different levels of training (beginner, advanced or pro) [1,11,15,16,17,18,19,20,21,22].
A typical Raman spectroscopic measurement usually consists in focusing a laser beam onto the sample and recording the energy profile of the scattered light (Stokes scattering). Every examined sample—compound or chemical element provides a unique spectrum (which results from the excitation of the vibrational modes of one or several different molecules) and for more complex or mixed samples, such as solutions or mixture of different compounds, the collected spectra represent a superposition of the Raman signals from each of the components, which allows us to display the resulting band intensities for quantitative analysis of the relative concentration and assessment of the biochemical composition alterations or structural modifications [20,21,22]. Every Raman spectrum includes a fingerprint region (with bands of interest), low- and high-frequency regions.
There are several important spectral parameters that can be extracted from a Raman spectrum, acquired from a dental enamel sample, or other materials, according to the specific case, that can be used not only to detect a certain molecule or identify a specific compound, but also to characterize a surface layer according to the biochemical composition, molecular structure, as well as the structural arrangement and orientation.
Hence, the main spectral parameters are the following:
- ▪
- Raman peak intensity provides information on material relative concentration and distribution, the polarizability factor of the chemical bond, and additionally, material traceability or detectability (defined as the capability of being detectable to certain extent). In the case of enamel, the amplitude of the phosphate peak in the Raman spectrum is directly proportional to the amount of mineral content [4].
- ▪
- Raman band position (as a function of frequency, expressed in wavenumbers, specific to a certain molecule, compound, material, or tissue) yields unique information on the examined material composition (fingerprint). The bands of interest, for each molecule or compound that are assigned to different vibrational modes and/or groups, are detected at specific positions.
- ▪
- Raman band shift can reveal structural changes, phase, as well as material stress/strain. It shows if the sample was prone to certain significant alterations conformational, compositional, phase transition, and others, such as deformation, elongation, increased pressure, stress, and/or temperature.
- ▪
- Raman band-width is a precise characteristic of the crystallinity (degree), amorphousness, molecular orientation, and phase, a parameter often used for the detection of defects, impurities, contaminants, and/or doping content.
- ▪
- Raman band polarization provides relevant information on the material molecular orientation, crystallinity, structural arrangement, and/or symmetry.
The Raman technique has been frequently used to detect bacteria and the compositions of biological cells, tissues, and biofluids. Moreover, in the past few decades, it has received a growing interest in medical prognosis and diagnosis. It has emerged as a potential chairside microbiological diagnostic approach. This technique can yield clear and obvious differences between dental caries and intact tooth tissues, and between oral cancer lesions and healthy tissue, at compositional and structural levels. Therefore, its potential in the diagnosis and prognosis of these two diseases is more than obvious. Raman technique is a precise tool that can be used for oral hard and soft tissue assessment, differentiation, and classification [22,23].
Table 1 resumes the most relevant advantages and major limitations of Raman technique.
However, despite the fact that it is an increasingly popular and widespread technique, the main limitations and drawbacks are: (1) The high cost of the equipment, which can be a real obstacle to the widespread employment of RS for routine analysis; (2) It cannot be used for pure metals or alloys; (3) Raman effect is very weak (an extremely small fraction of light of approximately 1 in 107 photons is scattered from the incident photons)—the detection needs a sensitive and highly optimized instrumentation, and especially for biological specimens, the Raman signals are inherently weak without utilizing enhancement effects; (4) Fluorescence (intrinsic, for organic samples, or caused by impurities; several compounds fluoresce when irradiated by the laser beam) affect the quality of the Raman spectrum; (5) Sample heating—through the intense laser radiation can destroy (denature or decompose) the sample or cover the acquired Raman spectra; (6) Shallow penetration depth of the light beam [1,11,15,16,17,20,21,22,24]. Two of the mentioned limitations require special caution and more details.
In Raman microscopy, for benchtop microscopes or fiber-coupled systems, one of the main problems represents the fluorescence emitted by the sample under examination, which can severely affect or completely mask the spectra of the obtained Raman signals. The efficiency of Raman scattering is proportional to λ−4. Consequently, it is strongly enhanced at shorter wavelengths of incident light, resulting in a significant intensity decrease of 15 times going from blue to an infrared laser. At the same time, the excitation in the visible region causes strong fluorescence of real biological (organic) samples [25]. If the incident photon has sufficient energy, electrons in the sample are excited to higher states of energy and during relaxation to their ground state they emit light of longer wavelengths than that of the incident light. This means that together with the Raman scattered photons, these fluorescence wavelengths are also able to overpass the edge or long-pass filters that are specially designed to block the incident light and Rayleigh radiation. Critically, fluorescence is up to several orders of magnitude more efficient than Raman scattering, so an organic sample, or one that contains strong fluorophores (mixed compound, defects, inclusions, or contaminants) will emit fluorescence that would clearly overwhelm the weak Raman signals. There are two major solutions for solving the fluorescence problem. First is the removal of it during spectral processing. There are several fluorescence rejections or correction algorithms that can effectively remove or, at least, avoid and significantly minimize the fluorescence levels regardless of the laser wavelength used. Secondly, since fluorescence has very specific excitation and emission parameters, the excitation wavelength of the incident laser beam can be chosen to minimize fluorescence. By increasing the laser wavelength, the energy is consequently reduced so as not to promote fluorescence, with insufficient energy to excite/stimulate the electrons to higher energy levels. Typically, longer wavelengths, ranging from red to NIR, with over 700 nm, do not cause or considerably lower fluorescence in organic samples. Therefore, a proper choice of the laser wavelength for a certain measurement of a specific sample has a great impact on the needed trade-off between Raman efficiency and fluorescence effect. Longer the wavelength of the employed laser source, such as NIR, greater the possibility for the avoidance of the fluorescence.
According to Buchwald et al. [26], laser-induced fluorescence can be clearly detected and seen in the Raman spectrum background, which was often reported to be very problematic. Biological tissues, including teeth, exhibit strong fluorescence emission during Raman spectra measurements, turning the spectral analysis more difficult. Nevertheless, the obtained information that results from the background of the Raman spectrum is considered very useful for caries detection. The background intensity can reveal the fluorescent compounds in the enamel, such as bacterial porphyrins, which usually appear in the caries lesion or organic compounds located in plaque or calculus. During their studies, these authors observed substantially increased fluorescence levels in Raman spectra acquired at the natural caries lesion in accordance with their own predictions [26].
Another major limiting factor that should be seriously considered, for ex vivo measurements and especially before applying the probe for in vivo examination, is the sample local heating, which can result in irreversible damage of both hard (enamel and dentine) and soft (pulp, cement, nerves, and gingiva) oral tissues. To minimize the risk of temporary temperature increase, which might cause a critical or irreversible condition of the enamel and surrounding and inner tissues of a vital tooth, it must establish a limit for the duration of spectral acquisition time, in order to obtain high-quality spectra without affecting the sample, depending on the combination of excitation laser monochromatic beam wavelength and incident radiation power on the sample [24].
2. Early Recognition of Carious Lesions
Dental caries is a common chronic infectious oral microbial disease, frequently developing as caries with small lesion sizes and slower progression rates, affecting the calcified structured layers of the tooth. Clinically, it is characterized by the progressive destruction of this structure by acid-forming bacteria found in dental plaque [11,23,27,28,29].
Caries represents a serious health problem, which can vary from the subsurface enamel layer demineralization to an extensive deeper dentinal layer involvement at a clinical level. According to the International Caries Detection and Assessment System (ICDAS), which is a clinical scoring system developed for clinical research, clinical practice and other epidemiological matters, the detection codes for the assessment of caries activity vary within the following range: 0—Sound; 1—1st visual change in enamel; 2—distinct visual change in enamel; 3—localized enamel breakdown (fissure); 4—underlying dark shadow from dentin; 5—distinct cavity with visible dentin; and 6—extensive distinct cavity with visible dentin [30].
Incipient dental caries is usually non-cavitated and limited to the outer enamel surface. The mineral concentrations in carious lesions are lower than in the surrounding sound enamel [2,3,16] and when the enamel starts to lose the mineral continuously, early lesions can be visually identified as white spots [4,16]. Early recognition and detection of the carious lesions and caries disease process is highly important from the point of view of medical intervention, to avoid progression into deeper parts of enamel (before cavitation) and healed by remineralization by applying a dental treatment with fluorinated products. Therefore, a correct and precise diagnosis of the carious lesion is of extreme importance in daily dental practice, which is increasingly focused on performing evidence-based, non-invasive, and painless modalities, or minimally invasive intervention treatments, aiming to reduce the removal of dental tissues whenever possible, as well as to promote and maintain the overall dental health [30,31].
Carious lesions are frequently found between adjacent teeth, an area that is difficult to examine. These characteristics of the caries problem expand the limitations of caries detection through conventional diagnostic methods that involve subjective clinical criteria (color, “softness”, resistance to removal) and the use of diagnostic tools such as the dental explorer and dental radiographs. These conventional methods are appropriate for the detection of larger, possibly cavitated lesions; however, due to poor specificity and sensitivity, they are not adequate for the detection of early-stage, non-cavitated lesions. Additionally, these clinical methods are not able to address the dynamic nature of the demineralization–remineralization process during caries formation progression [11,12].
There are numerous methods employed for the diagnosis of carious lesions. Still, none of them have reached the maximal sensitivity and/or specificity, so further research is required to find a method that meets all the needs of dental care professionals. Despite all research studies dedicated to the development of improved methods for the early detection of dental carious lesions, in clinical practice, caries detection is still mostly limited to conventional visual and visual–tactile tools, such as sharp explorers and dental radiographs [11,31]. Conventional clinical diagnostic methods that are frequently used for detecting cavitated lesions are characterized by insufficient sensitivity and specificity for the early detection of carious lesions [3]. For instance, bitewing radiographs are still considered the gold standard for the diagnosis of interproximal caries [30,31]. Dental radiographs are also useful in detecting larger, advanced dental caries, but limited image resolution and poor radiographic contrast of early carious lesions confer to radiographs reduced sensitivity for detecting early-stage dental caries [11,12,13].
Digital radiography combined with visual examination is the most frequently used routine diagnostic technique for caries detection. High demineralization in enamel and dentine layers, caused by caries, results in a significant decrease in the attenuation of the X-ray beam through the dental hard tissue. An identified lesion appears in the visualized image as radiolucency. For the radiolucency to be clearly visible and distinguishable, first must occur a major loss in the mineral content of the tooth (app. 40% to 60%). This technique was found to be quite sensitive in detecting carious lesions and cavities that are deeply advanced into dentin, however not too efficient in detecting non-cavitated fissure caries. Evidence suggested higher specificity (0.59–0.90) than sensitivity (0.14–0.38) for the detection of non-cavitated fissure caries, which means that a false-negative diagnosis is highly probably to occur [3,30,31,32,33].
The use and frequency of radiography must be always justified in routine examination since exposure to ionizing radiations can be harmful to patients. The introduction of digital radiography replaced physical films and the images stored digitally, with the detection performance for dental caries reported to be approximately the same analogue radiography. The main strengths of digital radiography include less radiation exposure for the patient (reduced dose of received radiation), the obtainment of instant and reliable images, the possibility of image enhancement, a lack of necessity for a dark room, no hazards of film development, and data-sharing capacity for easy and simple transfer/transmission of information. At the same time, numerous factors can impact the accuracy of radiography, such as exposure time, image processing, viewing conditions, training, and experience of the examiner. Another two major limitations are the high cost and durability (life expectancy) of the used chip [32,33].
Diagnosis methods based on light dispersion, such as fiber-optic transillumination (FOTI) and digital imaging fiber-optic transillumination (DIFOTI), are extensively used by stomatologists. The FOTI method makes use of high-intensity white light in the visible range spectra (400–700 nm) to illuminate the tooth and to emphasize the contrast between the healthy and diseased enamel tissues. DIFOTI was developed to reduce the perceived inadequacies and to solve the deficiencies of FOTI, by combining FOTI with a digital CCD camera. DIFOTI has elevated traditional transillumination to more sophisticated diagnostic levels. The carious enamel scatters and absorbs more light compared to the sound enamel and, consequently, seems darker than the sound enamel, which is transparent. On the other hand, dentin layers show brown to gray-colored spots or larger regions underneath the enamel. These distinct colors highlight the contrast between the examined tissues, revealing a clear differentiation between enamel and dentin lesions. The main advantages of this technique rely on the detection of initial areas of demineralization, pits and fissures, cracks, tooth fractures, and wear. Its use does not imply any ionizing harmful radiation, using instead, safe white light. It provides images of all dental coronal sides, including interproximal, occlusal, smooth surfaces. It can easily determine the depth of the examined lesion with great accuracy, being the only dental diagnostic imaging instrument approved by the Food and Drug Administration for the detection of incipient and recurrent caries. Real-time visualization with a magnification of up to ×16 is possible. On the other hand, it is a quite expensive method (especially DIFOTI), which implies a high cost of acquisition and maintenance, it cannot quantify, and the diagnostic decisions are based mostly on subjective outcomes determined visually. Therefore, this might result in low-reliability scores due to the subjective interpretation of the image by the operator [32,33].
Near-infrared laser transillumination (NILT) method employs NIR light for the detection of enamel lesions and can discriminate between the extent of the lesion limited to the enamel from the ones that have reached the enamel dentin junction (EDJ). This technology works on a similar mechanism as the FOTI technique, replacing the visible white light with NIR light (range between 750–1500 nm), which appears to have a more efficient and deeper penetration depth in the enamel. The enamel layers are highly transparent in the NIR range due to less scattering and absorption. The main strengths of NILT are that is a non-invasive and painless method, not confounded by stains, which can be used to map the horizontal extension of a caries lesion. Furthermore, the performance of NILT is comparable to a LF system DIAGNOdent® pen (KaVo Dental, Charlotte, NC, USA) and QLF methods, and therefore, it is established as a valid and reliable technique for the detection of incipient occlusal caries on permanent teeth [32,33].
The quantitative laser/light-induced fluorescence (QLF) technique involves the principle of fluorescence. This method allows the early detection of carious lesions, mainly the progression or regression of white spots of smooth surface lesions. QLF is based on the excitation of the tooth with blue light at a wavelength of 370 nm, which results in the emanation of yellow-green fluorescence caused by fluorophores that are located within the EDJ, providing this way with a fluorescent image of the examined tooth surface in a spectrum of yellow-green visible light that quantifies mineral loss and provides the size of the lesion—area, depth, and volume, which are relevant parameters. It is considered an appropriate method for quantitative assessment of early enamel lesions in areas that are visually unreachable. Demineralized areas between the outer enamel layers and EDJ appear dark on a green fluorescence background. This process is caused by the increased scattered light by the porous demineralized area resulting in less light reaching the EDJ, hence decreasing the fluorescence photons that reach the surface from the EDJ. Therefore, this substantial difference in fluorescence between the sound and demineralized enamel can be precisely quantified and used to monitor the identified lesion progression over time [32,33].
The laser fluorescence-based method (LF) is another modality frequently used for the detection and quantification of dental caries. In DIAGNOdent®, a monochromatic red laser light beam (655 nm wavelength) is emitted unto the tooth surface and the back-scattered red fluorescence from the tooth is detected. This modern technique responds to fluorescence radiated from proto-porphyrin, meso-porphyrin, and other metabolites of cariogenic bacteria present in the porosities of caries lesions. The exhibited fluorescence is directly proportional to the severity degree and extension of detected caries, with higher fluorescence corresponding to a more severe lesion. It is a highly sensitive, specific, precise, and extremely reliable method. It provides reproducible results that enable checking, stabilization, and documentation. Minute lesions that are usually missed out or unobserved by conventional methods can be detected by it at the earliest stages, with over 90% accuracy to diagnose pit-and-fissure caries, proximal caries, calculus, and periodontitis. It provides early detection of slight pathological changes that are unseen or undiagnosed by conventional methods. It is simple, user-friendly, non-invasive, pain-free, safe, easy, and quick to use, without radiation exposure. It can yield accurate, real-time, and good-time results, exposed through elevated scale readings on the display. In addition, it is readily transportable with a flexible unit which is battery-operated [32,33].
DIAGNOdent® pen is a more recent advancement made in the DIAGNOdent technology, which is considered by many as a perfect option to detect enamel superficial fissures and smooth surface caries accurately. It is a cordless mobile device, which can be easily transported and used anywhere. It is also handy, user-friendly, simple, precise, fast, and always there when needed, providing a complete caries detection, with a high intra-examiner reliability [33].
Another method used for caries diagnosis is based on the ultrasound principle. The ultrasonic caries detector is considered as a reliable tool that provides fast and accurate results for the detection of dental caries, being more effective in detecting proximal caries that cannot be seen on radiographs. It is mainly limited by the fact that is not a quantitative method [33].
There are many options for caries diagnosis techniques, each of them functioning better for certain types of lesions. However, an ideal diagnostic tool should detect dental caries and incipient lesions in the earliest stage possible, provide valid potential caries risk and severity degree assessment for different age groups, and above all, make it possible to determine the caries activity exactly and monitor the behavior and progress of carious lesions over time [11,12,13,20,21,32,33].
Therefore, based on the aforementioned references, the main requirements/requisites of a highly efficient method for caries diagnosis would be: accuracy, precision, high sensitivity and specificity, objectivity, validity, reproducibility, consistency, non-invasiveness, pain-free, simple and easy-to-apply, user-friendly, rapidity and real-time outcome, useful for all surfaces and orientation angles of teeth surfaces, cost-efficient, able to identify carious lesions even in inaccessible or hard-to-reach regions of the examined tooth, detect caries adjacent to restorations, resistant to environment changes (humidity, pressure and temperature), the robustness of the equipment and durability (batteries, filters, laser and other components) [30,31,32].
Using Raman spectroscopy, Bulatov et al. [7] performed a comparison of healthy and carious teeth and established that the carious process can affect the phosphate and carbonate phases of enamel. This mineral component, hydroxyapatite (Ca10(PO4)6(OH)2), has a hexagonal symmetry and the apatite crystalline structure is adaptive to various additions; for example, dental apatite contains a substantial amount of carbonate groups, which substitute for the OH− groups (A-type CO3) or for the phosphate tetrahedral (B-type CO3). Therefore, the general formula for dental hydroxyapatite could be [Ca10(PO4)6−x(OH)2−y(CO3)x+y]. In this work, four stages of dental caries were determined, according to their severity: normal enamel (no caries at all), fissure carries, moderate caries, and advanced caries. The experimental setup consisted of a Renishaw spectrometer coupled to an imaging microscope (Leica DM LM) and excitation was performed by both air-cooled HeNe laser, emitting at 632.8 nm and a 785 nm emitting diode laser, directly on the tooth specimens. The Raman spectrometer used in this work covered a wavenumber range of 500 to 4000 cm−1, suitable to provide information on a variety of chemical bonds and vibrational modes potentially affected by caries (Table 2). It was concluded that the emission at ~960 cm−1, which corresponds to PO stretching, is the most significant and can be used for caries detection [7].
Akkus et al. [4] examined the mineralization of healthy human enamel using a near-infrared (NIR) Raman microscope and provided an understanding of baseline variations that may be characteristic for the sound enamel from individual to individual as well as variations within a tooth. Prior to analysis, samples were frozen at −20 ˚C and then thawed at room temperature for 30 min. A Raman microscope was employed with a 10x× objective used to focus the 785 nm laser. Raman spectroscopy scores were confirmed by microcomputed tomography (μCT) on the two teeth that revealed the highest and lowest mineralization levels found in the Raman scans. They found that mineralization levels, assessed by the intensity of the ~960 cm−1 phosphate peak, varied substantially between individuals: the highest Raman-based mineralization intensity value was approximately five times greater than the lowest mineralization degree. They also reported that when teeth were individually assessed, mineralization levels varied along the apical to cervical axis only in some individuals and that, on average, cervical enamel is the least mineralized region [4].
Fraser et al. [34] performed a chemical mapping of the lesions associated with molar–incisor hypo-mineralization in human teeth. Raman microscopic measurements were performed by means of a Senterra Raman microscope (Bruker optics, Ettlingen, Germany) equipped with 532 nm and 785 nm lasers. The 785 nm infra-red laser was used to avoid as much as possible fluorescence emission by organic components of teeth. Spectra were collected using 3–5 cm−1 resolution, the signal has a band reproducibility within 0.1 cm−1 with backgrounds collected every 1000 s. Raman spectra of sectioned specimens were collected in a grid format to chemically map the Raman active components in the hypo-mineralized lesions with different severity degrees, described as white, yellow, or brown, and mapped these caries lesions using integral ratios of major component bands (hydroxyapatite and b-type carbonate) and principal component analysis scores values. The studied lesions exhibited reduced levels of a mineral compared with those of sound enamel and these variations were consistent with an increased disorder in the mineral component of the hypo-mineralized tooth lesions. The results revealed that the hypo-mineralized enamel lesions contain depleted levels of hydroxyapatite and/or slightly higher levels of organic components compared with normal healthy enamel [34].
Ko et al. performed several studies by means of Raman spectroscopy [11,28,29]. The mentioned group examined ex vivo extracted teeth with early carious lesions using polarized Raman spectroscopy. To measure the polarization dependence of Raman spectra of tooth enamel, a series of spectra were acquired at different angles of the polarization direction of the linearly polarized laser light with respect to that of the analyzer (PA). By mechanically rotating a half-wave plate placed in the laser path, laser polarization was varied in relation to that of the analyzer (PA). Parallel-polarized and cross-polarized spectra were obtained with the analyzer (PA) polarization oriented parallel (||) and perpendicular (⊥) to that of the linearly polarized laser light, respectively. The depolarization ratio ρ959 and polarization anisotropy A959 were calculated according to conventional definitions:
where I959(⊥) and I959(||) are the integrated peak intensities of the ~959 cm−1 peak detected, with the analyzer oriented perpendicular to (⊥) and parallel to (||) the polarization direction of the linearly polarized laser light, respectively. Polarization dependence was found evident for Raman peaks at 590 cm−1, 608 cm−1, 959 cm−1, 1069 cm−1, and 1104 cm−1 as a function of angle (θ), this dependence was most noticeable for the band at 959 cm−1.
This approach determined that carious lesions can be detected based on a reduced Raman polarization anisotropy or a higher depolarization ratio of the symmetric stretching peak of phosphate derived from polarized Raman spectra. The observed differences in polarization ratio or anisotropy were believed to be due to increased scattering and alteration in the degree of hydroxyapatite crystal orientation with demineralization. In addition, since these parameters provide a single numerical value, this value can be used as a quantitative measure to assess the extent of demineralization.
A similar approach was followed by Ionita et al. [35] while examining extracted natural teeth with questionable caries. The Raman measurements were made with a Raman micro-spectrometer T64000 HORIBA Jobin Yvon, functioning with the 647.1 nm excitation line and confocal microscope Olympus (objective ×50LF). The measurements were performed for two perpendicular directions of laser polarization plane, provided by a half-wave plate rotation. The authors also reported reduced anisotropy and increased depolarization ratio at 959 cm−1 vibrational mode, both at the external surface of the enamel and in sectioned enamel. Moreover, the examination of various intensities of the PO43− vibrations (at 1043, 590, and 431 cm−1) showed consistent variation in the intensities of spectra of carious lesions when compared to healthy normal enamel: the Raman spectrum of the diseased enamel showed a high-level background. This background is reported to be frequently higher than the highest Raman peak of sound enamel, meaning that two specific phenomena occur: a decrease in the Raman peaks due to local disorder produced by enamel mineral loss and consequently decay process, and simultaneously a strong increase in the background due to fluorescence process (mostly caused by organic elements and organic waste of bacteria).
In addition to the depolarization ratio, other parameters such as the Raman band position, the full width at half maximum of the Raman band and the line shape of the Raman band were used by Buchwald et al. [3] to investigate the effectiveness of Raman spectroscopy as a tool for early caries detection and determined the changes in chemical composition and morphology of human tooth enamel affected by caries. As the results have shown, it was confirmed that parameters, such as depolarization ratio (ρ959), anisotropy (A959), phosphate band position, and line shape, are precise indicatives of enamel caries changes. The results of this study [3] allowed us to statistically correlate the parameters values and the severity of dental caries. The bands of the Raman scattering spectrum are dominated by the PO43− internal mode near 959 cm−1. The other markers of the mineral component connected with the PO43− vibrations are detected near 431 cm−1 and 589 cm−1, respectively.
All the measurements were performed by means of a Renishaw micro-spectrometer with two lasers emitting 785 nm (diode-pumped laser) and 514.5 nm (argon laser) wavelength. The excitation of the laser power was controlled and fixed at 30 mW (diode-pumped laser) and 3 mW (argon laser). During the measurements of each single Raman spectra, the laser beam was automatically focused on the sample by means of Leica 50× long working distance microscope objective with the numerical aperture of 0.5, leading to a laser beam diameter about 2 μm. The values of spectroscopic parameters were obtained by the analysis of Raman scattering spectra. Their findings were able to reliably indicate the occurrence of early caries, characterizing sound enamel, enamel with incipient caries, and enamel affected by advanced caries [3].
The same group led by Buchwald et al. have recently performed additional research studies [26,36,37] in order to investigate the effectiveness of the Raman spectroscopy technique in the determination of changes in chemical composition, structural arrangement, crystal rod orientation and/or morphology of human tooth enamel affected by caries. The initial results from [3] provided new insights into early caries detection that lead to further development and completion with succeeding studies [26,36,37], showing high potential in distinguishing healthy and caries tissue, revealing new possibilities of Raman spectroscopy as a diagnostic tool to recognize the caries disease. In addition to the aforementioned spectral parameters, it is possible to detect early caries by analysis of the background in the Raman scattering spectrum related to the Rayleigh scattering and fluorescence emission.
Kinoshita et al. [38] performed a study in which they employed Raman micro-spectroscopy to measure the Raman spectra of phosphate in sound and carious teeth. The peak intensity at 960 cm−1 of the phosphate (PO43−) symmetric stretching vibrational mode in sound enamel was stronger than that of sound dentin, which indicated that sound enamel contained more phosphate than sound dentin. Additionally, the border between sound enamel and sound dentin was clearly distinguished by the mapping image by means of the Raman spectrum of phosphate. The authors reported that the area surrounding the blackened region of defective carious tooth substance, the Raman spectrum intensity of phosphate was weaker than that of the surrounding sound enamel.
Mihaly et al. [39] performed a study by means of FT-Raman spectroscopy and spectra analysis of human enamel surfaces from sound, affected (with 1 cavity) and highly affected (with at least 3 cavities) tooth samples, obtained from fourteen extracted permanent (molar and premolar) solid teeth. The authors used principal component analysis (PCA) and reported that great differences between the healthy (unaffected) and affected carious tooth samples arise from the structural changes along the c-axis of hydroxyapatite, the main crystalline component of human dental enamel.
The measurements were performed employing a BioRad (Digilab) dedicated FT-Raman spectrometer equipped with liquid nitrogen (LN2) cooled germanium detector and a Nd: YAG excitation laser with a radiation line at a wavelength of 1064 nm. Spectra were collected randomly from 2 × 2 mm areas of teeth enamel surfaces, using a 500 mW laser power, 4 cm−1 resolution and coaddition of 512 individual spectra.
The authors reported that the intensity of the strongest ν1 PO43− peak at 958 cm−1 is considerably pronounced for the sound tooth enamel, compared to enamel spectra of affected and highly affected teeth. Based on Fisher index calculations (measure of the significance of effects), the most discriminative value was obtained for the intensity of the only Raman active ν2 PO43− (E1) symmetric deformation mode at 428 cm−1. Furthermore, these alterations can be observed through the entire tooth enamel surface, promoting a predisposition to caries that is correlated to the chemical and structural composition of tooth enamel. Since carbonated apatites are more susceptible to acid dissolution compared to carbonate-free apatite, the caries susceptibility might be related to differences in CO32− substitution; however, no significant spectral changes regarding the substitution were distinguished by FT-Raman [39].
Wang et al. [40] performed a study aiming to show how correlative electron microprobe and extended hyperspectral Raman imaging (with high spatial and spectral resolution, with peak position and linewidth analysis, and from the μm to mm scale) can provide important information regarding structural characteristics in dentin and enamel. The authors compared healthy and hypoplastic teeth. This comparison was used as a representative tooth disease example to determine discrepancies in the degree of crystallinity, both nearby the dentin–enamel junction, and with different long-range spatial variations. The authors managed to identify a correlation between spectral peak position and linewidth as a measure of crystal lattice disorder across tubules, dentin, dentin–enamel junction, and enamel. They reported that this correlative Raman imaging and analysis approach may really be helpful in providing a better understanding of apatite geochemistry and biomineralization.
Raman micro-spectroscopy and microimaging were performed employing two Raman spectrometer systems. The experimental setup (HR Evo Nano, Horiba Jobin Yvon, f = 800 mm) is based on a confocal Raman microscope, using 632.8 nm excitation, a 100× objective (NA = 0.7, spot size ≈ 1 μm diameter), with the power on the sample at about 8 mW. Spectra were acquired using a grating of 1200 grooves/mm providing a spectral resolution of 0.5 cm−1. Two types of teeth, sound and highly mineralized, and hypoplastic teeth, were collected from two people of similar age. The authors emphasized a well-recognized characteristic, which is the accentuated transition of the Raman response between enamel and dentin at the dentin-enamel junction over a very shorted-length transition of several tens of μm, most obvious in the difference in the intensity of the protein versus inorganic (mineral) Raman response and the related change in line width of the ~960 cm−1 mode. It was also reported that in the hypoplastic tooth samples, a high protein content in hypoplastic enamel was detected with only a minor difference in Ca/P, insignificant to account for the Raman spectral differences, results that would rather imply that protein content is the origin of the reduced degree of mineralization and crystallinity. It was reported that not all tooth disorders lead to diminished linewidth. Similarly, an increase in fluorine content leads to an increase in apatite density and a decrease in solubility, based on an increase in crystallinity and reduced linewidth. The obtained results also showed heterogeneity in Raman response on multiple length scales characterizing spatio-chemical and structural variations in healthy and disease-disordered tooth tissues, establishing a regular relationship of elemental distribution associated alterations in crystallinity and their consequence in the linewidth and spectral position of phosphate Raman mode as a sensitive reporter of the local chemical and structural environment [40].
Another study performed by Monteiro et al. [16] has shown the suitability of confocal Raman microscopy for the examination of carious dental tissues and mineral loss in depth by analyzing tooth cross-sections. Since the analysis of the PO43– symmetric stretching band and its polarization anisotropy are reported to be sensitive markers of demineralization, and at the same time, identifiers of early caries detection, samples of enamel and dentine, with carious lesions in different stages of progression, were assessed by comparing the depolarization ratio of the PO43– symmetric stretching band at 959 cm–1 in different sound and carious tissues carefully chosen by an expert and the selection criteria were represented by the presence of lesions, cavitated or not, including white spots. Raman spectra of samples were acquired by means of a Horiba XploRA confocal microscope using a near-infrared laser (785 nm) with a 1200 lines mm–1 grating. The spectral range explored was from 300 cm–1 to 2200 cm–1 with the spectral resolution of 4 cm–1. Using an entrance slit of 100 μm and a confocal hole of 300 μm, the scattered light collected by the objective achieved the air-cooled charge-coupled detector (CCD) array of an Andor iDus detector.
In order to determine the depolarization ratio of the most intense band in the Raman spectrum, spectra were recorded in two orthogonal polarizations of scattered light (perpendicular and parallel to the polarization of the incident laser beam). Mappings were found to be extremely useful in the delimitation of carious tissues; however, the analysis of a representative area is a time-consuming and complex process, since the areas should be scanned twice with different polarizations, and there is a major risk of defocusing.
An obvious increase in the background spectra of carious enamel due to fluorescence was observed as well as consistent values of the depolarization ratio of 0.05 for sound enamel, with a significant rise of the depolarization ratio in the areas that correspond to the white spot lesions. However, in the closest region to the surface of the tooth, the depolarization ratio decreased again which could be directly related to the contact of these tissues with saliva and, consequently, superficial remineralization [16].
In a more recent research work published in 2021 by Prikule et al. [41], comparative studies were presented with a slightly different approach, carried out using scanning Raman micro-spectroscopy with several sources of laser excitation with wavelengths of 532 nm, 785 nm, and 1064 nm, obtaining different spectra of tooth enamel according to the used radiation, also revealing that the intensity of Raman scattering of enamel is directly proportional to the enamel layer thickness. These comparative studies provided relevant data obtained from vital and removed teeth, showing an obvious difference in the optical response during the measurements of the vital teeth surface with an in vivo approach compared to the in vitro approach applied to the removed teeth, under the same conditions of signal registration. The main reported difference was that due to the standard oral hygiene procedure carried out by each of the patients, microbial plaque remains on the surface of their teeth, which effectively absorbs and scatters visible high-frequency laser radiation. Additionally, it must be considered that the presence of fluid circulation in the dentine tubules of vital teeth may lead to significant differences in the obtained indicators during Raman diagnostics on vital and removed teeth.
In conclusion, the authors stated that Raman spectroscopy represents a promising method for the differential diagnosis of teeth predisposition to caries. The implementation of such developed research methods will increase the effectiveness of not only the diagnosis, but also the prevention of dental hard tissue disease development. Moreover, Raman scattering provides an opportunity to determine both the static value of the dental tissues’ mineralization degree, and the effect of remineralization in dynamics [41].
3. Bleaching Agents’ Performance
Tooth whitening is one of the most requested dental treatments, for the noninvasive aesthetical improvement of the smile. Bleachorexia is a disease characterized by the constant application of whitening products, without any medical control [42], causing more severe cases lesions in the oral cavity, as well as inducing severe adverse effects such as tooth transitory sensitivity, a reduction in microhardness, and an increase in roughness [42,43,44,45].
Tooth whitening can be defined as a process that lightens the tooth color, accomplished by the physical removal of the stain or chemical degradation of the chromophore molecule. The active ingredient in the greatest part of whitening products is hydrogen peroxide (H2O2), which can be delivered as hydrogen peroxide or carbamide peroxide (carbamide peroxide is a stable complex that breaks down in contact with water to release hydrogen peroxide and urea). However, there are certain risks related to tooth whitening that need to be mentioned, such as increased tooth sensitivity, gingival irritation, tooth surface roughening and softening, increased potential for demineralization, degradation of dental restorations, and undesirable color change of dental restorations [46,47].
Four different methods for tooth whitening have been recognized and described by Barghi [46]: dentist-administered bleaching—the use of an increased concentration of hydrogen peroxide (from 35 to 50%) or carbamide peroxide (from 35 to 40%), often supplemented with a heat source; dentist-supervised bleaching—by means of a bleaching tray loaded with high concentrations of carbamide peroxide (from 35 to 40%) that is placed in the patient’s mouth for 30 min to 2 h while the patient is in the dental office; dentist-provided bleaching—known as “at-home” or “night-guard” bleaching and self-administered by the patient applying from 5 to 22% solution of carbamide peroxide in a custom-made tray; and over-the-counter products, often based on carbamide peroxide or hydrogen peroxide of different concentration levels and positioned in a pre-fabricated tray, strips [48], rinses, and toothpastes, all to be adjusted by the user according to the applied product manufacturer instructions [46,47,48,49,50].
The main advantages of the in-office technique comprise dentist control, avoidance of soft tissue exposure or material ingestion, diminished total treatment time, and a greater potential for immediate efficient results. Another relevant whitening method is at-home bleaching. It is also known as night guard vital bleaching, which represents an esthetic procedure where the patient, at home, uses custom-fitted prostheses to apply a solution to lighten vital teeth. The accepted standard for this procedure recognizes the use of a maximum of 10% carbamide peroxide or CP material. The CP concentration in real cases, however, may vary from 10–22%. The mains disadvantage of bleaching techniques is that bleaching agents cause enamel demineralization and may soften some tooth-colored restorative materials. There is a significant difference between the effect of at-home and in-office bleaching on the hardness of the tested specimens. Nevertheless, when compared with the untreated control surfaces, the enamel surface exposed to the bleaching active agents underwent slight notably significant morphologic changes [46,47,48,49,50].
Santini et al. [51] performed several relevant studies on dental dentine and enamel layers, by means of Raman spectroscopy. In one of their studies, the authors assessed alterations in phosphate concentrations of surface enamel treated with a proprietary bleaching agent (‘peroxide’) containing 10% carbamide peroxide over a 28-day period using Raman spectroscopy. Raman spectra were acquired on a confocal LabRam 300 spectrometer fitted with an Olympus B microscope (Olympus, Middlesex, UK). The excitation source was emitted by a He/Ne laser operating at 632.8 nm (red) in combination with a slit of 150 µm, confocal hole 250 of µm, and 1800 grooves/mm holographic grating providing high resolution. A significant decrease in the PO43− group concentration levels compared with the base-line measurements, at days 7, 14, and 28 was also reported. They recommended that bleaching agents with a concentration of carbamide peroxide above 10%, should not be applied to a point where surface enamel is demineralized.
Vargas et al. [15] performed another in vitro study comparing dental bleaching agents with different concentrations (between 9.5% and 14% hydrogen peroxide) for 28 consecutive days. In all experimental groups, a decrease in the concentration of the phosphate molecule was observed during the bleaching treatment process. They concluded that the bleaching material caused a decrease in the concentration of the phosphate molecule. This demineralization was more significant in higher-concentration bleaching procedures. The present study concluded that teeth treated with 9.5% hydrogen peroxide have revealed minimal loss of dental phosphate. Dental bleaching achieved with 14% hydrogen peroxide generated continuous dental phosphate loss in the 4 weeks of treatment, representing approximately 22% of the mineral loss. Teeth that were bleached with 38% carbamide peroxide exhibited the greatest demineralization of dental enamel phosphate; this loss was approximately 45%, and it was notable, especially during the two first weeks of the study.
Another study performed as well by Vargas et al. [52] aimed to analyze the effect of tooth bleaching agents on Titanium dioxide trace concentration in dental enamel by means of confocal Raman spectroscopy. In this study, 60 human dental tooth samples, extracted for periodontal or orthodontic reasons, were randomly distributed in six experimental groups and prone to different bleaching procedures, according to the whitening gel elements (hydrogen peroxide of 9,5%, 14%, 28%, and 35%, respectively, as well as carbamide peroxide of 38% concentrations) and manufacturer’s instructions.
Measurements were performed by means of a confocal Raman spectrometer (Model Alpha300 R, WiTec, Ulm, Germany), fitted with a 100 mW He/ Ne laser (785 nm) with spot size ~50 μm. All spectra were obtained with an integration time of 0.5 s and 100 acquisitions. This study aimed to identify and quantify the presence of titanium dioxide molecules in enamel before and following whitening protocols. The results revealed that titanium dioxide concentration was negatively affected by the longer whitening protocols (at-home bleaching gels). All in-office bleaching products significantly altered the studied molecule to a higher level. In all dental specimens was possible to identify the presence of titanium dioxide as a trace component in dental enamel. In-office bleaching products that must be applied at higher concentrations but for shorter periods of time promote a concentration increase in titanium dioxide, whilst at-home whitening gels used for extended periods of time, despite the lesser concentration, favored a loss in titanium [52].
Castro et al. [42] used confocal Raman spectroscopy to assess whether the mineralization levels and elemental and molecular content in tooth enamel are changed when bleaching the teeth with two different over-the-counter (OTC) bleaching gels, above the recommendations of the manufacturer. The manufacturer’s recommendations for both products were gel application on the tray one time per day, between 20 and 45 min for 4 weeks. Since the aim of this study was to investigate the effects of unsupervised OTC whitening products on dental enamel, an abusive protocol exceeding the manufacturer’s recommendations was developed for both bleaching products used, with six teeth randomly chosen for each product. In each application, the whitening gel was applied directly on the surface of teeth, covering the entire enamel area, for 45 min on each day for 39 consecutive days.
The Raman spectrometer used was the Horiba XploRA Confocal Micro-Raman with a laser diode source operating at a wavelength of 785 nm. The spectral range that was used for all the assessments was from 130 cm−1 to 1800 cm−1 with a 4 cm−1 spectral resolution. Both products revealed lower carbamide peroxide values than the advertised ones by the fabricant.
The Degree of Demineralization of enamel was determined by:
where Imineralized is the intensity of the hydroxyapatite peak at ~959 cm−1 in the mineralized enamel (control), and Idemineralized is that measured for each day of application.
The obtained results suggest that over-bleaching may generate a significant loss of phosphate groups from surface enamel. Although the demineralization protocol did not contemplate saliva renewal between applications, the product is so highly concentrated and with such low pH, that a high demineralization would most likely occur in vivo [42].
In order to test the importance of saliva renewal in the design of valid in vitro models, Silveira et al. [53] compared the Degree of Demineralization induced in enamel samples after the application of an over-the-counter bleaching gel in an application model with and without daily renewal of artificial saliva. From the obtained results, the medium storage conditions tested do not result in statistically significant differences in the DD values. However, the Pearson coefficients of variation in the saliva renewal group were smaller and without variation along the time when compared with those in the non-renewal group which increased over time. This result suggests greater variability and dispersion in the obtained values when saliva is not changed, hence a lower precision of the measurements.
Bittencourt et al. [54] assessed the impact of fluoride delivery and restoration time point on the microshear bond strength (mSBS) by determining the degree of conversion (DC) values of an adhesive applied on bleached enamel. In this study, 54 enamel samples were submitted to bleaching and subsequently divided into three groups of 18 specimens: group HP, bleaching with 35% hydrogen peroxide (Whiteness HP Maxx, FGM; Joinville, SC, Brazil); group HPF, bleaching with 35% HP + topical 1.23% sodium fluoride application (F); and group PF, bleaching with 38% HP containing fluoride in its composition (Opalescence Boost PF, Ultradent Products; South Jordan, UT, USA). A control group containing six samples was neither bleached nor fluoridated. Following, each group except the control was divided into three subgroups to perform an immediate enamel restoration.
The DC was calculated according to the following formula:
where u and p refer to the uncured and polymerized adhesive systems, respectively, and Ir is the intensity of the reactive bands (1639 cm−1) and Iref the reference ones (1609 cm−1) of the obtained spectra.
The results of this study disclosed low microshear bond strength to enamel values in group HP for the subgroup specimens restored immediately after bleaching treatments. Additionally, a decline in immediate DC values was observed for the HP subgroups, possibly due to the presence of residual oxygen, which impairs conversion. It was reported a lessening in resin tags, as well as a decreased degree of adhesive penetration into the bleached enamel substrate. The authors highlighted that the separate application of topical fluoride was not effective in reversing the low bond strength and degree of conversion values following the in-office bleaching procedure. Still, increased bond strength and a higher degree of conversion values were found when the restorative procedure was performed immediately after bleaching with the fluoridated in-office bleaching agent [54].
Silveira et al. [43] used the confocal micro-Raman technique to identify the presence of oxygen generated by tooth bleaching products in the tooth enamel surface, supporting the theory that oxygen remains in tooth mineralized tissues following some dental treatments and thus reducing adhesive forces and compromising the restorative treatments. Oxygen is a polymerization inhibitor of 2,2-bis[4-(2-hydroxy-3-methacryloxypropoxy) phenyl] propane (Bis-GMA) and triethylene glycol dimethacrylate, a basic constituent of most dental adhesive materials. Six molar teeth were treated with a bleaching gel containing 38% of hydrogen peroxide (Opalescence Boost, Ultradent Products, USA) for 24 h, then rinsed in distilled water and dried with absorbent paper at room temperature. Raman spectra were collected before and after the application of the gel using XploRa Confocal Micro-Raman with a laser diode source operating at a wavelength of 638 nm and a new peak at 1552 cm−1 attributed to CO2 was determined in the bleached samples.
More recently, Silva et al. [55] performed a research study to assess the effect of fluorinated tooth bleaching products using polarized Raman spectroscopy. Four whitening products were compared for efficacy and deleterious effects, by analyzing raw and polished enamel samples. The information on the crystalline state of the enamel was provided by the determination of the depolarization ratio of the symmetric stretching band of phosphate (at 959 cm−1). The authors concluded that polished enamel is more prone to demineralization. Enamel polishing increased susceptibility to erosion, leading to a decreased hardness and an increased enamel depolarization ratio. The results have also shown a statistically significant decrease in the depolarization ratio, leading to an increase in mineralization after the application of three of the applied bleaching products. Therefore, when these products are used according to manufacturer instructions, they preserve enamel integrity, while fluorinated whitening gels can efficiently incorporate fluorine. This study proved also the utility of the Raman technique [55].
4. Other Pharmaceutical Products
Enamel mineral loss can also be caused by medication or dental pharmaceutical products that can directly affect surface enamel or indirectly lead to increased demineralization. A great part of these pharmaceuticals, especially for pediatric use, contain added sweeteners such as saccharose, with lower pH and further converted in acid by the bacteria in intraoral environment [56,57,58], in order to overcome the unpleasant taste.
Commonly, such medications are taken over long periods of time and multiple times a day (and night) and dental hygiene is rarely performed after each administration procedure. Consequently, the drug remains in contact with the enamel surface for long periods of time, therefore causing carious degradation and destruction processes and favoring erosion. Some authors have suggested that for structural reasons, primary tooth enamel is more soluble than the enamel of permanent teeth; therefore, it is more prone to demineralization [56].
Sant Anna et al. [56] performed a study evaluating antihistamine (DA) and bronchodilator (DB) drugs actions on dental enamel by means of Fourier Transform Raman spectroscopy with the main advantage of an absent background. The measurements were carried out using a FT Raman spectrometer (RFS 100/S ®, Bruker Inc, Karlsruhe, Germany) with germanium detector using LN2 cooling. The samples were excited using Nd: YAG laser (1064 nm) with incident power on the sample of 400 mW and spectral resolution of 4 cm−1.
This study aimed to assess whether the use of the mentioned medications in the treatment of chronic diseases may be associated with the risk of dental demineralization and erosion. Twenty-four enamel samples were randomly distributed in control and experimental groups, analyzed afterwards by the FT–Raman technique.
For the total spectrum for each sample, the band intensity and integrated area under the peaks were considered for the comparison between the organic material (2940 cm−1) and inorganic (carbonate 1070 cm−1). The average of the spectra was calculated after baseline correction by removing the spectral background and then normalizing band at ~960 cm−1. All experimental groups revealed a non-significant, however notable decrease in most soluble inorganic compounds after submitted to challenge, which proves that saccharose, pediatric medications with an endogenous acidic pH and acidic substances can cause a slight loss and dissociation of the minerals present at the enamel surface [57].
Kuramochi et al. [59] performed a study by means of micro-Raman spectroscopy and transverse microradiography techniques, in order to investigate the influence of bicarbonate use on the effects of carbonate ions in the mineral phase during demineralization (acid resistance test) of subsurface lesions. Initially, baseline lesions were formed by demineralizing bovine enamel, and specimens were then exposed to remineralization solutions containing 0-, 5-, or 50 mm bicarbonate. In a later stage, acid resistance tests were completed on remineralized and sound enamel samples. Dental specimens were analyzed by means of confocal laser Raman micro-spectroscopy (Nicolet Almega XR Dispersive Raman micro-spectroscopy system; Thermo Fisher Scientific, Waltham, MA, USA), equipped with a 780 nm laser and a grating of 360 lines per mm. The spectra were acquired from six points across the cut surface from each sample, at 10 and 40 µm from the surface in the direction of the lesion by applying an aperture of 100 µm, delimitating the surface and lesion body areas. Signal-to-noise ratios were improved, with decreased fluorescence background, by performing constantly 10 consecutive exposures for all the samples, each of 10 s duration, with 10% neutral density filter. The intensities of phosphate (~961 cm−1) and B-type carbonate substitution (1070 cm−1) peaks were measured, while for the six points at the varying depth of every sample was calculated an average value.
The obtained Raman spectra have revealed that carbonate and phosphate ions were efficiently incorporated into both surface layers and lesion bodies during remineralization after bicarbonate application. Although the average of the measured mineral profiles of remineralized enamel differed from those of sound enamel after the acid resistance tests, it was found that phosphate and bicarbonate application and their consequent integration into enamel subsurface lesions did not change the overall mineralization levels during the remineralization process [59].
Santini et al. [60] performed another study by means of Raman spectroscopy, in which they examined monomer-to-polymer conversion, a process that is considered relevant for obtaining optimal mechanical properties and resistance to biodegradation of resin-based restorative materials. The main objective of this study was to determine the degree of conversion (DC) of three distinct fissure sealants (Helioseal Opaque, Helioseal Clear and Delton Opaque) cured using a conventional quartz-tungsten halogen (QTH) or a high-power light-emitting diode (LED) light-curing unit.
The fissure sealants were applied to 60 non-carious permanent molars and cured with the QTH or the LED. Micro-Raman spectra were obtained from the top and the bottom surface of each specimen, by using the Micro-Raman spectrometer LABRAM 300 (HORIBA Jobin Yvon Ltd.). Spectra were obtained using the following micro-Raman parameters: HeNe laser with 632.8 nm wavelength and 20 mW incident power, spatial resolution of 1.5 µm, spectral resolution of 2.5 cm−1, 300 µm slit, 500 µm confocal hole, and 100% filter. The obtained results have shown that top surface DC values were significantly greater than the bottom surface in each material regardless of the light-curing unit. Moreover, a higher DC value can be obtained by means of LED with less exposure time in comparison with the conventional QTH at the top and bottom surfaces of the three fissure sealants, even though a lower conversion may be expected in opaque materials.
Another work conducted by Luis et al. [61], was performed, in vitro, in order to evaluate the potential demineralizing effect on human enamel samples of two different gustatory stimulants of salivary secretion (GSSS). Additionally, proton-induced gamma-ray emission (PIGE) was also employed to quantify fluorine uptake. These two products are usually administrated to patients who are diagnosed with a pathological condition called xerostomia, a complication generated by radiation therapy, chemotherapy, or diseases such as Sjögren’s Syndrome [61].
Raman spectra were acquired from the samples using a Horiba XploRA confocal microscope using the near-infrared laser (785 nm) with a 1200 lines/mm grating. The investigated spectral range varied between 300 and 1400 cm−1 with a spectral resolution of 4 cm−1. Using an entrance slit of 100 μm, and a confocal hole of 300 μm, the scattered light collected by the objective was dispersed onto the air-cooled CCD array of an Andor iDus detector.
The depolarization ratio of the symmetric stretching band of phosphate ions (~959 cm−1) was determined in order to provide valuable information on the mineralized state of the enamel. Considering the obtained results and the statistic t-student test performed, there was no statistically significant variation in the depolarization ratio before and after treatment. Nonetheless, the possible effects of abusive administration require further evaluation. Regarding fluorine concentration, the obtained results have revealed a significant increase in fluorine concentration, which was found in samples treated by XerosTM, whereas no significant differences were found in fluorine concentration for the specimens treated using SST® treatment [61].
5. Demineralizing Effect from Low pH Foods and Beverages with Erosive Potential
Enamel mineralization can be affected by different factors, such as alcohol consumption and high ingestion of dietary carbohydrates, with an overall mineral loss of the enamel.
Dental erosion represents a relevant destruction process on tooth surface enamel, caused by acidic foods and drinks such as fruit juices, energy drinks, and cola drinks with an increased acidic potential [62]. Highly sophisticated acidic beverages sweetened with carbohydrates have been reported to generate morphologically damaging modifications on the surface of the enamel [63].
Tramini et al. [64] investigated, in vitro, the effects of lactic acid on enamel and dentin from human permanent teeth. The results have revealed modifications due to the acidic attack principally concerning phosphate PO43−, which represents the mineral phase in enamel and dentin. The evolution of the mineral reduction inside dentin and enamel was evaluated by producing, in vitro, a low pH: the used specimens from sectioned teeth were submerged in pure lactic acid solution (5 M, pH = 4.5) during 7, 14, and 30 days. Following, samples were rinsed with distilled water before being analyzed. The Raman spectra have shown changes in the intensity of the PO43− symmetric stretching band that depend on the type of dentin, anatomical location, and the age of the subject.
Braga et al. [65] performed a study using FT-Raman Spectroscopy examining the erosive potential of two acidic solutions. This study evaluated and compared in vitro the structure and mineral components of dental enamel after enduring an erosive challenge in gastric juice (pH 1.6, titratable acidity 0.50 mL 0.05 M sodium hydroxide) originated from the endoscopy exam and commercially available orange juice (Minute Maid, Coca-Cola Company, pH 3.7, titratable acidity 0.65 mL) as follows: 5 min in 3 mL of demineralizing solution, rinsed with distilled water, and stored in artificial saliva for 3 h. This cycle was performed repeatedly four times a day, for 14 days, consecutively. The comparison of the carbonate to phosphate ratio (bands at 1072 and 960 cm−1, respectively) showed that gastric juice has a higher erosive potential and caused more significant alterations in the morphology and mineral composition of dental enamel than orange juice. SEM photomicrographs of enamel surface after the erosive challenge with gastric juice showed a distinct unique specific pattern, showing hollowing of prism centers with relatively intact peripheral regions, reflecting a honeycomb appearance. On the other hand, the enamel surface after orange juice revealed a generalized surface roughening with no apparent evidence of a prism pattern, and the surface was not entirely etched.
Zheng, J. et al. [66] investigated in vitro erosion effects on human tooth enamel in citric acid solution (pH = 3.2). The surfaces of enamel after different erosion time periods were analyzed by means of several microscopic examinations. Results revealed a honeycomb-like structure on the enamel surface, after just 7 days, due to severe dissolution of the enamel rods, showing a substantial erosive demineralization, concomitant with reduced microhardness.
Pezzotti et al. [67] used Raman spectroscopic technique to assess quantitatively and in vitro the degree demineralization of sound dental enamel after being exposed to a highly acidic beverage (Coca-Cola®, pH = 2.5). The used setup was an optical fiber-coupled probe by means of a triple monochromator (T-64000, Horiba/Jobin-Yvon, Kyoto—Japan) employing a LN2 cooled charge-coupled device (CCD), a confocal pinhole, and polarization filters. The excitation source consisted of a 532 nm Nd: YVO4 diode-pumped solid-state laser (SOC JUNO, Showa Optronics Co. Ltd., Tokyo, Japan) operating at an emission power of 200 mW. An objective lens with a numerical aperture of 0.5 was used in order to focus the laser beam on the sample surface and to collect the scattered Raman light. All the measurements were carried out with a pinhole aperture of 100 μm and with an objective lens with a magnification of 100×. The diameter of the probe device in the focal plane and the penetration depth to which emission of the Raman signal reached 90% of the total Raman intensity were calibrated as ~2 and 104 μm, respectively, with focusing on the free enamel surface of the normal healthy teeth. After the erosive challenge, the authors reported that the originally smooth enamel surface of the tooth suffered an acidic damaging attack and was obviously corroded within a relatively short exposure time. A latter evaluation revealed a strong increase in surface roughness caused by the corrosive attack, with the difference in height raising from 0.3 to 4.7 μm. As frequently detected in etched enamel surfaces, the basic organizational structure of the enamel prisms tends to be gradually more visible as the exposure time to acidic attack increases until the core of the prisms starts to dissolve. The authors concluded that soaking specimens in phosphoric acid at a concentration of approximately 37% results in many superficial morphological irregularities, increases the surface area for mechanical bonding and surface wettability [67,68,69].
More recently, Cândido et al. [70] also proposed an in vitro model to evaluate the demineralizing capacity of Coca-Cola®. The main aim of this study was to assess the resulting alterations in the mineral content of enamel specimens prone to an acidic soft drink (Coca-Cola®, pH=2.43). For this purpose, human dental enamel specimens were obtained and collected from the teeth bank of the Group of Research in Biology and Oral Biochemistry of the Faculty of Dentistry of the University of Lisbon (GIBBO-LibPhys FMDUL), which were divided into three experimental groups according to the type of study—the study of in-depth and/or surface demineralization using energy dispersive X-ray fluorescence (EDXRF) and confocal Raman spectroscopy techniques. For Raman spectra acquisition, the used setup was a Raman Confocal system, μ-Raman XploRA (Horiba/Jobin-Yvon Xplora, Longjumeau, France), equipped with an Olympus microscope with different objectives: 10×, 50×, and 100×. The examined specimens from the first group were analyzed on the surface and cross-section, while in the second group, the measurements were performed only to the surface. In the third group specimens, the measurements were made only on the cross-section, intending to determine the depth of demineralization. The results exhibited dental demineralization both in surface analysis and in cross-section analysis. Surface analysis showed a slight reduction in the concentration of Ca and P and an apparent increase in the concentration of the light elements Sr and S, obtained by μ-EDXRF. Furthermore, the increase in the depolarization ratio observed in the measurements performed by μ-Raman is also indicative of surface demineralization. Moreover, both profile analyses revealed a mineral loss in depth of tens of μm. By obtaining these results, the authors managed to prove that the μ-Raman technique is highly sensitive for the assessment of dental demineralization [70].
6. Remineralization Agents
Dental caries is caused by demineralization of tooth hard tissue generated by organic acids from the complex fermentation process of dietary carbohydrates by dental plaque bacteria [71]. Caries prevention of the initiation of mineral loss and interruption of dental decay progression of early lesions are the desirable modes of caries management. Remineralization of carious lesions, defined as net mineral raise due to a supply of calcium and phosphate ions external to enamel [71,72], is increasingly considered instead of restoring such lesions, with great interest in minimal invasive treatment of incipient carious lesions with the availability of novel preventive remineralization agents, such as fluoride, casein phosphopeptide–amorphous calcium phosphate (CPP–ACP), unstabilized ACP (ACP), CPP stabilized amorphous calcium phosphate with fluoride (CPP-ACP F), and Calcium Sucrose Phosphate (CaSP) [71,72,73,74,75,76,77].
Kerr et al. [78] have successfully employed FT-Raman spectroscopy to map the mineral concentration of dental enamel at baseline and after exposure of artificial caries to microwave energy (ME) radiation, known for killing various microorganisms, and a remineralization protocol. In this work, one group of enamel specimens was exposed to Ka band of ME radiation at a power setting of 6.6 W for 60 s, while the other group was used as control.
Raman spectra were acquired at 12 points per enamel slab by means of FT infrared spectroscopy instrument, configured with a Raman accessory, a CaF2 beam splitter, and an InGaAs detector (Thermo Fisher Scientific, Madison, WI, USA). The laser wavelength used for the enamel evaluation was 1064 nm, with a spot size of approximately 50 μm. The treatment approach used in the present study targeted S. mutans, a pathological bacterial factor which is directly implicated in the caries process and dental decay. The authors proved that bacterial elimination would significantly change that balance in favor of remineralization. Since remineralization is a pH-dependent “repair” process, the elimination of S. mutans, a key acid-producing bacterium, is expected to alter local pH in order to promote tooth repair. The limitations of the used in vitro model demonstrated an effectiveness of approximately 99% killing of S. mutans, promoting and reinforcing remineralization compared to controls [78].
Another study, performed by Job et al. [79], aimed mainly to compare the remineralization potential of three different dentifrices by means of Raman spectroscopy and confocal laser scanning microscopy (CLSM) techniques. The authors used 30 extracted intact molar teeth, that were affected, and the crown of each selected tooth from a group was separated from the root and longitudinally sectioned into four parts with each section under a subgroup, of which one section was an untreated section, the second and the third sections were demineralized in a demineralizing solution, while the third section was remineralized after demineralization. After Raman spectral analysis, it was revealed that demineralized samples treated with CPP-ACP compounds exhibited the highest concentration of phosphate ions, and the microscopic examination with confocal laser has shown better surface remineralization of the demineralized samples when treated with NovaMin technology [79].
Milly et al. [80] performed a study that aimed to evaluate the remineralization potential of bio-active glass (BAG) powder and BAG-containing polyacrylic acid (PAA-BAG) products, applied to enamel white spot lesions (WSL). The authors used 32 human enamel samples with artificially induced WSLs. These samples were divided into four experimental groups: BAG slurry, PAA-BAG slurry, standardized remineralization solution (positive control) and de-ionized water (negative control).
Mechanical properties of dental enamel were investigated using surface and cross-section Knoop microhardness, while Micro-Raman spectroscopy (Renishaw inVia Raman microscope) in Stream-Line TM scan mode (high-speed line scanning system that permits faster and better excitation intensity distribution across the sample surface using a 785 nm diode laser) was used to scan lesion cross-sections, with the established intensity of the Raman phosphate peak at 959 cm−1. The signal was acquired using a 600 lines/mm diffraction grating centered at 800 cm−1 and a CCD exposure time of 2 s. For every sample, a Raman map of the air/lesion/enamel interface was obtained at the middle part of the lesion. The Raman map was started at 125 mm on the exterior side of the lesion (air) and continued to approximately 400 mm within the sound enamel, covering an area of 525 × 350 µm2 and containing 1740 spectra acquired with a 2.7 mm resolution across the air/lesion/enamel interface. Raman maps were then exported to fit the spectra and to produce gray-scale images and depth profiles of phosphate peak intensity at 959 cm−1. The demineralized enamel emitted a small amount of autofluorescence, as most biological samples. A further 20 samples were used to acquire 3D images of enamel surfaces by using non-contact white light profilometry allowing the measurement of lesion step height in relation to the sound enamel reference level. In addition, the authors used scanning electron microscopy (SEM) to further assess the lesion surface. It was reported that samples treated with remineralization solution revealed (statistically) significantly greater surface and higher cross-section Knoop microhardness in comparison with negative control. By using the Raman technique, the authors determined a significantly increased phosphate content within the treated groups compared to the negative control group, while SEM images revealed mineral depositions, differing in sizes and shapes, within remineralized treated groups and the positive control groups. The obtained results indicate that remineralization surface treatments improve and promote enamel WSL remineralization, which is confirmed by the higher phosphate content and morphological alterations within the artificial lesions [80].
Parker et al. [81] investigated, the crystal formation of hydroxyapatite (HAp) from calcium silicate and the deposition of calcium silicate on sound and acid-eroded enamel surfaces, in order to assess its repair potential and protective properties on enamel. The authors mixed calcium silicate with phosphate buffer for seven days and the resulting solids analyzed for crystalline phases by means of Raman spectroscopy. Micro-Raman spectra were collected from the samples by means of a Raman microscope (Renishaw, UK) fitted with a CCD detector and a 633 nm He-Ne laser using a 5% attenuation filter and a spot size with a diameter of 3 μm. A 50× magnification lens was employed. Enamel repair and protection were examined using scanning electrochemical cell microscopy technique—SECCM. The obtained results showed that calcium silicate can undergo great transformations into Hap, resulting in small deposits on acid eroded and sound enamel surfaces, providing relevant protection of sound enamel from acid challenges. Consequently, calcium silicate can be considered as a biomaterial, highly compatible with dental composition, with a significant repair capacity, which can be applied as a new approach for the repair of demineralized affected enamel layers and the protection of enamel from the acidic action of low-pH beverages with erosive potential [81].
Finally, however not less important, Otel et al. performed an in vitro study, by means of polarized Raman spectroscopy and energy-dispersive X-ray fluorescence (EDXRF) techniques [82], on the protective effect of fluorinated varnish on human enamel samples, after enduring a citric acid erosive challenge. To accomplish the proposed objectives, it was performed a direct and more complex analysis of a group of dental samples before (1st stage) and after (2nd stage) the application of the fluorinated varnish, followed by a 3rd stage—after being subjected to an acid erosive procedure which was similar to the intraoral environment. All acquired Raman spectra (with an example represented in Figure 3) from the examined samples during this study [82] were obtained by means of an XploRA Raman confocal microscope (Horiba, France), equipped with a laser diode source operating at 785 nm, using a 1200 lines/mm grating, resulting in a wide spectral range from 400 cm−1 to 1800 cm−1, with a spectral resolution of approximately 4–6 cm−1. More precisely, in the case of Raman spectra, the main spectral parameters that were used to evaluate the mineral loss of the hydroxyapatite matrix were the depolarization ratio (ρ959) and the polarization anisotropy (A959) of the symmetric stretching band of phosphate (located at ~959 cm−1), while the assessment of slight variations or more significant changes regarding the elemental content was performed using a different technique—Energy-dispersive X-ray fluorescence (EDXRF). These two techniques were used for an overall evaluation of the examined dental samples, providing complementary information and further confirmation on the obtained results. Their selection was mainly based on the fact that these two techniques have been previously used, combined together or separately, for the ex vivo evaluation of human enamel, but have not been, to the best of authors’ knowledge, used in this manner to assess the effect or acid erosive cycles (erosive challenge). This study revealed strong evidence of demineralization after the citric acid erosive procedure and significant differences between control and treatment groups, during all study stages. The obtained data indicated clearly the existence of a significant loss of mineral content, namely calcium component, especially after performing the citric acid erosive cycle. It was revealed that the enamel samples treated with a remineralizing and protective dental varnish had a significantly lesser mineral loss, reinforcing in this way, the protective potential of topical fluoride application, with surface adherent capacity and superficial remineralization effect [82].
7. Raman Fiber-Optic Probes for In Vivo and In Vitro Remote Applications
In this additional section, a few relevant studies are described in which Raman systems connected to fiber-coupled remote probes were used. A study performed by Izawa et al. [83] carried out in vivo trial measurements of living teeth to verify the accessibility of the Raman technique by using a fiber-optic probe-type multi-channel Raman spectrometer (Figure 4). The authors explored the possibility of dental caries diagnosis by using Raman spectroscopy and its clinical application, reporting that Raman peak intensity of hydroxyapatite at carious lesion was considerably lower compared to the healthy parts of sound enamel tissue, while the florescence intensity levels at the same portions were higher.
Another relevant research study, performed by Ko et al. [11], described the possibility of examining tooth enamel by using a fiber-optic coupled polarization-resolved Raman spectroscopic optimized system for an 830 nm laser excitation, which was designed and developed by this group for the simultaneous collection of orthogonally polarized Raman spectra within a single measurement. Moreover, these authors demonstrated also “an application of detecting incipient dental caries based on changes observed in Raman polarization anisotropy”. They managed to obtain precise and indicative significant results.
A more recent study conducted by Akkus et al. [84] exposed important results obtained from Raman measurements, which allowed them to assess the mineral content of tooth enamel and overall mineralization level. The reference Raman measurements of dental mineral content were completed twice by means of a high-fidelity confocal Raman microscope and followed by a fiber-optic Raman set up which was configured as non-confocal and confocal arrangements, used to collect spectral information from similar and comparable enamel area investigated by a research-grade Raman microscope. The authors reported that this study used a different approach, for the first time, by which the non-confocal fiber-optic system has failed to identify significant differences in mineralization between the analyzed samples, while the combination of the in-line confocal module with the employed fiber optic system resulted successfully in determining even small discrepancies in mineral content between the tooth specimens. The provided results indicated clearly that confocal aperture modification for a remote Raman probe is essential for proper adjustment and a better control of the sampling volume of the examined enamel. Moreover, the authors reported that portable Raman systems integrated with hand-held confocal fiber probes for remote analysis are very promising for the screening and assessment of enamel content and degree of mineralization, providing elucidative results [84].
Another recent work, performed by Sa et al. in 2017 [85], monitored the mineral contents change of human enamel, in vitro, by means of a portable micro-Raman spectroscopic system coupled to fiber-optic probe (B&W Tek Inc., Plainsboro, NJ, USA), equipped with a NIR monochromatic laser source of 785 nm wavelength. The main purpose of this study was to examine the efficacy and efficiency of the Raman spectroscopy technique in detecting and identifying mineral content variations during several sequential demineralization and de/remineralization consecutive processes. The authors also used microhardness and chemical analysis to prove the accuracy of the micro-Raman spectroscopy, affirming that this technique could successfully monitor the human dental enamel surface mineral losses. It was concluded that due to the non-invasive, portable, and remote advantages, as well as low interference from the water, the Raman technique can be considered a very promising tool which could be certainly used as a reliable, accurate, precise, real-time, and quantitative technique for the detection of slight changes in enamel mineral content, in future clinic work [85].
The combination of Raman spectroscopy with portable and fiber-optics technology allows for remote, real-time examination, in situ analysis, ex vivo and in vivo investigation, and comparison of different samples, organic or inorganic, material, mixtures, compounds, or vital tissues, which can be situated in distant, isolated, hardly accessible, contaminated, or even dangerous environments, in a minimally invasive and non-destructive way. For such reasons, Raman fiber-optic probes have found numerous applications in several fields, from process control to medicine. Therefore, these can have different designs, varying dimensions, and distinct geometrical configurations—from standard to custom-made, modified and/or adapted according to the examined sample and surrounding environment, containing specific optical components, according to the specific application—industrial use, laboratorial measurements, or clinical examination. Additionally, the remote probe must contain the necessary filters and optical components, coupled to highly efficient input and output optical fibers, in order to excite, collect and transmit the Raman signal with high efficiency, with minimal signal losses, maximizing the SNR and yielding spectra with a high level of accuracy, allowing for sharp peaks obtention, with a highest possible spectral quality, spectral resolution, and band intensities (especially for the “fingerprints” bands of interest that are characteristic and specific to a certain compound, with unique biochemical composition, chemical bonds and structural arrangement).
Overall, Raman fiber-optic remote probes represent an ideal solution for the analysis of small or large, irregular, outer abnormal and/or awkwardly shaped surface samples, monitoring real-time kinetic reactions, in vivo sampling, and any other application where it is difficult or impossible to bring the investigated sample to the spectrometer. The recent development of flexible, simple, manageable, and user-friendly fiber-optic probes has made them one of the most widespread devices in modern spectroscopy [24].
8. Conclusions
All described studies that were conducted by different research groups, for the evaluation of surface enamel using Raman spectroscopy, which were mentioned in this article, reported that the Raman technique can be a valuable diagnostic method in enamel health assessment, providing relevant data for incipient caries or advanced lesions detection and evaluation of dental enamel de/remineralization. The displayed spectral changes are mainly attributed to demineralization-induced alterations of enamel crystallite morphology and/or orientation. This hypothesis is confirmed by increased depolarization ratio and decreased polarization anisotropy, provided by polarized Raman spectra of carious lesions. Accordingly, recorded spectra can be very useful in differentiating dental health enamel samples from affected (demineralized or carious cavitated) specimens, providing high spectroscopic resolution and a unique wavelength range capability that offers great flexibility and high performance. With the advent of suitable intraoral optical probes, a patient’s surface enamel can be analyzed qualitatively and quantitatively for early diagnostics.
Regarding tooth bleaching methods, these may lead to significant modifications in the morphology of the enamel (increased porosity, depressions, and potential erosions) by promoting reductions in enamel mineral content. Teeth whitening effects prove that over-bleaching results directly in the loss of phosphate groups from surface enamel. As the bleaching product is highly concentrated and with a very low pH, it is very probable that occurs a high mineral loss.
Enamel mineralization can be affected by different factors, such as alcohol consumption and high ingestion of dietary carbohydrates, with an overall mineral loss of the enamel, also originated by medications or dental pharmaceutical products that can directly affect surface enamel or indirectly lead to an increased demineralization. Incorporation of carbonate into enamel subsurface lesions with phosphate during remineralization does not affect the levels of remineralization or related acid resistance.
Demineralization changes in enamel can be reverted by the systematic application of remineralizing toothpaste, especially those containing calcium and phosphate. Bioactive glasses have a strong potential for enhancing enamel remineralization more effectively than other topical remineralizing materials, including fluoride or CPP-ACP. Crystals at the tooth enamel surface regularly go through natural periods of demineralization and remineralization, particularly surfaces covered by unobstructed stagnant films, such as dental plaque. The exposure of enamel surface (regardless of incipient or advanced lesions, superficial or deep cavitations) to remineralizing solutions or toothpaste results in a significant net increase in mineral as porous defects become remineralized.
Funding
This work has been financially supported by Fundação para a Ciência e Tecnologia. Iulian Otel acknowledges FCT for receiving a PhD grant PD/BDE/143107/2018.
Informed Consent Statement
Not applicable.
Data Availability Statement
Data is contained within the article.
Acknowledgments
This work has been financially supported by Fundação para a Ciência e Tecnologia—I.O. PhD grant PD/BDE/143107/2018. Acknowledgements are due to S. Pessanha and V. Vassilenko, from NOVA School of Science and Technology, for the general supervision, guidance, and systematic remarks and comments.
Conflicts of Interest
The author declares no conflict of interest.
References
- Tsuda, H.; Arends, J. Raman Spectroscopy in Dental Research: A Short Review of Recent Studies. ADR 1997, 11, 539. [Google Scholar] [CrossRef] [PubMed]
- Ramakrishnaiah, R.; Rehman, G.U. Applications of Raman Spectroscopy in Dentistry: Analysis of Tooth Structure. Appl. Spectrosc. Rev. 2015, 50, 332–350. [Google Scholar] [CrossRef]
- Buchwald, T.; Okulus, Z. Raman spectroscopy as a tool of early dental caries detection—New insights. J. Raman Spectrosc. 2017, 48, 1094–1102. [Google Scholar] [CrossRef]
- Akkus, A.; Akkus, O.; Roperto, R.; Lang, L. Investigation of Intra-and Inter-individual, Variations of Mineralisation in Healthy Permanent Human Enamel by Raman Spectroscopy. Oral Health Prev. Dent. 2016, 14, 321–327. [Google Scholar] [CrossRef]
- Leichter, I.; Margulies, J.Y. The relationship between bone density, mineral content, and mechanical strength in the femoral neck. Clin. Orthop. Relat. 1982, 163, 272–281. [Google Scholar] [CrossRef]
- Kodaka, T.; Debari, K. Correlation between microhardness and mineral content in sound human enamel (short communication). Caries 1992, 26, 139–141. [Google Scholar] [CrossRef]
- Bulatov, V.; Feller, L. Dental enamel caries (early) diagnosis and mapping by laser Raman spectral imaging. Instrum. Sci. Technol. 2008, 36, 235–244. [Google Scholar] [CrossRef]
- Shellis, R.P. Relationship between human enamel structure and the formation of caries-like lesions in vitro. Arch. Oral. Biol. 1984, 29, 975–981. [Google Scholar] [CrossRef]
- Targino, A.G.; Rosenblatt, A. The relationship of enamel defects and caries: A cohort Study. Oral Dis. 2011, 17, 420–426. [Google Scholar] [CrossRef]
- Loureiro, R.M.; Sumi, D.V. Cross-Sectional Imaging of Third Molar–Related Abnormalities. Am. J. Neuroradiol. 2020, 41, 1966–1974. [Google Scholar] [CrossRef]
- Ko, A.C.T.; Hewko, M. Early dental caries detection using a fibre-optic coupled polarization-resolved Raman spectroscopic system. Opt. Express 2008, 16, 6274–6284. [Google Scholar] [CrossRef] [PubMed]
- Bader, J. Diagnosis and Management of Dental Caries; AHRQ Publication No.01-E055; Agency for Healthcare Research and Quality: Rockville, MD, USA, 2001; Number 36.
- Ismail, A.I. Visual and Visuo-tactile detection of dental caries. J. Dent Res. 2004, 83, C56–C66. [Google Scholar] [CrossRef] [PubMed]
- Vandenabeele, P. Practical Raman Spectroscopy—An Introduction; John Wiley & Sons, Ltd.: New York, NY, USA, 2013; ISBN 978-0-470-68319-4. [Google Scholar]
- Vargas-Koudriavtsev, T.; Durán-Sedó, R. Effect of tooth-bleaching agents on phosphate concentration in dental enamel by means of Raman spectroscopy. Rev. Odontológica 2015, 19, 228–235. [Google Scholar] [CrossRef]
- Monteiro, M.; Chasqueira, F. Raman spectroscopy in the characterization of carious dental tissues. Spectrosc. Eur. 2018, 30, 11–14. [Google Scholar]
- Toporski, J.; Dieing, T. Raman Microscopy (Confocal). In Encyclopedia of Geobiology; Springer: Dordrecht, The Netherlands, 2011. [Google Scholar] [CrossRef]
- Horiba. Explore the Future. Available online: https://www.horiba.com/int/ (accessed on 22 October 2022).
- Renishaw. Raman Spectroscopy. Available online: https://www.renishaw.com/en/raman-spectroscopy--6150 (accessed on 22 October 2022).
- Ferraro, J.R.; Nakamoto, K. Introductory Raman Spectroscopy, 2nd ed.; Elsevier: Amsterdam, The Netherlands, 2003; ISBN 978-0-12-254105-6. [Google Scholar]
- Vo-Dinh, T. Biomedical Photonics Handbook; CRC Press: Boca Raton, FL, USA, 2003. [Google Scholar]
- Matousek, P.; Morris, M. Emerging Raman Applications and Techniques in Biomedical and Pharmaceutical Fields; Springer: Berlin/Heidelberg, Germany, 2010; ISBN 978-3-642-02648-5. [Google Scholar]
- Zhang, Y.; Ren, L. Raman Spectroscopy: A Potential Diagnostic Tool for Oral Diseases. Front. Cell. Infect. Microbiol. 2022, 12, 775236. [Google Scholar] [CrossRef] [PubMed]
- Eberhardt, E.; Stiebing, C. Advantages and limitations of Raman spectroscopy for molecular diagnostics: An update. Expert Rev. Mol. Diagn. 2015, 15, 773–787. [Google Scholar] [CrossRef]
- Tatarkovič, M.; Synytsya, A. The minimizing of fluorescence background in Raman optical activity and Raman spectra of human blood plasma. Anal. Bioanal. Chem. 2015, 407, 1335–1342. [Google Scholar] [CrossRef]
- Buchwald, T.; Buchwald, Z. The fluorescence background in Raman spectra of sound enamel. Vibrational Spectrosc. 2021, 115, 103275. [Google Scholar] [CrossRef]
- Toledano, M.; Osorio, E. Ex vivo detection and characterization of remineralized carious dentin, by nanoindentation and single point Raman spectroscopy, after amalgam restoration. J. Raman Spectrosc. 2017, 48, 384–392. [Google Scholar] [CrossRef]
- Ko, A.C.T.; Choo-Smith, L.P. Ex vivo detection and characterization of early dental caries by optical coherence tomography and Raman spectroscopy. J. Biomed. Opt. 2005, 10, 031118. [Google Scholar] [CrossRef]
- Ko, A.C.T.; Choo-Smith, L.P. Detection of early dental caries using polarized Raman spectroscopy. Optics Express 2006, 14, 203–215. [Google Scholar] [CrossRef] [PubMed]
- Datta, S. A Complete Review on Dental Carious Lesion Detection Methods and its Challenges. Acta Sci. Dent. Sci. 2019, 3, 74–81. [Google Scholar] [CrossRef]
- Melo, M.; Sanz, J.L. Current Status and Trends in Research on Caries Diagnosis: A Bibliometric Analysis. Int. J. Environ. Res. Public Health 2022, 19, 5011. [Google Scholar] [CrossRef] [PubMed]
- Zain, E.; Chew, H.P. Update on Clinical Detection Methods for Non-cavitated Fissure Caries. World J. Dent. 2020, 11, 81–88. [Google Scholar] [CrossRef]
- Mohanraj, M.; Prabhu, V.R.; Senthil, R. Diagnostic Methods for Early Detection of Dental Caries—A Review. Int. J. Pedod. Rehabil. 2016, 1, 29. [Google Scholar]
- Fraser, S.J.; Natarajan, A.K. A Raman spectroscopic study of teeth affected with molar–incisor hypo-mineralisation. J. Raman Spectrosc. 2015, 46, 202–210. [Google Scholar] [CrossRef]
- Ionita, I. Diagnosis of tooth decay using polarized micro-Raman confocal spectroscopy. Rom. Rep. Phys. 2009, 61, 567–574. [Google Scholar]
- Buchwald, T.; Okulus, Z. Determination of storage solutions influence on human enamel by Raman spectroscopy. Vib. Spectrosc. 2018, 96, 118–124. [Google Scholar] [CrossRef]
- Buchwald, T.; Buchwald, Z. Assessment of the Raman spectroscopy effectiveness in determining the early changes in human enamel caused by artificial caries. Analyst 2019, 144, 1409–1419. [Google Scholar] [CrossRef]
- Kinoshita, H.; Miyoshi, N. Functional mapping of carious enamel in human teeth with Raman micro-spectroscopy. Raman Spectrosc. 2008, 39, 655–660. [Google Scholar] [CrossRef]
- Mihaly, J.; Gombas, V. FT-Raman investigation of human dental enamel surfaces. Raman Spectrosc. 2009, 40, 898–902. [Google Scholar] [CrossRef]
- Wang, P.; Anderson, E.J.D. Hyper- spectral Raman imaging correlating chemical substitution and crystallinity in biogenic hydroxyapatite: Dentin and enamel in normal and hypoplastic human teeth. J. Raman Spectrosc. 2018, 49, 1559–1567. [Google Scholar] [CrossRef]
- Prikule, D.V.; Kukushkin, V.I. Studying the Degree of Tooth Enamel Mineralization through Raman Spectroscopy in Various Spectral Ranges. Biophysica 2021, 1, 269–278. [Google Scholar] [CrossRef]
- Castro, J.; Godinho, J. Study of the effects of unsupervised over-the counter whitening products on dental enamel using μ-Raman and μ-EDXRF spectroscopies. J. Raman Spectrosc. 2015, 47, 444–448. [Google Scholar] [CrossRef]
- Silveira, J.; Longelin, S. Identification of oxygen in dental enamel following tooth bleaching using confocal micro Raman spectroscopy. J. Raman Spectrosc. 2012, 43, 1089–1093. [Google Scholar] [CrossRef]
- Godinho, J.; Silveira, J.A. Effect of bleaching gel in Ca, P and Zn content in tooth enamel evaluated by μ-EDXRF. Nucl. Instrum. Methods Phys. Res. B 2014, 337, 78–82. [Google Scholar] [CrossRef]
- Silveira, J.; Godinho, J. Assessment of teeth elemental content using μ-EDXRF: Effects by in-office and at-home bleaching products. X-ray Spectrom. 2015, 44, 3–6. [Google Scholar] [CrossRef]
- Carey, C.M. University of Colorado, School of Dental Medicine. Tooth Whitening: What We Now Know. J. Evid. Based Dent. Pract. 2014, 14, 70–76. [Google Scholar] [CrossRef]
- Taher, N.M. The Effect of Bleaching Agents on the Surface Hardness of Tooth Colored Restorative Materials. J. Contemp. Dent. Pract. 2005, 6, 18–26. [Google Scholar] [CrossRef]
- Barghi, N. Making a clinical decision for vital tooth bleaching: At-home or in-office? Compend. Contin. Educ. Dent. 1998, 19, 831–838. [Google Scholar]
- Gerlach, R.W. Shifting paradigms in whitening: Intoduction of a novel system for vital tooth bleaching. Compend. Contin. Educ. Dent. 2000, 21, S4–S9. [Google Scholar]
- Dahl, J.E. Tooth bleaching—A critical review of the biological aspects. Crit. Rev. Oral. Biol. Med. 2003, 14, 292–304. [Google Scholar] [CrossRef]
- Santini, A.; Pulham, C.R. The effect of a 10% carbamide peroxide bleaching agent on the phosphate concentration of tooth enamel assessed by Raman spectroscopy. Dent. Traumatol. 2008, 24, 220–223. [Google Scholar] [CrossRef] [PubMed]
- Vargas-Koudriavtsev, T.; Durán-Sedó, R. Titanium dioxide in dental enamel as a trace element and its variation with bleaching. J. Clin. Exp. Dent. 2018, 10, 537–541. [Google Scholar] [CrossRef] [PubMed]
- Silveira, J.; Coutinho, S. Raman spectroscopy analysis of dental enamel treated with whitening product—Influence of saliva in the remineralization. Spectrochim. Acta Part A Mol. Biomol. Spectrosc. 2018, 198, 145–149. [Google Scholar] [CrossRef]
- Bittencourt, B.F.; Dominguez, J.A. Influence of Two Different Methods of Delivering Fluoride on Bond Strength and Degree of Conversion of an Adhesive After Bleaching. J. Adhes. Dent. 2013, 15, 553–559. [Google Scholar] [CrossRef]
- Pessanha, S.; Silva, S. Evaluation of the effect of fluorinated tooth bleaching products using polarized Raman microscopy and particle induced gamma-ray emission. Spectrochim. Acta Part A 2020, 236, 118378. [Google Scholar] [CrossRef]
- Sant’Anna, G.R.; Nascimento, E.B. FT Raman spectroscopy in the study of human teeth under medications demineralization, Biophotonics South America. Proc. SPIE 2015, 9531, 427–440. [Google Scholar] [CrossRef]
- Kenny, D.J.; Somaya, P. Sugar load of oral liquid medications on chronically ill children. J. Can. Dent. Assoc. 1989, 55, 43–46. [Google Scholar]
- Linnett, V.; Seow, W.K. Dental erosion in children: A literature review. Pediatr. Dent. 2001, 23, 37–43. [Google Scholar]
- Kuramochi, E.; Iizuka, J. Influences of bicarbonate on processes of enamel subsurface remineralization and demineralization: Assessment using micro-Raman spectroscopy and transverse microradiography. Eur. J. Oral Sci. 2016, 124, 554–558. [Google Scholar] [CrossRef] [PubMed]
- Santini, A.; Miletic, V. Degree of conversion of three fissure sealants cured by different light curing units using micro-Raman spectroscopy. J. Dental Sci. 2012, 7, 26–32. [Google Scholar] [CrossRef]
- Luís, G.; Silva, H. Evaluation of enamel demineralization and fluorine uptake caused by gustatory stimulants of salivary secretion (GSSS) using Raman spectroscopy and proton induced gamma-ray emission (PIGE). J. Raman Spectrosc. 2018, 50, 380–386. [Google Scholar] [CrossRef]
- Grippo, J.O.; Simring, M. Attrition, abrasion, corrosion and abfraction revisited: A new perspective on tooth surface lesions. J. Am. Dental. Assoc. 2004, 135, 1109–1118. [Google Scholar] [CrossRef] [PubMed]
- Wongkhantee, S.; Patanapiradej, V. Effect of acidic food and drinks on surface hardness of enamel, dentine, and tooth-coloured filling materials. J. Dent. 2006, 34, 214–220. [Google Scholar] [CrossRef] [PubMed]
- Tramini, P.; Pélissier, B. A Raman Spectroscopic Investigation of Dentin and Enamel Structures Modified by Lactic Acid. Caries Res. 2000, 34, 233–240. [Google Scholar] [CrossRef]
- Braga, S.; Faria, D. Morphological and mineral analysis of dental enamel after erosive challenge in gastric juice and orange juice. Microsc. Res. Tech. 2011, 74, 1083–1087. [Google Scholar] [CrossRef]
- Zheng, J.; Xiao, F. Erosion behaviour of human tooth enamel in citric acid solution. Tribol. Int. 2009, 42, 1558–1564. [Google Scholar] [CrossRef]
- Pezzotti, G.; Adachi, T. Vibrational monitor of early demineralization in tooth enamel after in vitro exposure to phosphoridic liquid. Spectrochim. Acta Part A Mol. Biomol. Spectrosc. 2017, 173, 19–33. [Google Scholar] [CrossRef]
- Gwinnett, A.J. A study of enamel adhesives. The physical relationship between enamel and adhesive. Arch. Oral Biol. 1967, 12, 1615–1620. [Google Scholar] [CrossRef]
- Carpena Lopes, G.; Greenhalgh Thys, D. Enamel acid etching: A review. Compend. Contin. Educ. Dent. 2007, 28, 662–669. [Google Scholar]
- Cândido, M.; Silveira, J.M. In-vitro study of the demineralization induced in human enamel by an acidic beverage using X-ray fluorescence spectroscopy and Raman microscopy. X-Ray Spectrom. 2018, 48, 61–69. [Google Scholar] [CrossRef]
- Thylstrup, A.; Fejerskov, O. Textbook of Cariology; Munksgaard: Copenhagen, Denmark, 1986. [Google Scholar]
- Cochrane, N.J.; Cai, F. New approaches to enhanced remineralization of tooth enamel. J. Dent. Res. 2010, 89, 1187–1197. [Google Scholar] [CrossRef]
- Hicks, J.; Garcia-Godoy, F. Biological factors in dental caries: Role of remineralization and fluoride in the dynamic process of demineralization and remineralization (part 3). J. Clin. Pediatr. Dent. 2004, 28, 203–214. [Google Scholar] [CrossRef] [PubMed]
- Oshiro, M.; Yamaguchi, K. Effect of CPP-ACP paste on tooth mineralization: An FE-SEM study. J. Oral. Sci. 2007, 49, 115–120. [Google Scholar] [CrossRef]
- Azarpazhooh, A.; Limeback, H. Clinical efficacy of case inderivatives: A systematic review of the literature. J. Am. Dent. Assoc. 2008, 139, 915–924. [Google Scholar] [CrossRef] [PubMed]
- Sargod Sharan, S.; Bhat Sham, S. Remineralization microscopic study. Indian J. Appl. Res. 2015, 5, 421–423. [Google Scholar]
- Thabitha Rani, S.; Manjula, M. Evaluation of remineralizing potential of Calcium Sucrose Phosphate and CPP-ACP: An in vitro study. Pediatr. Dent. J. 2016, 26, 95–102. [Google Scholar] [CrossRef]
- Kerr, J.E.; Arndt, G.D. FT-Raman Spectroscopy Study of the Remineralization of Microwave-Exposed Artificial Caries. J. Dent. Res. 2015, 95, 342–348. [Google Scholar] [CrossRef] [PubMed]
- Job, T.V.; Narayana, G.T. Remineralization Potential of Three Different Dentifrices using Raman Spectroscopy and Confocal Laser Scanning Microscope. J. Contemp. Dent. Pract. 2018, 19, 420–425. [Google Scholar] [CrossRef] [PubMed]
- Milly, H.; Festy, F. Enamel white spot lesions can remineralize using bio-active glass and polyacrylic acid-modified bio-active glass powders. J. Dent. 2014, 42, 158–166. [Google Scholar] [CrossRef]
- Parker, A.S.; Patel, A.N. Measurement of the efficacy of calcium silicate for the protection and repair of dental enamel. J. Dent. 2014, 42, s21–s29. [Google Scholar] [CrossRef] [PubMed]
- Otel, I.; Dias, K. Investigation of the protective suitability of a dental fluorinated varnish by means of X Ray fluorescence and Raman spectroscopy. J. Trace Elem. Med. Biol. 2022, 71, 126938. [Google Scholar] [CrossRef] [PubMed]
- Takahiro, I.; Moriaki, W. Application of laser Raman spectroscopy to dental diagnosis. In Proceedings of the SPIE BiOS, 2005, San Jose, CA, USA, 22–27 January 2005; Volume 5687, pp. 1–8. [Google Scholar] [CrossRef]
- Akkus, A.; Yang, S. A portable confocal fiber optic Raman spectrometer concept for evaluation of mineral content within enamel tissue. J. Oper. Esthet. Dent. 2016, 1, 1–5. [Google Scholar] [CrossRef]
- Sa, Y.; Feng, X. Evaluation of the effectiveness of micro-Raman spectroscopy in monitoring the mineral contents change of human enamel in vitro. Lasers Med. Sci. 2017, 32, 985–991. [Google Scholar] [CrossRef] [PubMed]
Figure 1.
Cross-sectional anatomic view of the tooth obtained by means of computed tomography (CT) technique (adapted from [10]).
Figure 1.
Cross-sectional anatomic view of the tooth obtained by means of computed tomography (CT) technique (adapted from [10]).

Figure 2.
Energy level diagram for Raman scattering: (a) Rayleigh, (b) Stokes, and (c) anti-Stokes scattering.
Figure 2.
Energy level diagram for Raman scattering: (a) Rayleigh, (b) Stokes, and (c) anti-Stokes scattering.

Figure 3.
Comparison of two Raman spectra obtained from sound enamel with parallel and cross polarizations, before applying a baseline subtraction (correction algorithm) [82].
Figure 3.
Comparison of two Raman spectra obtained from sound enamel with parallel and cross polarizations, before applying a baseline subtraction (correction algorithm) [82].

Figure 4.
Raman equipment used for the in vivo examination [83].
Figure 4.
Raman equipment used for the in vivo examination [83].


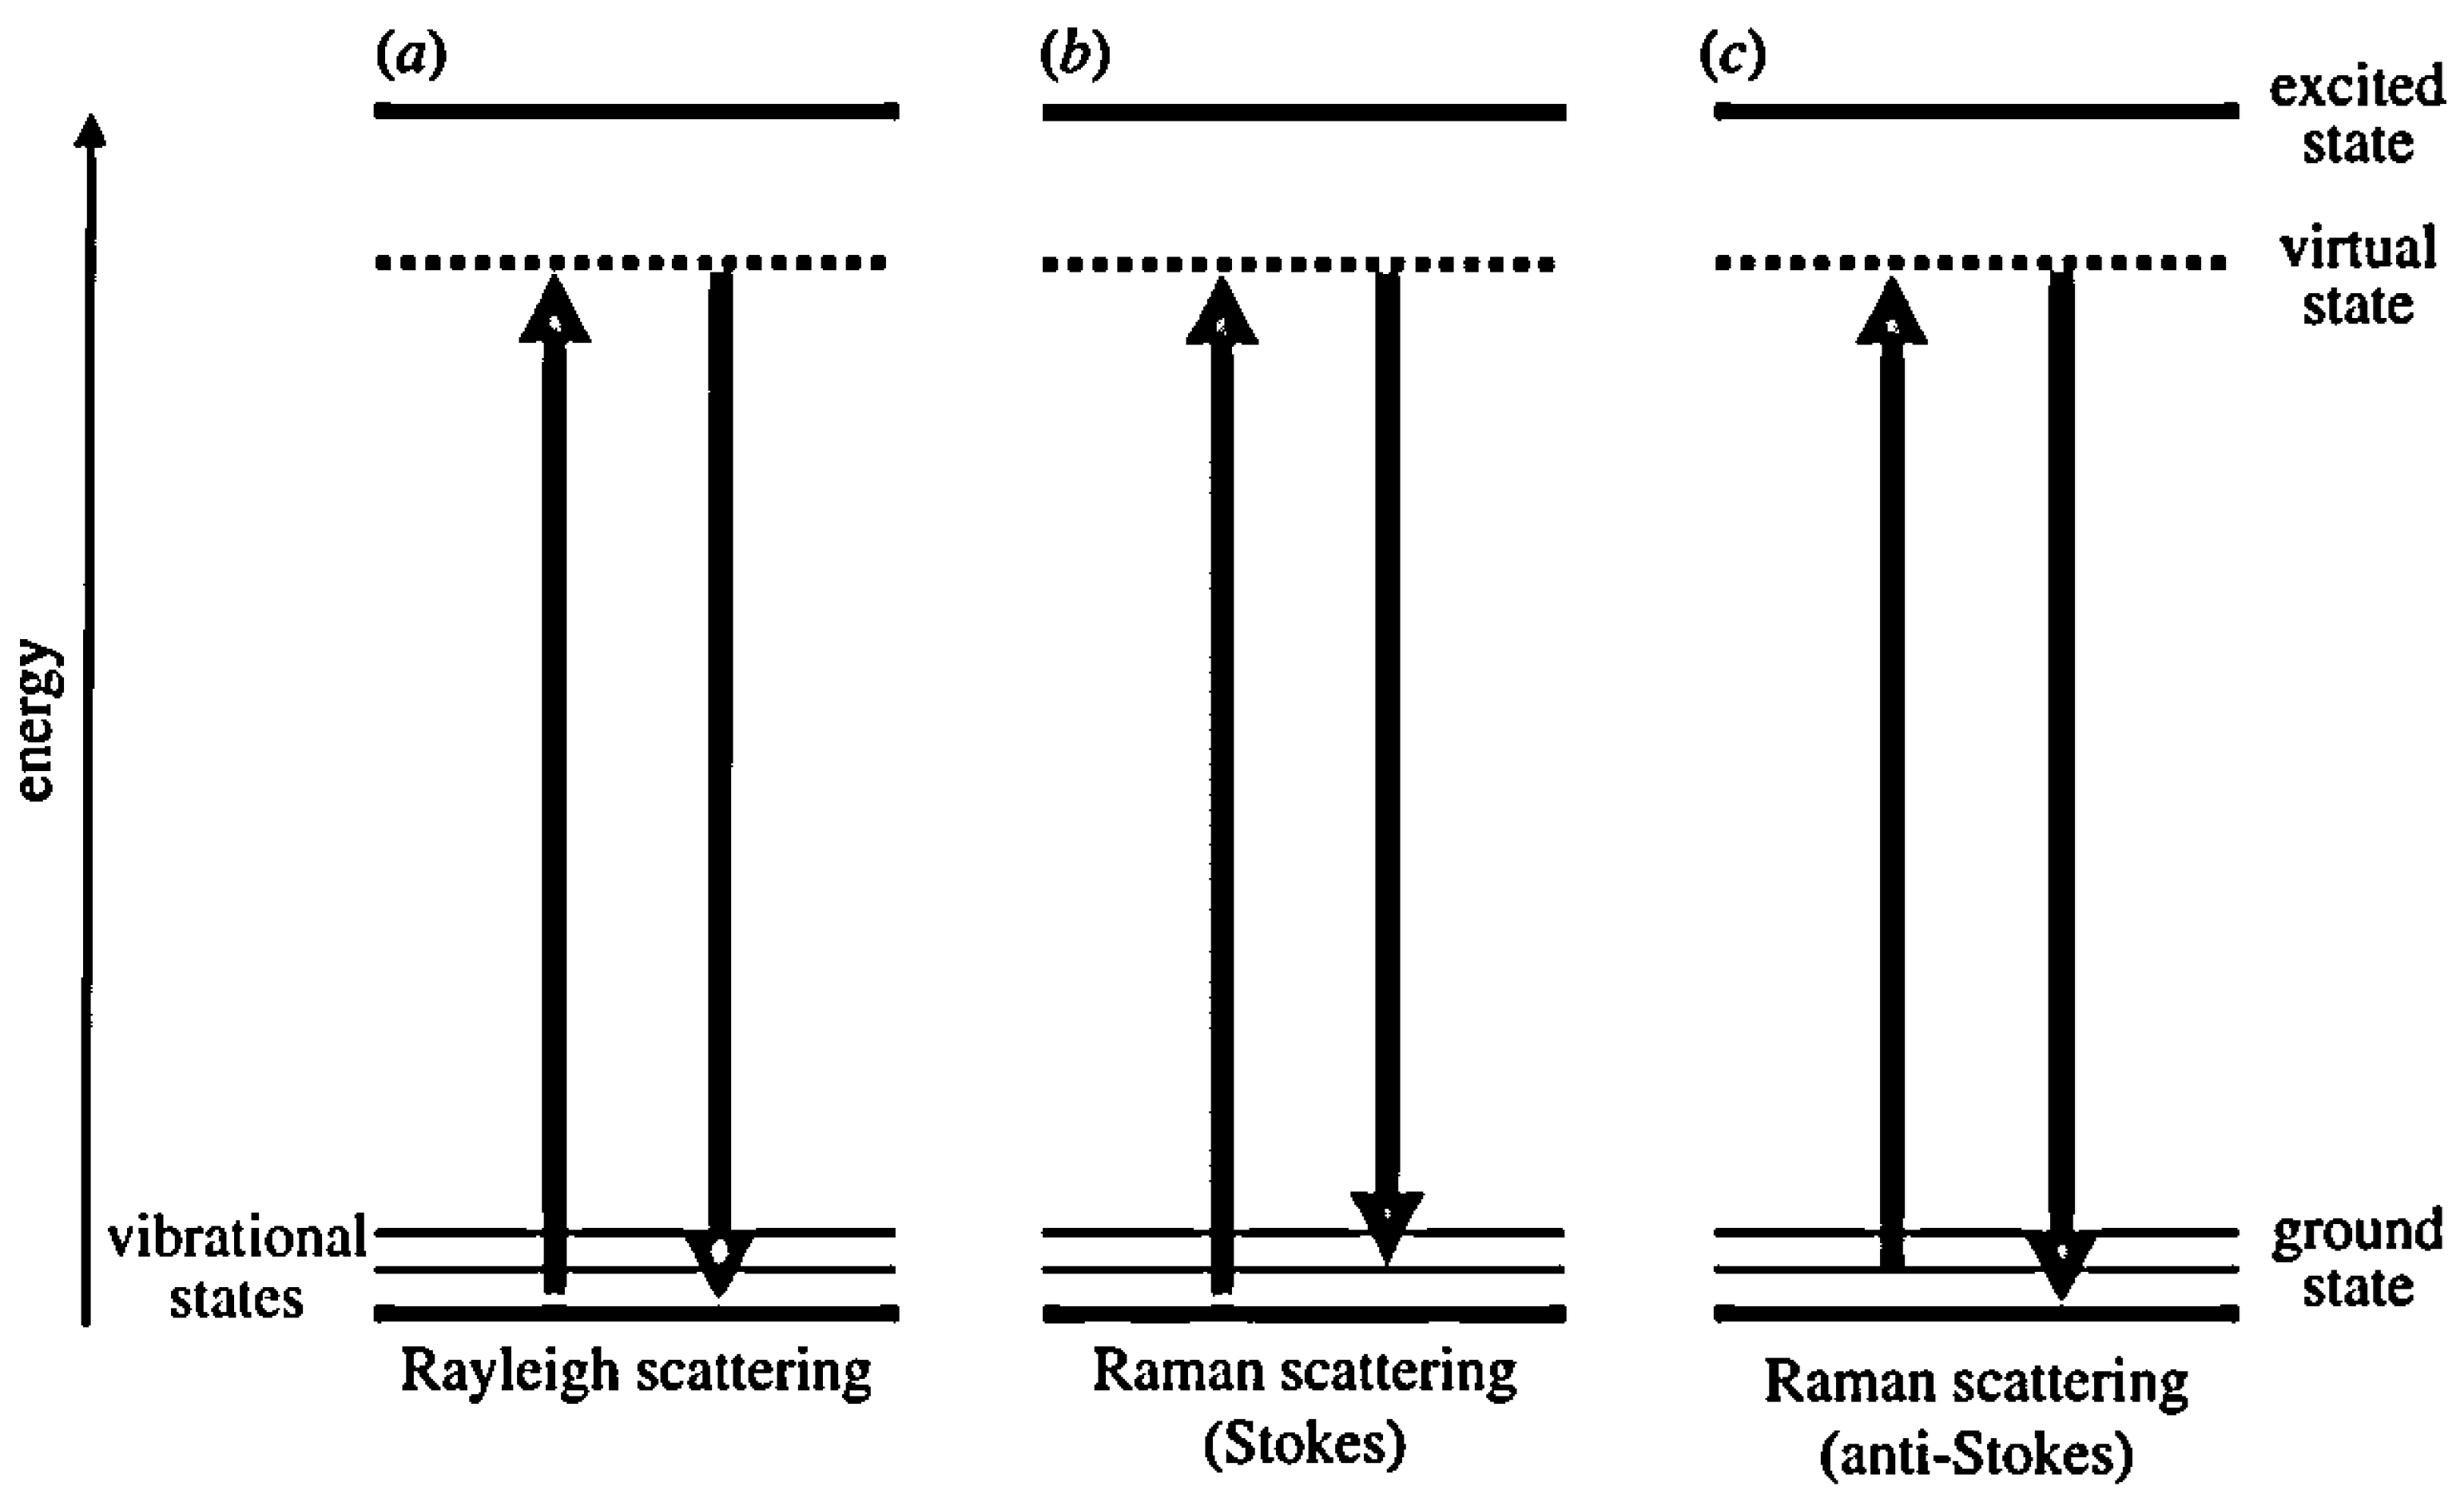
Table 1.
Advantages/disadvantages of Raman technique for molecular diagnostics [24].
Table 1.
Advantages/disadvantages of Raman technique for molecular diagnostics [24].
| Advantages | Limitations and Drawbacks |
|---|---|
|
|
|
|
|
|
|
|
|
|
|
|
|
|
|
|
|
|
|
Table 2.
Most relevant vibrational modes found to be affected by caries [7].
Table 2.
Most relevant vibrational modes found to be affected by caries [7].
| Functional Group Vibrations | Raman Band Wavenumbers |
|---|---|
| O-P-O bending modes | 430 and 590 cm−1 |
| PO symmetric stretching—most significant | ~960 cm−1 |
| CO symmetric stretching bands (B-type, A-type) | 1070, 1107 cm−1 |
| C-H stretching bands (associated with organic matter) | 1450, 2700–2880 cm−1 |
| PO of carbonated apatite | 3513 and 3573 cm−1 |
Disclaimer/Publisher’s Note: The statements, opinions and data contained in all publications are solely those of the individual author(s) and contributor(s) and not of MDPI and/or the editor(s). MDPI and/or the editor(s) disclaim responsibility for any injury to people or property resulting from any ideas, methods, instructions or products referred to in the content. |
© 2023 by the author. Licensee MDPI, Basel, Switzerland. This article is an open access article distributed under the terms and conditions of the Creative Commons Attribution (CC BY) license (https://creativecommons.org/licenses/by/4.0/).
Share and Cite
MDPI and ACS Style
Otel, I. Overall Review on Recent Applications of Raman Spectroscopy Technique in Dentistry. Quantum Beam Sci. 2023, 7, 5. https://doi.org/10.3390/qubs7010005
AMA Style
Otel I. Overall Review on Recent Applications of Raman Spectroscopy Technique in Dentistry. Quantum Beam Science. 2023; 7(1):5. https://doi.org/10.3390/qubs7010005
Chicago/Turabian StyleOtel, Iulian. 2023. "Overall Review on Recent Applications of Raman Spectroscopy Technique in Dentistry" Quantum Beam Science 7, no. 1: 5. https://doi.org/10.3390/qubs7010005