Article

Microscopic Depictions of Vanishing Shampoo Foam Examined by Time-of-Flight Small-Angle Neutron Scattering

1
Institute of Quantum Beam Science, Ibaraki University, 162-1 Shirakata, Tokaimura, Ibaraki 319-1106, Japan
2
Department of Chemistry, Faculty of Science, Nara Women’s University, Kitauoyanishi-machi, Nara 630-8506, Japan
3
NOF Corporation, Yebisu Garden Place Tower, 20-3 Ebisu 4-Chome, Shibuya-ku, Tokyo 150-6019, Japan
4
Kracie Home Products, Ltd., 134, Goudo-cho, Hodogaya-ku, Yokohama 240-0005, Japan
*
Author to whom correspondence should be addressed.
Quantum Beam Sci. 2023, 7(1), 4; https://doi.org/10.3390/qubs7010004
Submission received: 23 May 2022 / Revised: 18 January 2023 / Accepted: 18 January 2023 / Published: 29 January 2023
(This article belongs to the Special Issue New Trends in Neutron Instrumentation, 2nd Edition)

Abstract

:
A novel surfactant of N–dodecanoyl–N–(2-hydroxyethyl)–β–alanine (coded as C12–EtOH–βAla) was synthesized by modifying the methyl group of N–dodecanoyl–N–methyl–β–alanine (coded as C12–Me–βAla). Amino-acid-type surfactants (C12–EtOH–βAla and C12–Me–βAla) are more healthy and environmentally friendly compared to sodium dodecyl sulfate (SDS). To investigate the microstructures of these new surfactants, we employed a method of time-of-flight small-angle neutron scattering (TOF SANS) at a pulsed neutron source, Tokai Japan (J–PARC). The advances in TOF SANS enable simultaneous multiscale observations without changing the detector positions, which is usually necessary for SANS at the reactor or small-angle X-ray scattering. We performed in situ and real-time observations of microstructures of collapsing shampoo foam covering over a wide range of length scales from 100 to 0.1 nm. After starting an air pump, we obtained time-resolved SANS from smaller wave number, small-angle scattering attributed to (1) a single bimolecular layer with a disk shape, (2) micelles in a bimolecular layer, and (3) incoherent scattering due to the hydrogen atoms of surfactants. The micelle in the foam film was the same size as the micelle found in the solution before foaming. The film thickness (~27 nm) was stable for a long time (<3600 s), and we simultaneously found a Newton black film of 6 nm thickness at a long time limit (~1000 s). The incoherent scattering obtained with different contrasts using protonated and deuterated water was crucial to determining the water content in the foam film, which was about 10~5 wt%.

1. Introduction

Foams, considered a soft matter science [1,2], are frequently found in our daily life and industrial applications, such as drinks (beer [3] and champagne [4,5,6,7]), detergents [8], and cosmetics [9,10]. A biosurfactant, composed of proteins, was also reported [11]. In this paper, we investigated the microstructures of vanishing foams prepared from shampoo surfactants. Commercial shampoo solutions are multicomponent systems composed of anionic and/or amphoteric surfactants, conditioning agents (cationic polymer and silicon oil), a thickener agent, a pearling agent, and a preservative agent. When we use a shampoo for washing hair, its concentration varies from 400 mmol/dm3 to 20 mmol/dm3. Its physical performance can be characterized by “foamability”, “stability”, and “fineness”, which are tightly related to the microstructures, e.g., the molecular packing at the air interface and the water content in the film. In this paper, we aim to provide the structural parameters determined by a scattering method in reciprocal space and link these with the macroscopic observations detected in real space. Sodium dodecyl sulfate (SDS) [7,8] is a standard surfactant for shampoo that has a hydrophobic tail composed of 11 carbons. A novel surfactant of N–dodecanoyl–N–(2-hydroxyethyl)–β–alanine (coded as C12–EtOH–βAla) was recently synthesized by modifying the methyl group of N–dodecanoyl–N-methyl–β-alanine (coded as C12–Me–βAla) [12]. Amino-acid-type surfactants (C12–EtOH–βAla and C12–Me–βAla) are more healthy and environmentally friendly compared to sodium dodecyl sulfate (SDS). We compare three surfactants, SDS, C12–EtOH–βAla, and C12–Me–βAla, in this paper.
Figure 1 shows a schematic view of a foam film on a molecular level drawn by considering the picture by Dr. Takaya Sakai (Kao Corporation, Japan) [13]. In a bilayer film, the surfactants are allocated to the air surface. A hydrophobic tail faces to air side, whereas a hydrophilic group is attached on the water side. Because of a disjoining pressure [1,2], the film thickness (d) is maintained. The triplet junction, the plateau boarder, connects individual foam films. Laplace pressure [1,2] causes a flow of water to the junction. Simultaneously, gravity causes falling films, drainage of water, and foliation of films. The Gipps–Marangoni effect [1,2] resists film breakage. Interestingly, micelles with spaces between them (L), are depicted in water sandwiched between surfactant layers. These microscopic depictions give an understanding of the physical performances when using shampoo.
Small-angle scattering was frequently utilized in order to investigate the formation of film on a molecular level. The pioneering works using small-angle neutron scattering (SANS) and synchrotron radiation were conducted by a French group for SDS solutions, including normal foams [14] and an oriented single foam film using reflection geometry [15,16] or including protein mixtures [17,18]. More developments after these were described in [19,20,21,22].
To chase the evolution of collapsing forms, we employed an advanced TOF SANS method with high-intensity pulsed neutrons [23]. With a wide range of wavelengths (λ) from 1 to 10 A and a scattering angle (2θ) covered by a large number of tube detectors surrounding the sample position, we could simultaneously scan an amplitude of a scattering vector (or wave number) q from 4 to 0.007 A−1. Using this tool, we investigated the foams at microscopic molecular levels. Time-resolved SANS was achieved with a time interval of 1 min, covering a q-region from 0.007 to 4 A−1. The scattering experiments were reinforced with a conventional method of foam height analysis using a commercial apparatus, i.e., a dynamic foam analyzer. Based on the tentative report shown in [24], this paper was devoted to the methodology of TOF SANS using pulsed neutrons and intensively examined the time-resolved SANS obtained for the three surfactants: (i) the amino–acid–type surfactant molecule N–dodecanoyl–N–(2–hydroxyethyl)–β–alanine (C12βAla–C2OH; C12, βAla, and C2OH represent the dodecyl chain, β-alanine, and hydroxyethyl group); (ii) a surfactant without a hydroxy group, N–dodecanoyl–N-methyl–β–alanine (C12Me–βAla); and (iii) as a control, SDS (sodium dodecyl sulfate). We focused on the concentration of 100 mmol/dm3, which is typical for washing. As a result of these investigations, we determined the structural parameters in Figure 1, such as the film thickness (d), the sizes of the micelles in the foam (L), the specific interface of the films (S/VS, where Vs is the total foam volume), and the water volume fraction (ψs) as a function of elapsed time (t). We aimed to perform model-free analyses of SANS and extract key structural parameters describing a foam, which will profit researchers who are unfamiliar with small-angle scattering, especially from the chemistry and/or industry fields.

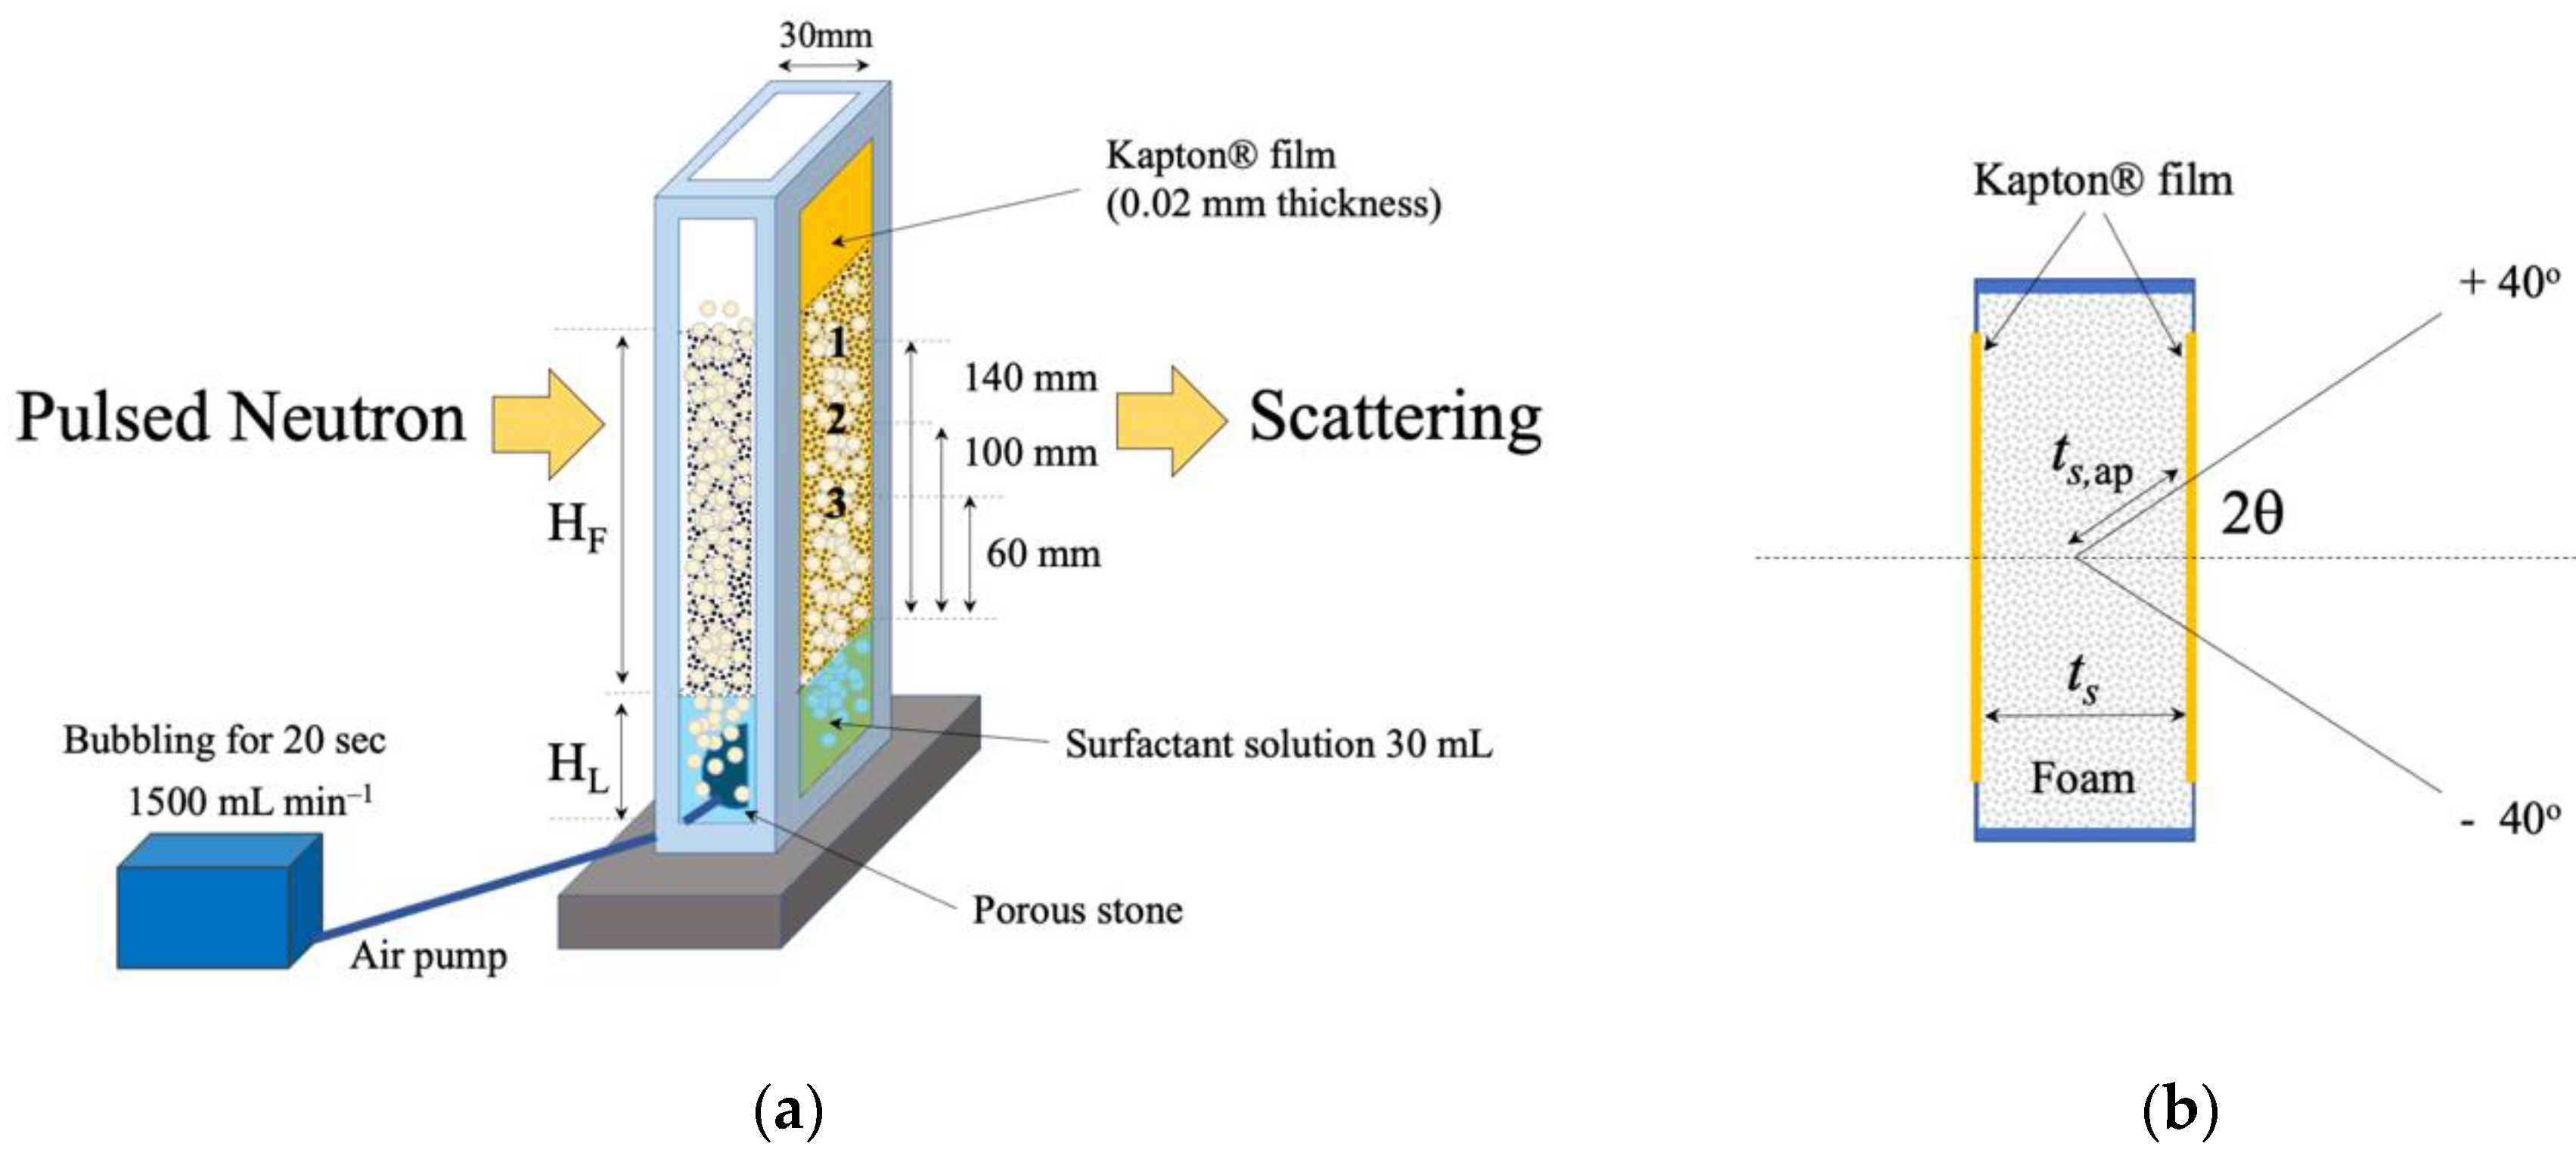
2. Experimental Section

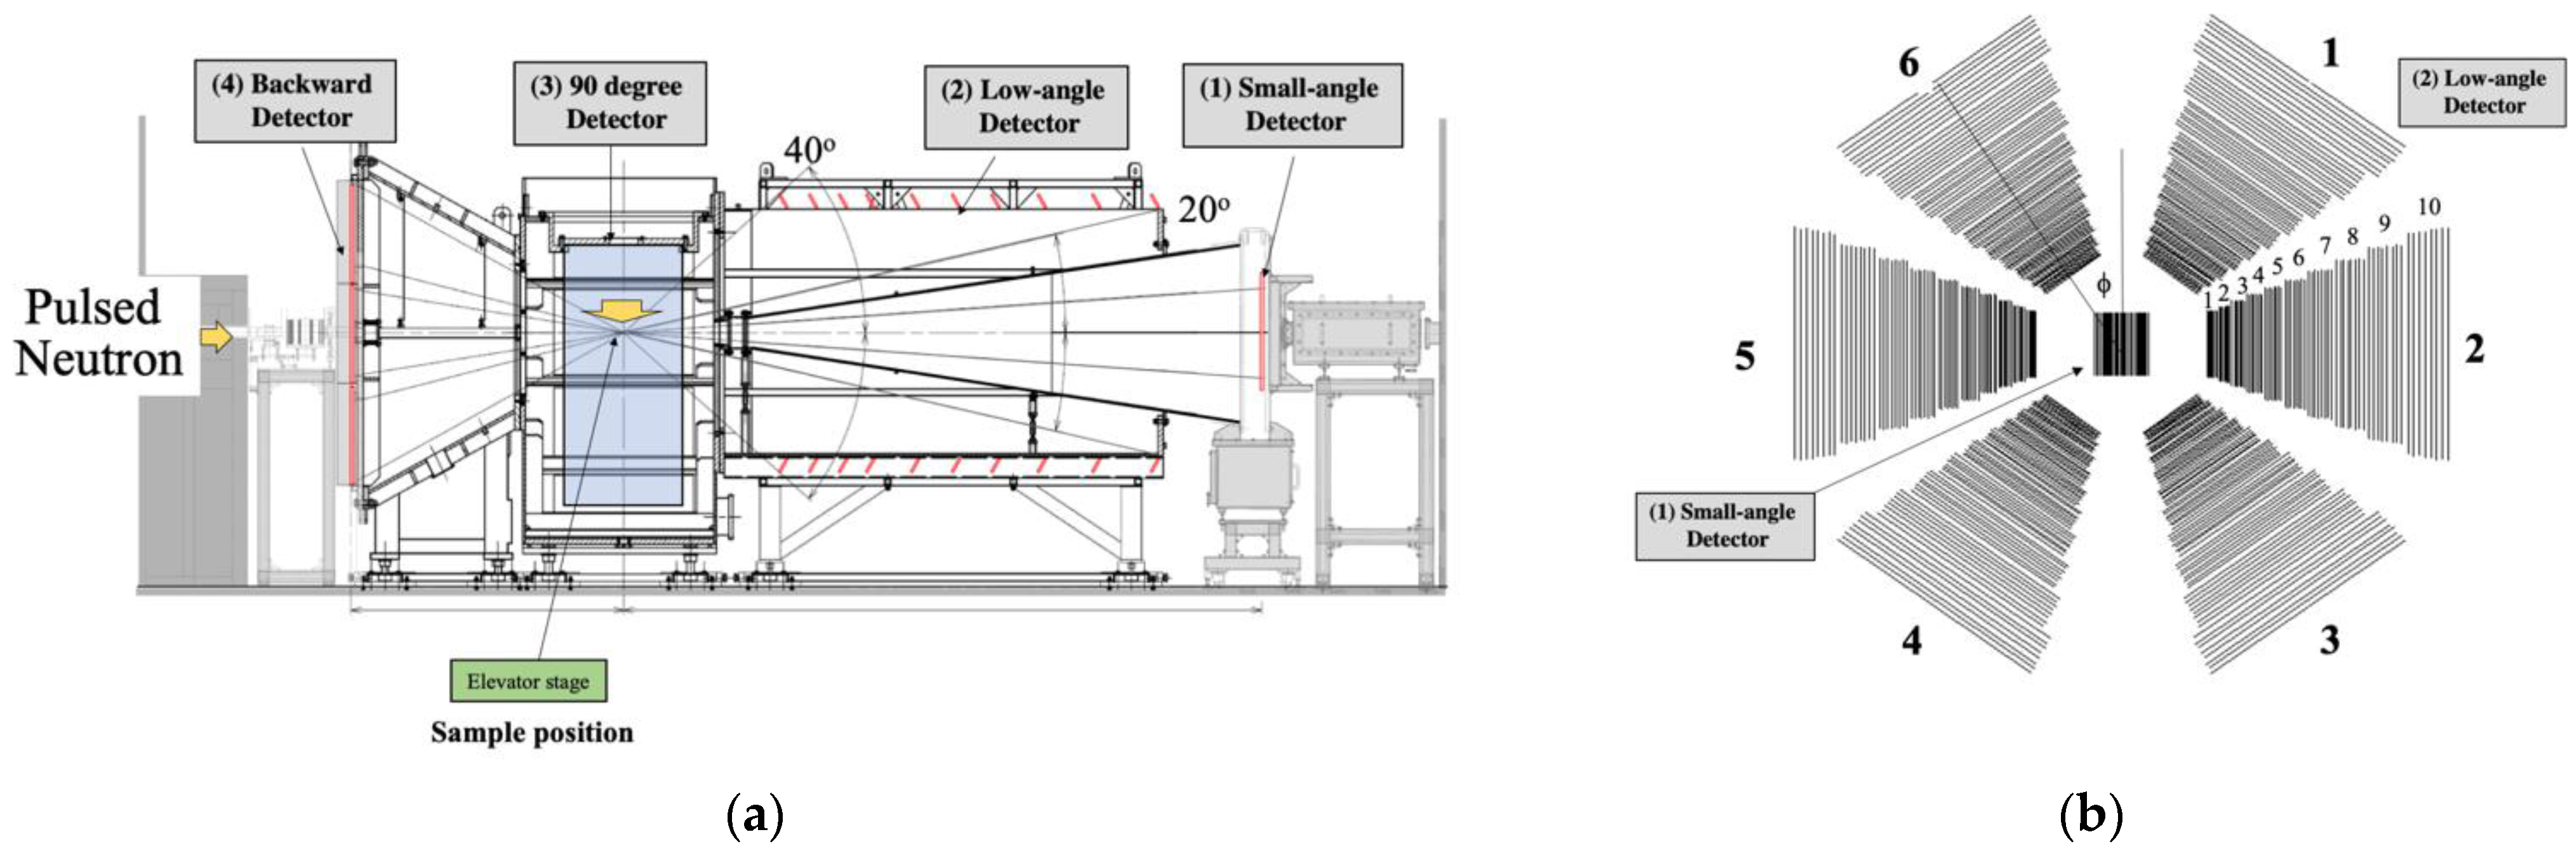
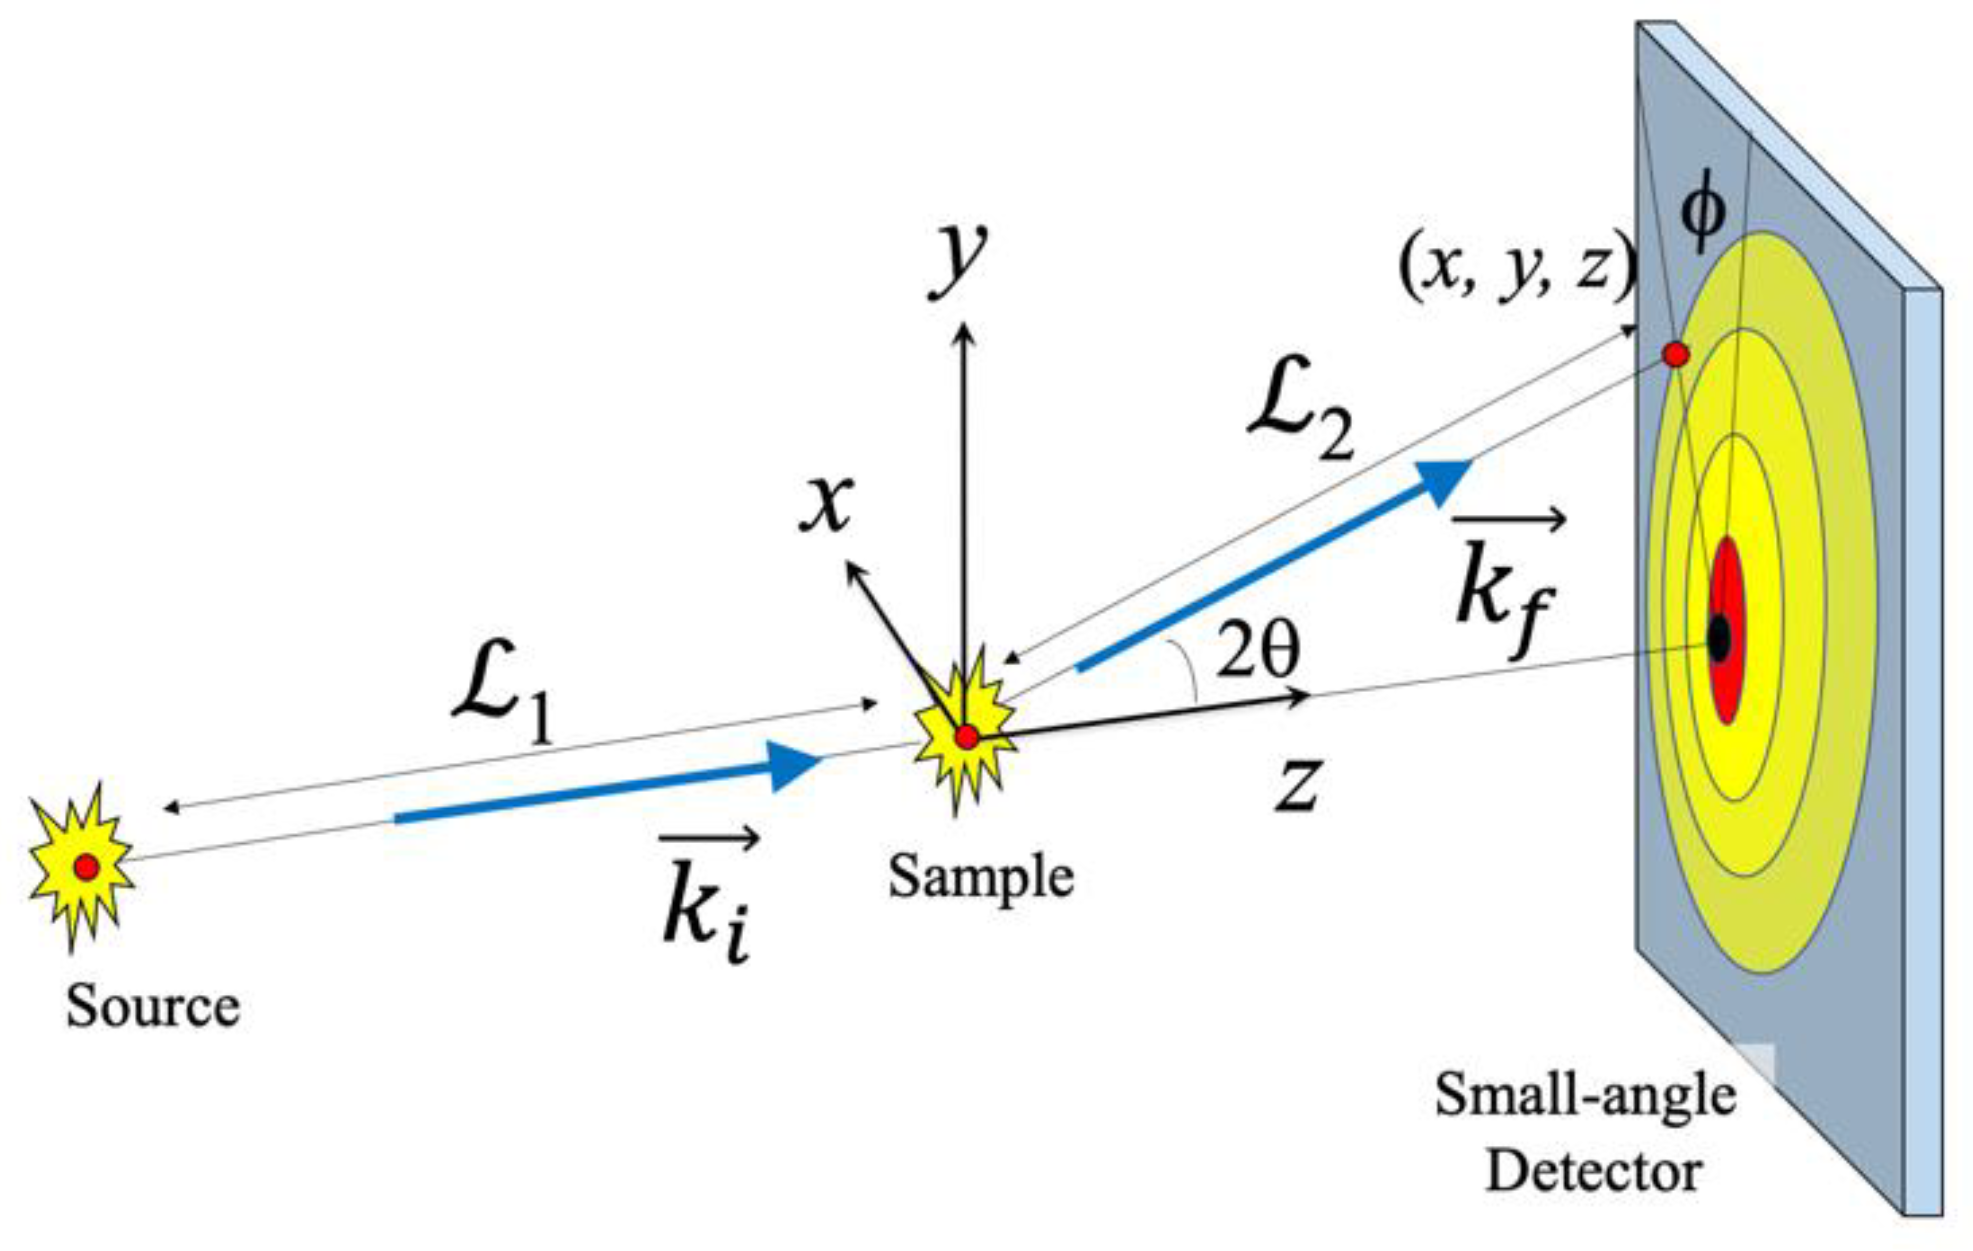
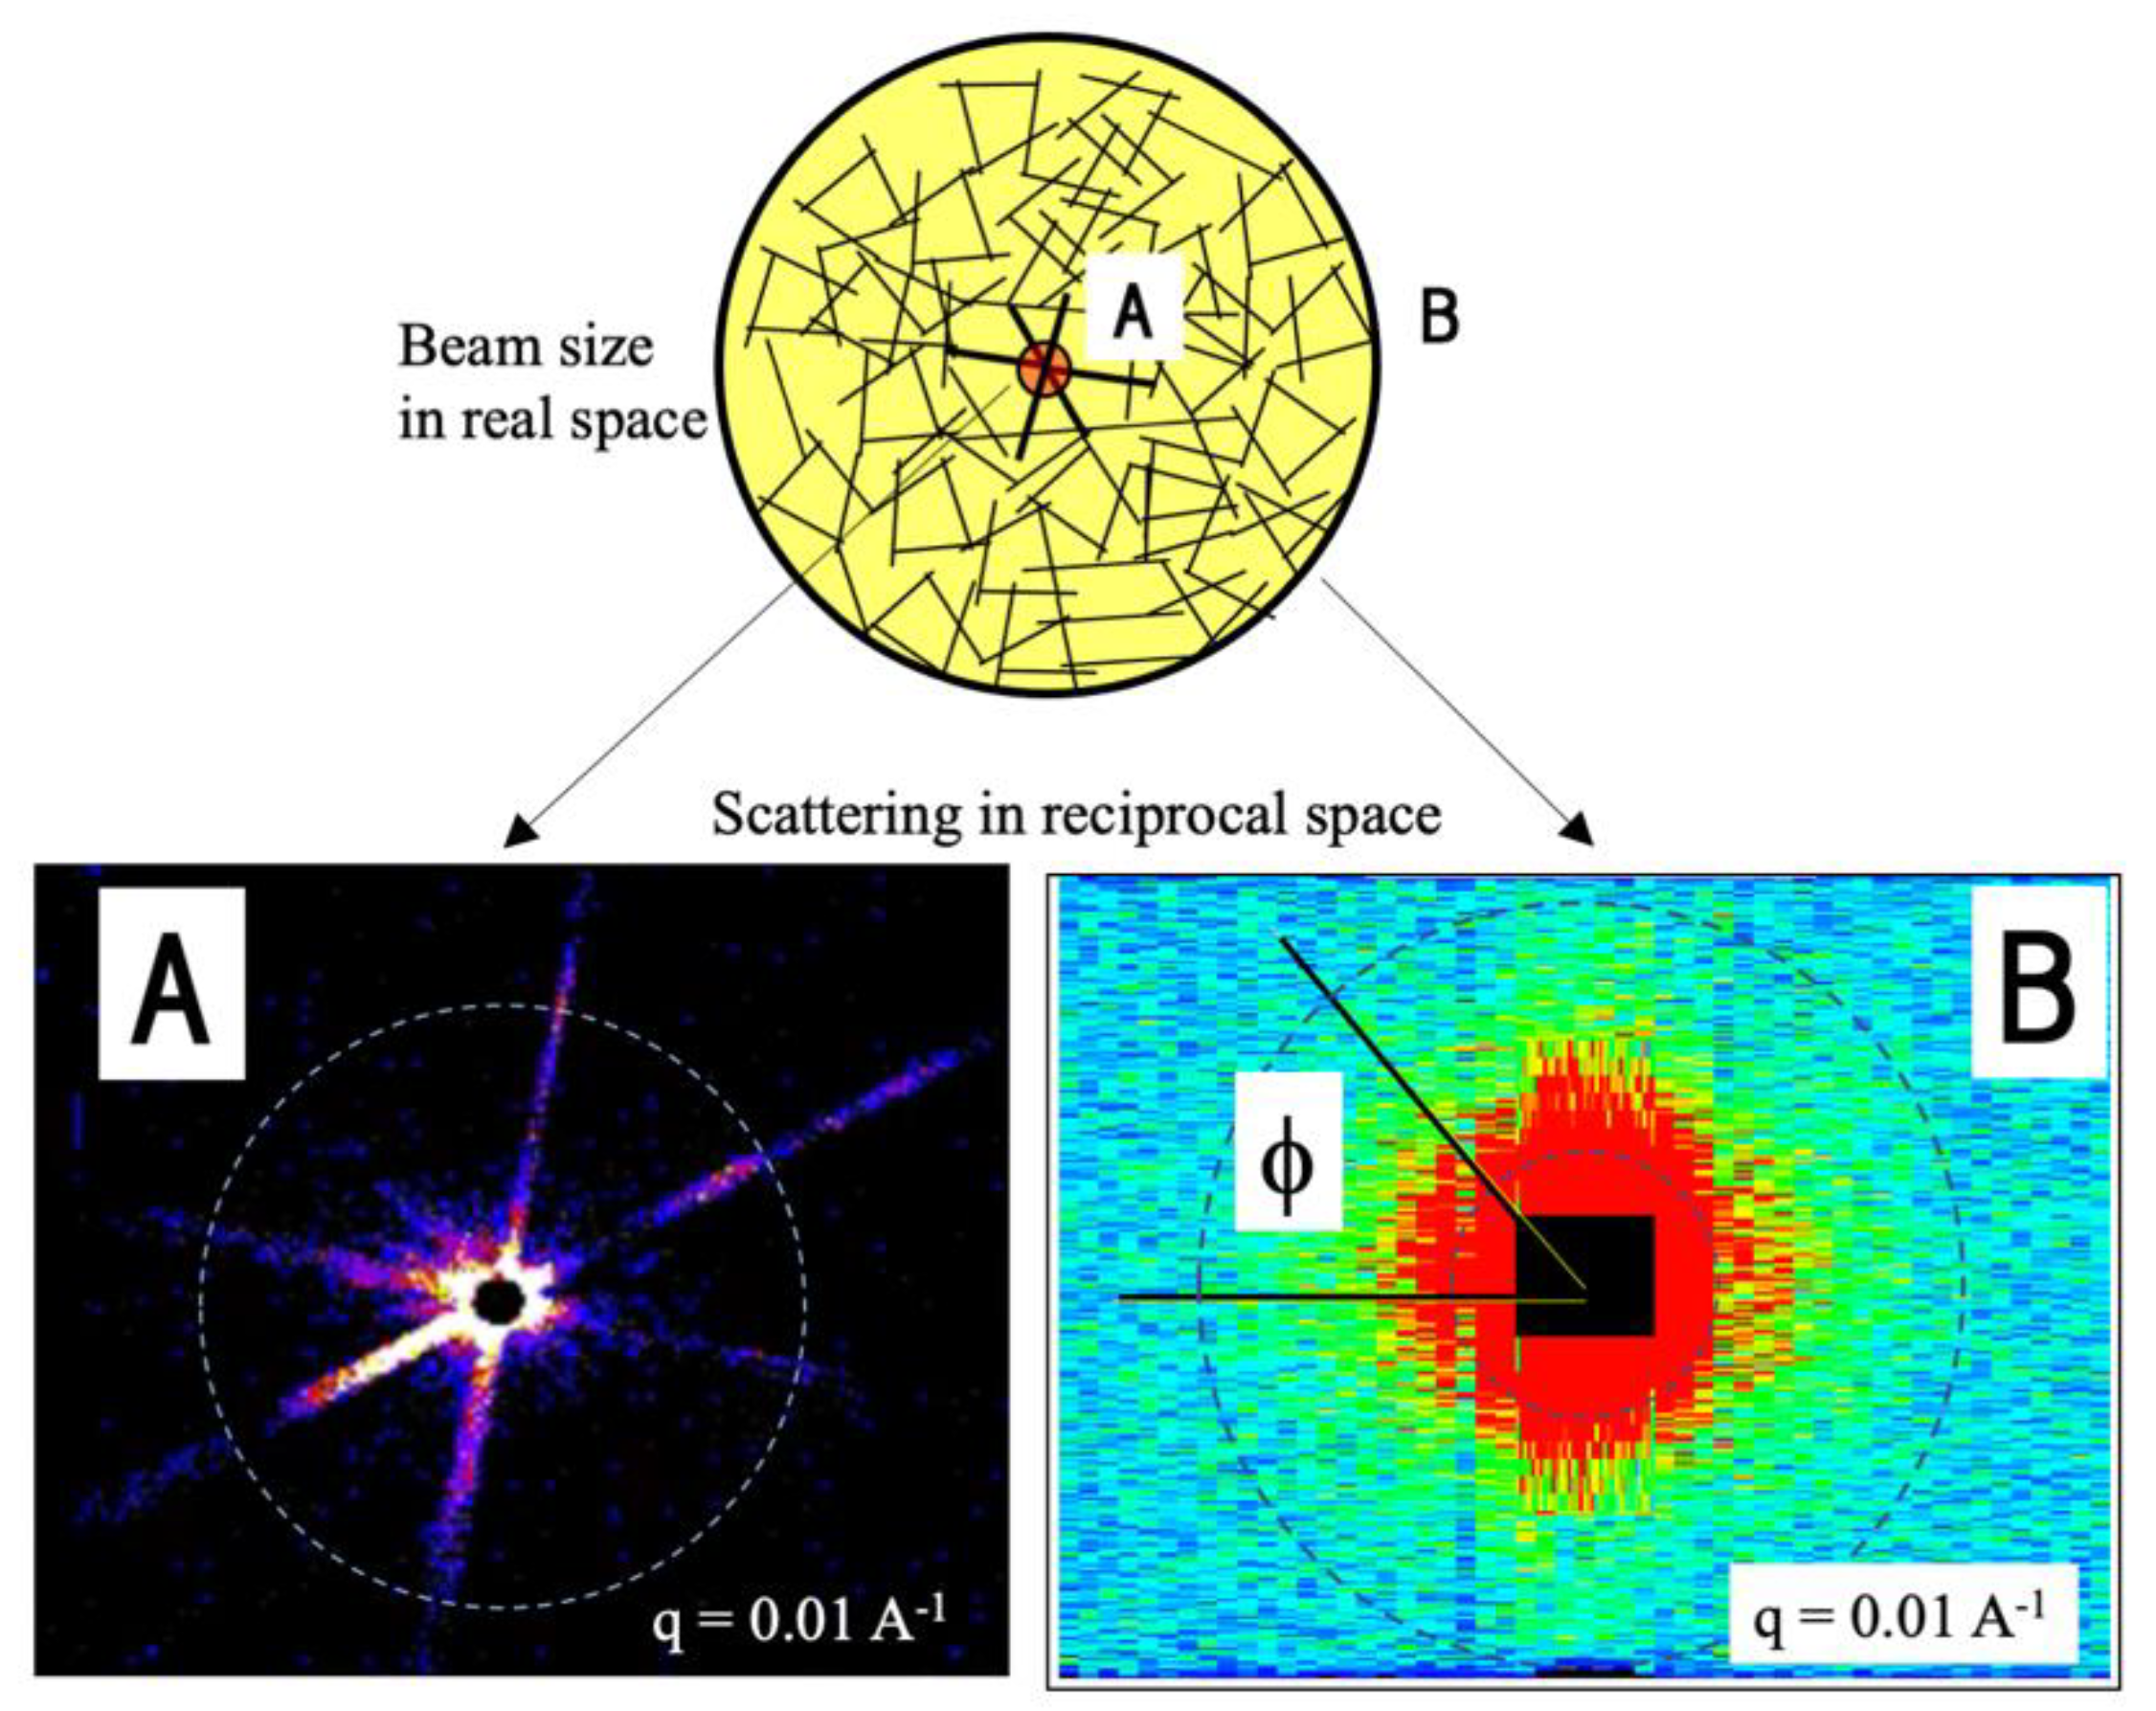
2.1. Time-of-Flight Small-Angle Neutron Scattering Instrument

SANS measurements were performed using the iMATERIA time-of-flight diffractometer at a BL20 beamline at the Material and Life Science Experimental Facility (MLF) at the Japan Proton Accelerator Research Complex (J-PARC; Tokai, Japan). Figure 2a shows a schematic diagram of the iMATERIA diffractometer. Recently, the area detector of iMATERIA, covering a small scattering angle was renewed in order to perform SANS experiments [24]. The iMATERIA instrument is characteristic for a wide range of scattering angles (2θ (=0.1–175°)) covered by 3He gas tube detectors (scattering angle dispersion). In total, 1500 tubes were grouped into four blocks: small-angle, low-angle, 90 degree angle, and backward angle. For observations of foams, we used the small-angle and low-angle detector blocks, with which scattered neutrons transmitted through foam were counted. Figure 2b shows a schematic view of the small-angle and low-angle detector blocks from a sample position. The low-angle detector block had sextuple symmetry. Simultaneously, a wide range of wavelengths of λ = 110 A of pulsed neutrons (wavelength dispersion) were combined in order to scan wave number q. The combination of wide ranges of wave lengths and scattering angles was advantageous for multiscale observations covering a wide q-region from 0.007 to 0.4 A−1, where q is the amplitude of the scattering vector.
Figure 3 shows a schematic diagram of the foaming cell used for the SANS measurements, which was designed by copying the dynamic foam analyzer shown below. It had a rectangular shape measuring 70 × 250 mm2 with a thickness of 30 mm. The windows were made of Kapton® thin films of 0.02 mm thickness in order to reduce background scattering. A surfactant solution (30 mL) was poured into the cell with an air stone at its bottom, and air was moved using an electric air pump (at 1500 mL s−1 for 20 s). After the cell was sufficiently filled with foam, the air pump was stopped and SANS measurements began. SANS measurements were performed at different heights of (1) 140, (2) 100, and (3) 60 mm, as shown in Figure 3. After measuring the time-resolved SANS of collapsing foam, background scattering from the empty cell was subtracted by considering the transmission T(λ), which depends on λ. SANS from foam is isotropic, so after circular averaging over the azimuthal angle (ϕ), a one-dimensional SANS profile I(q) was obtained with a time interval of 1 min.

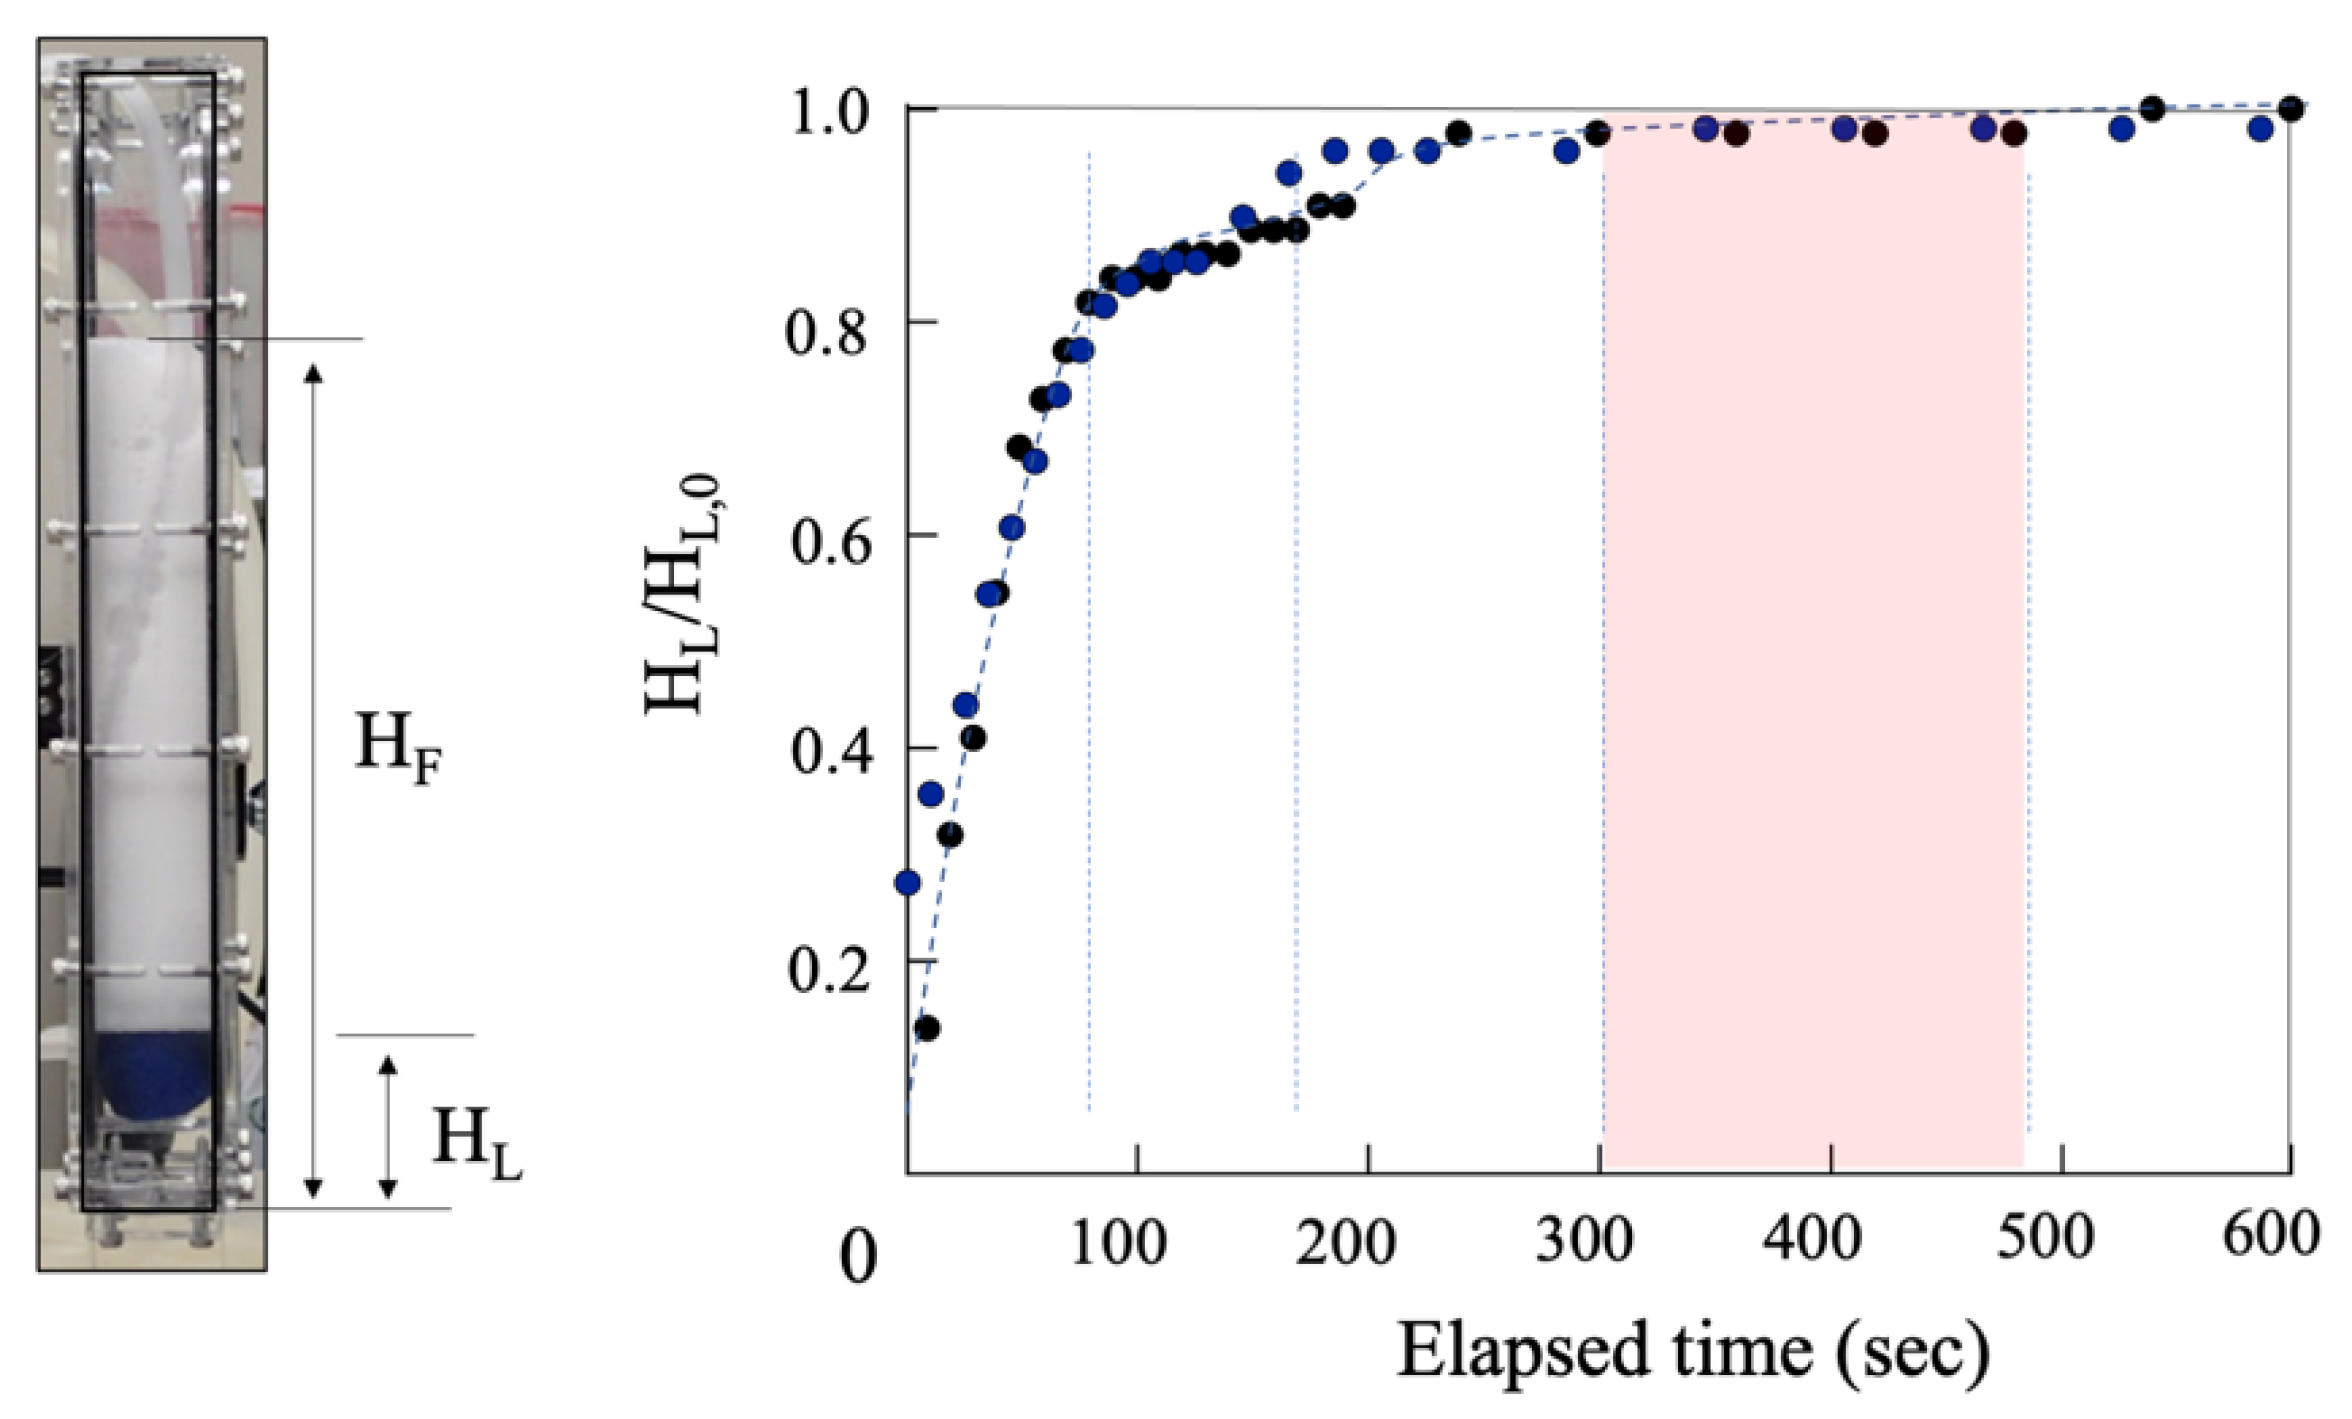
2.2. Height Analysis and Small-Angle X-ray Scattering
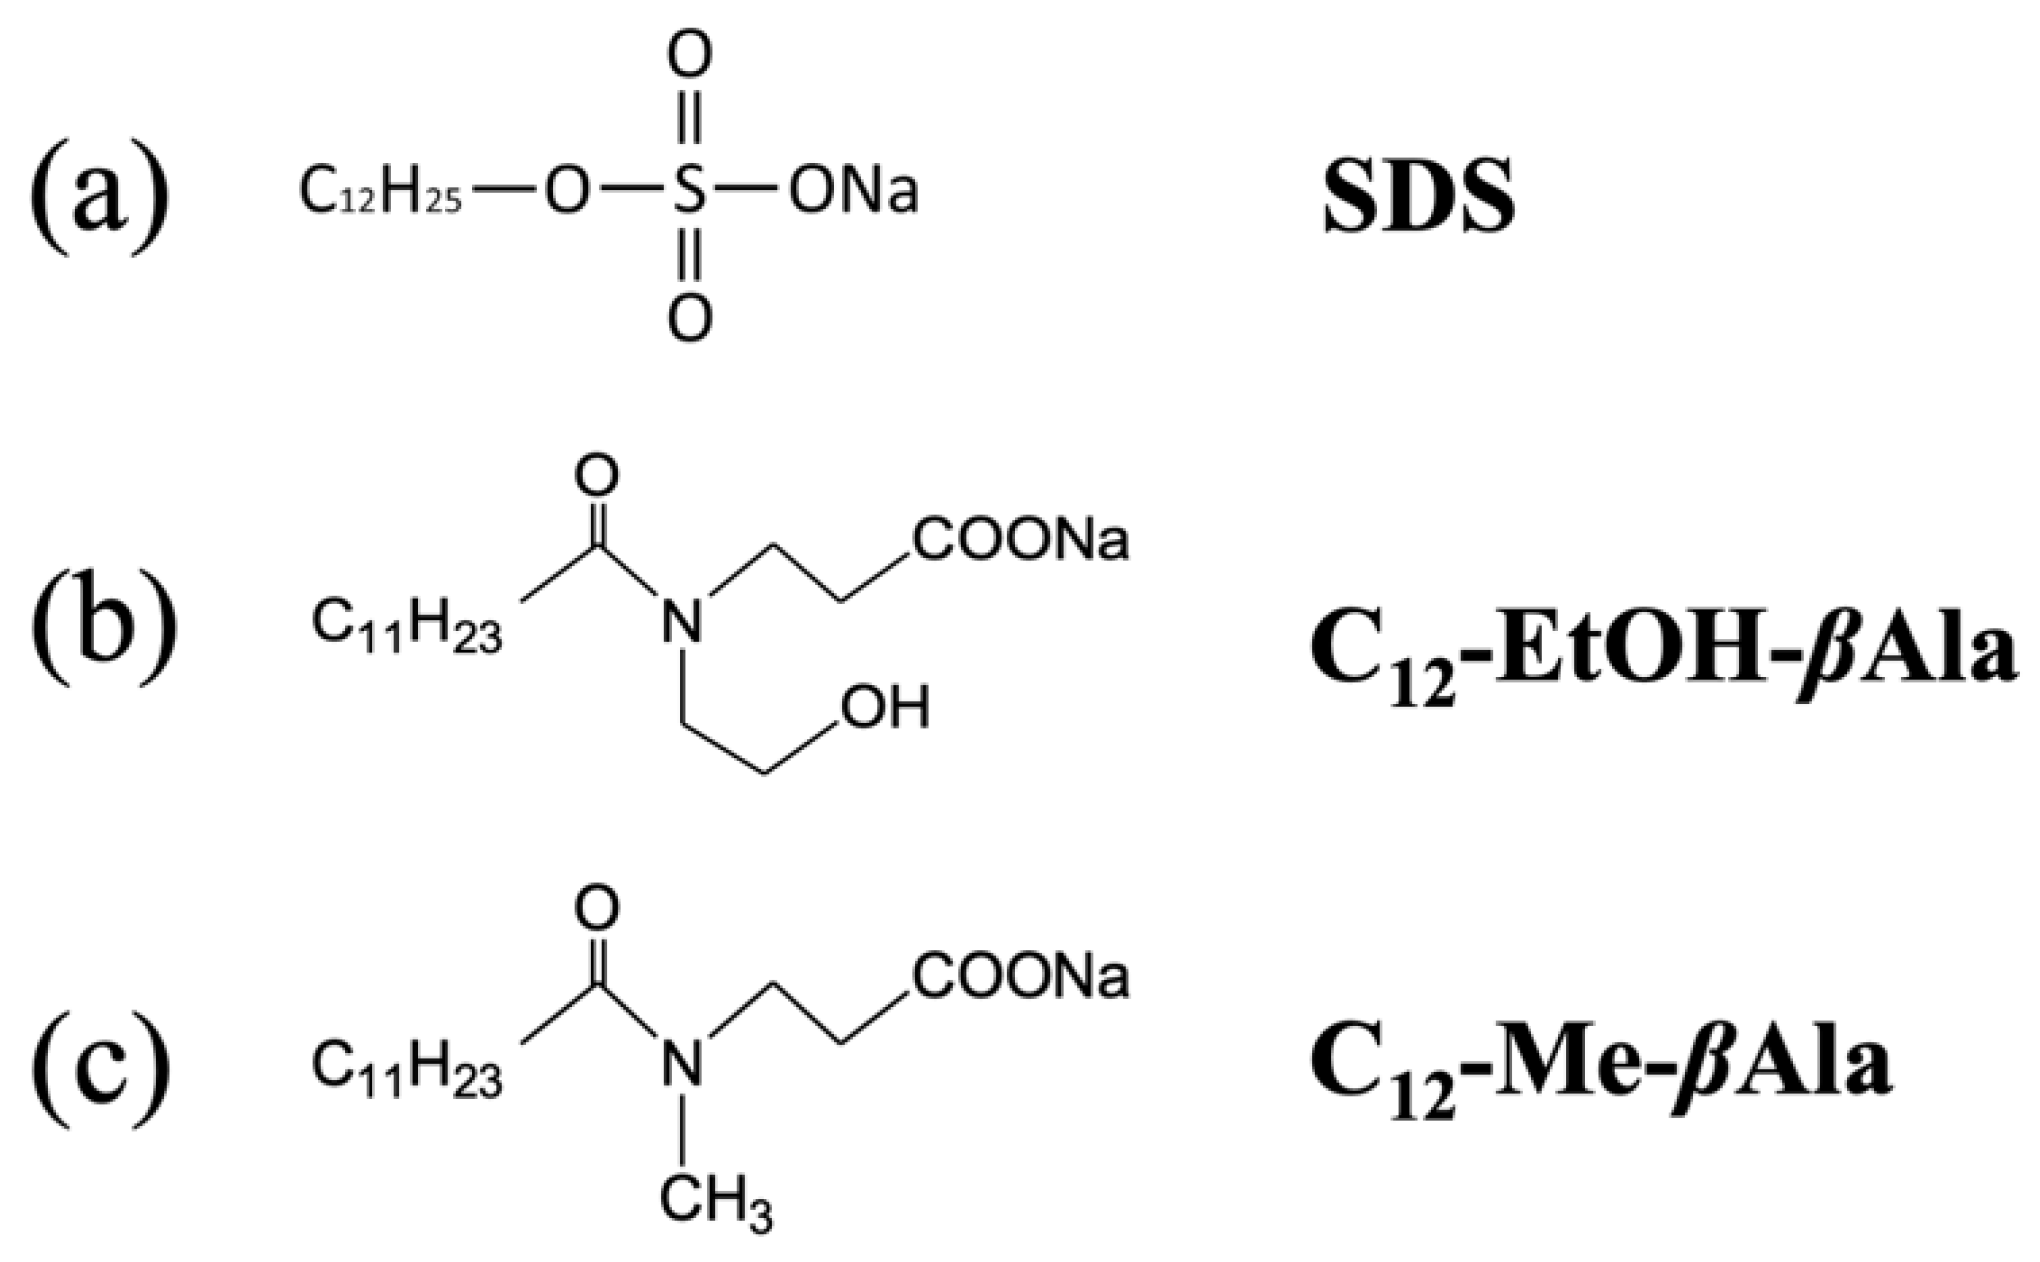
The foam height was monitored using a dynamic foam analyzer (DFA100, Krüss, Hamburg, Germany). A surfactant solution dissolved in H2O (30 mL) was poured into a cylindrical quartz vessel (40 mm diameter). Air was moved for 20 s through a porous stone using an electric air pump with a flow rate of 25 mL s−1. The foam thus prepared was irradiated using a red laser light from a horizontal direction at a height of 200 mm, and the transmitted light was monitored every 60 s using a line-shape detector. The light was transferred to the foam height, denoting the stability of the foams. Images of the foams attached to the glass wall were also monitored using a CCD camera as a function of the elapsed time.
Small-angle X-ray scattering (SAXS) was performed using a laboratory instrument (Nano-viewer, RIGAKU Co., Ltd., Akishima, Japan). The sample environment was the same as for SANS, as shown in Figure 3. In order to obtain higher transmission, the thickness was tuned to 5 mm. The two-dimensional SAXS pattern was obtained using a PILATUS detector.

2.3. Materials

Figure 4 shows the chemical structures of surfactants studied in this paper. The SDS in this study was supplied by Sigma-Aldrich Co. Ltd. The amino-acid-type surfactants C12–EtOH–βAla and C12–Me–βAla were provided by NOF Corporation (Tokyo, Japan). After recrystallization, C12–EtOH–βAla or C12–Me–βAla was dissolved in water. In order to enhance or tune the scattering contrast for SANS, we prepared isotopically mixed water (H2O/D2O (0/100) and (91/9) (vol/vol)). Using the mixed water (91/9) (vol/vol), contrast matching was achieved between the surfactant solution and air. SDS was also prepared as a control. NaOD (30 wt% solution in D2O) was obtained from Kanto Chemicals Co., Inc. (Tokyo, Japan). NaOH was purchased from Fujifilm Wako Pure Chemical Corporation (Osaka, Japan). The surfactant concentration in D2O and aqueous solutions was fixed at 100 mM, and the pH was adjusted to 12–13 using NaOD and NaOH, respectively.

3. Time-of-Flight SANS and Scattering Laws

3.1. Data Reduction to Scattering Profile

A scattering process is described by the conservation laws for momentum ( q = ( k f k i ) ) and energy (   ω = 2 / 2 m n ( k f 2 k i 2 ) ), where is Plank’s constant, k i and k f are wavenumber vectors of the incident and scattered neutrons, and m n is the mass of a neutron [23]. Figure 5 shows a schematic diagram of the scattering geometry. A sample is allocated at a position L 1 from a neutron source, and a large area detector is allocated at L 2 from the sample. The orthogonal coordinate is defined as the x- and y-axes parallel to the detector surface, and the z-axis is parallel to an incident neutron beam. We postulate k f k i = 2 π λ , so a scattering vector ( q ) is defined using k i = 2 π λ 0 ,   0 ,   1 and k f = 2 π λ ( x L 2 ,   y L 2 ,   z L 2 ) as follows:
q = q x , q y , q z = 2 π λ ( x L 2 ,   y L 2 , 1 z L 2 )
or with a polar axis coordinate with a scattering angle (2θ) and an azimuthal angle (ϕ) in an x–y plane:
q = 4 π sin θ λ cos θ cos ϕ , cos θ sin ϕ , sin θ
An amplitude of scattering vector ( q ) is defined as
q = q = 4 π λ sin θ
Figure 5. Schematic diagram of scattering geometry. The sample position is L 1 from a neutron source, and a large area detector is L 2 from the sample. The orthogonal coordinate is defined as the x- and y-axes parallel to the detector surface, and the z-axis is parallel to the incident neutron beam ( k i ). A scattering vector ( q ) is defined using the scattering angle (2θ), k i , and the scattering neutron ( k f ).
Qubs 07 00004 g005
According to wave–particle duality and the de Broglie principle, the λ for neutrons is given by λ = p ,   where p is momentum ( p = m n v ,   where   v   is   velocity ). With a traveling distance of L   ( = L 1 + L 2 ) and a traveling time of tTOF, the neutron velocity is given by v = L t T O F . Then, λ is given by
λ = t T O F m n L .
The q–value is obtained by combining Equations (2) and (3), which is called a “time-of-flight” method characteristic for a pulsed neutron source (J-PARC in our case). For scanning q, there are two methods: (i) the angular-dispersive method and (ii) the wavelength-dispersive method. For the first method (i), by changing the scattering angle (2θ) (usually the detector positions with respect to the beam), q values are scanned. For SANS at a reactor source, we changed the detector positions away from the sample position. The second method (ii) is suitable for scattering measurements at a spallation source. The wavelength was scanned by using the time-of-flight method according to Equation (3). Toward a wider q, the wavelength–dispersive method at a pulsed neutron source profits by gaining qmax and therefore qmax/qmin. Toward a smaller q, on the other hand, the wavelength-dispersive method is no longer necessary because the smallest q is realized by a combination of the smallest q and the longest λ. Therefore, SANS at a reactor is preferable for achieving the smallest qmin.
The measured intensity ( I o b s s λ , θ ) is given by background scattering ( I o b s b c k λ , θ ) as follows [24]:
I o b s s λ , θ = I O λ K I   A s t s d s d Ω λ , θ   T r s λ   η λ   Δ Ω + I o b s b c k λ , θ T r s λ
where d Σ d Ω q is the differential scattering cross section.
Note that I o b s s λ , θ is proportional to the incident beam intensity ( I 0 λ ), sample volume (AS tS), and transmission (   T r s λ ), where AS and tS are the sample cross section and thickness. KI is an instrument constant. η λ and Δ Ω are the counting efficiency and solid angle of a detector element. Therefore, we obtain
d s d Ω λ , θ = I o b s s λ , θ T r s λ   I o b s b c k λ , θ / I 0 λ N   η λ Δ Ω .
Note that I 0 λ , T r s λ , and η λ are wavelength–dependent. We define a distance as L   ( = L 1 + L 2 ), which is the sum of L1 (from the T0 chopper to a sample) and L 2 (from a sample to the detector). An absolute intensity unit (cm−1) is obtained by considering SANS for a secondary standard of glassy carbon.
With the neutron counts from a direct beam monitor behind a small–angle scattering detector, the neutron transmission ( T r s λ ) is calculated as follows:
T r s λ =   I 1 s λ I 1 c l o s e λ     / I 1 b c k λ I 1 c l o s e λ   =   exp Σ T t s ,
where I 1 s λ , I 1 b c k λ , and I 1 c l o s e λ are the transmitted beam intensity for the sample, background, and beam-close measurements, respectively. The beam-close measurement is conducted by putting a B4C block at the sample position. t s is the thickness of the sample. Σ T is the macroscopic total cross section, composed of scattering ( Σ S ), the incoherent scattering cross section ( Σ i n c ), and the absorption cross section ( Σ A ), as follows:
Σ T = Σ S + Σ i n c + Σ A .
In this study, Σ A was negligible, whereas Σ S and Σ i n c were crucial to determining the microstructures of foams. Using coherent and incoherent scattering and absorption microscopic cross sections ( σ c o h , σ i n c , and σ a b s , respectively), Σ T is given by Σ T = n σ c o h + σ i n c + σ a b s , where n is the number density, as defined by n = N/V. Microscopic scattering cross sections are given by σ c o h = 4 π b c o h 2 and σ i n c = 4 π b i n c 2 , where bcoh and binc are the coherent and incoherent scattering lengths. Note that a mean free path (MFP) is given by MFP = 1/ Σ T .
For real measurements, transmission depends on both the wavelength and the scattering angle. The apparent sample thickness (tap) (Figure 3c) is given by tap = t s / cos 2 θ . Then, transmission is given by
T r s λ , θ =   exp Σ T λ t s / cos 2 θ .
The absorption cross section depends on the wavelength (λ).
Σ T λ = n σ s + σ i n c + λ λ R σ a b s
Note that σ a b s is determined for the reference thermal neutron of λ R = 1.8 Å.

3.2. Scattering Functions for Film Structure

According to a textbook by Roe [25], we describe a scattering function for a film shape structure. The total small–angle scattering from foam (I(q)) is the sum of the coherent (Icoh(q)) and incoherent scattering (Iinc(q)) (proportional to the total amount of hydrogen):
I o b s s λ , θ = I c o h ( q ) + I i n c ( q ) .
Icoh(q) is given by the interference between the i–th and j–th scattering points with a distance vector of r i j . By considering a phase difference ( r i j . q ), the scattering intensity (I(q)) is given by
I c o h q ~   i , j b i b j   exp ( r i j . q ) θ
where 2 θ is an angle between a scattering vector and a principal axis of a scattering object. After taking a random average in θ for isotropic systems, q is given as a scalar and we obtain a Debye scattering equation [26], as indicated by
I c o h q ~   i , j b i b j   sin q r i j q r i j .
For a spherical symmetry system (micelle) [23], Icoh(q) is given by
I M = Δ b ¯ 2 2   V p 2   n p   P ( q )   L ( q ) ,
where P(q) is a form factor and L(q) is a structure factor. In Equation (7), Vp is the volume of a particle and np is the number density. Δ b ¯ , i.e., the difference in the averaged scattering length density (SLD), is called a scattering contrast. Note that Δ b ¯ 2 is a contast between an alkyl chain and the mixed water in the film, as shown in Figure 6.
An individual foam film between two Plateau boarders is approximated by a disk with diameter R and thickness d (R >> d). P(q) for a disk is given by
I F q P q   ~   Δ b ¯ 1 2   q 2 sin q d / 2 q d / 2 2 ,
where Δ b ¯ 1 is the scattering contrast between the air and the film averaged over the mixed water and surfactant, as shown in Figure 6. At the crossover wave number qc (=2π/d), the q-behaviors of P(q) for a disk are changed:
I F q   ~   Δ b ¯ 1 2   q 2 ,   ( q   <   q c )
and
I F q   ~   2 π Δ b ¯ 1 2 ( S / V s )   q 4 ,   ( q   >   q c )
where S is a specific surface of the films and Vs is a sample volume (volume irradiated by neutrons). It should be denoted that the film thickness (d) is given by d = 2π/qc.

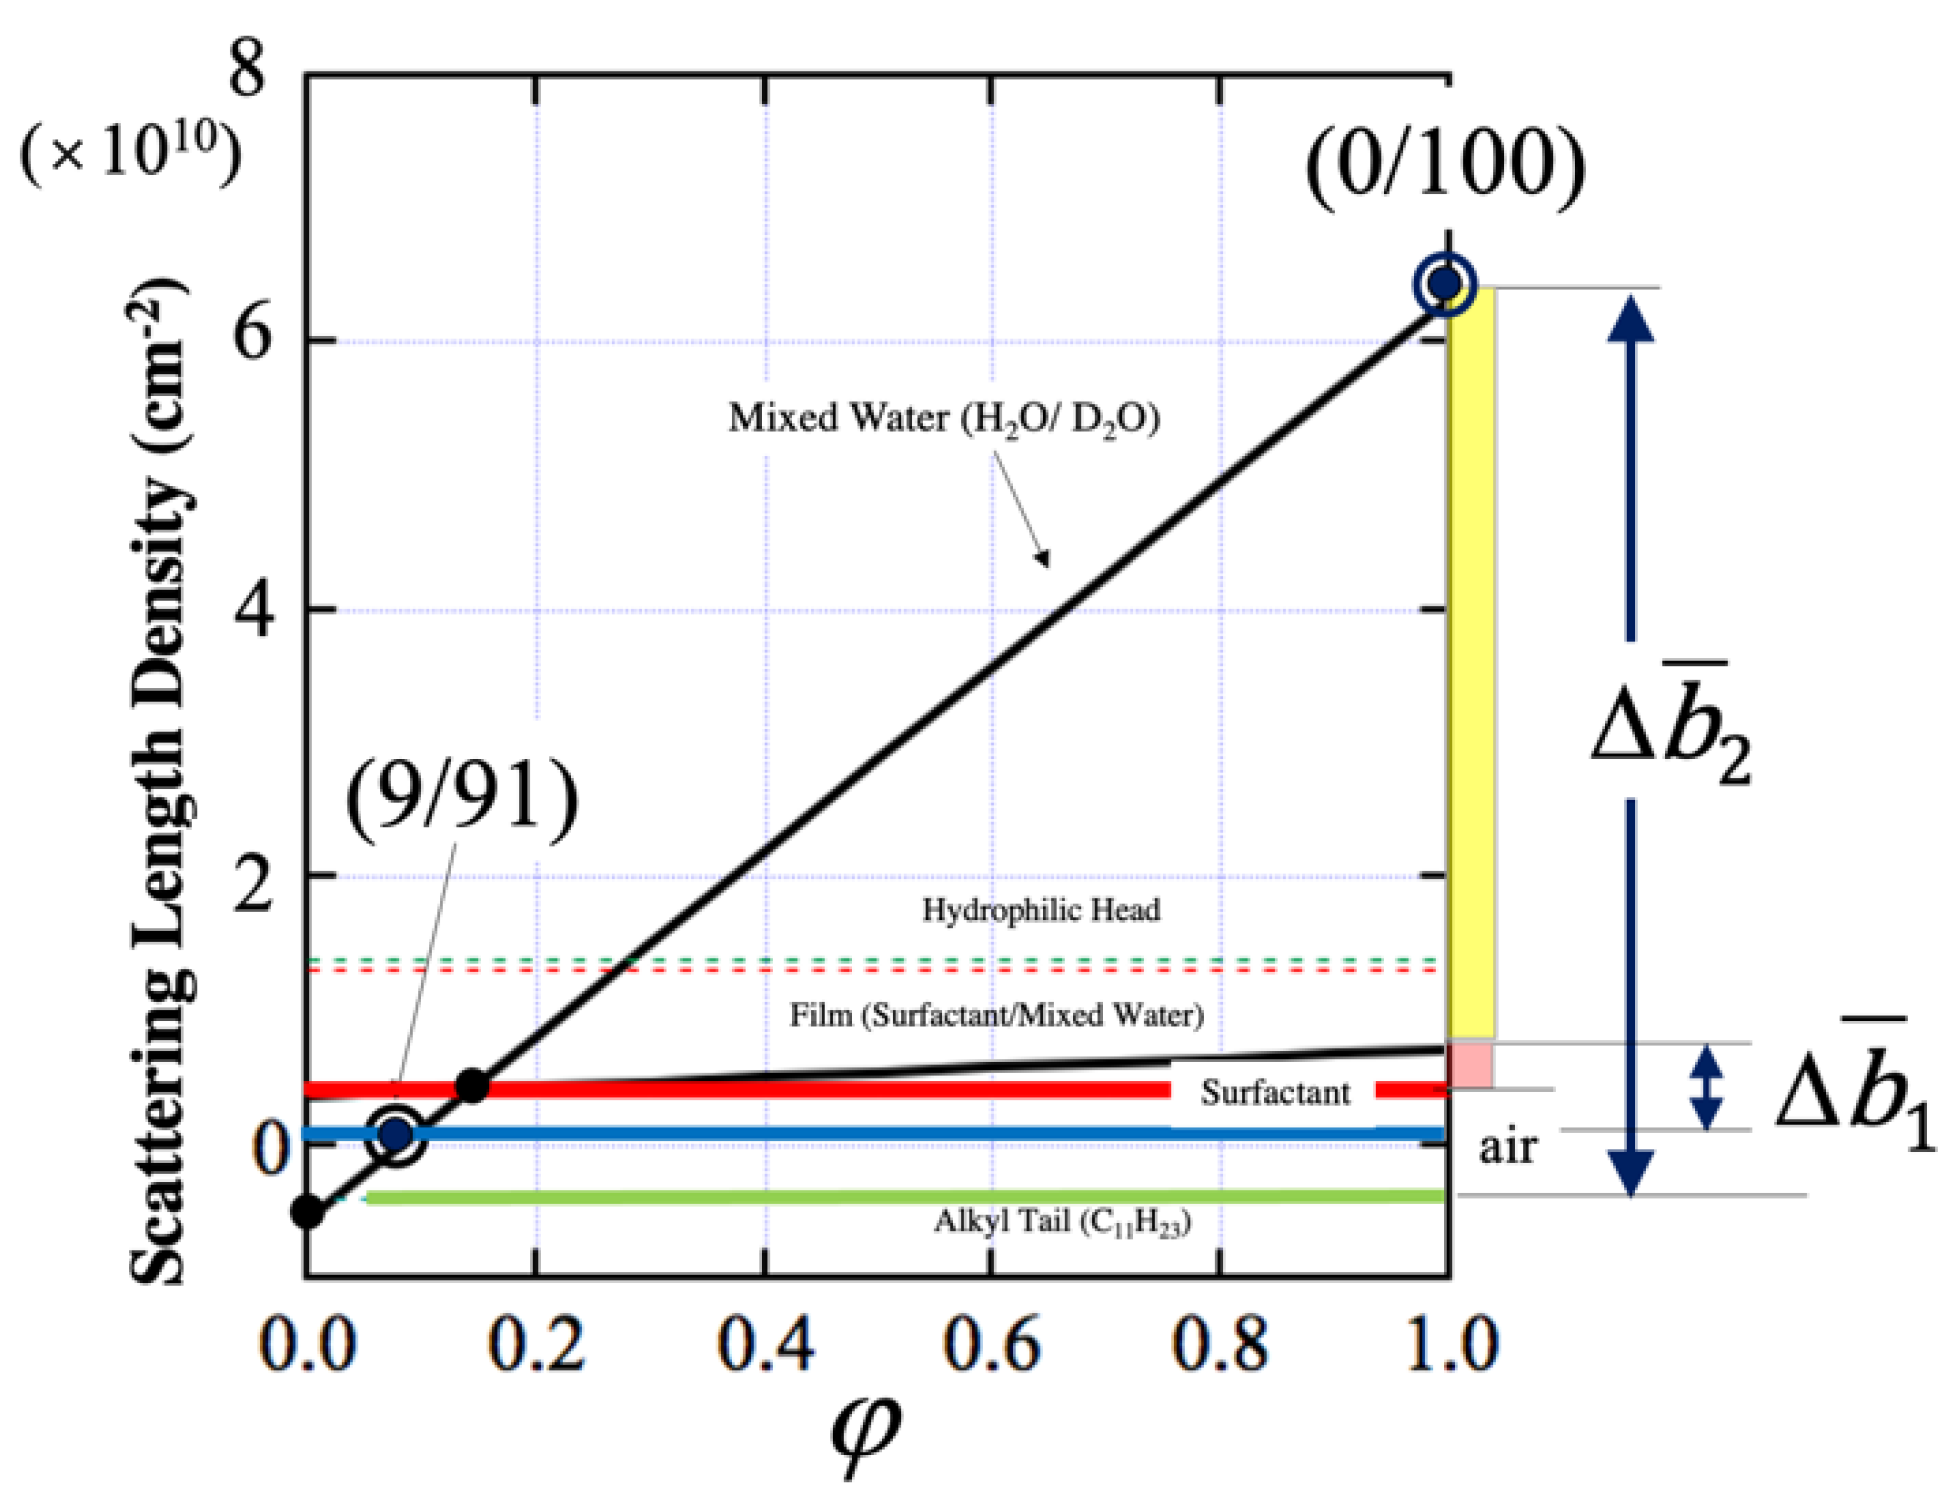
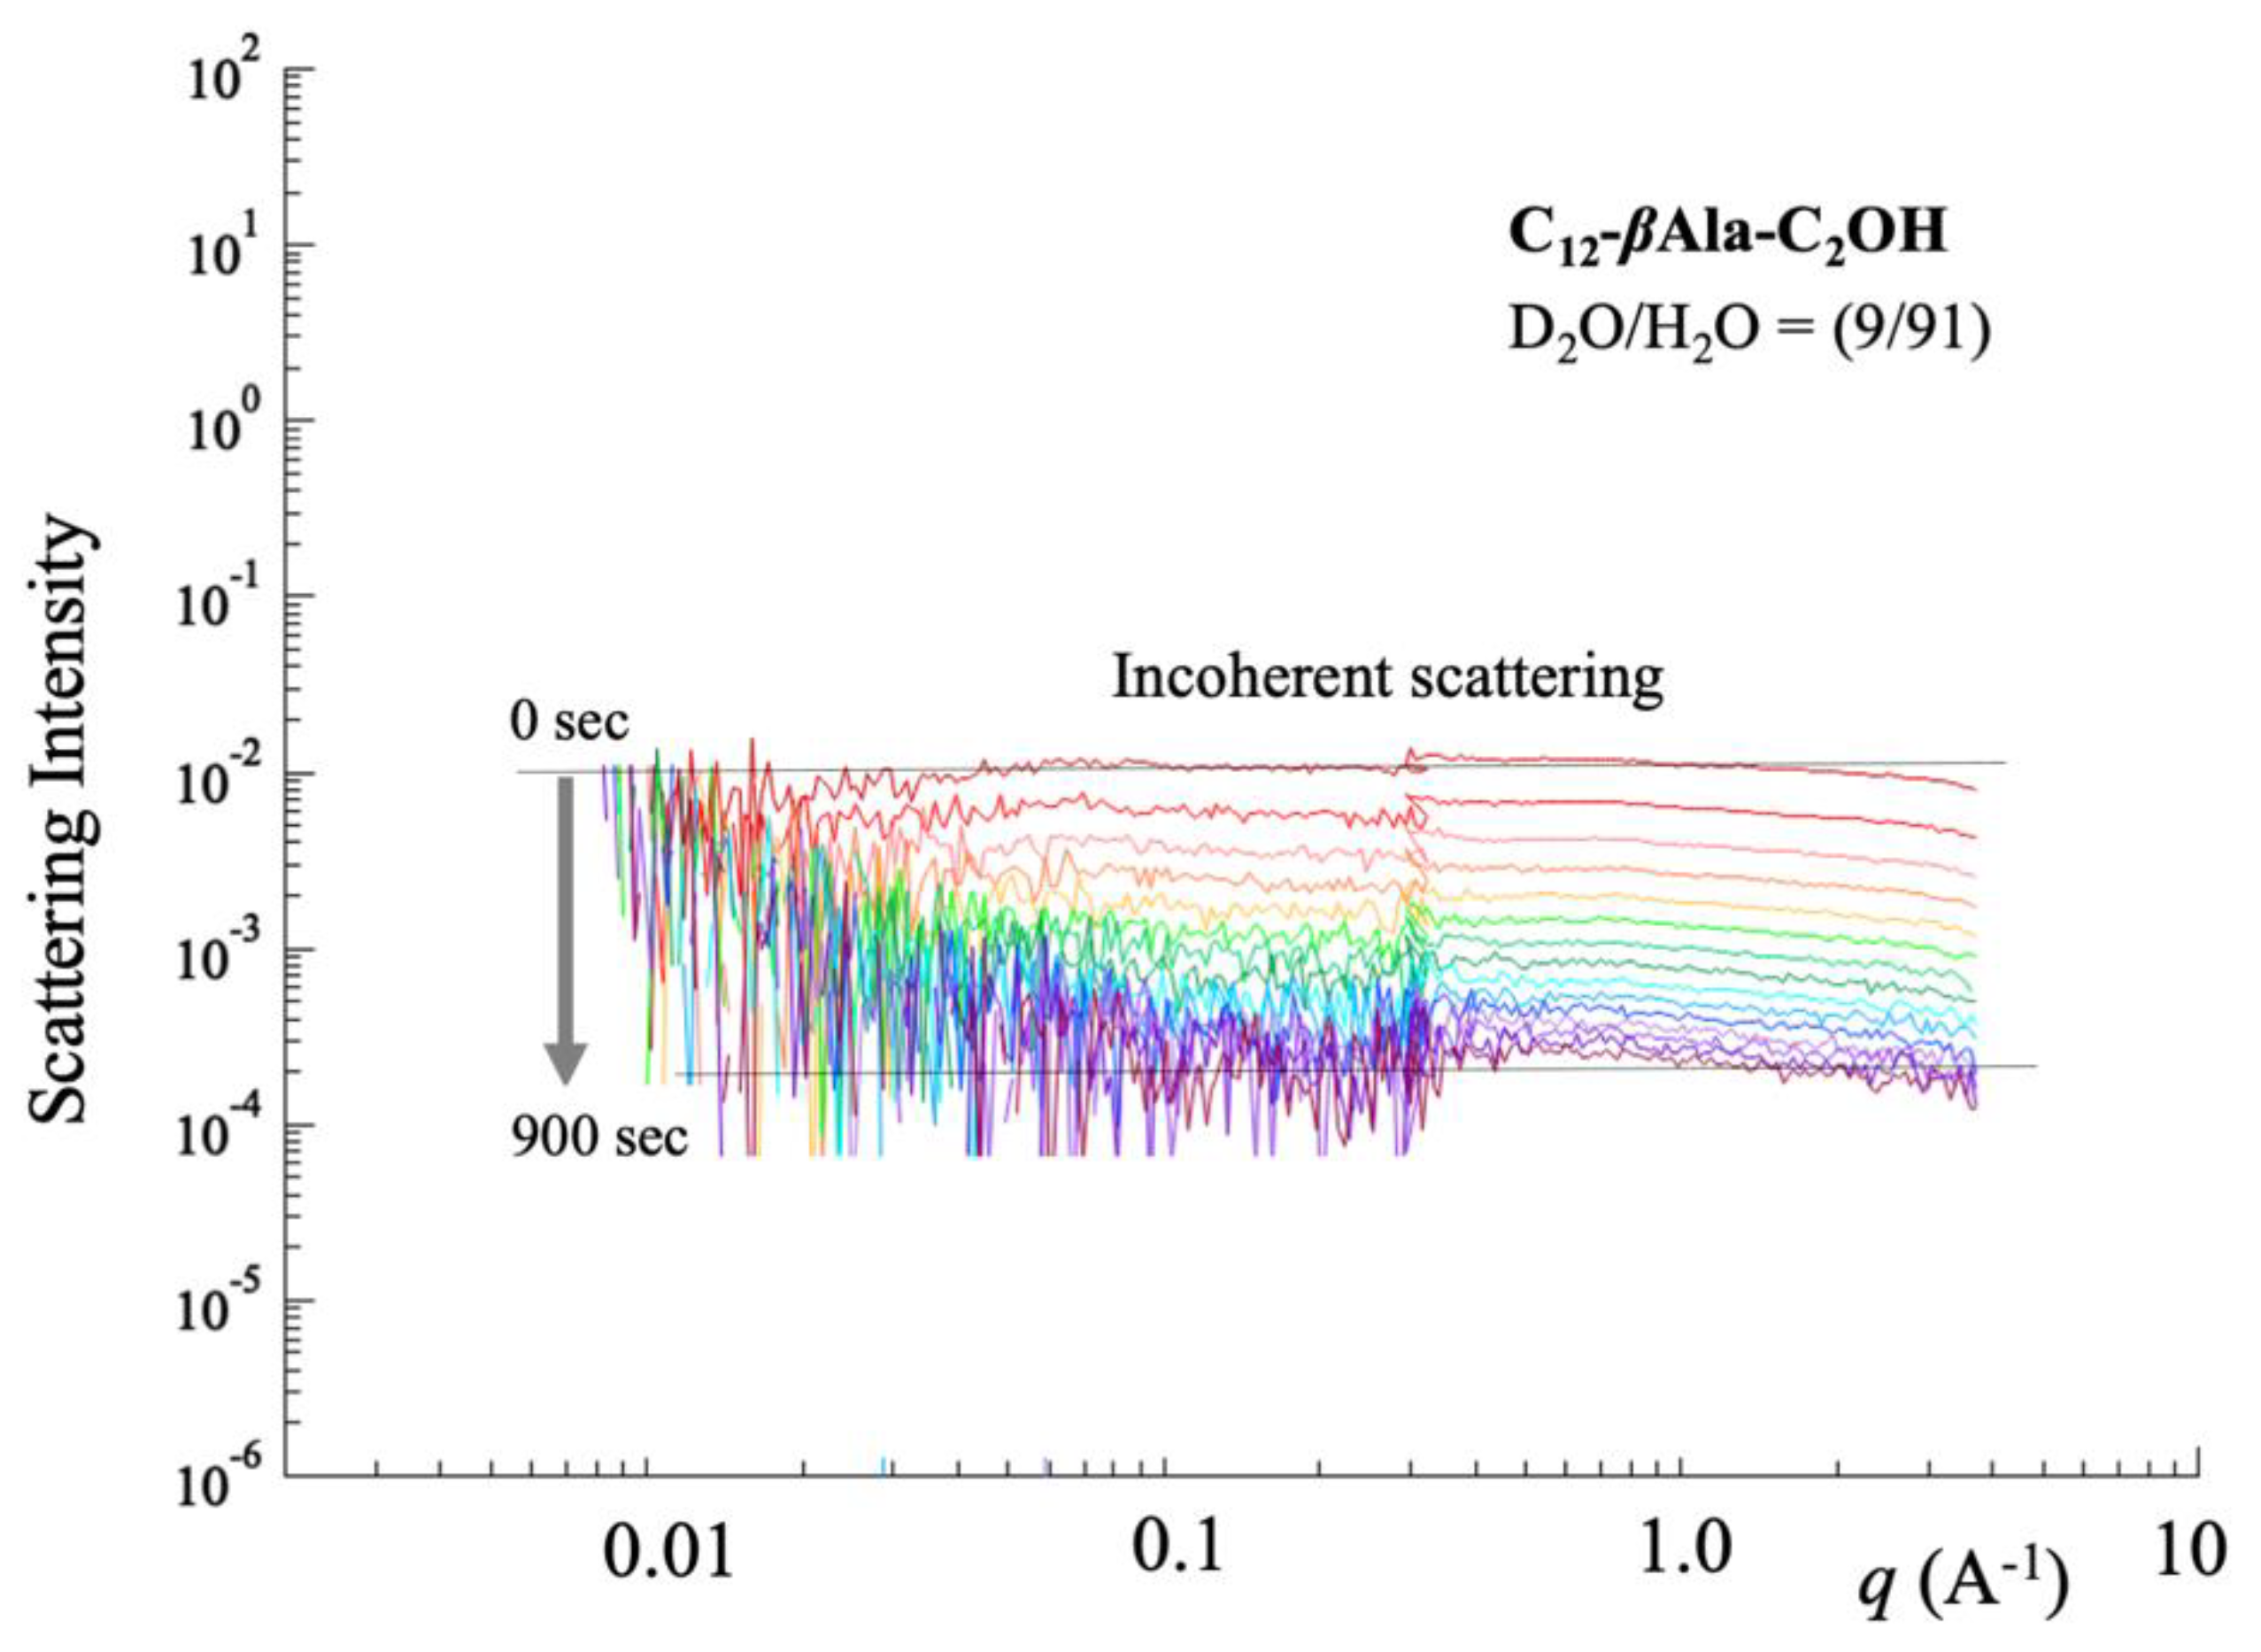
3.3. Deuterium Substitution

Incoherent scattering (Iinc(q)) is caused by hydrogen (H) in water and surfactant as well as in deuterium (D) in water. Iinc(q) is given by
Iinc(q) = (1 − ψs) [φIinc,D + (1 − φ) Iinc,H] + ψs Iinc,s
where ψs is a volume fraction of surfactant. Note that φ is a volume fraction of D2O in the mixed water of H2O/D2O.
We calculated the scattering length density (SLD) ( b ¯ ) averaged over the surfactant molecules or the mixed water. SLD is defined by summing the coherent scattering lengths (b) for atoms composing a molecule [25], that is
b ¯ = b V m ,
where V m is a molar volume given by V m = M n / N A ρ m with molecular weight Mn, mass density ρm, and Avogadro’s number NA. We obtained b ¯ = −0.56 × 1010 cm−2 for H2O and b ¯ = 6.37 × 1010 cm−2 for D2O.
Figure 6 shows SLD as a function of the mixing ratio (φ). The SLD for the mixed water (H2O/D2O) is shown by a thick black line in Figure 6. Note that the SLD for air is zero. In order to evaluate SLD for a hydrophobic tail of the surfactant, V m was determined according to a Tanford method [27], as follows:
V m = 27.4 + 26.9 n c × 10 3   ( nm 3 )
where n c is the number of carbons in a molecule ( n c = 11 in this study). Then, we obtained V m = 27.4 + 26.9 × 11 × 10 3 = 0.3233   nm 3 , so that the SLD for the alkyl tail (C11H23) was b ¯ = 0.399 × 10 10 cm 2 (indicated by a light-green dashed line in Figure 6). The SLD for the hydrophilic heads of the C12–EtOH–βAla and C12–Me–βAla surfactants is 1.319–1.393 × 1010 cm−2. Averaging the head and tail groups, the SLD values for SDS, C12–EtOH–βAla, and C12–Me–βAla are b ¯ = 0.31, 0.42, and 0.36 × 1010 cm−2, respectively. It should be denoted that SLD becomes zero with a concentration of (H2O/D2O) (91/9 vol/vol), i.e., a matching point in the scattering length between air and mixed water. The SLD for a foam film can be evaluated using the water content in a film (1 − ψs), which is determined by considering incoherent scattering. In Figure 6, ψs, the volume fraction of the surfactant, is indicated by a yellow bar, whereas (1 − ψs) is indicated a by pink bar. As a result of averaging over the surfactant and mixed water, the SLD for the whole film (mixed water/surfactant) is given by a thick black line. The scattering contrast between the whole film and air is indicated by arrow Δb1. The scattering contrast of a micelle in a film (alkyl tail and mixed water) is indicated by arrow Δb2.
Figure 6. Coherent scattering length density (SLD) as a function of the volume fraction of D2O (φ). The SLD for mixed water (H2O/D2O) is shown by a thick black line. The SLD for a hydrophilic head of C12–EtOH–βAla and C12–Me–βAla surfactant is 1.319–1.393 × 1010 cm−2 (broken thin lines), whereas an alkyl tail (C11H23) is −0.399 × 1010 cm−2 (thick green line). Averaging the head and tail groups, the SLD values for SDS, C12–EtOH–βAla, and C12–Me–βAla are b ¯ = 0.31, 0.42, and 0.36 × 1010 cm−2, respectively (red line). The SLD of (H2O/D2O) (91/9 vol/vol) is zero, i.e., a matching point in the scattering length between air and mixed water. The SLD for a foam film is indicated by a thick black line by considering the volume fractions of the surfactant (ψs, indicated by the yellow bar) and water ((1 − ψs), indicated by the pink bar). The scattering contrast between the whole film and air is indicated by arrow Δb1. The scattering contrast of a micelle in a film (alkyl tail and mixed water) is indicated by arrow Δb2. Note that the SLD for air (blue line) is zero.
Qubs 07 00004 g006

4. Experimental Results

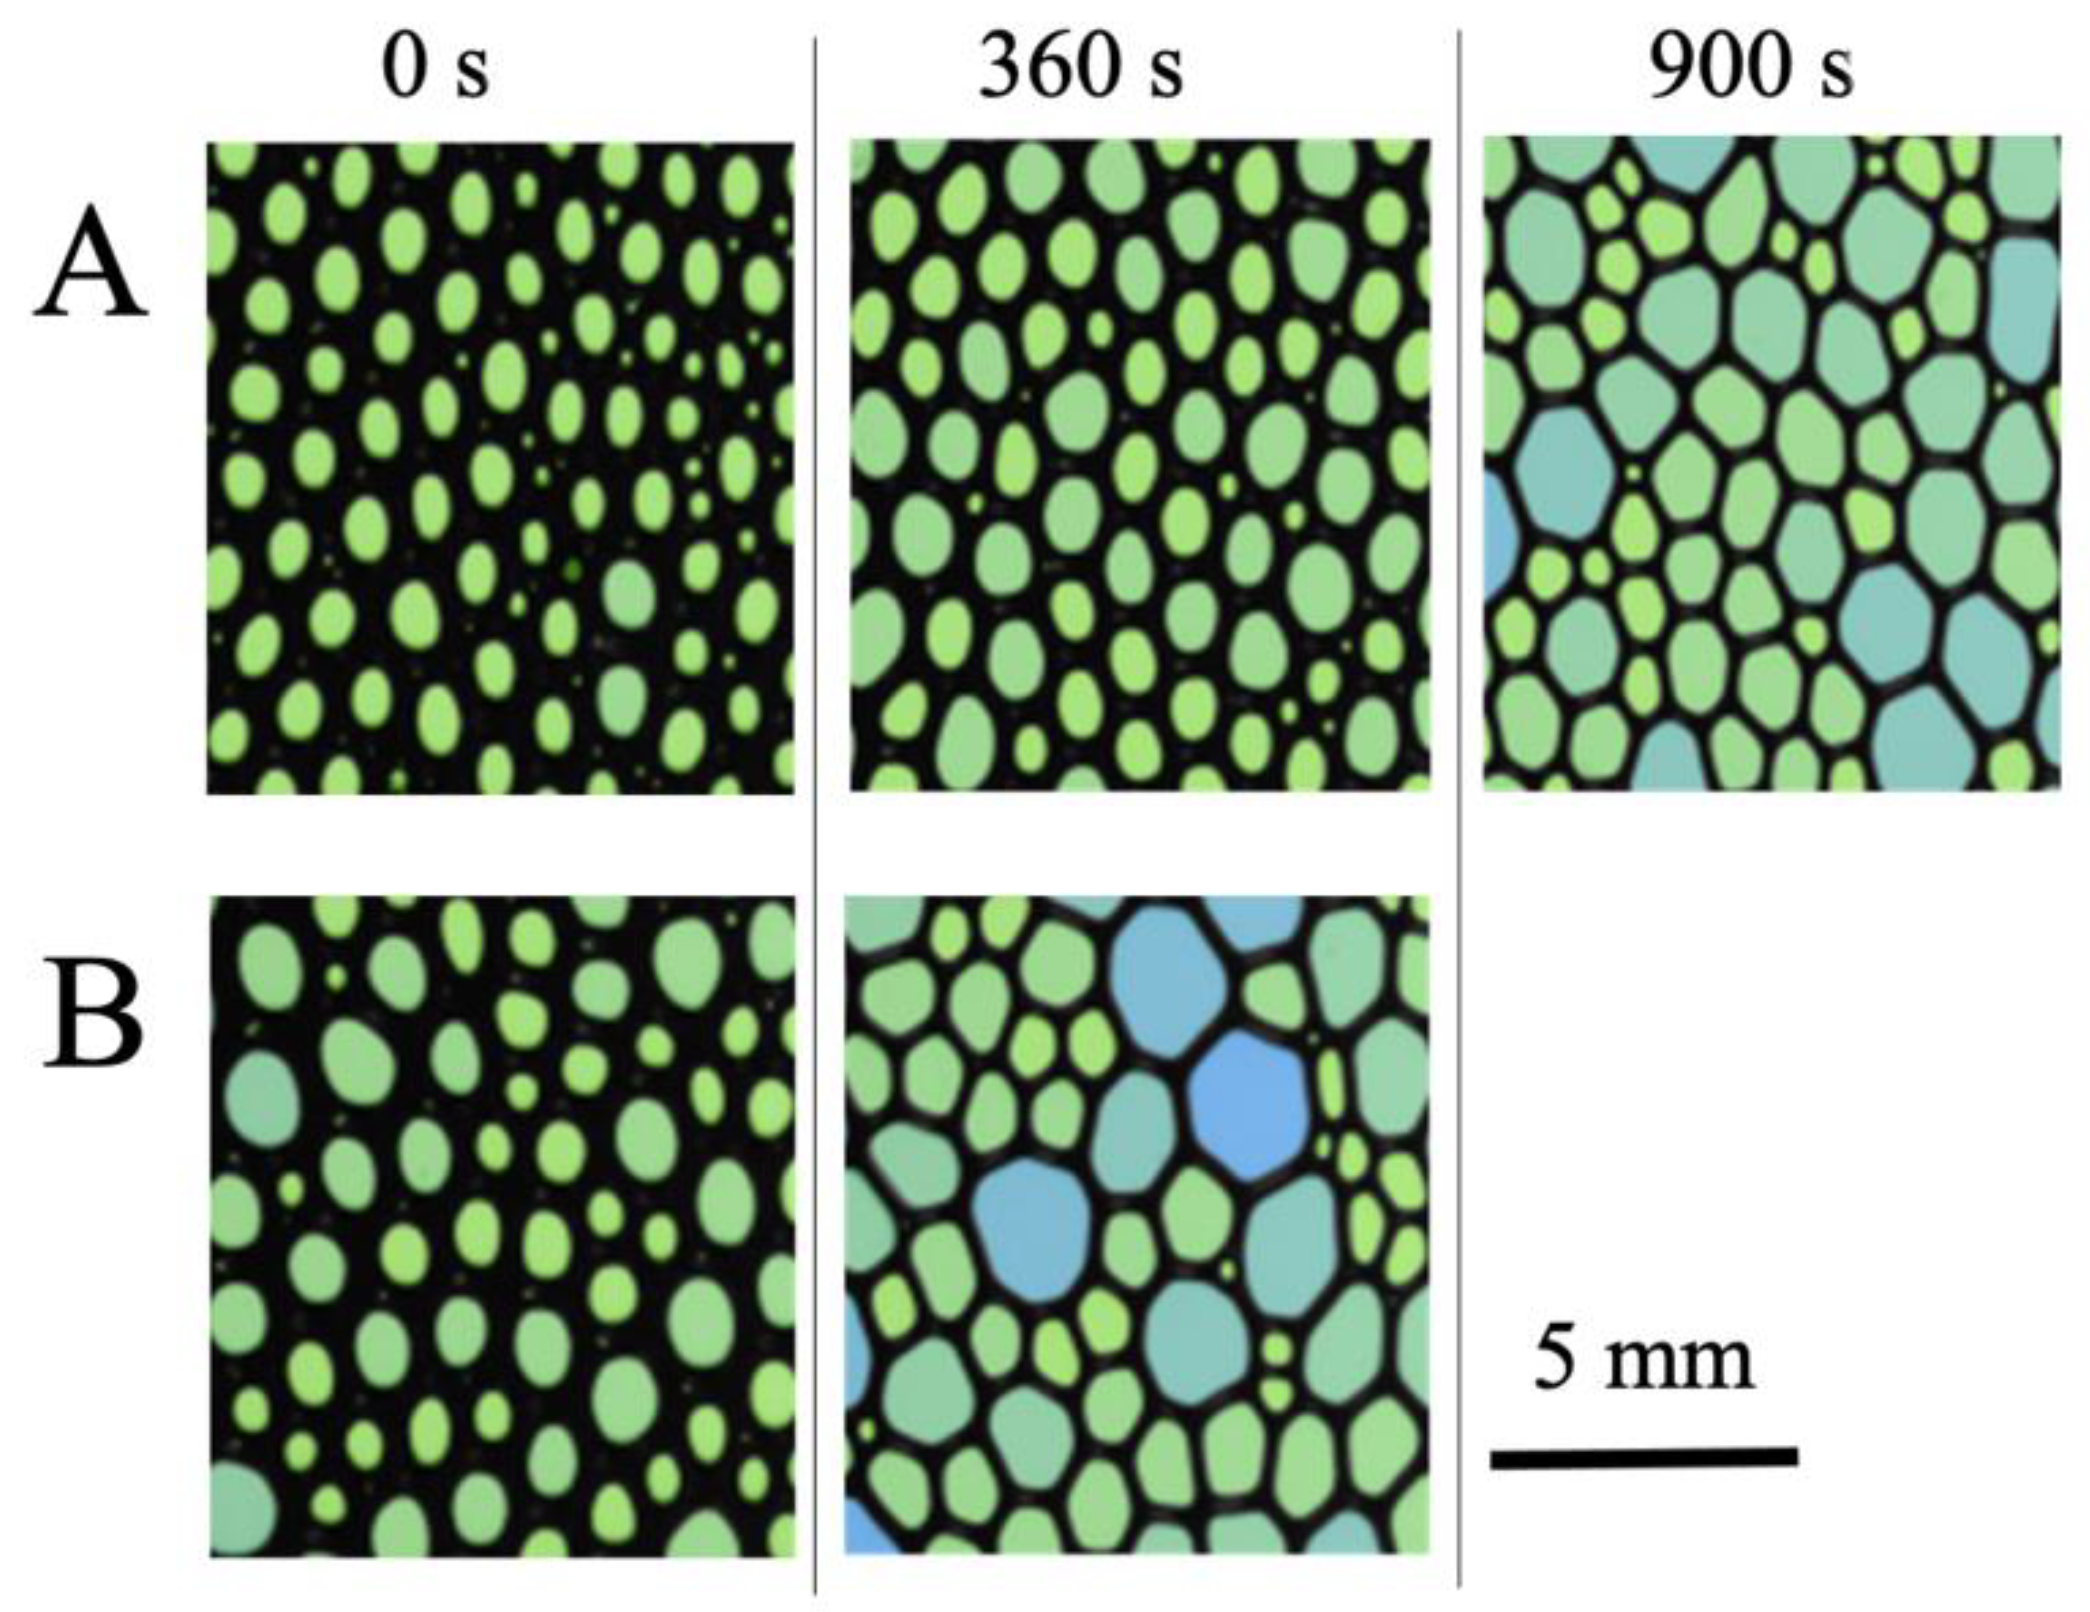
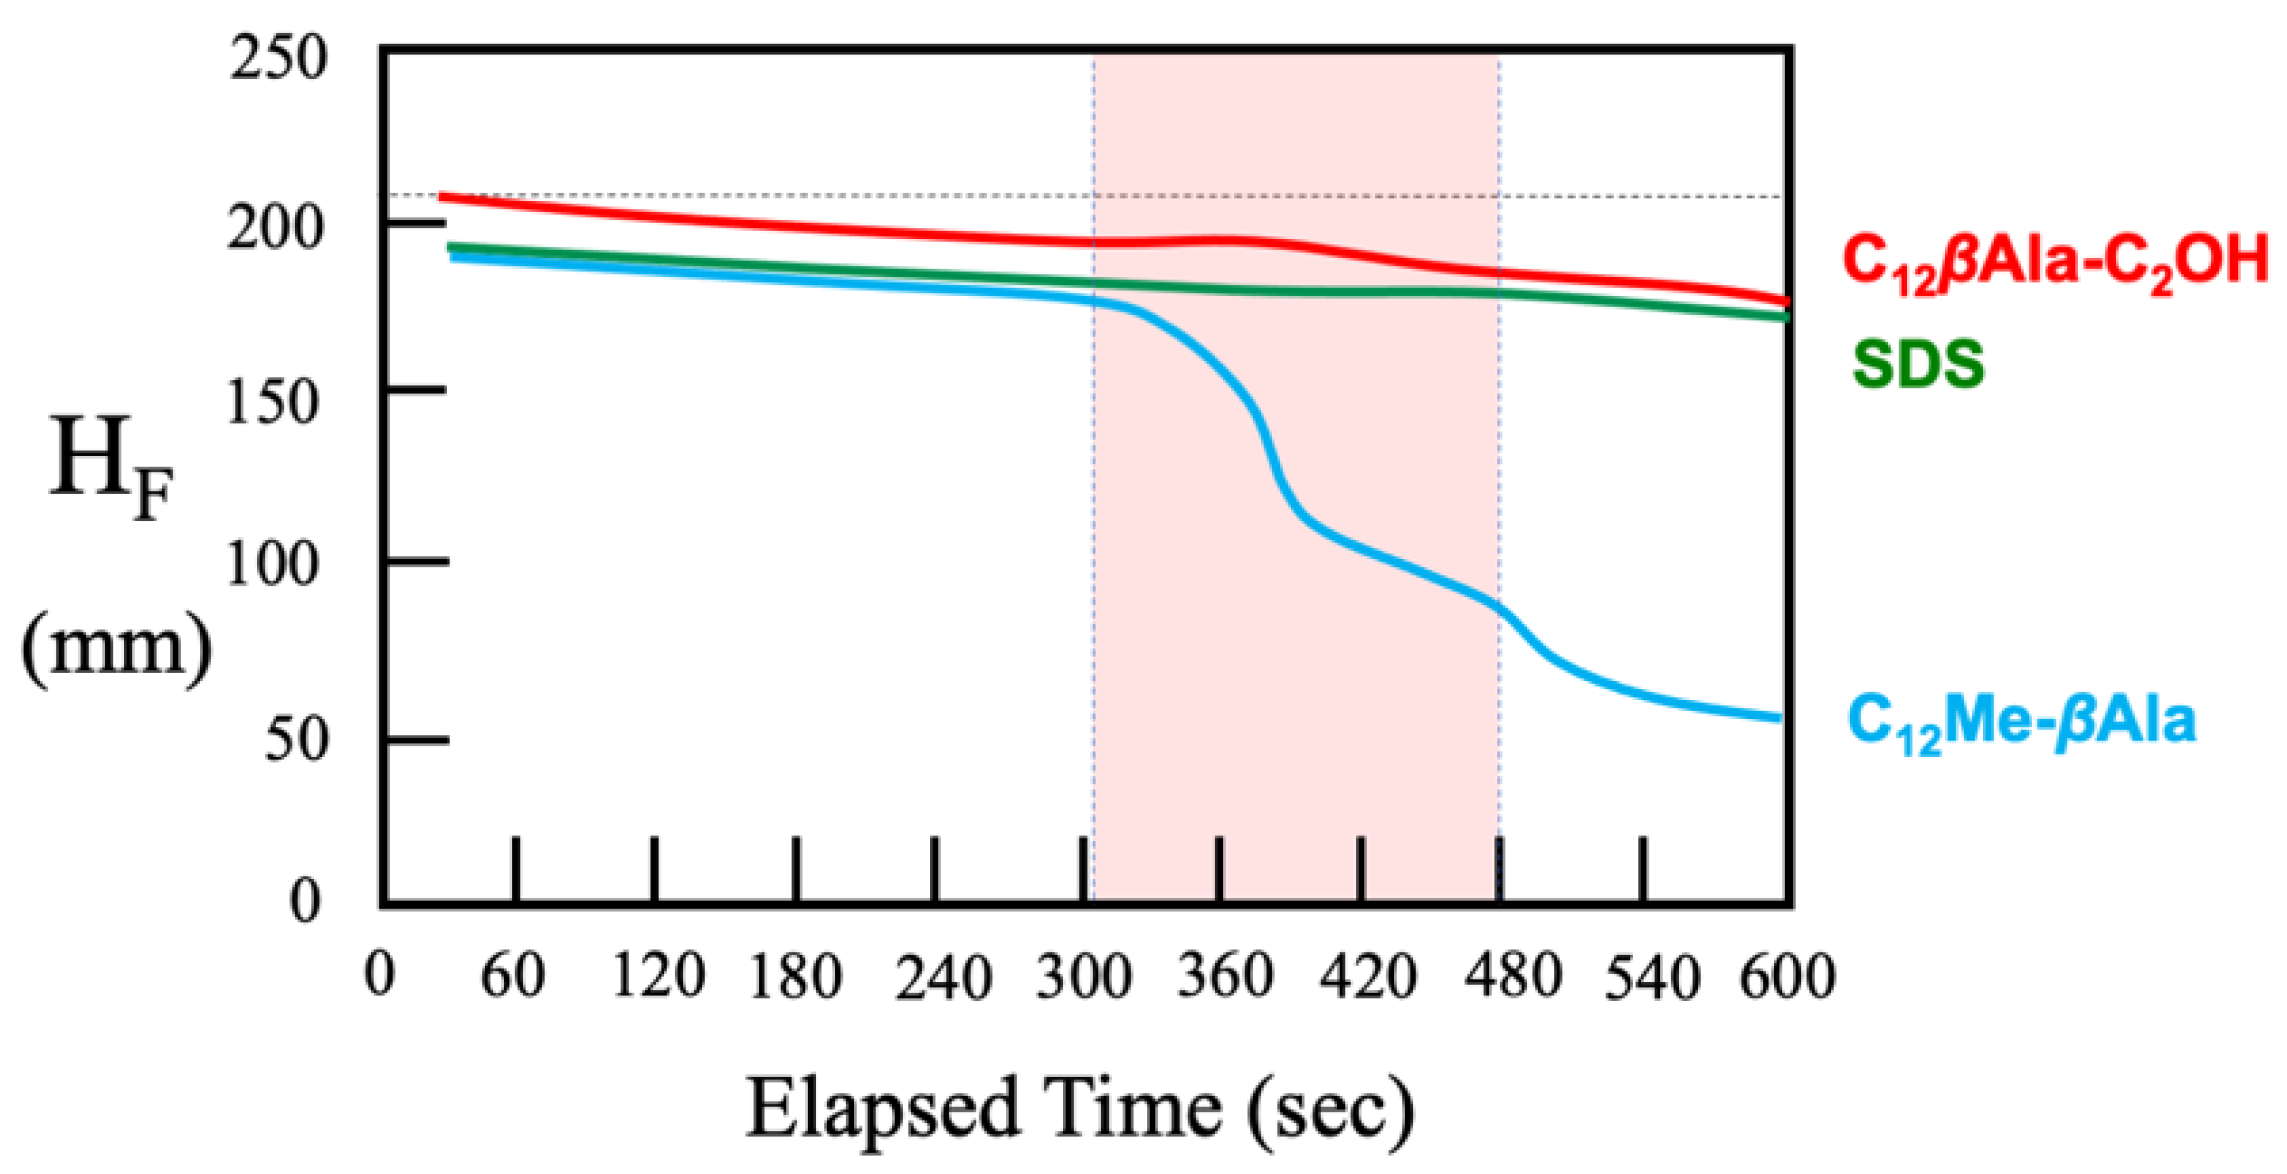
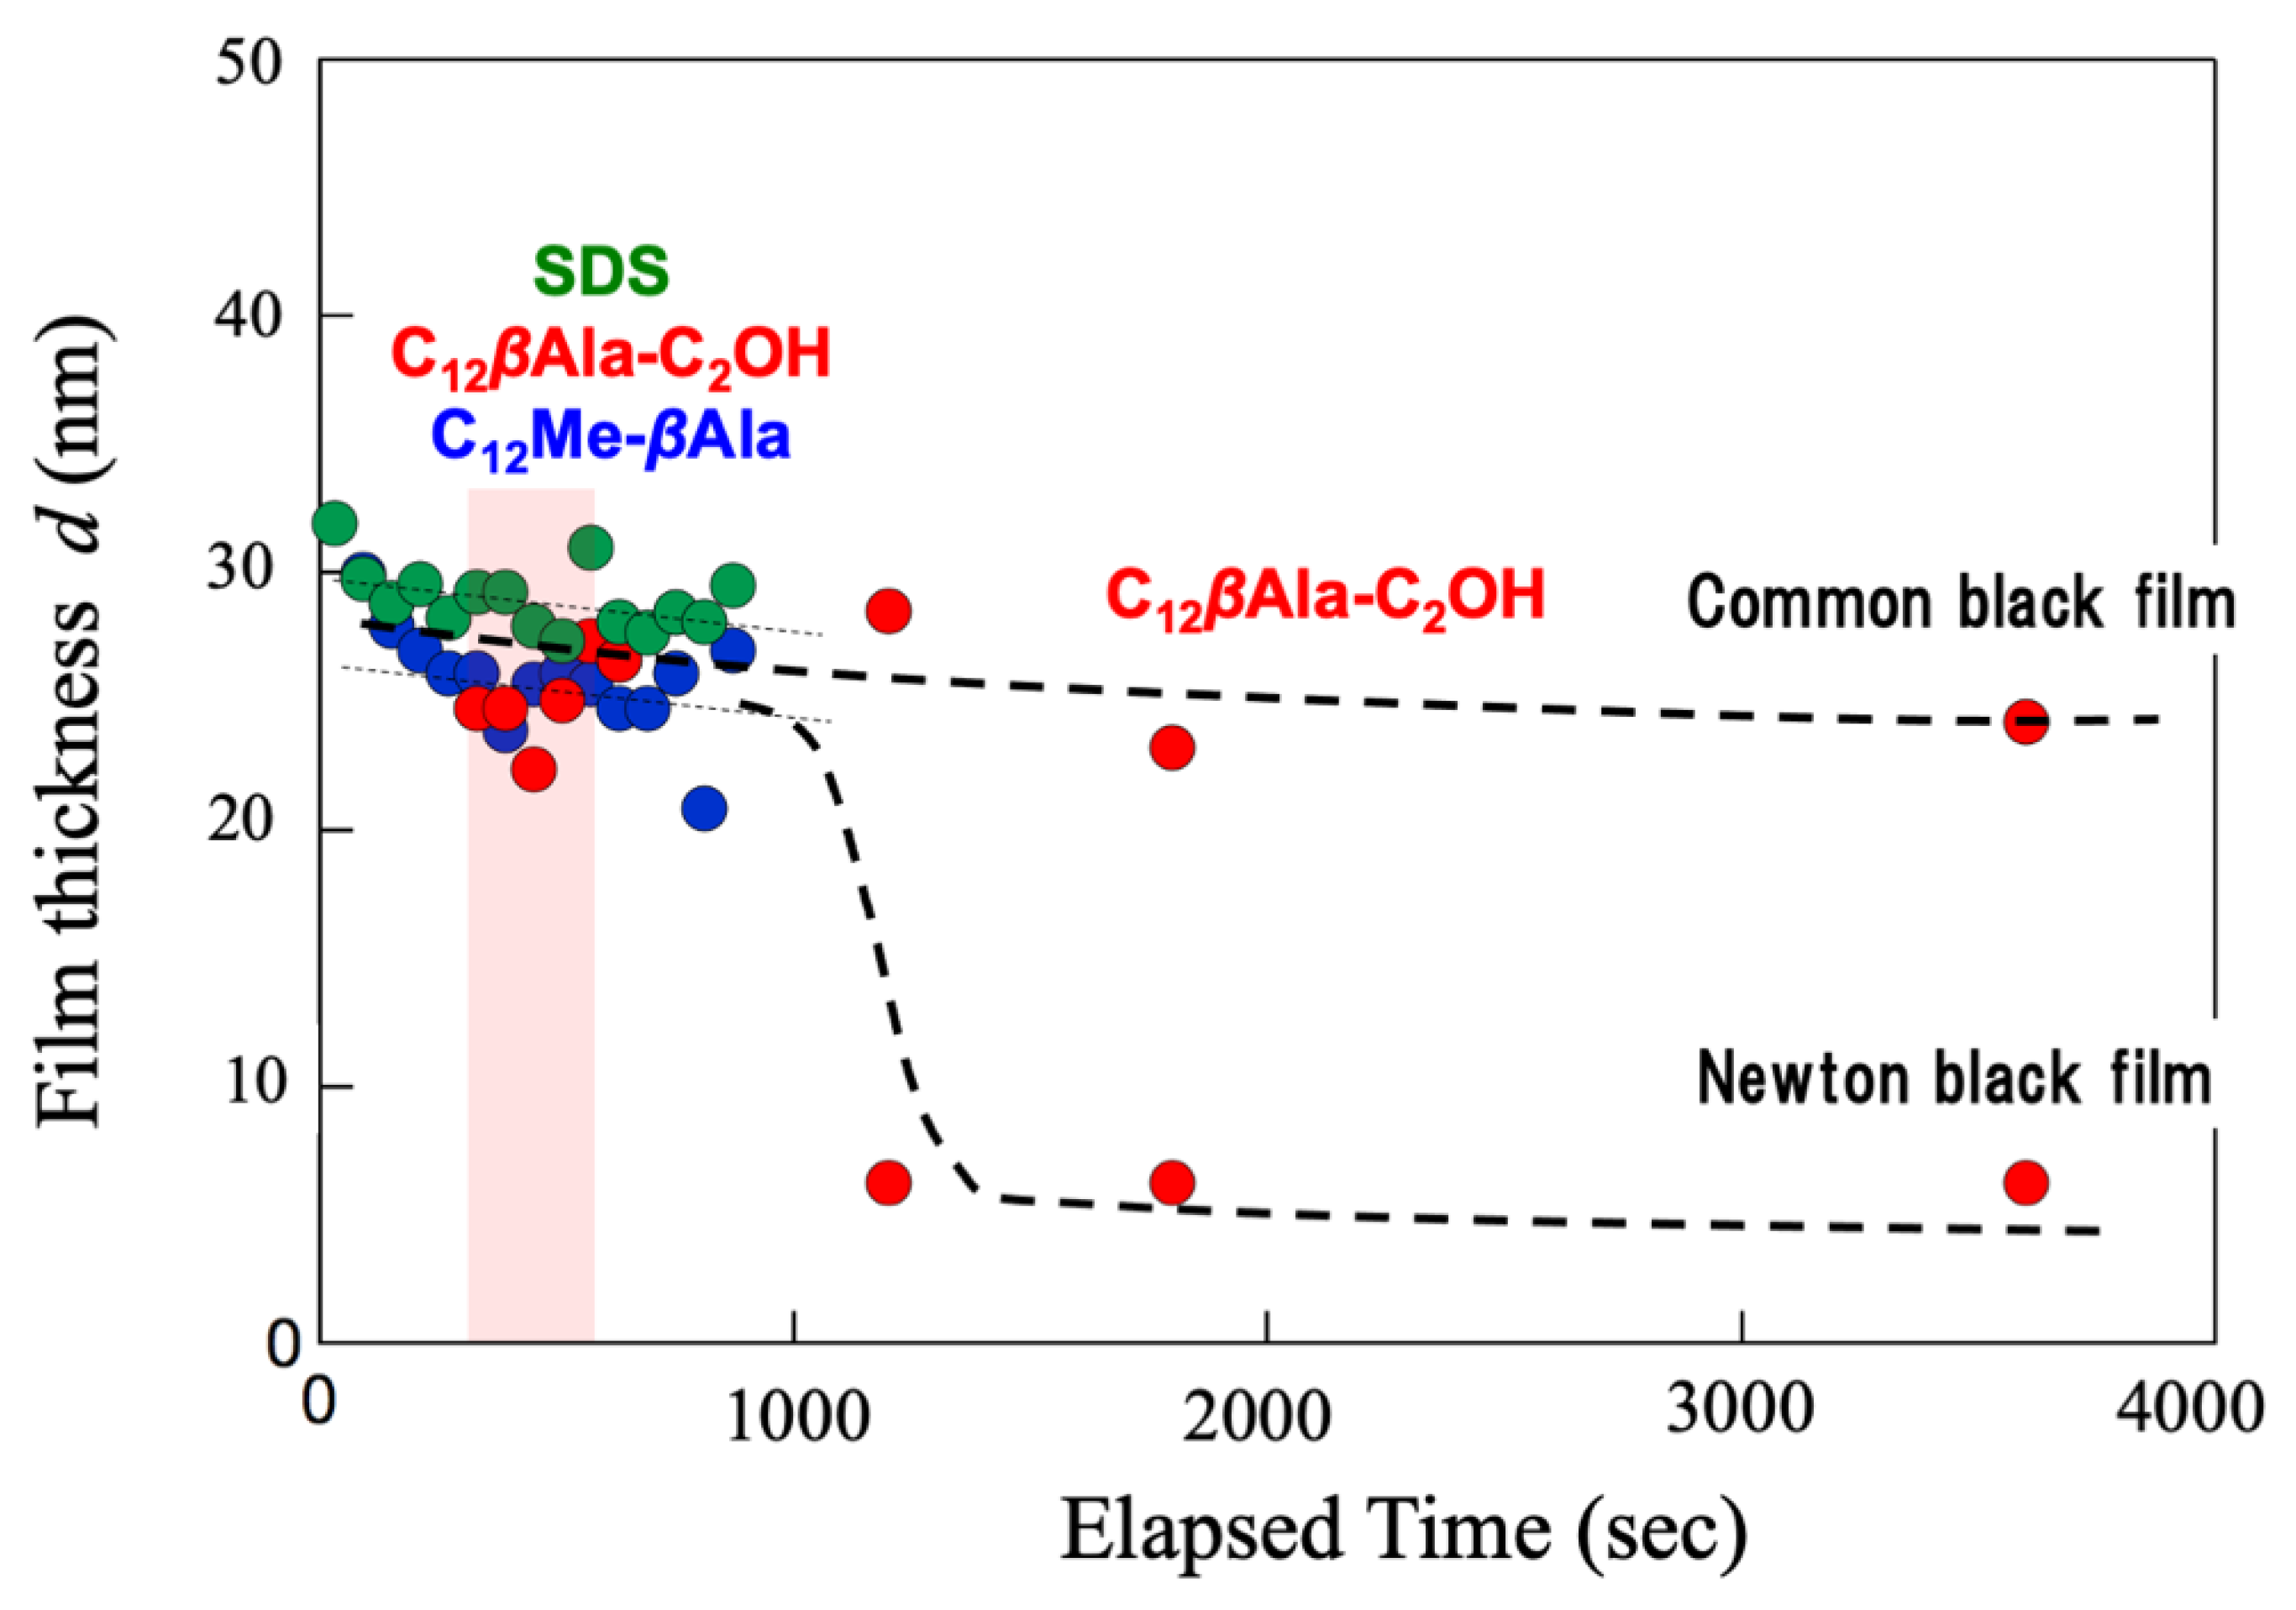
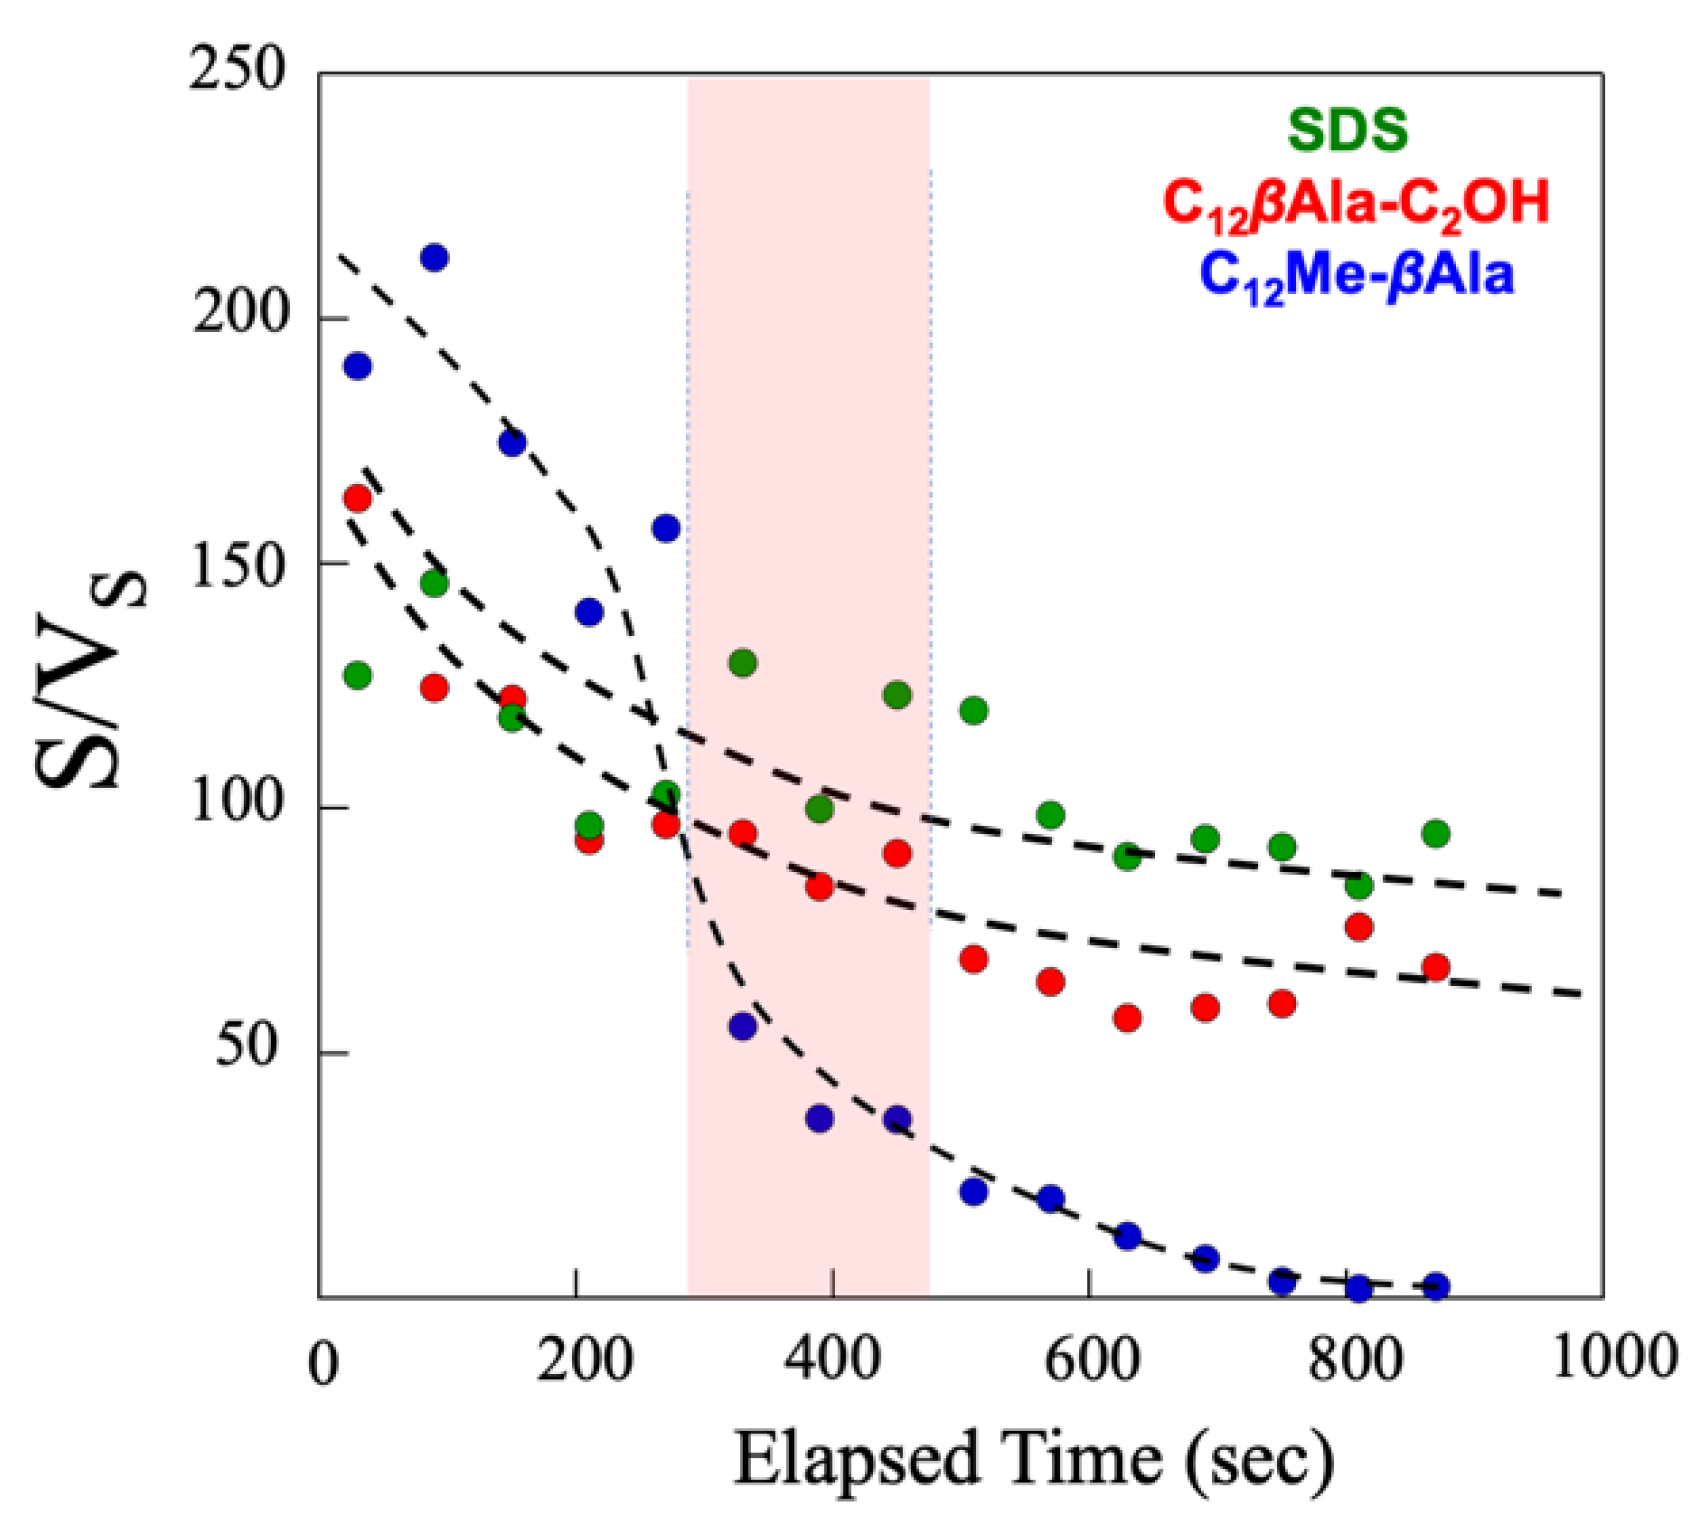
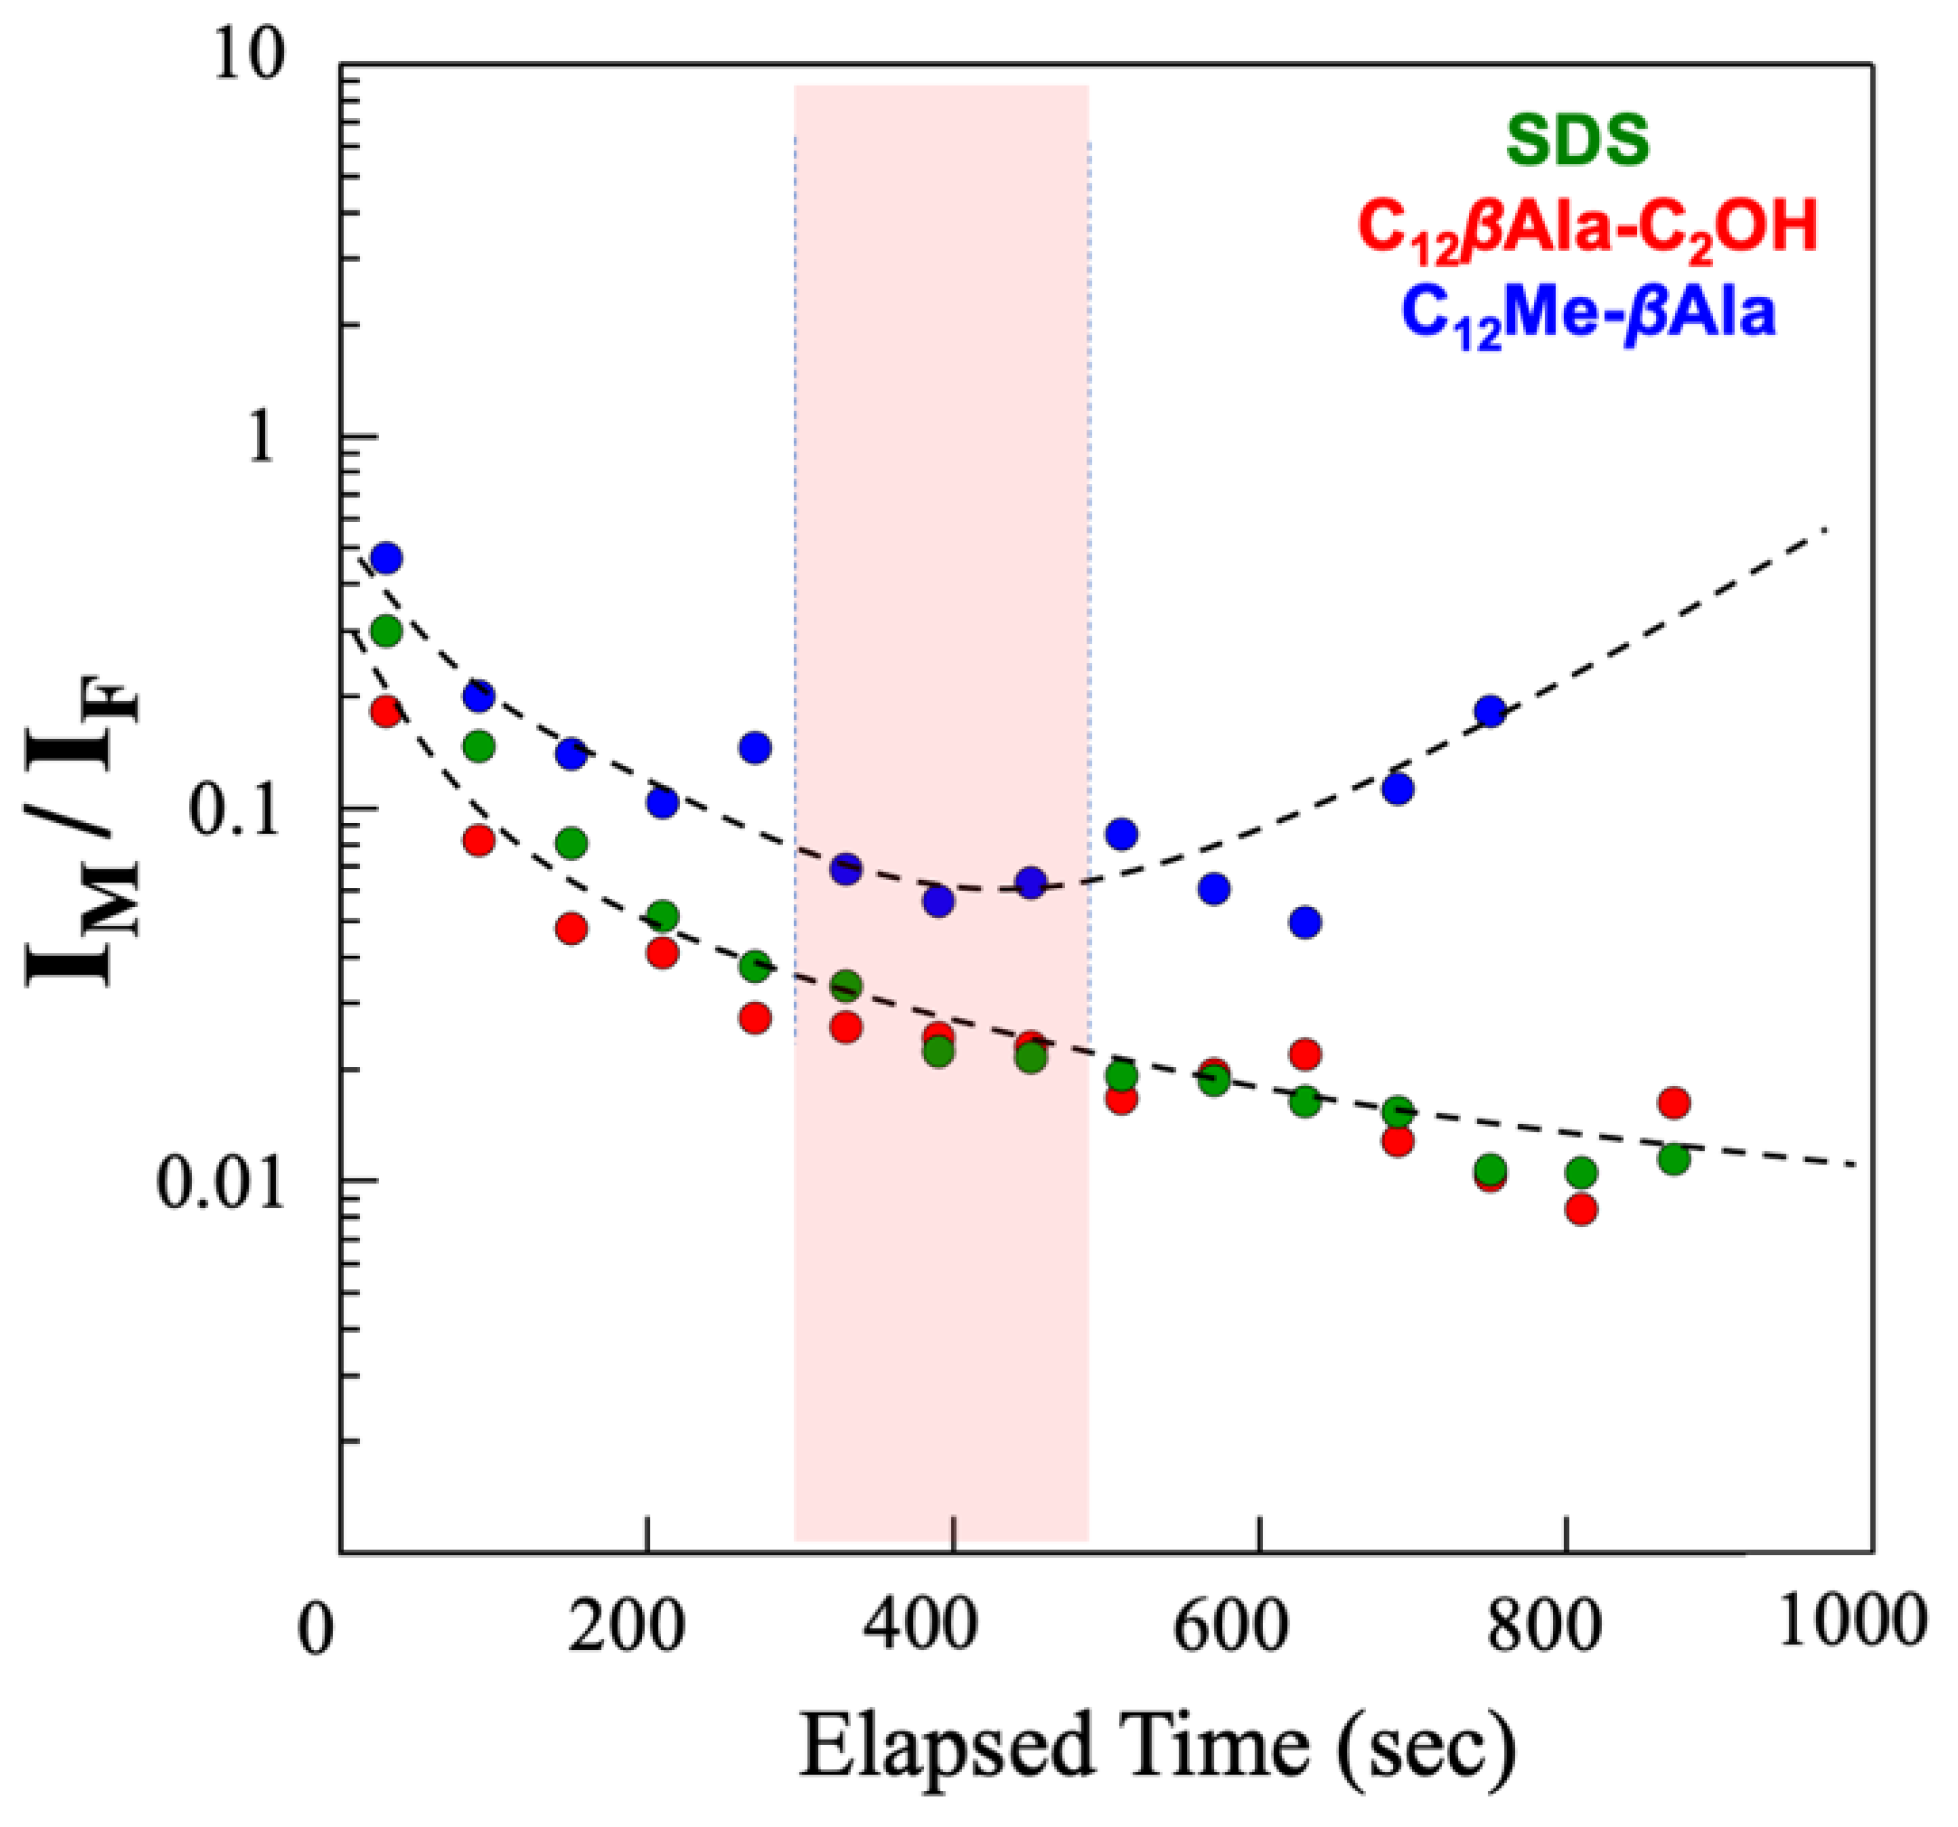
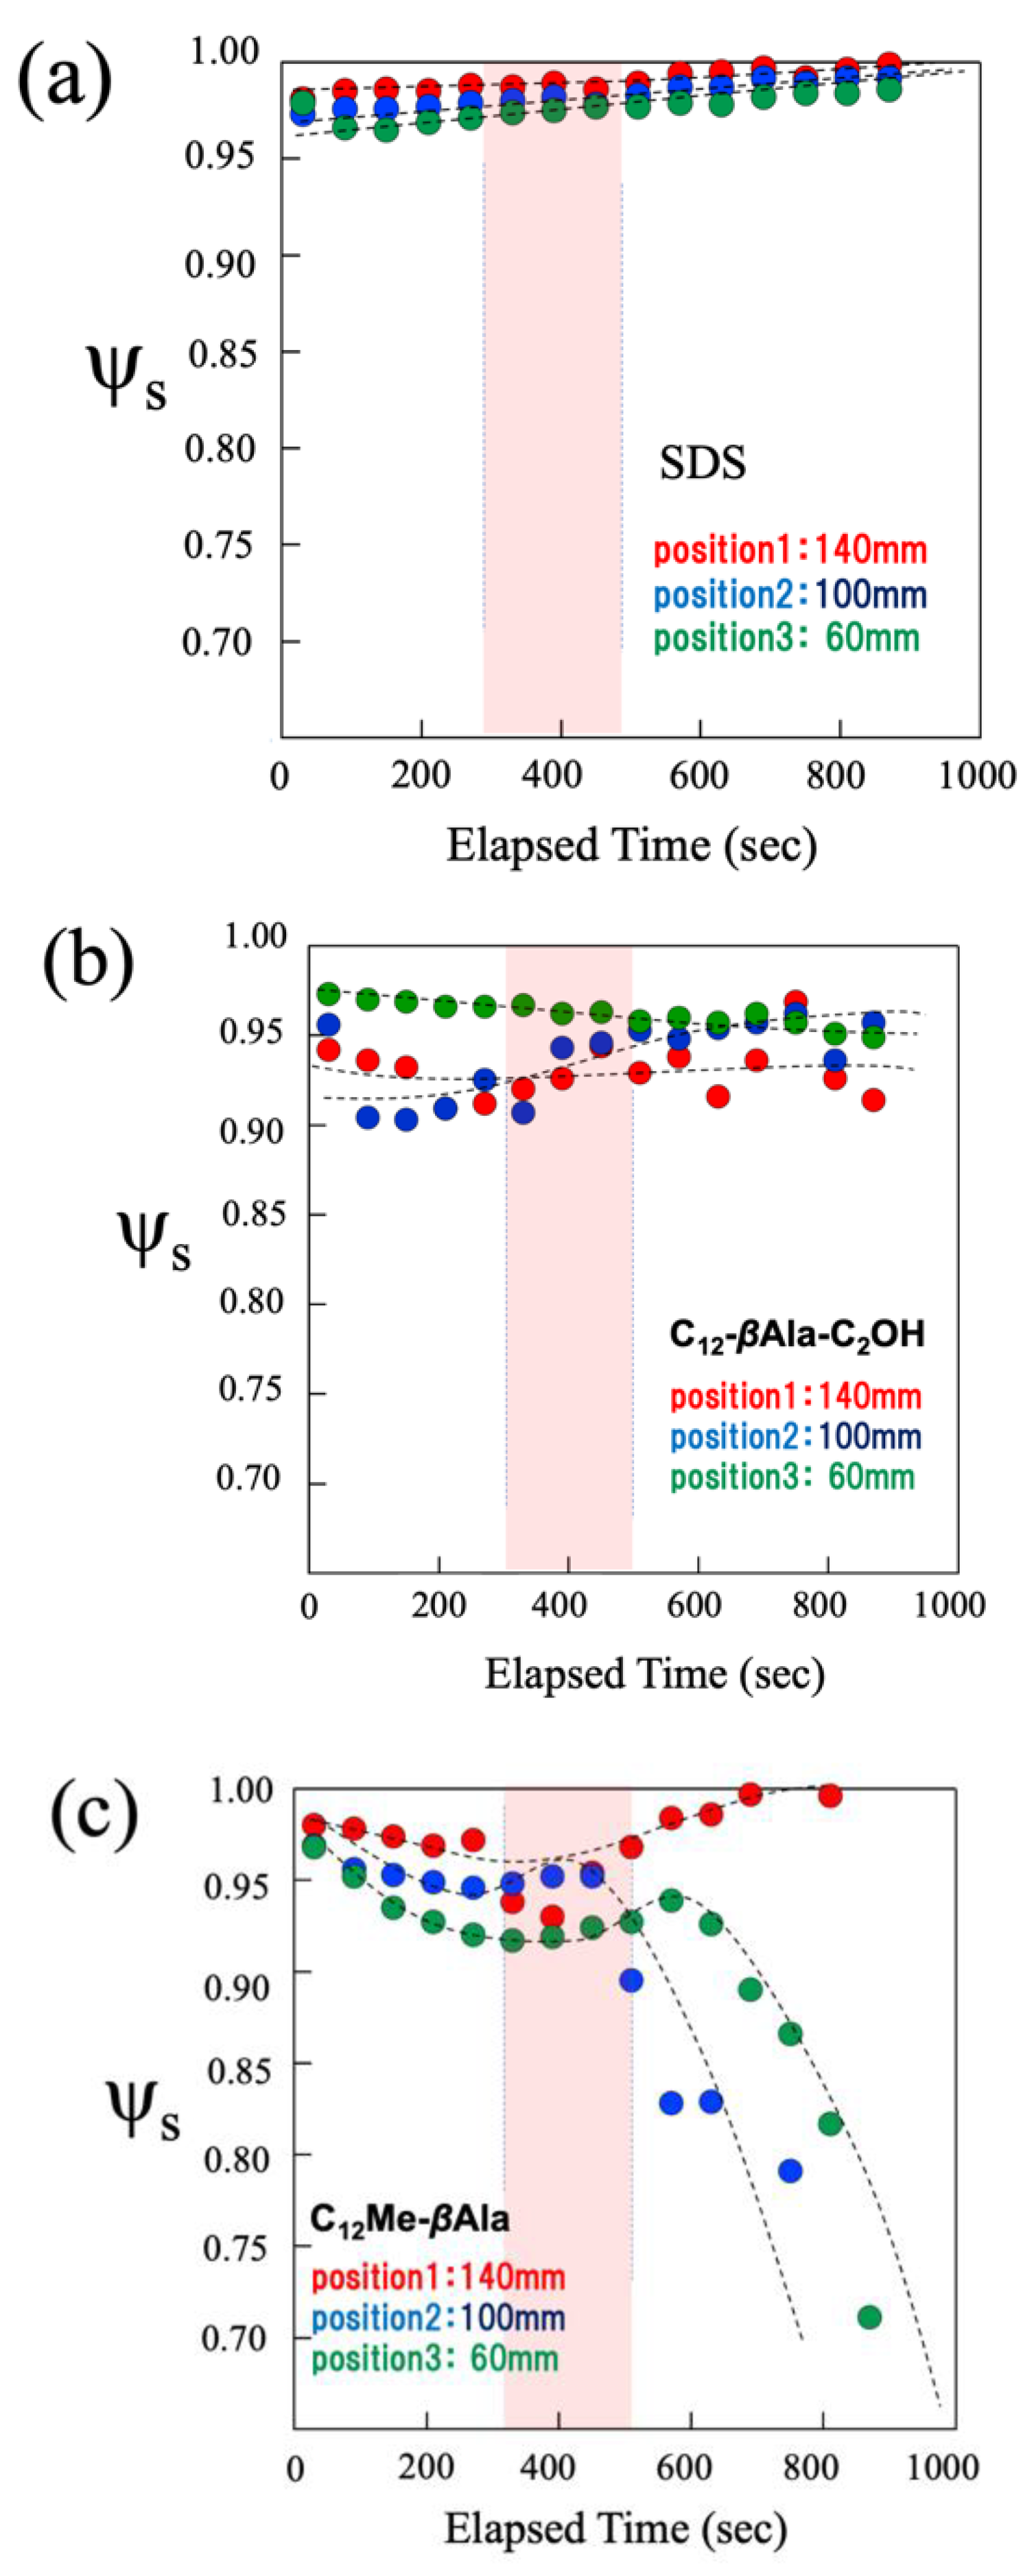
4.1. Macroscopic Behavior (Foam Stability)

Figure 7 shows images of foams attached to the glass wall observed by the dynamic foam analyzer. Images (A) and (B) were obtained for C12–EtOH–βAla and C12–Me–βAla. We stress that the foams shown in Figure 7 were strongly affected by the glass wall; the film on the glass was much thicker than that in a bulk foam, which was elucidated by SANS. The thickness of the ribs in Figure 7 was on the order of mm, whereas the film thickness on the order of nm was determined later using SANS measurements. At shorter times (after foaming and 600 s), the films (dark parts in the image) looked thicker, and as time increased they became thinner. This was due to the draining of water by gravity. The surfactant C12–EtOH–βAla (Figure 4c) exhibited excellent water retention since, even at 600 s (b), the ribs were thicker than those of C12–Me–βAla (Figure 4b). C12–EtOH–βAla was more stable without coagulation, whereas C12–Me–βAla tended to coagulate faster and collapse after 10 min.
Figure 8 shows the evolution of foam heights obtained using the dynamic foam analyzer. The heights of the C12–EtOH–βAla and SDS foams gradually decreased over 600 s, while that of C12–Me–βAla drastically decreased after 300 s and dropped to 50 mm after 600 s. The time domain from 300 to 480 s is colored red in Figure 8.
Figure 9 shows the height of the C12–EtOH–βAla solution appearing at the bottom (HL), normalized by HL,0 at t = 0. The height of the foam, indicated by HF, was related to that shown in Figure 8. The sample cell was employed for SANS. The height (HL) was zero immediately after foaming at t = 0 s and recovered by 80% at 100 s and by 100% at 200 s.

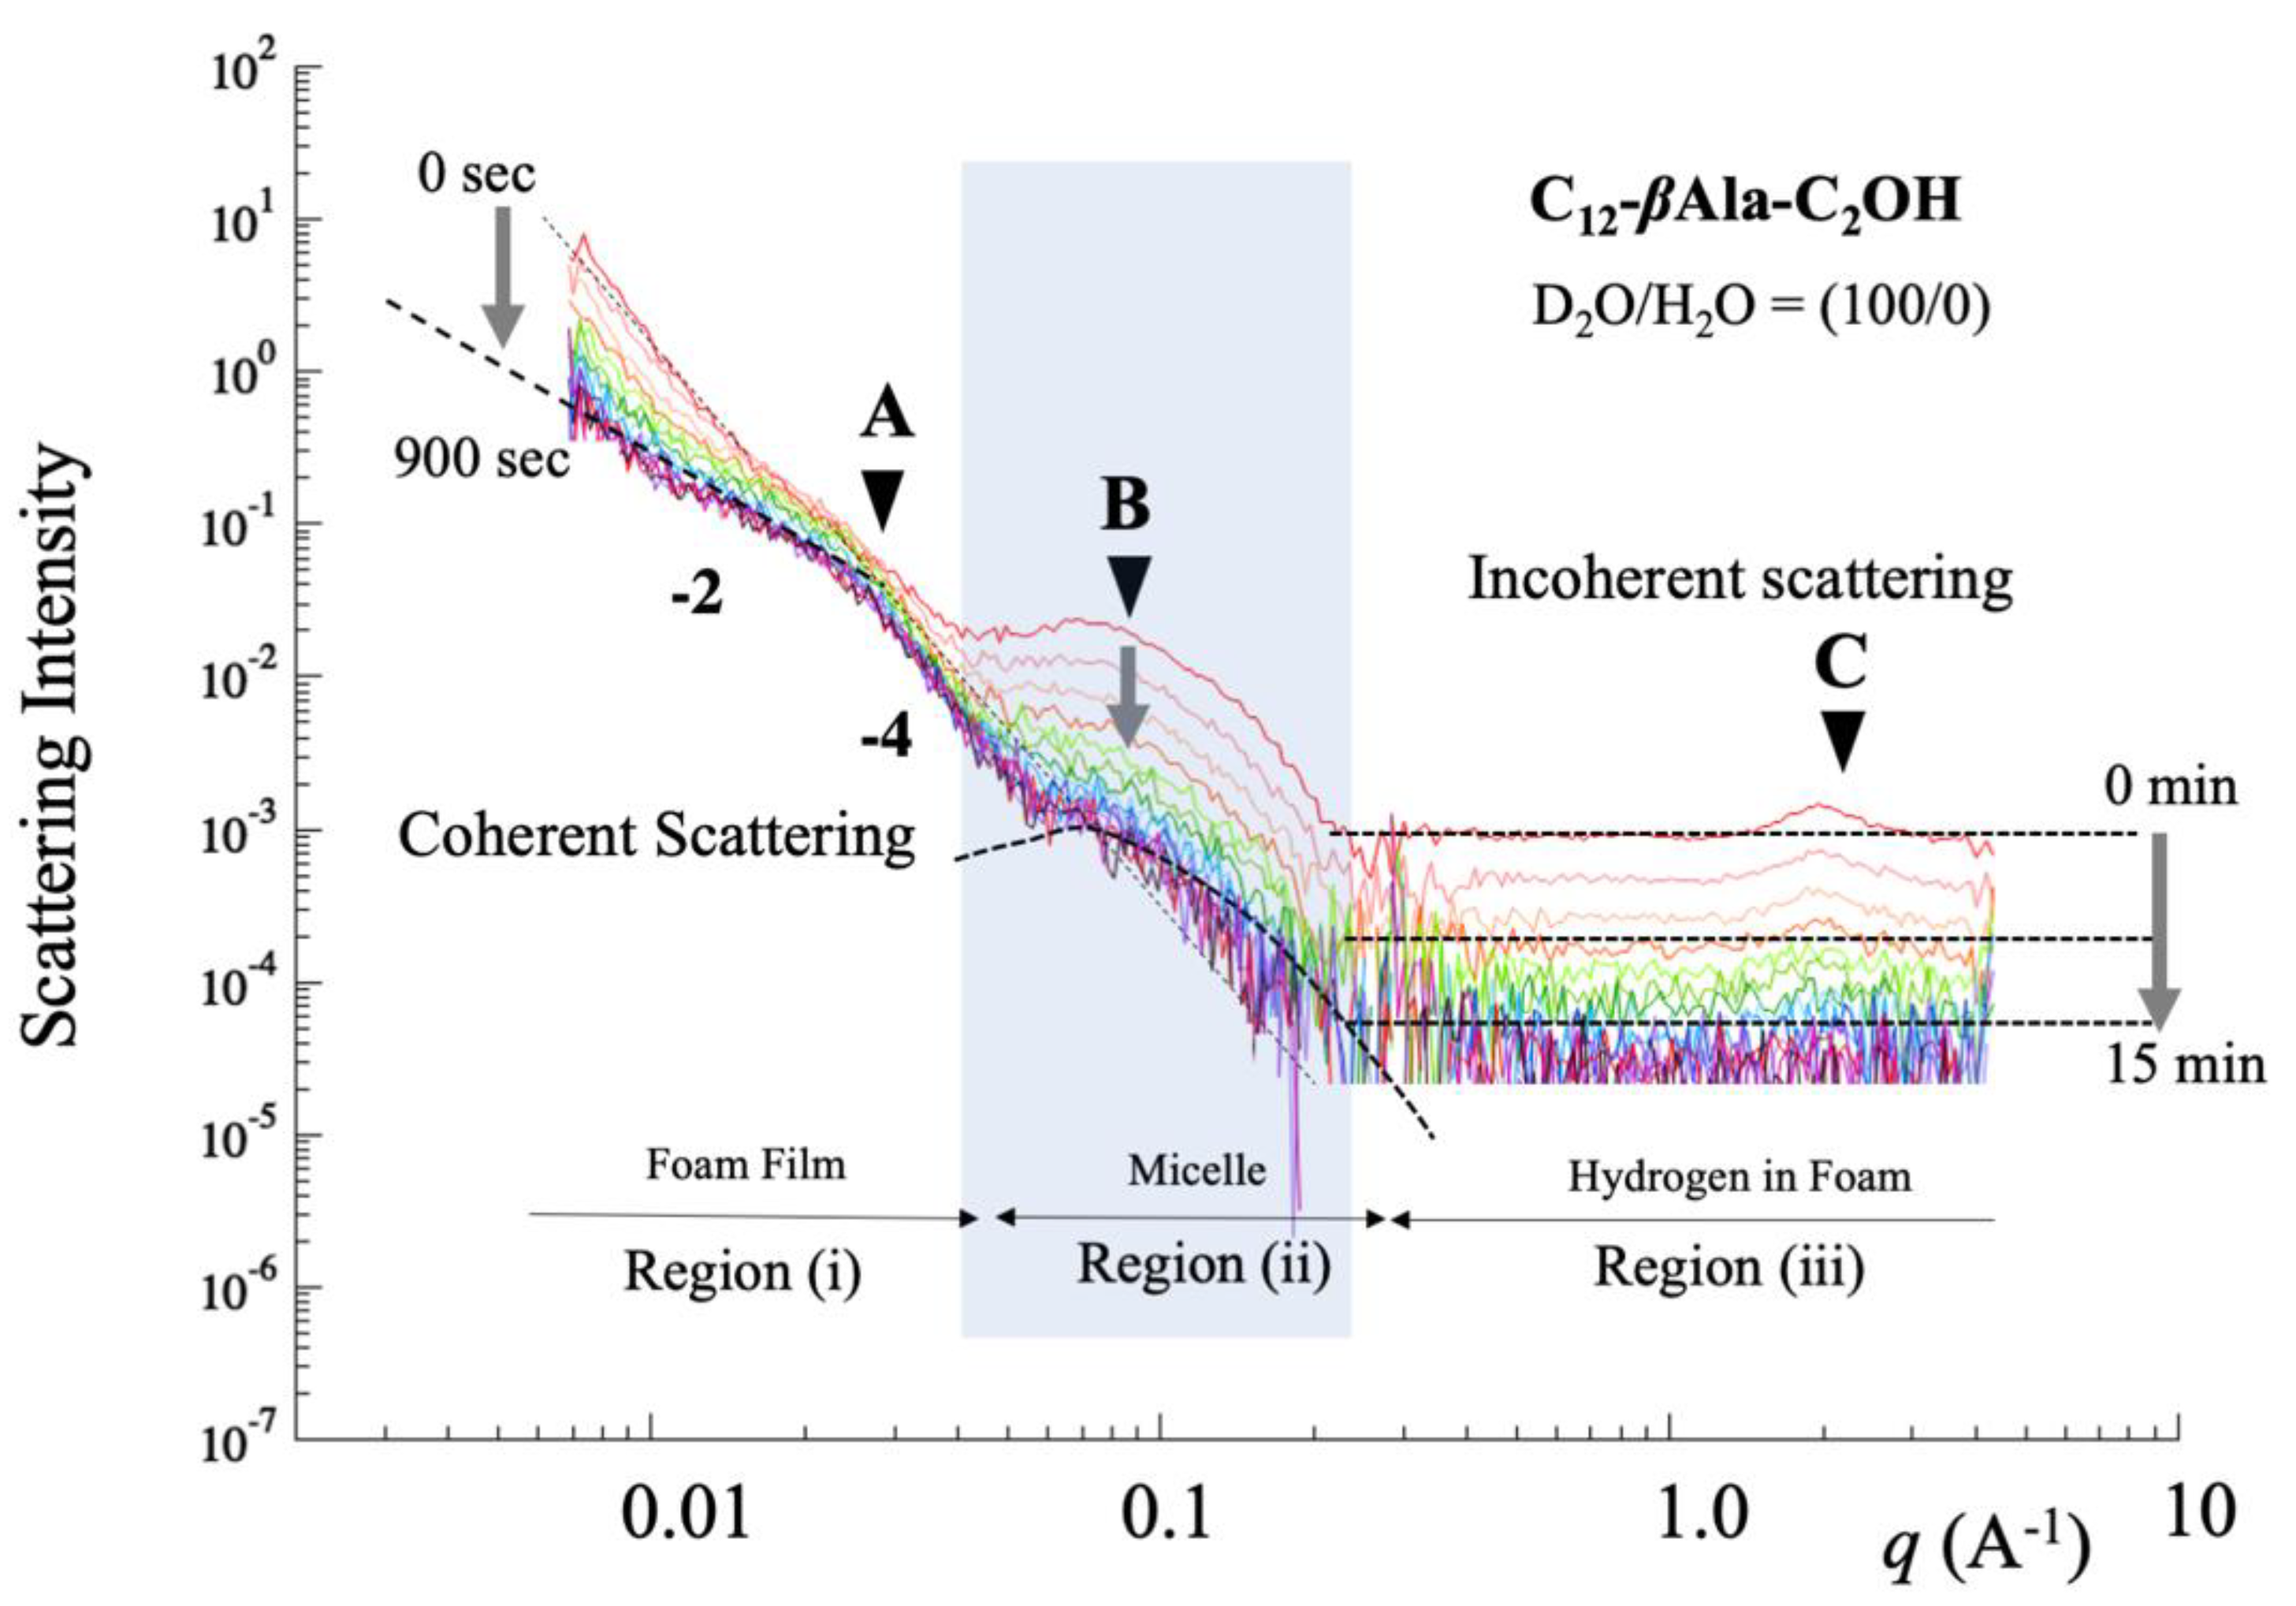
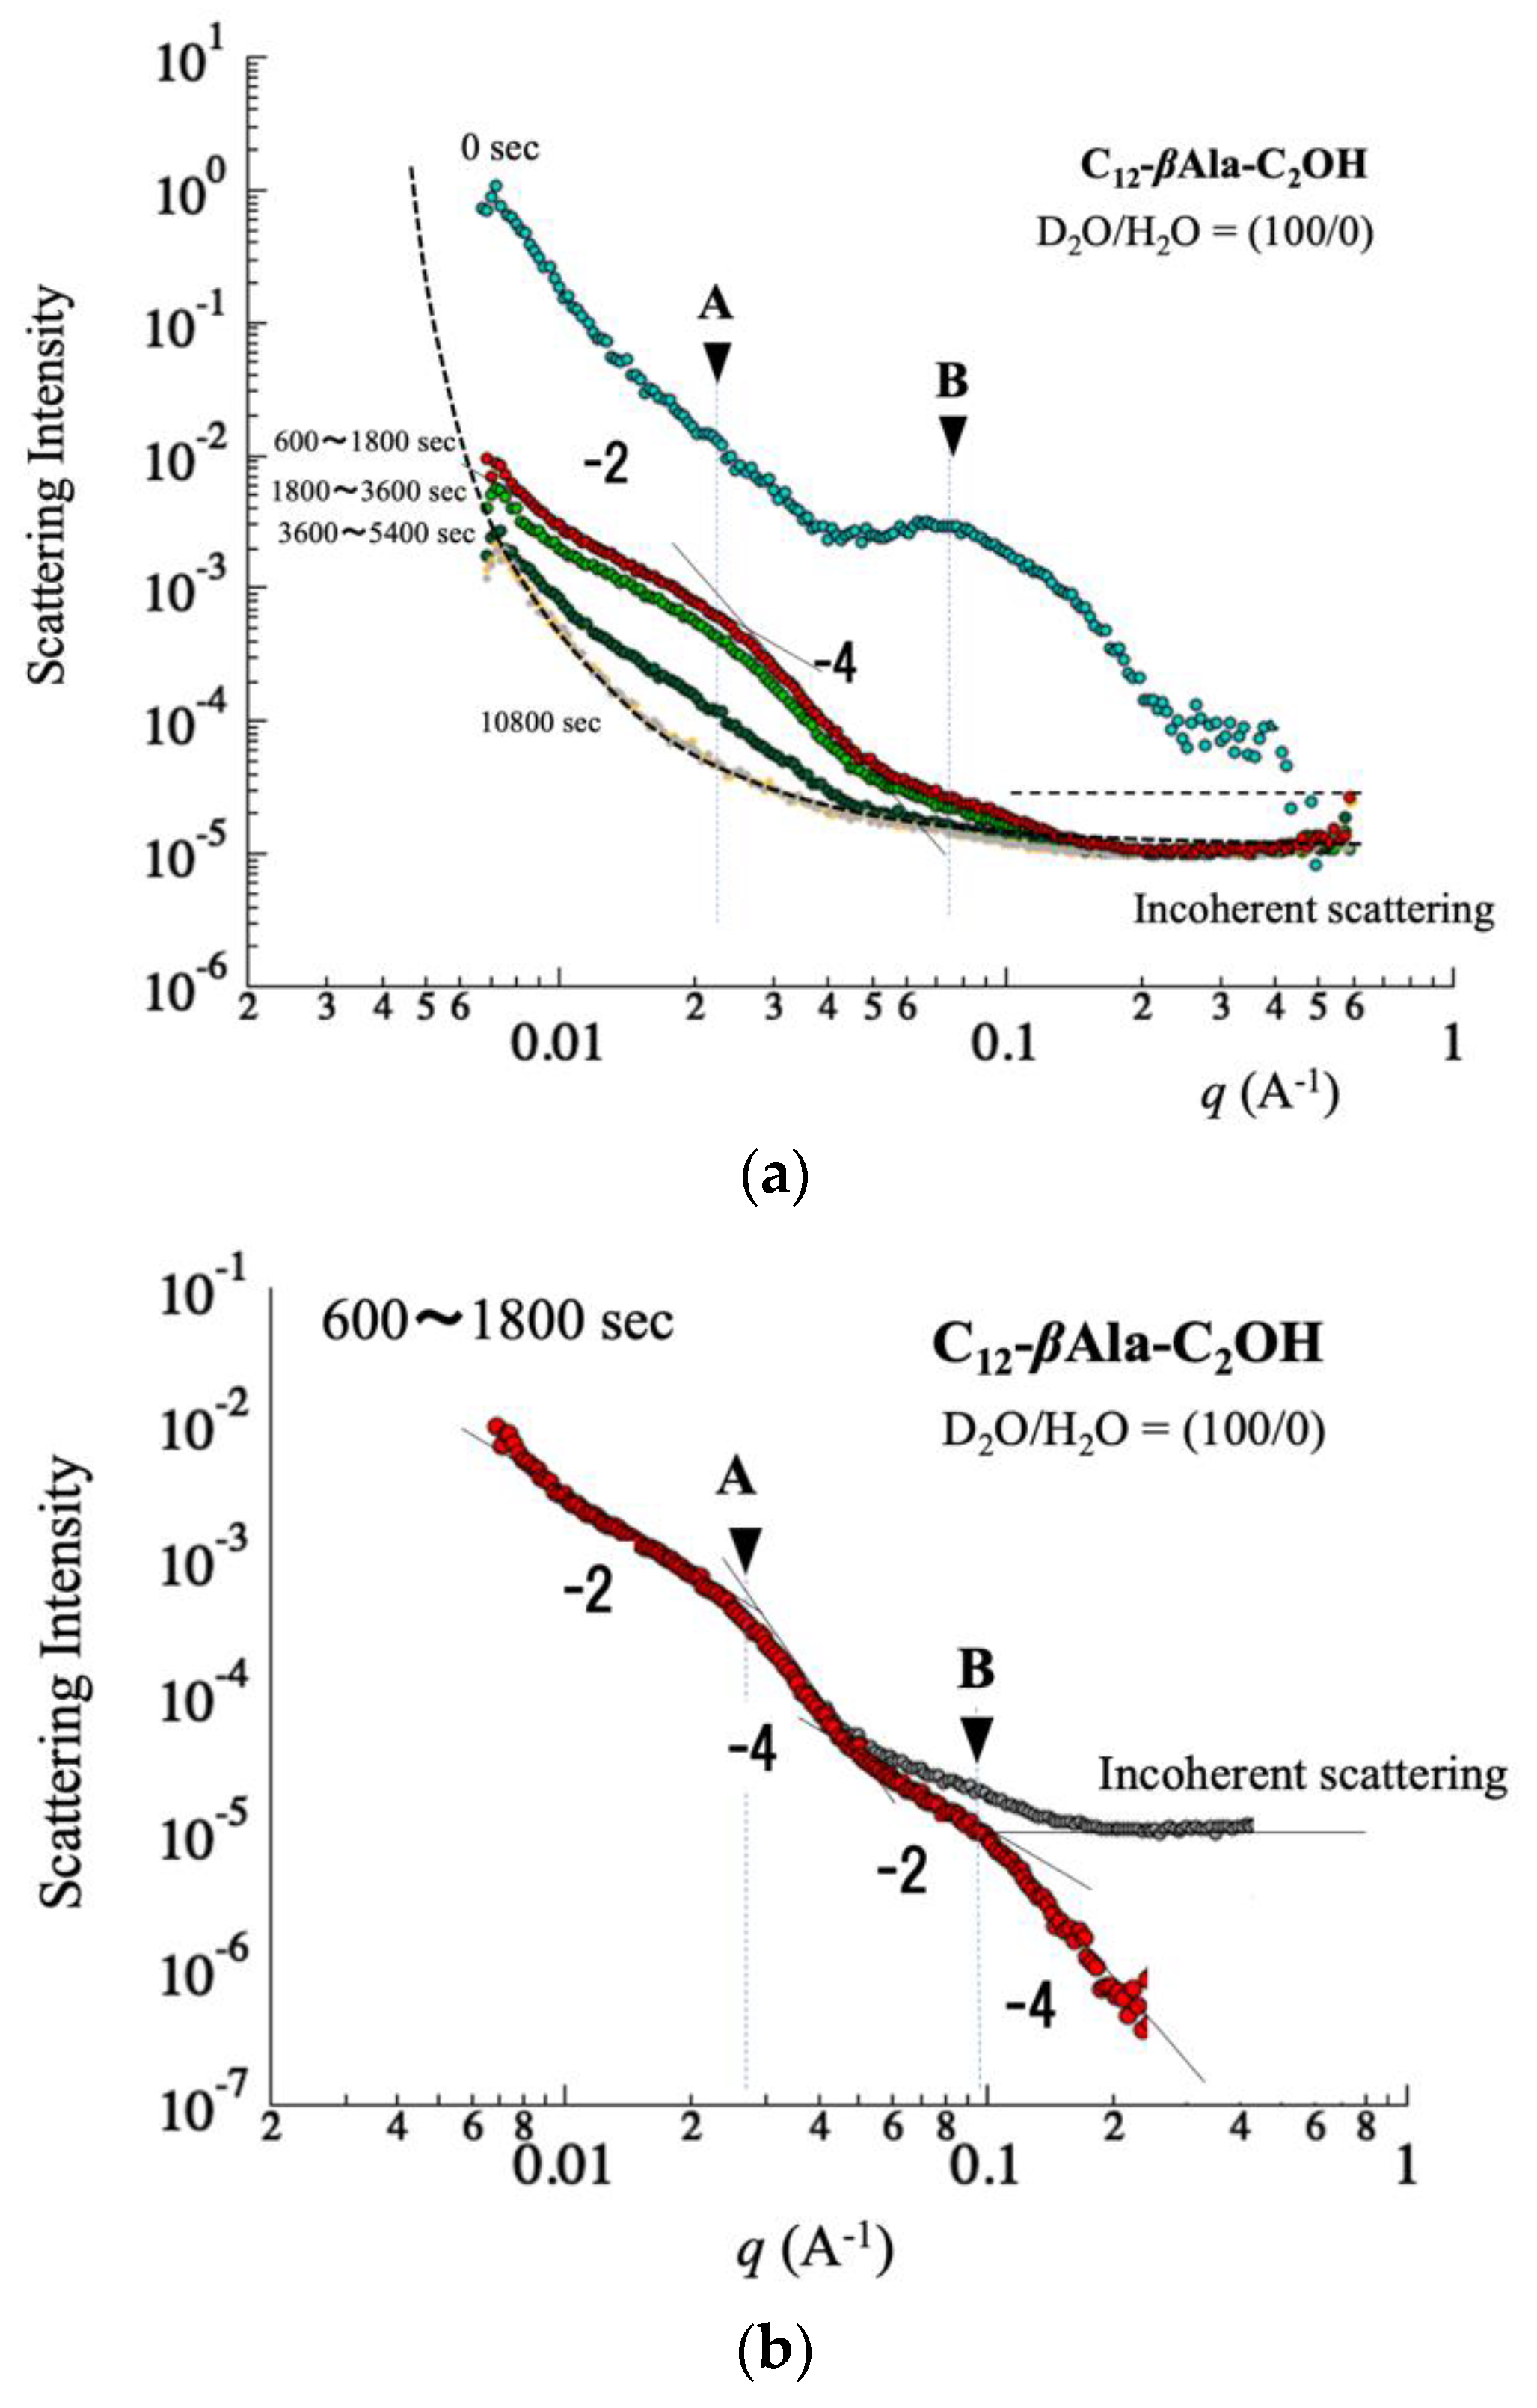
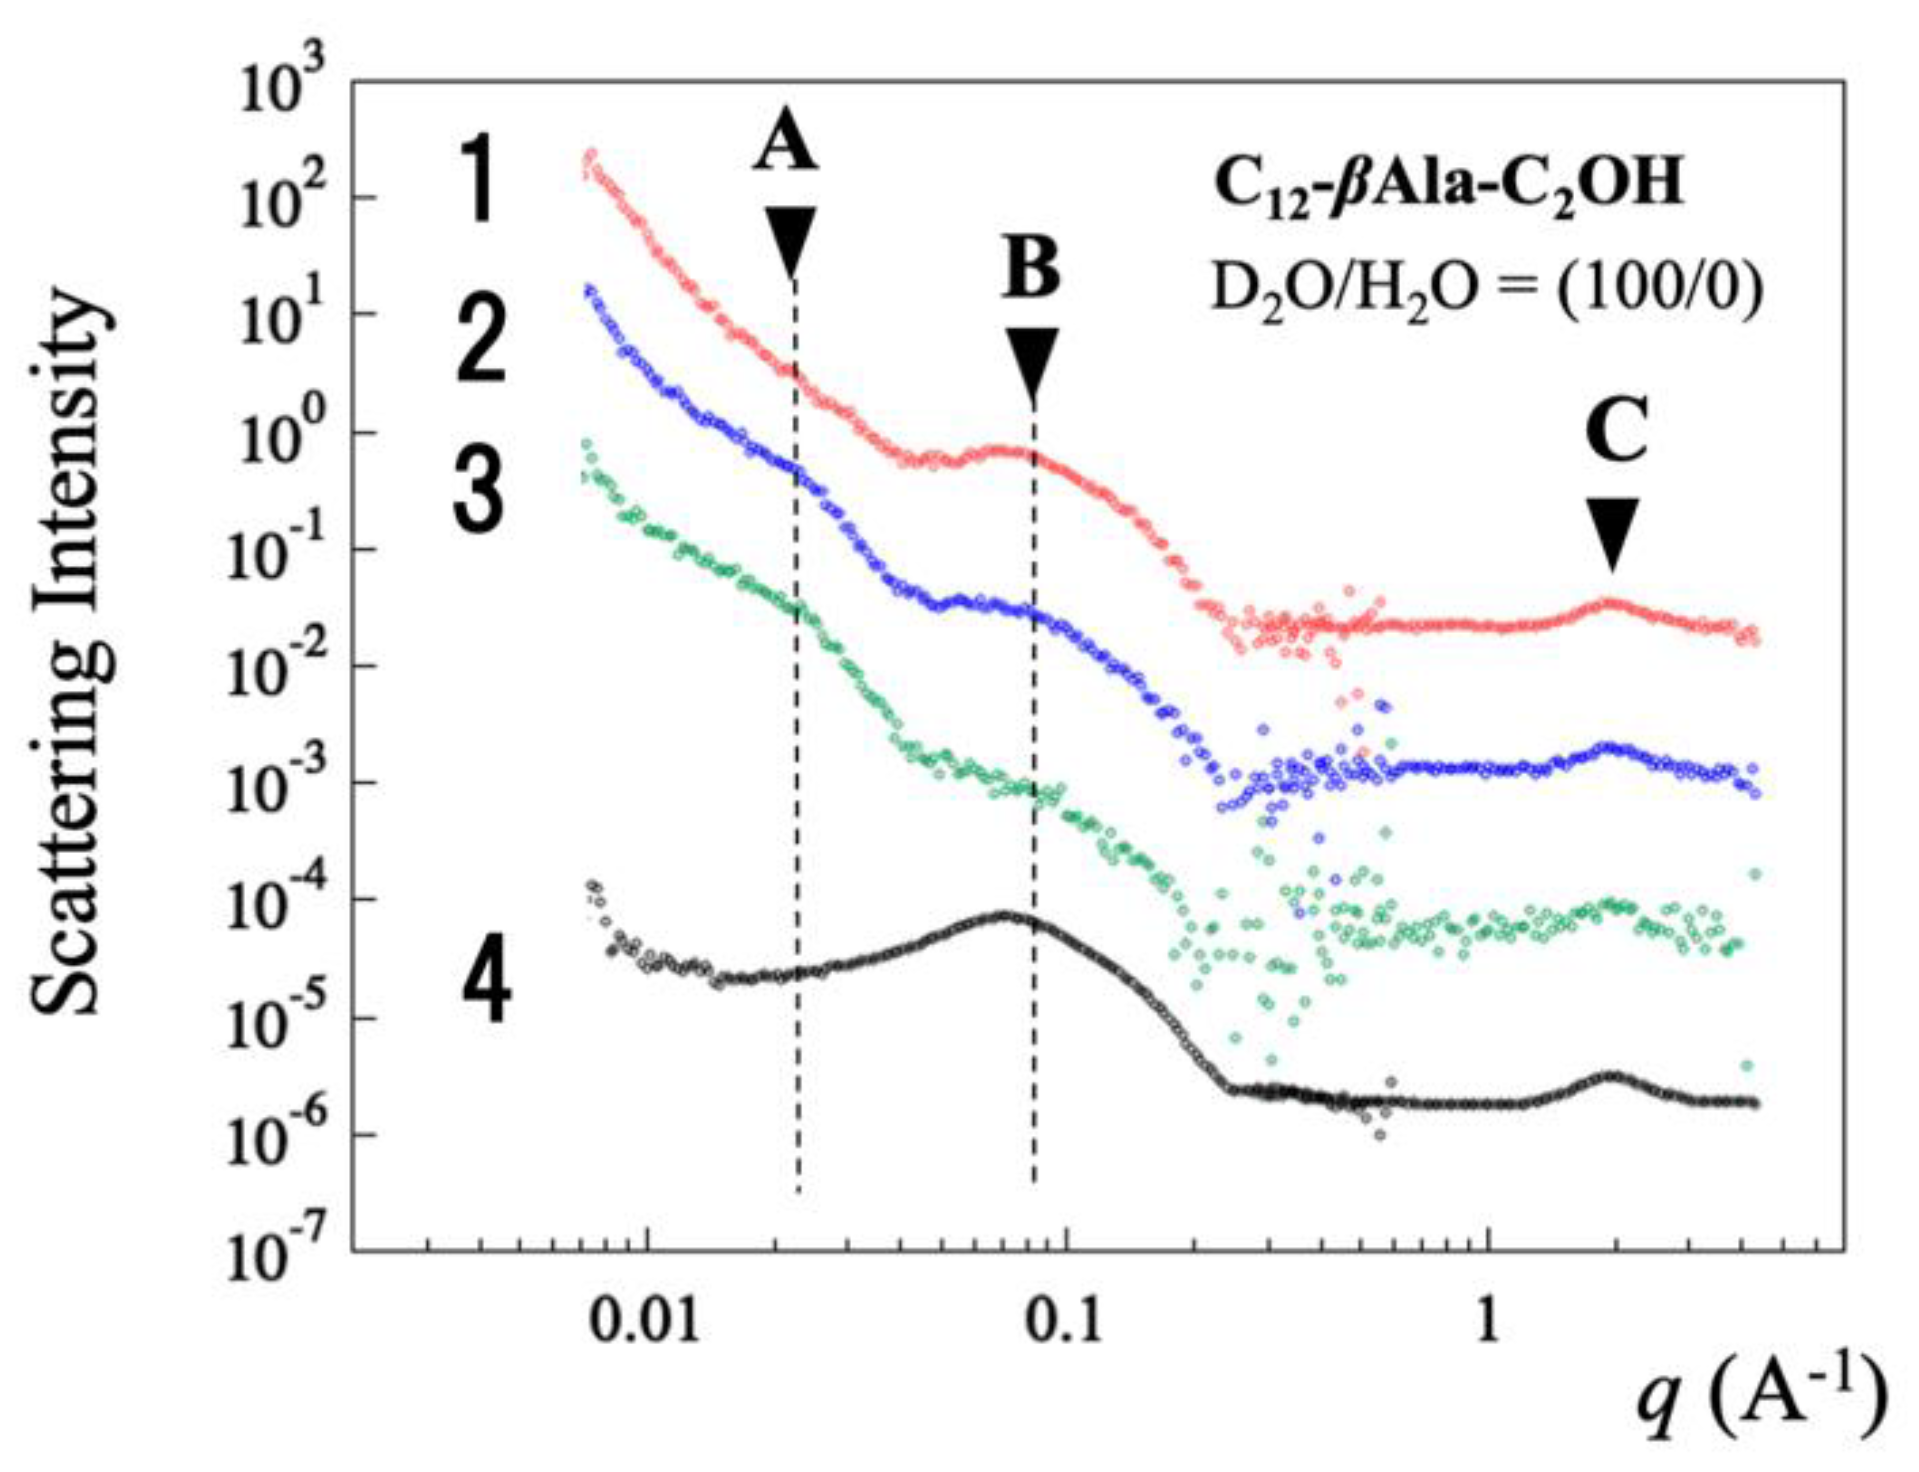
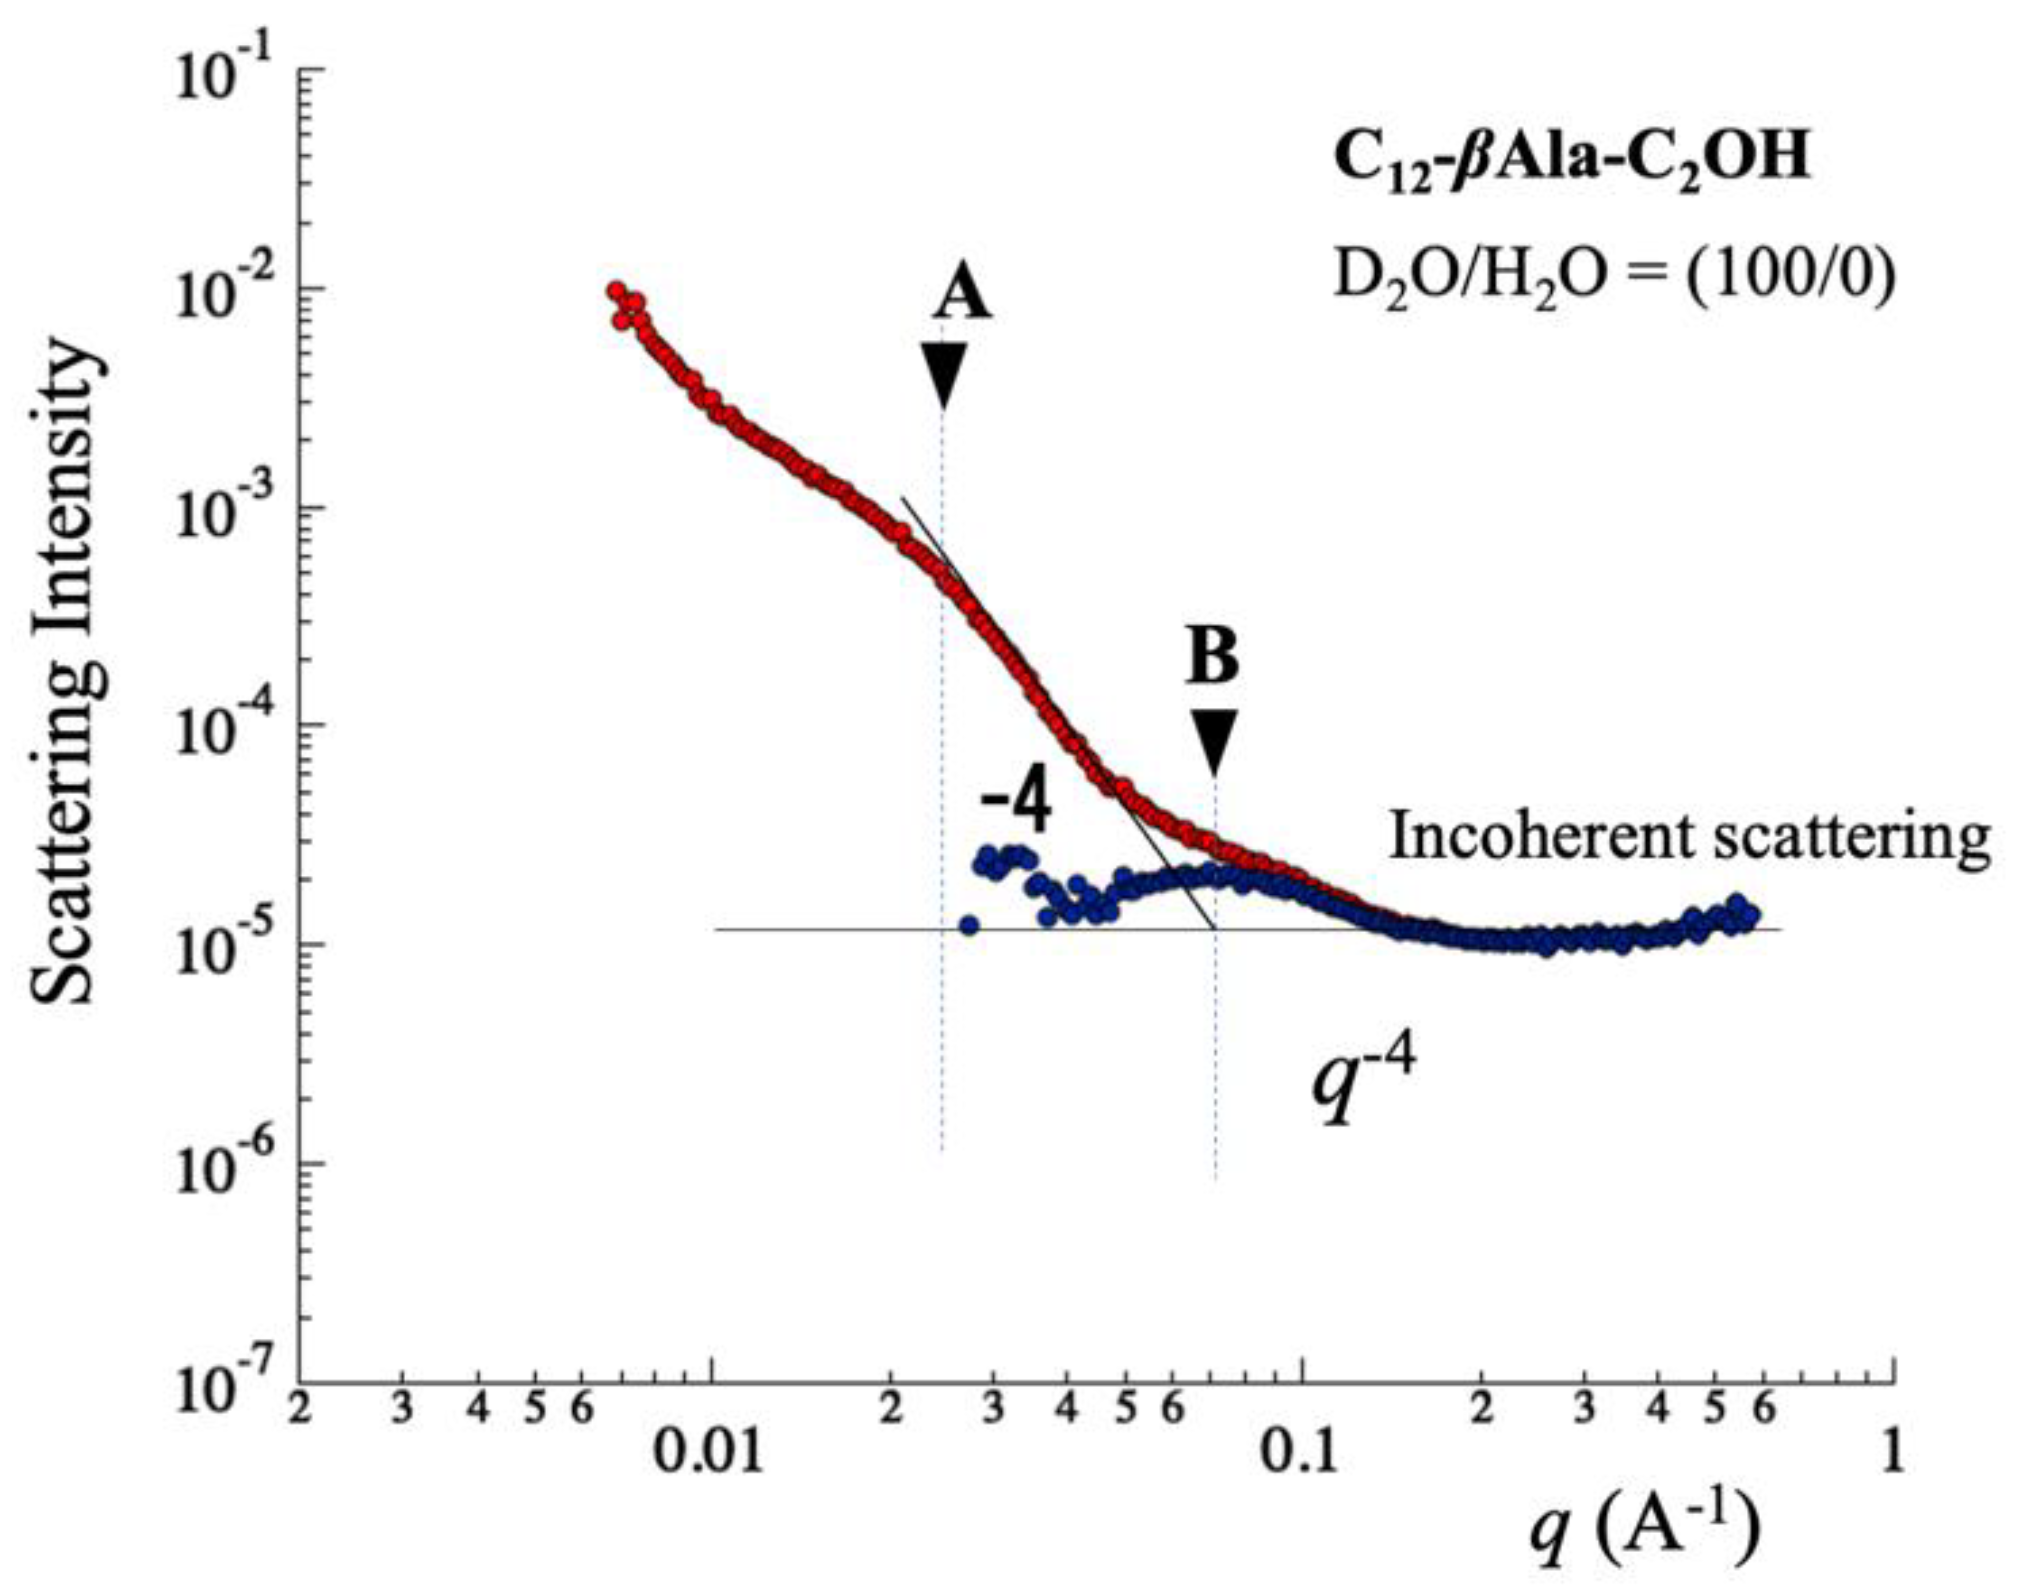
4.2. Microscopic Behavior Determined by Small-Angle Neutron Scattering

After foaming with an air pump in the cell described in Figure 3, we performed time-resolved SANS experiments in order to observe the evolution of foam structures on a molecular level. Figure 10 shows the two-dimensional scattering patterns in an x–y plane that appeared on a large detector for small-angle scattering. In the case of small–angle X-ray scattering (SAXS) (A in Figure 10), the incident beam was narrowed to 0.5 mm in diameter. Note that the cell thickness was 30 mm. Consequently, we observed individual streak scattering patterns, which appeared parallel to a normal vector of the foam film [28]. In the case of SANS (B in Figure 10), which used a beam that was 10 mm in diameter, an isotropic SANS pattern appeared on the detector. This was because in the sample volume of Vs = 102 × 30 mm3, the number of foam films was enough to ensure random orientation approximation. SANS q–profiles were obtained using circular averaging over the azimuthal angle (ϕ) defined in Figure 5.
Figure 11 shows the time-resolved SANS obtained for the solution with 100% D2O as a solvent. Note that by using two detector banks (as shown in Figure 2) and a wide range of wavelengths from 1 to 10 A, we could simultaneously detect a wide range of q values from 0.007 to 4.0 A−1. The transmission of foam (T) (see Equation (8)) was about 0.95. It should be emphasized that with a time interval of 1 min, we obtained a snapshot of SANS covering a wide q-region without changing the detector’s position. Note that when the power of J–PARC was highest (1 MW), we were able to observe the evolution of foams with 1 s intervals [28]. This was due to a combination of the scattering-angle dispersive method and the wavelength-dispersive method using a time-of-flight technique (1500 tube detectors surrounding a sample position and available λ values from 1 to 10 A). Characteristic q–values or maxima were indicated by A, B, and C, which were attributed to the foam film thickness, micelle size, and deuterated water (D2O).
Immediately after foaming for 1 min, the SANS patterns showed three q–regions from lower to higher q, originating from (i) the intraparticle scattering of films, (ii) micelles in a film, and (iii) incoherent scattering from hydrogen. Note that the q-behaviors of (i)–(iii) were common for the C12–EtOH–βAla, C12–Me–βAla, and SDS solutions. In the region (i) of low q, we observed asymptotic behaviors of small-angle scattering from q−2 to q−4, both of which were attributed to Equations 15 and 16. q-position A was transferred to the film thickness, which was about d = 27 nm. In the region (ii) of middle q at q–position B, broad scattering maxima appeared after 5 min of foaming and remained stable. They originated from micelles floating in the foam. From the peak position, we determined the size of micelle L = 8 nm, which was identical to the micelles in the foam. At the long time of 3600 s, the broad scattering disappeared. In the region (iii) of high q, incoherent scattering related to the total amount of hydrogen was dominant. It is interesting that incoherent scattering deceased as time proceeded after foaming. At q–position C, we recognized the intermolecular interference due to D2O molecules.
Figure 12 shows the time-resolved SANS obtained for foams in the mixed water H2O/D2O (9/91, vol/vol), which exhibited q–independent scattering (incoherent scattering from hydrogen). This is because the scattering length density averaged over the mixed water and surfactants was matched with that of air. Therefore, the coherent scattering originating from foams was diminished, and only incoherent scattering from the hydrogen atoms appeared. The incoherent scattering intensity was proportional to the amount of hydrogen in the sample volume.

5. Discussion

5.1. Foam Film in q-Region (i)

In the region (i) of the lowest q (0.007–0.04 A−1), we observed coherent scattering of q−α originating from foam films. For the q–region of 2π/(2R) < q < 2π/d, Equation (13) asymptotically behaves as I(q)~q−2. For q >2π/d, a Porod region appeared, showing I(q)~q−4. The asymptotic q-behavior changed from α = −2 to −4 at a crossover wave number of qc = 0.023 A−1. From the crossover (qc), we determined the thickness of the film to be d = 2π/qc. As time increased, the crossover (qc) and the scattering intensity at qc remained almost constant.
Figure 13 highlights the smaller q region from 0.007 to 0.5 A−1, detected by a small-angle detector, as shown in Figure 2. Figure 13a shows the highlights of SANS for a long elapsed time (5400 s). The scattering curves obtained for t = 600–3600 s remained stable without changing (red curve at 600 s and green curve at 3600 s, respectively). The crossover (q) behavior remained at 3600 s and became less obvious at 5400 s (dark-green curve). In Figure 13b, we examined the region (i) carefully. In order to clearly indicate the coherent scattering, we subtracted the incoherent scattering, which was determined by from the higher q-region. After the subtraction of incoherent scattering, a second slopes of q−2 and q−4 appeared at around q > 0.1 A−1. From the second q-crossover from q−2 to q−4, we could determine that the thinner film thickness was 6 nm. We observed a thick film (27 nm) containing micelles and water, known as a common black film. For a longer time, on the other hand, a Newton black film (thin film of 6 nm thickness) appeared, which might not have contained water. Note that the length of the surfactant was about 3 nm, according to a Tanford method [27].
Figure 14 shows the time-dependence of d determined by qc for SDS, C12–EtOH–βAla, and C12–Me–βAla. For C12–EtOH–βAla, the film of d = 27 nm was constant for 2–15 min after foaming. For C12–Me–βAla, the thickness was the same as that of C12–EtOH–βAla for 6–11 min. After 1000 s, a common black film and a Newton black film coexisted. Note that only C12–EtOH–βAla was examined for a time longer than 1500 s.
We stress that the film thickness (d) was determined by the length of the molecule and number of charges on its head. Films with thicknesses on the order of 10 nm were reported as common black films based on a model including a disjoining pressure [1,2], in which the electrostatic repulsion between the adjacent heads of ionic surfactant molecules is dominant. The electric double layer surrounding micelles in the film moderated the electrostatic repulsion.
Nikolov et al. [29,30] and Danov et al. [31,32], who also found micelles in foam films of nonaoxyethylene oleylether carboxylic acid, reported a film thickness of 33 nm (at a height of 168 mm from the bottom of a column with an inner diameter of 24 mm). This thickness was close to that of our C12–EtOH–βAla- and C12–Me–βAla-stabilized foams. The film thickness was determined by the length of the surfactant molecule; a molecule of nonaoxyethylene oleylether carboxylic acid (number of carbons is usually 26~30) is longer than those of C12–EtOH–βAla and C12–Me–βAla.
From the q-region (i), we evaluated the specific surface area (S/VS) according to a plot of q4I(q) vs. q. An intercept gave 2πb1)2S VS−1. Figure 15 shows the specific surface area determined at a 140 mm height in the cell as a function of the elapsed time after foaming. The specific surface area gradually decreased with time for C12–EtOH–βAla, whereas for C12–Me–βAla there was a steep decrease for ~6 min and then a drop to zero after 10 min.

5.2. Micelle in q-Region (ii)

In the middle q-region (0.04 < q < 0.3 A−1), we recognized a broad scattering maximum at qm = 0.07 A−1, which was attributed to the interparticle interference of micelles, giving L = 8 nm, according to L = 2π/qm. It should be emphasized that the qm was identical to that observed for the solutions before foaming. Figure 16 compares the SANS obtained for foams at different heights (No. 1, 2, and 3) and the SANS originating from micelles in the solutions of C12–EtOH–βAla (No. 4). The q-behaviors for profiles 1–4 were identical to each other. It should be emphasized that the q-behaviors discussed here were common for the C12–EtOH–βAla, C12–Me–βAla, and SDS solutions, implying that the micelle structure (size and distance) was determined by a molecular structure with a C11 hydrophobic tail and its concentration in the solution.
In the thin film of thickness d = 27 nm, there were micelles similar to the surfactant solution before foaming. At the highest q (>0.3 A−1), the q-independent scattering was attributed to incoherent scattering from hydrogen atoms, the intensity of which was proportional to the number of protons irradiated by the incident neutron beam. The broad scattering maximum at q = 2.0 A−1 was attributed to the coherent scattering of D2O. As for C12–Me–βAla, the SANS intensity rapidly decreased with time and reached background after 10 min. As observed using the dynamic foam analyzer (Figure 8), this was because the foam at a 180 mm height broke at 10 min.
Figure 17 shows the SANS obtained at 600~3600 s. The asymptotic q-behavior q−4 at q = 0.03~0.04 A−1 was subtracted, so we recognized a broad scattering maximum at the same q value for the micelle in the foam. A second possibility for the middle q-region is that the micelles were longer in the black film, even though its density decreased as time proceeded.
Figure 18 shows the ratio of scattering intensity between micelle and foam (IM/IF). At elapsed times of 0–200 s for C12–Me–βAla, the IM/IF ratio had a large decrease (10%), which was common for C12–EtOH–βAla, C12–Me–βAla, and SDS. This was related to the macroscopic observation of the solution height (HL) in Figure 8 and Figure 9. Due to the draining of water, the micelles in the film flowed with the water. The IM/IF ratios for C12–EtOH–βAla and SDS decreased gradually from 300 s to 900 s, implying that the micelles remained stable in the film. The IM/IF ratio for C12–Me–βAla, on the other hand, started to increase at 400 s, which was due to the collapse of the film, and the surfactant molecules on the film’s surface started to form micelles.

5.3. Water Content in q-Region (iii)

In the course of collapse, what is the water concentration in the foam film? To address this question, we analyzed time-resolved incoherent scattering appearing in region (iii). We combined two different scattering contrasts (Δb) with different mixing ratios (φ) in Equation (17). Incoherent scattering (Iinc(q)) was caused by hydrogen (H) in the water, surfactant, and deuterium (D), as indicated by Equation (17). Equation (17) was rewritten to include the time-dependent surfactant concentration (ψs(t)):
Iinc(q,t) = (1 − ψs(t)) [φ Iinc,D + (1 − φ) Iinc,H] + ψs(t) Iinc,s, for q = 1.0 A−1
At different measurement times (t) in the course of collapse, we solved a simultaneous equation for different φ values (φ =1 or φ = 0.09) and then determined ψs(t), as shown in Figure 19.
Figure 19a shows the ψs(t) for SDS, determined at different observation heights. The ψs(t) for SDS was more than 0.95; SDS is a very dry foam. The ψs(t) for SDS gradually increased toward 1.0 (drying process). In Figure 19b, the ψs(t) for C12–EtOH–βAla appears around 0.9–0.95; it is a wet foam compared to SDS. Especially at higher positions (140 mm and 100 mm), the foam contained more water, which was attributed to the hydroxy group in the head group. In Figure 19c, the ψs(t) for C12–Me–βAla starts at 0.95, similar to SDS (a very dry film). After t = 480 s, the ψs(t) values at 100 and 60 mm heights had large drops, implying a decrease in surfactant molecules from the top and a large amount of hydrogen crosses in a neutron beam. The ψs(t) for C12–Me–βAla at a 140 mm height, on the other hand, increased to 1.0.

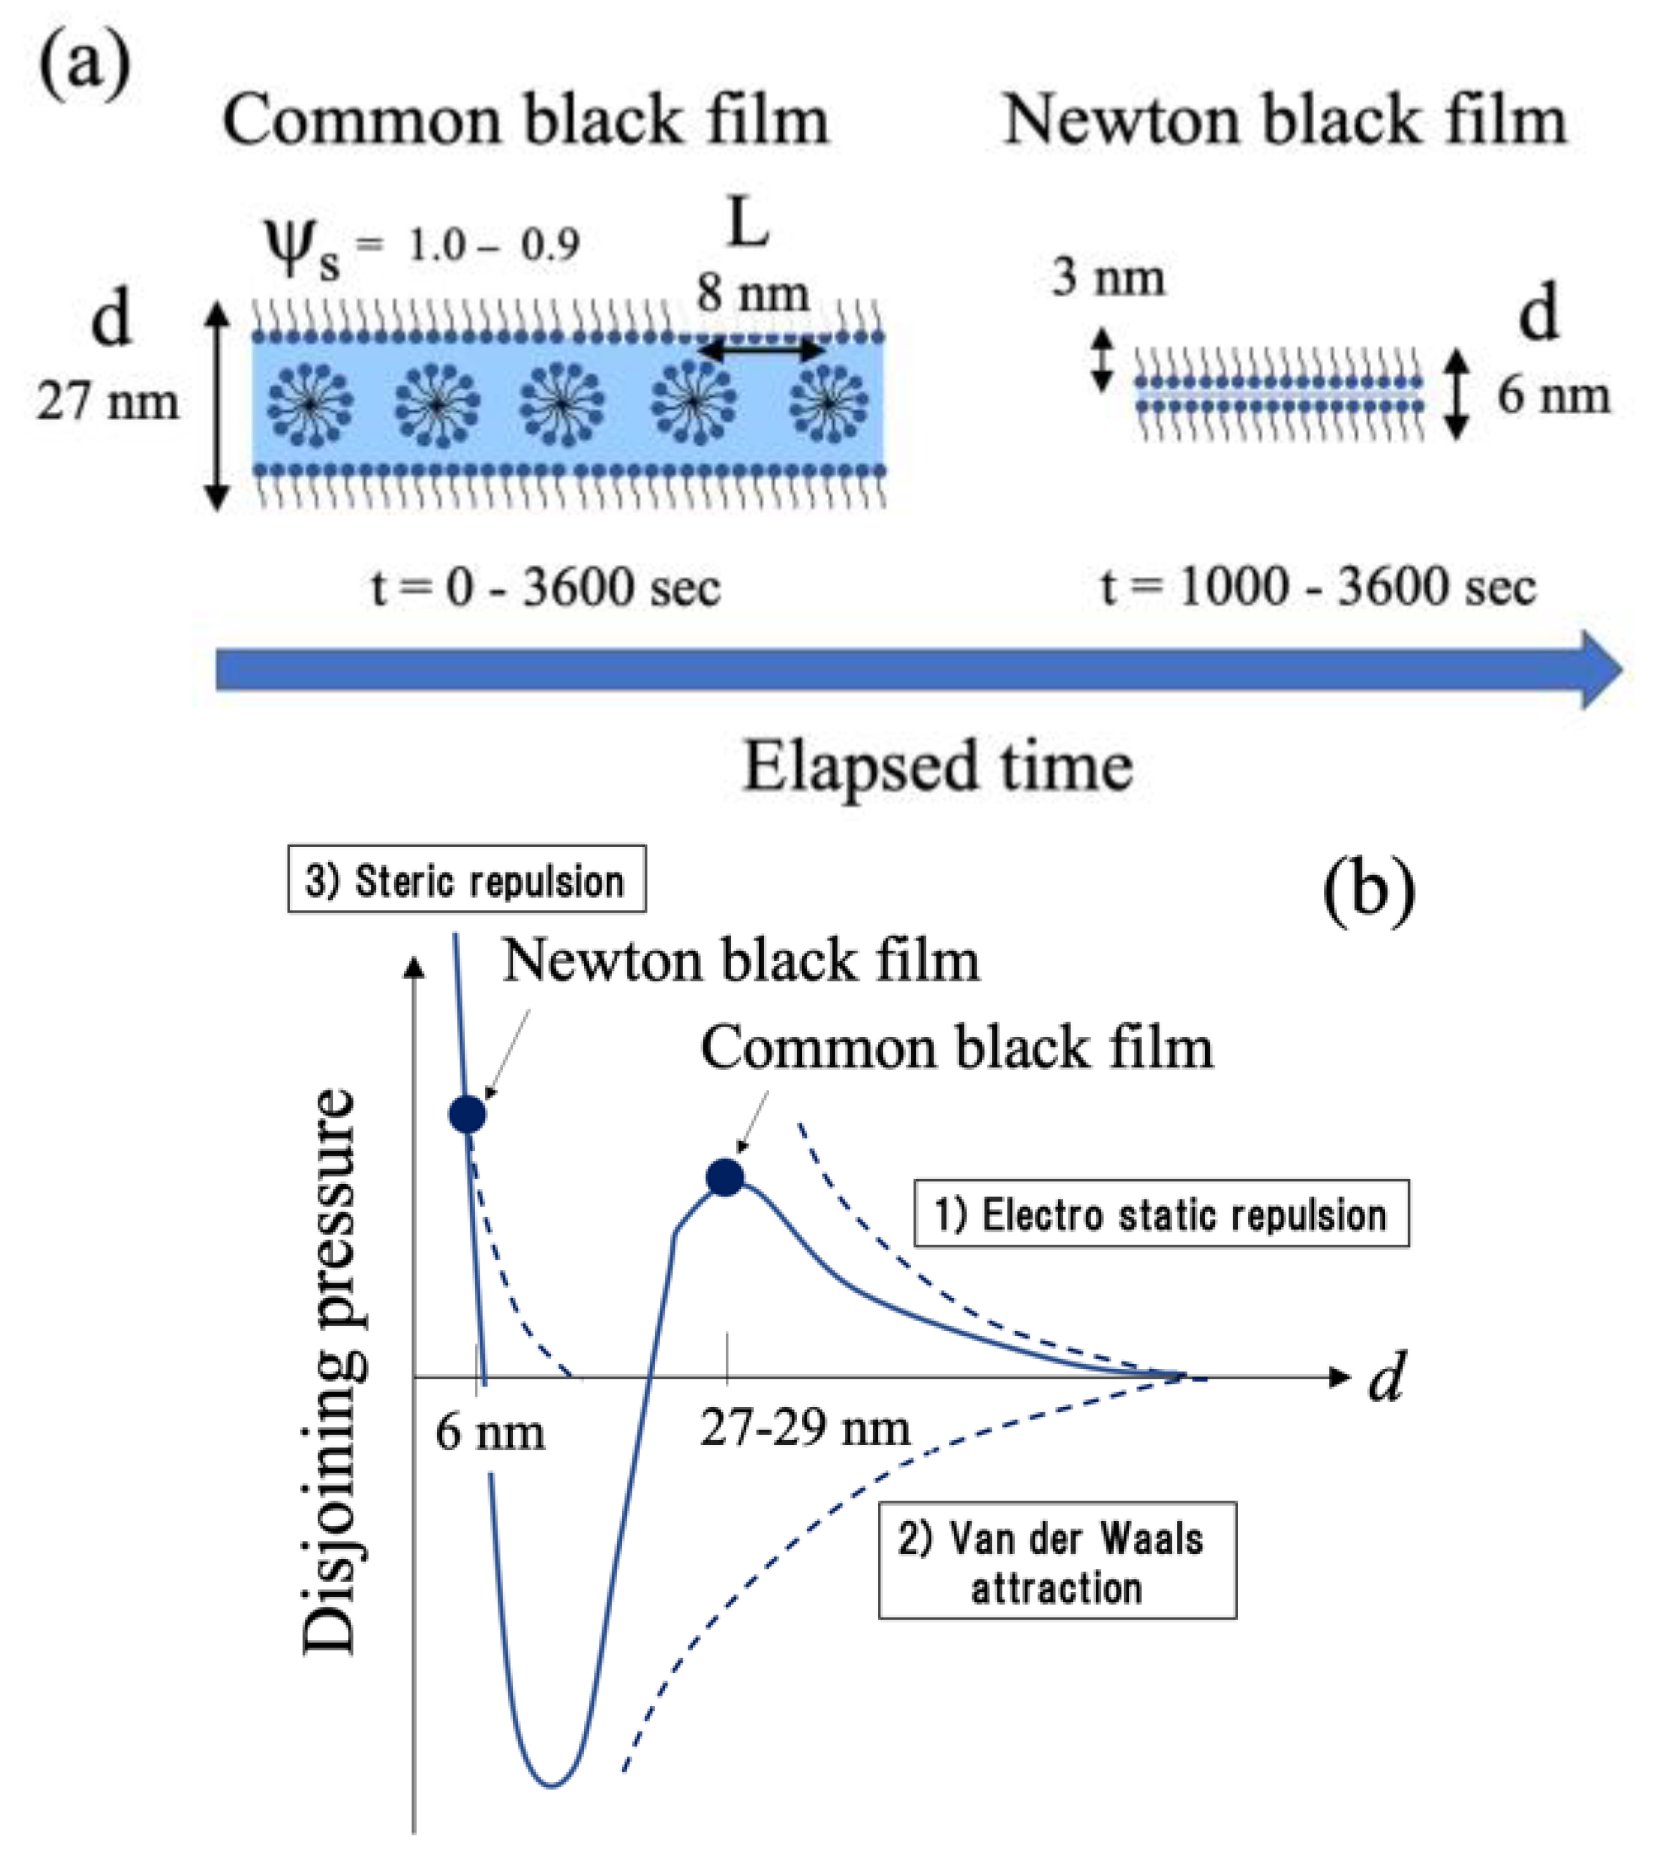
5.4. Microscopic Depictions of Shampoo Foam

By using a time-resolved SANS method at a pulsed neutron source, we chased the collapsing foam at Angstrom to submicron length scales. Figure 1 was intuitively depicted by Dr. Sakai, who is a leading researcher at the KAO company, Japan. Our study, in this paper, contributes to quantitatively determining the structural parameters describing foam films in Figure 1.
First of all, we emphasize that there are micelles in the foam film, even at a 140 mm height from the bottom of the shampoo solution (Figure 20), which agrees with the depiction in Figure 1. Stated another way, the solution concentration in the foam film is more than a critical micelle concentration (CMC). The excess surfactant molecules stored in the film might contribute to repairing the foam film according to a Gibbs–Marangoni effect [1,2].
The film thickness (d) and the distance between micelles (L) are common for all surfactants and are determined by the chemical structure of C11. On the other hand, ψs, the concentration of surfactant in the film, behaves differently depending on the types of surfactants. SDS and C12–Me–βAla are very dry, whereas C12–EtOH–βAla is wet. According to the macroscopic observation of the foam height (HF), the foams of SDS and C12–EtOH–βAla are stable for a long time.
Figure 20a shows a schematic summary of the microstructures of foam film, as determined by time-resolved SANS measurements. The film thickness is d = 27 nm, and volume fraction of the surfactant is ψs = 1.0–0.9. The micelles, which are identical to those in the solution before foaming, exist in the film. For longer times (>1000 s), a Newton black film and common black film coexist (thicknesses of d = 6 and 27 nm, respectively). Note that the length of surfactants is 3 nm, according to a Tanford’s method [27]. Figure 20b presents a schematic diagram showing the disjoining pressure (solid curve) as a function of the film thickness (d) given by forces of (1) electrostatic repulsion, (2) Van der Waals attraction, and (3) steric repulsion. A Newton black film and a common black film appear at maxima of disjoining pressure at d = 6 and 27 nm.

6. Conclusions

In order to investigate the new surfactants, the hydroxy-group-containing amino acid surfactant (C12–EtOH–βAla), a control surfactant without a hydroxy group (C12–Me–βAla), and SDS, we employed time-resolved time-of-flight small-angle neutron scattering (TOF SANS) combined with a conventional method, a dynamic foam analyzer observing the macroscopic behaviors of “foamability”, “stability”, and “fineness”. Time-resolved TOF SANS revealed that micelles exist in the foam films, which are common for all surfactants. The thickness of the foam films was also common for all surfactants (~27 nm). The film of C12–EtOH–βAla was more stable and kept more water than that of C12–Me–βAla, and this was ascribed to hydrogen bonding between the carboxylate and hydroxy groups. Consequently, the new surfactant, C12–EtOH–βAla, is more suitable for use in shampoos.

Author Contributions

Conceptualization: S.K.; methodology: S.K.; sample preparation H.F., H.S., T.Y., M.Y. and Y.M.; data curation and formal analysis: Y.N., S.Y., T.M., T.I. and M.Y.; investigation: Y.N., T.I., T.M. and S.K.; resources: Y.N. and S.K.; writing—original draft preparation: S.K.; writing—review and editing: S.K.; supervision: S.K.; project administration: S.K. All authors have read and agreed to the published version of the manuscript.

Funding

This research was partially supported by Ibaraki Prefecture (Leading Research Project of Ibaraki Neutron Beam line 2018–2019).

Data Availability Statement

The data presented in this study are available on requests from the corresponding authors.

Acknowledgments

SANS experiments were carried out using the iMATERIA spectrometer (BL20) at J-PARC MLF (proposal No. 2018PM0005).

Conflicts of Interest

The authors declare no conflict of interest.

References

  1. Cantat, I.; Cohen-Addad, S.; Elias, F.; Graner, F.; Höhler, R.; Pitois, O.; Rouyer, F.; Saint-Jalmes, A. Foams: Structure and Dynamics; Oxford University Press: Oxford, UK, 2013. [Google Scholar]
  2. Weaire, D.; Hutzler, S. The Physics of Foams; Oxford University Press: Oxford, UK, 1999. [Google Scholar]
  3. Leike, A. Demonstration of the exponential decay law using beer froth. Eur. J. Phys. 2002, 23, 21. [Google Scholar] [CrossRef] [Green Version]
  4. Liger-Belair, G.; Beaumont, F.; Jeandet, P.; Polidori, G. Flow patterns of bubble nucleation sites (called fliers) freely floating in champagne glasses. Langmuir 2007, 23, 10976–10983. [Google Scholar] [CrossRef] [PubMed]
  5. Liger-Belair, G.; Voisin, C.; Jeandet, P. Modeling nonclassical heterogeneous bubble nucleation from cellulose fibers: Application to bubbling in carbonated beverages. J. Phys. Chem. B 2005, 109, 14573–14580. [Google Scholar] [CrossRef] [PubMed]
  6. Liger-Belair, G.; Jeandet, P. Capillary-driven flower-shaped structures around bubbles collapsing in a bubble raft at the surface of a liquid of low viscosity. Langmuir 2003, 19, 5771–5779. [Google Scholar] [CrossRef]
  7. Ghabache, E.; Liger-Belair, G.; Antkowiak, A.; Séon, T. Evaporation of droplets in a Champagne wine aerosol. Sci. Rep. 2016, 6, 25148. [Google Scholar] [CrossRef] [Green Version]
  8. Yekeen, N.; Manan, M.A.; Idris, A.K.; Samin, A.M. Influence of surfactant and electrolyte concentrations on surfactant Adsorption and foaming characteristics. J. Pet. Sci. Eng. 2017, 149, 612–622. [Google Scholar] [CrossRef]
  9. Kartono, F.; Maibach, H.I. Irritants in combination with a synergistic or additive effect on the skin response: An overview of tandem irritation studies. Contact Dermat. 2006, 54, 303–312. [Google Scholar] [CrossRef]
  10. Löffler, H.; Happle, R. Profile of irritant patch testing with detergents: Sodium lauryl sulfate, sodium laureth sulfate and alkyl polyglucoside. Contact Dermat. 2003, 48, 26–32. [Google Scholar] [CrossRef]
  11. Lethcoe, K.; Fox, C.A.; Ryan, R.O. Foam fractionation of a recombinant biosurfactant apolipoprotein. J. Biotechnol. 2022, 343, 25–31. [Google Scholar] [CrossRef]
  12. Yada, S.; Shimosegawa, H.; Fujita, F.; Yamada, M.; Matsue, Y.; Yoshimura, T. Microstructural Characterization of Foam Formed by a Hydroxy Group-Containing Amino Acid Surfactant Using Small-Angle Neutron Scattering. Langmuir 2020, 36, 7808–7813. [Google Scholar] [CrossRef]
  13. Sakai, T. Formation Mechanism and Application of Foam; Chapter 1; CMC Publishing: Tokyo, Japan, 2017. [Google Scholar]
  14. Axelos, M.A.V.; Boué, F. Faoms as viewed by small-angle neutron scattering. Langmuir 2003, 19, 6598–6604. [Google Scholar] [CrossRef]
  15. Etrillard, J.; Axelos, M.A.V.; Cantat, I.; Artzner, F.; Renault, A.; Weiss, T.; Delannay, R.; Boué, F. In Situ Investigations on Organic Foam Films Using Neutron and Synchrotron Radiation. Langmuir 2005, 21, 2229–2234. [Google Scholar] [CrossRef] [PubMed]
  16. Roper, M.H.; Novales, B.; Boue, F.; Axelos, M.A.V. Polysaccharide/Surfactant Complexes at the Air−Water Interface—Effect of the Charge Density on Interfacial and Foaming Behaviors. Langmuir 2008, 24, 12849–12857. [Google Scholar] [CrossRef] [Green Version]
  17. Schmidt, I.; Novales, B.; Boué, F.; Axelos, M.A.V. Foaming properties of protein/pectin electrostatic complexes and foam structure at nanoscale. J. Colloid Interface Sci. 2010, 345, 316–324. [Google Scholar] [CrossRef] [Green Version]
  18. Mikhailovskaya, A.; Zhang, L.; Cousin, F.; Boue, F.; Yazhgur, P.; Mullter, F.; Gay, C.; Salonen, A. Probing foam with neutrons. Adv. Colloid Interface Sci. 2017, 247, 444–453. [Google Scholar] [CrossRef]
  19. Micheau, C.; Bauduin, P.; Diat, O.; Faure, S. Specific salt and pH effects on foam film of a pH sensitive surfactant. Langmuir 2013, 29, 8472–8481. [Google Scholar] [CrossRef] [PubMed]
  20. Hurcom, J.; Paul, A.; Heenan, R.K.; Davies, A.; Woodman, N.; Schweins, R.; Griffiths, P.C. The interfacial sutrcture of polymeric surfactant stabilized air-in-water foams. Soft Matter 2014, 10, 3003–3008. [Google Scholar] [CrossRef] [Green Version]
  21. Zhang, L.; Mikhailovskaya, A.; Yazhgur, P.; Muller, F.; Cousin, F.; Langevin, D.; Wang, N.; Salonen, A. Precipitating sodium dodecyl sulfate to create ultrastable and semistable foams. Angew. Chem. Int. Ed. Engl. 2015, 54, 9533–9536. [Google Scholar] [CrossRef] [PubMed]
  22. Mansour, O.T.; Cattoz, B.; Beaube, M.; Montagnon, M.; Heenan, R.K.; Schweins, R.; Appavou, M.-S.; Griffiths, P.C. Assembly of small molecules surfactants at highly dynamic air-water interfaces. Soft Matter 2017, 13, 8807–8815. [Google Scholar] [CrossRef]
  23. Imae, T.; Kanaya, T.; Furusawa, M.; Torikai, N. Neutrons in Soft Matter; Wiley: Hoboken, NJ, USA, 2011. [Google Scholar]
  24. Koizumi, S.; Noda, Y.; Maeda, T.; Inada, T.; Ueda, S.; Fujisawa, T.; Izunome, H.; Robinson, R.A.; Frielingshaus, H. Advanced Small-angle scattering Instrument Available in Tokyo area II. Time-of-flight Small-Angle Neutron Scattering Developed on iMATERIA Spectrometer at High Intensity Pulsed Neutron Source J-PARC. Quantum Beam Sci. 2020, 4, 42. [Google Scholar] [CrossRef]
  25. Roe, R.J. Methods of X-ray and Neutron Scattering in Polymer Science; Oxford University Press: Oxford, UK, 2000. [Google Scholar]
  26. Debye, P. Zerstreuung von Röntgenstrahlen. Ann. Phys. 1915, 351, 809–823. [Google Scholar]
  27. Tanford, C. The Hydrophobic Effect, 2nd ed.; Wiley: Hoboken, NJ, USA, 1980. [Google Scholar]
  28. Onizawa, M.; Koizumi, S.; Noda, Y.; Inada, T. Time-resolved Small-angle Scattering Investigating A Single Shampoo Film. Soft Matter, 2022; manuscript in preparation. [Google Scholar]
  29. Nikolov, A.D.; Kralchevsky, P.A.; Ivanov, I.B.; Wasan, D.T. Ordered Micelle Structuring in Thin Films Formed from Anionic Surfactant Solutions: Part II—Model Development. J. Colloid Interface Sci. 1989, 133, 13–22. [Google Scholar] [CrossRef]
  30. Nikolov, A.D.; Wasan, D.T. Ordered Micelle Structuring in Thin Films Formed from Anionic Surfactant Solutions: Part I—Experimental. J. Colloid Interface Sci. 1989, 133, 1–12. [Google Scholar] [CrossRef]
  31. Danov, K.D.; Basheva, E.S.; Kralchevsky, P.A.; Ananthapadmanabhan, K.P.; Lips, A. The metastable states of foam films containing electrically charged micelles or particles: Experiment and quantitative interpretation. Adv. Colloid Interface Sci. 2011, 168, 50–70. [Google Scholar] [CrossRef]
  32. Tzocheva, S.S.; Kralchevsky, P.A.; Danov, K.D.; Georgieva, G.S.; Post, A.J.; Ananthapadmanabhan, K.P. Solubility limits and phase diagrams for fatty acids in anionic (SLES) and zwitterionic (CAPB) micellar surfactant solution. J. Colloid Interface Sci. 2012, 369, 274–286. [Google Scholar] [CrossRef]
Figure 1. Schematic view of shampoo foam drawn by considering the picture by Dr. Sakai (Kao Corporation, Wakayama, Japan) [13]. Surfactants are allocated at the air surface; a hydrophobic tail faces to the air side, whereas a hydrophilic group is attached on the water side. Disjoining pressure maintains the film thickness (d). A triplet junction (plateau boarder) connects individual foam films. Laplace pressure causes water flow to the junction. Gravity causes foliation and collapse of the foam and drainage of water. The Gipps–Marangoni effect resists film breakage. Interestingly, micelles with spaces between them (L) are depicted in the foam film.
Qubs 07 00004 g001
Figure 2. iMATERIA spectrometer at J-PARC, with neutrons entering from the right to the detectors on the left. (a) side view showing 4 detector blocks surround a sample position; (b) small-angle and low-angle detectors viewed from sample position.
Qubs 07 00004 g002
Figure 3. (a) Schematic diagram of the foaming cell used for SANS measurements (70 × 30 × 250 mm3), designed by copying a dynamic foam analyzer. A surfactant solution (30 mL) was poured into the cell with an air stone. SANS measurements were performed at different heights of (1) 140, (2) 100, and (3) 60 mm. (b) top view of the foaming cell showing a scattering path and scattering 2 (the maximum angle is 40°).
Qubs 07 00004 g003
Figure 4. Chemical structures of (a) sodium dodecyl sulfate (SDS), (b) N–dodecanoyl–N–(2-hydroxyethyl) –β–alanine (C12–EtOH–βAla), and (c) N–dodecanoyl–N-methyl–β–alanine (C12–Me–βAla).
Qubs 07 00004 g004
Figure 7. Macroscopic images at elapsed times of 0, 360, and 900 s obtained for foams of (A) C12–EtOH–βAla and (B) C12–Me–βAla surfactants, which were attached to the glass wall of the dynamic foam analyzer.
Qubs 07 00004 g007
Figure 8. Evolution of foam heights (HF) obtained using a dynamic foam analyzer for SDS (green), C12–EtOH–βAla (red), and C12–Me–βAla (blue). Foam of C12–Me–βAla collapsed dramatically in the time domain from 300 to 480 s (indicated in red).
Qubs 07 00004 g008
Figure 9. Evolution of height (HL) of C12-EtOH-βAla solution at the bottom of foaming cell (right). Time domain at 300–480 s is indicated in red. The broken line is a guide for the eye. Side view of sample filled with foams and solution (left).
Qubs 07 00004 g009
Figure 10. Two-dimensional small-angle scattering patterns appeared in an x–y plane of the large area detector. In the case of X-ray scattering (A), an incident beam with a 0.5 mm diameter was used, so individual foam films caused streak scattering patterns, which were parallel to the normal vector of the foam film. In case of neutron scattering (B) with a beam with a 10 mm diameter, an isotropic scattering pattern appeared on the detector.
Qubs 07 00004 g010
Figure 11. Time-resolved coherent SANS obtained for the C12–EtOH–βAla solution of 100% D2O with a time interval of 1 min, covering a wide q-region from 0.01 to 4 A−1. At low q values, coherent scattering of the film was dominant, whereas at high q values incoherent scattering of hydrogen was dominant. The characteristic q-positions are indicated by A (=qc), B, and C, which were attributed to the film thickness, micelle, and deuterated water (D2O). The dotted lines are guides for the eye.
Qubs 07 00004 g011
Figure 12. Time-resolved incoherent SANS obtained for the C12–EtOH–βAla solution of mixed water (H2O/D2O (9/91, vol/vol)), which exhibited q-independent scattering (incoherent scattering from hydrogen). The dotted lines are guides for the eye.
Qubs 07 00004 g012
Figure 13. (a) Highlights of SANS for long elapsed time (3600–5400 s) obtained for the C12–EtOH–βAla solution of 100% D2O. The crossover (q), as indicated by A, remained at 3600 s and became less obvious for 3600–5400 s. The broken line indicates an instrument background. (b) Examination of SANS observed at 600–1800 s. After the subtraction of incoherent scattering, second slopes of q−2 and q−4 (as indicated by B) appeared at around q > 0.1 A−1. From the second q-crossover from q−2 to q−4, we determined another film thickness of d = 6 nm, which was attributed to a Newton black film.
Qubs 07 00004 g013
Figure 14. Time–dependence of film thickness (d) determined by q-crossover from q−2 to q−4 in coherent SANS, obtained for SDS, C12–EtOH–βAla, and C12–Me–βAla. For SDS (green), d = 29 nm appeared at the start and gradually decreased, whereas for C12–EtOH–βAla and C12–Me–βAla (red and blue), d = 27 nm was common at the start. For C12–EtOH–βAla, d was constant, and after 1000 s it split into two; the thick one was a common black film, and the thin one (obtained in Figure 12b) was a Newton black film. The time domain at 300–480 s is indicated in red. Broken lines are guides for the eye.
Qubs 07 00004 g014
Figure 15. Specific surface area (S/VS) determined at a 140 mm height as a function of the elapsed time after foaming for SDS (green), C12–EtOH–βAla (red), and C12–Me–βAla (blue). The time domain at 300–480 s is indicated in red. Broken lines are guides for the eye.
Qubs 07 00004 g015
Figure 16. SANS obtained for C12–EtOH–βAla at different heights (No. 1, 2, and 3) and SANS originating from micelles in the solutions of C12–EtOH–βAla (No. 4). For SANS No. 4, the scattering maxima at qm = 0.07 A−1 (indicated by B) were attributed to interparticle interference between micelles in the solutions, which appeared in SANS (No. 1, 2, and 3) obtained for foams at different heights. The q-behaviors at A and C were attributed to foam film and deuterated water. Broken lines are guides for the eye.
Qubs 07 00004 g016
Figure 17. Examination of SANS observed at 600–1800 s; the asymptotic q-behavior q−4 at q = 0.03~0.04 A−1 (solid line) was subtracted, so a broad scattering maximum appeared at the same q value for the micelle in the foam (B in Figure 16). Solid lines are guides for the eye.
Qubs 07 00004 g017
Figure 18. Ratio of scattering intensity between micelle and foam (IM/IF), obtained for SDS (green), C12–EtOH–βAla (red), and C12–Me–βAla (blue). Time domain at 300–480 s is indicated in red. Broken lines are guides for the eye.
Qubs 07 00004 g018
Figure 19. Volume fraction of surfactant in foam film (ψs) at different heights of 140 mm (red), 100 mm (blue), and 60 mm (green), obtained for (a) SDS, (b) C12–EtOH–βAla, and (c) C12–Me–βAla. The time domain at 300–480 s is indicated in red. Broken lines are guides for the eye.
Qubs 07 00004 g019
Figure 20. (a) Schematic summary of microstructures of collapsing foam film, as determined by time-resolved SANS measurements. The film thickness is d = 27–29 nm, and the volume fraction of the surfactant is ψs = 0.1–0.05. The micelles, which are identical to those in the solution before foaming, exist in the film. For longer times (>1000 s), a Newton black film and a common black film coexist (thicknesses of d = 6 and 27–29 nm, respectively). (b) Schematic diagram showing the disjoining pressure (solid curve) as a function of the film thickness (d).
Qubs 07 00004 g020
Disclaimer/Publisher’s Note: The statements, opinions and data contained in all publications are solely those of the individual author(s) and contributor(s) and not of MDPI and/or the editor(s). MDPI and/or the editor(s) disclaim responsibility for any injury to people or property resulting from any ideas, methods, instructions or products referred to in the content.

