
Assessment of Liquefaction Hazard and Mapping Based on Standard Penetration Tests in the Long Beach and Tuzla Regions of Cyprus

Civil Engineering Program, North Cyprus Campus, Middle East Technical University, 99738 Guzelyurt, Northern Cyprus, TR-10, Turkey
*
Authors to whom correspondence should be addressed.
Infrastructures 2023, 8(6), 99; https://doi.org/10.3390/infrastructures8060099
Submission received: 15 March 2023
/
Revised: 27 April 2023
/
Accepted: 28 April 2023
/
Published: 23 May 2023
(This article belongs to the Special Issue Geotechnical Earthquake Engineering)
Abstract
:Cyprus is the third largest and populated island in the Mediterranean Sea, and is still rapidly expanding. Significant infrastructures, such as hotels, educational institutions, and large residential complexes, are being built. Historically, 15 destructive earthquakes were reported on Cyprus from 1896 to 2019 that caused structural damages and casualties. In this study, the liquefaction potential of Tuzla and Long Beach on the east coast of Cyprus is estimated using the standard penetration test (SPT) data from more than 200 boreholes at different locations at the sites. The overall results are presented in a liquefaction potential index obtained from the factor of safety (F.S.) coefficient. Both study areas are susceptible to liquefaction. Thus, liquefaction potential maps are prepared to identify hazards in Tuzla and Long Beach. Additionally, the average factor of the safety line was introduced for both sites to create a correlation between the liquefaction area and F.S. values of every borehole. The adopted approach precisely provides the liquefiable regions when compared with historical evidence, CPT measurements, surface geology aspects, and geospatial data. Additionally, the results prove that the liquefaction potential must be considered during the design stage of new infrastructure in these areas.
1. Introduction
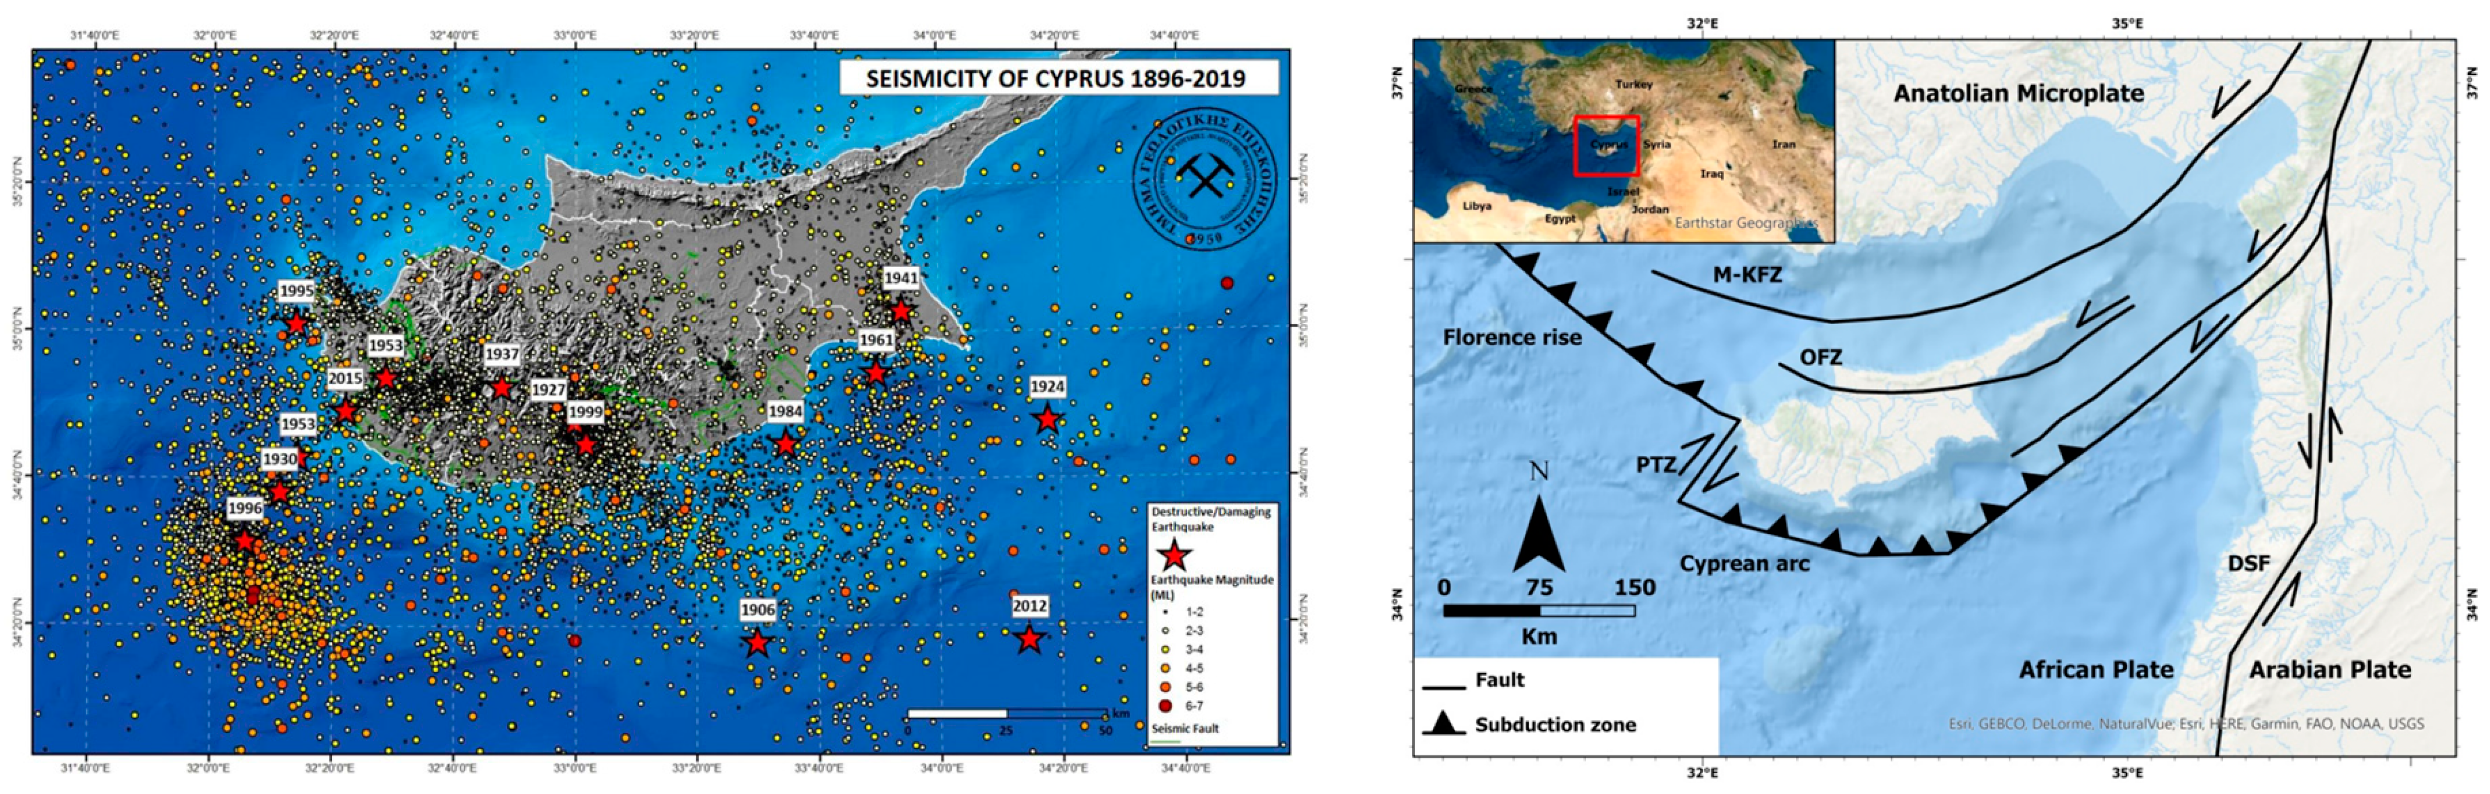
Soil liquefaction is a significant design issue for a wide range of structures. Liquefaction causes ground failures that comprise bearing capacity loss, lateral spreading, and flow, resulting in the settlement of structures. According to Zhou et al. [1], the main cause of liquefaction is the flow of soil beneath the foundation. The liquefied soil tends to flow, and the volume reduction leads to subgrade collapse, uneven settlement, earthquake subsidence, deformation, and the failure of buildings. Bao et al. [2] stated that the fundamental cause of liquefaction is a loss of shear strength caused by increased pore water pressure and a decrease in effective stress, resulting in soil exhibiting fluid-like characteristics. The Cyprus Arc, seen in Figure 1, forms a tectonic boundary between the African and Eurasian lithospheric plates in the region where Cyprus is located [3]. As shown in Figure 1, more than 400 earthquakes occurred in certain parts of the island and in the surrounding countries between 1896 and 2019, including fourteen that caused damage and injuries. Cavallaro et al. [4] carried out in situ and laboratory tests to study the soil–structure interaction of Saint Nicholas Church in Nicosia, Cyprus. The authors further summarized the seismicity of the island, and concluded that the island can be subject to a potentially damaging earthquake once every twelve years. The authors further reported that potentially destructive earthquakes are expected to occur in the future, with a frequency of one destructive earthquake every 25–30 years, and a 63% probability of an earthquake of magnitude 5.8–6.1 on the Richter scale.
Seed and Idriss [7] reported that the most-known liquefaction occurred during the Niigata earthquake in Japan, which had a magnitude of 7.5 Mw. This liquefaction has attracted the attention of researchers in the field of soil liquefaction. A well-known example of soil liquefaction, at the closest distance to Cyprus, occurred in Adapazarı, Turkey, on 17 August 1999, also called the Kocaeli earthquake [8]. This devastating earthquake had a magnitude of 7.4 Mw and occurred at a focal distance of 11 km from the city. This resulted in the fatality of thousands of people, and destroyed a large part of the city. Soil liquefaction was observed after this earthquake. Bray and Sancio [9] reported that fine-grained soils (clay and silt) were liquefied at 12 building sites in the Adapazarı region as a result of the Kocaeli earthquake. One of the latest studies conducted by Kayabaşı and Gokceoglu [10] considered the related steps for determining the liquefaction potential of a site using a standard penetration test (SPT). The authors carried out a study for a 6.94 Mw earthquake from an approximately 40 km long fault line that could cause liquefaction in Eskişehir, Turkey. The authors further analyzed liquefiable soil layers using an SPT, determining their factor of safety results with the data from ten boreholes. This study further introduced the average factor of safety line to demonstrate connections between liquefaction and the average factor of safety. The authors believe that the average safety factor for the site can provide valid liquefiable soil depth evidence. Wadi et al. [11] conducted another study, which followed similar steps, by investigating the data from 28 boreholes with SPT measurements. The authors reported that saturated subsurface fine-grained soil up to a depth of 4 m had a low factor of safety (F.S.) value, which caused liquefaction potential for a designed 7.5 Mw earthquake located in Nigeria’s Upper Benue region. Abdullah and Aal [12] investigated safety factors and potential liquefaction by utilizing 214 SPT boreholes and geographical information systems. As a result, the authors produced a liquefaction potential index hazard map for Jeddah City in Saudi Arabia.
This study aims to develop an improved and precise liquefaction potential index for evaluating and translating outcomes into maps, to establish liquefiable areas at intensely developing parts of Cyprus. The SPT data of more than 200 boreholes were evaluated. The results indicate that the liquefaction potential of the Tuzla and Long Beach areas under a designed 6.5 Mw earthquake simulation was high, resulting in severe soil liquefaction. Although the adopted testing regime and calculation methods are well established, the use of such methods and investigation techniques still needs verification in various soil types. In this case, it is an alluvial soil deposited via streamline from a large catchment area, which is a unique geological setting for such investigations. Additionally, the verification of outcomes with various other methods proposes novelty to the study. Moreover, validating the results with geospatial data enables readers to determine investigation areas within their region, as the geospatial data depending on topographic slopes are widely available around the world through satellite imaging technology. Furthermore, the importance of historical evidence also proposes a good indication for liquefaction studies. Therefore, while this study highlights an important local problem for the region, it also contributes international knowledge by evaluating the results with respect to historical evidence, CPT measurements, surface geology aspects, and geospatial data.
2. Site Specific Data
2.1. Susceptible Soil Classification
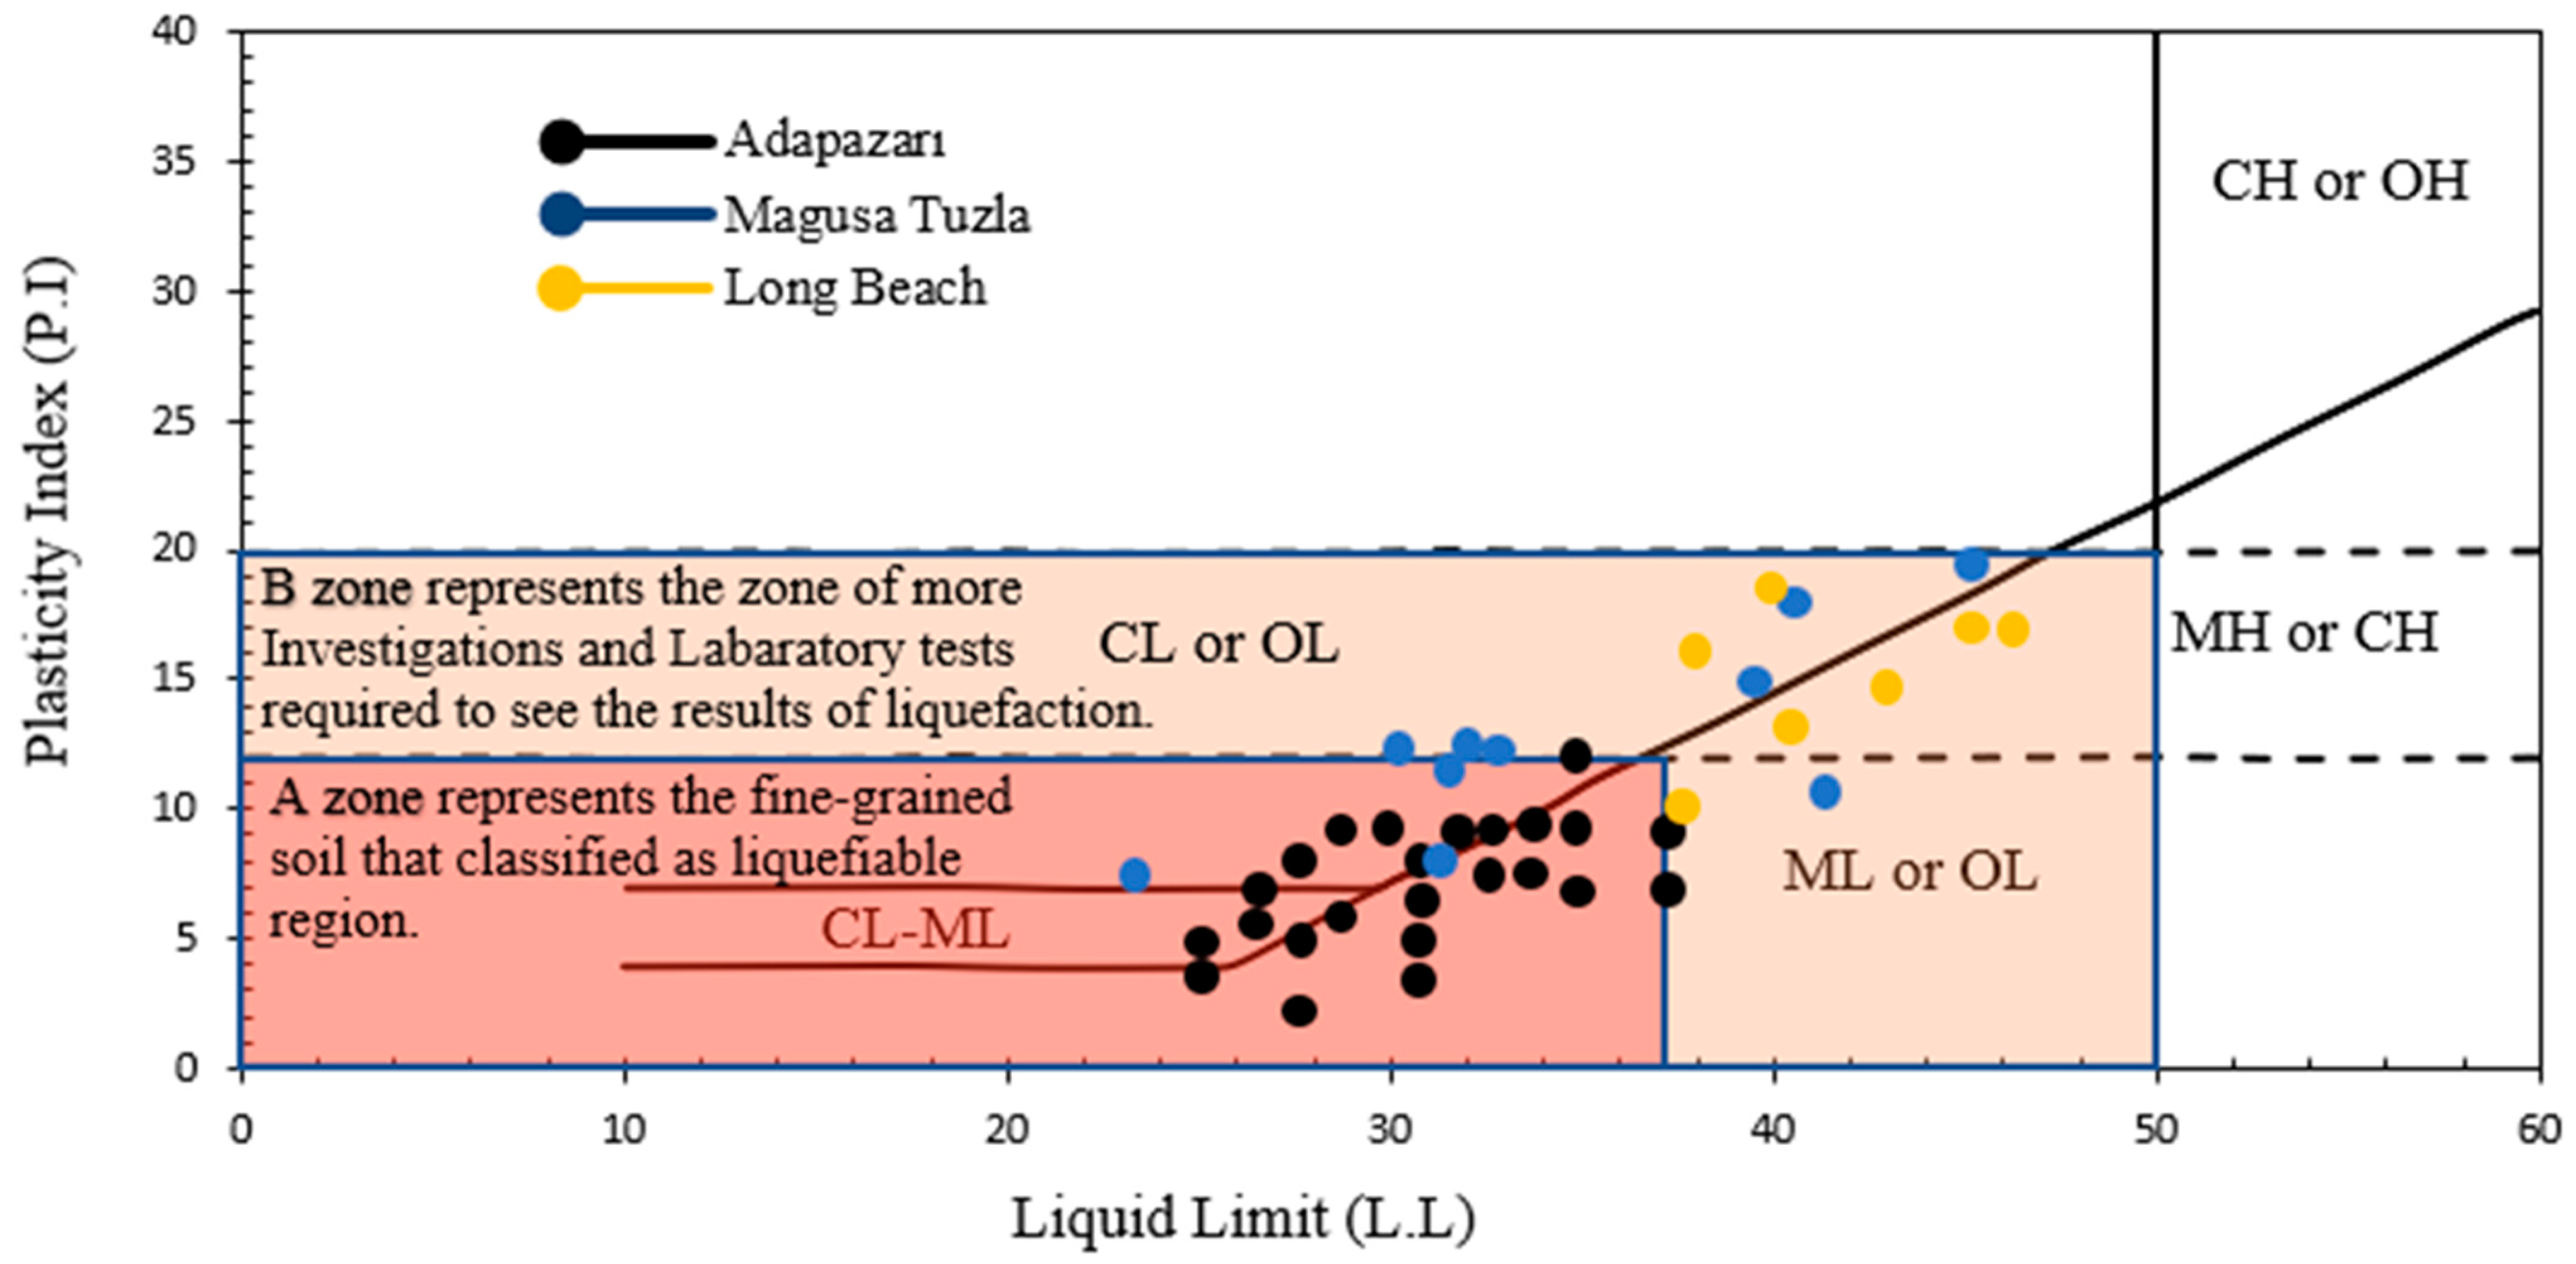
Seed et al. [13] reported that liquefaction susceptibility criteria were applied to soil strata up to 20 m deep for the boreholes. The fine-grained soil was classified as liquefiable when the liquid limit was less than 37%, and the plasticity index (P.I.) was less than 12%. The recommendations of Seed et al. [13] and Bray et al. [9] for fine-grained soils for the 12 construction sites in the 1999 Adapazar Kocaeli earthquake are shown in Figure 2. As described by Seed, even soils consisting of soil layers with a P.I. higher than 12% were liquefied in that region. This study classified liquefiable fine-grained soils according to the Seed et al. [13] susceptibility criteria. Zone A represents the fine-grained soil classified as a liquefiable region. Zone B represents the region where more investigations and laboratory tests are required to see the results of liquefaction occurrence. Characterization tests were performed at Tuzla and Long Beach regions’ fine-grained soils in accordance with earlier historical evidence and studies. Figure 2 shows the zones of Tuzla and Long Beach soils with the Adapazarı liquefied fine-grained soils in the 1999 earthquake. The figure shows that both Tuzla and Long Beach regions’ fine-grained soils fall into Zone A and mostly Zone B, which means further investigation is required to see the results of liquefaction.
2.2. Borehole Locations
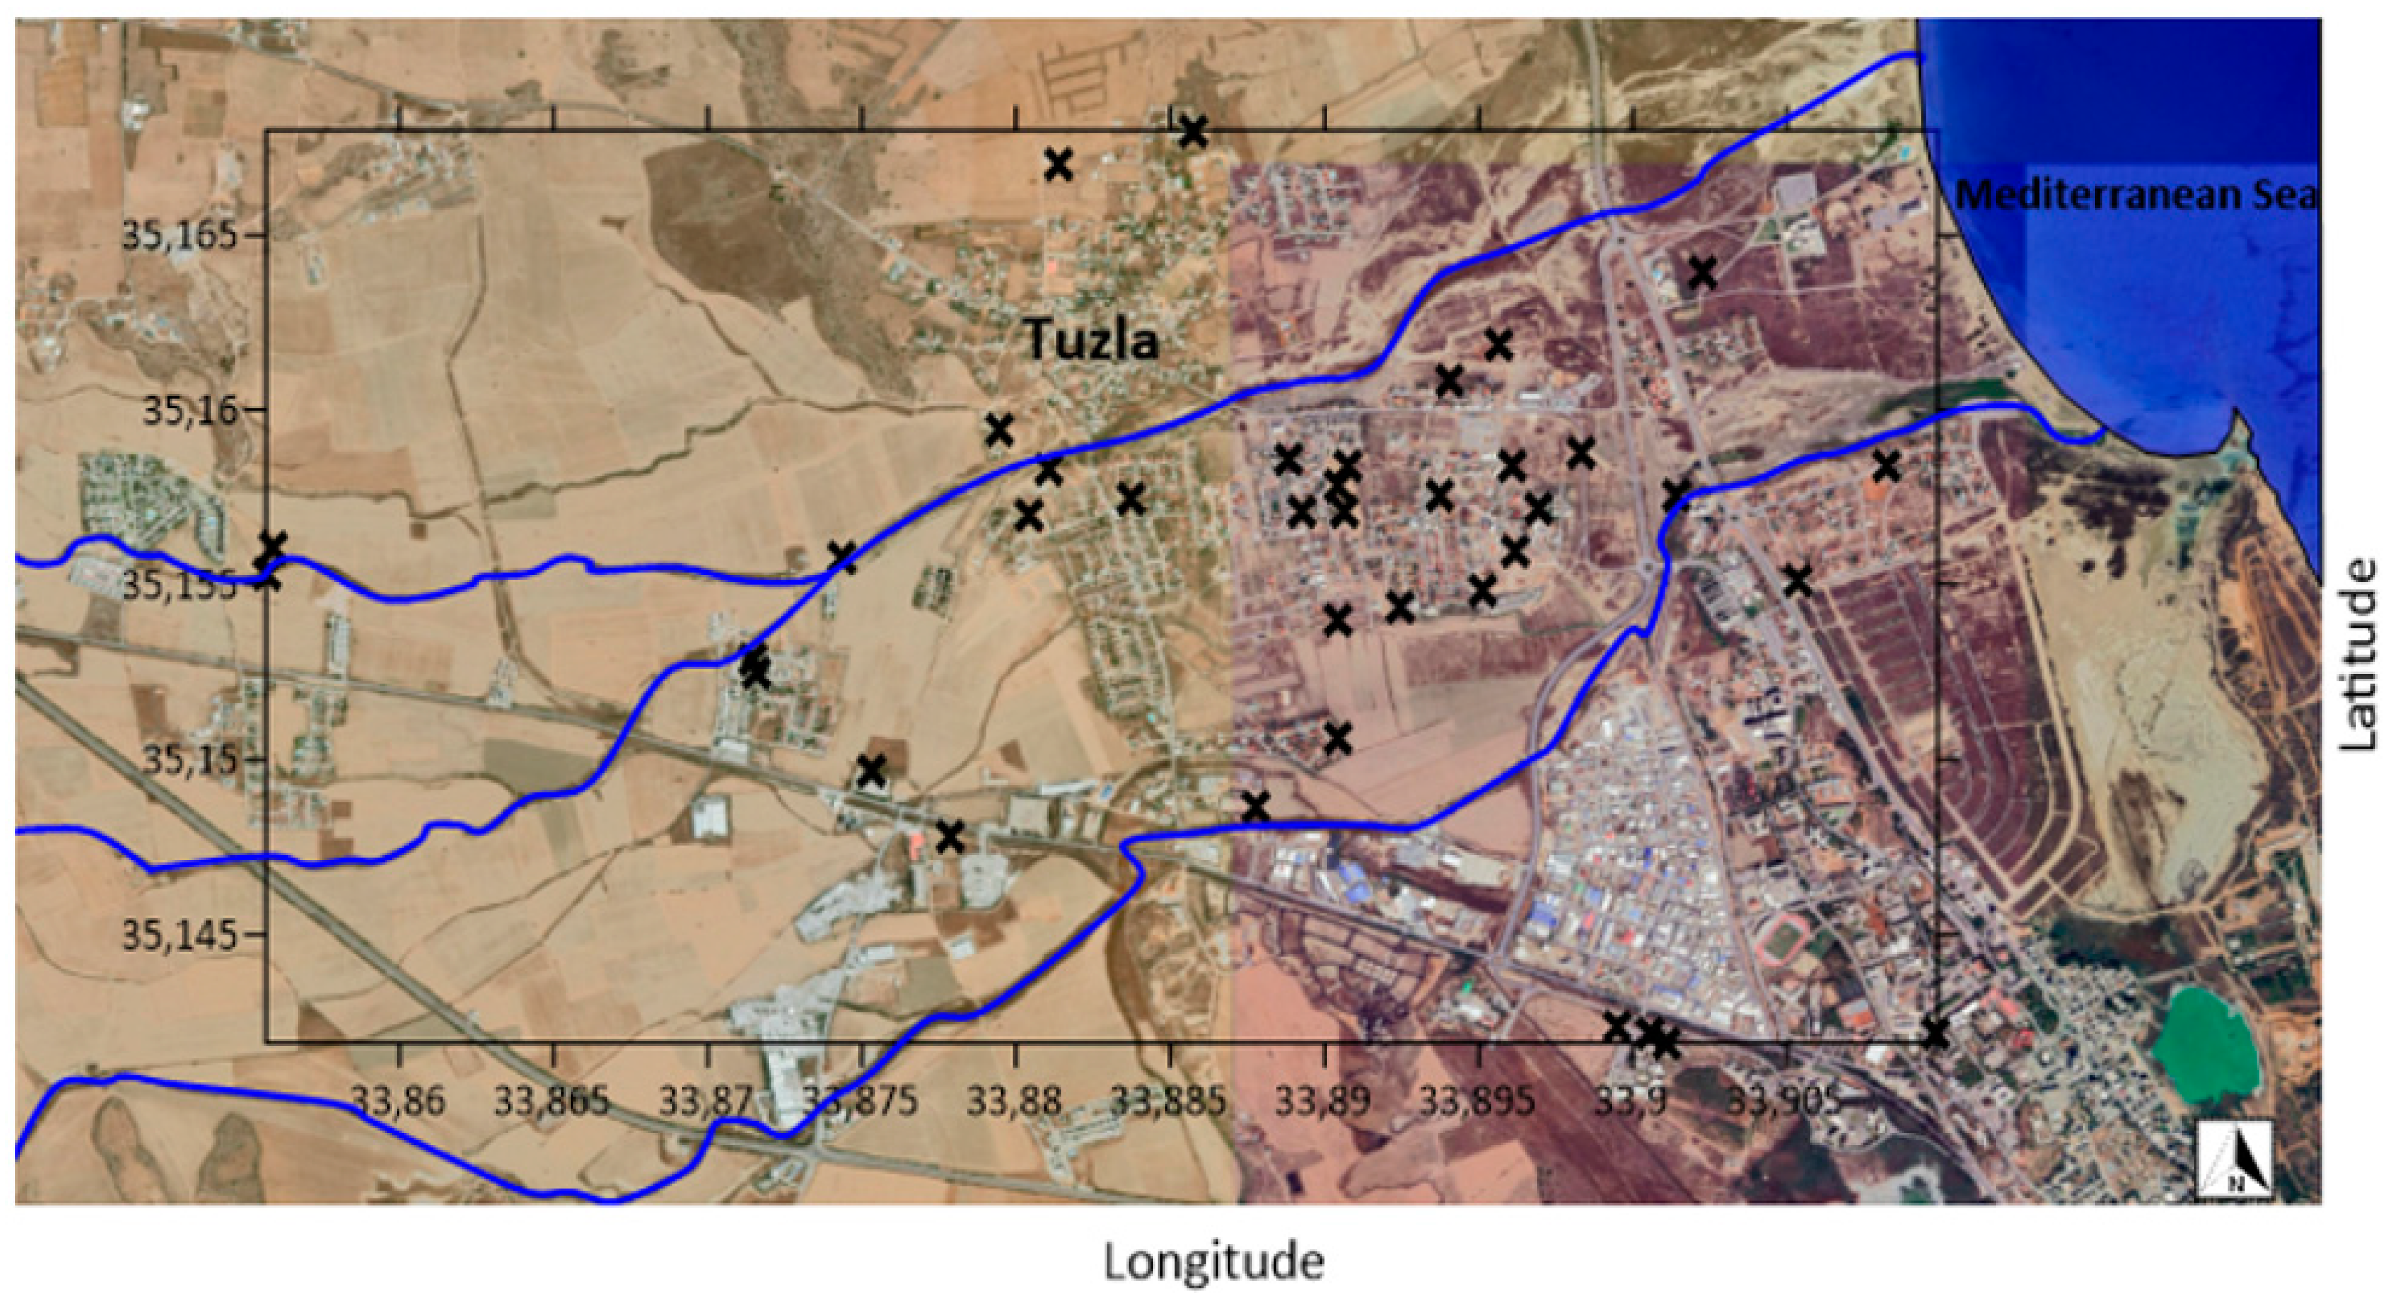
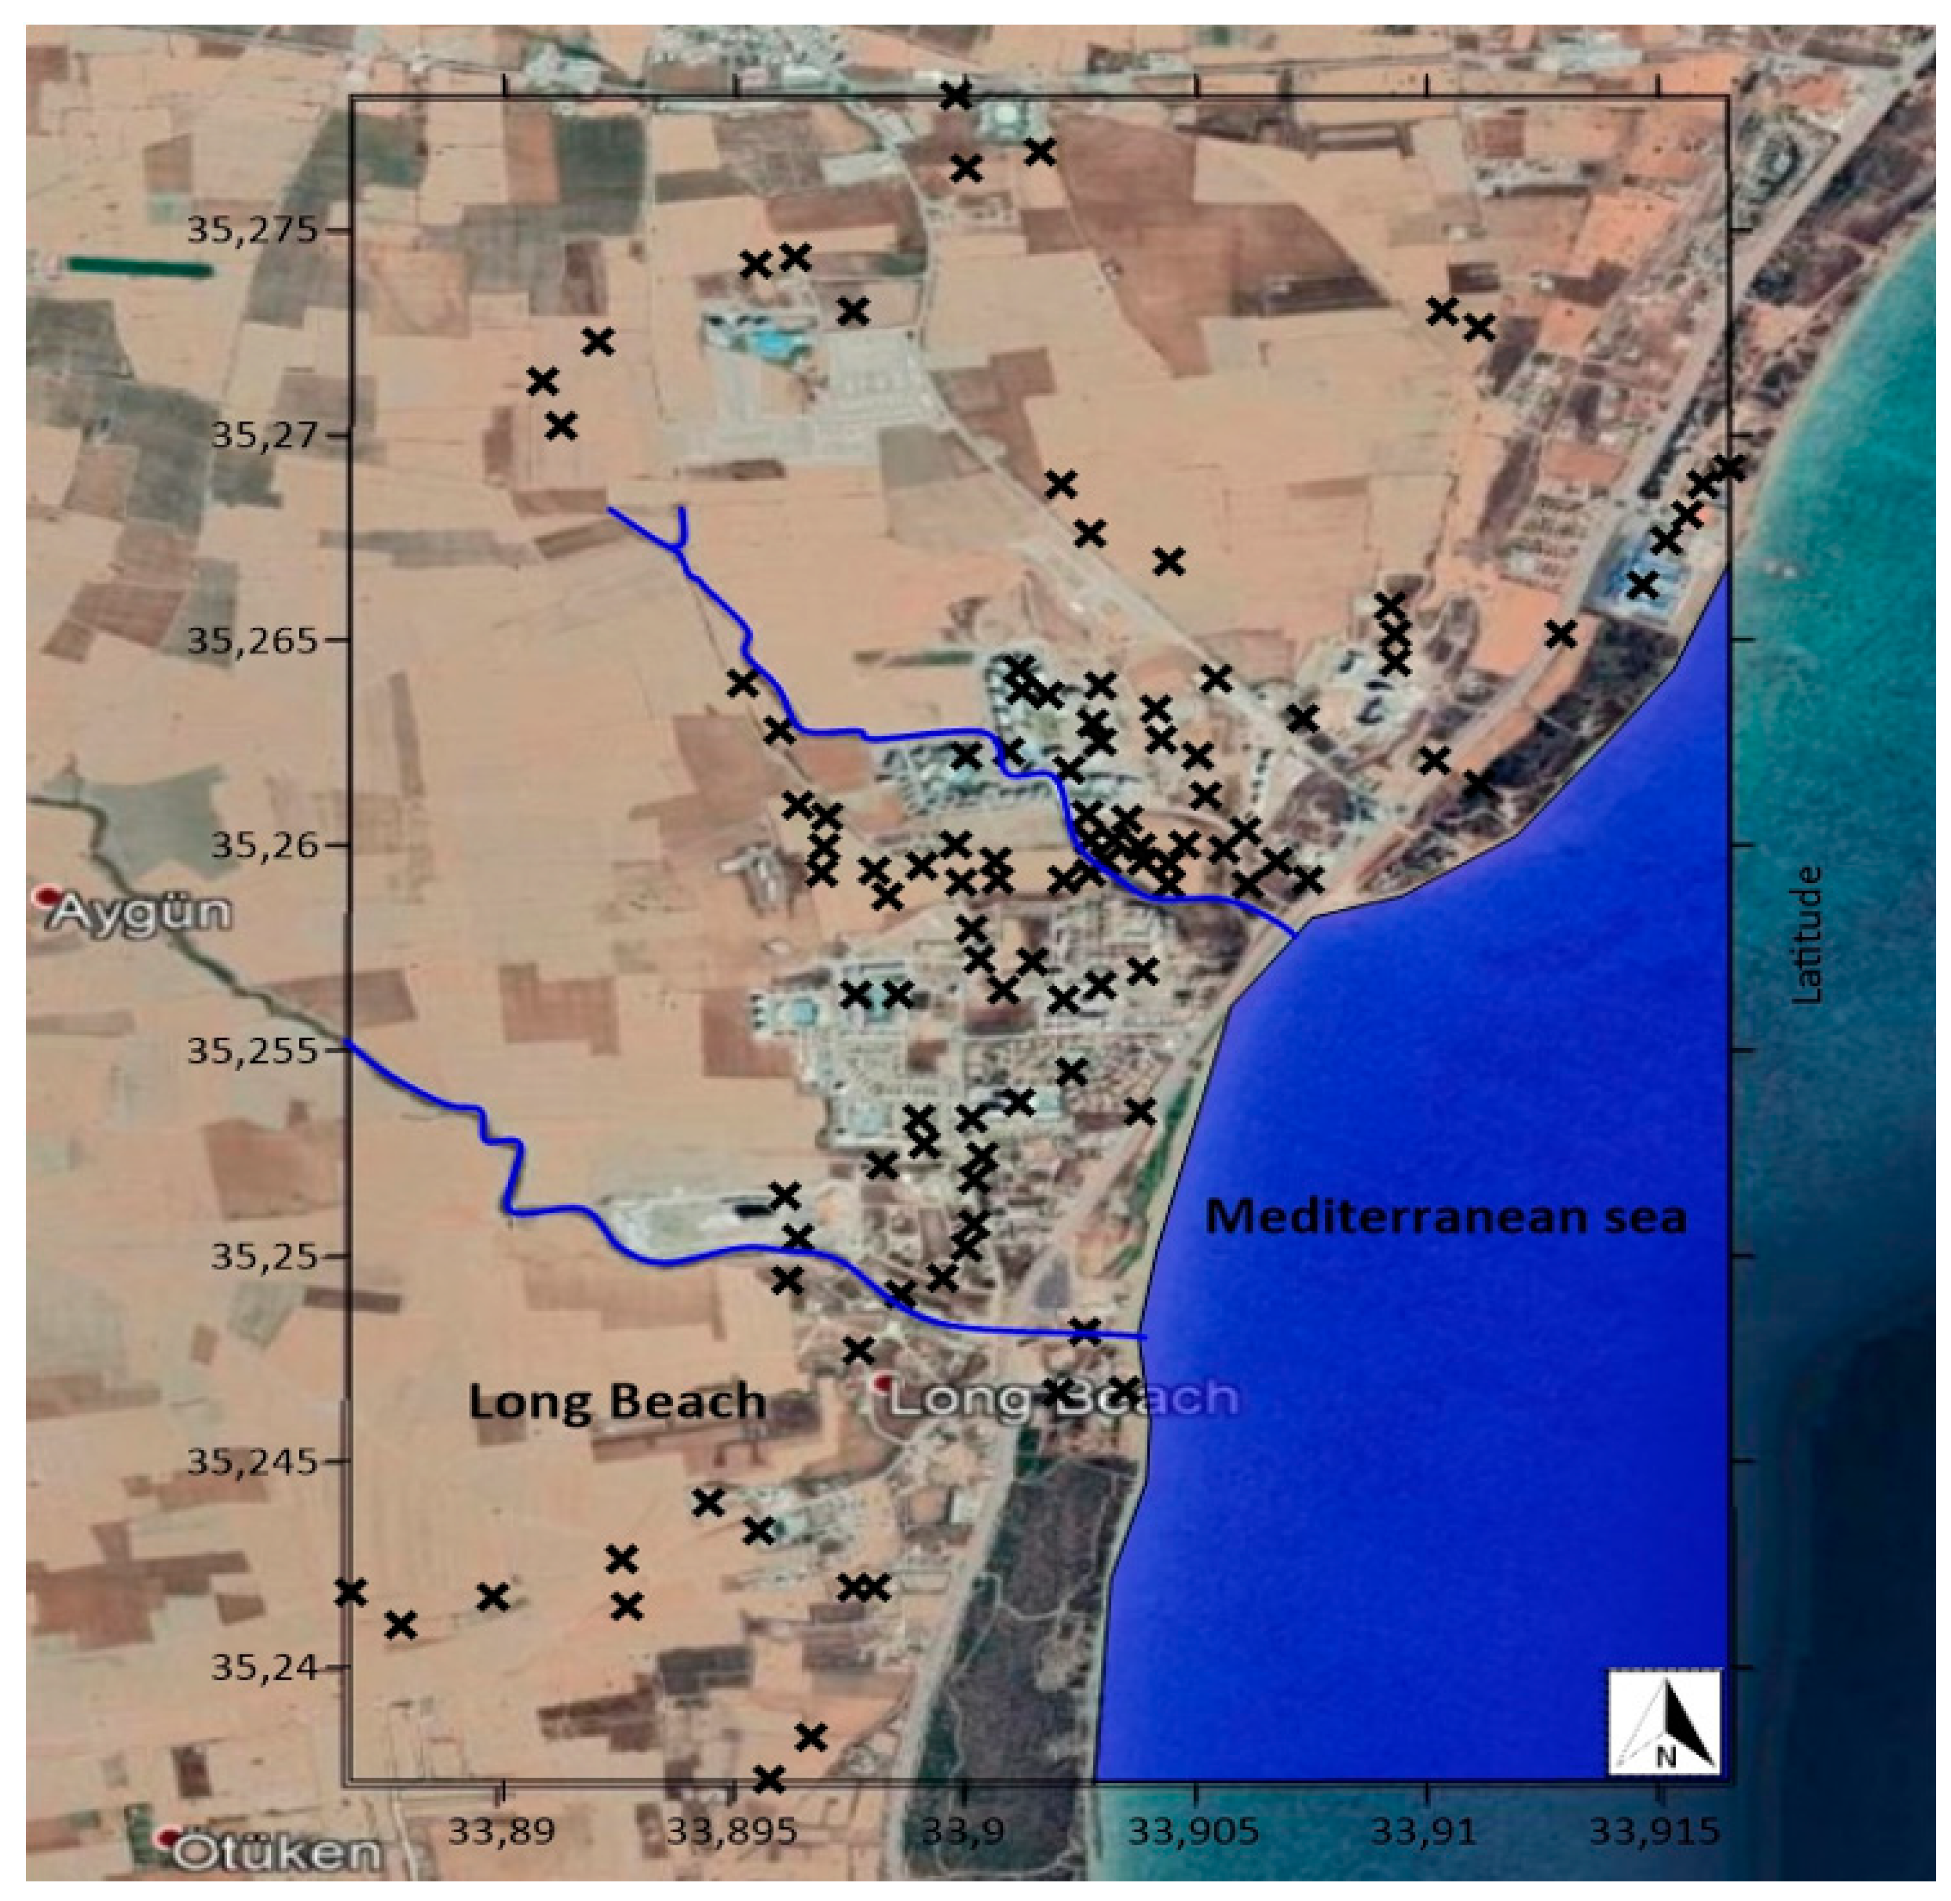
Both Tuzla and Long Beach sites are under heavy development and have a coast on the Mediterranean Sea (Figure 3 and Figure 4). The SPT borehole locations and streams are also shown in Figure 3 and Figure 4. Data were collected from more than 200 boreholes that were along streamlines located near the sites. In both locations, the river streams that carry rainfall from large catchment areas reach the Mediterranean Sea. It should be highlighted that the streamline that transports rainwater to Tuzla has a considerably larger basin and catchment area than Long Beach. Consequently, it was hypothesized that the Tuzla region had a far greater potential to contain alluvial soils capable of causing liquefaction.
2.3. Investigation of Boreholes
The borehole data that were utilized to perform this study were provided by the Union of Turkish Engineers and Architects, the Chamber of Civil Engineers (UCCTEA-CCE, Nicosia, Cyprus [14]. At each borehole, the standard penetration test (SPT) was performed according to the ASTM D1586/D1586M-18e [15]. The standard penetration test is an in situ subsurface exploration test utilized in order to obtain and analyze raw data, which is then used in acquiring geotechnical properties and parameters of the soil. According to Nixon [16], it was first developed in 1927 and used in an industrial scale in 1947. Subsequent to its use in the industry, the method was standardized in 1958 by the American Society of Testing Materials (ASTM D1586/D1586M-18e1) [15]. The standard penetration test is the most favoured and commonly used subsurface exploration drilling test all over the globe. Clayton [17] stated that 80–85% of foundation designs around the world are based on the SPT. It is preferred due to the simplicity of the methodology and equipment, but also the cost. The SPT is mostly applicable to granular soils [18].
Prescreening was performed on the SPT data to eliminate poor quality test results. In this respect, in situ test results have been evaluated in comparison to laboratory test results performed by the authors of this study. In some cases, the investigation of numerous boreholes was necessary for nearby locations due to human errors that could have occurred while performing the site investigations, or due to varying soil characteristics over short distances.
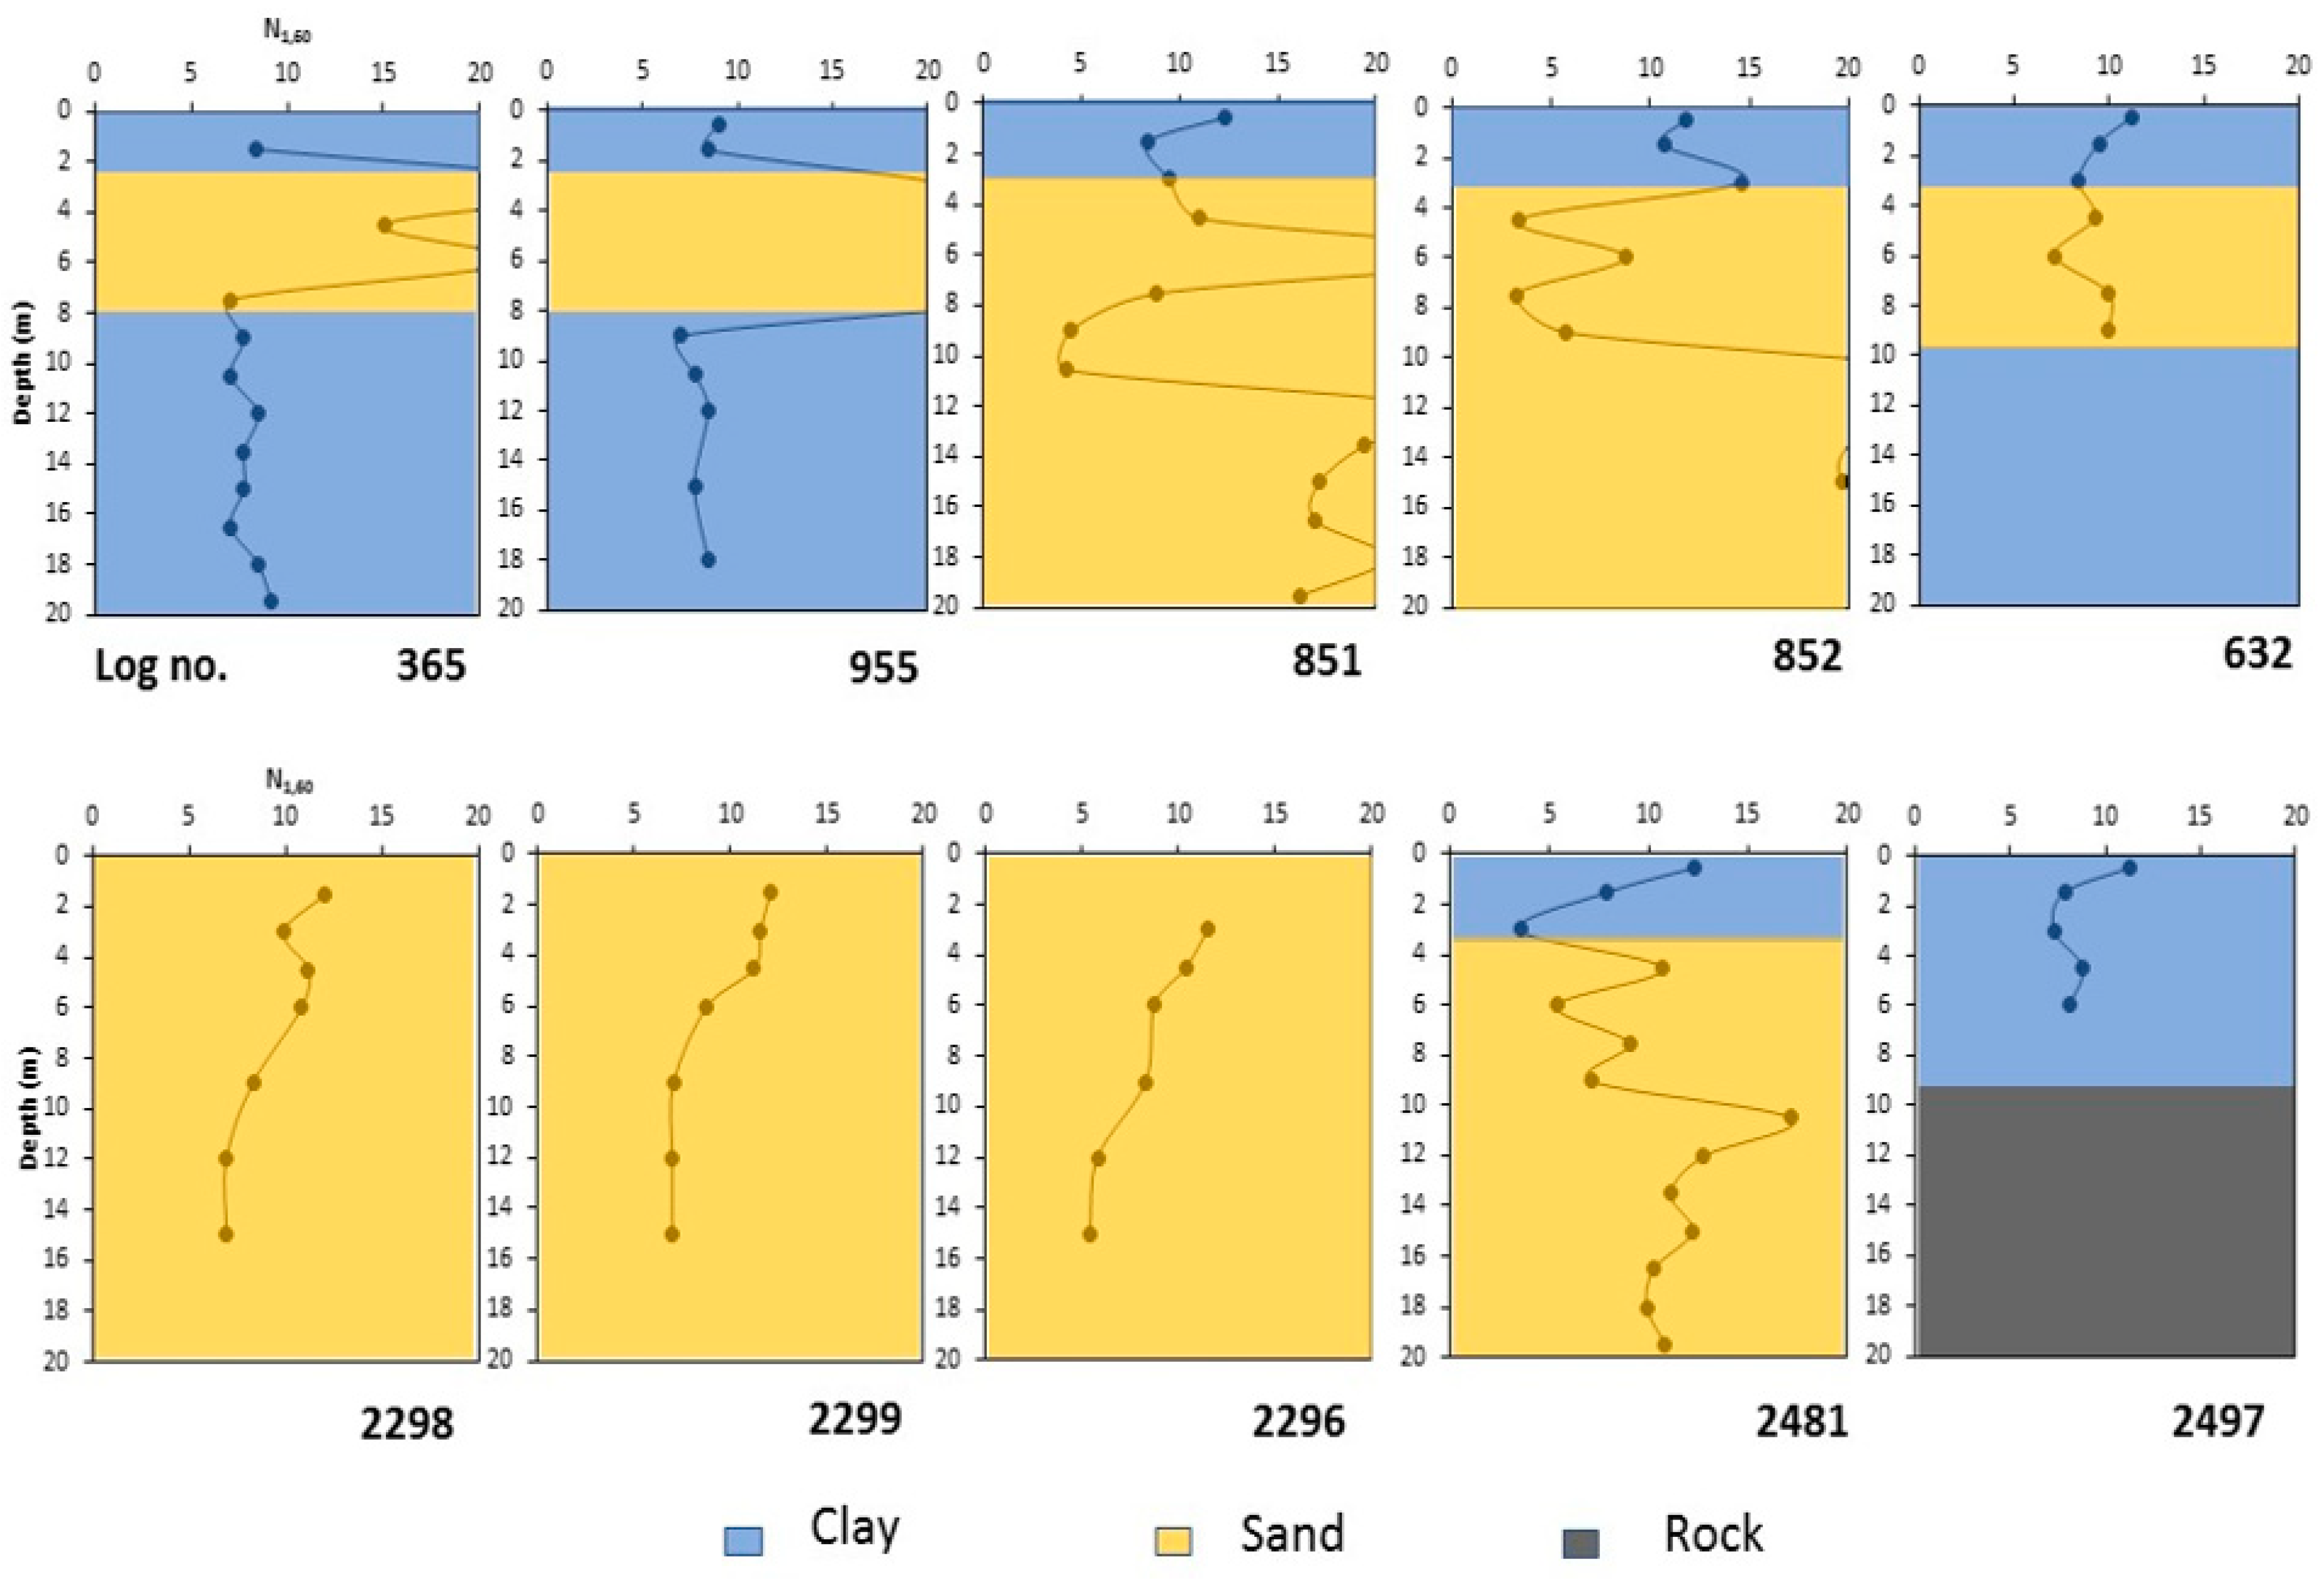
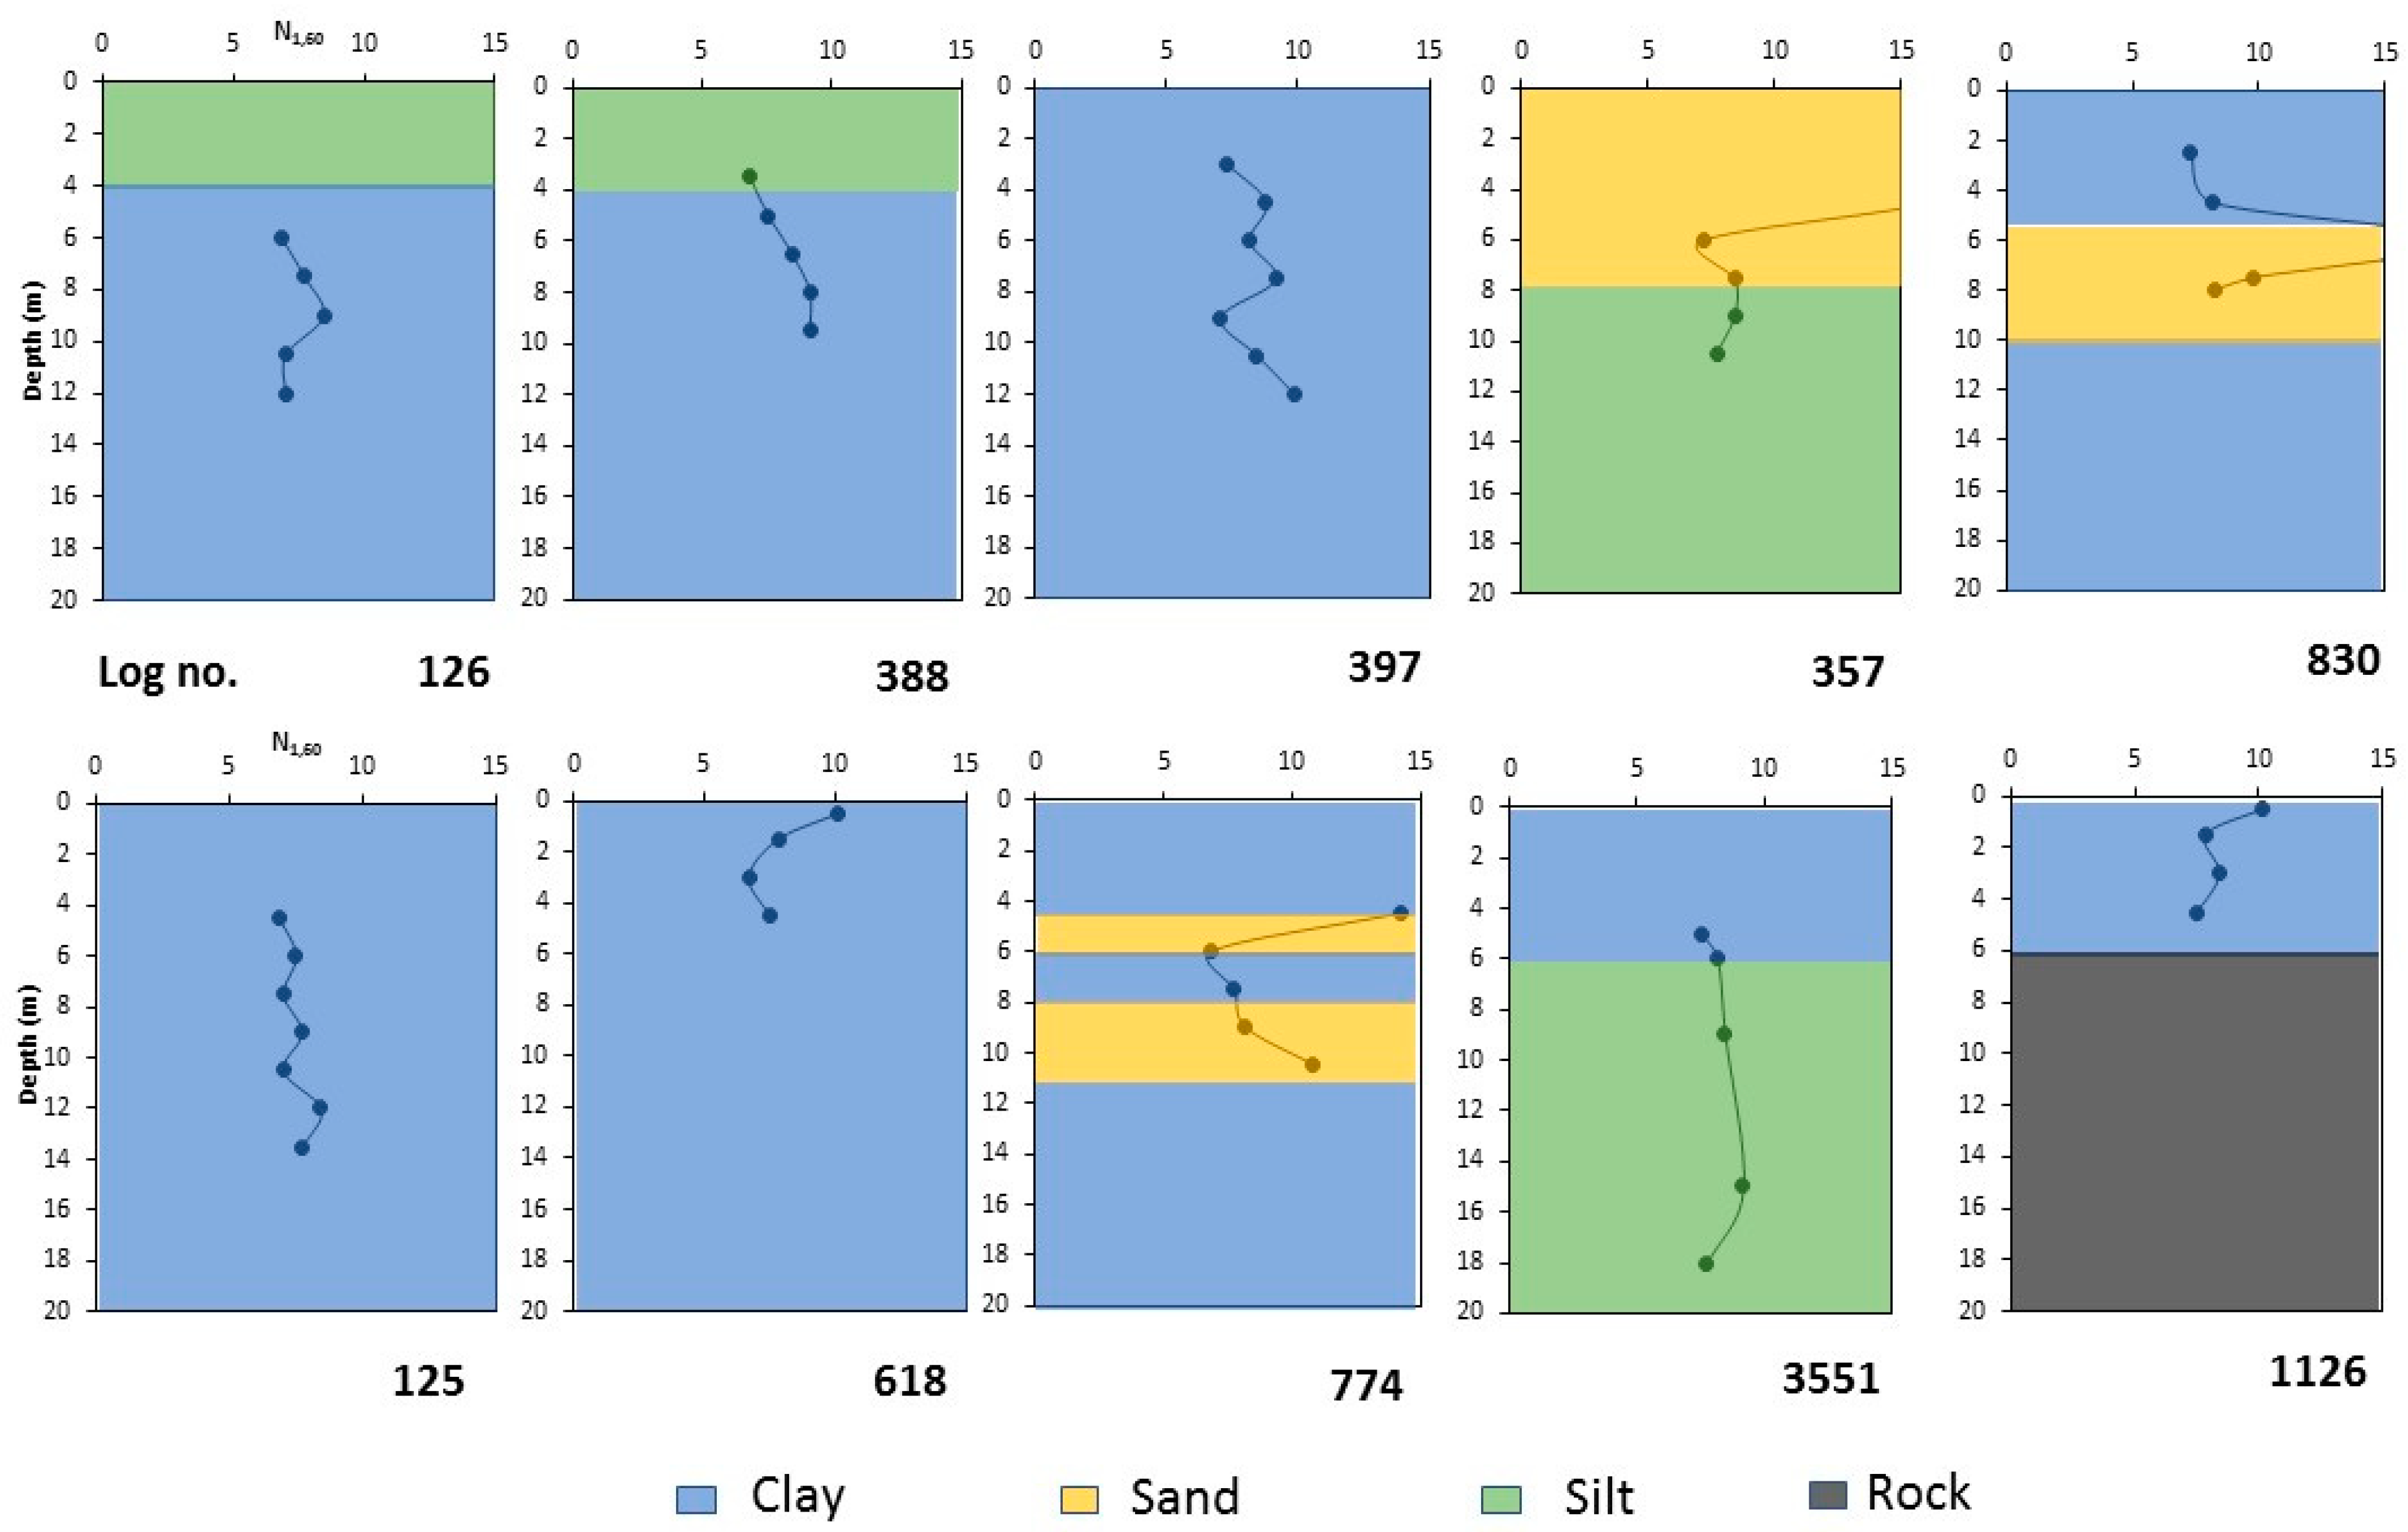
The primary data from the on-site SPT boreholes provided an initial idea of the liquefaction potential of the sites. The SPT borehole blow counts in every 1.5 m depth from the Long Beach and Tuzla sites are shown in Figure 5 and Figure 6. The N1.60 (corrected blow count) values are generally shown to be between 5 and 10. These low blow count results are suspected to indicate that the named sites have liquefaction potential. Furthermore, it was observed in Figure 2 that, depending on the physical characteristics, soils from both sites fall into zones that may be susceptible to liquefaction.
3. Methods
3.1. Methodology
Different liquefaction evaluation procedures were developed using the SPT, which began in 1964 with the Niigata earthquake. After the earthquake, many researchers published numerous developments on liquefaction. The evaluation and analysis of the liquefaction potential of soil sediments involve the characterization of the soil subjected to seismic loading, and the characterization of soil resistance to liquefaction. Two possible methods to determine the liquefaction potential of soil were developed by Kuribayashi and Tatsuoka [19], Seed and Idriss [20], and Seed et al. [21]. The first approach is plotting the magnitude versus epicentral distance to the farthest occurrence of the liquefaction, which presumes and proposes a simple relation, and generalizes the liquefaction occurrence [18]. Other parameters, such as the zone of faulting, the total energy released, and soil characteristics, are even more critical than the magnitude and epicentral distance. However, the magnitude plots versus the epicentral distance provide an approximation. Seed and Idriss [20] developed the second approach, which estimates a shear stress level that can be generated at the site under a given designed earthquake. However, these two approaches are not comparable. The first one can be used as a screening guide for the likely liquefaction of a site in relation to the magnitude and the distance, while the second one is a detailed approach used for evaluating the liquefaction potential.
The prediction of liquefaction resistance, developed by Seed and Idris [20], is used worldwide and is also called the “Simplified Procedure”. The procedure was initially developed for the SPT and has been revised several times. In addition to the SPT, two additional procedures were developed and are being used for liquefaction resistance. These are the cone penetration test (CPT) and the shear wave velocity test (Vs). According to Youd and Idriss [22], the SPT and CPT are the most used methods, and numerous studies have been performed utilizing these tests. Each test method has advantages and disadvantages, as shown in Table 1. In this study, SPT data were utilized, as it is the most widely available site investigation method, and numerous data were available for the subject sites.
3.2. Cyclic Shear Stress Ratio (CSR)
In this study, the simplified procedure of Seed and Idriss [20] is used, as suggested by Idriss and Boulanger [23], as the maximum shear stress that can be estimated. In this respect, the cyclic shear stress ratio (CSR) can be expressed as:
where, σv represents the total vertical stress, σ’v represents effective vertical stress, and amax is the maximum ground acceleration parameter. amax was calculated using a formula developed by Fukushima and Tanaka [24], Equation (2), and Yih-Min Wu et al. [25], Equation (3). It can be expressed as
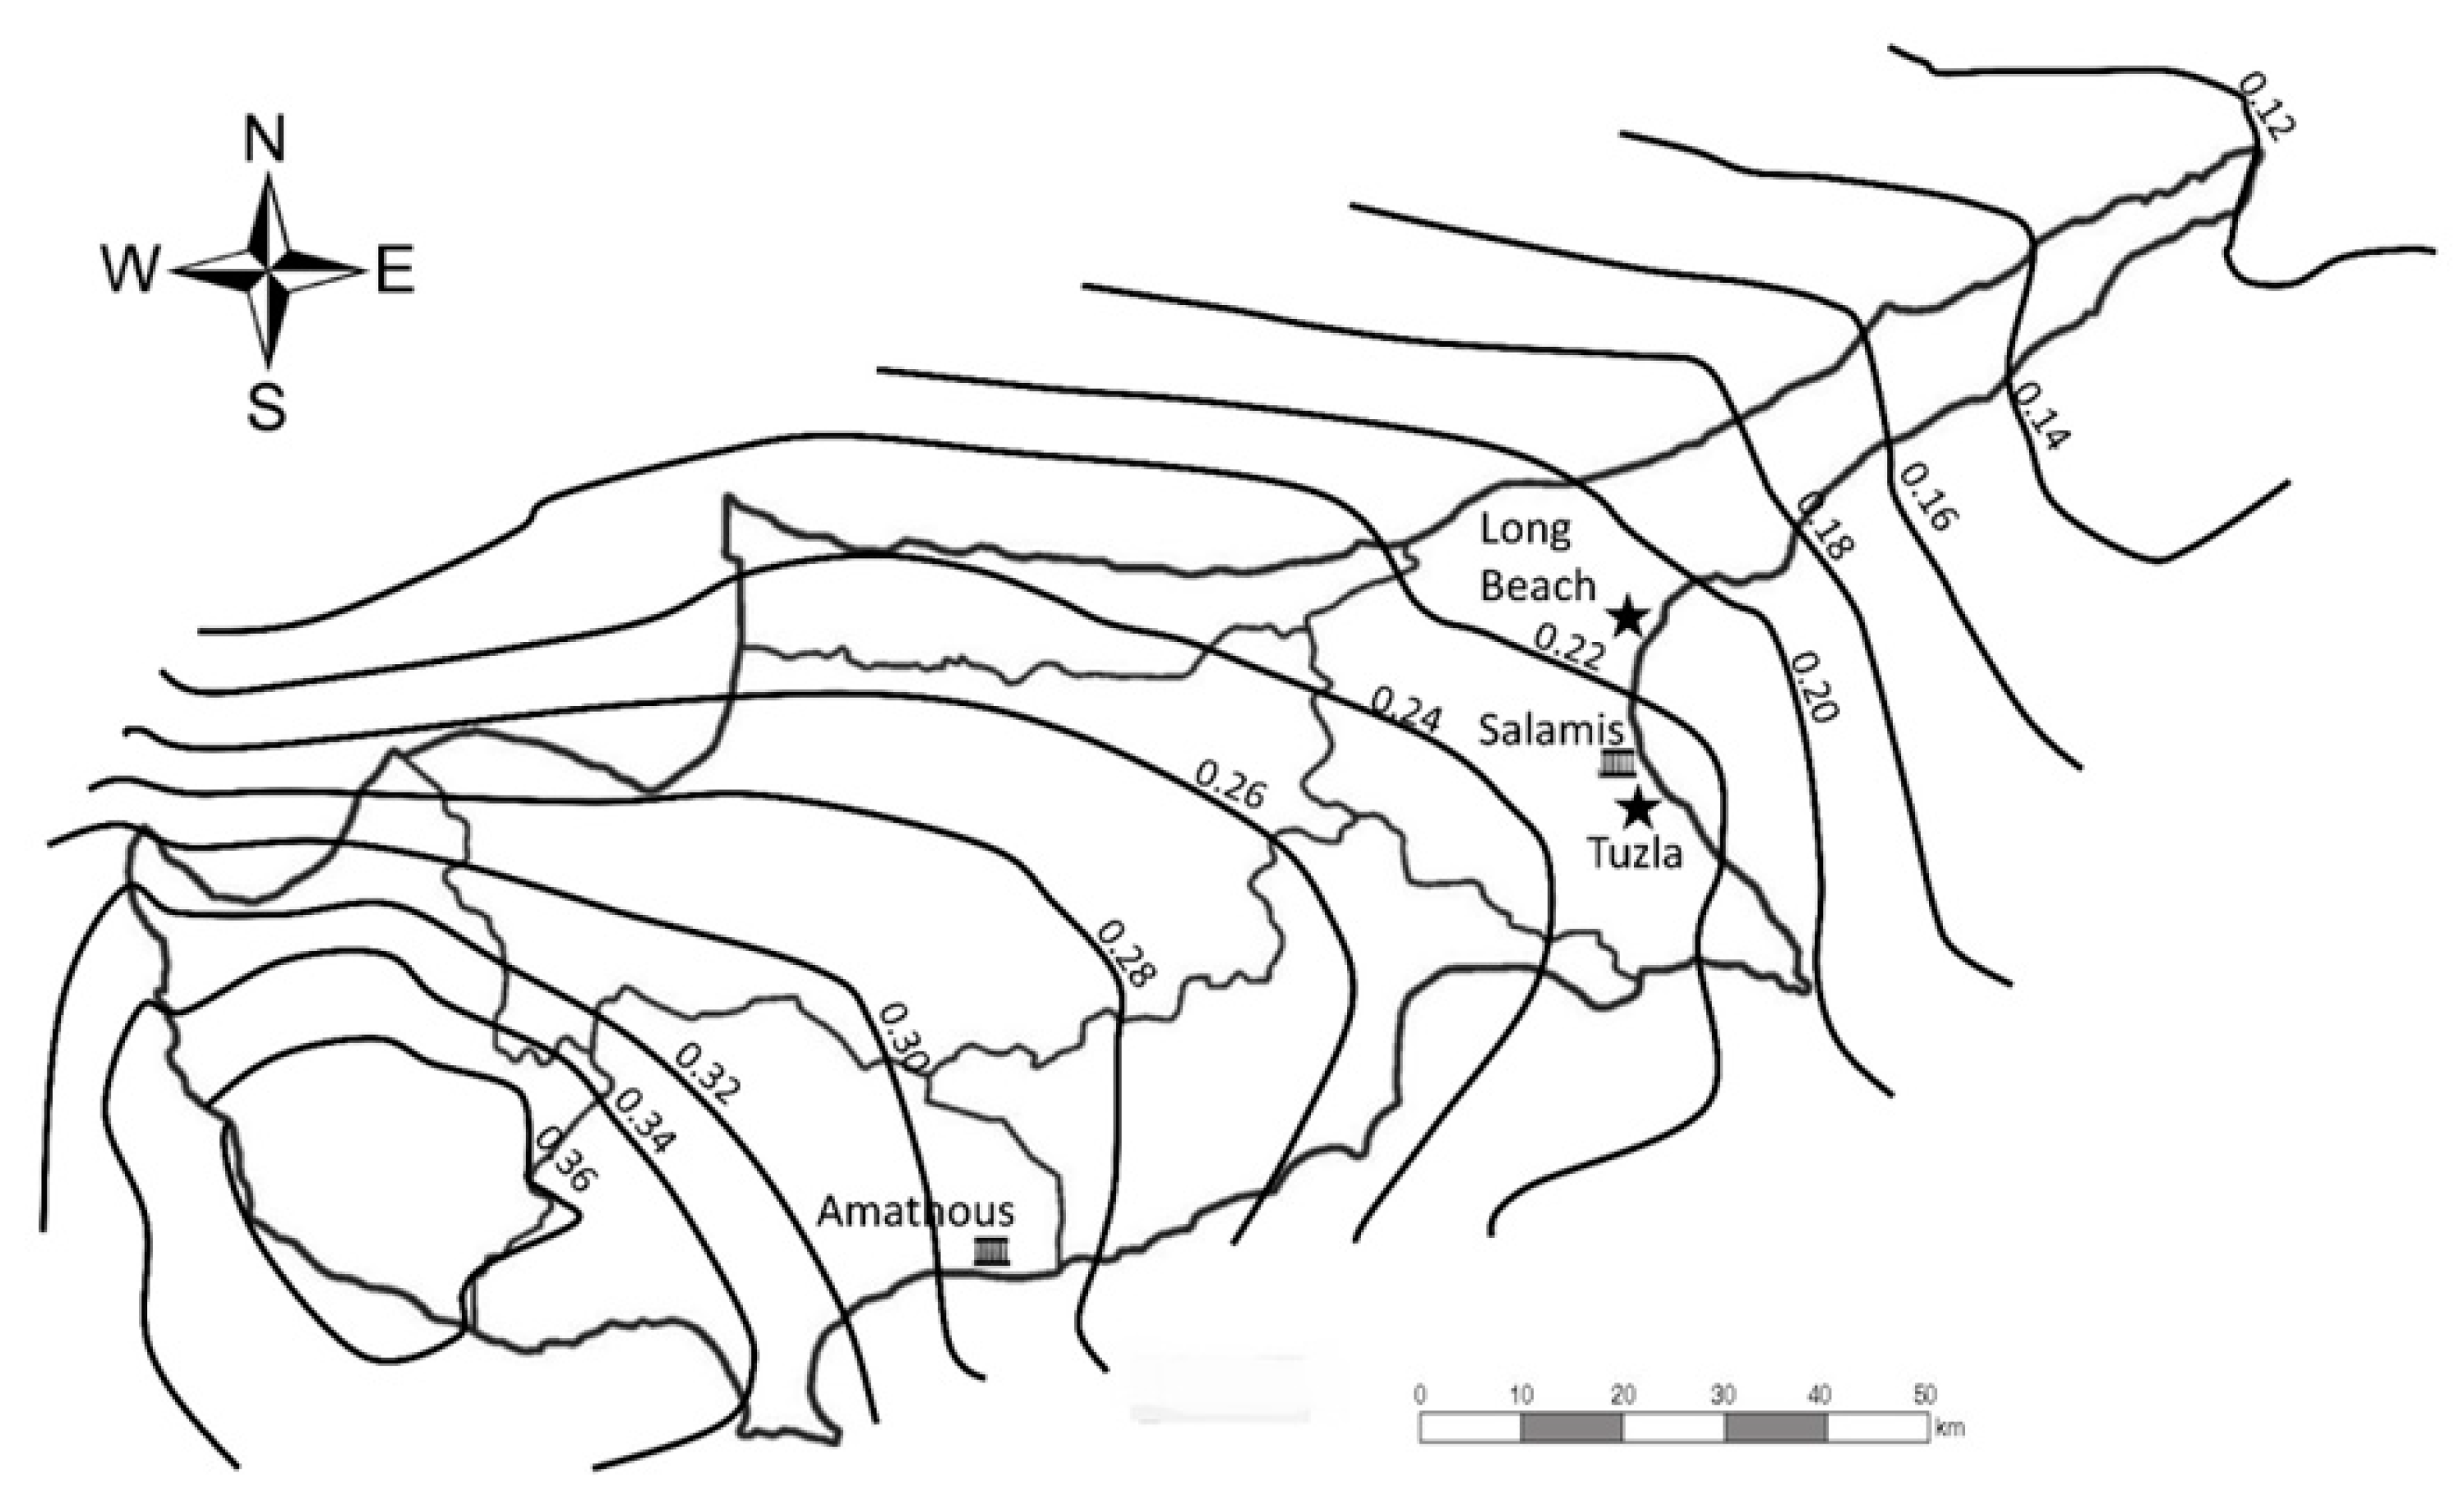
where, 1 gal (cm/s2) = 1.02 × 10⁻³ g, R is equal to 20 km, and Mw represents a 6.5 magnitude earthquake. For the Tuzla area, a maximum ground acceleration of 0.23 was calculated in gravitational acceleration (g). The results were compared with an earlier study by Algermissen and Rogers [26] performed earlier for the same territory, with regard to peak ground acceleration for the same designed earthquake conditions. Similarly, 0.23 was calculated in the Algermissen and Rogers [26] study for the same territory (Figure 7).
The soil is more similar to a flexible body than a rigid one. As a result, the rigid body shear stress decreases by a correction factor or stress reduction factor (rd) to yield the deformable body shear stress, which measures the attenuation of peak shear stress with depth due to nonelastic soil behavior. Several researchers have suggested modifications to rd. In this study, rd is determined using Idriss and Boulanger’s [23] rd equations, expressed as:
where, z = depth below the ground surface in meters.
The magnitude scale factor (MSF) can be applied to the CSR formula as a division factor. For a 7.5 magnitude earthquake, the MSF is taken for granted as the one in the literature. The scale factor needs to be converted to a 7.5 magnitude scale for earthquakes of different magnitudes. Seed and Idriss [23] developed an MSF conversion formula that considered the convenience of calculating a particular earthquake factor, which is expressed as:
where, Mw stands for the earthquake moment magnitude of the earthquake.
Furthermore, deposits are subjected to an overburden pressure in liquefiable soils. Therefore, Idriss and Bolanger [27,28] recommended Kσ as a correction factor that extrapolated the simplified method. In this study, the correction factor has been applied to soil layers above σ’v = 100 kPa (1 atm) pressure.
3.3. Cyclic Resistance Ratio (CRR)
The cyclic resistance ratio (CRR) was calculated from a study by Idriss and Boulanger [23], and is used to obtain the CRR results from the corrected SPT blow numbers (N1(60)) in this study. The authors express it as: this correlation in terms of N1(60) for different values of fines content (FC). That CRR formulation for the SPT procedure is created for summarizing case history data and examining their distributions across a range of conditions.
Idriss and Bolunger [23] expressed the methodology that is used in their paper to obtain the calculation of N1(60) (corrected SPT blow numbers) originating in the SPT test for 30 cm penetration blow counts, and was developed by Skempton [29]. It corresponds to the normalized value using various in situ test corrections at a geostatic pressure of 1 bar applied to the overburden coefficient. It is expressed as:
where, CN is the overburden correction factor, CE is the energy correction factor, CR is the rod length correction factor, CB is the borehole diameter correction factor, and CS is the liner correction factor.
The CN correction factor is calculated using a formula developed by Liao and Whitman [30], which is expressed as:
According to Liao and Whitman [30], the proposed CN correction factor must be between 0.5 and 2.0. The CN correction can only be applied to calculate the relative density and shear resistance angle, and cannot be implemented on undrained parameters.
According to Idriss and Bolulanger [23], the liquefaction case histories indicate that when the fines content (F.C.) increases, the liquefaction initiating correlations move to less suspected, as seen by current SPT-based correlations. It is necessary to apply a fineness correction to the equivalent N1(60) to obtain the clean sand equivalent N1(60)cs from which to extrapolate the SPT blow number of the sand. Numerous equations have been proposed in the literature for clean sand correction. Thus, when empirically obtained using liquefaction case history data, and accounting for the impacts of fines content to the CRR [23], it is expressed as:
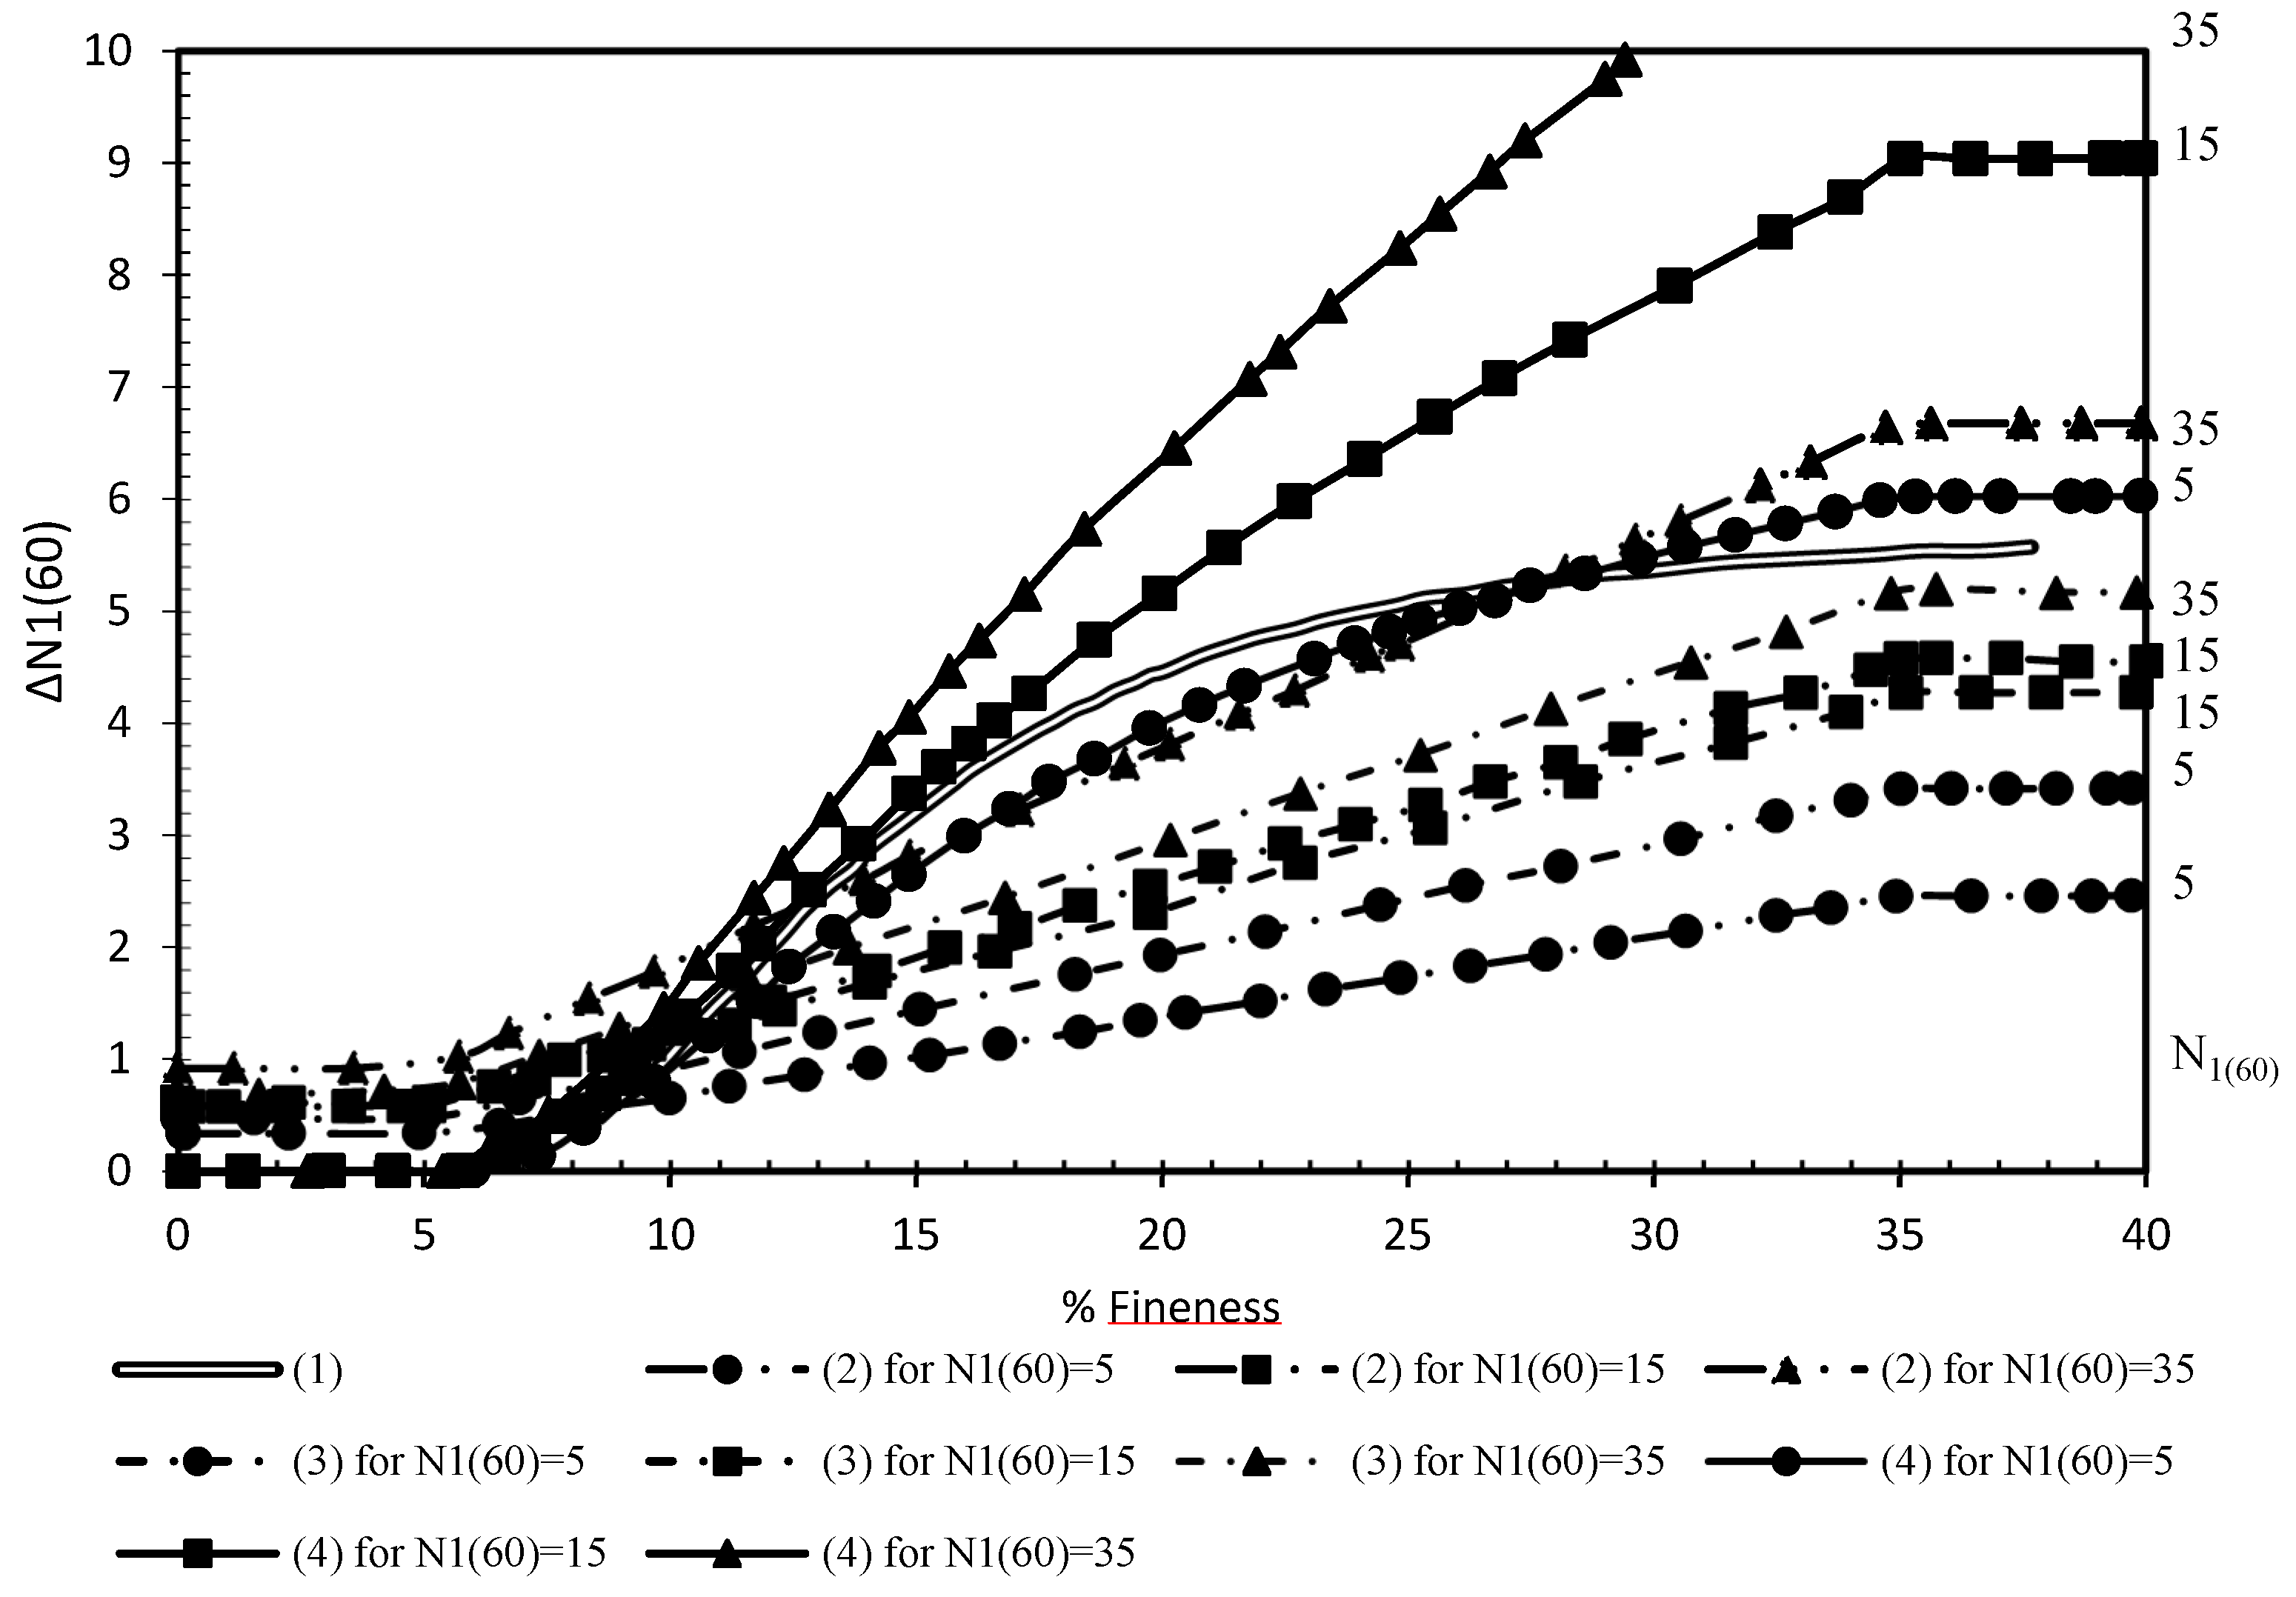
Figure 8 presents the correction values according to the amount of fines content in respect to various approaches developed for clean sand correction [27,31,32,33]. It is clear from the figure that the Idris and Baulanger [27] curve seems to plot an average of all other proposed curves. In a later study, Idriss and Boulanger [23] proposed the Equation (12) as an update to earlier study.
In order to keep the consistency of this study and to avoid mixed methodology, Equations (11) and (12) of Idriss and Boulanger’s [23] methodology is adopted to calculate fineness correction.
3.4. Factor of Safety against Liquefaction
The factor of safety against liquefaction (F.S.) is commonly used to quantify liquefaction potential. It is obtained from [23]:
where, CRRM = 7.5 is the cyclic resistance ratio for a magnitude 7.5 earthquake, and CSRM = 7.5, σV = 1 is the cyclic shear stress ratio converted to the desired CRRM = 7.5 by using a steeper MSF relationship, as stated earlier.
Both CSR and CRR vary with depth, therefore in this study, the factor of safety (F.S.) indicates potential liquefaction at a specific depth. The high value of F.S. indicates that the resistance to liquefaction exceeds the earthquake loading; therefore, liquefaction would not be expected.
3.5. Liquefaction Potential Index
The prediction of the liquefaction potential index of the boreholes was calculated using a formula provided by Iwasaki et al. [34], expressed as:
where, F(z) is a severity function of the LPI, and F(z) = 1 − F.S. when F.S. < 1. There are many debates in the literature that the soil can be liquefied until F.S. = 1.2. Sonmez [35] was inspired by the Iwasaki [34] formulation, which stated that soils could be liquefied up to the range of 1 < F.S. < 1.2. Subsequently, the author proposed the following:
The equation becomes F(z) = 0 if F.S. is more than or equal to 1.2, because no liquefaction occurs above that value. In this study, a modified liquefaction potential formulation by Sonmez [35] was adapted to the range of 1 < F.S. < 1.2 since, according to the Building Seismic Safety Council [36], the F.S. value between 1.1 and 1.3 is considered appropriate for residential structures, as liquefaction may occur if F.S. exceeds 1.
Furthermore, z is the depth of layers in meters, computed from weighting factor w(z) = 10 − 0.5 z up to a depth of 20 m. According to Iwasaki [34], liquefaction can occur up to a depth of 20 m. However, the possibility of liquefaction is not the same at different depths. The liquefaction potential is high on the surface, and decreases linearly until a depth of 20 m. From this perspective, the method used to calculate the liquefaction potential index must be multiplied by a factor. The weighting factor w(z) is 10 for the surface level and 0 after a depth of 20 m, because liquefaction cannot occur beyond a 20 m depth.
Finally, the potential liquefaction index was calculated from the summation of values for different soil strata, with respect to the thickness of soil layers.
4. Results and Discussion
4.1. Factor of Safety Distributions
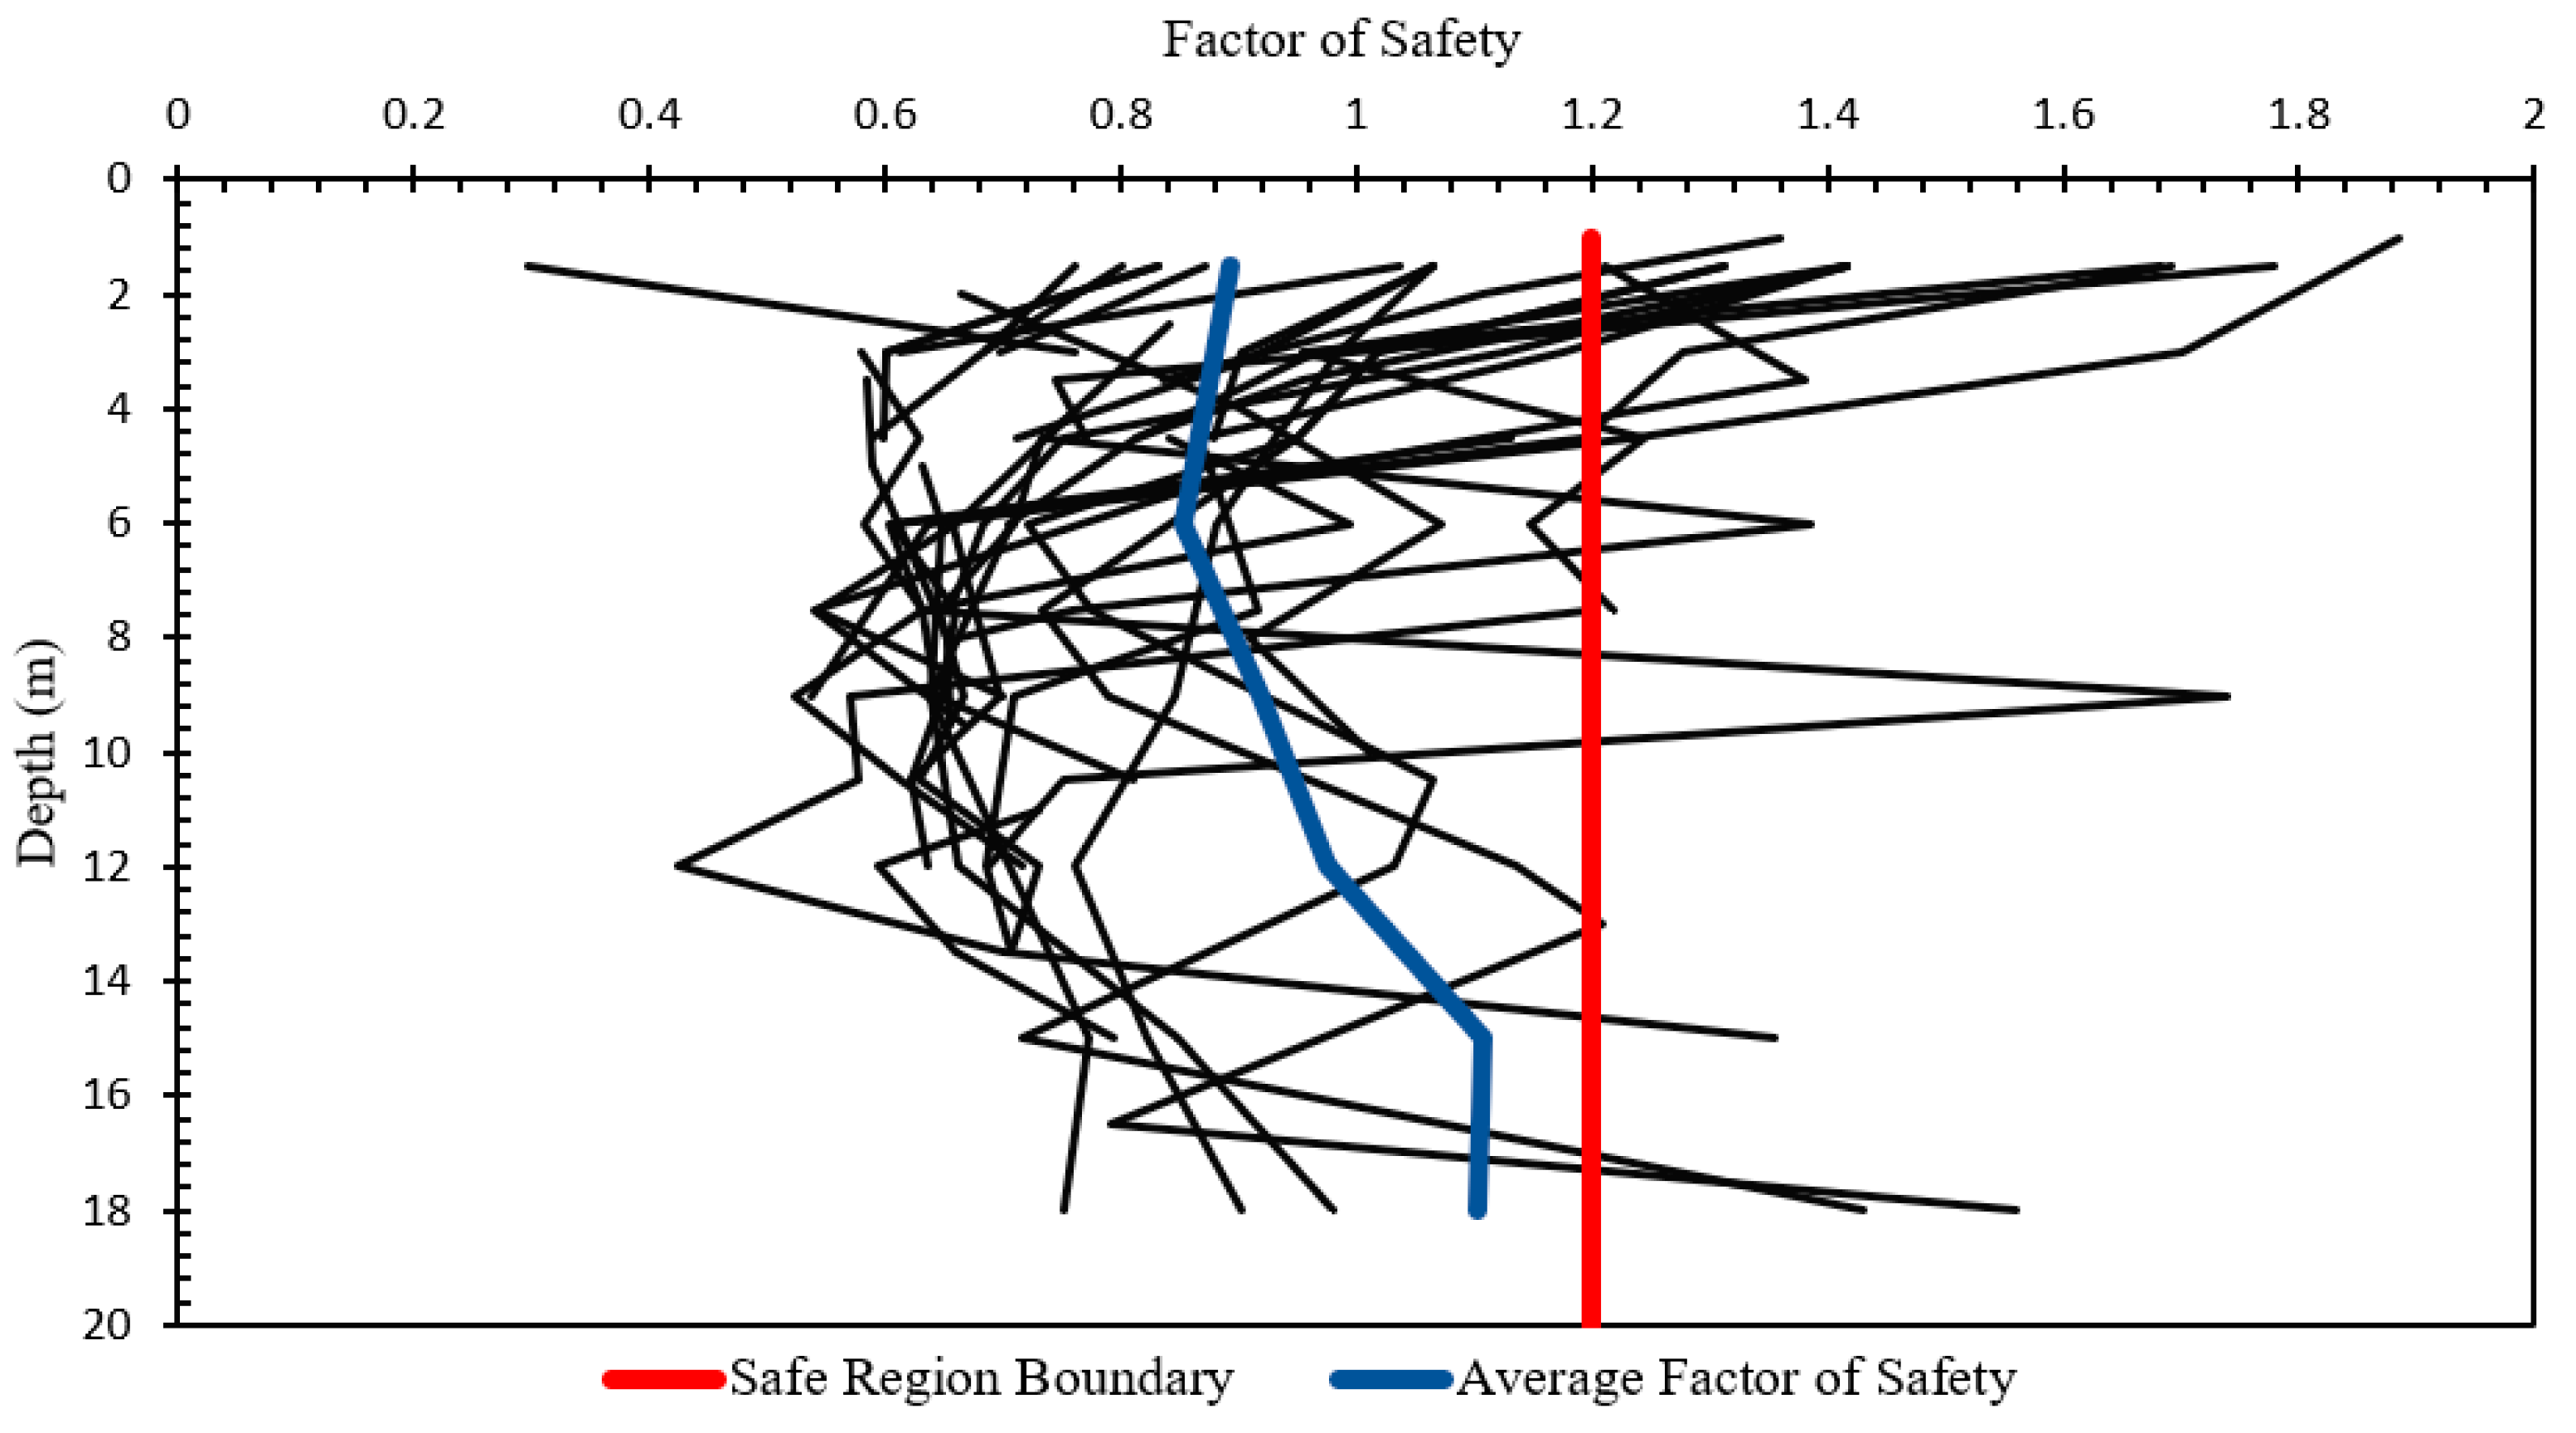
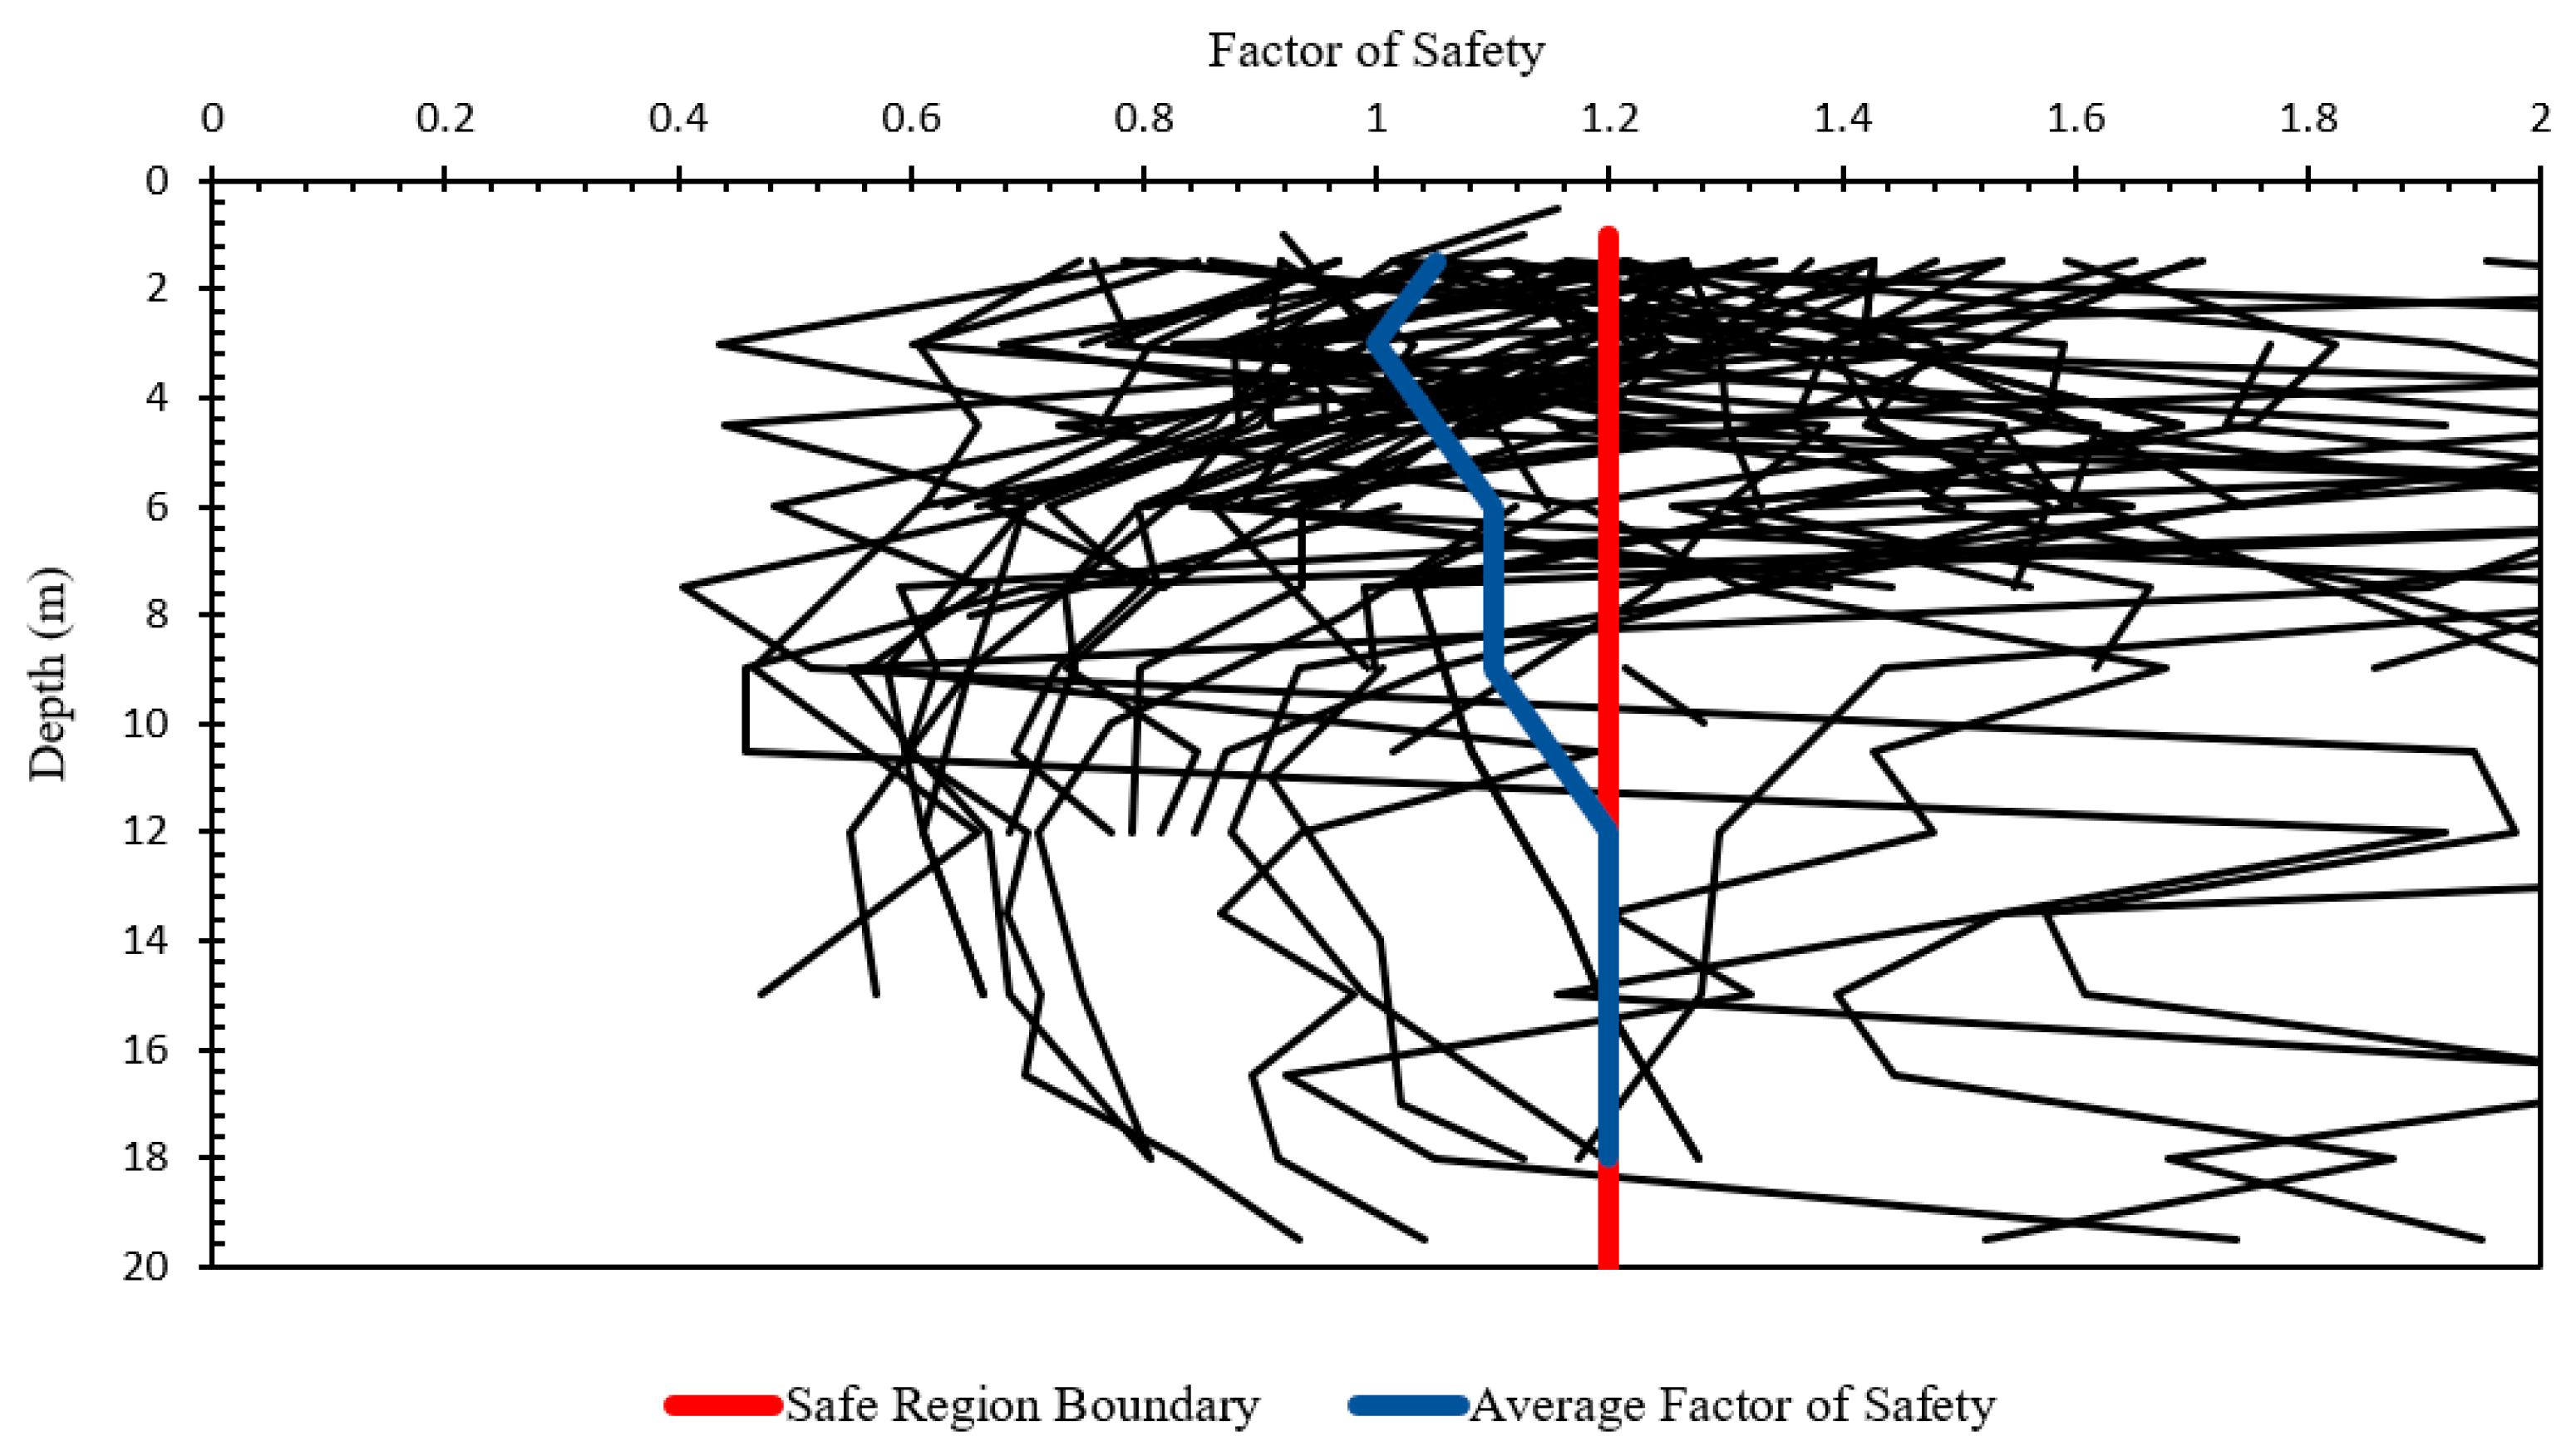
A liquefaction evaluation was performed for Tuzla and Long Beach to obtain a liquefaction potential index map. The F.S. values were calculated to determine the liquefaction potential of all the boreholes at the site. The number of corrected blow counts for the 30 cm depth (N1.60) was considered through a 20 m depth. N1.60 values were not considered for some locations because there was no possibility of liquefaction due to the presence of clays with a high plasticity index, or very dense sands with high blow counts. F.S. values were plotted in Figure 9 and Figure 10 to present the dimensional distribution of F.S. values for each depth of all boreholes. The F.S. values of the boreholes above 1.2 indicate that the potential for liquefaction did not exist. Therefore, this is considered to be safe against liquefaction. In Figure 9 and Figure 10, the red line and blue line represents the safe region boundary and average F.S. values, respectively.
It is also characteristic at both locations that the liquefaction potential is more substantial at the surface, and reduced for deeper strata. Surface soil liquefaction is expected to cause damage or failure of structures, since the liquefiable soil under the structures is not adequately treated by ground improvement techniques against liquefaction. In both regions, it is clear that the average F.S. values are reduced to their minimum at 3 m in Long Beach and 6 m in the Tuzla region, which indicates a high potential of liquefaction. Below those depths, an increase in average F.S. values was observed; for the Tuzla region, the average F.S. value stays below 1.2 up to 20 m, while Long Beach seems to reach a boundary of 1.2 F.S. at 12 m. Therefore, it is clear that the Tuzla region possesses higher liquefaction potential. This is due to the fact that the catchment area that transports soil from the Long Beach basin is much smaller that the Tuzla basin [37], implying that the rivers deposited less alluvial soil to the region.
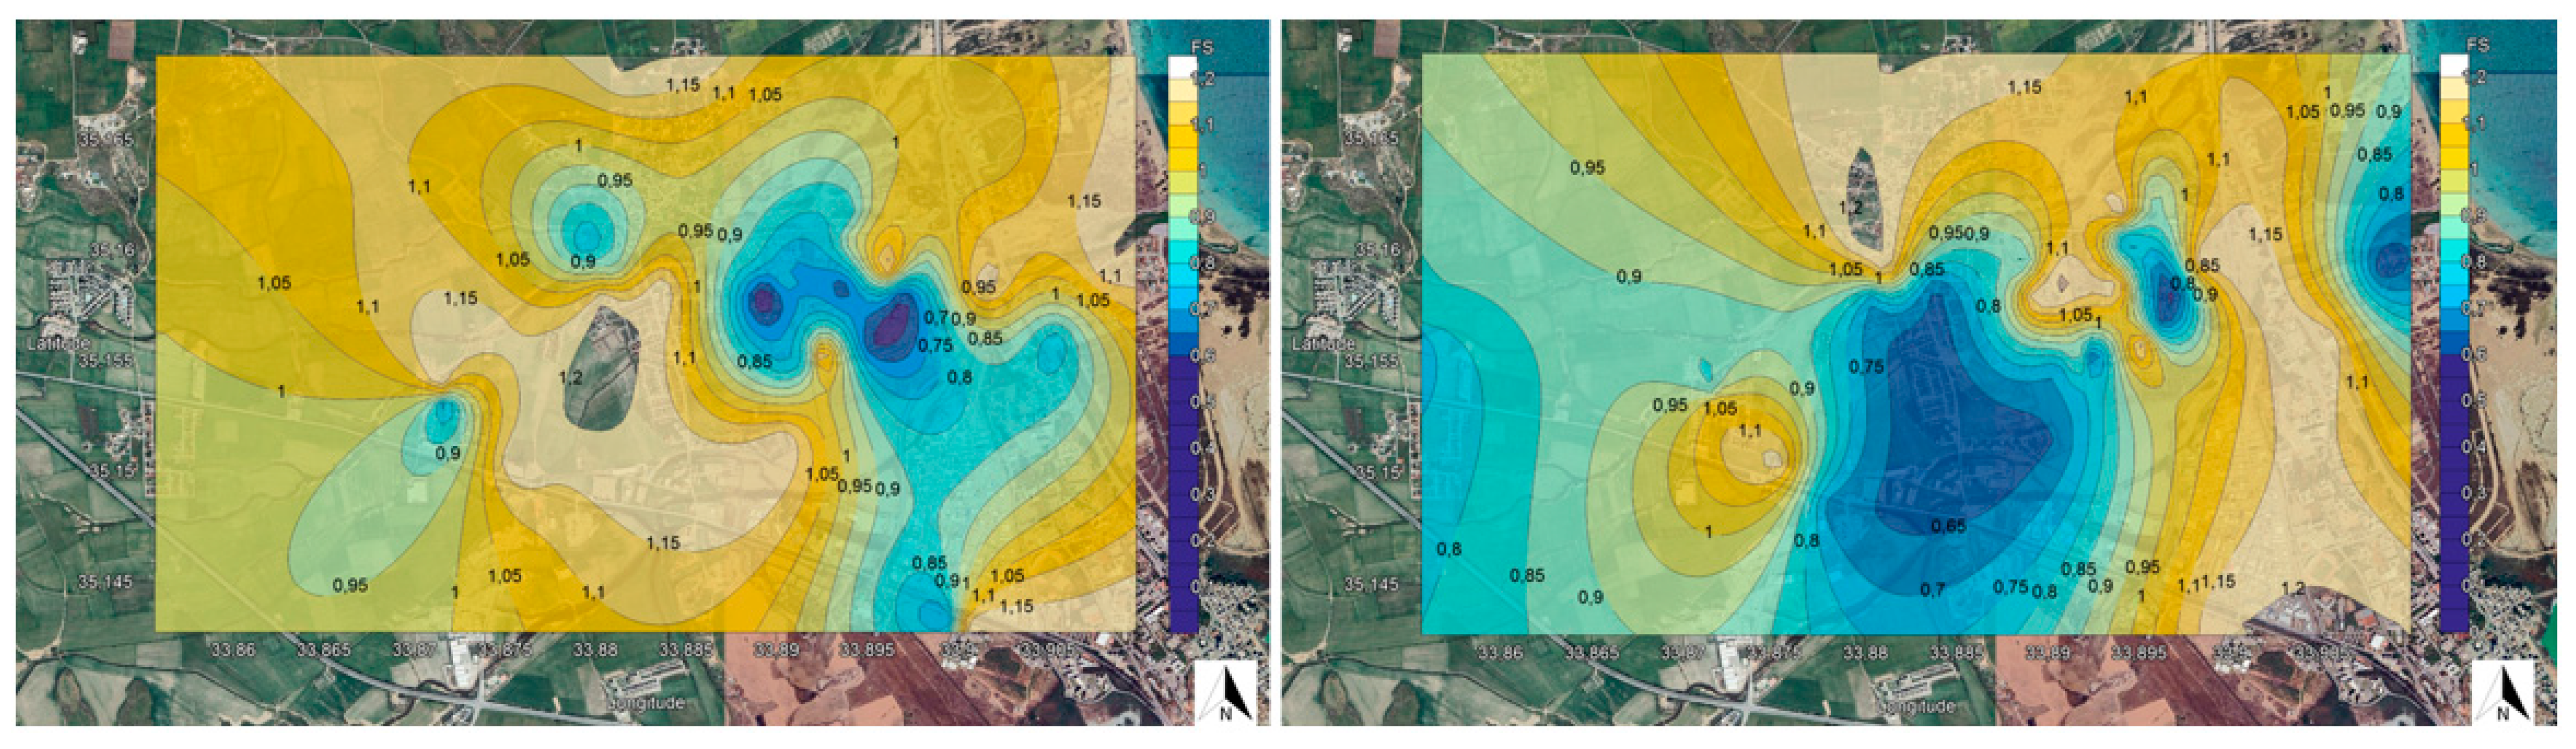
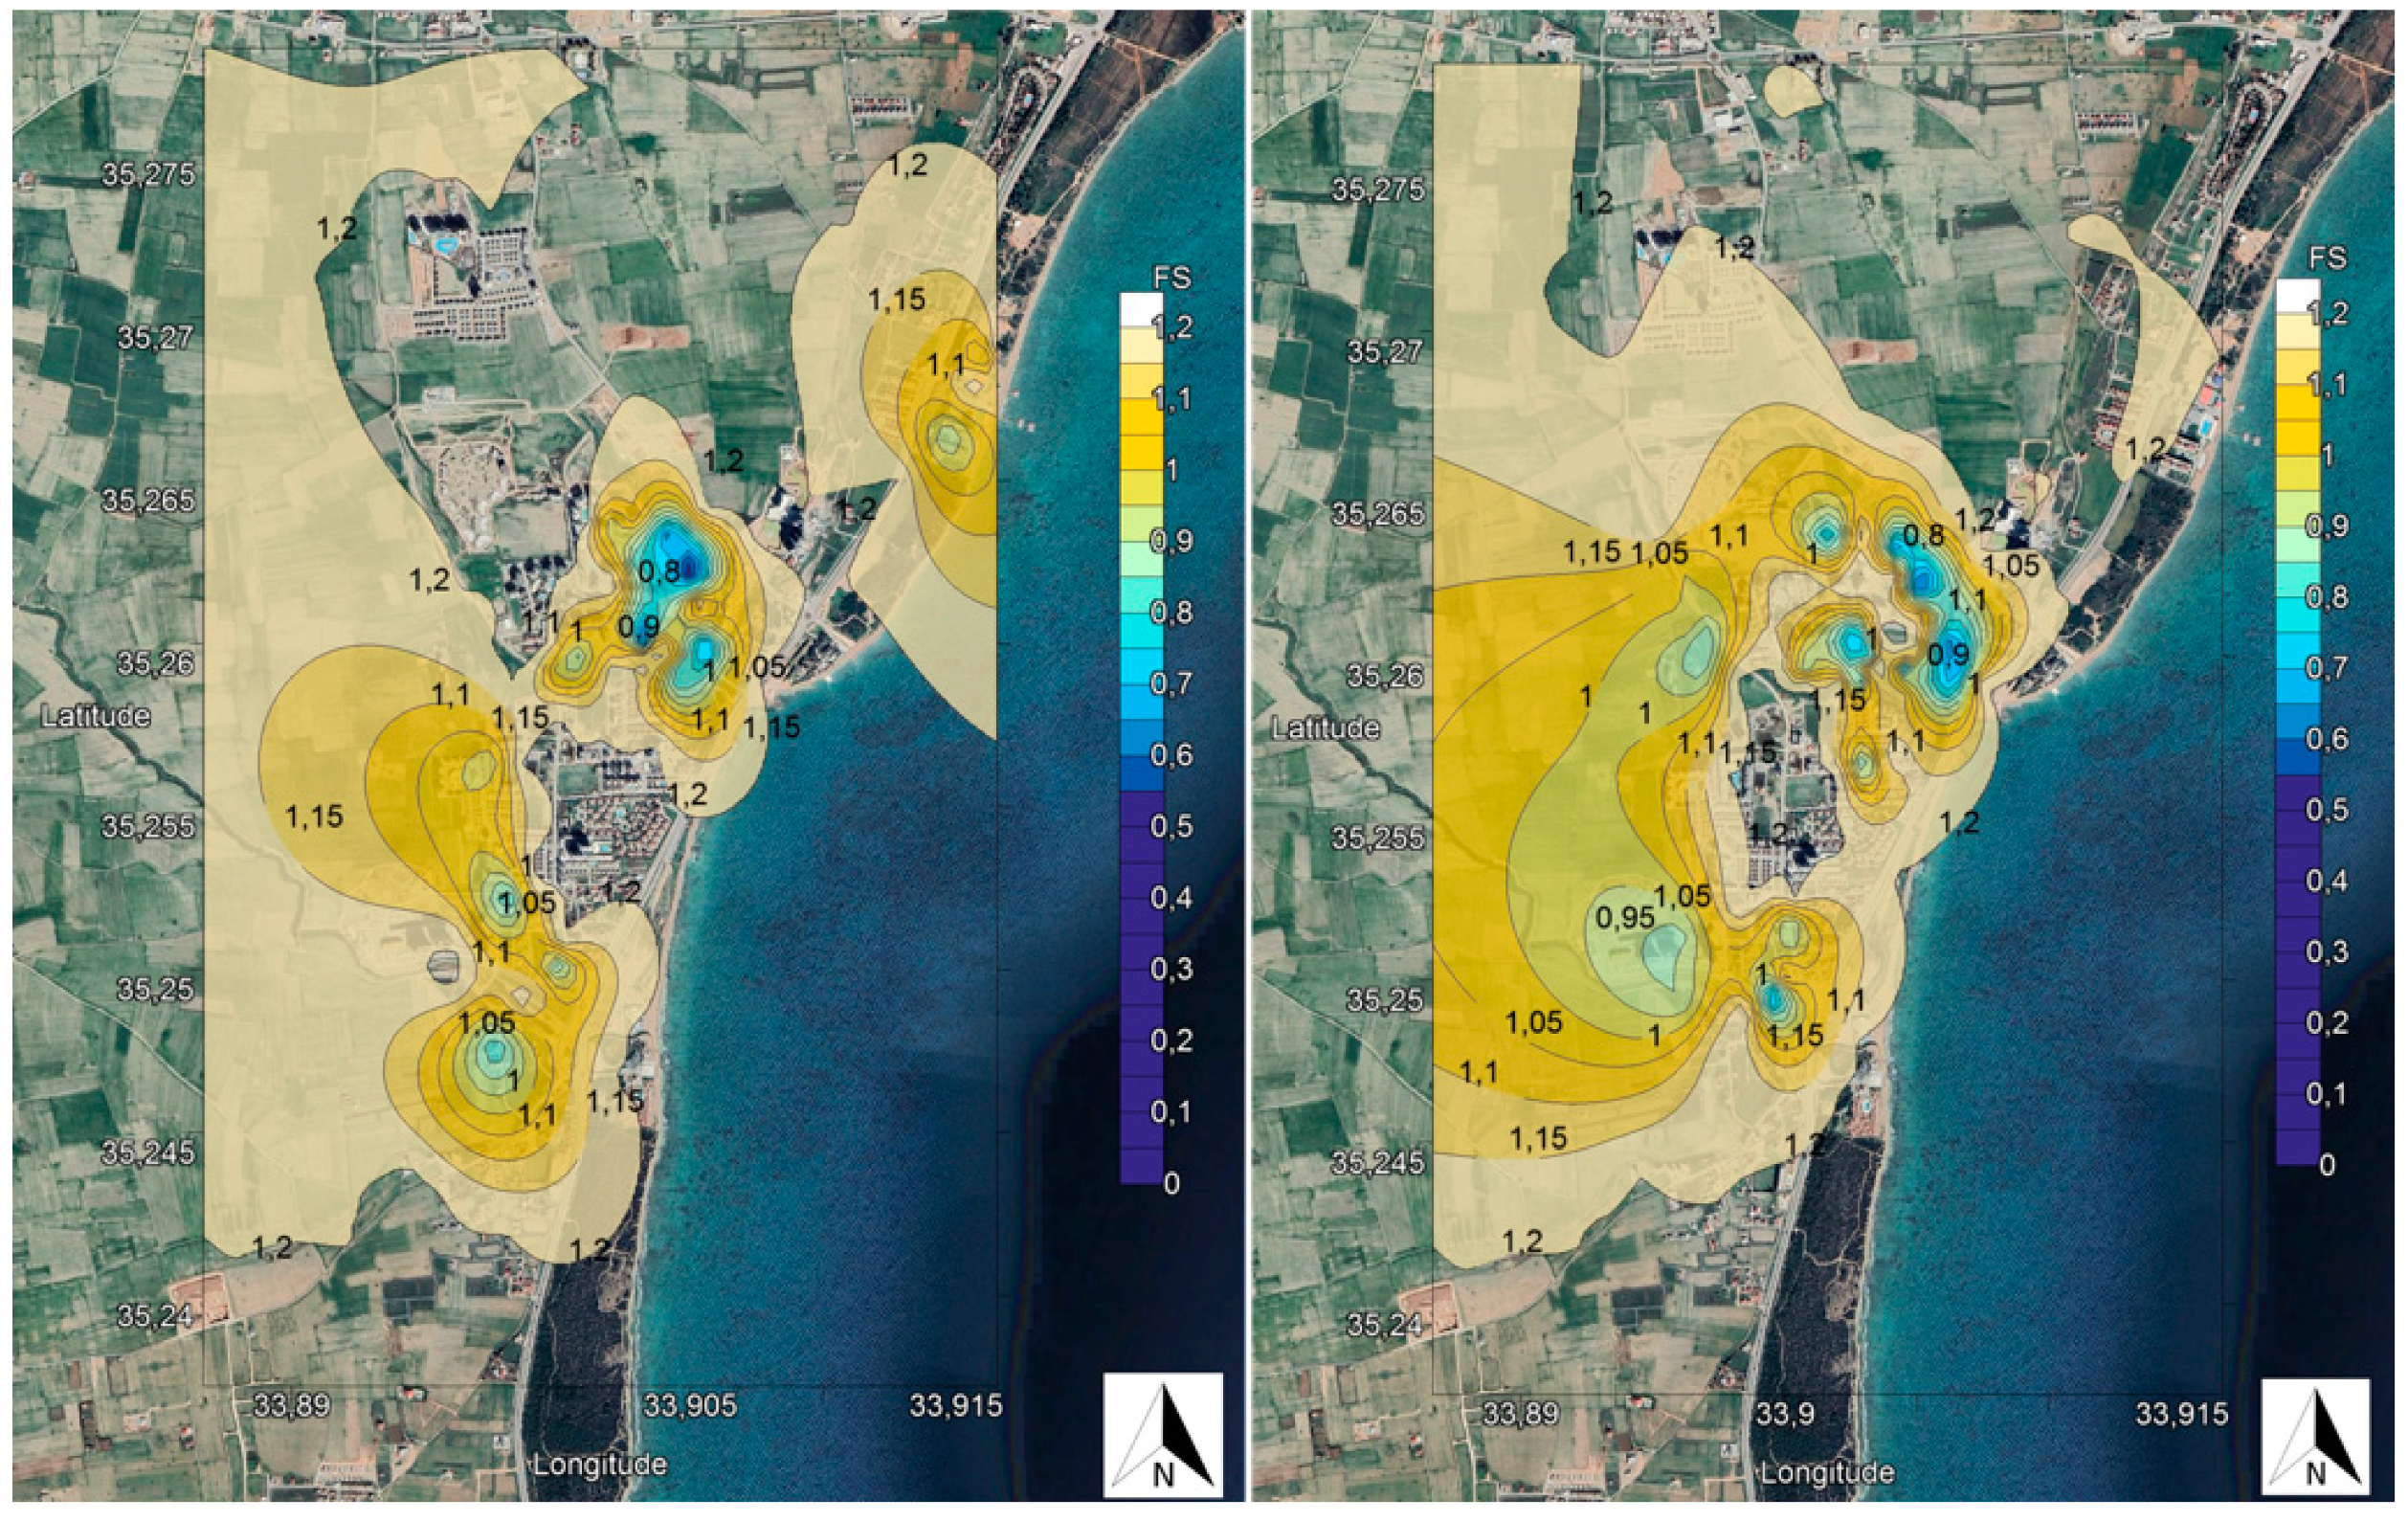
4.2. Factor of Safety Contour Maps
The F.S. values of each site at depths of 3 and 6 m are shown as contour maps in Figure 11 and Figure 12. The F.S. and liquefaction potential maps of the Tuzla and Long Beach regions were prepared using the Surfer Version 20.1.195. Both the satellite image and contour maps have the same coordinate systems. For all maps, kriging with a simple gridding method was used. The interpolation parameters of the spacing of the Tuzla region maps in the x direction were taken at 0.0004145 with 73 nodes, and 0.000414 with 100 nodes in the y direction. The Long Beach region interpolation parameters were taken at 0.000547 spacing with 100 nodes in the x direction, and 0.000542 spacing with 45 nodes in the y direction of the maps. For all maps, the contour tolerance was set to 1.015.
Both Tuzla and Long Beach sites were determined to be liquefiable at shallow depths. It is crucial to determine the most critical soil layer that is prone to liquefaction. Figure 7 and Figure 8 show the soil type at each depth with the blow counts. As shown in Figure 7, sand is the most critical soil type for the Long Beach region, and is located beyond a 3 m depth. For the Tuzla region (Figure 8), sand and low plasticity clays are the critical soil layers at a 6 m depth that can be liquified. Furthermore, it was presented in Figure 9 and Figure 10 that the average F.S. values are reduced to their minimums at 3 m in Long Beach and 6 m in the Tuzla region, which indicates a high potential of liquefaction. Therefore, the F.S. was presented in Figure 11 and Figure 12 at 3 m and 6 m depths of soil strata for both locations, which are the critical soil layers. The blue areas in Figure 11 and Figure 12 represent the territories with low F.S. values. The areas that were determined to possess low F.S. distribution in Tuzla were widely separated at depths of 3 and 6 m (Figure 11). The F.S. values for the Long Beach area were relatively higher, so the liquefiable areas were not widespread for the depths of 3 and 6 m (Figure 12). However, there were some specific areas near the coast that demonstrated a high possibility of liquefaction.
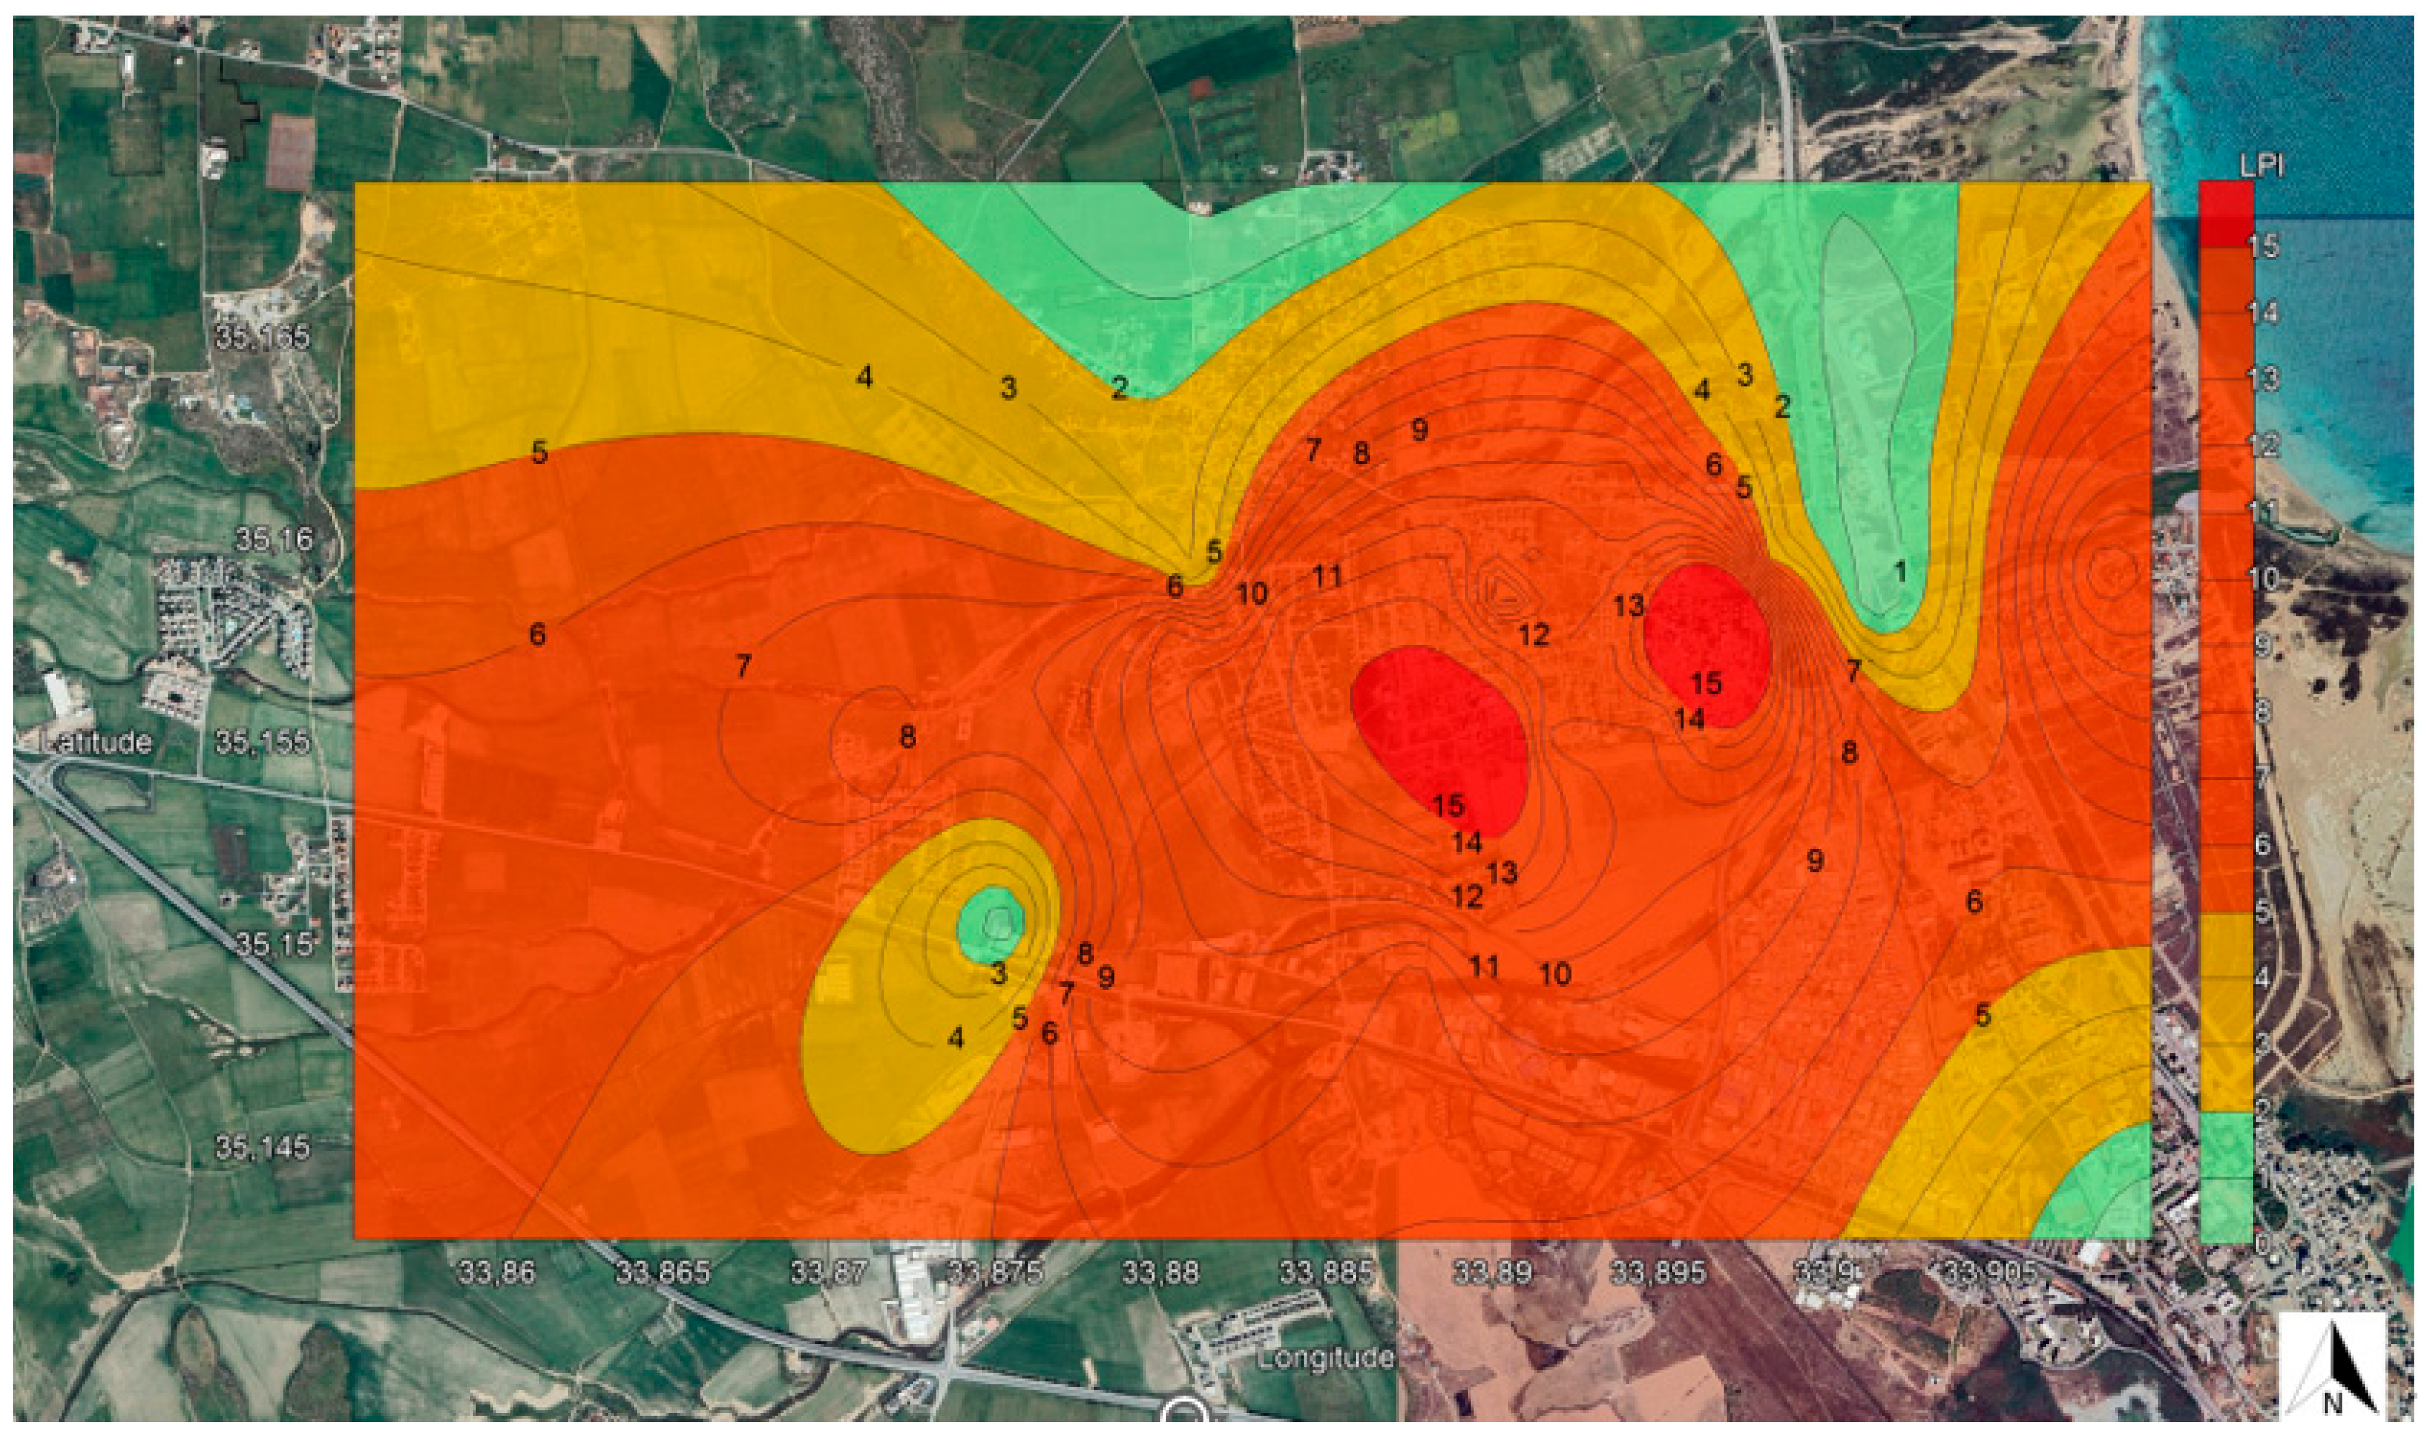
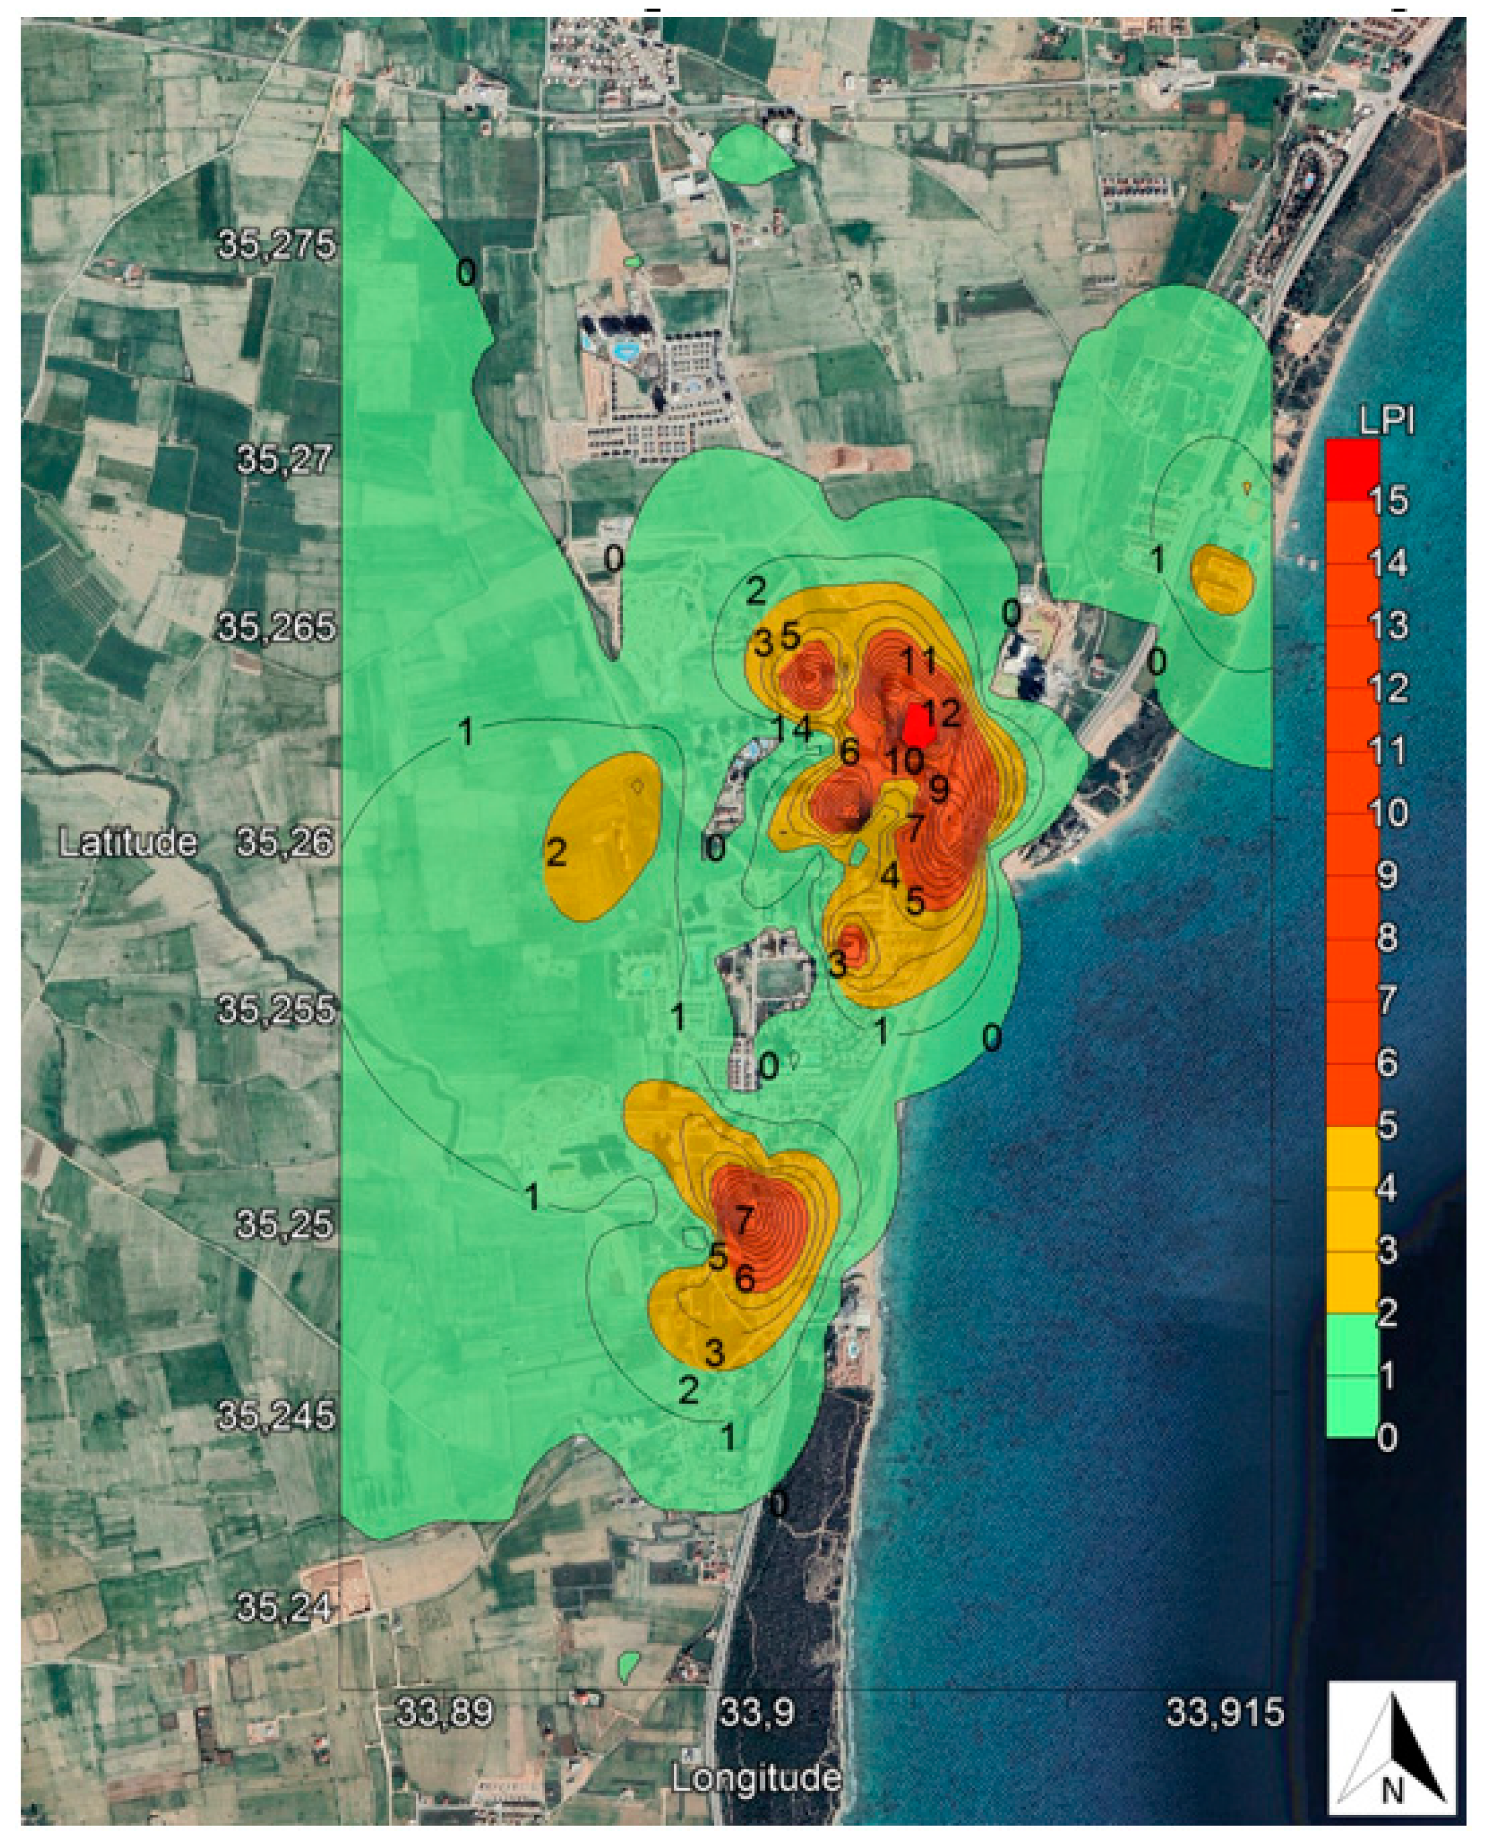
4.3. Liquefaction Potential Index Maps
The liquefaction index maps in Figure 13 and Figure 14 were plotted in respect to the method proposed by Sonmez’s [35] modified version of the Iwasaki [34] liquefaction potential index. According to Sonmez [35], a moderate liquefaction potential category is not considered in the existing Iwasaki [34] liquefaction potential index. Consequently, Sonmez [35] modified the categories and introduced a moderate category into the classification. The category of very low was omitted. In order to produce the LPI maps, the same interpretation method was adopted as stated above for the F.S. maps. The green areas in Figure 13 and Figure 14 represent the areas with a low possibility of liquefaction for a designed 6.5 magnitude earthquake. The yellow, orange, and red areas represent moderate, high, and very high-risk areas, respectively. The liquefaction potential index map in Figure 13 indicates that Tuzla is in an area that is highly likely to be liquefied. Low F.S. results were calculated at shallow depths due to numerous streamlines passing through the Tuzla area and carrying alluvial sediments from a larger catchment area. Since these streamlines carry silt and clay, it affects the liquefaction potential. Therefore, a liquefaction hazard was expected for this region. Wotherspoon et al. [38] carried out a case study and investigated a territory very similar to the Tuzla region, with river streams passing 3 km through the city. The authors mentioned that during a 7.1 Mw earthquake, severe liquefaction was observed in that area. The water table was 2 m below the ground level, which was very similar to the Tuzla region, and liquefaction was observed in shallow depths. This study shows that liquefaction occurred in shallow depths, which agrees with Wotherspoon et al. [38]. This indicates that the occurrence of liquefaction also depends on the river streams and their catchment areas. However, the Long Beach area appears to be less potentially liquefiable than the Tuzla region, as shown in Figure 14. Again, some specific regions of this area contain average and high potentials of liquefaction, but they are not too extensive. There are three reasons for this: the soil in Long Beach is denser than the soil in Tuzla, fewer streamlines pass through the region to carry rainfall from a relatively minor catchment area, and the Long Beach region is relatively far from the Cyprus arc, so the maximum ground acceleration has a more negligible effect against designed earthquakes.
4.4. Discussion with Respect to Historical Evidence, Previous Studies, and Geospatial Data
Although there is no recent seismic activity that has caused liquefaction phenomena on the island of Cyprus, historical records show that most parts of the island are vulnerable to liquefaction. Michaelides [39] studied the construction, foundation conditions, and final abandonment of the port of Amathus (Figure 2), which is located on the south coast of Cyprus, 90 km from the investigation area. The author stated that the moles of the port were founded on a weak, compressible sandy layer of marine deposits, which is characterized as highly liquefiable when subjected to earthquakes. The authors further stated that the likely reason for the abandonment of the port could be a gradual and regional tectonic lowering of the sea bottom of Limassol Bay, and settlement due to the weak foundation stratum in the vicinity of the port, possibly accompanied by the liquefaction phenomena during a solid seismic event between the sixth and seventh centuries A.D. In another study, Antonopoulos [40] investigated the seismic sea-wave events in the eastern Mediterranean from the birth of Christ to 500 A.D. The authors reported that the city of Salamis (Figure 2) is 3 km from Tuzla, 7 km from the Long Beach area and located at the mouth of the Pedieos rivers, which is one of the rivers that transport alluvial soil to the Tuzla region, was hit by a strong earthquake in 342 A.D. The authors further reported that because of this earthquake, part of the ancient city of Salamis collapsed and sank into the Mediterranean. Therefore, it is clear from the historical records that the investigation areas have been subjected to liquefaction phenomena.
Biryılmaz [41] and Cetin [42] conducted two different studies to investigate the Tuzla area against liquefaction under the same earthquake conditions. Biryılmaz [41] investigated the Tuzla region using data from 38 SPT boreholes. The author utilized the simplified procedure of Seed and Idriss [23], with Iwasaki’s liquefaction potential index method [34], and prepared the liquefaction potential index map with respect to surface geology aspects. In addition, Cetin [42] used 18 CPT data to conduct a liquefaction hazard map by considering a related method with respect to Iwasaki [34], the liquefaction potential index. Cetin’s liquefaction index method [42] was converted to Iwasaki’s format [34] to enable an appropriate comparison. For both studies, the closest SPT borehole and CPT locations were compared to the SPT borehole locations of this study, to achieve the most accurate comparison. Figure 15 shows the comparison of all borehole locations, regarding the liquefaction potentials of Biryılmaz’s [41] and Cetin’s [42] studies. The results show that there is a significant similarity between all studies conducted in the Tuzla area. Nevertheless, at some locations, the LPI calculated in this study seems to be slightly higher than the earlier studies. This phenomenon might be due to differences in the adapted techniques of the studies. It was stated by Hore et al. [43] that such slight variation is possible because the SPT n value was obtained at 1.5 m intervals, and for CPT it was collected continuously. Additionally, it should be noted that Iwasaki et al. [34] utilized SPT data instead of CPT data to develop the LPI method. Therefore, it is debatable whether or not the determination of LPI would result in similar findings in respect to SPT.
To determine the number of variances and relations of the results, the Pearson correlation analysis method was adopted through Microsoft Excel. The variables of correlation coefficients revealed the interpretation of correlation, and then by taking the square of the correlation results, the coefficients of determination (R2) were determined. R2 values are between 0 and 1, and are reported in Table 2. The results show a 75% correlation between Cetin’s liquefaction hazard map [42] and the map developed in this study. The high correlation between this study and Cetin’s [42] studies is due to the precision of CPT measurements against liquefaction. The high correlation shows that these studies support each other concerning liquefaction occurring under the same earthquake scenarios. The slight variance in the two studies might be due to differences in the number of data points, which can affect the sensitivity of hazard maps against liquefaction. Additionally, as presented in Table 2, the correlation between this study and Biryılmaz’s [41] study reduced to 72% for the same designed earthquake scenario condition. Although Biryılmaz [41] used an approach similar to that of this study, generalizing the liquefaction potential from surface geology aspects reduced the correlation index. Such a hypothesis proves valid if one compares the correlation between [41,42], which returns an even lower correlation index of 70%.
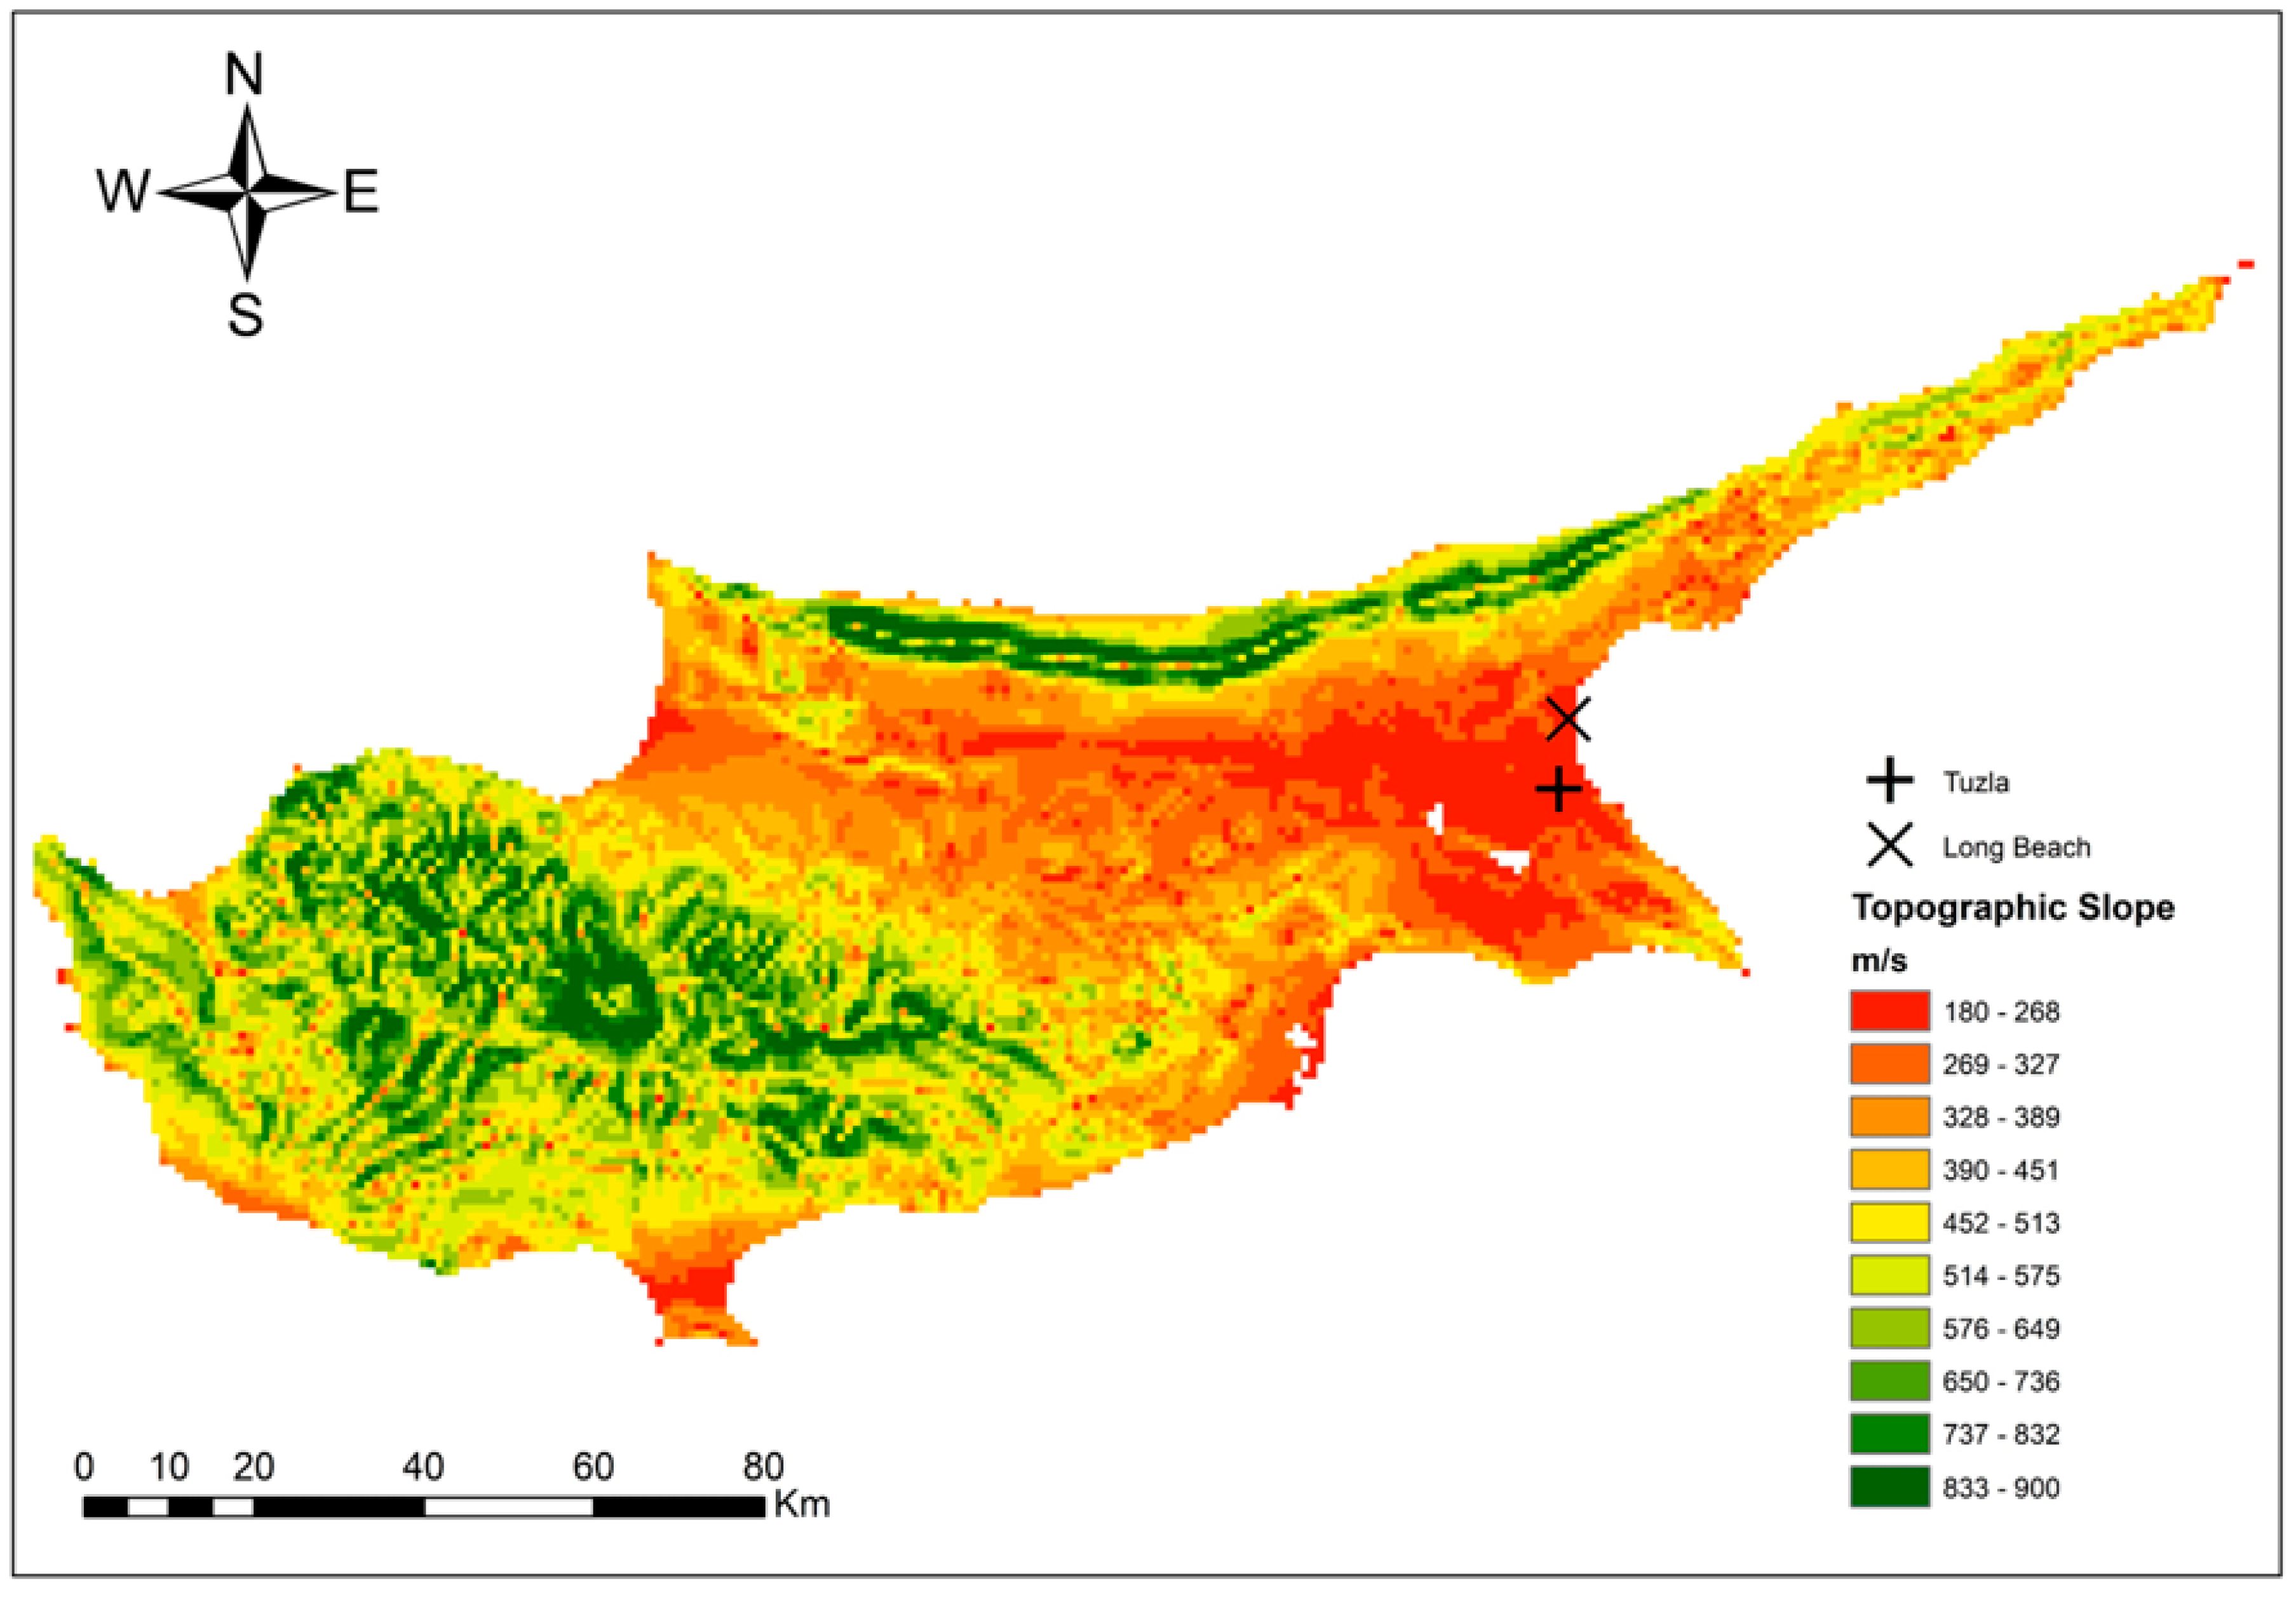
In addition to historical evidence and earlier studies, Figure 16 shows the global slope-based shear wave velocity (Vs30) map of Cyprus based on approximation to the topographic slope [44]. In short, authors correlated Vs30 data with the topographical slope (m/m) that was obtained via the Shuttle Radar Topography Mission 30-sec (SRTM30) topographic dataset. It can be seen in the figure that the Tuzla and Long Beach regions have <180 m/s and 180–240 m/s Vs30, respectively. It is known from the study of Andrus and Stokoe [45] that such low values of Vs30 are considered to be liquefiable.
The approach adopted in this study to calculate the liquefaction potential based on SPT tests is revealing similar outcomes in respect to historical evidence, CPT measurements, surface geology aspects, and geospatial data. Therefore, the methodology adopted in this study can be extended to other regions with similar geological, topographical, and geotechnical aspects.
5. Conclusions and Recommendations
This article provides a detailed evaluation of the liquefaction potential in the northern part of Cyprus, utilizing an improved liquefaction potential index to identify areas at risk. This study specifically focuses on the Tuzla and Long Beach areas on the east coast of Cyprus, using SPT data from over 200 boreholes. The results of this study indicate that both study areas are susceptible to liquefaction, and that sustainable ground improvement methods and foundations should be considered.
This article also highlights the unique geological setting of the area, and the challenges it poses to the applicability of current methods to assess the liquefaction potential in alluvial deposits. By comparing various methods, such as SPT, CPT, and surface geology aspects, the authors demonstrate the effectiveness of their proposed approach for evaluating the risk of liquefaction in the region. Additionally, this study emphasizes the importance of utilizing geospatial data and historical evidence to enhance the accuracy of liquefaction potential assessments.
Overall, the findings of this study provide valuable insights into improving our understanding of the risks associated with liquefaction, and enhancing our ability to mitigate its potential impacts. As a future study, the authors recommend investigating the performance of various in situ testing methods, such as SPT, CPT, MASW, and ReMi, in determining the liquefaction potential of the same study areas. This could further enhance our understanding of the risk posed by liquefaction, and help in developing effective mitigation strategies.
Author Contributions
Conceptualization, A.E. and O.S.; methodology, A.E.; software, O.S.; validation, A.E. formal analysis, O.S.; investigation, O.S.; resources, A.E.; data curation, O.S.; writing—original draft preparation, O.S.; writing—review and editing, A.E.; visualization, A.E.; supervision, A.E.; project administration, A.E.; funding acquisition, A.E. All authors have read and agreed to the published version of the manuscript.
Funding
This work was supported by the Office of Research Coordination and Support, Middle East Technical University, Northern Cyprus Campus under Grant number FEN 20 YG 4.
Data Availability Statement
Data available up on request.
Acknowledgments
The Union of the Chambers of Cyprus Turkish Engineers and Architects, Chamber of Civil Engineers support for this research is highly appreciated by the authors. Authors are also grateful to Hasan Zaifoglu for his contributions.
Conflicts of Interest
The authors declare no conflict of interest.
References
- Zhou, H.; Che, A.; Wang, L.; Wang, L. Investigation and Mechanism Analysis of Disasters under Hokkaido Eastern Iburi Earthquake. Geomat. Nat. Hazards Risk 2020, 12, 1–28. [Google Scholar] [CrossRef]
- Bao, X.; Jin, Z.; Cui, H.; Chen, X.; Xie, X. Soil Liquefaction Mitigation in Geotechnical Engineering: An Overview of Recently Developed Methods. Soil Dyn. Earthq. Eng. 2019, 120, 273–291. [Google Scholar] [CrossRef]
- Hall, J.; Calon, T.J.; Aksu, A.E.; Meade, S.R. Structural Evolution of the Latakia Ridge and Cyprus Basin at the Front of the Cyprus Arc, Eastern Mediterranean Sea. Mar. Geol. 2005, 221, 261–297. [Google Scholar] [CrossRef]
- Cavallaro, A.; Cessari, L.; Gigliarelli, E. Site Characterization by in Situ and Laboratory Tests for the Structural & Architectural Restoration of Saint Nicholas Church, Nicosia, Cyprus. In Proceedings of the 2nd International Symposium on Geotechnical Engineering for the Preservation of Monuments and Historic Sites, Napoli, Italy, 30–31 May 2013; pp. 241–247, ISBN 978-1-138-00055-1. [Google Scholar]
- Danezis, C.; Hadjimitsis, D.; Eineder, M.; Brcic, R.; Agapiou, A.; Themistocleous, K.; Mendonidis, E.; Tzouvaras, M.; Hadjicharalambous, K.; Pilidou, S.; et al. CyCLOPS: A Novel Strategic Research Infrastructure Unit for Continuous Integrated Spaced-based Monitoring of Geohazards. Available online: https://elib.dlr.de/126541/ (accessed on 12 February 2022).
- Evelpidou, N.; Karkani, A.; Polidorou, M.; Saitis, G.; Zerefos, C.; Synolakis, C.; Repapis, C.; Tzouxanioti, M.; Gogou, M. Palaeo-Tsunami Events on the Coasts of Cyprus. Geosciences 2022, 12, 58. [Google Scholar] [CrossRef]
- Seed, H.B.; Idriss, I.M. Analysis of Soil Liquefaction: Niigata Earthquake. J. Soil Mech. Found. Div. 1967, 93, 83–108. [Google Scholar] [CrossRef]
- Erdik, M. Report on 1999 Kocaeli and Düzce (Turkey) Earthquakes. In Structural Control for Civil and Infrastructure Engineering; World Scientific Publishing Company: Singapore, 2001. [Google Scholar] [CrossRef]
- Bray, J.D.; Sancio, R.B. Assessment of the Liquefaction Susceptibility of Fine-Grained Soils. J. Geotech. Geoenviron. Eng. 2006, 132, 1165–1177. [Google Scholar] [CrossRef]
- Kayabasi, A.; Gokceoglu, C. Liquefaction Potential Assessment of a Region Using Different Techniques (Tepebasi, Eskişehir, Turkey). Eng. Geol. 2018, 246, 139–161. [Google Scholar] [CrossRef]
- Wadi, D.; Wu, W.; Malik, I.; Ahmed, H.A.; Makki, A. Assessment of Liquefaction Potential of Soil Based on Standard Penetration Test for the Upper Benue Region in Nigeria. Environ. Earth Sci. 2021, 80, 254. [Google Scholar] [CrossRef]
- Abdullah, G.M.S.; El Aal, A.A. Liquefaction Hazards Mapping along Red Sea Coast, Jeddah City, Kingdom of Saudi Arabia. Soil Dyn. Earthq. Eng. 2021, 144, 106682. [Google Scholar] [CrossRef]
- Seed, R.; Cetin, K.; Moss, R.; Kammerer, A.; Wu, J.; Pestana, J.; Riemer, M.; Sancio, R.; Bray, J.; Kayen, R.; et al. Recent Advances in Soil Liquefaction Engineering: A Unified and Consistent Framework. In Proceedings of the 26th Annual ASCE, Los Angeles, CA, USA, 30 April 2003; Geotechnical Spring Seminar: Long Beach, CA, USA, 2003. [Google Scholar]
- Union of the Chambers of Cyprus Turkish Engineers and Architects 2020. Available online: https://www.ktimo.org/Zemin (accessed on 18 March 2023).
- ASTM Standard Test Method D1586-11; Standard Test Method for Standard Penetration Test (SPT) and Split-Barrel Sampling of Soils. ASTM: West Conshohocken, PA, USA, 2011; pp. 1–9.
- Nixon, I.K. Standard penetration test State-of-the-art report. In Penetration Testing; Routledge: Oxfordshire, UK, 2021; pp. 3–22. [Google Scholar]
- Clayton, C.R.I.; Clayton, C.R.I. The Standard Penetration Test (SPT): Methods and Use. Available online: https://eprints.soton.ac.uk/75036/ (accessed on 12 May 2022).
- Fletcher, G.F.A. Standard Penetration Test: Its Uses and Abuses. J. Soil Mech. Found. Div. 1965, 91, 67–75. [Google Scholar] [CrossRef]
- Kuribayashi, E.; Tatsuoka, F. Brief Review of Liquefaction during Earthquakes in Japan. Soils Found. 1975, 15, 81–92. [Google Scholar] [CrossRef] [PubMed] [Green Version]
- Seed, H.B.; Idriss, I.M. Simplified Procedure for Evaluating Soil Liquefaction Potential. J. Soil Mech. Found. Div. 1971, 97, 1249–1273. [Google Scholar] [CrossRef]
- Seed, H.B.; Idriss, I.M.; Arango, I. Evaluation of Liquefaction Potential Using Field Performance Data. J. Geotech. Eng. 1983, 109, 458–482. [Google Scholar] [CrossRef]
- Youd, T.L.; Idriss, I.M. Liquefaction Resistance of Soils: Summary Report from the 1996 NCEER and 1998 NCEER/NSF Workshops on Evaluation of Liquefaction Resistance of Soils. J. Geotech. Geoenviron. Eng. 2001, 127, 297–313. [Google Scholar] [CrossRef] [Green Version]
- Idriss, I.M.; Boulanger, R.W. SPT-Based Liquefaction Triggering Procedures. Rep. UCD/CGM-10; University of California: Davis, CA, USA, 2 December 2010; pp. 4–13. [Google Scholar]
- Fukushima, Y.; Tanaka, T. A New Attenuation Relation for Peak Horizontal Acceleration of Strong Earthquake Ground Motion in Japan. Bull. Seismol. Soc. Am. 1990, 80, 757–783. [Google Scholar]
- Wu, Y.-M. Near Real-Time Mapping of Peak Ground Acceleration and Peak Ground Velocity Following a Strong Earthquake. Bull. Seismol. Soc. Am. 2004, 91, 1218–1228. [Google Scholar] [CrossRef]
- Algermissen, T.; Rogers, A. A Cyprus earthquake hazard assessment: Maps of probabilistic peak ground acceleration and uniform-hazard pseudo-absolute acceleration spectral response. In UNOPS Seismic Hazard and Risk Assessment of the Greater Nicosia Area Report; UNOPS: Copenhagen, Denmark, 2004. [Google Scholar]
- Boulanger, R.W.; Idriss, I.M. Closure to “Liquefaction Susceptibility Criteria for Silts and Clays” by Ross, W. Boulanger and I. M. Idriss. J. Geotech. Geoenviron. Eng. 2008, 134, 1027–1028. [Google Scholar] [CrossRef]
- Boulanger, R.W.; Idriss, I.M. Liquefaction Susceptibility Criteria for Silts and Clays. J. Geotech. Geoenviron. Eng. 2006, 132, 1413–1426. [Google Scholar] [CrossRef]
- Skempton, A.W. Standard Penetration Test Procedures and the Effects in Sands of Overburden Pressure, Relative Density, Particle Size, Ageing and Overconsolidation. Géotechnique 1986, 36, 425–447. [Google Scholar] [CrossRef]
- Liao, S.S.C.; Whitman, R.V. Overburden Correction Factors for SPT in Sand. J. Geotech. Eng. 1986, 112, 373–377. [Google Scholar] [CrossRef]
- Seed, H.B.; Tokimatsu, K.; Harder, L.F.; Chung, R.M. Influence of SPT Procedures in Soil Liquefaction Resistance Evaluations. J. Geotech. Eng. 1985, 111, 1425–1445. [Google Scholar] [CrossRef]
- Cetin, K.O.; Seed, R.B.; Der Kiureghian, A.; Tokimatsu, K.; Harder, L.F.; Kayen, R.E.; Moss, R.E.S. Standard Penetration Test-Based Probabilistic and Deterministic Assessment of Seismic Soil Liquefaction Potential. J. Geotech. Geoenviron. Eng. 2004, 130, 1314–1340. [Google Scholar] [CrossRef] [Green Version]
- Cetin, K.O.; Seed, R.B.; Kayen, R.E.; Moss, R.E.S.; Bilge, H.T.; Ilgac, M.; Chowdhury, K. SPT-Based Probabilistic and Deterministic Assessment of Seismic Soil Liquefaction Triggering Hazard. Soil Dyn. Earthq. Eng. 2018, 115, 698–709. [Google Scholar] [CrossRef]
- Iwasaki, T.; Arakawa, T.; Tokida, K.-I. Simplified Procedures for Assessing Soil Liquefaction during Earthquakes. Int. J. Soil Dyn. Earthq. Eng. 1984, 3, 49–58. [Google Scholar] [CrossRef]
- Sonmez, H. Modification of the Liquefaction Potential Index and Liquefaction Susceptibility Mapping for a Liquefaction-Prone Area (Inegol, Turkey). Environ. Geol. 2003, 44, 862–871. [Google Scholar] [CrossRef]
- Council, B.S. NEHRP Recommended Seismic Provisions for New Buildings and Other Structures; FEMA: Washington, WA, USA, 2009; p. 750.
- Türker, U.; Hansen, B.R. River Basin Management and Characterization of Water Bodies in North Cyprus. In Proceedings of the 10th International Congress on Advances in Civil Engineering, Ankara, Turkey, 17–19 October 2012; pp. 17–19. [Google Scholar]
- Wotherspoon, L.M.; Pender, M.J.; Orense, R.P. Relationship between Observed Liquefaction at Kaiapoi Following the 2010 Darfield Earthquake and Former Channels of the Waimakariri River. Eng. Geol. 2012, 125, 45–55. [Google Scholar] [CrossRef]
- Michaelides, P. The Ancient Port of Amathus (Cyprus): Its Construction, Foundation Conditions and Final Abandonment. Available online: https://pascal-francis.inist.fr/vibad/index.php?action=getRecordDetail&idt=6597194 (accessed on 20 October 2022).
- Antonopoulos, J. Data from Investigation on Seismic Sea-Waves Events in the Eastern Mediterranean from the Birth of Christ to 500 A.D. Part 1. Annali di Geofisica 1980, 33, 141–161. [Google Scholar] [CrossRef]
- Biryılmaz, E. Kıbrıs Mağusa Tuzla Bölgesinin Mühendislik Jeolojisi 2009. Available online: https://acikerisim.deu.edu.tr/xmlui/handle/20.500.12397/8257 (accessed on 8 December 2022).
- Cetin, K.O. TRNC Gazimagusa Tuzla Region Seismic Seismic SOIL Liquefaction Assessment Report; Union of the Chambers of Cyprus Turkish Engineers and Architects: Nicosia, Cyprus; Chamber of Civil Engineers: Nicosia, Cyprus, 2009. [Google Scholar]
- Hore, R.; Al-Mamun, S.; Ansary, M. SPT-CPT Correlations for Reclaimed Areas of Dhaka. J. Eng. Sci. 2018, 09, 35–46. [Google Scholar]
- Wald, D.J.; Allen, T.I. Topographic Slope as a Proxy for Seismic Site Conditions and Amplification. Bull. Seismol. Soc. Am. 2007, 97, 1379–1395. [Google Scholar] [CrossRef] [Green Version]
- Andrus, R.D.; Stokoe, K.H., II. Liquefaction Resistance of Soils from Shear-Wave Velocity. J. Geotech. Geoenviron. Eng. 2000, 126, 1015–1025. [Google Scholar] [CrossRef]
- Unites States Geological Survey Department. USGS Global Slope—Based Vs30 Map. Available online: https://earthquake.usgs.gov/data/vs30/ (accessed on 22 January 2023).

Figure 2.
1999 Adapazarı, Kocaeli earthquake liquefied fine-grained region with Magusa and Long Beach region [9].
Figure 2.
1999 Adapazarı, Kocaeli earthquake liquefied fine-grained region with Magusa and Long Beach region [9].

Figure 3.
Investigated SPT borehole locations (x) in the Tuzla region.

Figure 4.
Investigated SPT borehole locations (x) in the Long Beach region.

Figure 5.
Soil profile with SPT corrected blow counts from the Long Beach region.

Figure 6.
Soil profile with SPT corrected blow counts from the Tuzla region.

Figure 7.
Maximum peak ground acceleration values of the Cyprus island for a 6.5 Mw earthquake [26].
Figure 7.
Maximum peak ground acceleration values of the Cyprus island for a 6.5 Mw earthquake [26].

Figure 8.
Clean sand corrections according to the amount of fineness content (1) Idriss and Boulanger [27], (2) Cetin et al. [32], (3) Cetin et al. [33], (4) Seed et al. [31].

Figure 9.
Dimensional distribution of F.S. values for the Tuzla region.

Figure 10.
Dimensional distribution of the F.S. values for the Long Beach region.

Figure 11.
F.S. distribution map for 3 and 6 m depths of the Tuzla region.

Figure 12.
F.S. distribution map for 3 and 6 m depths of the Long Beach region.

Figure 13.
Liquefaction potential index map of the Tuzla region.

Figure 14.
Liquefaction potential index map of the Long Beach region.

Figure 15.
Liquefaction potential index correlation from previous studies conducted in the Tuzla region [41,42].

Figure 16.
Global slope-based shear wave velocity map of Cyprus [46].
Figure 16.
Global slope-based shear wave velocity map of Cyprus [46].


Table 1.
Liquefaction analysis in situ test methods [22].
Table 1.
Liquefaction analysis in situ test methods [22].
| Feature | SPT | CPT | Vs |
|---|---|---|---|
| Past measurements at liquefaction sites | Abundant | Abundant | Limited |
| Type of stress-strain behaviour influencing test | Large strain, partially drained | Large strain, drained | Small strain, no excess pore water pressure |
| Quality control and repeatability | Poor to good | Very good | Good |
| Detection of variability of soil deposits | Good for closely spaced tests | Very good | Fair |
| Soil types in which test is recommended | Nongravel | Nongravel | All |
| Soil sample retrieved | Yes | No | No |
| Test measures index or engineering property | Index | Index | Engineering |
Disclaimer/Publisher’s Note: The statements, opinions and data contained in all publications are solely those of the individual author(s) and contributor(s) and not of MDPI and/or the editor(s). MDPI and/or the editor(s) disclaim responsibility for any injury to people or property resulting from any ideas, methods, instructions or products referred to in the content. |
© 2023 by the authors. Licensee MDPI, Basel, Switzerland. This article is an open access article distributed under the terms and conditions of the Creative Commons Attribution (CC BY) license (https://creativecommons.org/licenses/by/4.0/).
Share and Cite
MDPI and ACS Style
Selcukhan, O.; Ekinci, A. Assessment of Liquefaction Hazard and Mapping Based on Standard Penetration Tests in the Long Beach and Tuzla Regions of Cyprus. Infrastructures 2023, 8, 99. https://doi.org/10.3390/infrastructures8060099
AMA Style
Selcukhan O, Ekinci A. Assessment of Liquefaction Hazard and Mapping Based on Standard Penetration Tests in the Long Beach and Tuzla Regions of Cyprus. Infrastructures. 2023; 8(6):99. https://doi.org/10.3390/infrastructures8060099
Chicago/Turabian StyleSelcukhan, Onur, and Abdullah Ekinci. 2023. "Assessment of Liquefaction Hazard and Mapping Based on Standard Penetration Tests in the Long Beach and Tuzla Regions of Cyprus" Infrastructures 8, no. 6: 99. https://doi.org/10.3390/infrastructures8060099