Article

Experimental Tests and Numerical Analyses for the Dynamic Characterization of a Steel and Wooden Cable-Stayed Footbridge

Department of Construction, Civil Engineering and Architecture (DICEA), Università Politecnica delle Marche, Via Brecce Bianche, 60131 Ancona, Italy
*
Author to whom correspondence should be addressed.
Infrastructures 2023, 8(6), 100; https://doi.org/10.3390/infrastructures8060100
Submission received: 5 April 2023 / Revised: 16 May 2023 / Accepted: 26 May 2023 / Published: 30 May 2023
(This article belongs to the Section Infrastructures and Structural Engineering)

Abstract

:
Vibrations are an issue of increasing importance in current footbridge design practice. More sophisticated footbridges with increasing spans and more effective construction materials result in lightweight structures and a high ratio of live load to dead load. As a result of this trend, many footbridges have become more susceptible to vibrations when subjected to dynamic loads. The most common dynamic loads on footbridges, other than wind loading, are pedestrian-induced footfall forces due to the movement of people. This paper concerns the experimental and numerical dynamic characterization of a newly built steel and wooden cable-stayed footbridge. The footbridge was dynamically tested in situ under ambient vibration, and the results allowed the real dynamic behavior of the footbridge to be captured. The dynamic response under pedestrian dynamic loads was also investigated and compared with the limitations provided by the main international codes and guidelines for footbridge serviceability assessment. A numerical model of the footbridge was also developed and updated based on the experimental outcomes. Then, the calibrated model was used to numerically assess the footbridge’s serviceability following the guideline prescriptions for pedestrian load simulation, and the design accuracy was also validated. This paper aims to increase the state-of-the-art knowledge about footbridge dynamic testing so as to support the design of new and futuristic structures as well as prove the effectiveness of using the requirements of codes and guidelines for footbridge serviceability assessment by adopting a calibrated numerical model.

1. Introduction

The combination of advanced computational methods and high-performance construction materials has led to the achievement of highly essential and light structures [1]. Although providing important advantages, lightness and slenderness also constitute two of the main concerns regarding the serviceability of footbridges [2,3]. Indeed, structures of this type are often vulnerable to dynamic loads, such as those due to the movement of pedestrians. For example, significant lateral and vertical vibrations are frequently associated with slender footbridges under the movement of pedestrians [4]. It is well-known that vibrations in structures induce a sense of insecurity in people, even though this does not mean that the structure is unsafe [5,6,7]. Moreover, it is also well-known that people induce vibrations in structures themselves. For these reasons, in the design phase, it is crucial to ensure that a structure will provide enough comfort to the users, since vibration problems can be difficult and very expensive to solve after construction [8].
Many authors from across the world investigated the problem of the serviceability assessment of footbridges, performing experimental tests and numerical analyses. Many of them used sensors over the deck to measure the response of footbridges under dynamic loads and to evaluate the relevant comfort in their usage. For instance, Tadeu et al. [9] investigated vibrations induced by wind and humans in the 516 Arouca suspended footbridge (Portugal), the world’s longest footbridge span, in 2020 (516 m). Kexin et al. [10] performed a comprehensive experimental campaign regarding the newly built Dongxing Temple suspension footbridge in China to investigate both the dynamic and static behaviors of the structure. Salgado et al. [11] tested a timber half-through arch footbridge under walking, running, and jumping forces of people, during which they recorded the accelerations over the deck to assess the structural serviceability. Al-Smadi et al. [12] conducted work in which the evaluation of the vibration serviceability and comfort criteria of a curved footbridge located in Jordan was performed, since several pedestrians felt a level of discomfort when passing over it. Other authors tested more than one footbridge to reach a general conclusion about the comfort assessment. For example, Feng et al. [13] recorded accelerations on 21 pedestrian bridges in Beijing, China, under different service conditions, and questionnaire surveys on pedestrian comfort were conducted. Rodriguez-Suesca et al. [14] assessed the vibration performance of eight steel or concrete footbridges whose structures were deteriorated due to aging effects, whilst Cuevas et al. [15] dynamically tested two footbridges to assess their lateral vibration serviceability. Additionally, Bayat et al. [16] investigated serviceability in the usage of a historical suspended footbridge located in Italy. Many other works are available in the literature focusing on the dynamic investigation and the serviceability assessment of footbridges built with innovative and high-performance materials (such as glass-fiber-reinforced polymers—GFRP [17,18,19] and glass [20]), which are generally more slender and lighter. Of course, in addition to the use of sensors deployed on the footbridge, other recent innovative techniques can be adopted to investigate the dynamic behavior of the structure, such as the video magnification of camera-recorded video [21] and 3D laser vibrometry [22].
Many other works have addressed experimental tests and numerical analyses performed to support the design procedures [23,24], the construction phases [25], and the design of retrofitting works in existing structures [26,27]. Concerning the latter topic, it is well-known that if are comfort concerns regarding a slender footbridge due to the high vibrations under pedestrian use, the most feasible solution to adopt is that of increasing the damping properties of the structure through the installation of passive inertial control devices [28,29,30]. As pedestrian movement over the deck is unpredictable, some works are available in the scientific and technical literature that aim to support the task of modelling the pedestrian dynamic load so as to support the design of the structure and the dynamic proof test [31,32,33,34]. Indeed, some recommendations are provided by international guidelines (as will be addressed further in the next section), but this topic is far from being considered to be concluded.
In this paper, an experimental and numerical investigation of the dynamic characteristics of footbridges is conducted. This work was developed considering a real steel and wooden footbridge newly built in Italy. At the beginning of the paper, a brief summary of the main available codes and guidelines for the dynamic design and testing of footbridges is proposed. After that, the extensive experimental dynamic campaign is presented. Dynamic tests were performed to identify the modal parameters of the footbridge under ambient vibrations, as well as its response (in terms of accelerations) under human-induced vibrations with the aim of assessing its comfort usage under common and extreme dynamic excitations. The accelerations recorded during the pedestrian dynamic tests are compared with the limit values proposed by the codes and guidelines with the aim of assessing the serviceability of the footbridge under pedestrian dynamic loads. Furthermore, the footbridge was numerically investigated. A Finite Element Model (FEM) of the structure was created and updated based on the identified experimental modal parameters. The serviceability of the footbridge was then assessed using the calibrated FEM. The latter is crucial for this evaluation, since the relevant outcomes may be considered as more representative of reality. The results are used to numerically assess the footbridge’s serviceability and to provide a verification regarding the accuracy when using the guideline procedures under human-induced excitations. Indeed, the numerical outcomes are compared with the experimental ones. The aim of this paper is to increase the state-of-the-art knowledge about the dynamic testing of footbridges in order to support the design of new and futuristic ones. Innovative content, rarely found in the scientific and technical literature, is provided through the design simulations performed on the calibrated numerical model, which allow for a more realistic footbridge design (or assessment) and, consequently, for the validation of the guideline prescriptions regarding footbridge serviceability assessment.

2. A Review of Code and Guideline Prescriptions

Many international codes and guidelines address the topic of the dynamic analysis and assessment of footbridges, especially under human-induced vibrations [35]. In the European context, the Eurocodes provide useful prescriptions, and a comprehensive treatment of the topic may be found in the Sètra [36] and Hivoss [37] guidelines. These guidelines divide the topic of the dynamic analysis of footbridges into two main parts, the former about the design procedures and the latter about the testing procedures. The Sètra is the older and more extensive guideline and provides copious information about the design procedures, while little information about the testing ones is included. The Hivoss is shorter and recalls many concepts of Sètra but also provides far more indications about the testing procedures, especially under human-induced dynamic loads. In this section, the Sètra and Hivoss prescriptions for footbridge dynamic design and testing are discussed, together with those provided by the Eurocodes. At the end of this section, the frequency risk intervals and the acceleration thresholds proposed by these codes and guidelines are compared with those recommended by other national and international codes and regulations.

2.1. Design

The design procedures defined by the Sètra and Hivoss start with the numerical evaluation of the footbridge natural frequencies (of the main vibration modes) and the relevant comparisons with the frequency risk intervals proposed by these guidelines. The numerical vibration modes can be achieved through the use of the numerical model developed for the structural design. If the numerical natural frequencies fall within the risk intervals, resonance may develop during pedestrian use. In these cases, the accelerations induced by human activities must be below the threshold values. To determine the maximum accelerations to which the footbridge can be subjected, the guidelines propose load cases for application to the model, in which the pedestrian activities are simulated using harmonic dynamic loads. If the comfort criteria are not satisfied, the footbridge design may be changed in order to improve the structural dynamic behavior under human-induced vibrations. Some strategies serving either to change the natural frequencies or to dampen the accelerations of the footbridge are suggested in both guidelines. Additionally, the EC0 [38] provides frequency limits correlated to resonance problems and maximum acceleration values to be used for the footbridge design. Moreover, for wooden footbridges (as in the case study discussed in this paper), the EC5 [39] provides empirical formulae with which to determine the maximum accelerations produced through pedestrian activities. Since the acceleration levels are calculated as a function of the damping, both the guidelines and EC5 provide indicative damping values on the basis of the footbridge construction materials.

2.2. Testing

The experimental evaluation of the footbridge dynamic properties may be divided into two main parts: (i) the identification of the modal parameters (namely, the frequencies, damping ratios, and mode shapes) and (ii) the measurement of the footbridge dynamic response under human-induced vibrations. Modal parameter identification may be achieved by performing Ambient Vibration Tests (AVTs), even if free-vibration and forced-vibration tests are recommended for a more reliable estimation of the damping. The identified modal parameters may be used to calibrate the numerical model and to support the design of possible tuning control devices. On the contrary, the measurement of the accelerations arising due to human activities are necessary to assess the footbridge comfort criteria. For this purpose, the footbridge is excited through human activities in an attempt to reach the resonance condition for the considered vibration mode. In the meantime, the accelerations over the footbridge are measured and then compared with the same limits considered for the design phase. Consequently, many dynamic tests are performed in order to excite the main footbridge vibration modes. The higher mode to be investigated may be selected based on the frequency risk intervals provided in the codes and guidelines.
Only the Sètra and Hivoss guidelines state which kinds of tests should be performed. Specifically, Sètra proposes four types of crowd tests, namely, (i) random walking in circles, continuously, or even from one end to the other; (ii) marching in step at the natural frequency that needs to be excited; (iii) marching in step with a sudden halt for the measurement of the damping; and (iv) running, jumping, or kneeling to test the footbridge under extreme stresses. However, the Sètra does not provide specific indications on how the tests must be carried out and the actual number of pedestrians that should be involved. Contrarily, the Hivoss suggests different tests on the basis of the number of pedestrians over the footbridge and the frequency to be investigated. Considering the pedestrian number, three load cases should be adopted: (i) 1 pedestrian, (ii) a group of 10–15 pedestrians, and (iii) a continuous flow of pedestrians. The type of movement is defined based on the frequency that must be excited. More specifically:
  • If the frequency to be investigated is f < 2.5 Hz, tests are carried out using walking motion;
  • If the frequency to be investigated is 2 < f < 3 Hz, tests are carried out using either walking or running motion;
  • If the frequency to be investigated is f > 3 Hz, tests are carried out using running motion.
Given the random characteristics of human excitation, the Hivoss also recommends performing multiple tests (typically around five) for each load case and considering the highest recorded acceleration value. If the recorded accelerations exceed the threshold values, modifications of the footbridge structure should be performed. In this regard, the Sètra underlines that the improvement of the damping capacities may be the only type of intervention for existing structures.
Concerning existing footbridges, the Eurocodes do not provide any further indications about test methods and human dynamic loads; they only provide the frequency risk intervals and acceleration thresholds already discussed for the design case.

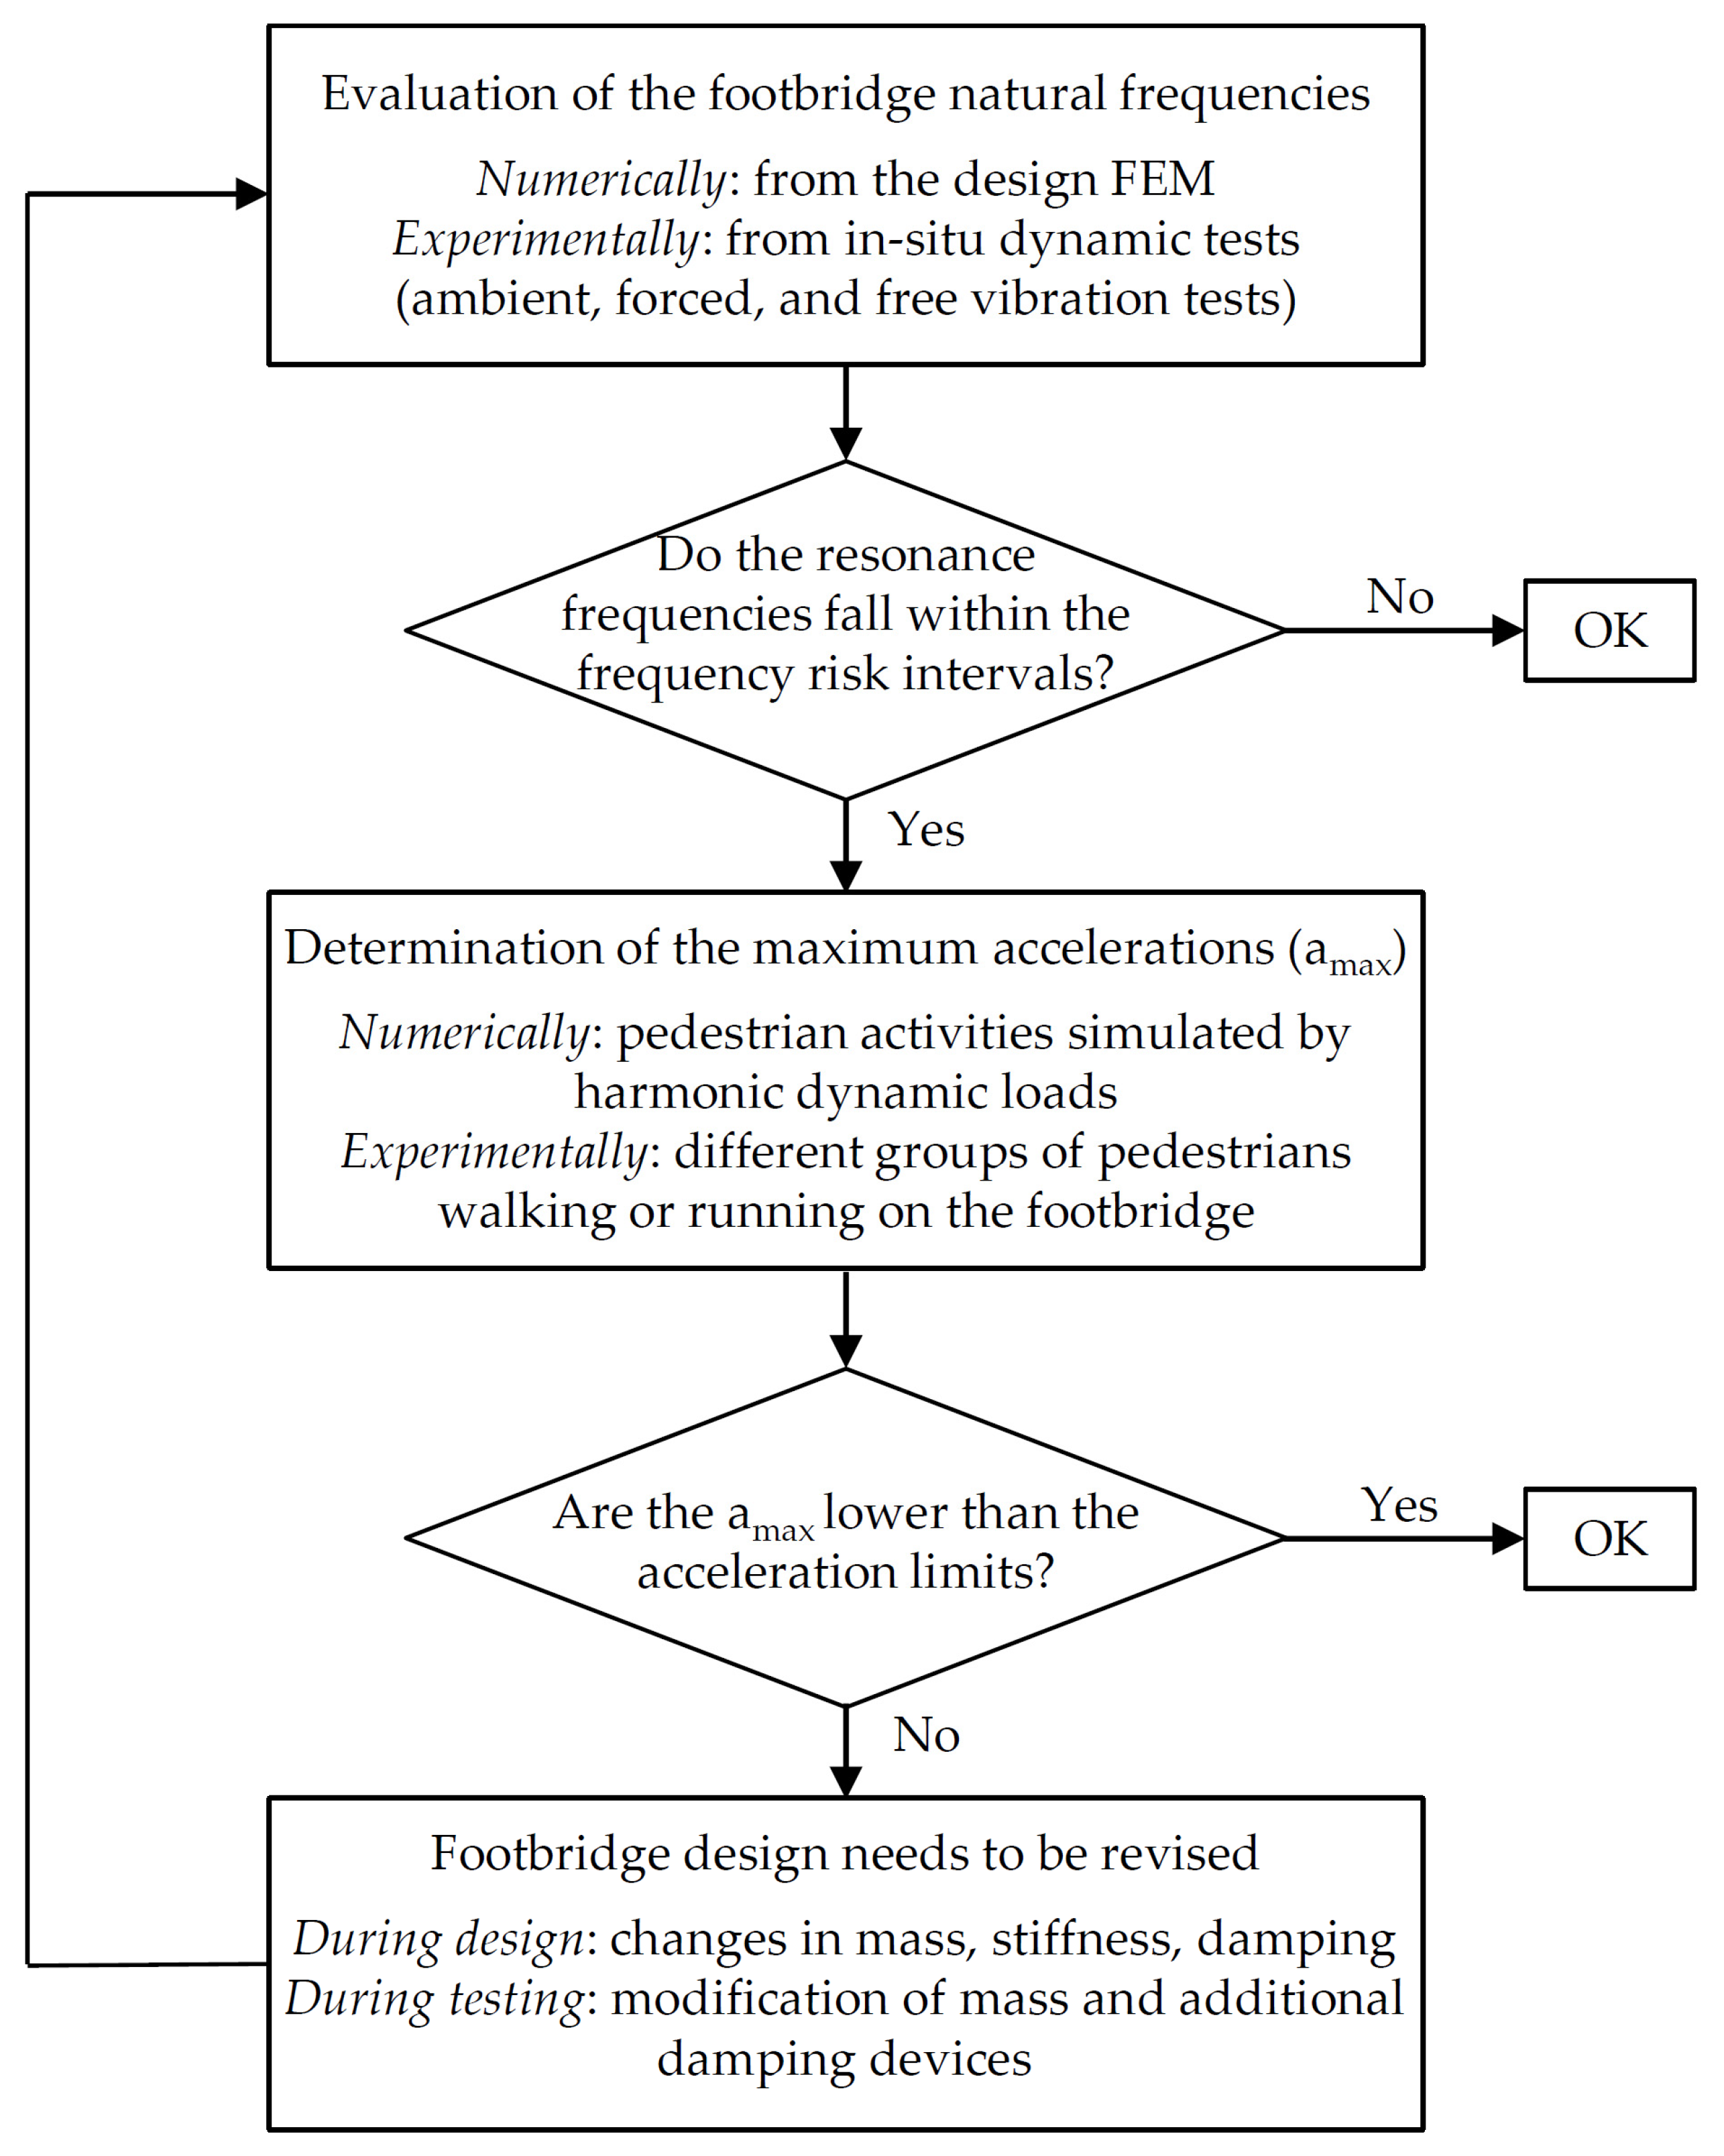
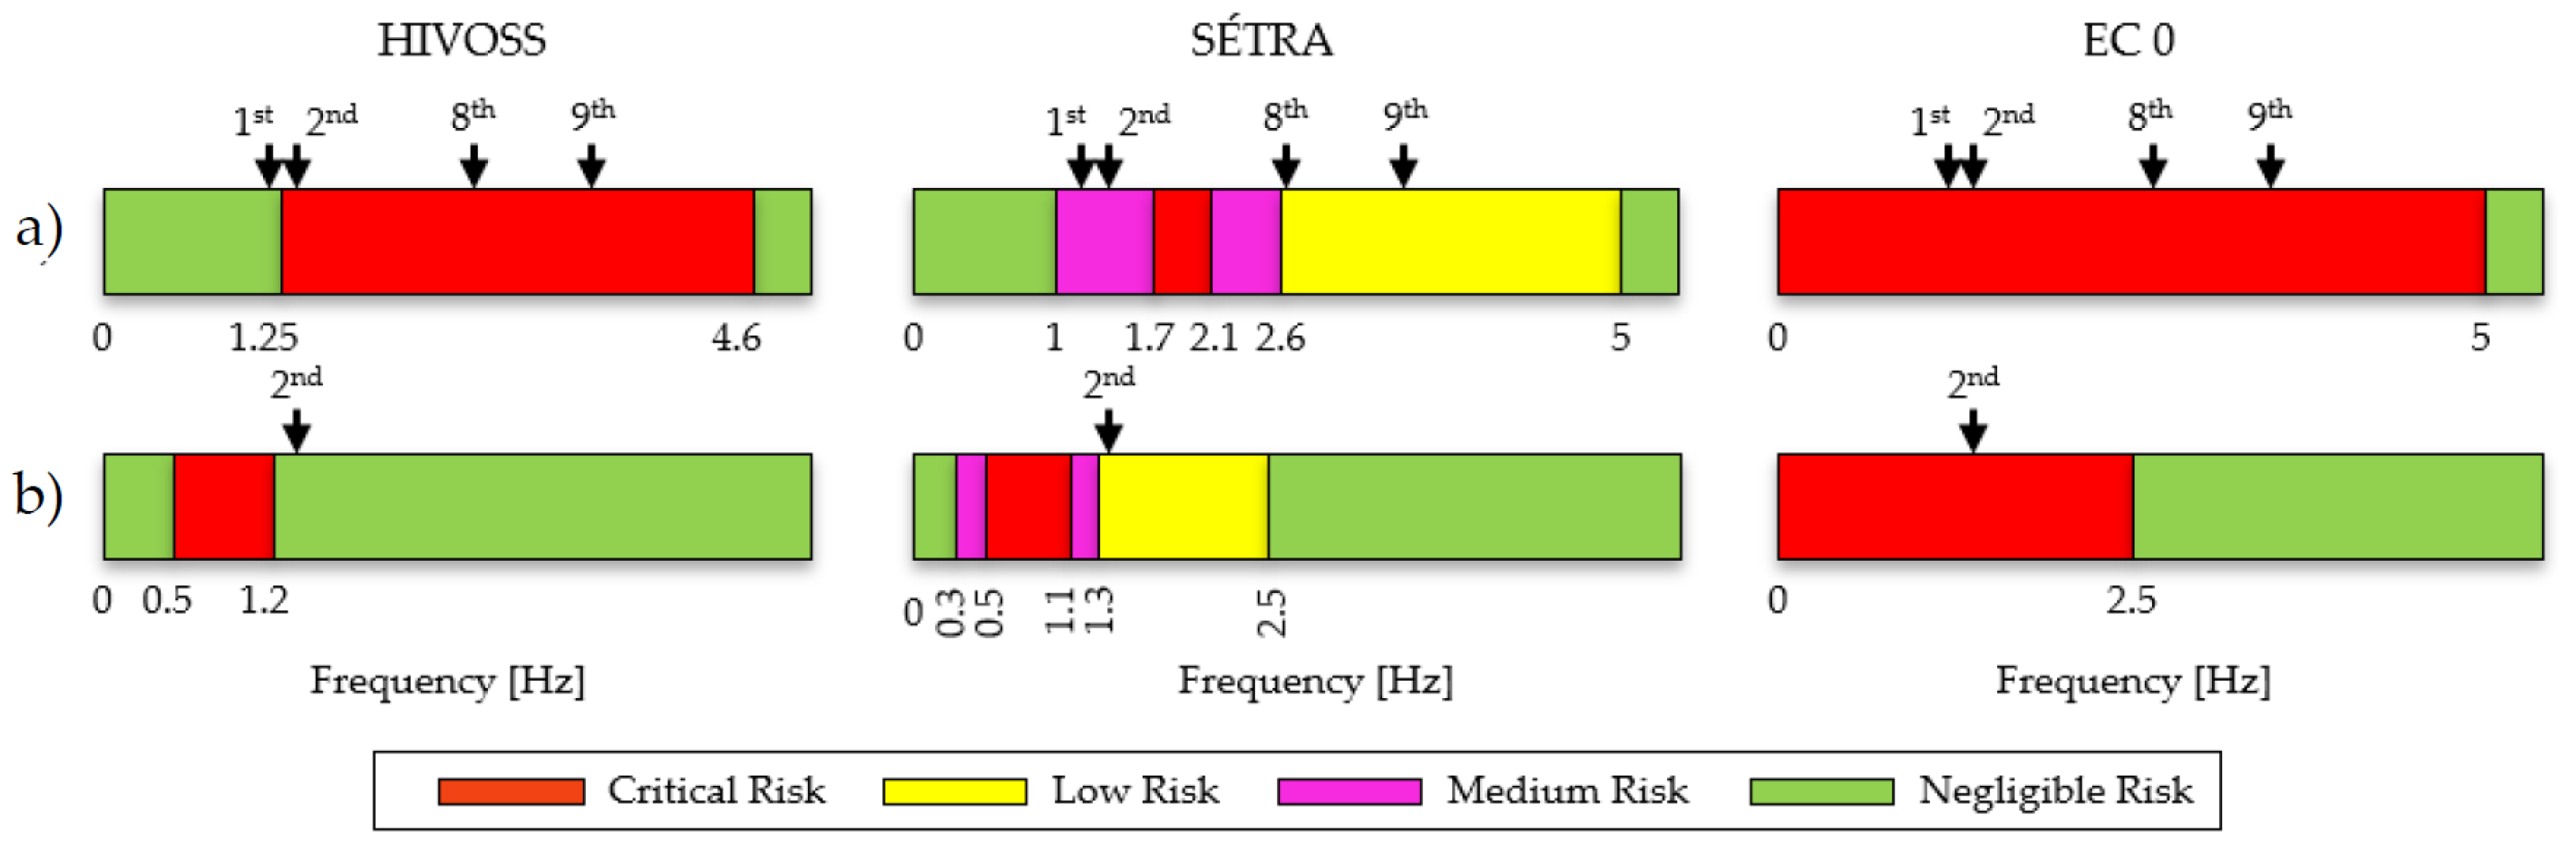
2.3. Frequency Risk Intervals and Acceleration Limits Proposed by the Codes and Guidelines

The frequency risk intervals are defined as those intervals in which resonance problems between the bridge and the moving pedestrians can occur. If the footbridge natural frequencies fall into these intervals, a comfort assessment for pedestrian activities should be performed. The two guidelines and the Eurocodes provide different frequency risk intervals for the vertical (bending and torsion) and horizontal (transverse) modes. Moreover, acceleration thresholds between acceptable comfort and unacceptable discomfort are provided. The same is true for the most important codes and standards available worldwide. Table 1 summarizes the frequency risk intervals and the relevant acceleration thresholds provided by the main codes and guidelines implemented worldwide. In Figure 1 a flowchart that summarizes the main steps to be followed during the design of new footbridges or the assessment of existing ones, in order to ensure pedestrian comfort, is reported.
In general, natural frequencies beneath 5 Hz for vertical modes or below 2.5 Hz for horizontal ones can lead to footbridge resonance. Regarding the acceleration limits, some regulations provide constant values, while others calculate the accelerations as a function of the fundamental frequency of the footbridge. Nevertheless, the frequency risk interval and the acceleration limits proposed by the different codes and guidelines differ from one another, sometimes even sensibly. This denotes a lack of a standardization and uniformity around the world. This task could be addressed by researchers in future works in an attempt to standardize guidance on the serviceability assessment of pedestrian footbridge vibrations.

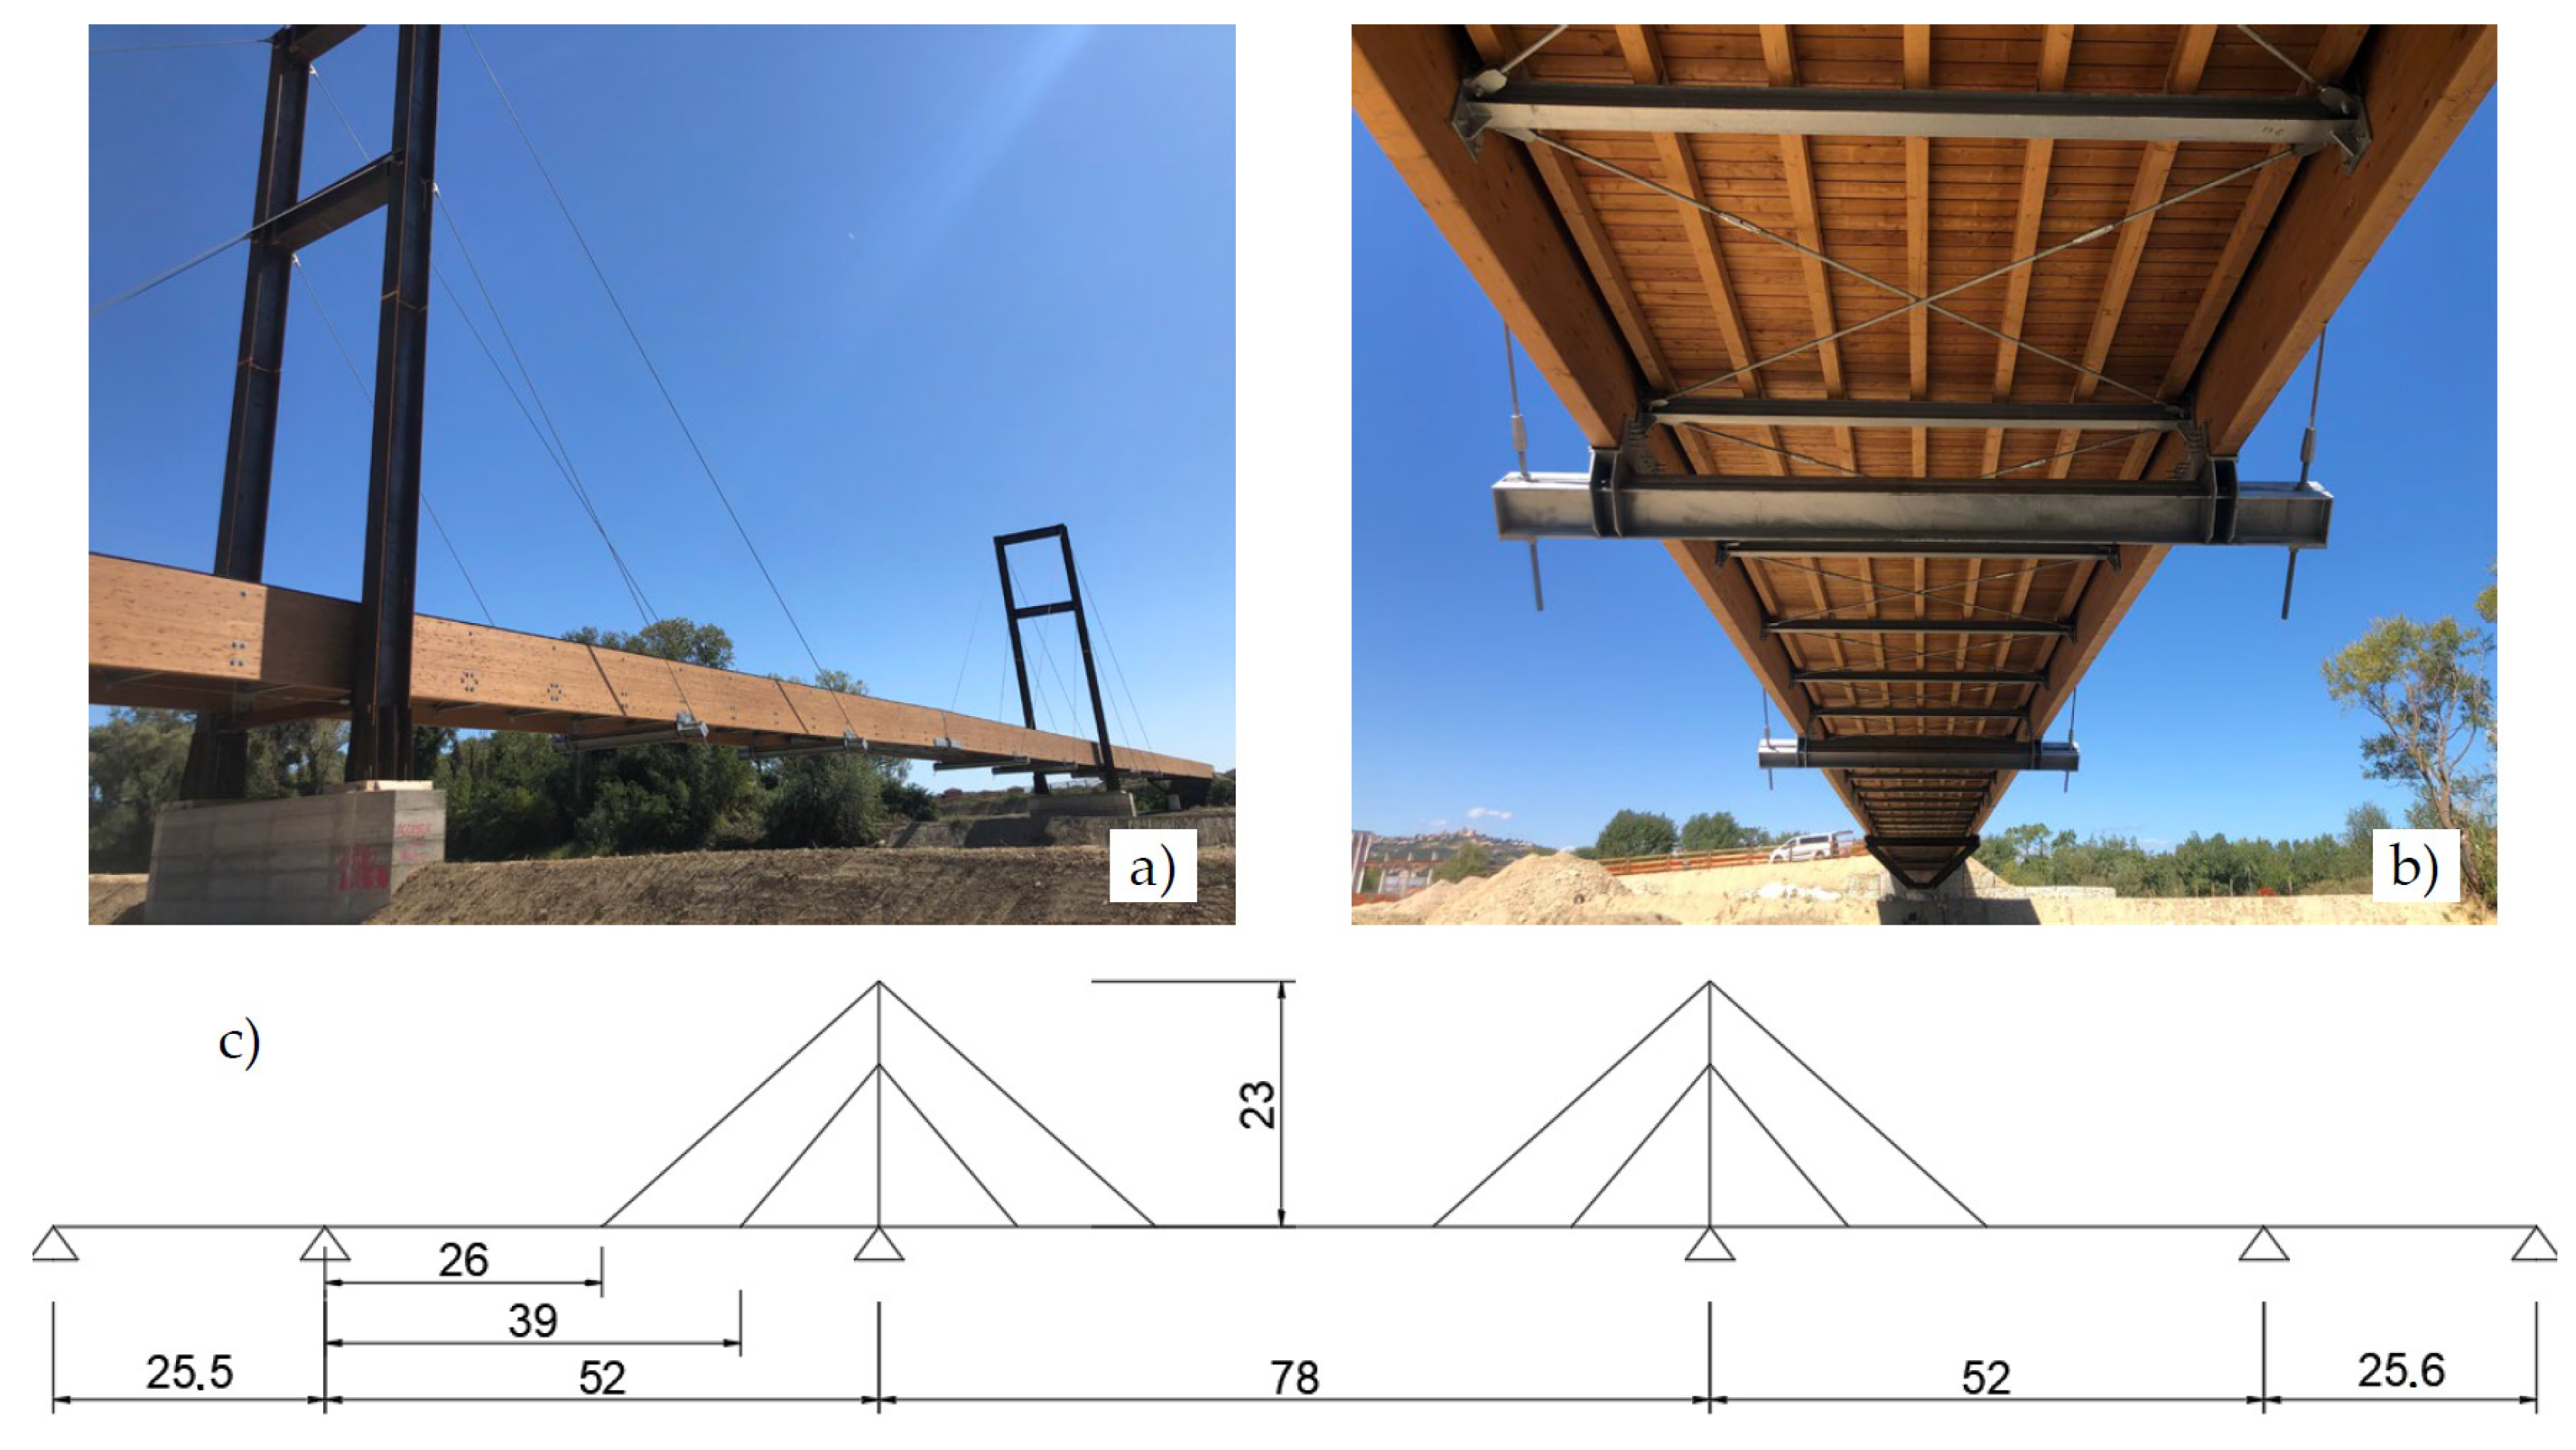
3. Description of the Footbridge Case Study

The present work was developed considering a newly built cable-stayed wooden and steel footbridge located in Central Italy as a case study (Figure 2). The footbridge is 233 m long and serves as a walking and cycling link between two municipalities divided by a river. The deck is 4 m wide and is built with wooden planking supported by steel transverse beams and steel truss cables, the latter working as a bracing system. The whole deck is supported by two lateral wooden beams which also have the additional function of parapets. The footbridge is composed of five spans. The external spans, with a length of approximately 25.5 m, are simply supported on the abutments and on piers; the three internal spans, with lengths of 52 m, 78 m, and 52 m, are supported by stays and by transverse steel beams located in parallel to the two steel portals and the two piers. The portals are approximately 23 m high and made of “Corten” steel profiles. The connection between the deck and stays is assured by steel beams bolted to the wooden beams on the bottom side of the deck. A geometric scheme of the footbridge, with the main dimensions, is provided in Figure 2c.

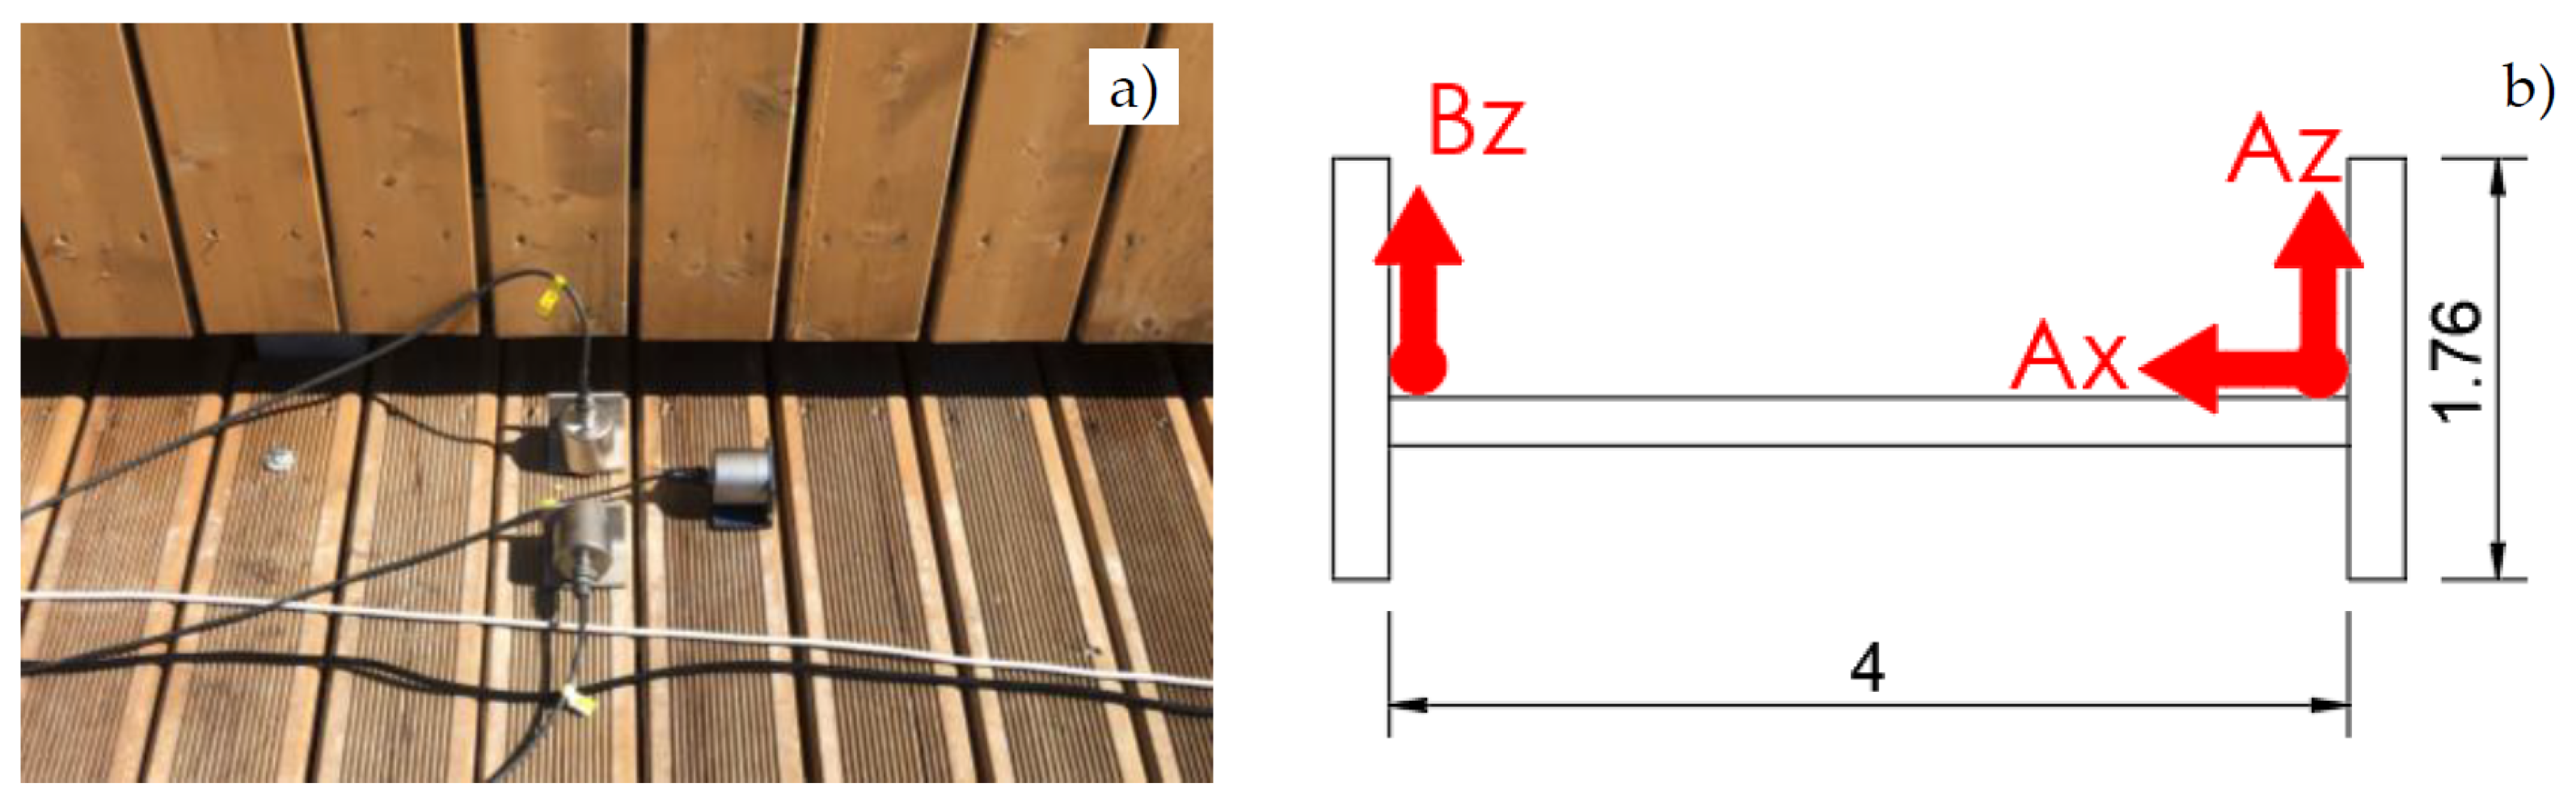
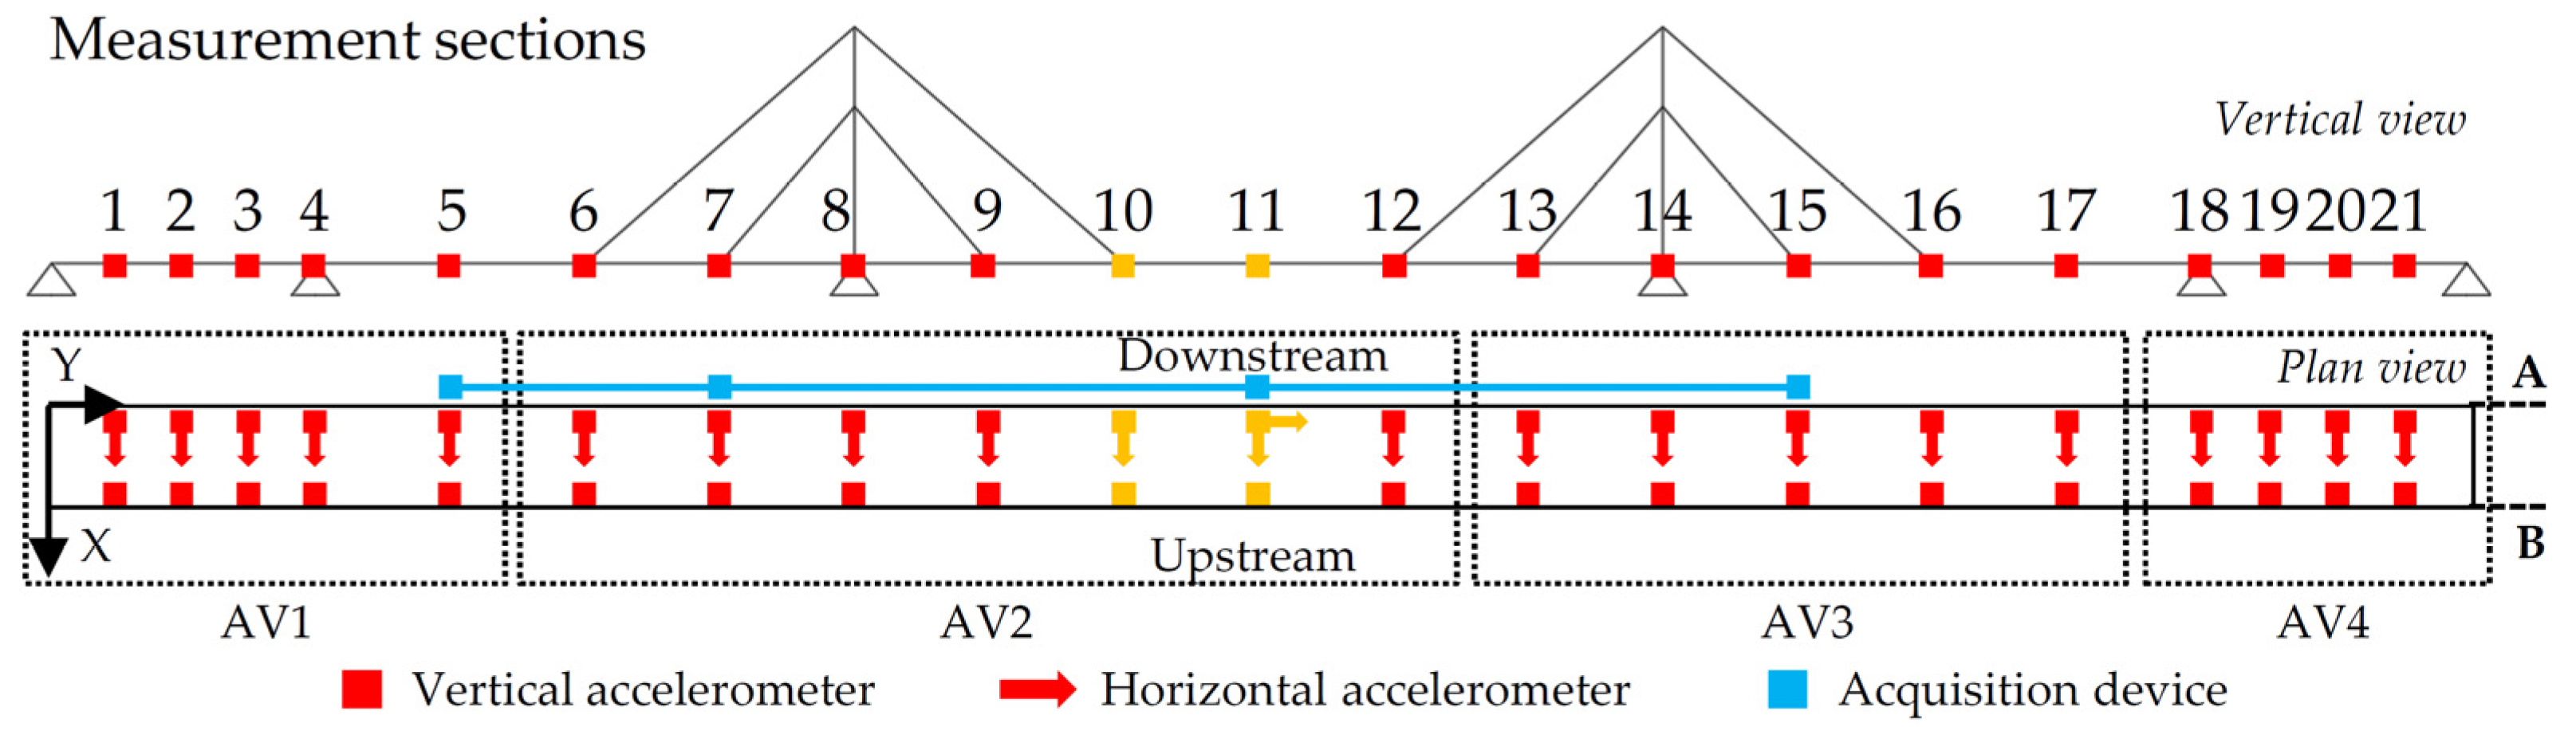
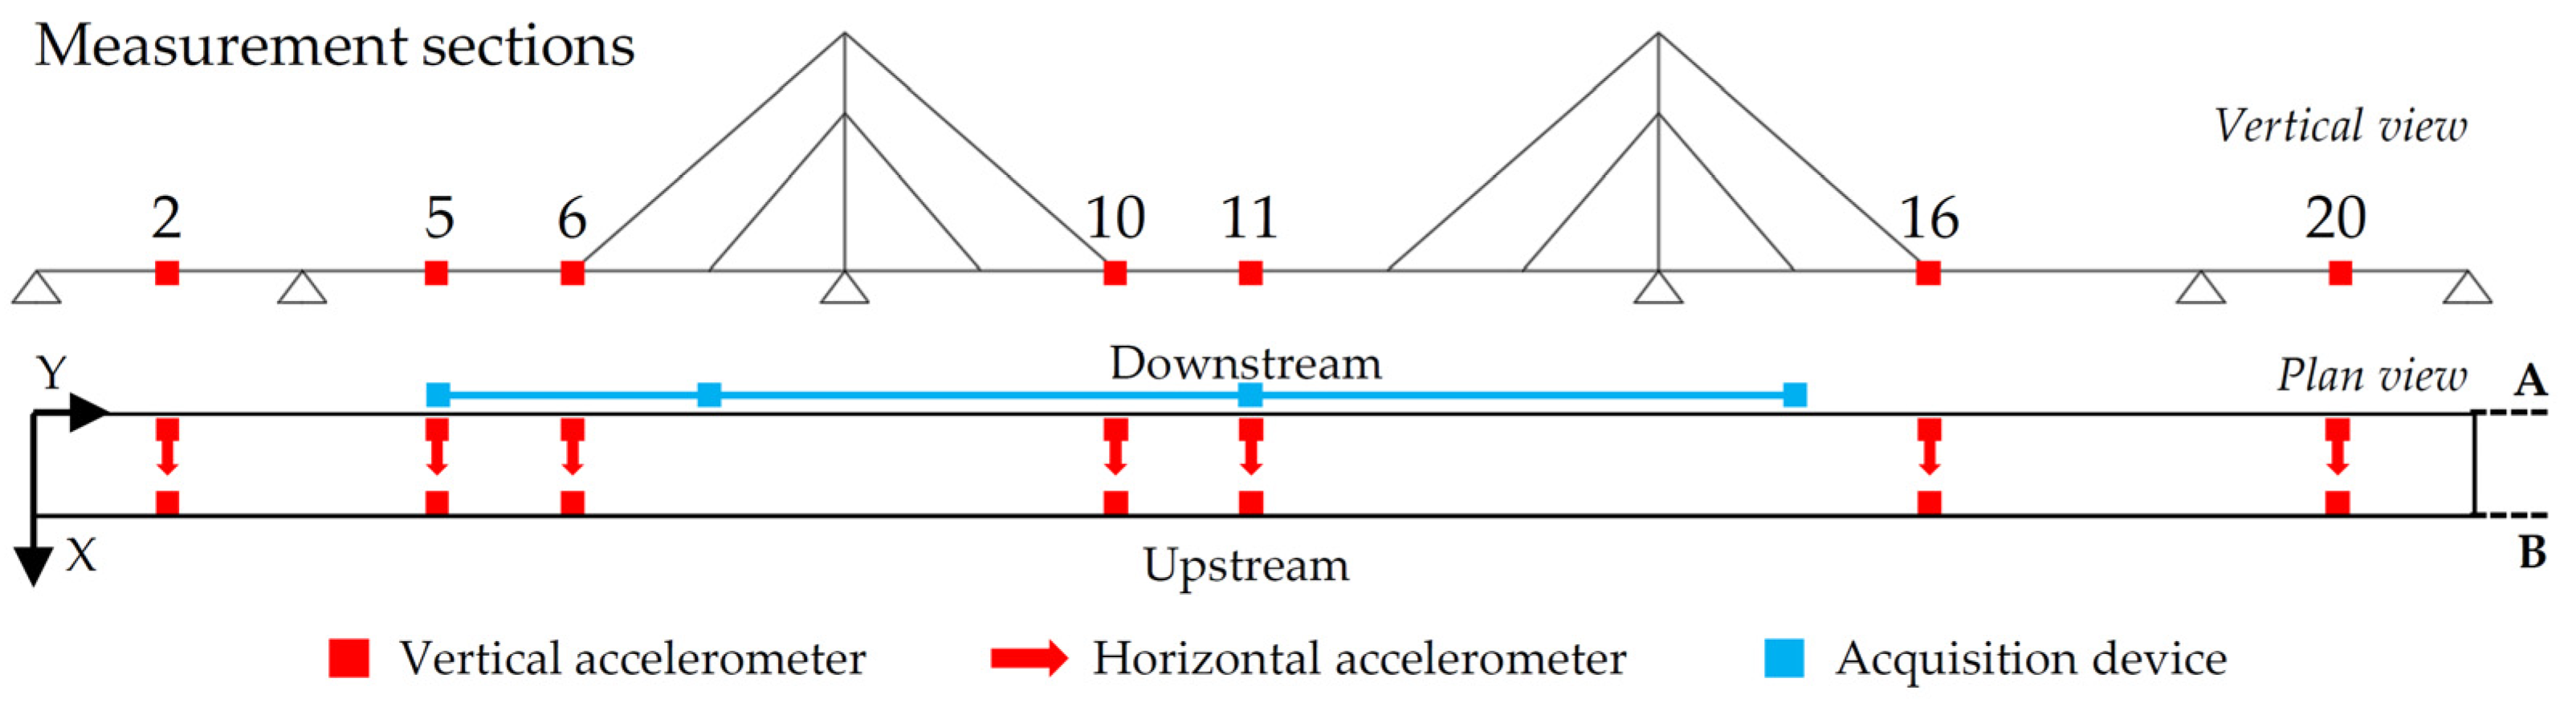
4. Experimental Campaign

According to the indications provided by the Hivoss and Sètra, the experimental campaign consisted of the identification of the footbridge modal parameters through AVTs and the evaluation of the dynamic response under human-induced loads. During the tests, the accelerations were recorded using a measurement system with the following characteristics [49]:
  • Twenty-two uniaxial piezoelectric accelerometers with 10,000 mV/g of nominal sensibility, a range of measurement of +/−0.5 g pk, range of frequency of (±10%) 0.07 ÷ 300 Hz, and broadband resolution 1 µg (RMS);
  • Eight acquisition modules, NI 9230, with a resolution of 24 bit, acquisition range of +/−30 V, and maximum sampling rate of 12.8 kS/s/ch;
  • Three chassis (four slots), NI cDAQ-9185 TSN-enabled;
  • One chassis (eight slots), NI cRIO-9045 TSN-enabled, with a 1.30 GHz Dual-Core CPU, 2 GB of RAM, 4 GB of storage, range of −20 °C to 55 °C, Kintex-7 70T FPGA;
  • Coaxial cables;
  • Ethernet cables, Cat.6 shielded S/TFP;
  • One notebook.

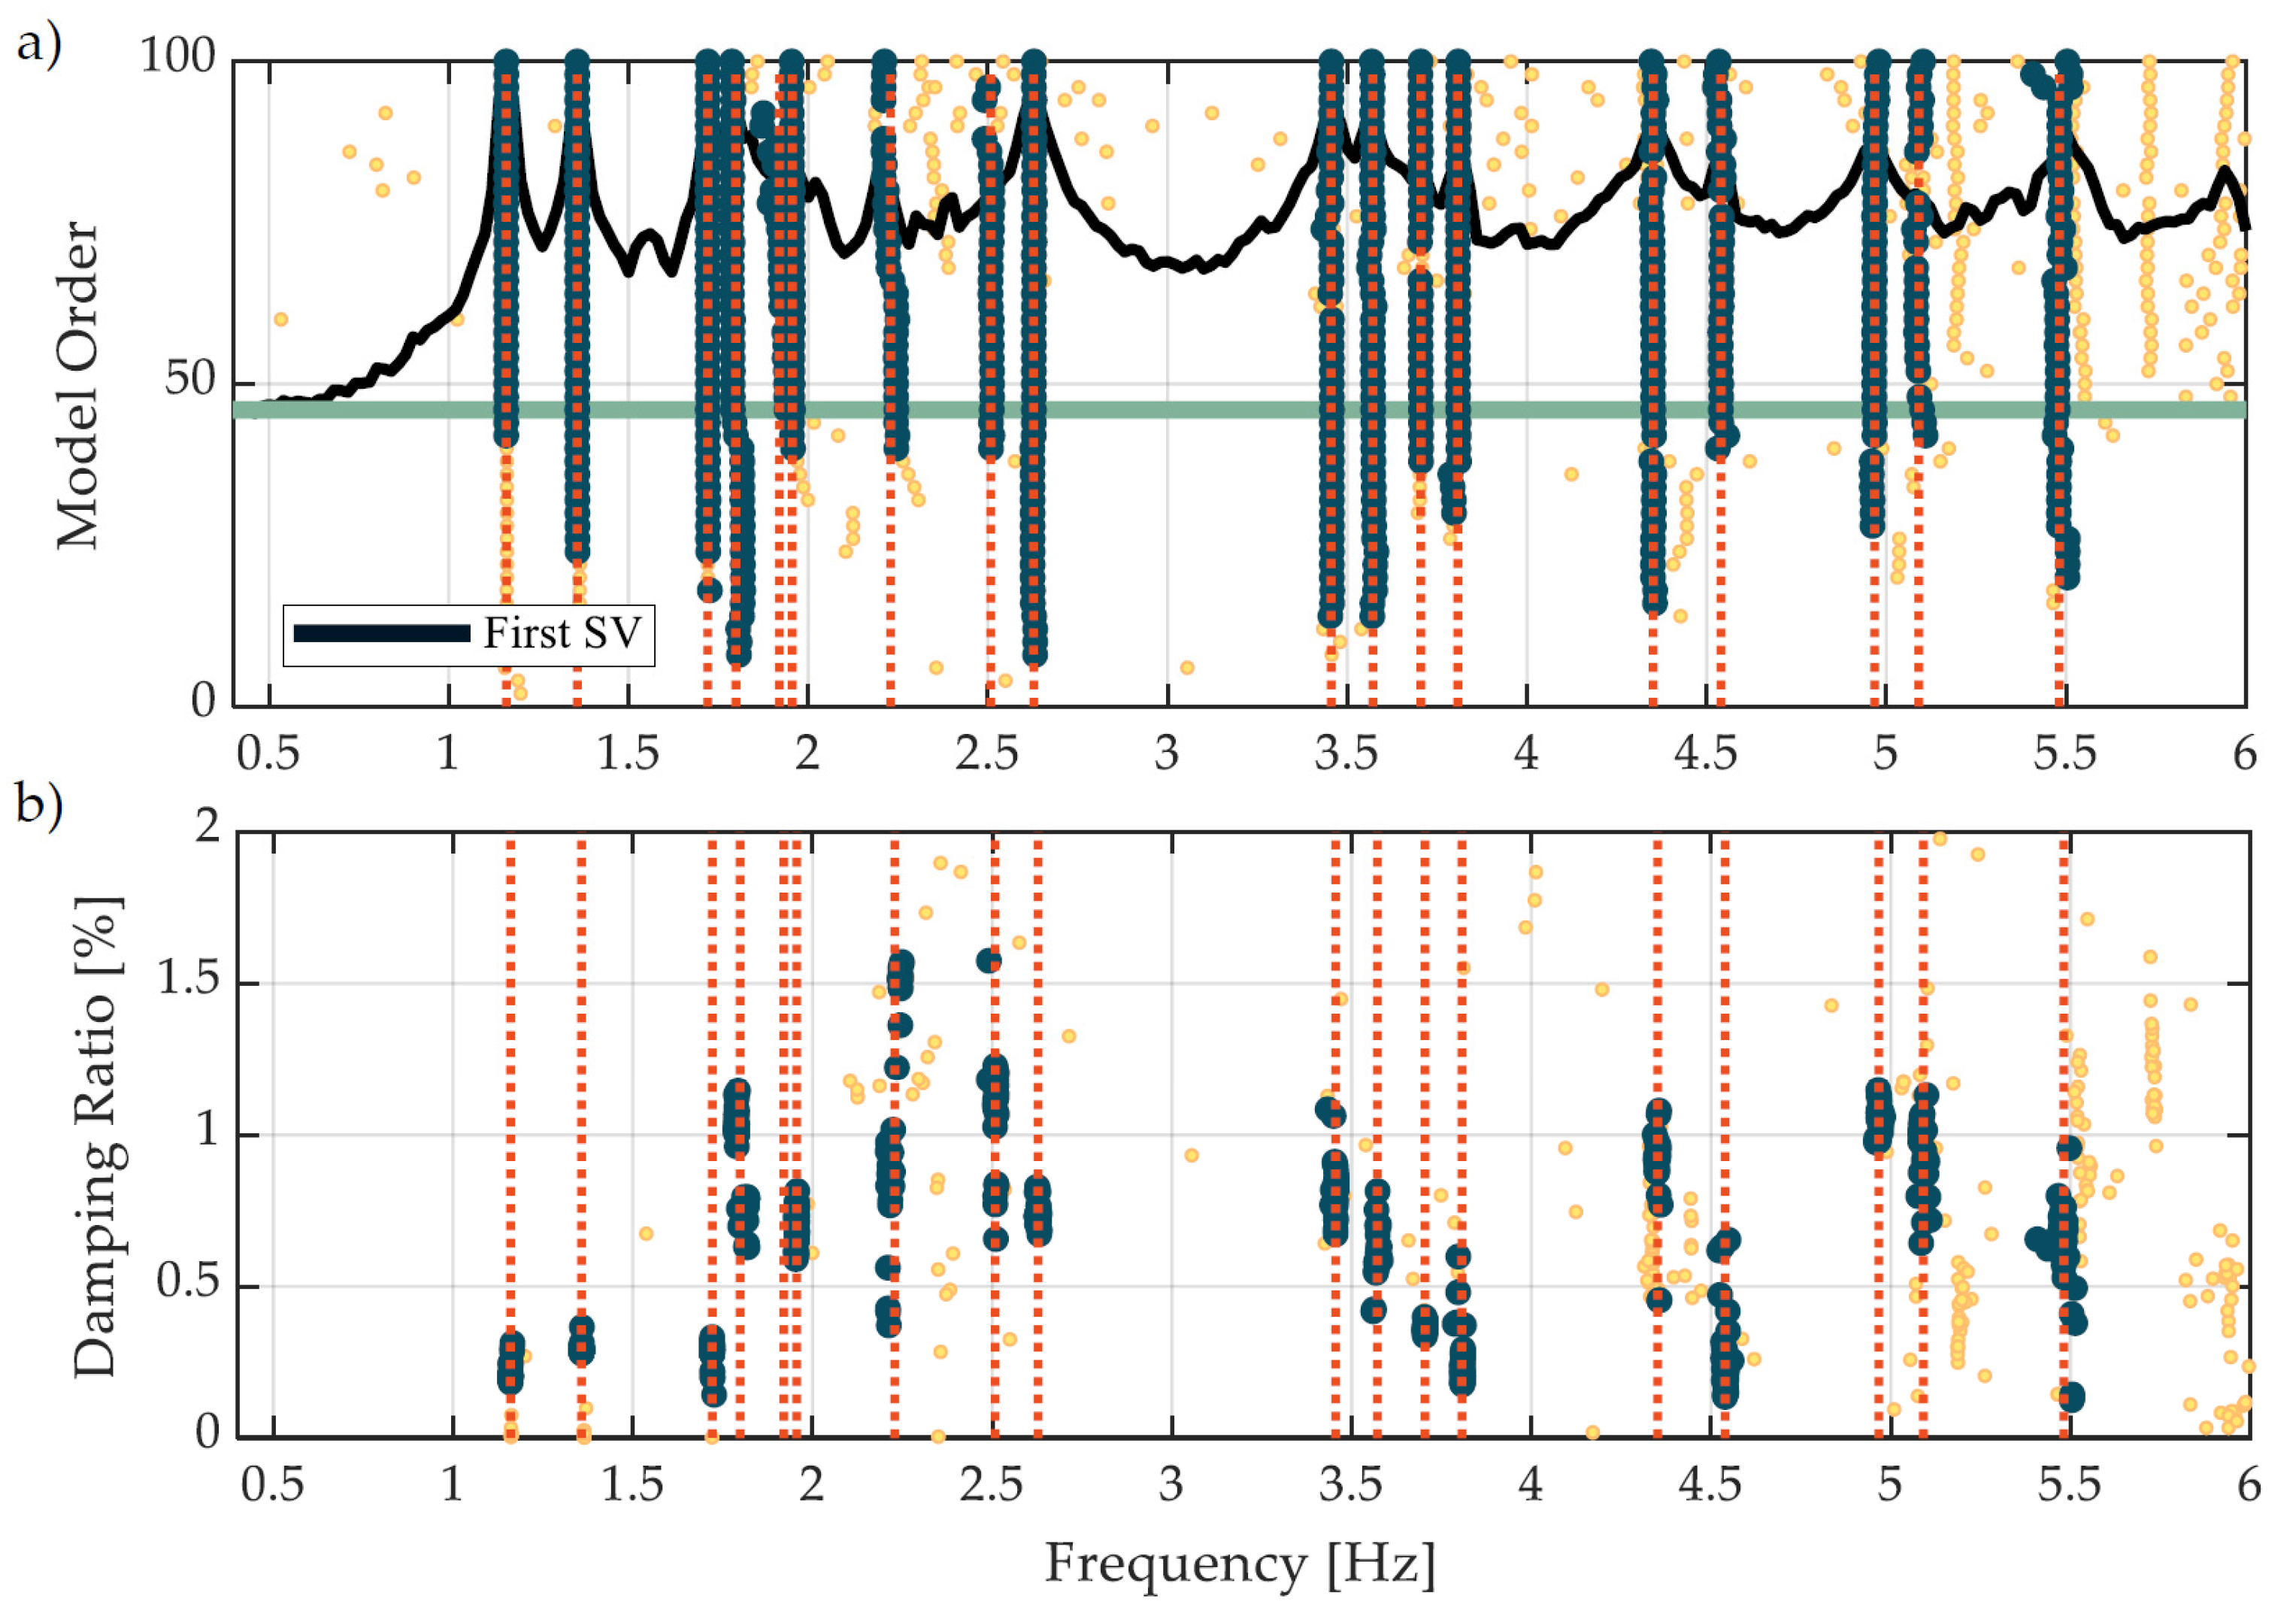
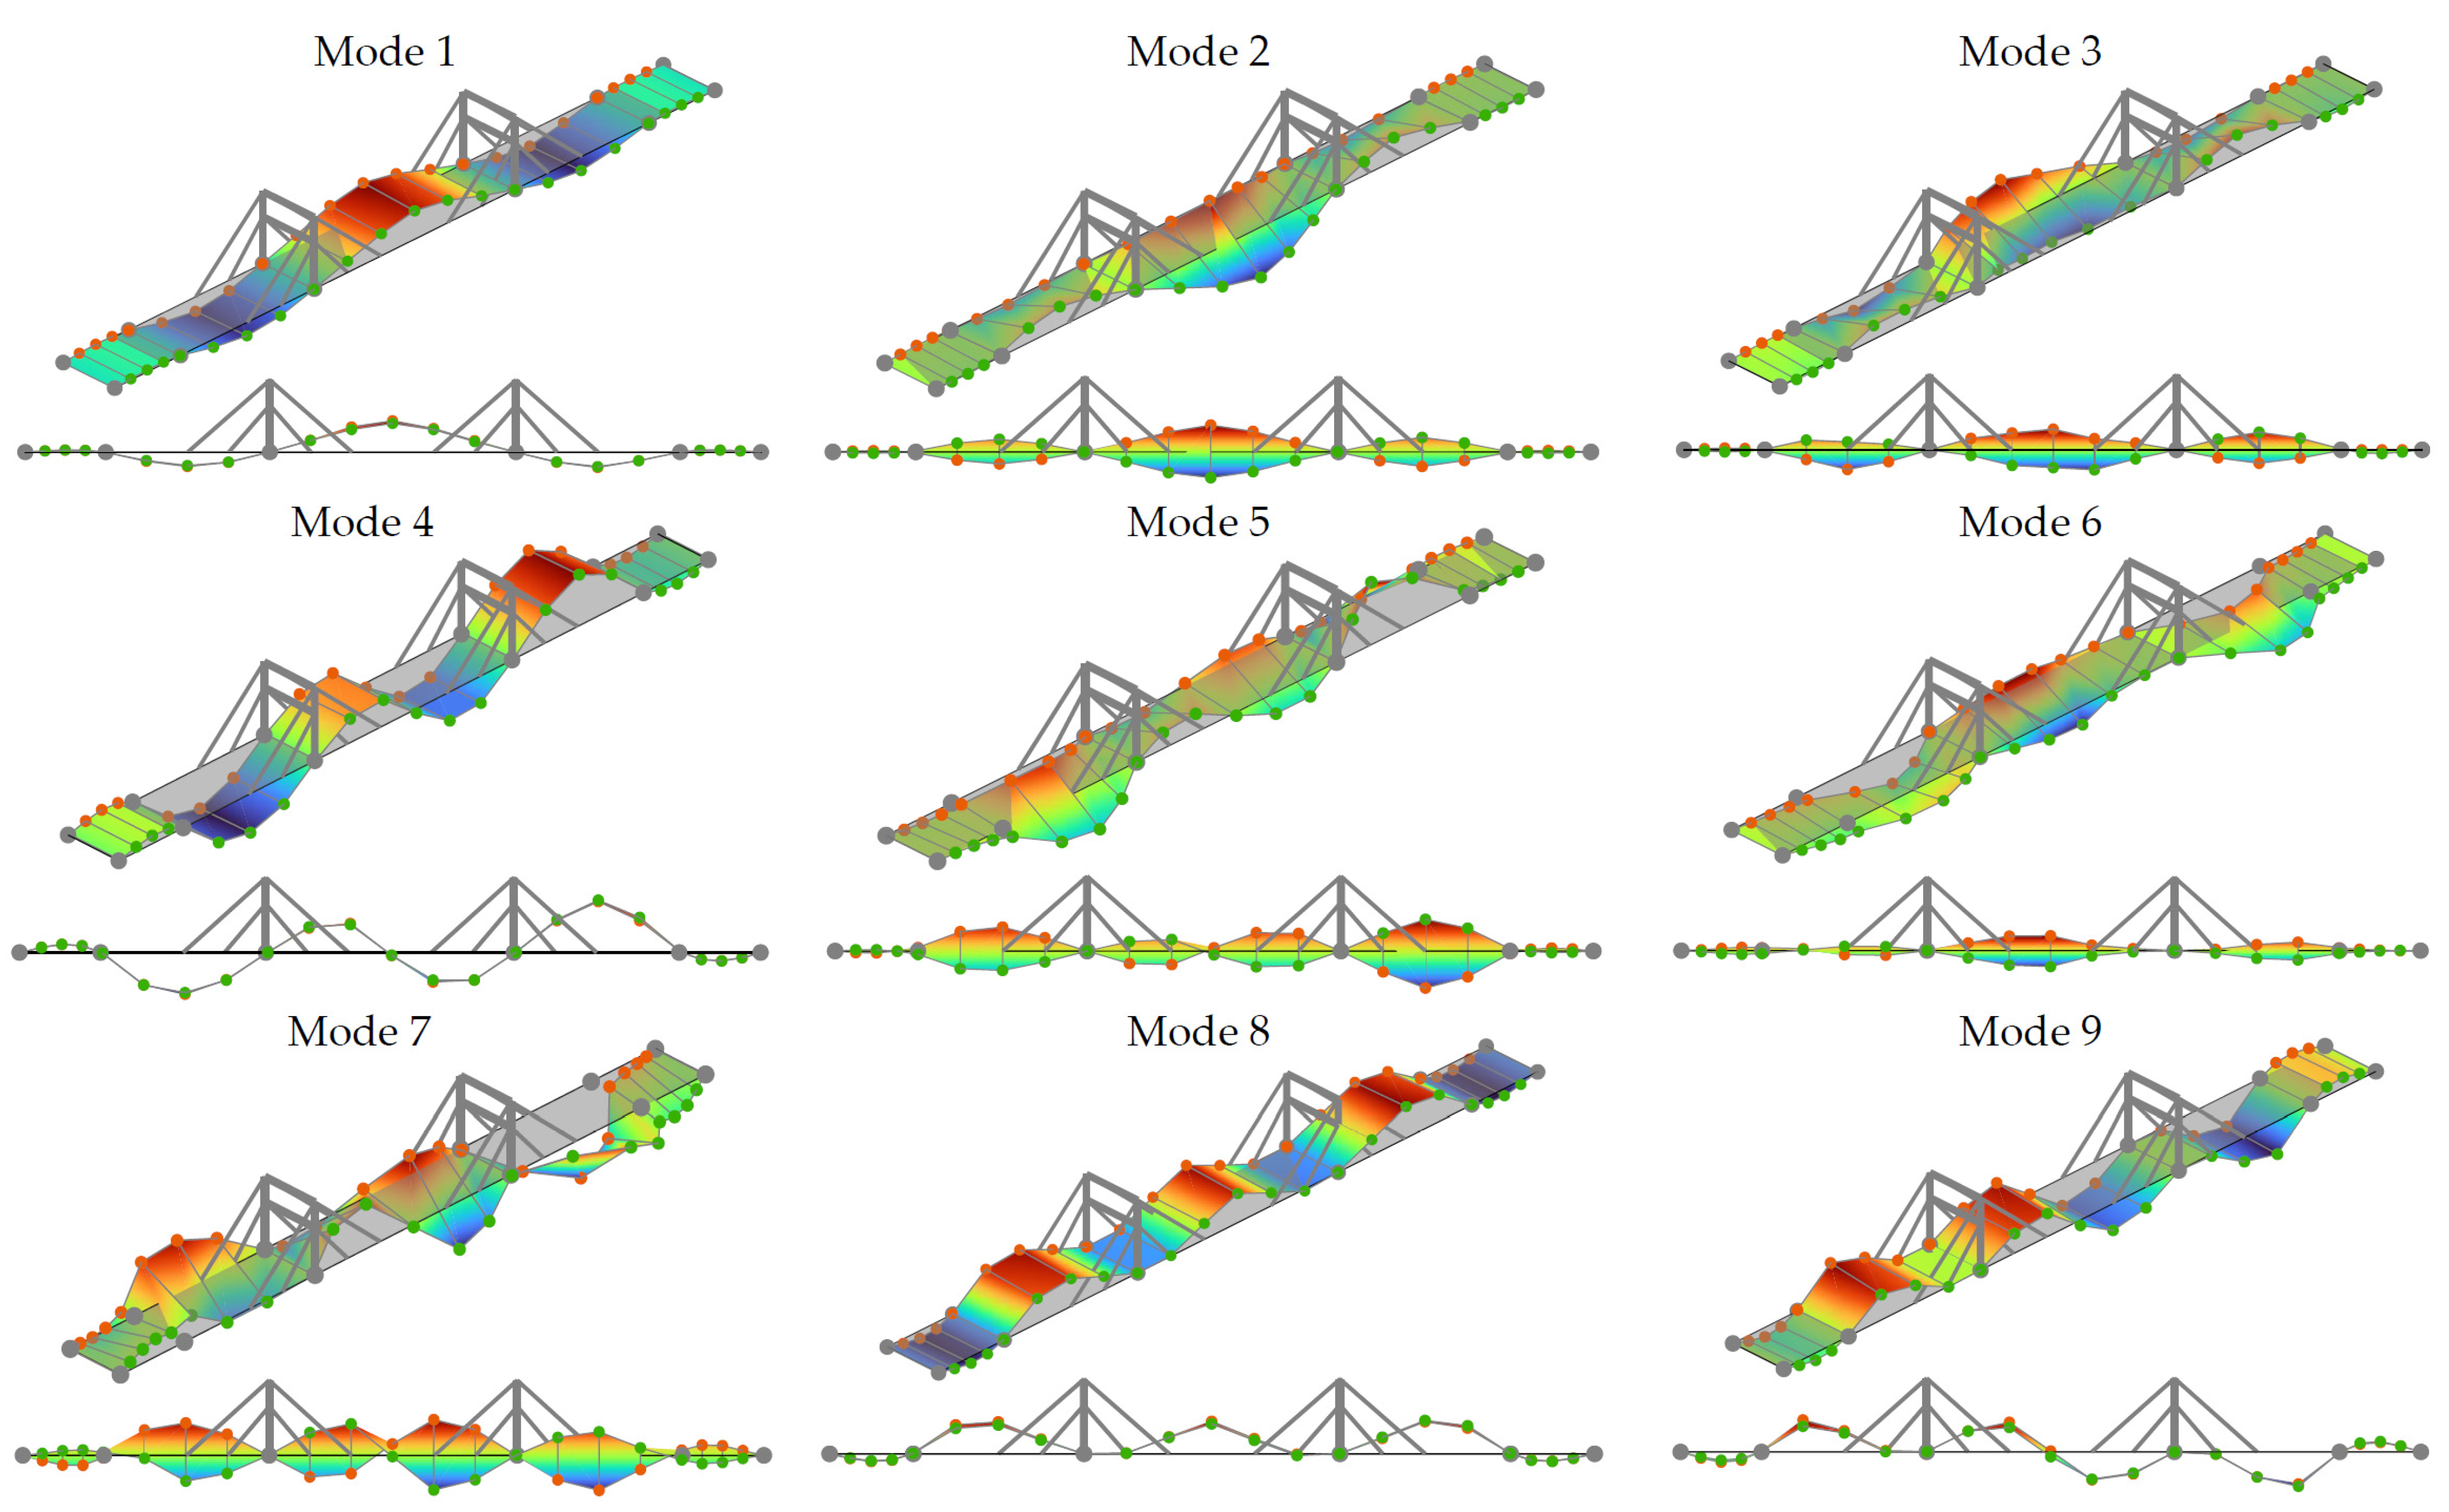
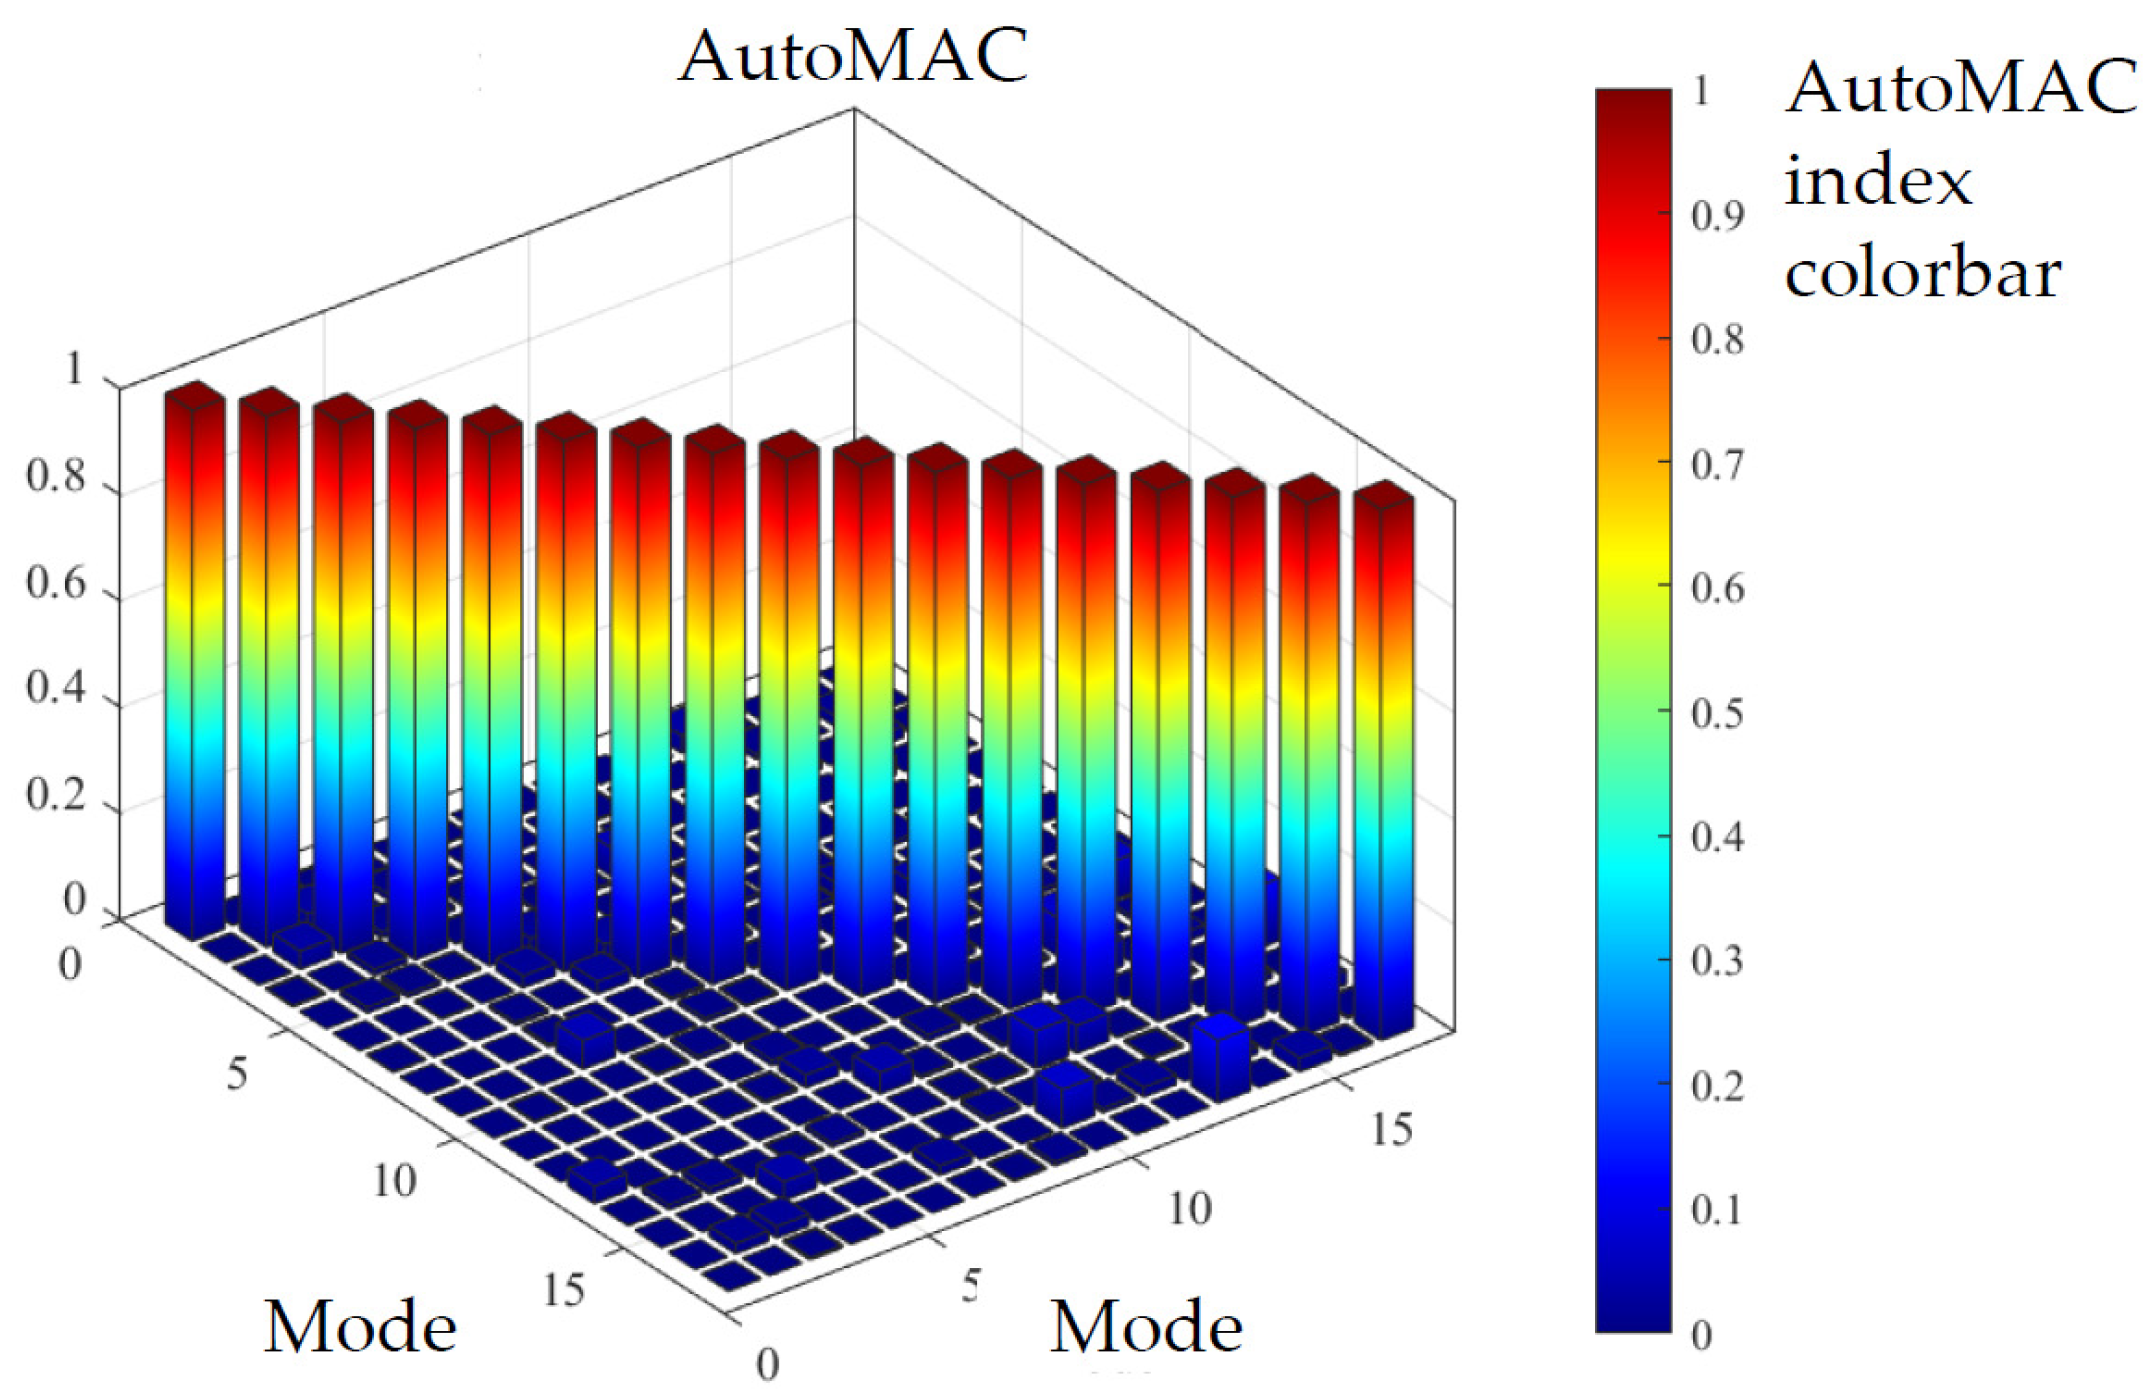
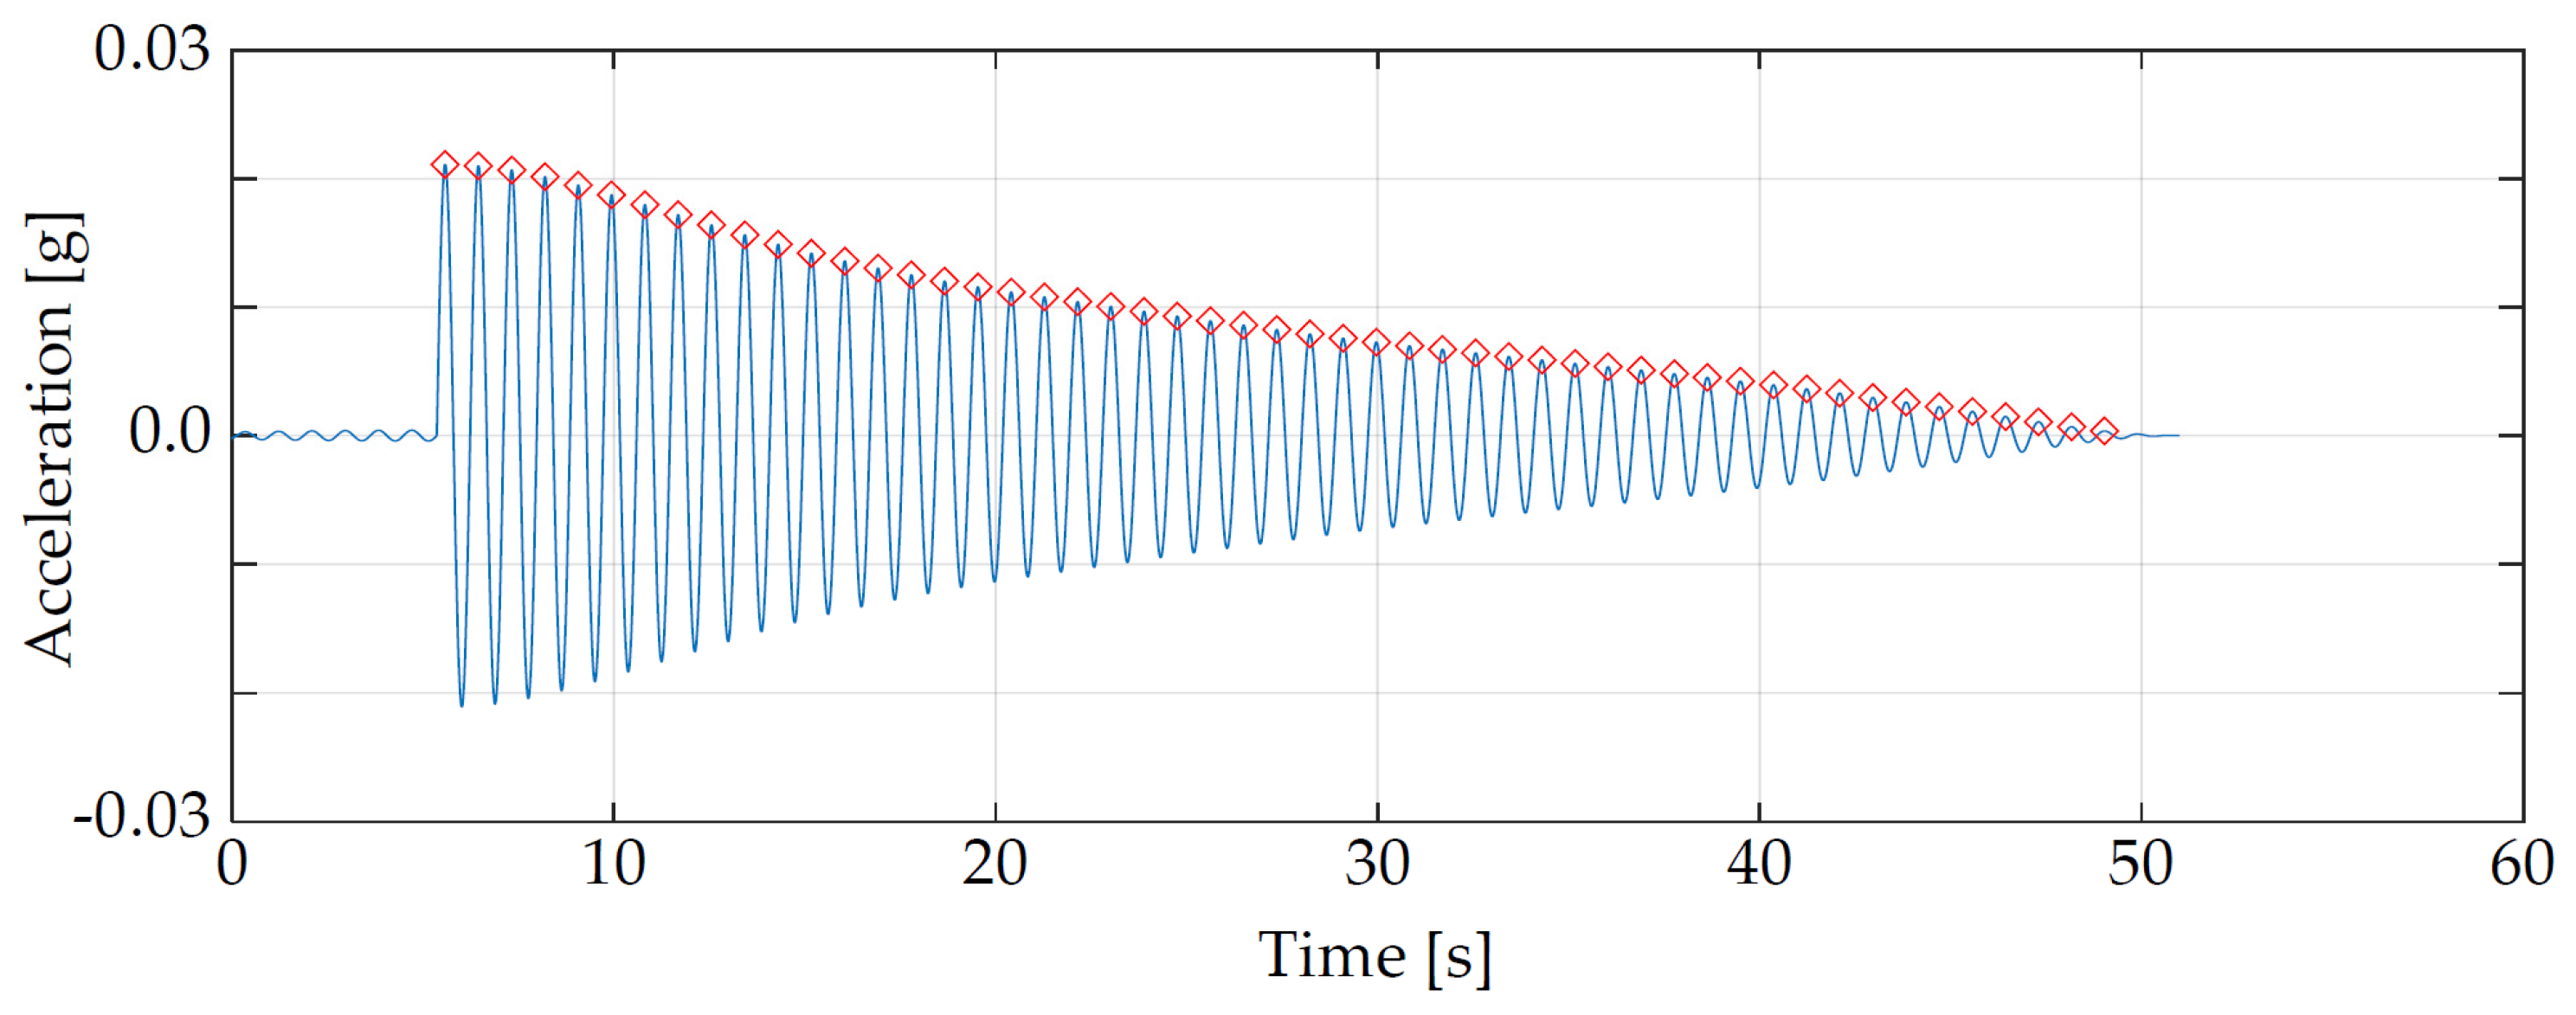
4.1. Identification of the Footbridge Modal Parameters

Modal parameters, such as natural frequencies, damping ratios, and modal shapes, are identified using the ambient noise as a source of excitation for the whole footbridge [50]. The advantage of this methodology (AVT) is that the dynamic properties of the structure can be defined quickly and non-intrusively. Following the Hivoss and Sètra prescriptions, the footbridge was closed to pedestrian traffic during the AVTs.
The footbridge was divided into 21 instrumented sections to capture the global dynamic behavior of the structure, namely, its bending, longitudinal, transverse, and torsional vibration modes. In total, 20 measurement sections were instrumented with three accelerometers (Figure 3), two measuring in the vertical direction and one in the transverse direction, while 1 measurement section (n. 11) was instrumented with four accelerometers, two in the vertical, one in the transverse, and one in the longitudinal direction. The accelerometers were positioned close to the wooden beams to record the maximum torsional accelerations. Moreover, given the technical difficulties involved in fully instrumenting the bridge at the same time, four consecutive AVTs were performed with the same sampling rate of 1024 Hz and the same time length of 40 min. From the first (AV1) to the last test (AV4), the sensors were moved along different measurement sections to cover all the footbridge, as described in Figure 4. Only sections n. 10 and n. 11 (highlighted in orange in Figure 4) were never moved during the tests; thus, they were used as a reference for the reconstruction of the global mode shapes. To reconstruct the mode shapes from the dataset recorded during each test, the PoSER (Post-Separate Estimation Re-Scaling) procedure was employed [51].
Before identifying the modal parameters, acceleration signals were filtered with a bandpass filter (to avoid high-frequency contributions and aliasing phenomena) and resampled at a lower frequency equal of 102.4 Hz in order to reduce the amount of data.
Then, dynamic identification was performed adopting the well-known Stochastic Subspace Identification Principal Component (SSI-PC) technique [52], implemented in a Matlab routine reorganized and supplemented by the authors. For illustrative purposes, only the results obtained from AV4 are shown in Figure 5, since all the identifications led to almost the same results, as expected. The first diagram (the so-called stabilization diagram—Figure 5a) illustrates the mode identification in a visual manner: the yellow dots represent all the identified modes, while the black ones are the stable modes, selected through the use of an agglomerative hierarchical clustering algorithm, the latter applied for the differences in frequencies and mode shapes between modes. In this diagram, the first singular value (SV) is also shown to highlight the frequency content of the footbridge. The green horizontal line represents the lower model order through which the dynamic model enables the identification of all 17 vibration modes. In Figure 5b, the frequency-damping diagram that supports the individuation of the stable modes is also shown. As can be seen from the aforementioned diagrams, a high number of vibration modes (17 modes) were identified in a very short frequency range of 1–5.5 Hz, indicating the high flexibility of the footbridge, as well as the high accuracy of the dynamic measurements and the identification procedures.
For the sake of brevity and for reasons linked to the pedestrian-induced load tests (as will be addressed further below), only the modal parameters of the first nine vibration modes are reported. Table 2 collects the identified resonance frequencies and damping ratios, together with a mode explanation; the frequencies and damping ratios are calculated as the average between the values obtained from the four identifications performed. Figure 6 shows the relevant mode shapes. Here, the footbridge geometry is distorted to render the modal deformations simpler and understandable. Figure 7 depicts the AutoMAC matrix; the very low values off the diagonal demonstrate that the identified modes are almost completely decoupled, confirming the accuracy of the adopted measurement configurations, as well as the quality of the measurements and the adopted identification procedures.

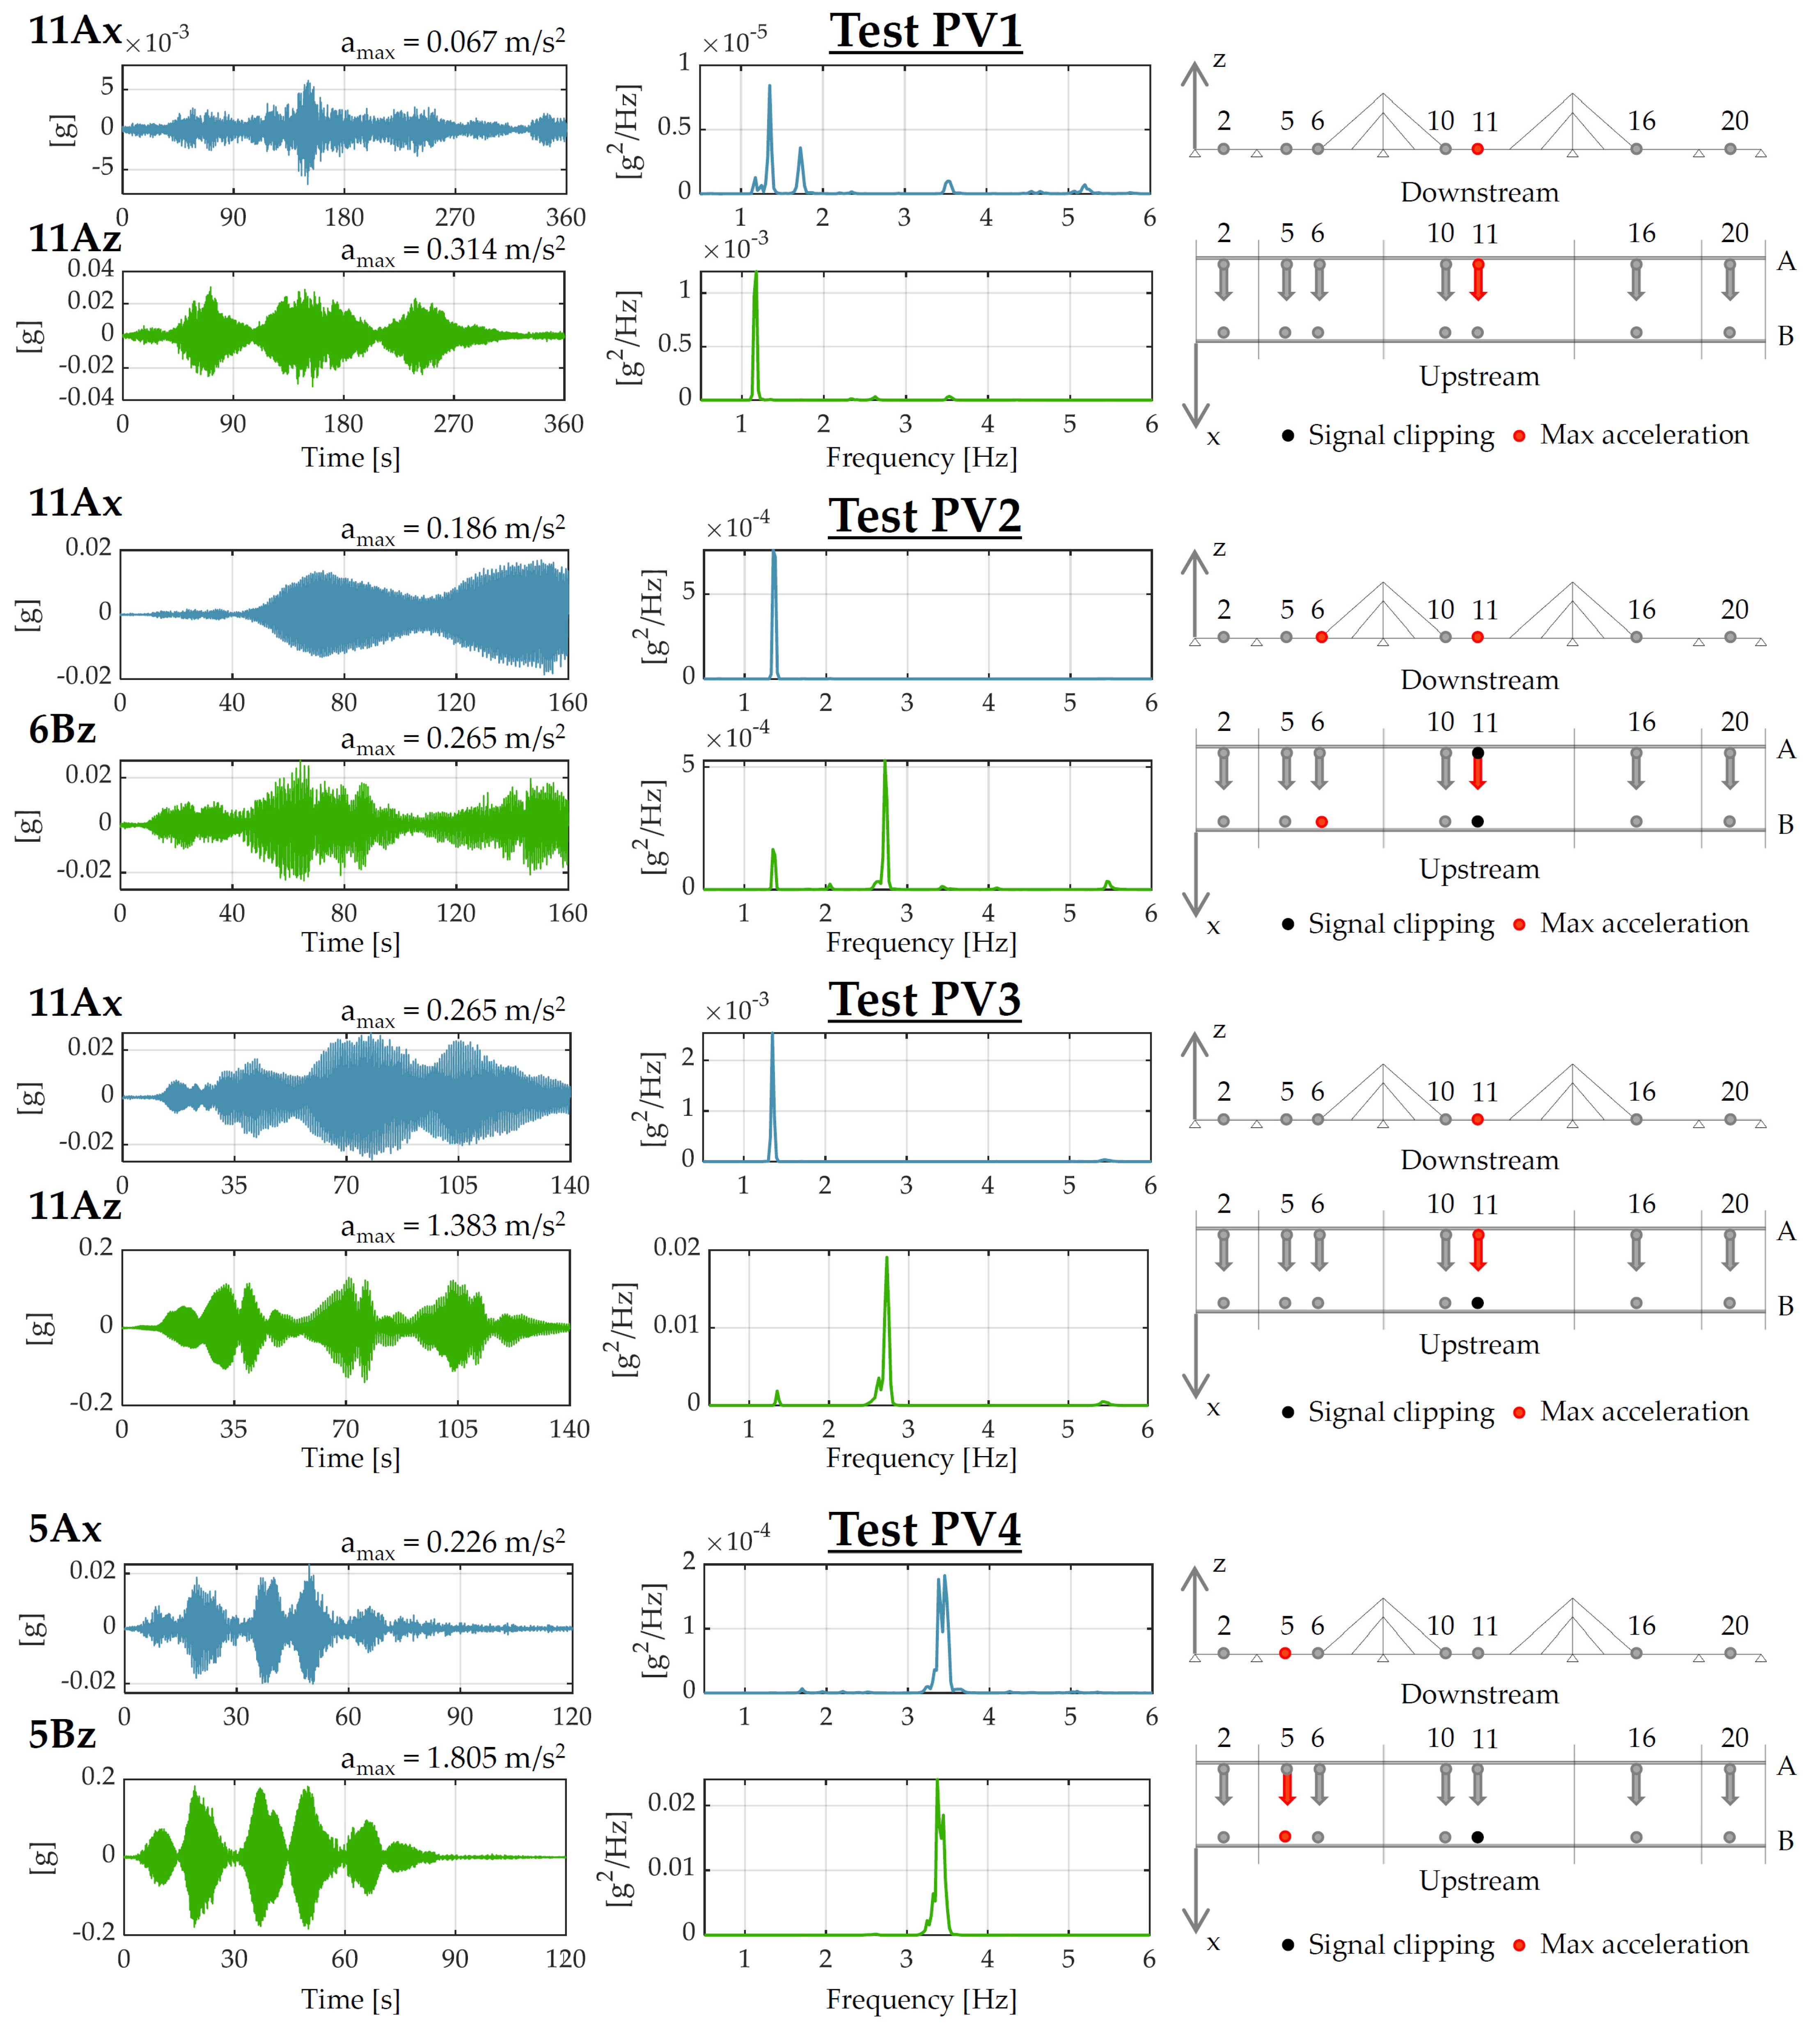
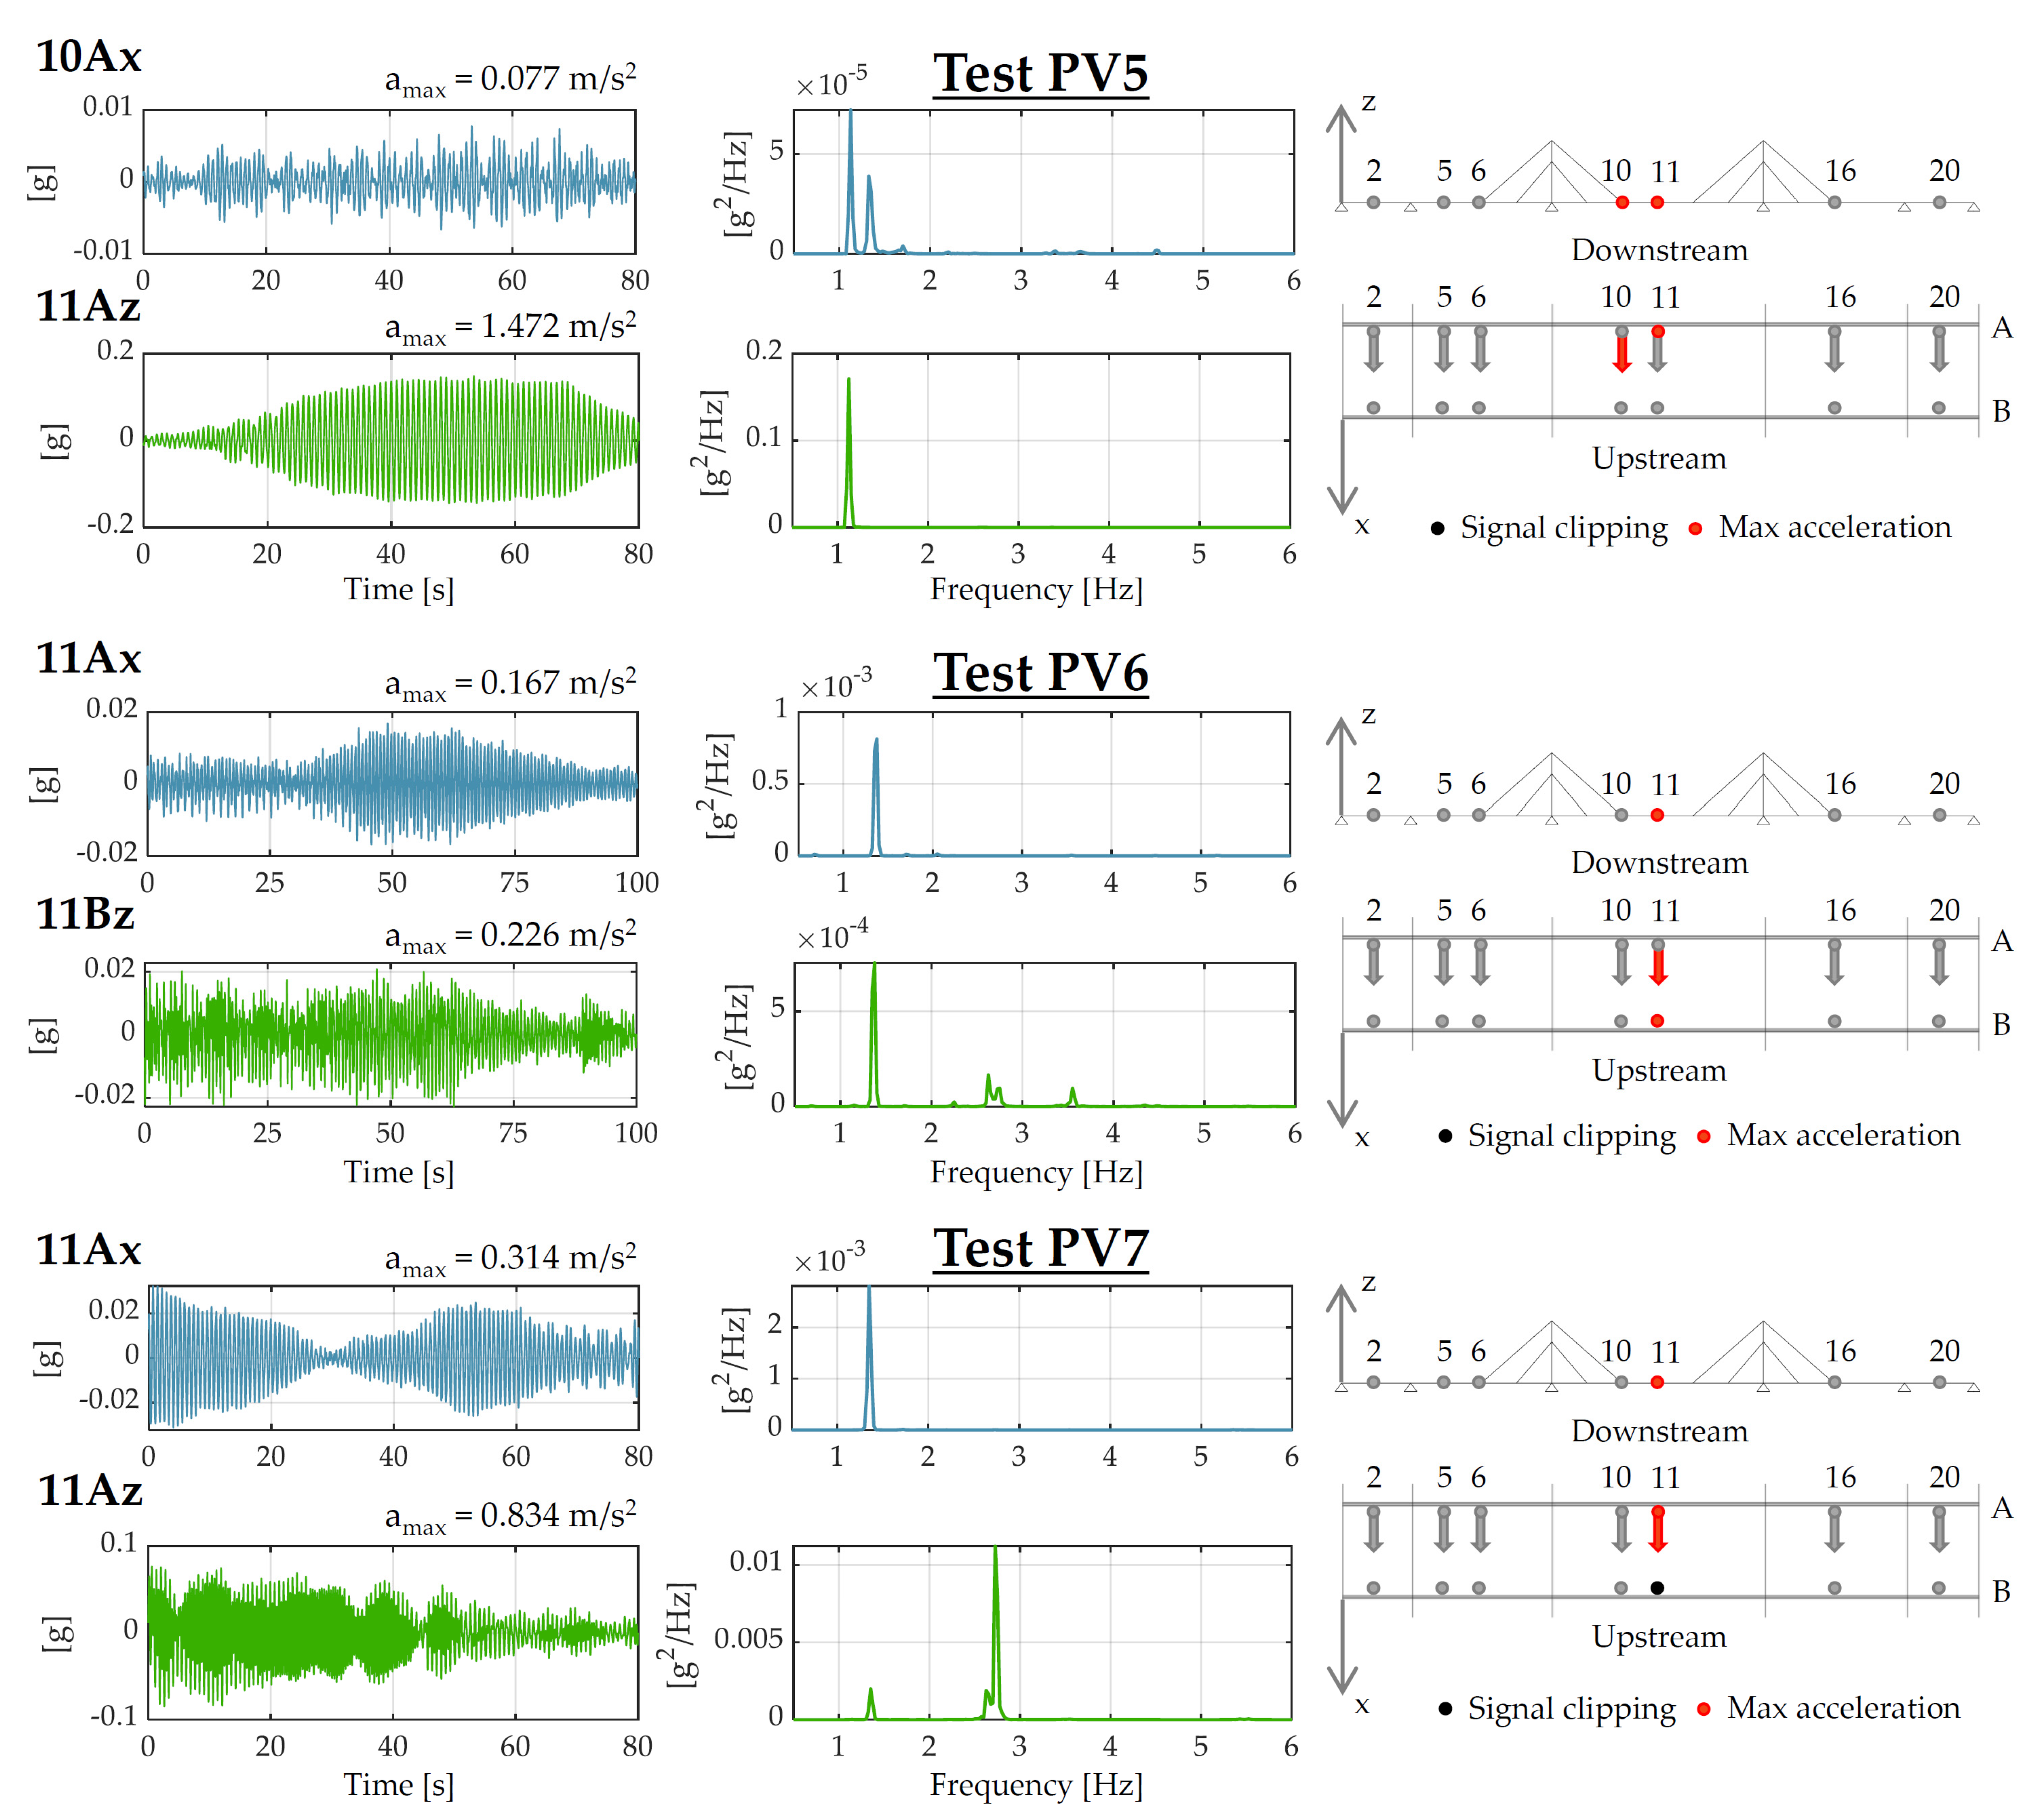
4.2. Footbridge Dynamic Response Due to Human-Induced Loads

Pedestrian-induced excitation may be considered as the primary source of vibrations in footbridges. People provide these vibrations by walking, running, jumping, and lateral body swaying. The relatively high maximum vibration amplitudes induced by these events cause discomfort when using the footbridge, i.e., free walking or standing is severely disturbed, and running is difficult.
To understand if a footbridge is affected by problems related to pedestrian-induced vibrations, the resonance frequencies of the structure must be compared with the frequency risk intervals proposed by the codes and guidelines. Many of the identified modes in this case study have frequencies within the risk ranges proposed by the Hivoss, Sètra, and EC0 guidelines (Figure 8). For this reason, dynamic tests were also conducted to assess the response of the footbridge under human-induced excitations.
The adopted instrumentation was the same as that used for the AVTs. Furthermore, according to the Hivoss prescriptions, the measurement sections were placed in positions where the maximum accelerations were expected; thus, seven measurement sections were applied, as detailed in Figure 9.
The pedestrian load tests aimed to excite the footbridge vibration modes through human excitation provided to the structure with the same frequency. For the sake of completeness, the typical frequencies that can be considered for people walking and running are listed in Table 3. Therefore, if one or more natural frequencies of the footbridge fall within these intervals, the source of excitation should be provided through either walking or running. For the footbridge case study, the first five modes are below 2 Hz, and they should be excited through walking, whereas from the seventh to the ninth, they should be excited through running, with their frequency values being higher than 2.5 Hz. For these reasons, the first and second modes were excited through walking, while the eighth and ninth were excited through running. Not all the vibration modes were tested due to limited time during the test day.
As can be seen from Figure 8, the frequency values of the tested modes fall within the frequency risk intervals proposed by the guidelines and by the EC0; thus, they need to be controlled. Moreover, further tests were performed to simulate extreme load conditions (i.e., jumping and running on the spot), as suggested by the Sètra. Finally, free-vibration tests were also conducted by means of having people jump to evaluate the damping ratio in cases of higher acceleration amplitudes with respect to those experienced during the AVTs. As stated in Section 2, the pedestrian load tests should be performed considering different groups of people; in this work, a limited number of people were present during the tests, and everyone was involved. The pedestrian load tests performed, with the main details, are listed in Table 4. In this table, the load ratio is calculated as the ratio between the total mass of people and that of the bridge, the latter being estimated using the design numerical model. The travel speed is calculated by measuring the time required to cross the whole footbridge, with knowledge of the deck length.
The main codes and guidelines serve to control the recorded maximum accelerations with the suggested limits. Therefore, the acceleration time histories measured in the vertical and horizontal directions, together with the maximum values and the PSDs of the signals, are reported in Figure 10 and Figure 11 for tests PV1–PV7. For each test, only the acceleration time histories and the relevant Power Spectral Densities (PSDs) of the sensors, with which the maximum accelerations were recorded (vertical and horizontal), are shown. All data can be found in the Supplementary Materials. Furthermore, for each test, the geometric scheme of the footbridge is also reported to show the positions where the maximum accelerations were recorded (highlighted in red). It is worth observing that some sensors (highlighted in black) were affected by signal clipping during the tests, probably because the human input was applied too close to them. For almost all the dynamic tests, the higher accelerations were measured in correspondence with the mid-length of the central (and longer) span, where the tested modes attained their maximum modal displacements. Generally, the acceleration values for the horizontal direction are lower than those for the vertical one.
Test PV8 was performed to obtain an alternative estimation of the damping. The free-vibration recording after the jump test is shown in Figure 12 for sensor 11Az. The signal is obtained by band-pass filtering around the first frequency of the footbridge. The damping is calculated as the logarithmic decrement in the acceleration time history, adopting the following equation [53]:
ξ = 1 2 π · i l n u ¨ 1 u ¨ i + 1
where u ¨ i is the i-th value of the acceleration peak. Many jumps were performed to obtain a reliable dataset, and the mean value of the damping ratio associated with the first mode of the footbridge is equal to 1.25%. As expected, this value is higher than that identified with the AVTs and OMAs (0.81%, as reported in Table 2), and it is consistent with the values proposed by the Hivoss and Sètra for timber structures (approximatively between 1 and 3%).

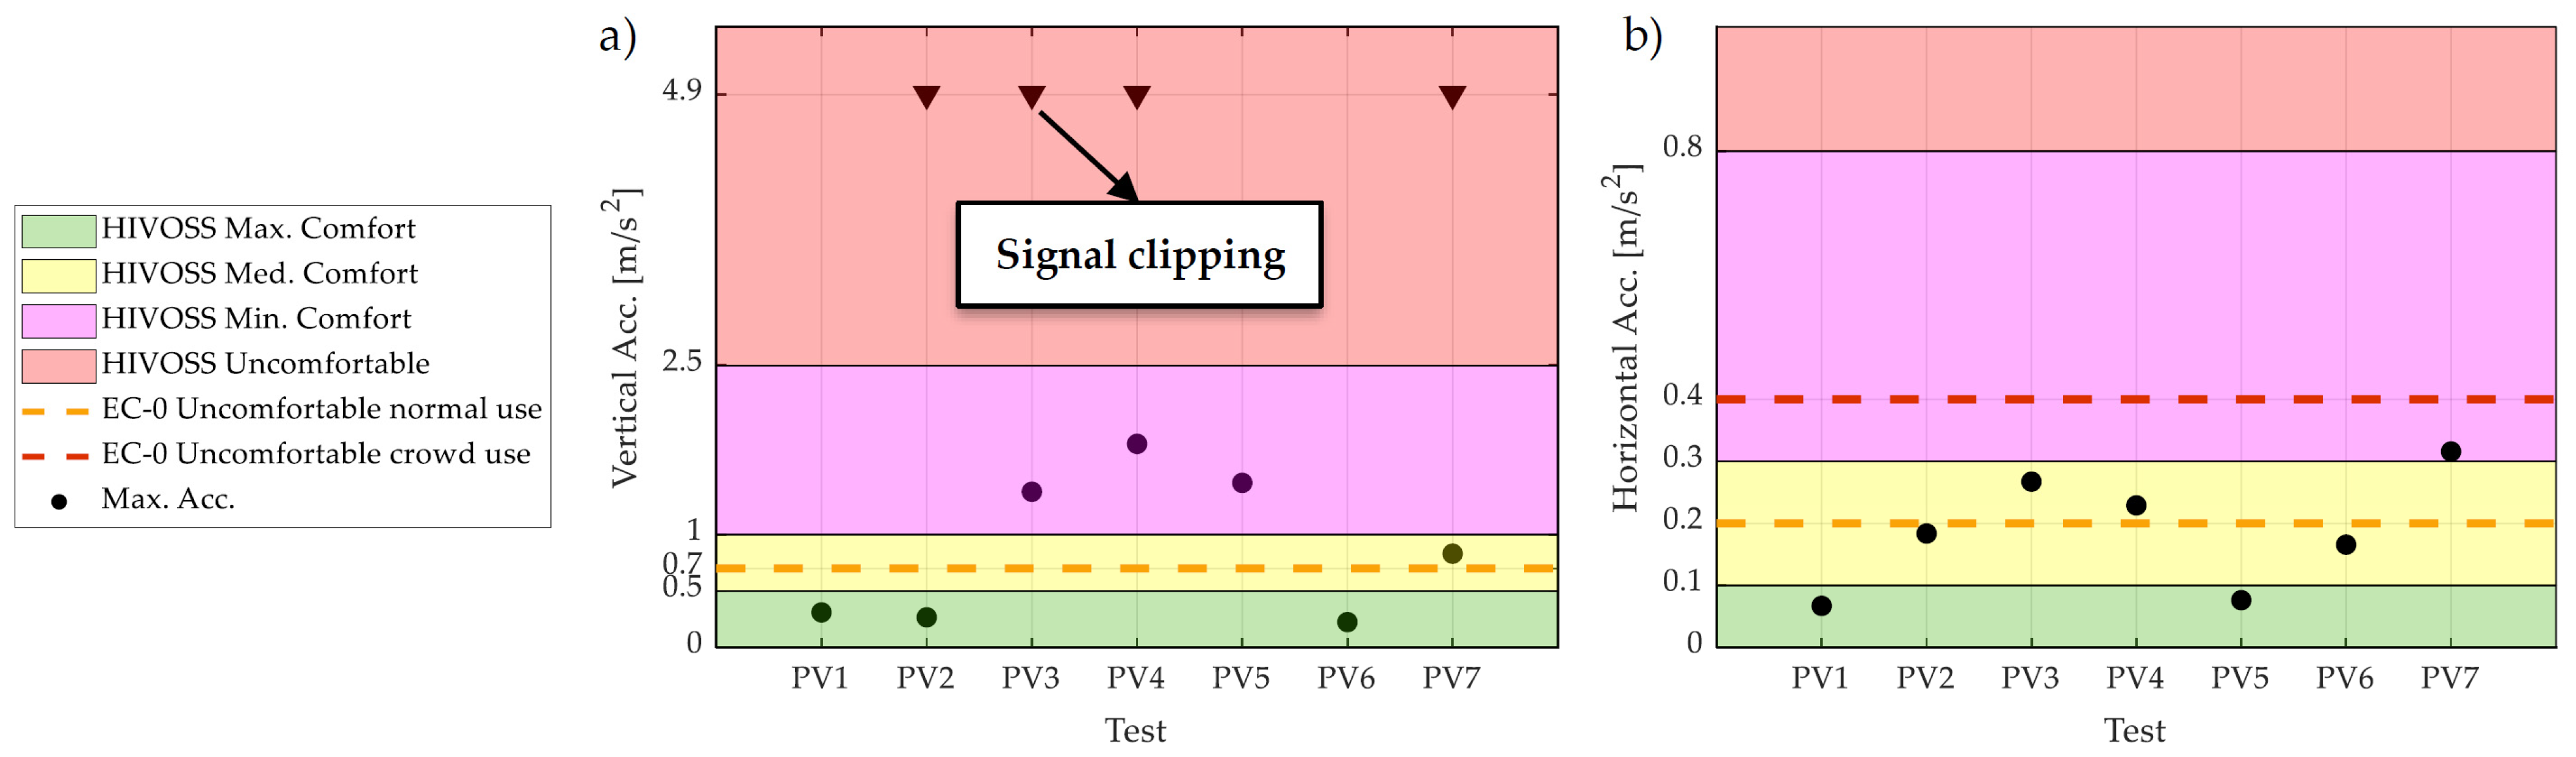
4.3. Experimental Assessment of the Footbridge Serviceability

It is widely recognized among almost all the codes and guidelines implemented worldwide that comfort during a footbridge’s usage is assessed based on the maximum accelerations recorded for the structure during pedestrian use. Clearly, determining an absolute value of tolerable acceleration is not a simple task, as it can be perceived very differently from one person to another. For this reason, the Hivoss and Sètra propose four different comfort levels for footbridge use, starting from maximum comfort (very low accelerations over the deck) and progressing to unacceptable discomfort (high accelerations). Contrarily, the EC0 only provides acceleration thresholds above which the footbridge’s use can be considered uncomfortable. Moreover, in the case of horizontal vibrations, the EC0 provides two thresholds, the lower being relevant to a normal use, while the higher applies in cases of crowded footbridges during exceptional events.
In this study, the maximum accelerations recorded during pedestrian vibration tests (PV1–PV7) were compared with the acceleration thresholds provided by the Hivoss, Sètra, and EC0 (Figure 13). The thresholds proposed by the Sètra and Hivoss are identical, except for the maximum comfort threshold for horizontal vibrations, for which the Hivoss suggests a more stringent acceleration value; thus, for a conservative assessment, only the latter is considered in the graphs in Figure 13. In cases of signal clipping, the next lower maximum acceleration is reported, since it is reasonable to associate the signal clipping with a human input applied too close to the sensor, rather than with resonance phenomena. This is also proved by the fact that the acceleration immediately below the clipped one was almost always measured in the same measurement section. Neglecting the signal clipping, the maximum recorded accelerations in the vertical direction (Figure 13a) are within the comfort limits for the Hivoss and Sètra, even if they are within the minimum comfort class in three cases, while they are often above the EC0 comfort threshold (four cases out of seven).
Regarding the horizontal direction (Figure 13b), only during three tests the accelerations exceeded the EC0 limit for normal use, while they never exceeded that relevant to crowd use during exceptional situations. Instead, the limits provided by the Hivoss and Sètra were always upheld, with only one case falling within the minimum comfort class.

5. Numerical Investigation of the Footbridge

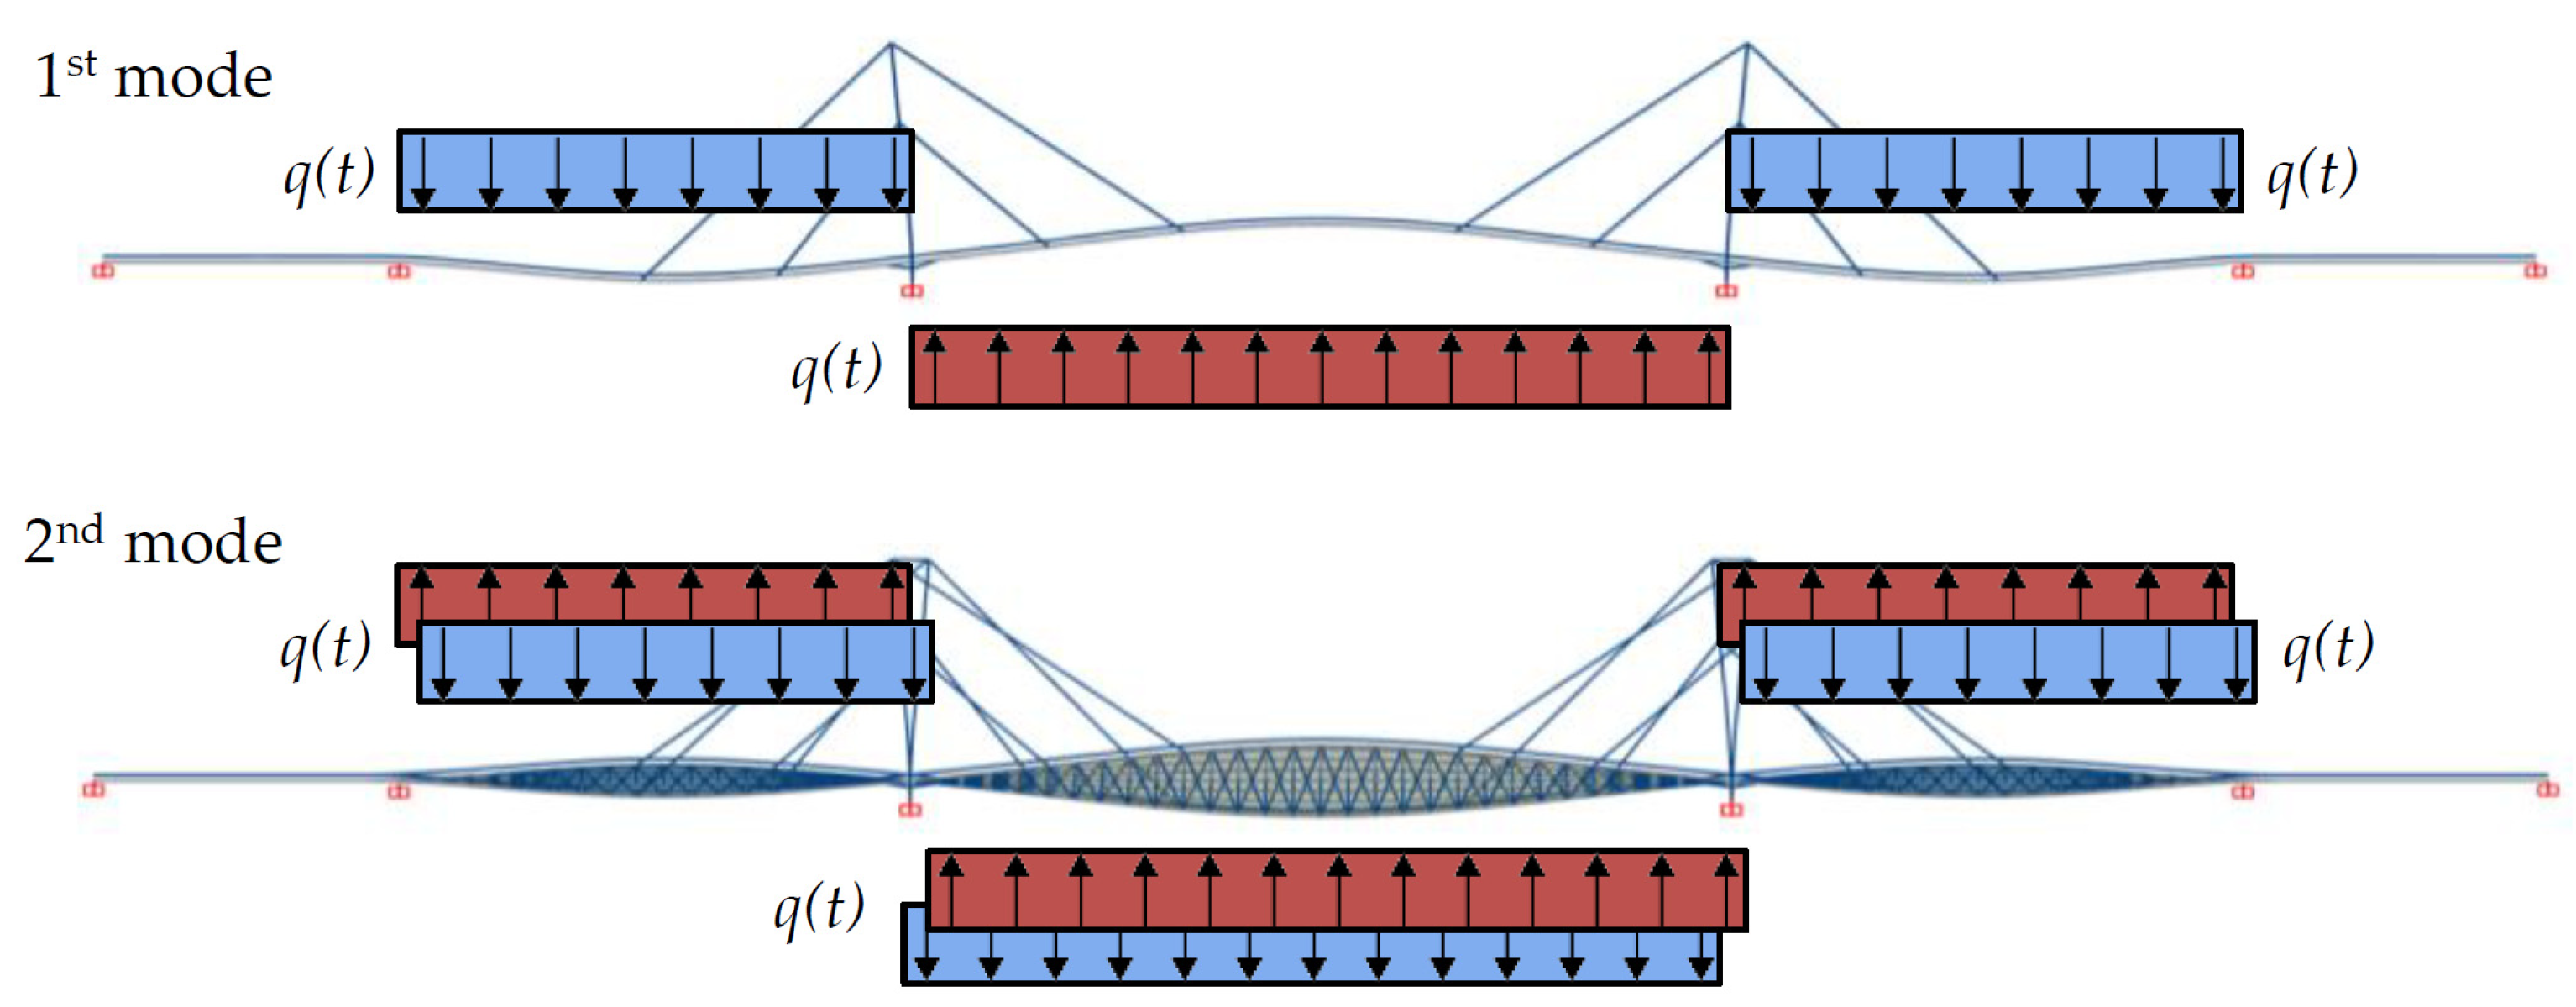
5.1. Description of the Footbridge Finite Element Model

The footbridge FEM was developed using the SAP2000 commercial software. The 3D model was performed using frame elements for the two steel portals, stays, the two main wooden girders, wooden purlins, steel transverse beams, and the steel bracings, while the wooden planking over the deck was modeled using shell elements. Fully fixed supports were modelled in correspondence with the abutments and piers, whereas simple supports were modelled in correspondence with the two steel portals. All the materials were assumed to be homogeneous and isotropic, even if the wood could be considered as an orthotropic material; however, for the analyses to be conducted in the next stage, this assumption may be considered realistic. The elastic modulus and density of the steel were assumed to be the same for all steel members and equal to E = 210,000 MPa and γ = 77 kN/m3. Similarly, all the wooden elements were modelled with the same wood properties, namely, E = 8,000 MPa and γ = 4 kN/m3. A view of the 3D model is shown in Figure 14.

5.2. Finite Element Model Updating

The footbridge 3D FEM is suitably calibrated to numerically reproduce the modal parameters experimentally obtained from the OMAs. The updating parameters are the elastic modulus of the wood and the stays’ effective area, since the cables are formed with steel strands. The mechanical properties of the steel elements are not included among the updating parameters, because they can reasonably be considered as standard and fixed due to the controlled production of the commercial steel profiles. In this work, a manual tuning model-updating technique was adopted because of the relative simplicity of the model and the low number of updating parameters. At the end of the model-updating process, two elastic moduli for the wooden elements were obtained, one suitable for the two main girders and for the purlins (E = 6500 MPa) and one used for the planking (E = 3000 MPa). The nominal diameter of the stays was reduced from 3.6 to 2.5 cm.
The comparison between the numerical and experimental modal parameters is reported in Table 5. Here, only the MAC calculated considering the mode shapes after the updating procedure is provided, since few differences were found with those obtained before the updating. As can be seen, good agreement is reached between the experimental and numerical resonance frequencies and mode shapes. As for the frequencies, differences of approximately 2–5% were found for the first five modes, while differences of approximately 10% were found for the last two. Nevertheless, three of the nine vibration modes were not numerically observed (n. f.), probably because they mainly involve parts of the structure other than the deck (for instance, it was found that the third experimental mode is very similar to a numerical mode in which the higher modal displacements are those related to the two portals).

5.3. Numerical Assessment of the Footbridge Serviceability

The calibrated numerical model is adopted to numerically assess the serviceability of the footbridge. The numerical comfort evaluation is performed following the Sètra prescriptions for the design of new footbridges. These guidelines (as well as the others) associate the pedestrian loads with the sum of Fourier harmonic components. The pedestrian load, which is mainly of random nature, is approximated with a deterministic, uniformly distributed harmonic load representing an equivalent pedestrian stream. The harmonic load can be calculated following the formulae provided by the Sètra:
q t = a N · cos 2 π f i t · n e q · Ψ   [ N / m 2 ]
where a is a coefficient depending on both the footbridge class and the frequency risk intervals, neq is the equivalent number of pedestrians moving at the same frequency and in the same phase on the loaded surface (calculated based on the pedestrian density d, the overall deck area S, and the footbridge damping ξ ), Ψ is a reduction coefficient that takes into account the probability that the footfall frequency will approach the critical range of natural frequencies under consideration, and fi is the pacing frequency equal to the footbridge’s natural frequency under consideration (i.e., the natural frequencies that need to be tested and assessed).
The Sètra prescribes the assessment of the vibration serviceability only in some cases, depending on the frequency risk intervals and on the footbridge class, as specified in Table 5 and reported in [36]. Footbridge classes vary from class IV (for rarely used footbridges) to class I (footbridges connecting densely populated areas). For the footbridge at hand, class III is the most suitable (a footbridge of standard use). Nevertheless, the Sètra prescribes that for class III, design under human-induced vibrations is not required; for this reason, we decided to move on to class II (a footbridge in a populated area). The frequency risk intervals are reported in Figure 8: the first mode frequency falls within the medium-risk class, while the eighth and ninth mode frequencies are within the low-risk class. The second mode is a torsional–transverse coupled mode; hence, it must be considered twice for both vertical and horizontal vibrations. For the former case, this mode falls within the medium-risk class, while for the latter, it falls within the low one. Considering that the structure is located in a suburb area and that the footbridge class was conservatively increased, the numerical serviceability assessment was performed only taking into account the modes falling into the medium-risk class (i.e., the first and second, with the latter only for vertical vibrations). Based on these considerations, two numerical analyses were performed considering the following parameters: d = 0.8 person/m2 and neq = 33.6 persons. The direction of the harmonic load for the two simulations was the same as that of the half-waves characterizing the mode shapes associated with the natural frequencies considered in the dynamic analysis. The harmonic loads assumed for the tested modes are shown in Figure 15.
The accelerations obtained from the harmonic analyses were evaluated in the same positions where sensors were located during the in situ pedestrian tests (thus, the same names are used). The higher accelerations experienced by the FEM, together with the relevant positions, are listed in Table 6 for the two numerical analyses. Moreover, the numerical maximum accelerations were compared with the experimental ones recorded when the first and second modes were excited (PV1 and PV2). Although this comparison is not truly consistent (because the number of pedestrians used during the tests was lower than that considered in the numerical simulations and because the human–structure dynamic interaction was neglected in the numerical model), it is interesting to observe that the numerical accelerations (design phase) are higher than the experimental ones (testing phase), indicating that the guideline prescriptions for footbridge dynamic design appear to be conservative (at least for the case study at hand). Moreover, the maximum numerical accelerations were detected in the same positions where the maximum experimental ones were measured, providing further evidence of the calibrated model’s reliability.

6. Conclusions

This paper discussed the experimental and numerical dynamic characterization of a newly built steel and wooden cable-stayed footbridge located in Central Italy. Particular attention was given to the serviceability assessment of the structure under pedestrian use, as this topic is particularly emphasized in the major codes and guidelines concerning footbridges worldwide. This concern is particularly important for slender structures, as in the present footbridge case study.
An extensive experimental campaign was undertaken regarding the footbridge, performing several dynamic tests, including ambient vibration, pedestrian load, and free-vibration tests. The former were used to identify the modal parameters of the structure in its current situation. Adopting common identification techniques, it was possible to identify up to 17 vibration modes within a small frequency range (1–5.5 Hz). These modal parameters (specifically the identified natural frequencies) are of paramount importance to the pedestrian load test campaign. Indeed, this information is the basis for deciding which pedestrian tests to perform and which pacing frequency to apply to the structure with human walking or running. Hence, a modal identification is always the first step in the dynamic testing of footbridges. Based on these considerations, the footbridge was tested through seven pedestrian load tests, varying in terms of the number of people, their motion, and their pacing frequency. These tests produced high accelerations over the deck, which were compared with the comfort limits proposed by the codes (EC0) and guidelines (Hivoss and Sètra). As a general conclusion, the footbridge’s serviceability was verified in all cases, even if the EC0 limits were sometimes transgressed (especially for the vertical vibrations).
The footbridge was also numerically investigated. A Finite Element Model of the structure was developed through the use of a commercial software, and it was then updated to numerically reproduce the real dynamic behavior of the structure, the latter being achieved through the experimental identification tests. Then, the calibrated model was used to numerically assess the footbridge’s serviceability. The pedestrian loads were simulated with harmonic, uniformly distributed loads over the deck, as prescribed by the Sètra. Two modes were tested (the first and the second, the latter considering only the vertical vibrations), and the numerical accelerations were detected. As a general conclusion, it may be asserted that the maximum numerical accelerations were lower than the experimental ones, proving that the guidelines suggest a conservative strategy for bridge dynamic design. Furthermore, the maximum numerical accelerations were recorded in the same positions as the maximum experimental ones, demonstrating the reliability and the usefulness of the calibrated model.
The present paper provided highly detailed experimental results about a steel–wooden cable-stayed footbridge with the aims of enlarging the actual state-of-the-art knowledge about the dynamics of this structural typology and providing insight into the design of new footbridges and the testing of existing ones. Furthermore, the use of a calibrated model for footbridge serviceability assessment was revealed to be of great importance, since the obtained results can be considered more realistic and trustworthy. In addition, they were used to prove the effectiveness of using the guideline procedures for the design of footbridges under human-induced vibrations by comparing the available experimental outcomes.

Supplementary Materials

The following supporting information can be downloaded at: https://www.mdpi.com/article/10.3390/infrastructures8060100/s1, PV1 test results, PV2 test results, PV3 test results, PV4 test results, PV5 test results, PV6 test results, PV7 test results.

Author Contributions

Conceptualization, V.N. and F.G.; methodology, V.N. and F.G.; software, S.Q.; formal analysis, S.Q. and V.N.; investigation, V.N., S.Q., R.M., L.T., and F.G.; data curation, V.N., S.Q., R.M., and L.T.; writing—original draft preparation, V.N. and L.T.; writing—review and editing, F.G.; visualization, V.N., S.Q., and L.T.; supervision, F.G. All authors have read and agreed to the published version of the manuscript.

Funding

This research received no external funding.

Data Availability Statement

Data available on request.

Acknowledgments

This work was developed within the research project PROTECT: maPping the seismic Risk Of straTEgiC consTructions (2019–2022). The project received funding from the Fondazione Cariverona and Fondazione Cassa di Risparmio di Padova e Rovigo under grant agreement ID 10758 and Cod. SIME 2018.0853.2019.

Conflicts of Interest

The authors declare no conflict of interest.

References

  1. Van Nimmen, K.; Van den Broeck, P.; Verbeke, P.; Schauvliege, C.; Malliè, M.; Ney, L.; De Roeck, G. Numerical and experimental analysis of the vibration serviceability of the Bears’ Cage footbridge. Struct. Infrastruct. Eng. 2017, 13, 390–400. [Google Scholar] [CrossRef]
  2. Drygala, I.J.; Polak, M.A.; Dulinska, J.M. Vibration serviceability assessment of GFRP pedestrian bridges. Eng. Struct. 2019, 184, 176–185. [Google Scholar] [CrossRef]
  3. Avossa, A.M.; Demartino, C.; Ricciardelli, F. Design procedures for footbridges subjected to walking loads: Comparison and remarks. Balt. J. Road Bridge Eng. 2017, 12, 94–105. [Google Scholar] [CrossRef]
  4. Ingólfsson, E.T.; Georgakis, C.T.; Jönsson, J. Pedestrian-induced lateral vibrations of footbridges: A literature review. Eng. Struct. 2012, 45, 21–52. [Google Scholar] [CrossRef]
  5. Nicoletti, V.; Martini, R.; Carbonari, S.; Gara, F. Operational Modal Analysis as a Support for the Development of Digital Twin Models of Bridges. Infrastructures 2023, 8, 24. [Google Scholar] [CrossRef]
  6. Fujino, Y.; Siringoringo, D.M. A conceptual review of pedestrian-induced lateral vibration and crowd synchronization problem on footbridges. J. Bridge Eng. 2016, 21, C4015001. [Google Scholar] [CrossRef]
  7. Maraveas, C.; Fasoulakis, Z.C.; Tsavdaridis, K.D. A review of human induced vibrations on footbridges. Am. J. Eng. Appl. Sci. 2015, 8, 422–433. [Google Scholar] [CrossRef]
  8. Ferreira, F.; Simoes, L. Optimum design of a cable-stayed steel footbridge with three dimensional modelling and control devices. Eng. Struct. 2019, 180, 510–523. [Google Scholar] [CrossRef]
  9. Tadeu, A.; Romero, A.; Dias, S.; Pedro, F.; Brett, M.; Serra, M.; Galvín, P.; Bandeira, F. Vibration serviceability assessment of the world’s longest suspended footbridge in 2020. Structures 2022, 44, 457–475. [Google Scholar] [CrossRef]
  10. Kexin, Z.; Dachao, L.; Xinyuan, S.; Wenyu, H.; Li, Y.; Xingwei, X. Construction monitoring and load testing of a pedestrian suspension bridge in China. Proc. Inst. Civ. Eng. Civ. Eng. 2021, 175, 33–41. [Google Scholar] [CrossRef]
  11. Salgado, R.; Branco, J.M.; Cruz, P.S.J.; Ayala, G. Serviceability assessment of the Góis footbridge using vibration monitoring. Case Stud. Nondestruct. Test. Eval. 2014, 2, 71–76. [Google Scholar] [CrossRef]
  12. Yahia, M.A.S.; Rajai, Z.A.R.; Ameen, A.L.; Onur, A. Vibration Serviceability Investigation of a Curved Footbridge. Pract. Period. Struct. Des. Constr. 2022, 27, 4022040. [Google Scholar] [CrossRef]
  13. Feng, P.; Wang, Z.; Jin, F.; Zhu, S. Vibration Serviceability Assessment of Pedestrian Bridges Based on Comfort Level. J. Perform. Constr. Facil. 2019, 33, 4019046. [Google Scholar] [CrossRef]
  14. Rodríguez-Suesca, A.E.; Gutiérrez-Junco, O.J.; Hernández-Montes, E. Vibration performance assessment of deteriorating footbridges: A study of Tunja’s public footbridges. Eng. Struct. 2022, 256, 113997. [Google Scholar] [CrossRef]
  15. Cuevas, R.G.; Jiménez-Alonso, J.F.; Martínez, F.; Díaz, I.M. Assessment of the Lateral Vibration Serviceability Limit State of Slender Footbridges Including the Postlock-in Behaviour. Appl. Sci. 2020, 10, 967. [Google Scholar] [CrossRef]
  16. Bayat, E.; Milone, A.; Tubino, F.; Venuti, F. Vibration Serviceability Assessment of a Historic Suspension Footbridge. Buildings 2022, 12, 732. [Google Scholar] [CrossRef]
  17. Górski, P.; Tatara, M.; Stankiewicz, B. Vibration serviceability of all-GFRP cable-stayed footbridge under various service excitations. Measurement 2021, 183, 109822. [Google Scholar] [CrossRef]
  18. Sá, M.F.; Guerreiro, L.; Gomes, A.M.; Correia, J.R.; Silvestre, N. Dynamic behaviour of a GFRP-steel hybrid pedestrian bridge in serviceability conditions. Part 1: Experimental study. Thin-Walled Struct. 2017, 117, 332–342. [Google Scholar] [CrossRef]
  19. Dacol, V.; Caetano, E.; Correira, J.R. Modal identification and damping performance of a full-scale GFRP-SFRSCC hybrid footbridge. Struct. Control Health Monit. 2022, 22, e3137. [Google Scholar] [CrossRef]
  20. Ming, G.; Yunsheng, L.; Ruili, S.; Xinxin, W. Glass Suspension Footbridge: Human-Induced Vibration, Serviceability Evaluation, and Vibration Mitigation. J. Bridge Eng. 2021, 26, 05021014. [Google Scholar] [CrossRef]
  21. Wu, X.; Yang, X.; Jin, J.; Yang, Z. Amplitude-Based Filtering for Video Magnification in Presence of Large Motion. Sensors 2018, 18, 2312. [Google Scholar] [CrossRef]
  22. Scislo, L. Single-Point and Surface Quality Assessment Algorithm in Continuous Production with the Use of 3D Laser Doppler Scanning Vibrometry System. Sensors 2023, 23, 1263. [Google Scholar] [CrossRef]
  23. Lai, E.; Gentile, C.; Mulas, M.G. Experimental and numerical serviceability assessment of a steel suspension footbridge. J. Constr. Steel Res. 2017, 132, 16–28. [Google Scholar] [CrossRef]
  24. Chróścielewski, J.; Ferenc, T.; Mikulski, T.; Miśkiewicz, M.; Pyrzowski, L. Numerical modeling and experimental validation of full-scale segment to support design of novel GFRP footbridge. Compos. Struct. 2019, 213, 299–307. [Google Scholar] [CrossRef]
  25. Bergenudd, J.; Battini, J.M.; Crocetti, R.; Pacoste, C. Dynamic testing and numerical modelling of a pedestrian timber bridge at different construction stages. Eng. Struct. 2023, 279, 115429. [Google Scholar] [CrossRef]
  26. Van Nimmen, K.; Verbeke, P.; Lombaert, G.; De Roeck, G.; Van Den Broeck, P. Numerical and experimental evaluation of the dynamic performance of a footbridge with tuned mass dampers. J. Bridge Eng. 2016, 21, C4016001. [Google Scholar] [CrossRef]
  27. Dall’Asta, A.; Ragni, L.; Zona, A.; Nardini, L.; Salvatore, W. Design and Experimental Analysis of an Externally Prestressed Steel and Concrete Footbridge Equipped with Vibration Mitigation Devices. J. Bridge Eng. 2016, 21, C5015001. [Google Scholar] [CrossRef]
  28. Gallegos-Calderón, C.; Renedo, C.M.C.; Pulido, D.G.; Díaz, I.M. A frequency-domain procedure to design TMDs for lively pedestrian structures considering Human–Structure Interaction. Structures 2022, 43, 1187–1199. [Google Scholar] [CrossRef]
  29. Linyun, Z.; Shui, W. Vibration Control of Footbridges Based on Local Resonance Band Gaps. J. Struct. Eng. 2022, 148, 4022137. [Google Scholar] [CrossRef]
  30. De Angelis, M.; Petrini, F.; Pietrosanti, D. Optimal design of the ideal grounded tuned mass damper inerter for comfort performances improvement in footbridges with practical implementation considerations. Struct. Control Health Monit. 2021, 28, e2800. [Google Scholar] [CrossRef]
  31. Jesus, A.; Živanović, S.; Alani, A. A spectral pedestrian-based approach for modal identification. J. Sound Vib. 2020, 470, 115157. [Google Scholar] [CrossRef]
  32. Jesus, A.; Živanović, S. Modal testing with a pedestrian as a vibration exciter. Mech. Syst. Signal Process. 2023, 189, 110082. [Google Scholar] [CrossRef]
  33. He, W.; He, K.; Cui, H.; Wang, G. Using a rhythmic human shaker to identify modal properties of a stationary human body on a footbridge. J. Sound Vib. 2022, 540, 117309. [Google Scholar] [CrossRef]
  34. Wei, X.; Zhang, J.; Zhou, H.; Živanović, S. Sensitivity Analysis for Pedestrian-Induced Vibration in Footbridges. Buildings 2022, 12, 883. [Google Scholar] [CrossRef]
  35. International Federation for Structural Concrete (fib). Guidelines for the Design of Footbridges; fib bulletin N.32; International Federation for Structural Concrete (fib): Lausanne, Switzerland, 2005; p. 160. [Google Scholar] [CrossRef]
  36. SÈTRA/AFGC. Footbridges–Assessment of Dynamic Behaviour under the Action of Pedestrians; Guidelines; Sètra: Boxborough, MA, USA, 2006. [Google Scholar]
  37. Research Fund for Coal and Steel. In HiVoSS: Design of Footbridges; Guideline EN03; EU: Brussels, Belgium, 2008.
  38. CEN: EN 1990; Eurocode 0 (EC0)—Basis of Structural Design. European Committee for Standardization: Brussels, Belgium, 2002.
  39. CEN: EN-1995-2; Eurocode 5 (EC5)—Design of Timber Structures, Part 2: Bridges. European Committee for Standardization: Brussels, Belgium, 2003.
  40. CEN: EN-1991-2; Eurocode 1 (EC1)—Actions on Structures, Part 2: Traffic Loads on Bridges. European Committee for Standardization: Brussels, Belgium, 2003.
  41. CEN: EN-1992-2; Eurocode 2 (EC2)—Design of Concrete Structures, Part 2: Bridges. European Committee for Standardization: Brussels, Belgium, 1999.
  42. American Association of State Highway and Transportation Officials. Guide Specifications for Design of Pedestrian Bridges, Subcommittee on Bridges and Structures; American Association of State Highway and Transportation Officials: Washington, DC, USA, 1997. [Google Scholar]
  43. Deutsches Institut für Normung. DIN-Fachbericht 102, Betonbrücken; Deutsches Institut für Normung: Berlin, Germany, 2003. (In German) [Google Scholar]
  44. Schweizerischer Ingenieur- und Architekten-Verein. SIA 160, Einwirkungen auf Tragwerke; Schweizerischer Ingenieur- und Architekten-Verein: Zürich, Switzerland, 1989. (In German) [Google Scholar]
  45. BS 5400-2; Steel, Concrete and Composite Bridges: Specification for Loads, Part 2, Appendix C. British Standards Institution: London, UK, 1978; 2.
  46. Japanese Road Association. Footbridge Design Code; Japanese Road Association: Tokyo, Japan, 1979. (In Japanese) [Google Scholar]
  47. ISO 2631-1; Mechanical Vibration and Shock Evaluation of Human Exposure to Whole Body Vibration. General Requirements; ISO: Geneva, Switzerland, 1997.
  48. Ontario Government. Ontario Highway Bridge Design Code ONT 83; Ontario Government: Toronto, ON, Canada, 2000. [Google Scholar]
  49. Innocenzi, R.D.; Nicoletti, V.; Arezzo, D.; Carbonari, S.; Gara, F.; Dezi, L. A Good Practice for the Proof Testing of Cable-Stayed Bridges. Appl. Sci. 2022, 12, 3547. [Google Scholar] [CrossRef]
  50. Nicoletti, V.; Arezzo, D.; Carbonari, S.; Dezi, F.; Gara, F. Measurements of ambient vibrations for a cable-stayed bridge including the soil-foundation system. In Proceedings of the 11th International Conference on Structural Dynamic, EURODYN, Athens, Greece, 23–26 November 2020; Volume 1, pp. 1722–1730. [Google Scholar]
  51. Ewins, D.J. Modal Testing: Theory, Practice and Application, 2nd ed.; Wiley: Hoboken, NJ, USA, 2007; Volume 3, pp. 154–196. [Google Scholar]
  52. Rainieri, C.; Fabbrocino, G. Operational Modal Analysis of Civil Engineering Structures, An Introduction and a Guide for Applications; Springer: Berlin/Heidelberg, Germany, 2014. [Google Scholar] [CrossRef]
  53. Chopra, A.K. Dynamic of Structures–Theory and Applications to Earthquake Engineering, 5th ed.; Pearson Education: New York, NY, USA, 2019. [Google Scholar]
Figure 1. Flowchart for the footbridge comfort assessment during the design and testing phases.
Infrastructures 08 00100 g001
Figure 2. Footbridge case study: (a) lateral view, (b) bottom view, (c) geometric scheme (measured in meters).
Infrastructures 08 00100 g002
Figure 3. Sensors adopted for the dynamic tests: (a) accelerometers; (b) sensor layout in a typical measurement section.
Infrastructures 08 00100 g003
Figure 4. Measurement configurations for the AVTs.
Infrastructures 08 00100 g004
Figure 5. Identification results for AV4: (a) stabilization diagram with the 1st SV, (b) frequency-damping diagram.
Infrastructures 08 00100 g005
Figure 6. Identified mode shapes for the first 9 vibration modes.
Infrastructures 08 00100 g006
Figure 7. AutoMAC matrix for all the identified vibration modes (17 modes).
Infrastructures 08 00100 g007
Figure 8. Frequency risk intervals proposed by Hivoss, Sètra, and EC0: (a) vertical (bending and torsional) modes, (b) transverse modes.
Infrastructures 08 00100 g008
Figure 9. Measurement sections and sensor layout for the pedestrian load tests.
Infrastructures 08 00100 g009
Figure 10. From left to right: maximum acceleration time histories recorded during pedestrian tests PV1, PV2, PV3, and PV4; relevant PSDs of the signals; and locations of the accelerometers where the maximum accelerations were recorded—part 1/2.
Infrastructures 08 00100 g010
Figure 11. From left to right: maximum acceleration time histories recorded during pedestrian tests PV5, PV6 and PV7; relevant PSDs of the signals; and locations of the accelerometers where the maximum accelerations were recorded—part 2/2.
Infrastructures 08 00100 g011
Figure 12. Free-vibration test recording (PV8 in 11Az) for the footbridge damping estimation.
Infrastructures 08 00100 g012
Figure 13. Assessment of the footbridge’s serviceability: recorded (a) vertical and (b) horizontal accelerations compared with the Hivoss, Sètra, and EC0 limits.
Infrastructures 08 00100 g013
Figure 14. The 3D FEM of the footbridge.
Infrastructures 08 00100 g014
Figure 15. Harmonic load distributions for the serviceability numerical analyses.
Infrastructures 08 00100 g015
Table 1. Frequency risk intervals and acceleration thresholds proposed by the main international codes and guidelines.
Code/Standard/GuidelineFrequency Risk Int. (Hz)Acceleration Limits (m/s2)
Vertical Horizontal VerticalHorizontal
SETRA [36]1–50.3–2.5<2.5<0.8
HIVOSS [37]1.25–4.60.5–1.2<2.5<0.8
Eurocode 0 [38]<5<2.50.70.2 normal
0.4 crowd
Eurocode 1 [40]1–5--- M i n 0.5 f 1 0.7 M i n 0.14 f 1 0.15
Eurocode 2 [41]1.6–2.40.8–1.2------
American Guide S. [42]<3---0.5---
Din-Fachbericht 102 [43]1.6–2.4, 3.5–4.5--- 0.5 f 1 ---
SIA 160 [44]1.6–4.5<1.3 trans.
<2.5 long.
------
BS 5400 [45]<5--- 0.5 f 1 ---
Japanese Footbridge Design Code [46]1.5–2.3---1---
ISO 2631 [47]------ 1.9 f 1 ---
ONT83 [48]------ 0.25 f 1 0.78 ---
Table 2. Description of the first 9 vibration modes of the footbridge with the relevant values of the resonance frequencies and damping ratios.
ModeMode Typeƒ (Hz)ξ (%)
1Bending1.160.81
2Transverse/Torsional1.360.39
3Transverse/Torsional1.720.34
4Bending1.790.87
5Transverse/Torsional1.950.55
6Transverse/Torsional2.231.19
7Transverse/Torsional2.510.87
8Bending2.630.71
9Bending3.460.78
Table 3. Typical frequency values associated with people walking and running (Hivoss and Sètra).
GuidelineFrequency (Hz)Excitation Source
Hivossf < 2.5Walking
2 < f < 3Walking or Running
f > 3Running
Sètra1.6 < f < 2.4Walking
2 < f < 3.5Running
Table 4. Summary of the pedestrian load tests performed.
TestActivityN. PeopleLoad
Ratio (%)
Duration
(s)
Pacing Freq. (Hz)Speed
(m/s)
PV1Synchronized walking from one end to the other90.43601.16
(1st mode)
0.65
PV2Synchronized walking from one end to the other90.41601.36
(2nd mode)
1.46
PV3Synchronized running from one end to the other90.41402.63
(8th mode)
1.67
PV4Synchronized running from one end to the other70.311203.46
(9th mode)
1.94
PV5Synchronized jumping in the midspan of the footbridge50.22-1.16
(1st mode)
-
PV6Synchronized jumping in the midspan of the footbridge50.22-2.63
(8th mode)
-
PV7Synchronized running on the spot in the midspan of the footbridge50.22-2.63
(8th mode)
-
PV8One jump in the midspan of the footbridge (free-vibration test)50.22---
Table 5. Comparison between the experimental and numerical modal parameters.
ModeFrequency (Hz)MAC
Yes
Updating
Exp.Num.
No Updating
Num.
Yes Updating
Exp. vs. Num. Yes Updating
11.161.271.105.2%0.99
21.361.511.322.9%0.94
31.72n. f.n. f.-n. f.
41.792.001.761.7%0.93
51.952.322.07−6.2%0.76
62.23n. f.n. f.-n. f.
72.51n. f.n. f.-n. f.
82.633.702.91−10.6%0.91
93.464.833.460%0.88
Table 6. Maximum numerical accelerations for harmonic excitation and comparison with the experimental ones.
TestNumericalExperimental
Vertical Acc.
(m/s2)
PositionVertical Acc.
(m/s2)
Position
1 (PV1)0.5011Az0.3111Az
2 (PV2)0.316Bz0.266Bz
Disclaimer/Publisher’s Note: The statements, opinions and data contained in all publications are solely those of the individual author(s) and contributor(s) and not of MDPI and/or the editor(s). MDPI and/or the editor(s) disclaim responsibility for any injury to people or property resulting from any ideas, methods, instructions or products referred to in the content.

