
Performance Comparison of 45° and 90° Herringboned Permeable Interlocking Concrete Pavement
by
 , , , and
Ali Shubbar
1,* ,
,
Mohammed Salah Nasr
2 ,
,
Abdullah Kadhim
3,
Tameem Mohammed Hashim
4 and
Monower Sadique
1 1
School of Civil Engineering and Built Environment, Liverpool John Moores University, Liverpool L3 3AF, UK
2
Technical Institute of Babylon, Al-Furat Al-Awsat Technical University (ATU), Najaf 51015, Iraq
3
Department of Civil Engineering, College of Engineering, Al-Qasim Green University, Babylon 51031, Iraq
4
Department of Building and Construction Techniques Engineering, Al-Mustaqbal University College, Hillah 51001, Iraq
*
Author to whom correspondence should be addressed.
Infrastructures 2023, 8(5), 97; https://doi.org/10.3390/infrastructures8050097
Submission received: 29 March 2023
/
Revised: 12 May 2023
/
Accepted: 20 May 2023
/
Published: 22 May 2023
Abstract
:Pavement deterioration is mainly caused by high traffic loading and by increased levels of runoff water resulting from storms, floods, or other reasons. Consequently, this issue can be efficiently solved by employing permeable pavement, such as permeable interlocking concrete pavement (PICP) to control water runoff and endure increased traffic loads. This study investigates the performance of PICP, in both 45° and 90° herringboned surface patterns, in terms of the infiltration of volumes of water, runoff water volumes, and the ability of pavement to withstand static loading. All the related tests in this study were implemented using a lab apparatus that was fabricated as a simulator for rainfall. Various conditions were adopted during the performance tests, including the application of longitudinal slopes (0, 2.5, 5, and 7.5%), side slopes (0, 2.5, and 5%), and different rainfall intensities (25, 50, 75, and 100 L/min). The results indicated that at high rainfall intensities (75 and 100 L/min), PICP with the 45° herringboned surface pattern had the highest volume of infiltrated water and the lowest runoff water at all the adopted longitudinal and side slopes. In addition, PICP with the 45° herringboned surface pattern showed higher resistance to deflection under a static loading test than the 90° herringboned pattern under the same conditions. Therefore, PICP with a 45° herringboned surface pattern showed supremacy in terms of runoff reduction and load resistance in comparison to PICP with a 90° herringboned pattern. Even though there are differences between the two types of PICP, they are both strongly recommended as alternatives to regular pavement.
1. Introduction
The quality management of on-site quantities of stormwater is provided through permeable pavements. By infiltration, brief detention, and some stormwater evaporation, the quantity is controlled. Various procedures, such as stormwater collection, filtering, sorption, and biodegradation, are used to maintain quality [1].
Quality performance, long-term quantity, rates of surface infiltration, the kinds of permeable pavement, infiltration over low-permeability soils, clogging, and the consequences of urban heat islands have all been examined by researchers [2,3,4,5,6].
Permeable interlocking concrete pavement (PICP) is made of solid concrete paving units with joints in the pavement surface after assembly into a design pattern. Permeable aggregates fill the joints, allowing water to enter the surface freely [7]. Flow rates of up to 1000 in/h (2540 cm/h) are possible due to the porous surface [8,9].
The paving units are set on a permeable aggregate bedding layer, resting on an open-graded aggregate base and subbase [10,11]. Concrete curbs are often used in vehicle applications to keep the concrete pavers, bedding, and base layers in place. The storage of water in the base and subbase allows it to permeate into the soil subgrade [12]. Underdrains are normally perforated in the base or subbase to remove water that does not permeate within the specified design period, which commonly takes place within 48 to 72 h [13].
The Kortright Centre for Conservation in Ontario has provided evidence of the advantages of permeable interlocking concrete pavements (PICPs) on the stormwater quality of parking lots [14]. Permeable pavement effluent includes much lower quantities of common contaminants than asphalt runoff, involving suspended particles, heavy metals, petroleum-based hydrocarbons, and certain nutrients, according to site-monitoring results [14]. Despite the established environmental advantages, PICP is still a specialized product in Canada. The Canadian interlocking paver business lags far behind the American interlocking paver business due to the absence of national laws to encourage the usage of PICP. Only 1.8 percent of all pavers sold in Canada are permeable, while 4.8 percent of all pavers sold in America are permeable [15]. Because customers are worried about winter performance and long-term operating and maintenance expenses, there has been a sluggish increase in the adoption of permeable pavements [16,17]. In order to achieve the structural and hydrologic goals of the design of permeable pavements, the subgrade may be covered with geosynthetics such as geotextiles, geogrids, or geomembranes. To stop fines (small particles) from migrating into the subbase and base layers from the near soils, separation geotextiles are typically placed along the perimeter of the subbase and the base [18]. PICP can be used in urban roads because it is considered to be a sustainable solution for managing stormwater runoff and improving water quality in urban areas. Moreover, PICPs can be designed to be both durable and aesthetically pleasing, making it a practical and visually appealing option for use in urban roads [18].
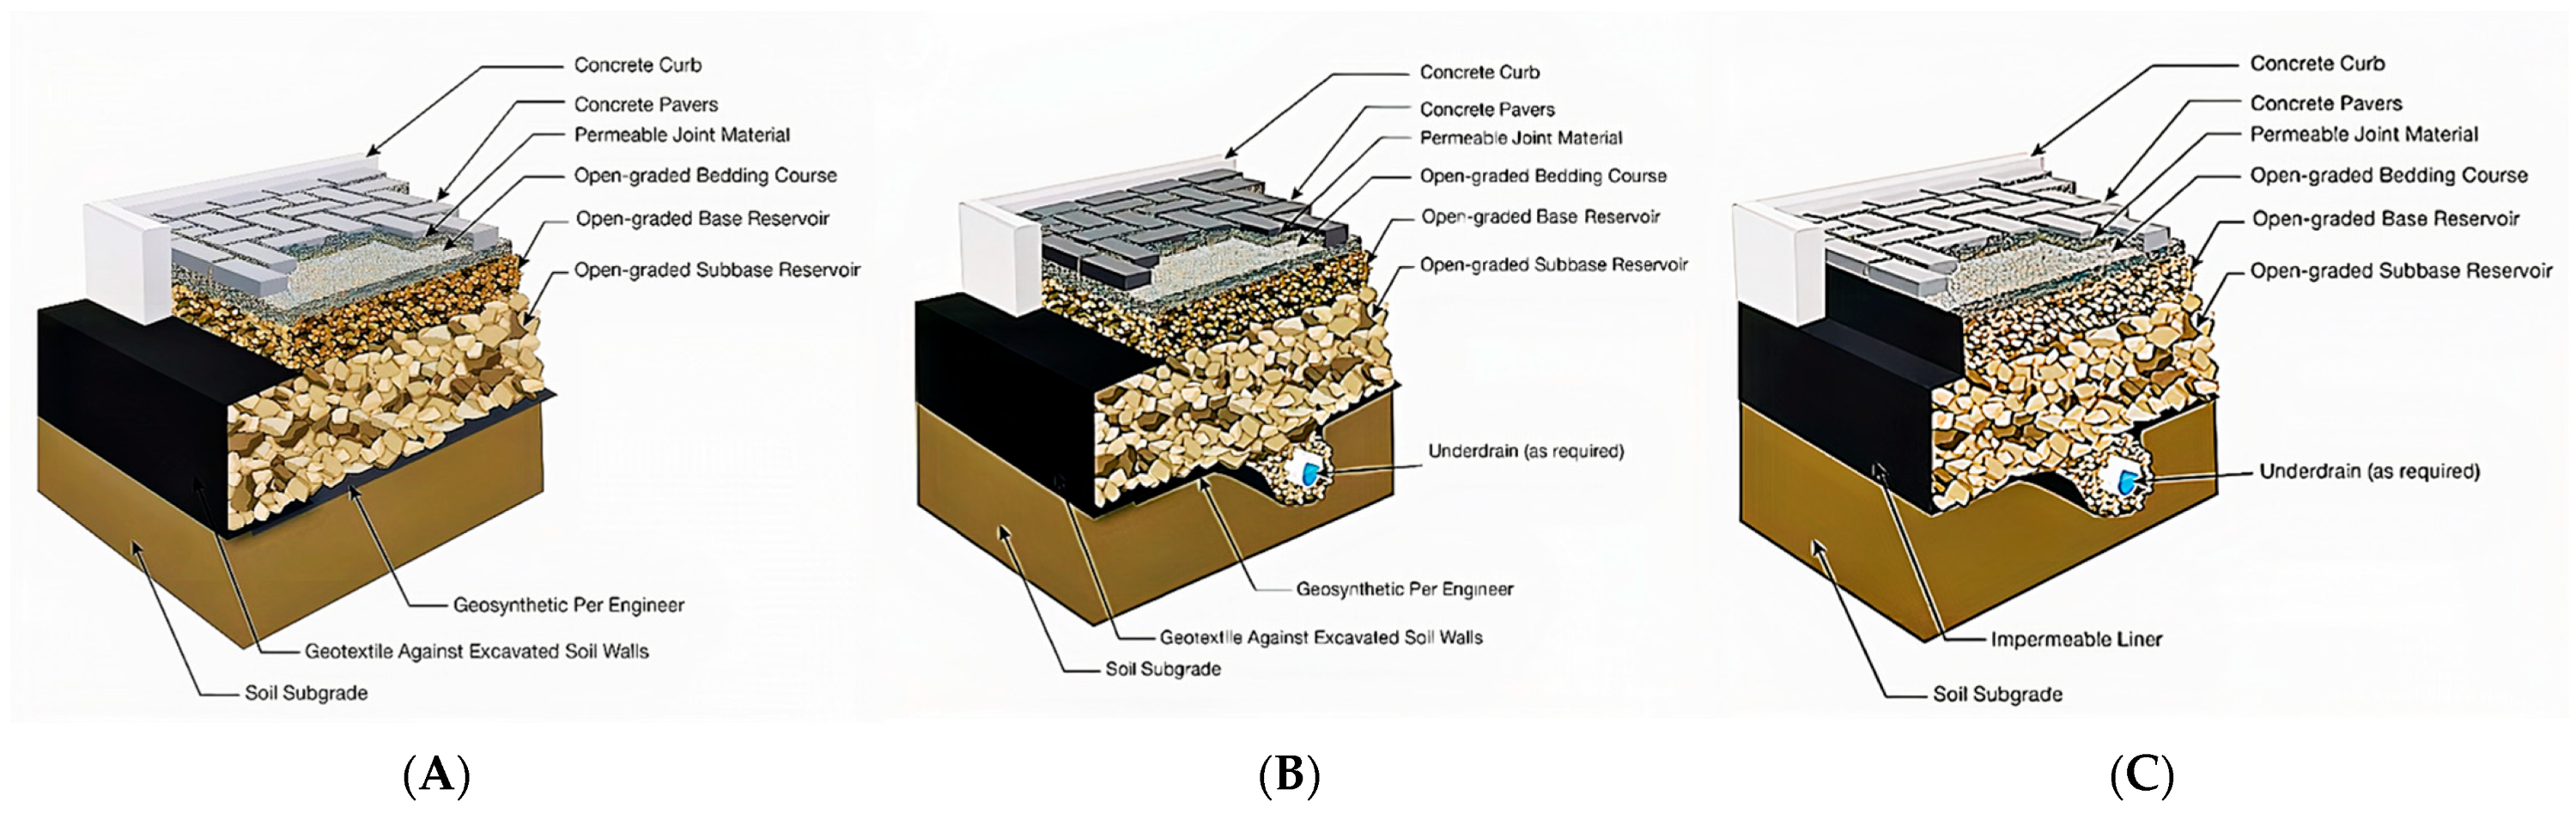
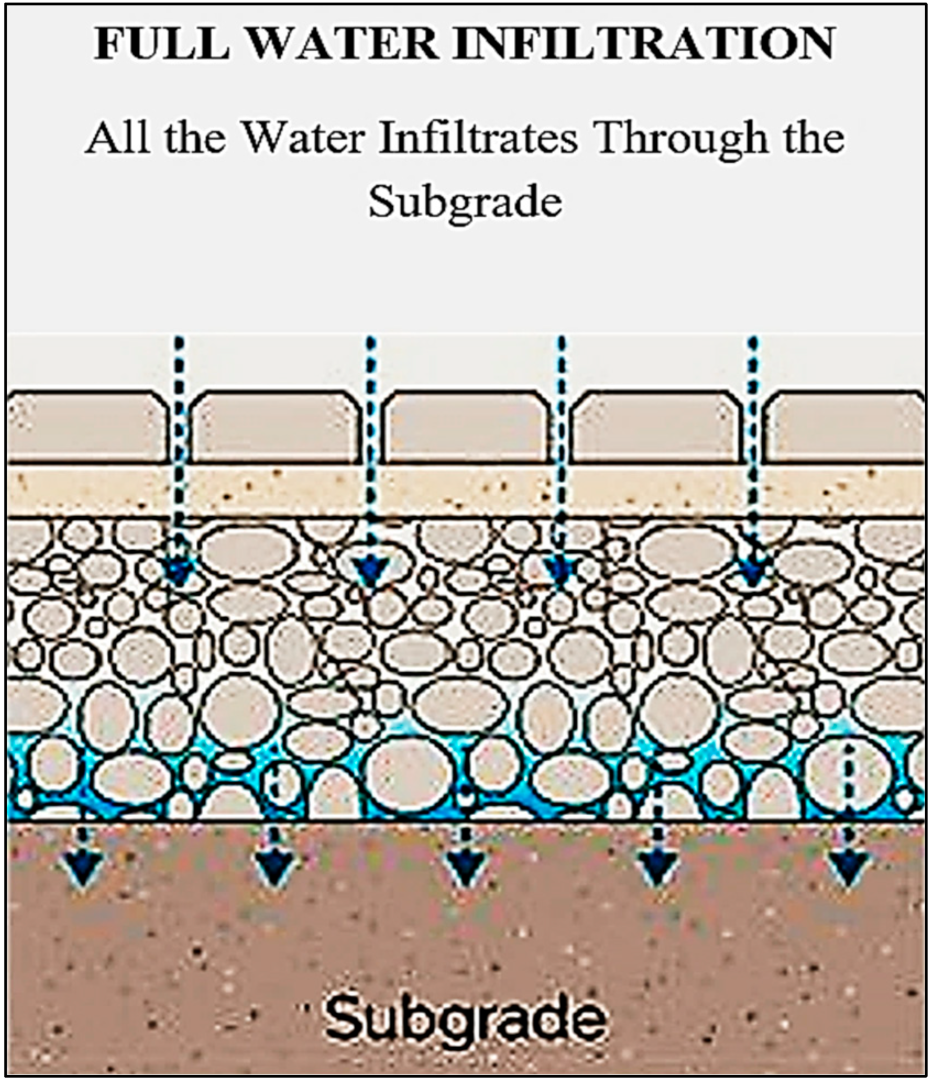
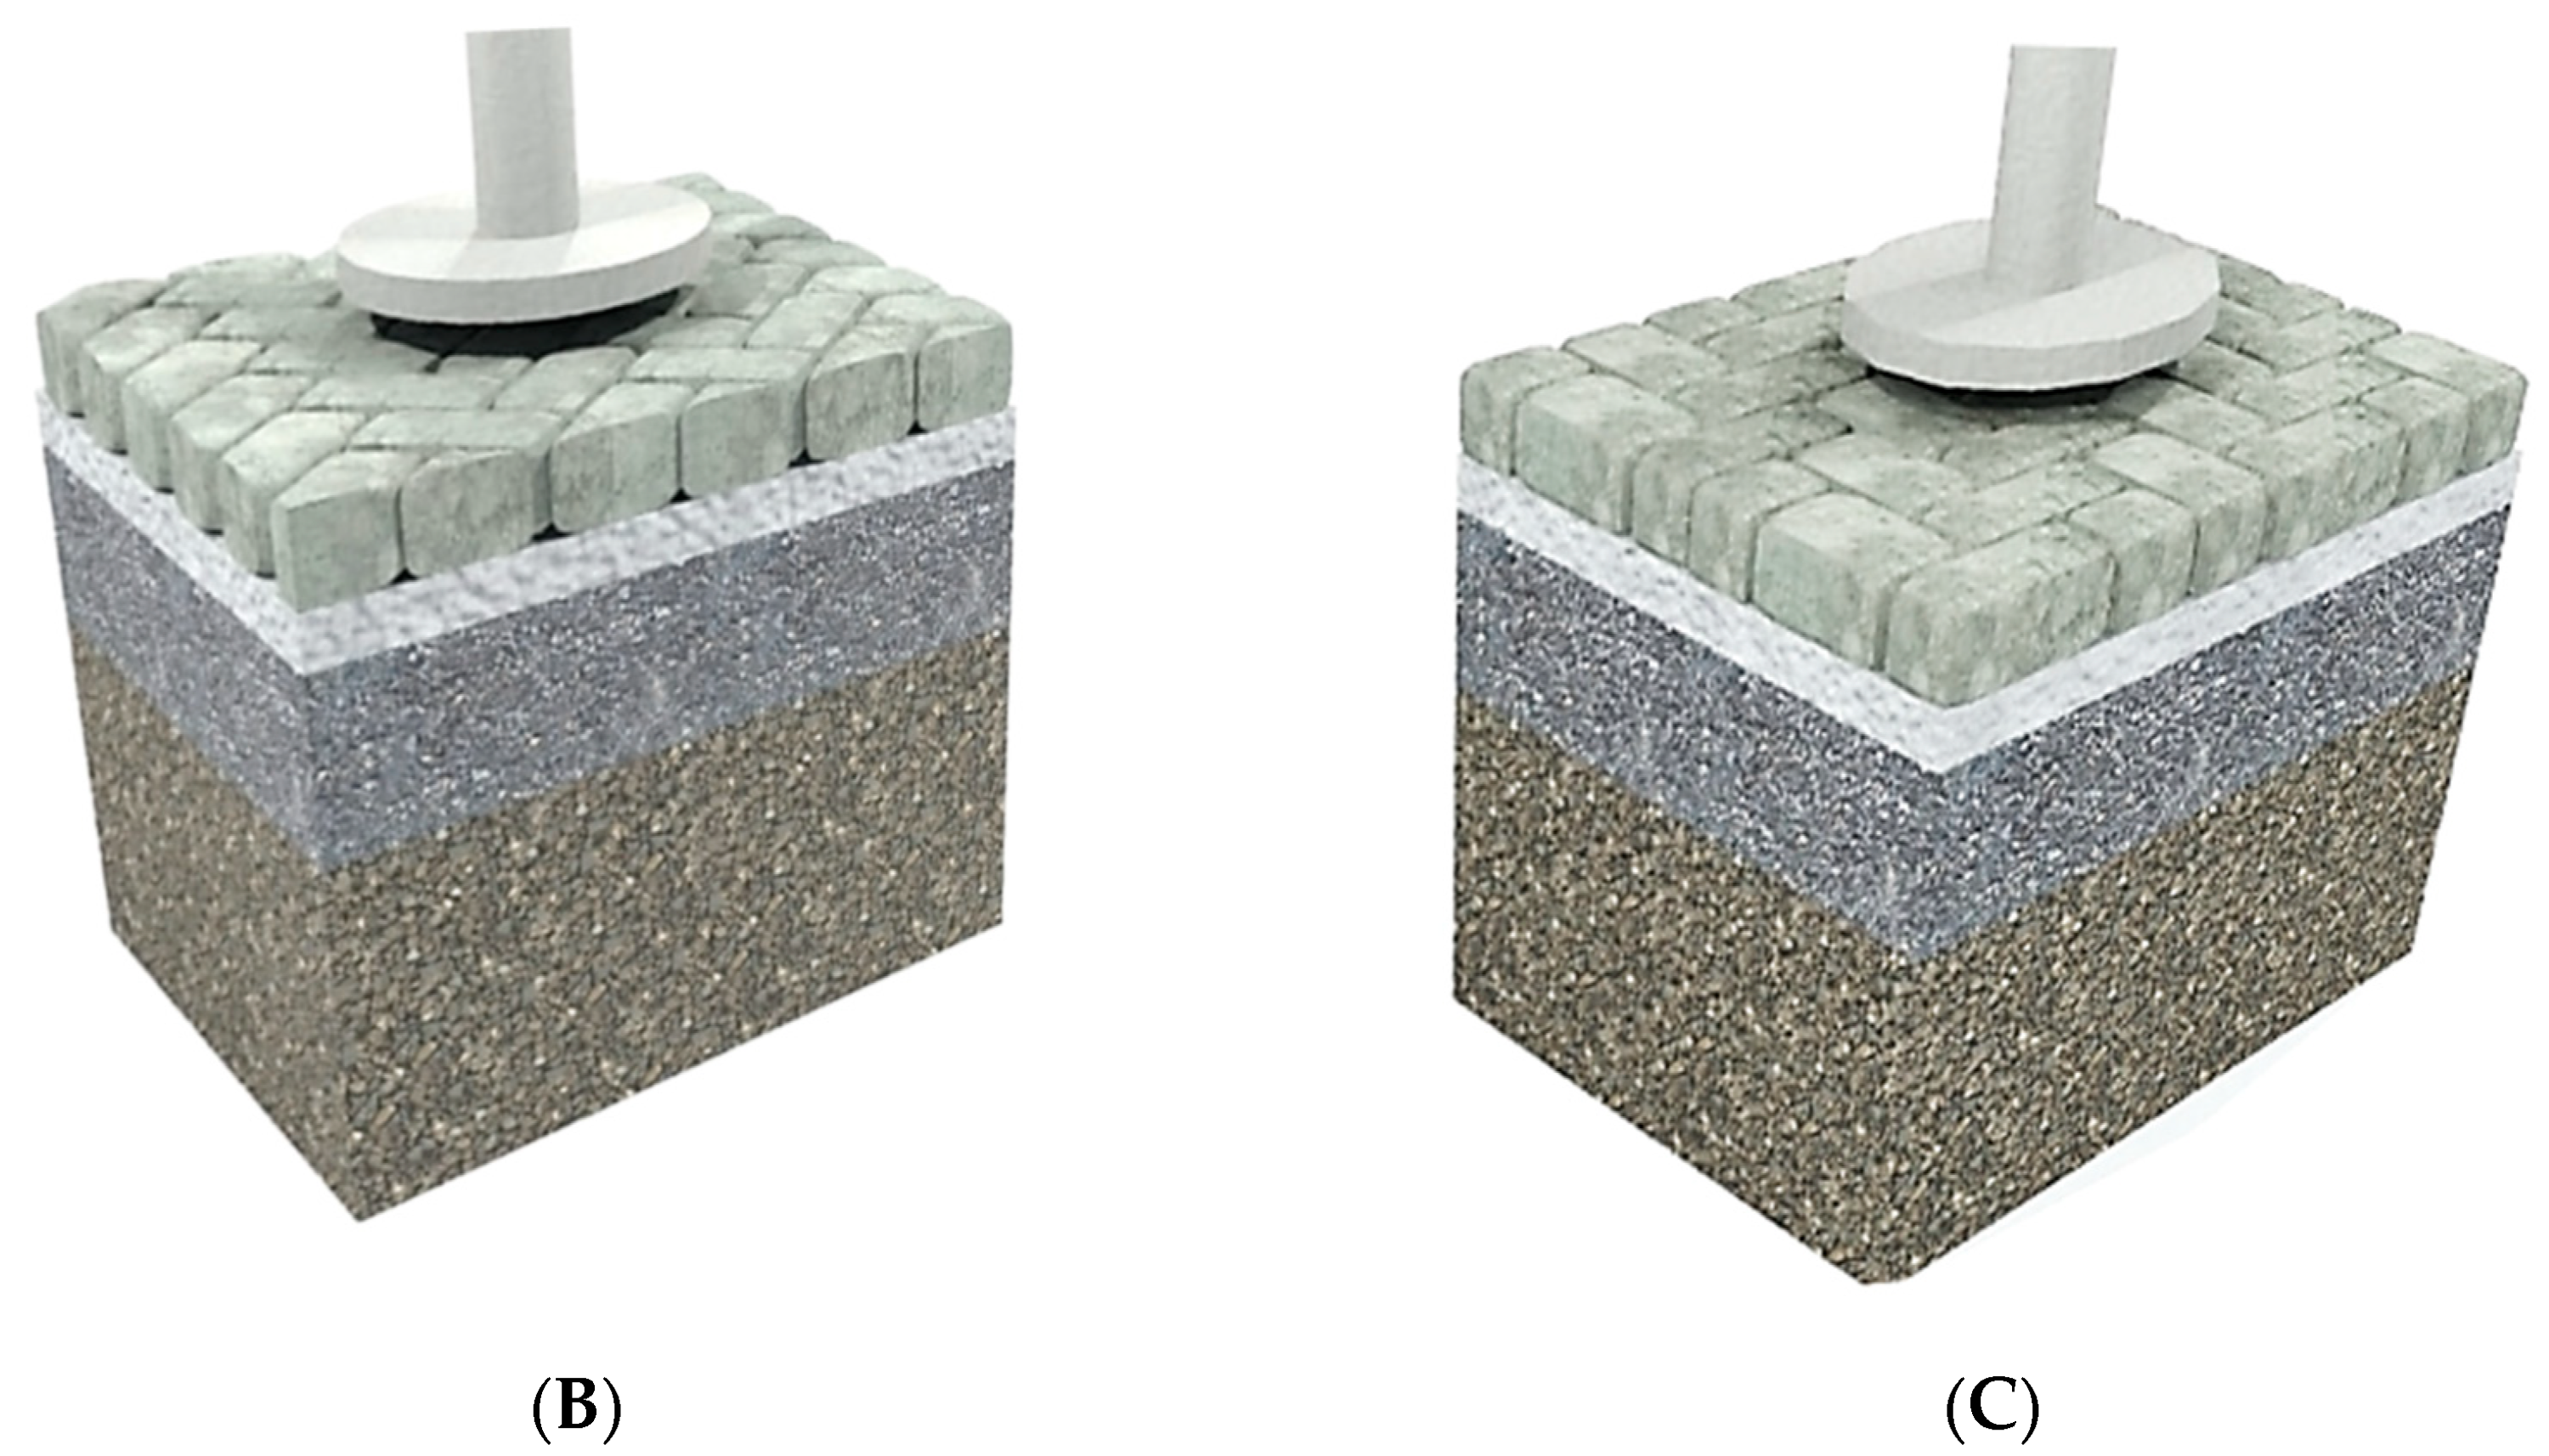
Regarding the hydraulic design of PICP, three options are considered: PICP with full-, partial-, or no-infiltration design. Full-infiltration design is used for PICP on top of high infiltration subgrade soils and does not always require underdrains, as shown in Figure 1A. The most common design type is partial-infiltration design, which can be used with low-permeability soils that can benefit from a drainage system, as shown in Figure 1B. No-infiltration design involves a geomembrane that is used to stop water from seeping through to the subgrade, as shown in Figure 1C [19].
Certain other designs of PICP are highly expensive or located near structures that enclose the pavement with a geomembrane. Temporary storage and an outflow regulator are provided via an outlet pipe, which is applicable in horizontal ground-source heat pumps and water collection systems [20]. PICP has many benefits in terms of stormwater and runoff control design requirements, including reducing runoff volume, controlling pollutants in case of an accident, providing temporary storage for runoff, reducing overflows by infiltrating surface water, and managing the quality of captured water and/or the quantity of storm events [21]. The use of PICP is frequently less expensive than implementing a complete drainage system; additionally, it can be built immediately, with no curing time required, and it can be exposed to low temperatures (freezing) without failure [22]. PICP is mainly applicable in parking lots, low-speed roads, walkways, driveways, alleys, and shoulders of roads [23]. Furthermore, PICP is suitable for roads with a 50 kph maximum speed and medium traffic-loading applications [24]. In detail, the design of PICP layers is demonstrated in Table 1.
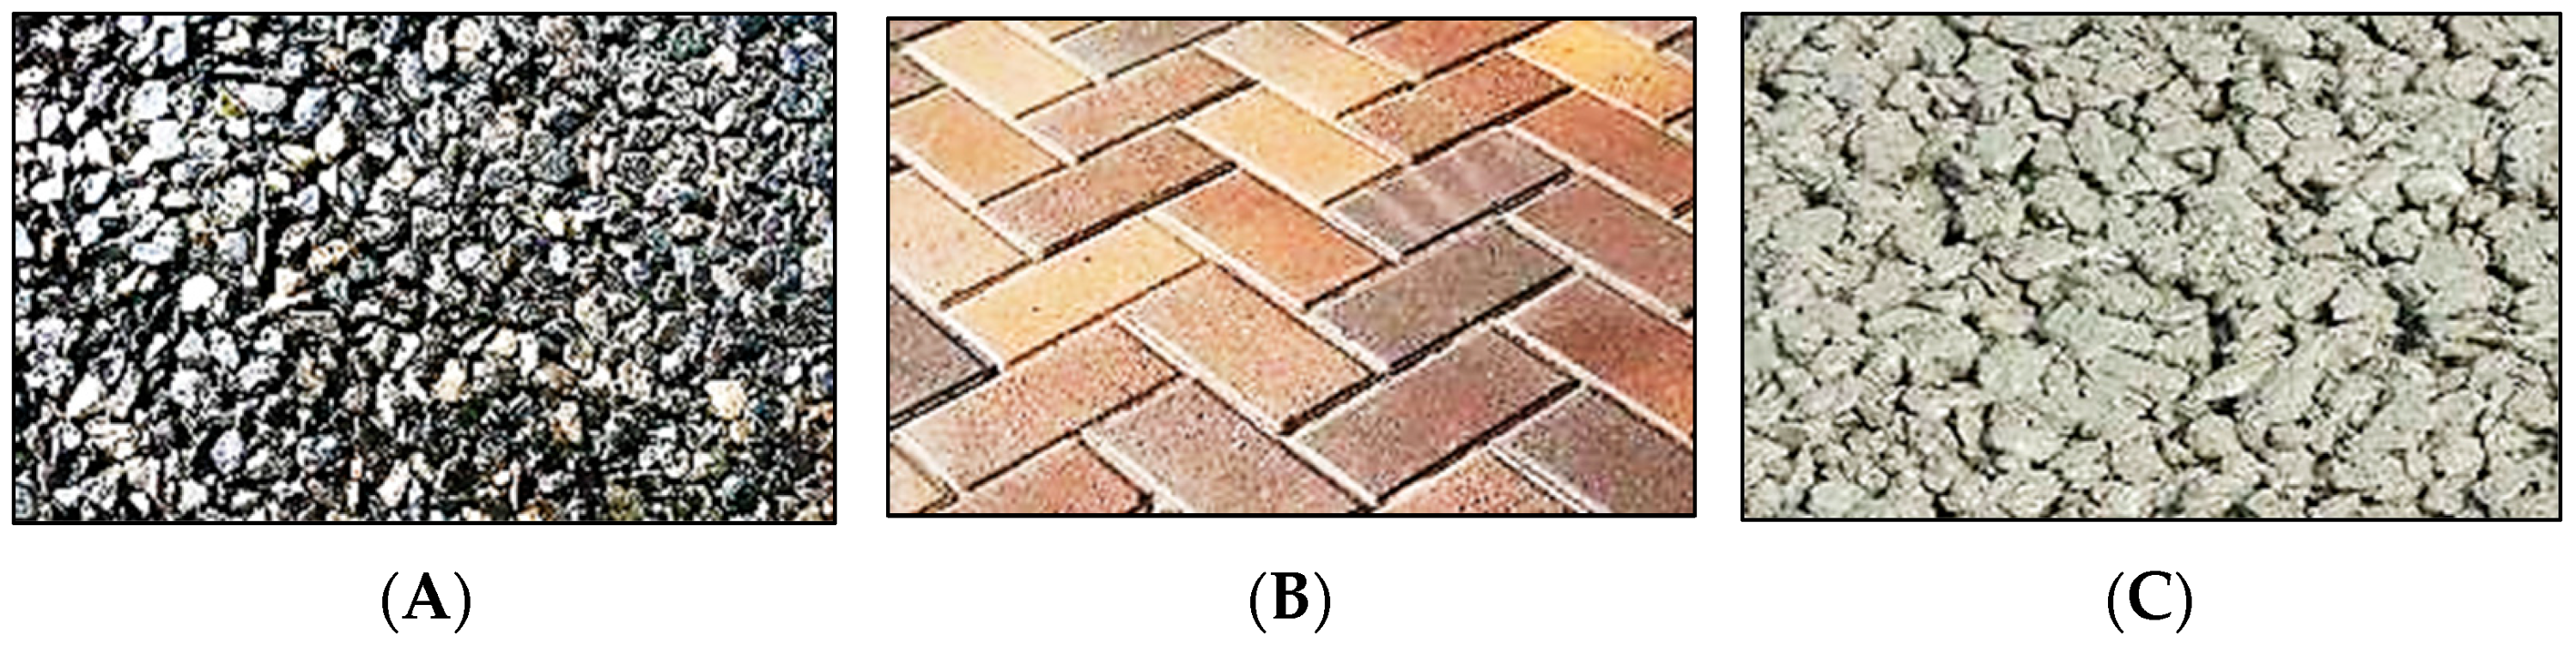
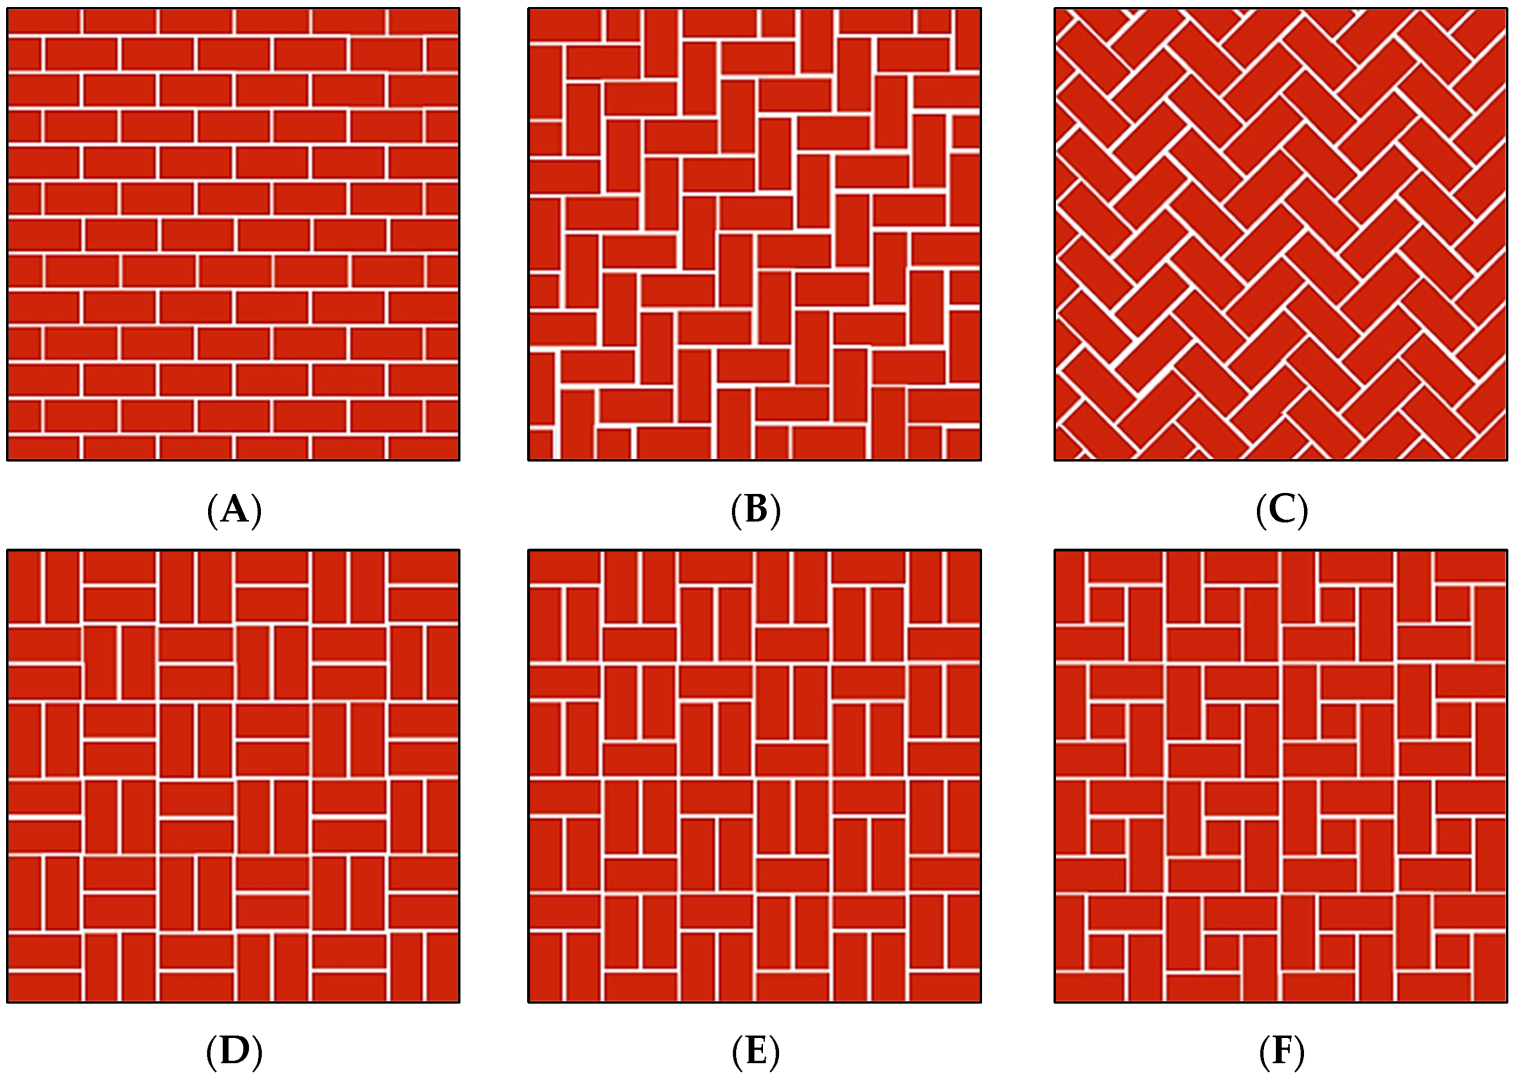
Permeable pavement comes in different types, including porous asphalt, pervious concrete, and PICP. Among these types of permeable pavement, PICP is considered the most efficient. Porous asphalt is made of openly graded coarse aggregate that is bonded using bitumen [26]. Porous asphalt allows water to seep through, due to its large interconnected voids between aggregates. Pervious concrete is a highly porous mixture of cement, water, coarse aggregate, and limited fine aggregate [27]. It generates a porous medium that allows water to pass through to the underlying layers. Figure 2 demonstrates the surface patterns of the three main types of permeable pavement. PICP surface patterns and the opening of joints vary, depending on the structural design [28], whereas the well-known surface patterns are demonstrated in Figure 3.
Liu et al. [29] provided a study of the efficacy of 10 different PICP designs for treating the nutrients that exist in runoff stormwater. The results indicated the successful removal of different types of nutrients, including ammonia–nitrogen, orthophosphate–phosphorus, and nitrite–nitrogen. Simpson et al. [30] aimed to evaluate the effectiveness of PICP in filtering runoff water for non-potable domestic use. In order to filter rainwater before it was further treated for non-potable purposes in buildings, PICP was shown to be a viable alternative for filtering.
Nichols et al. [31] compared the performance of two measuring methods of PICP’s surface infiltration rate in order to minimize some of the practical challenges associated with the existing methods, including increased infiltration rates due to irrational pressure heads.
Tirpak et al. [32] studied the effectiveness of PICP in improving water quality in a redesigned parking lot. The findings of that study illustrated the efficiency of PICP in eliminating seasonally deposited contaminants several years after construction.
Smith et al. [33] presented a technical progress review of the standards issued by the emerging American Society of Civil Engineers regarding the PICP, including the use of high-strength concrete paver units connected to each other by permeable aggregate in the joints and the structural and hydraulic design of the layers within PICP. Imran et al. [34] showcased the versatility of permeable pavement for various applications, particularly in managing drainage systems and improving the quality of stormwater runoff from roads, driveways, rooftops, and parking lots. However, that study also revealed gaps in the current understanding of PICP and identified areas where further research is needed for future developments.
In addition, Van Vuuren et al. [35] explored the factors that affect the infiltration and flow of water through PICP, specifically examining the impact of construction materials and pavement slope. Their findings indicated that using materials with lower permeability in the surface layer of PICP and/or increasing the slope of the pavement can reduce the overall permeability of the system.
The novelty of the present study is that it provides a specific comparison between two surface patterns of PICP, in terms of water infiltration and runoff volume, using a specialized rainfall simulator that has been fabricated for measuring the water infiltration volume. Furthermore, we applied static loading on both surface patterns using a manufactured scale model to predict the deflection behavior in order to attain the most sustainable stretcher-bonded surface pattern that can serve as an alternative to traditional asphalt pavement in public spaces, with a focus on factors such as durability, cost-effectiveness, and optimal performance for potential users.
We investigated the ability of PICP to reduce runoff volume under different rainfall intensities, using different parameters of geometric roadway design, including employing 45° and 90° herringbone surface patterns of PICP (the most commonly used patterns in Iraq), in addition to adjusting the surface longitudinal and side slopes for better infiltration.
2. Experiment Program
2.1. Details of the Rainfall Simulator
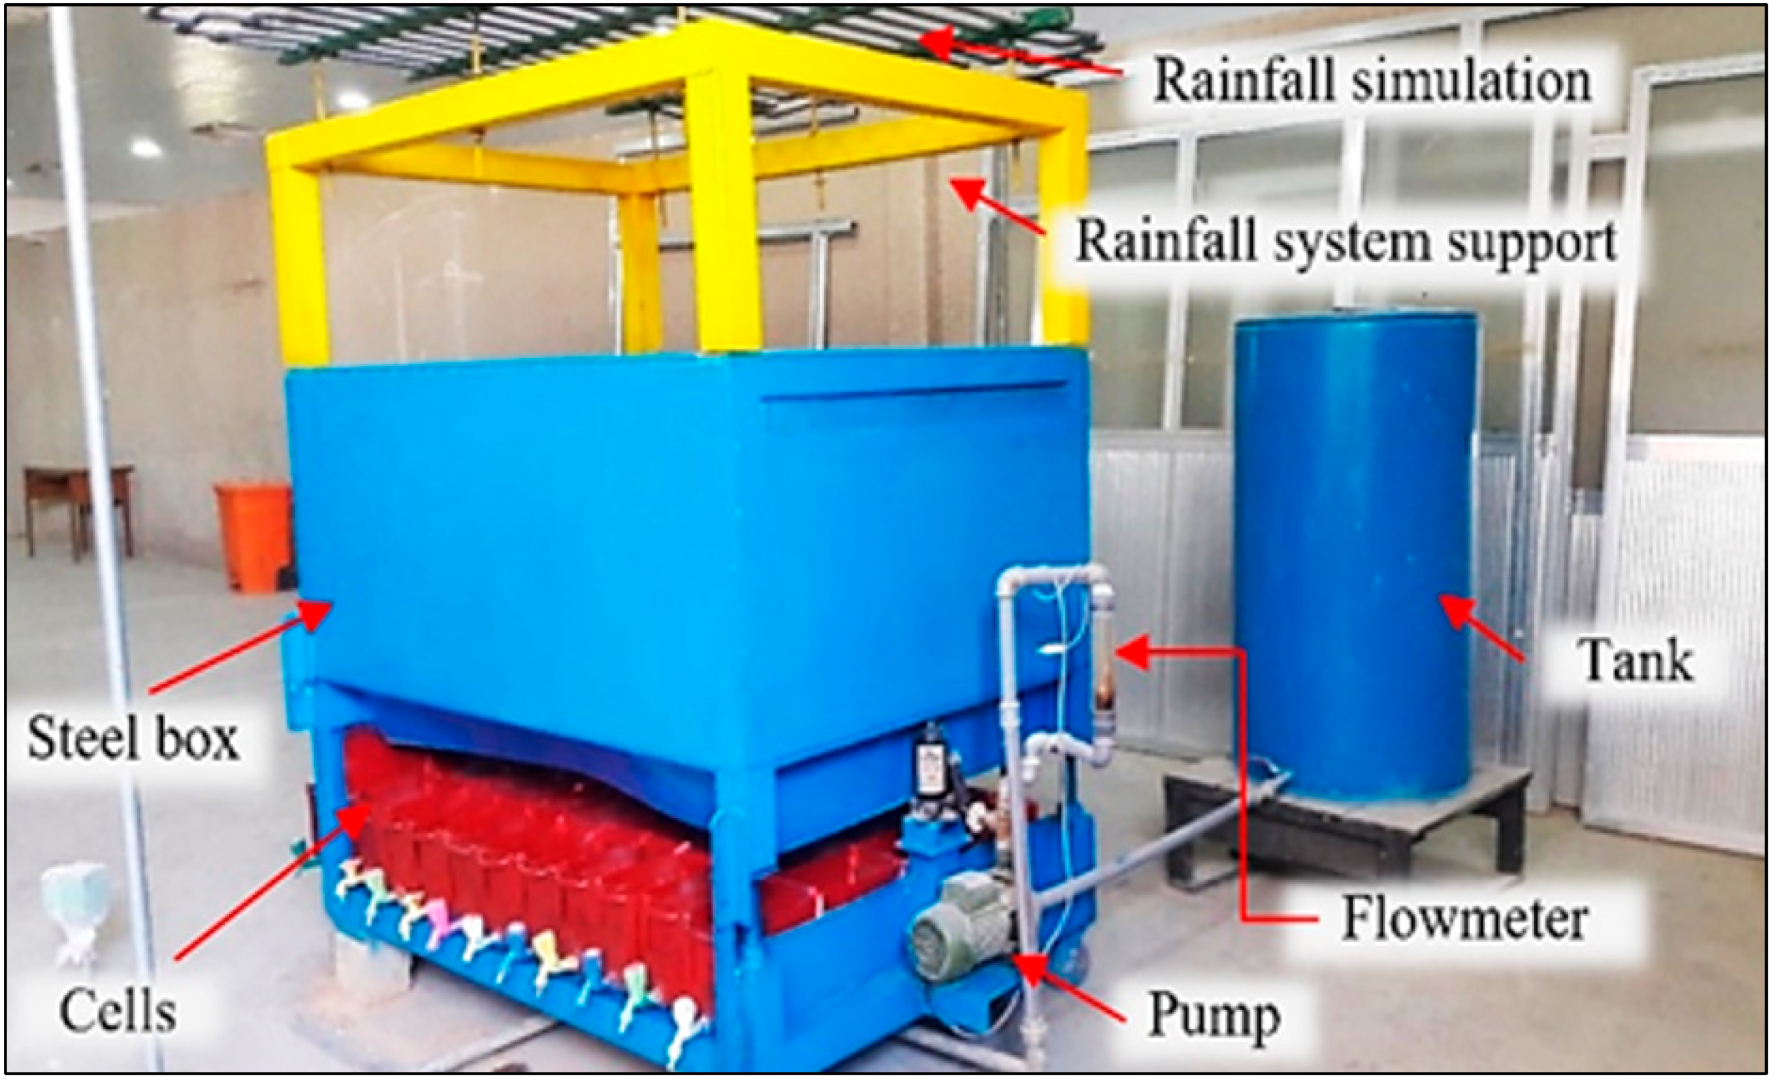
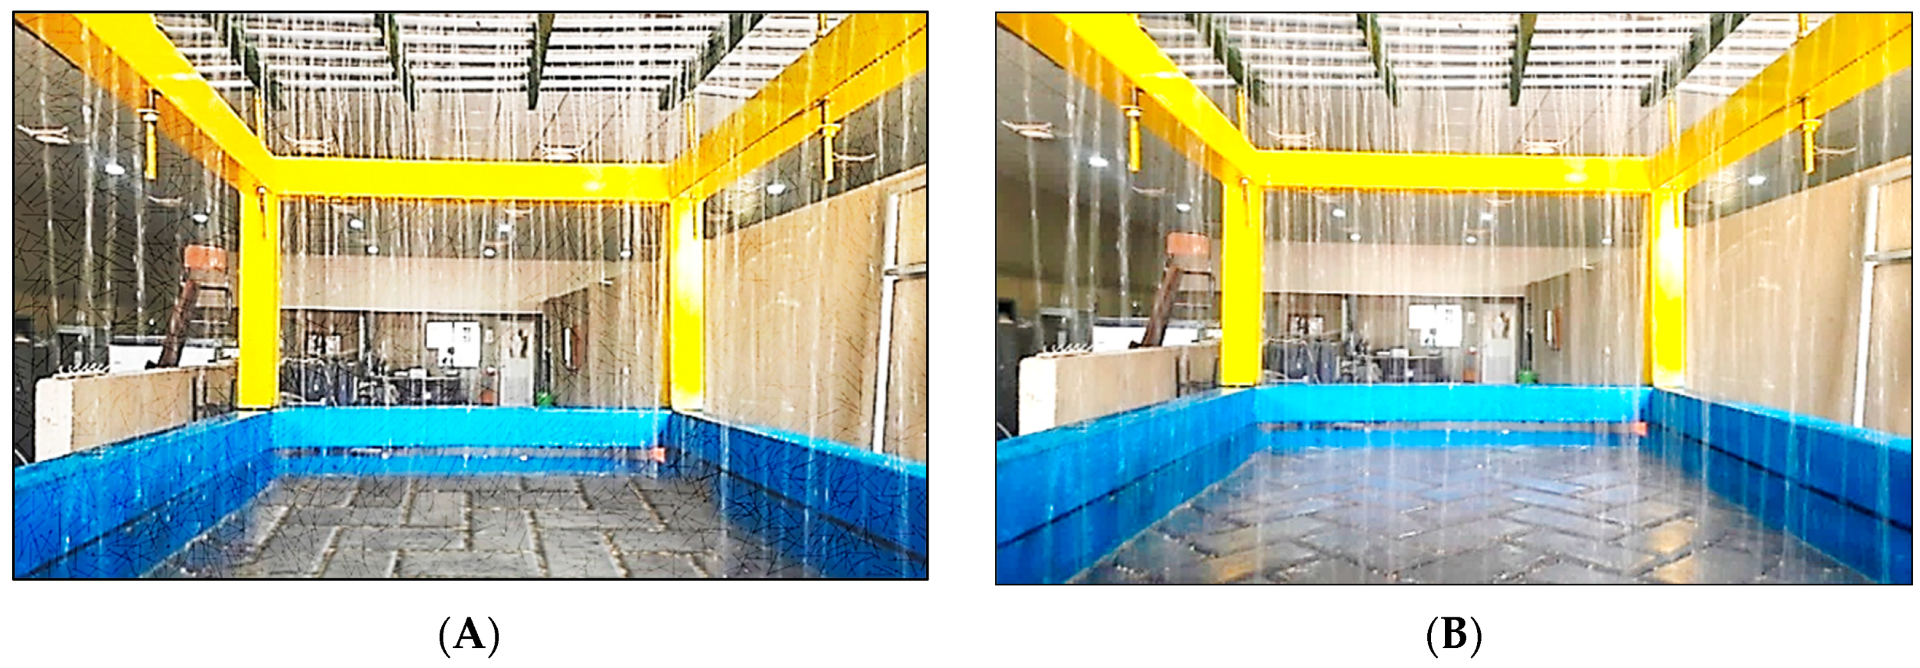
The fabricated simulator of rainfall, as shown in Figure 4, is composed of several vital parts. The dimensions of the construction and the period of rainfall activation were determined based on previous studies by Alzamly et al. [36], Mhaske et al. [37], Yusuf et al. [38], and Mendes et al. [39]. The parts of the fabricated simulator were as follows:
i. A box made of steel with specific dimensions (65 cm height × 1.5 m length × 1.0 m width) was used as a vessel for the layers of PICP, as shown in Figure 4.
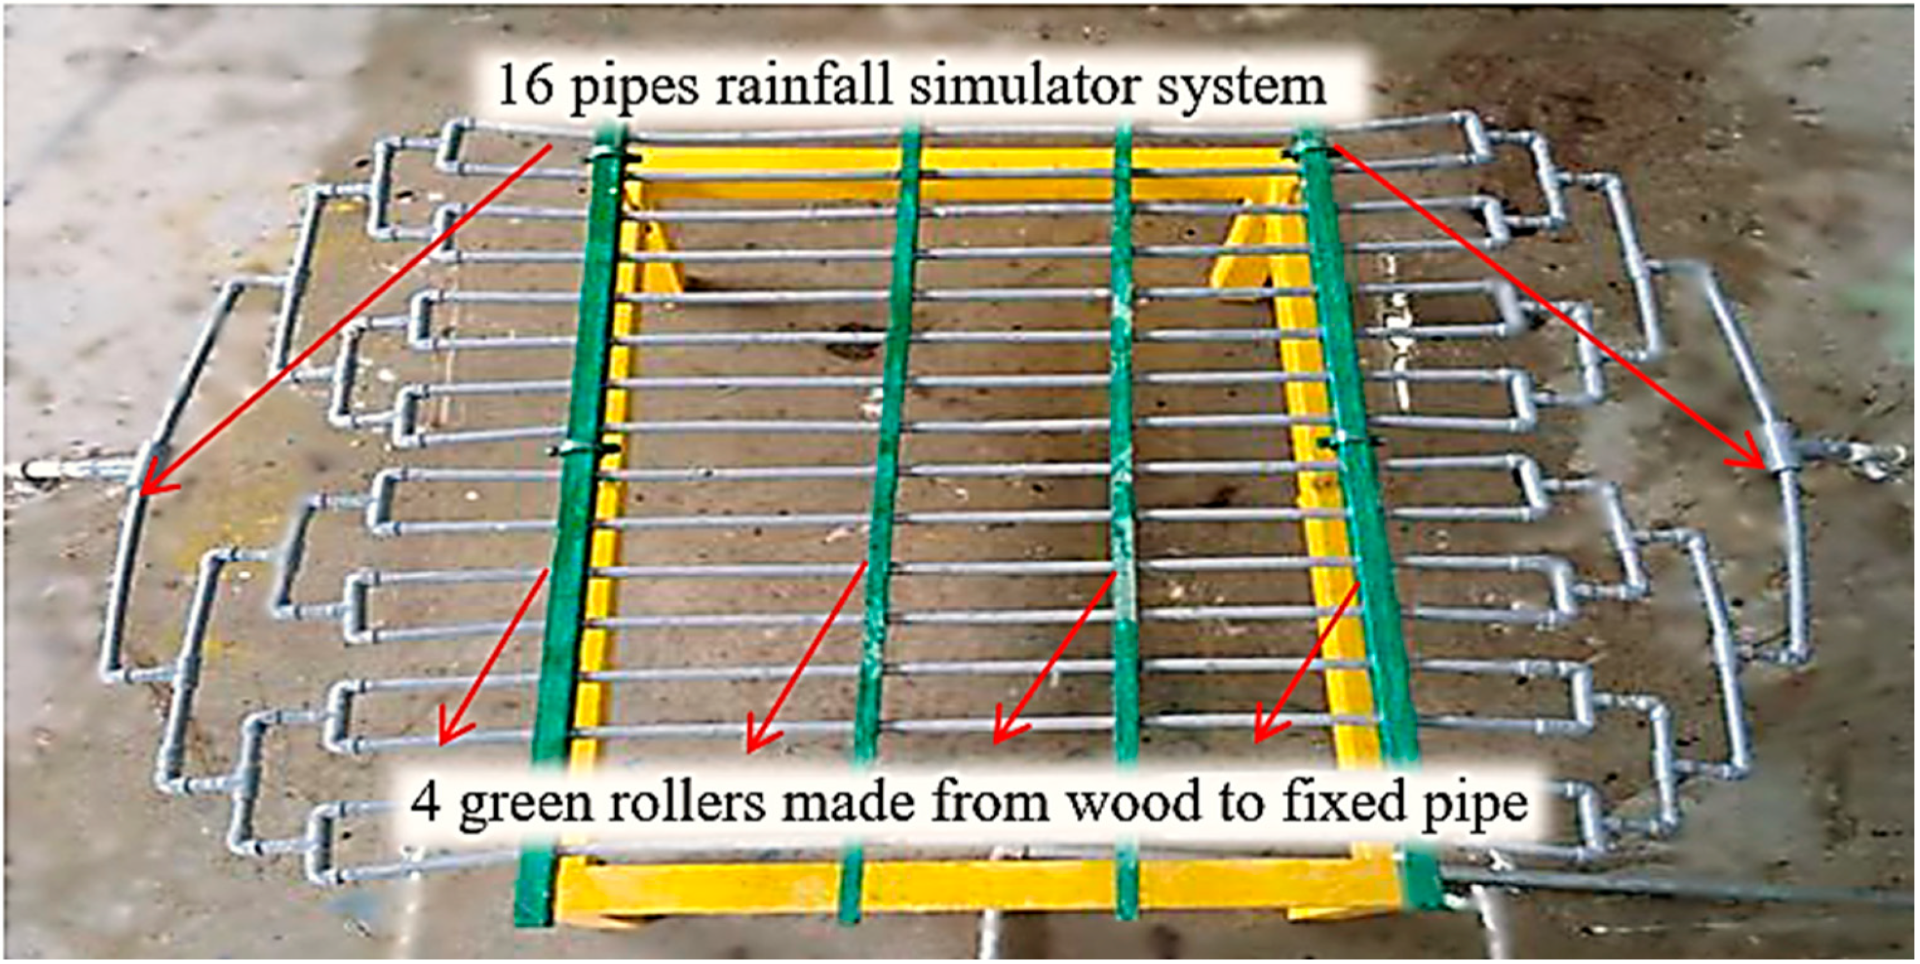
ii. A rain-dropping system was developed to simulate rainfall, composed of 16 parallel PVC pipes fixed with equal spacing (9.75 cm) between each pipe. Each pipe had a diameter of one-half inch; in addition, holes were drilled along each pipe, with a center spacing of 11 cm and 2 mm in diameter, as shown in Figure 5.
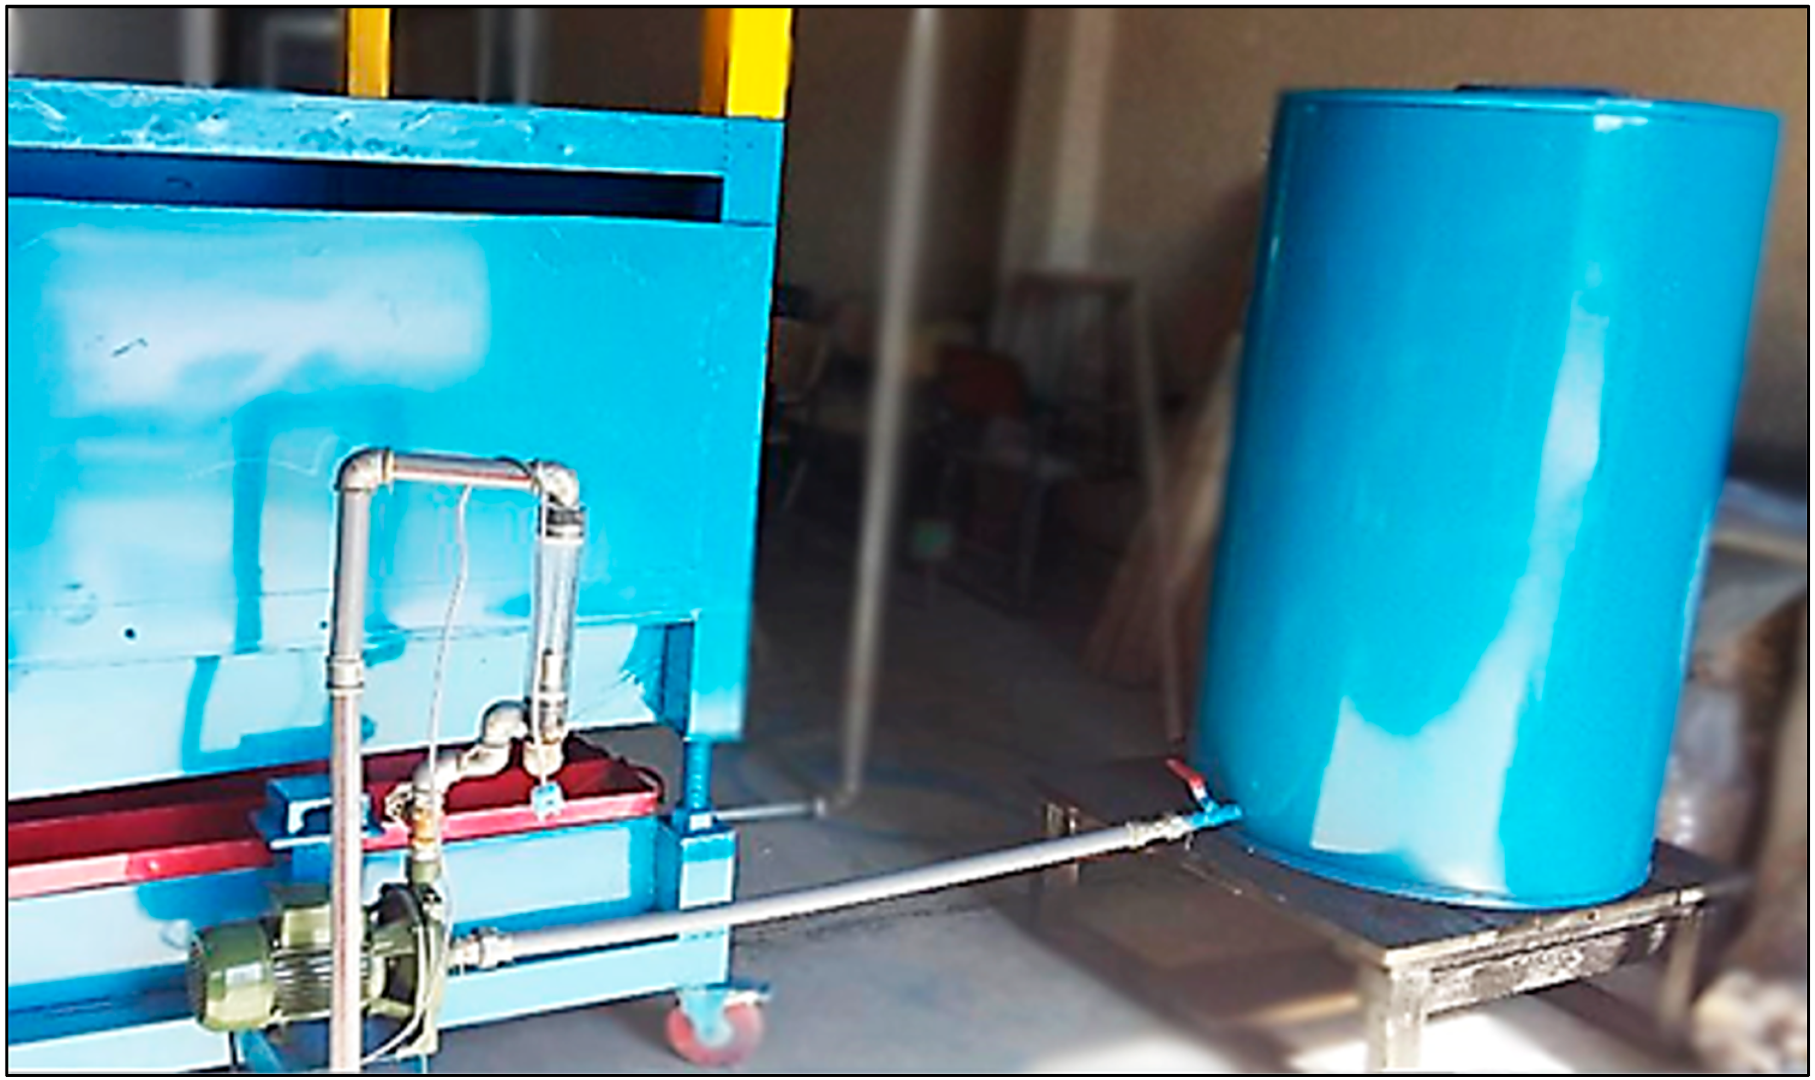
iii. A water-feeding system was included, consisting of a steel tank attached to an impeller pump with a 130 L/min maximum flowrate, connected to a steel pipe to deliver the water to the rainfall simulator, as shown in Figure 6.
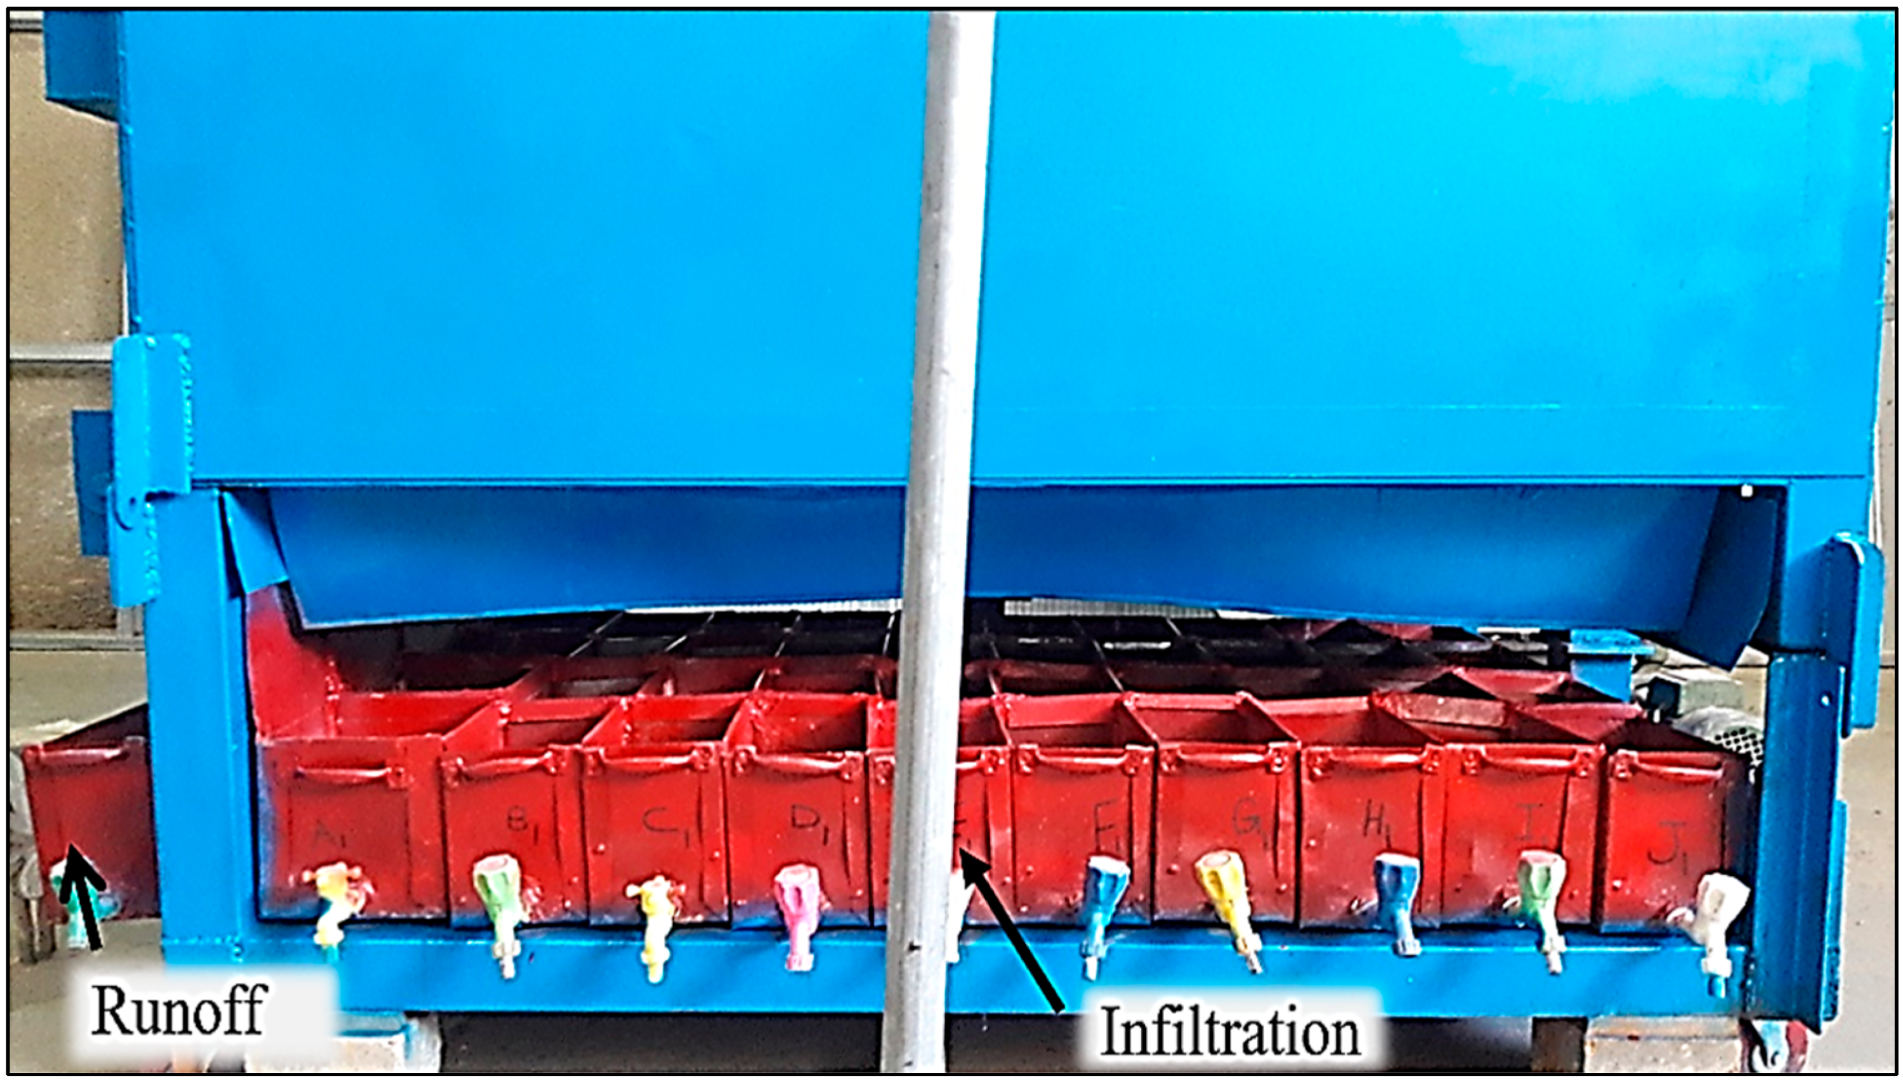
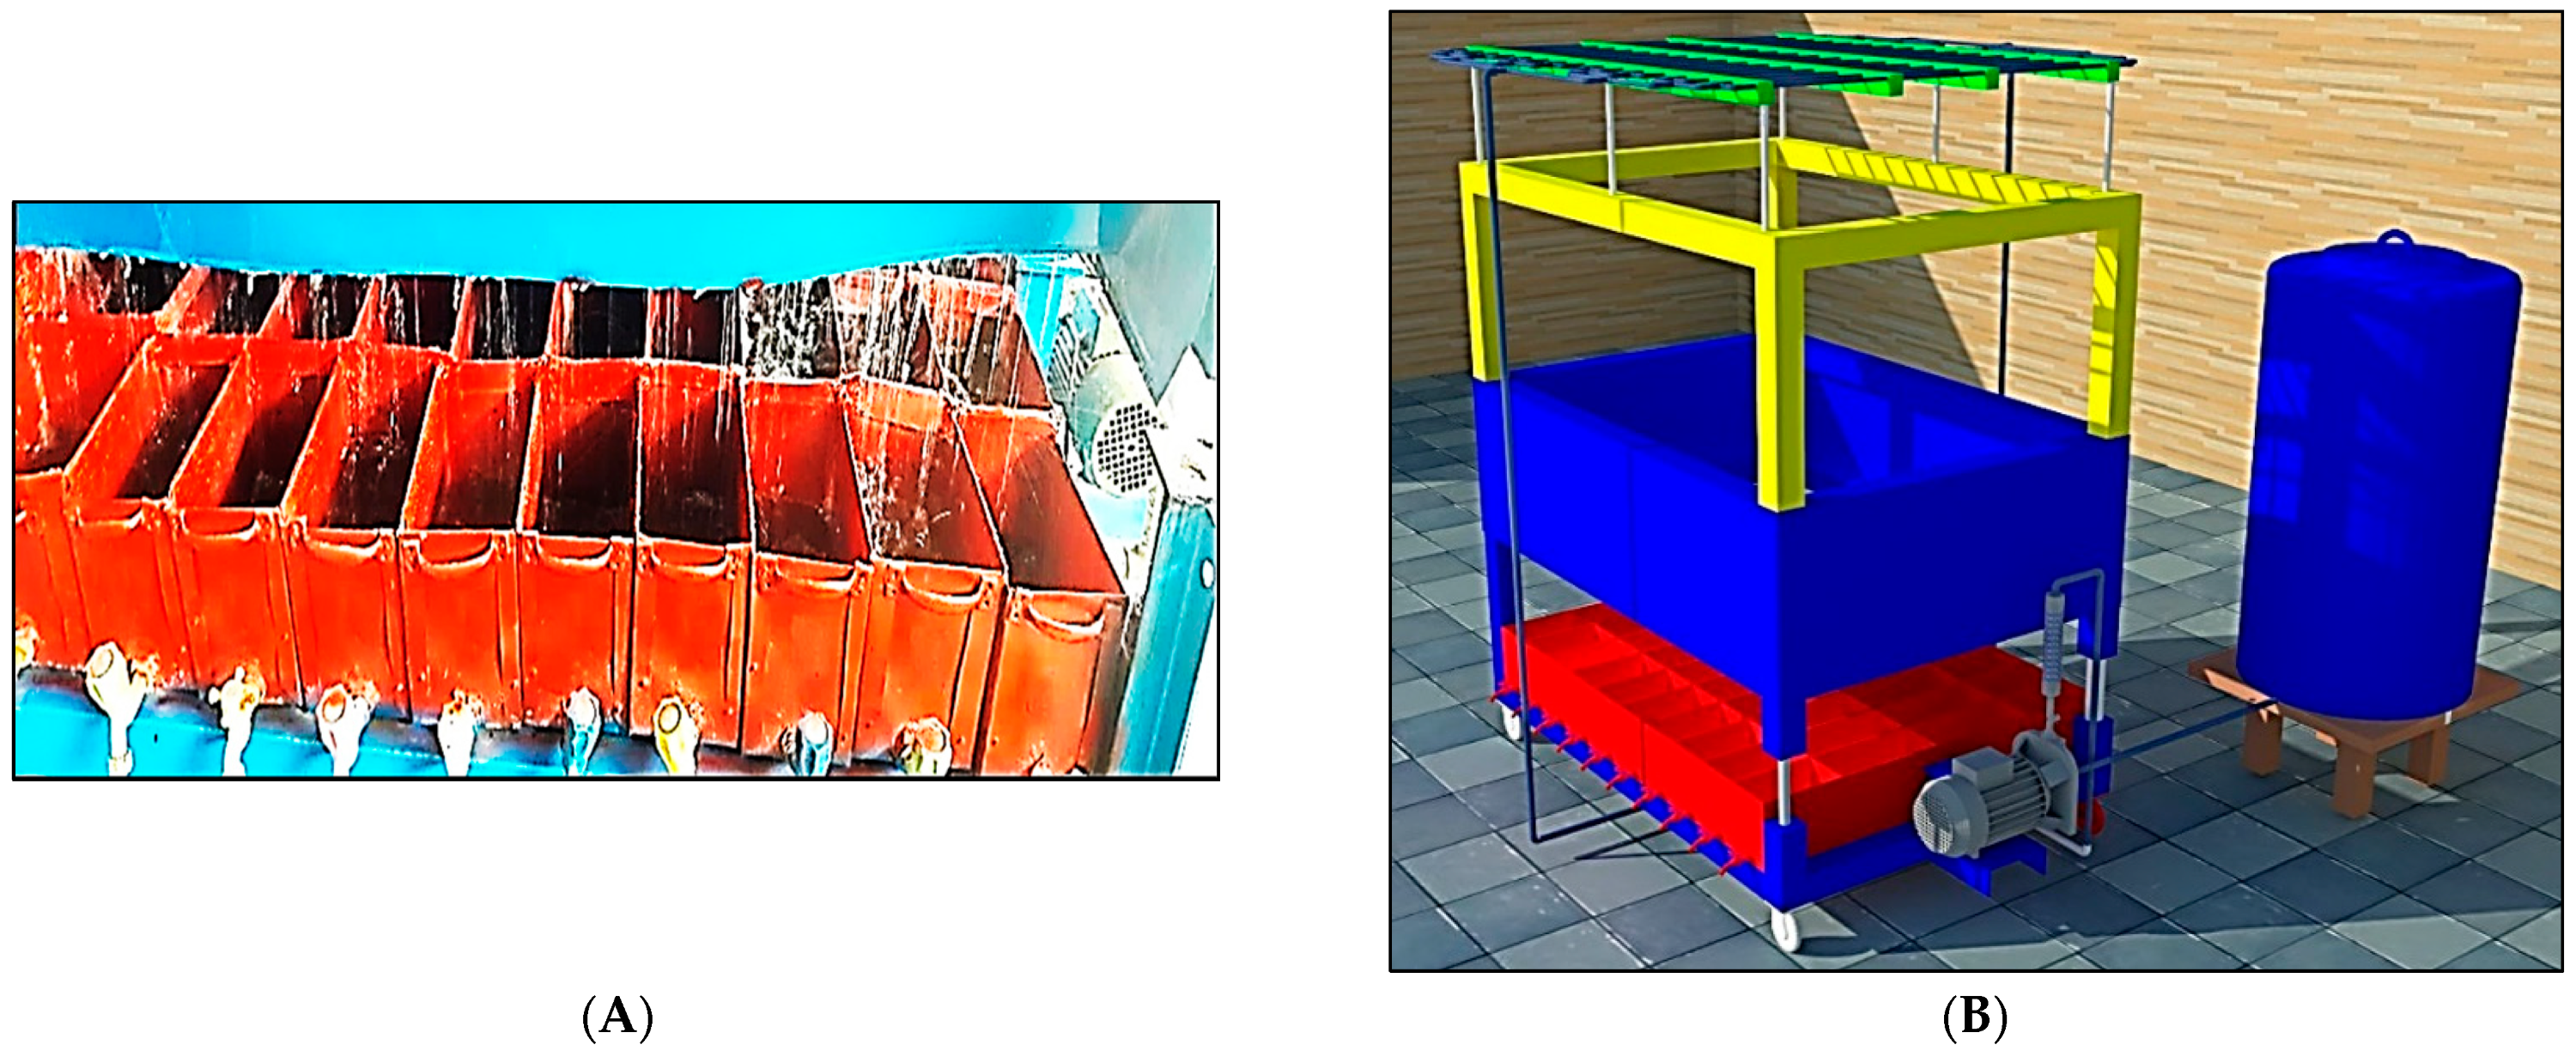
iv. A mesh of 40 steel containers or cells (20 cm high, 25 cm length, 15 cm wide) was located 50 cm vertically beneath the iron box. The purpose of these cells was to collect water permeated from the PICP layers, as shown in Figure 7.
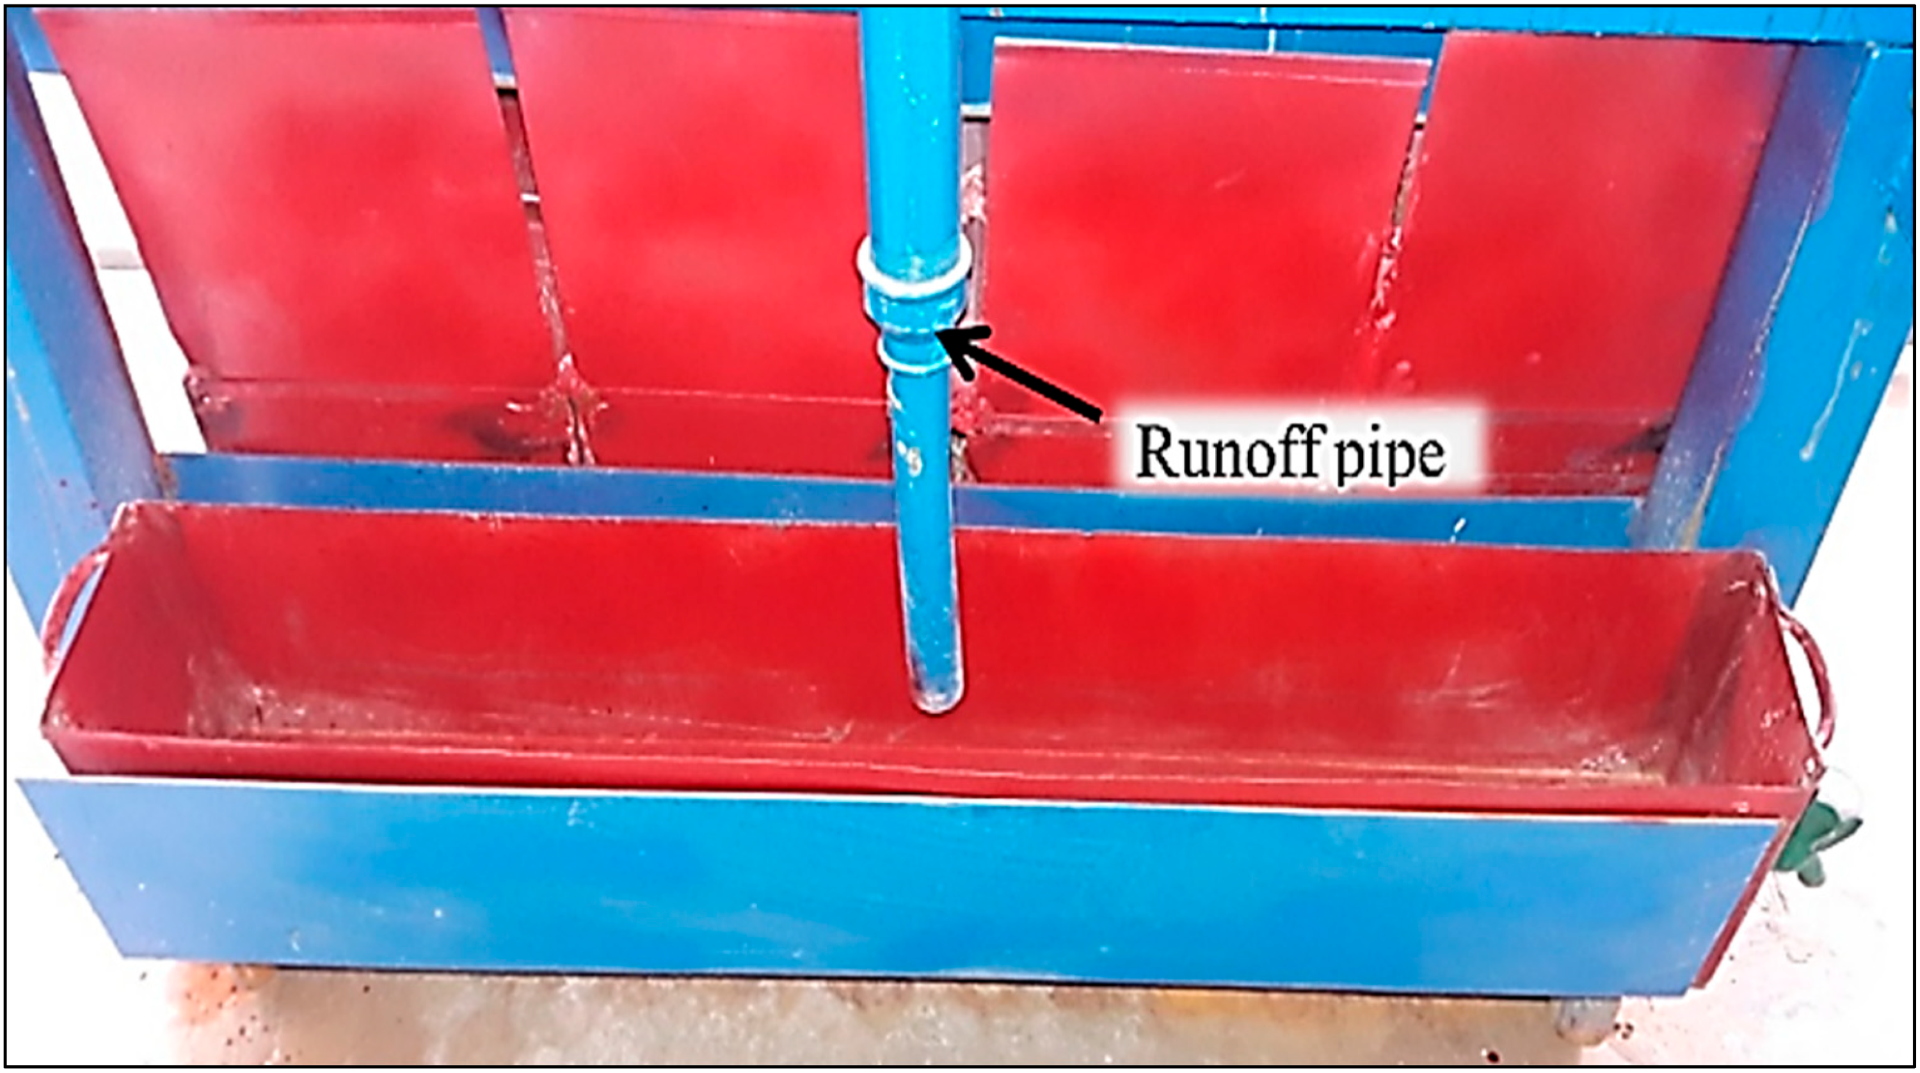
v. A container made of steel was located at the lower side of the fabricated simulator (20 cm height × 100 cm length × 15 cm width); it was used to gather the seeping runoff water, as shown in Figure 8.
2.2. The Adopted Hydraulic Design of PICP
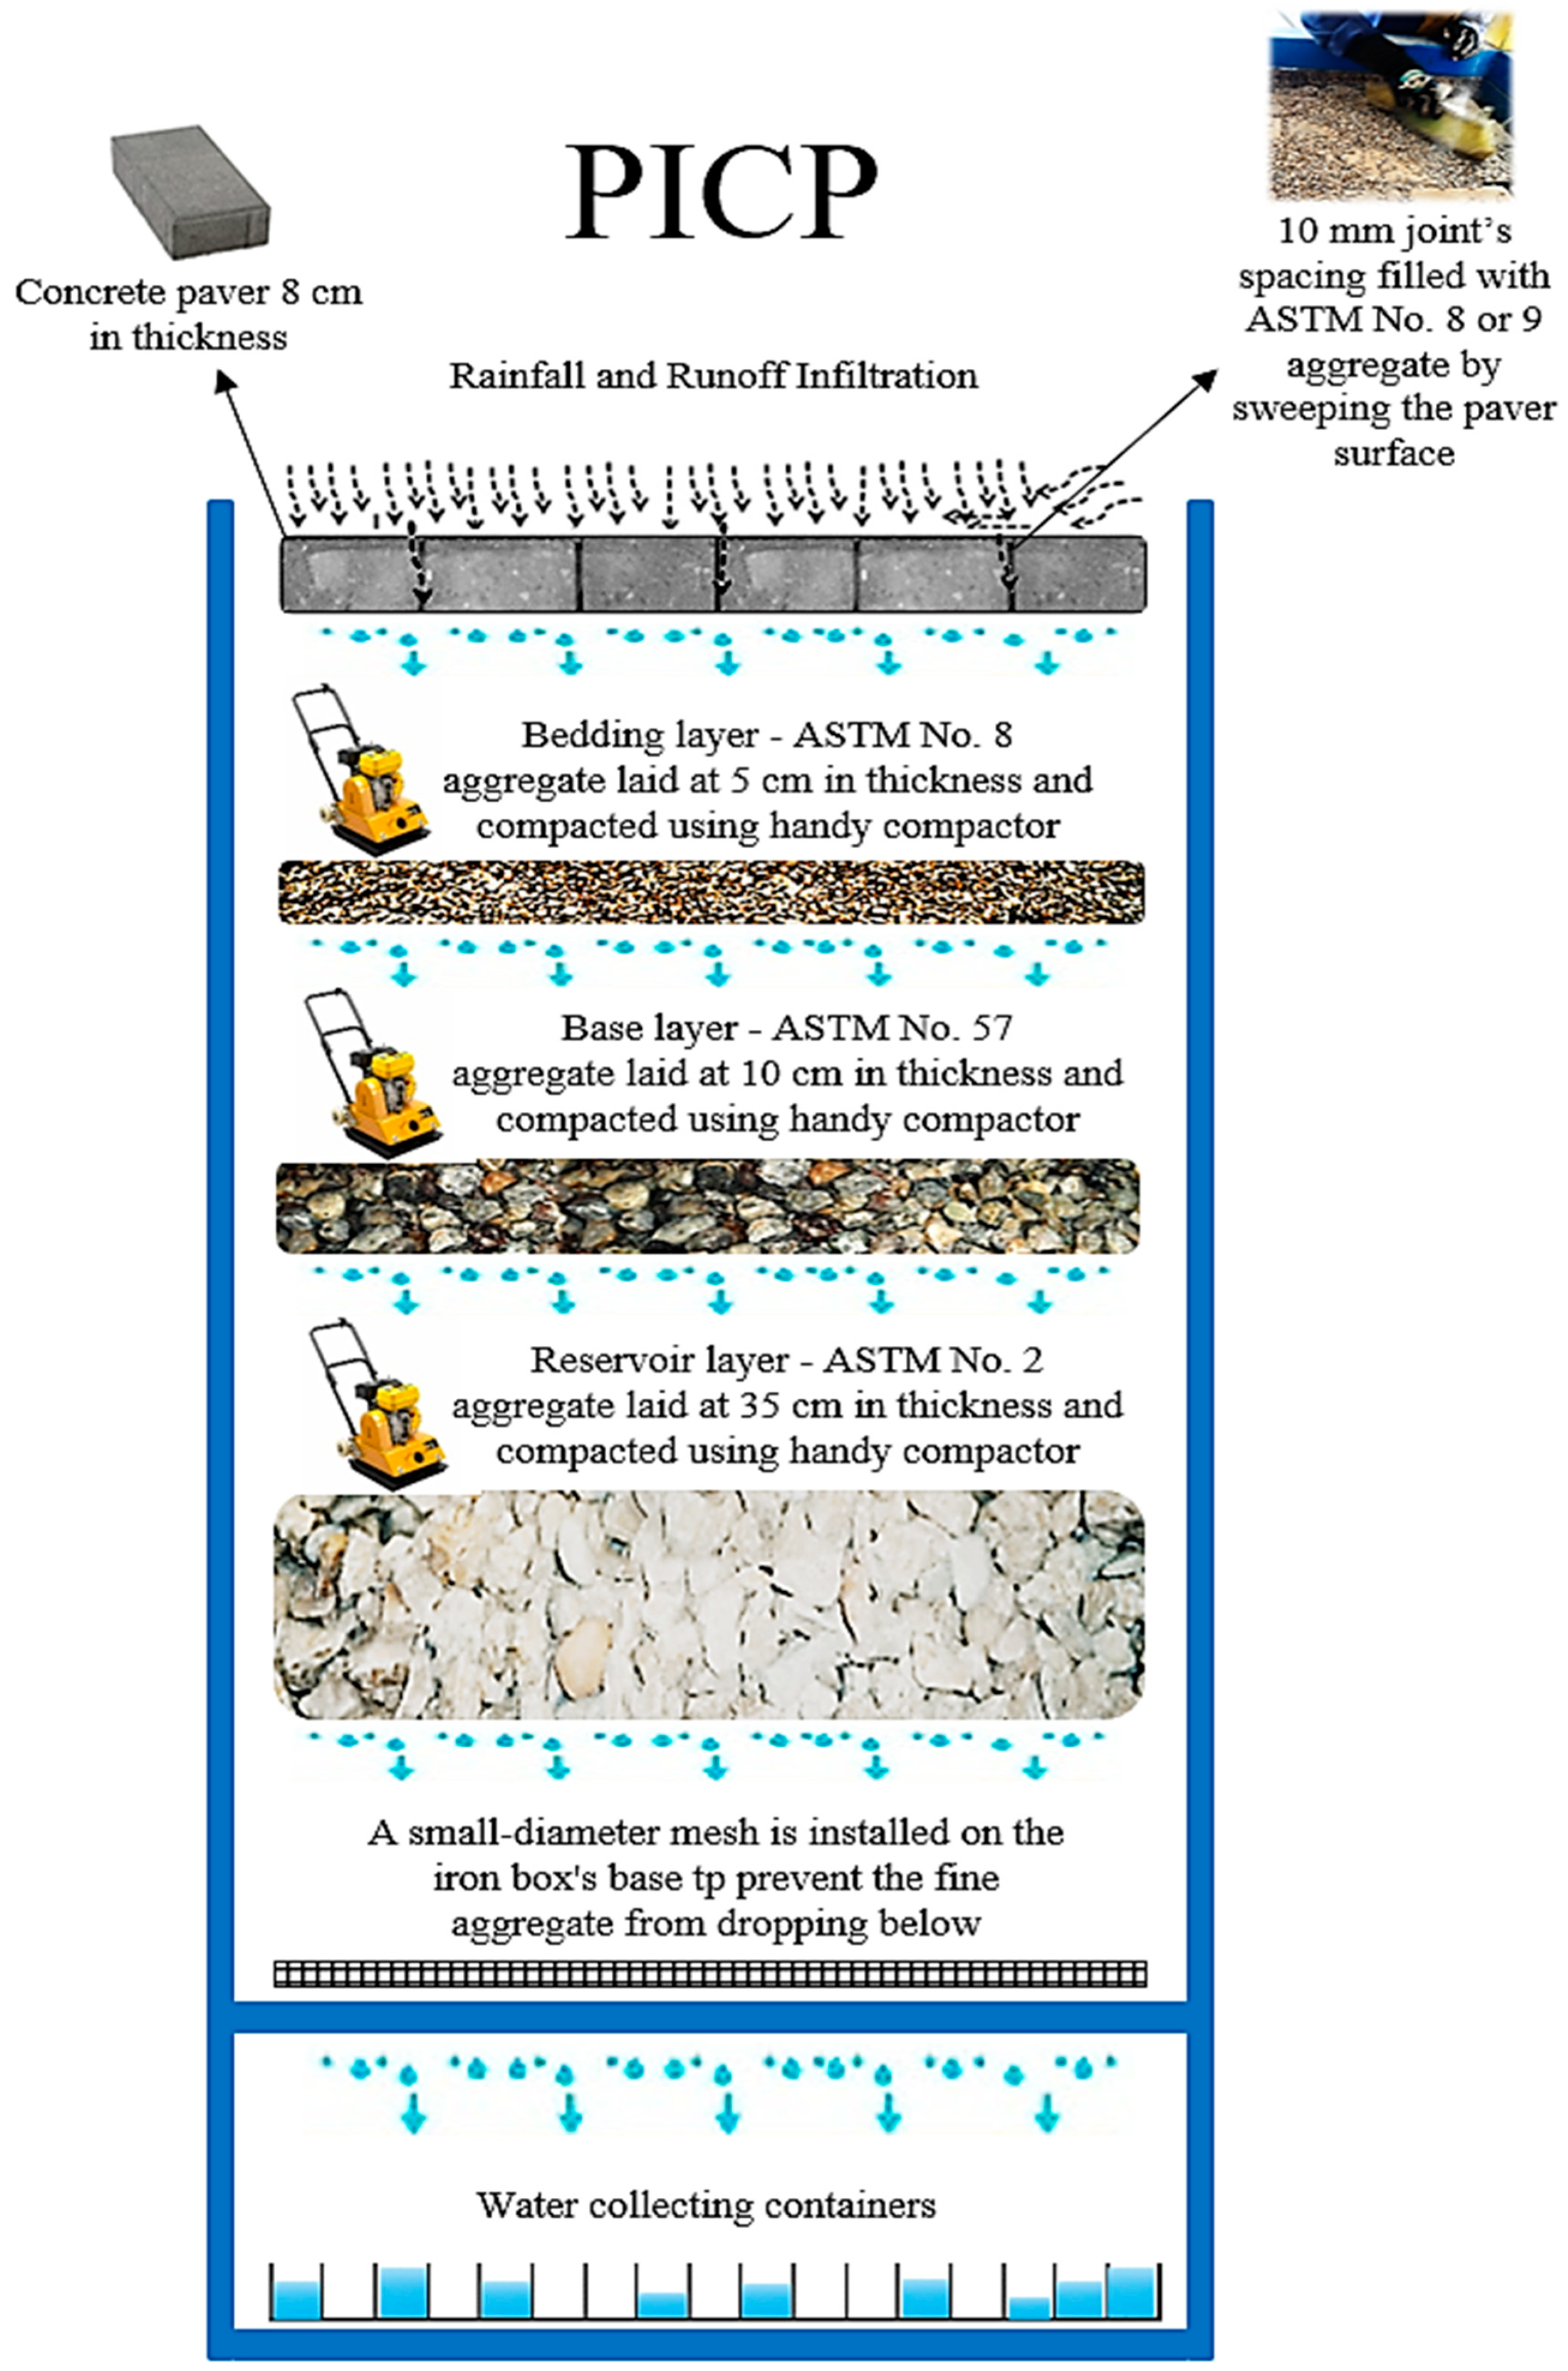
The hydraulic design of PICP includes several key elements: the permeability of the pavement surface, the storage capacity of the underlying layers, the infiltration rate of water into the pavement, and the drainage system that collects and channels water away from the pavement surface [34]. The permeability of the pavement surface is typically achieved by using open-jointed pavers that allow water to flow through the joints and into the underlying layers. The storage capacity of the underlying layers is achieved by using a layer of open-graded aggregate or gravel as the base. The infiltration rate of water into the pavement is determined by the size and spacing of the joints, as well as by the porosity of the pavers and the base layer. The drainage system is designed to collect and channel water away from the pavement surface, usually through a drainage layer or system of pipes. In this study, the selected hydraulic design of PICP was with full infiltration, as shown in Figure 9, whereas the subgrade layer of the structure was considered with high permeability to runoff water at a ratio of infiltration higher than 40 mm/h. Therefore, conducting the hydraulic design for any proposed paving project at the site location was governed by the nature of the soil subgrade [40]. Normally, PICP is constructed over different types of subgrades, not just a specific type.
2.3. In-Detail Designing of the Layers of PICP
2.3.1. Surface Concrete Paver
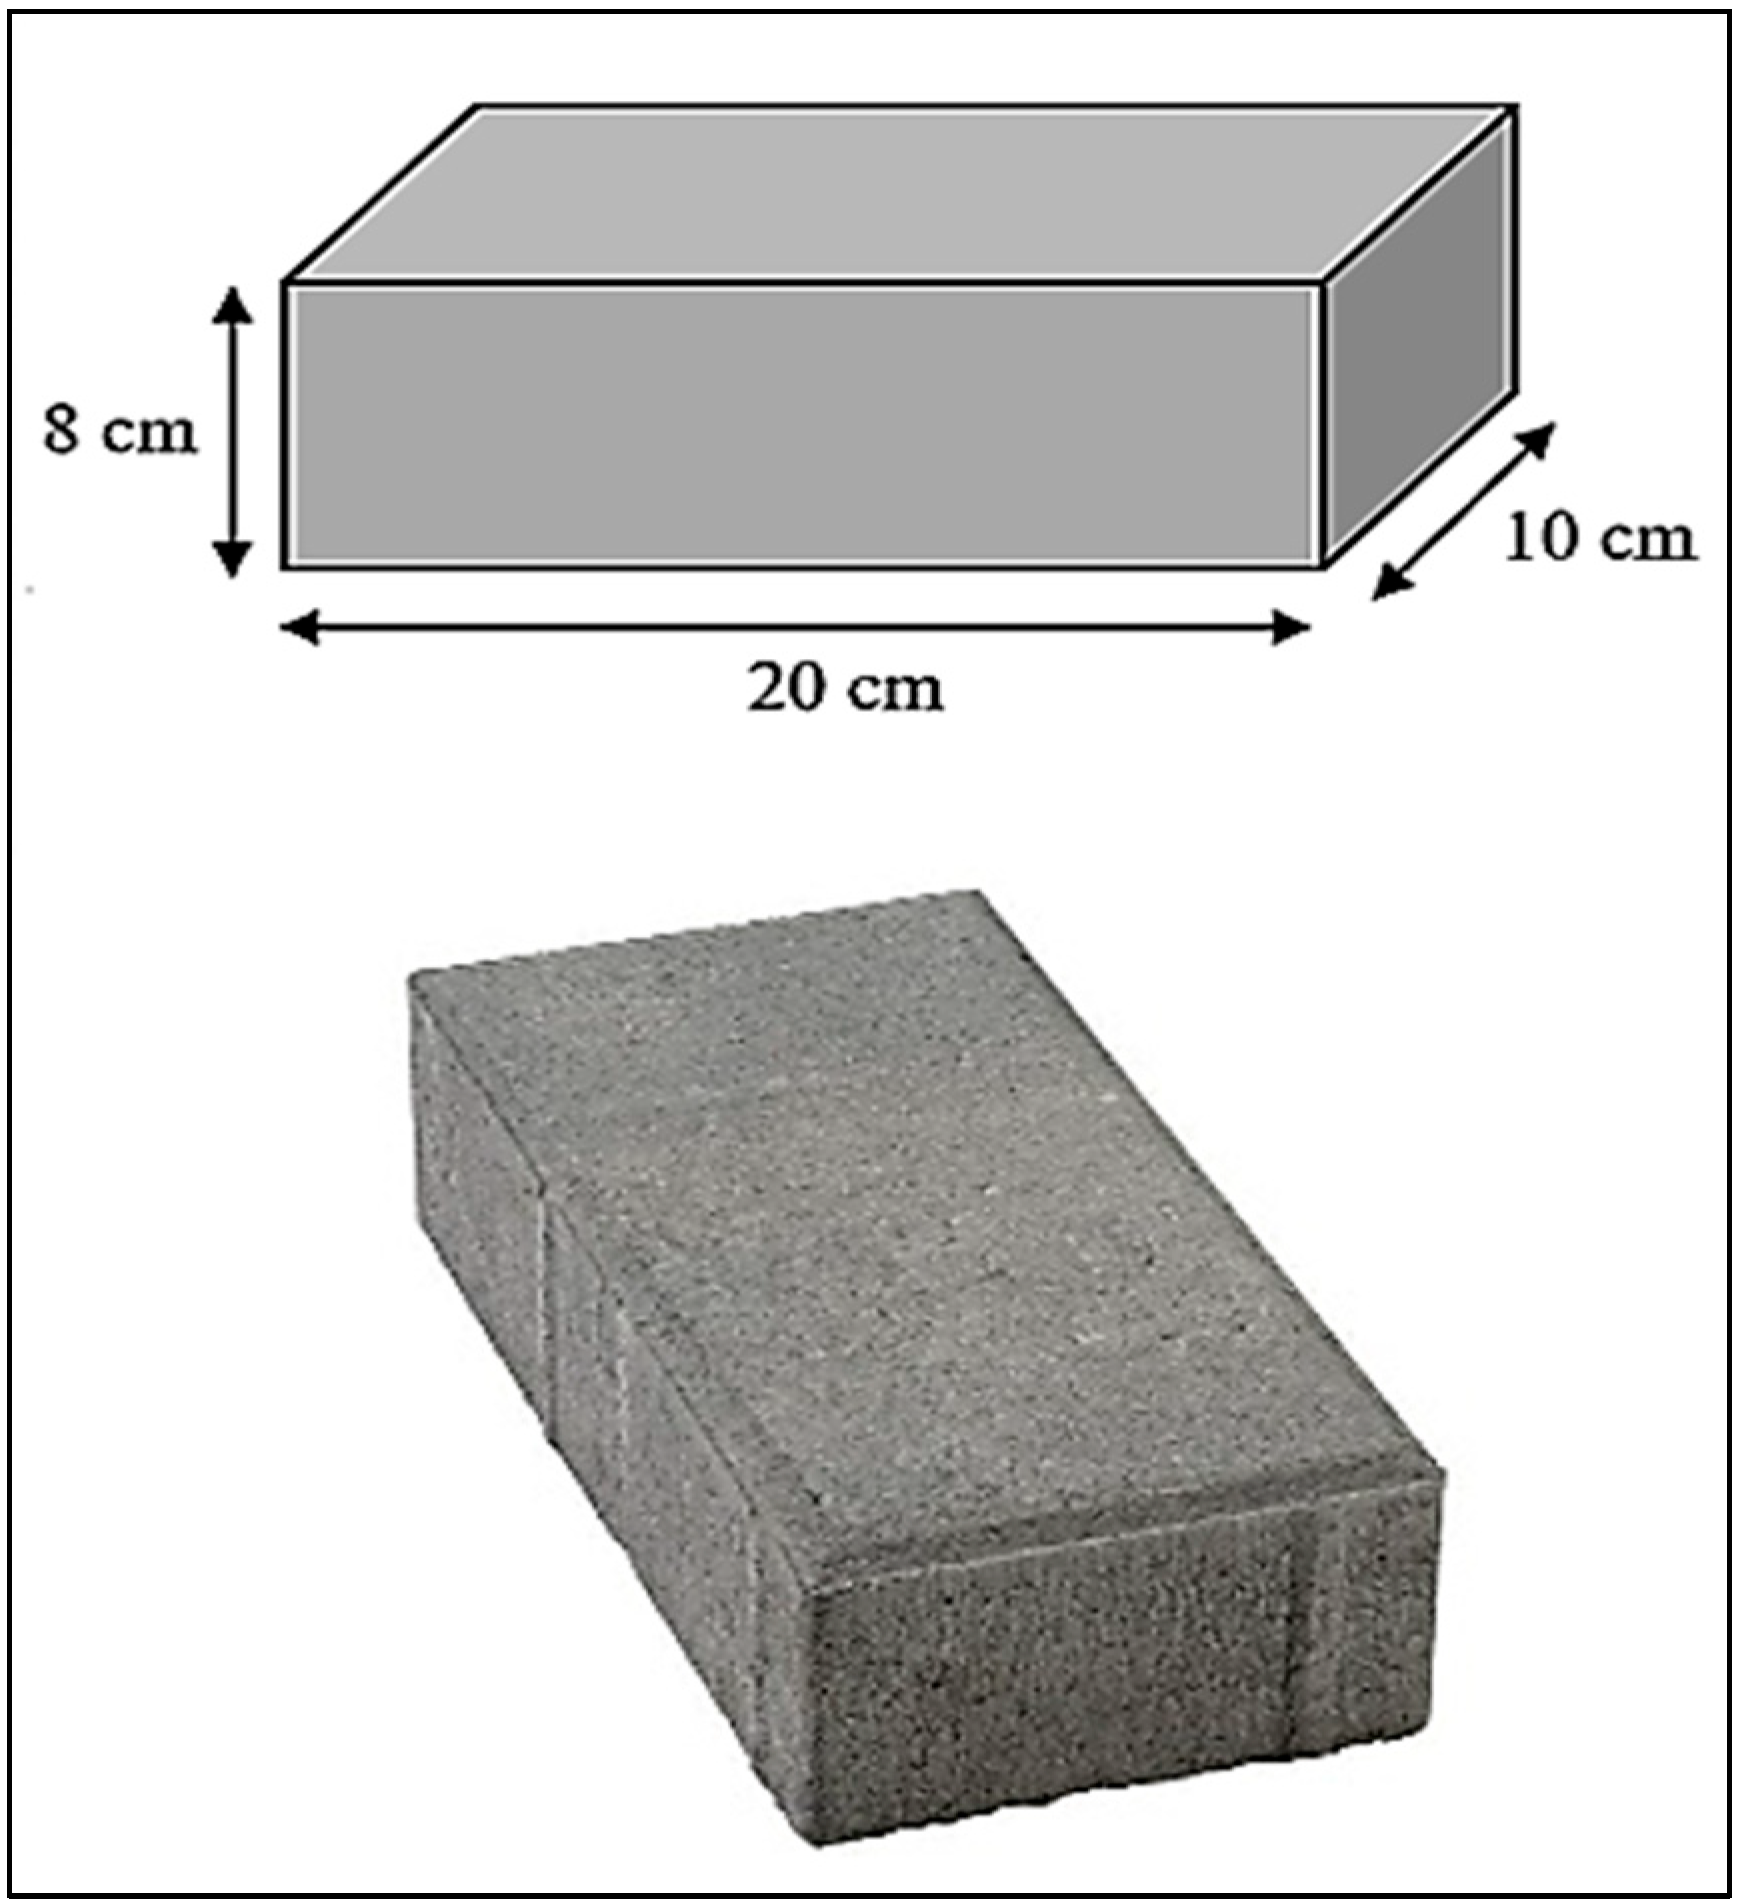
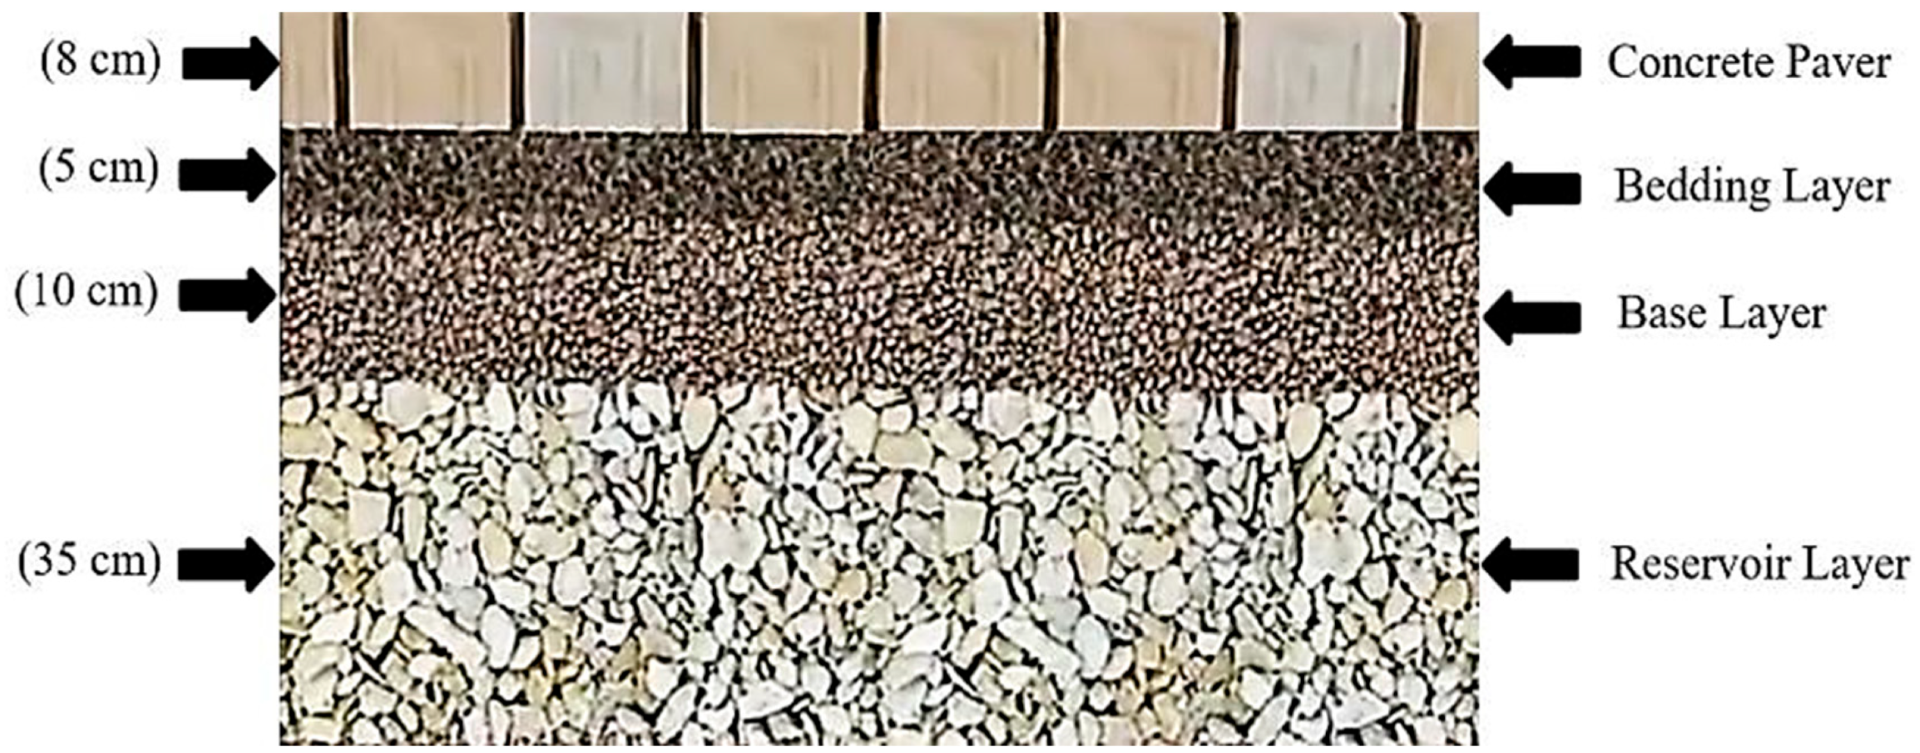
A surface concrete paver of PICP is a type of paving system that allows water to permeate through the surface and into the ground, rather than running off into stormwater systems. Concrete pavers are impermeable; the permeable aggregate between the block joints confers this characteristic. The thickness of the pavers is selected at 8 cm for pedestrian and vehicular zones. For heavy-duty applications, thicker blocks of 10 cm are employed. The surface square meter of concrete pavers is approximately occupied by 50 blocks weighing about 4.30 kg each. The adopted surface dimensions of the concrete paver and the physical characteristics are displayed in Figure 10 and Table 2.
2.3.2. The Aggregate That Fills the Joints—ASTM No. 8 or 9
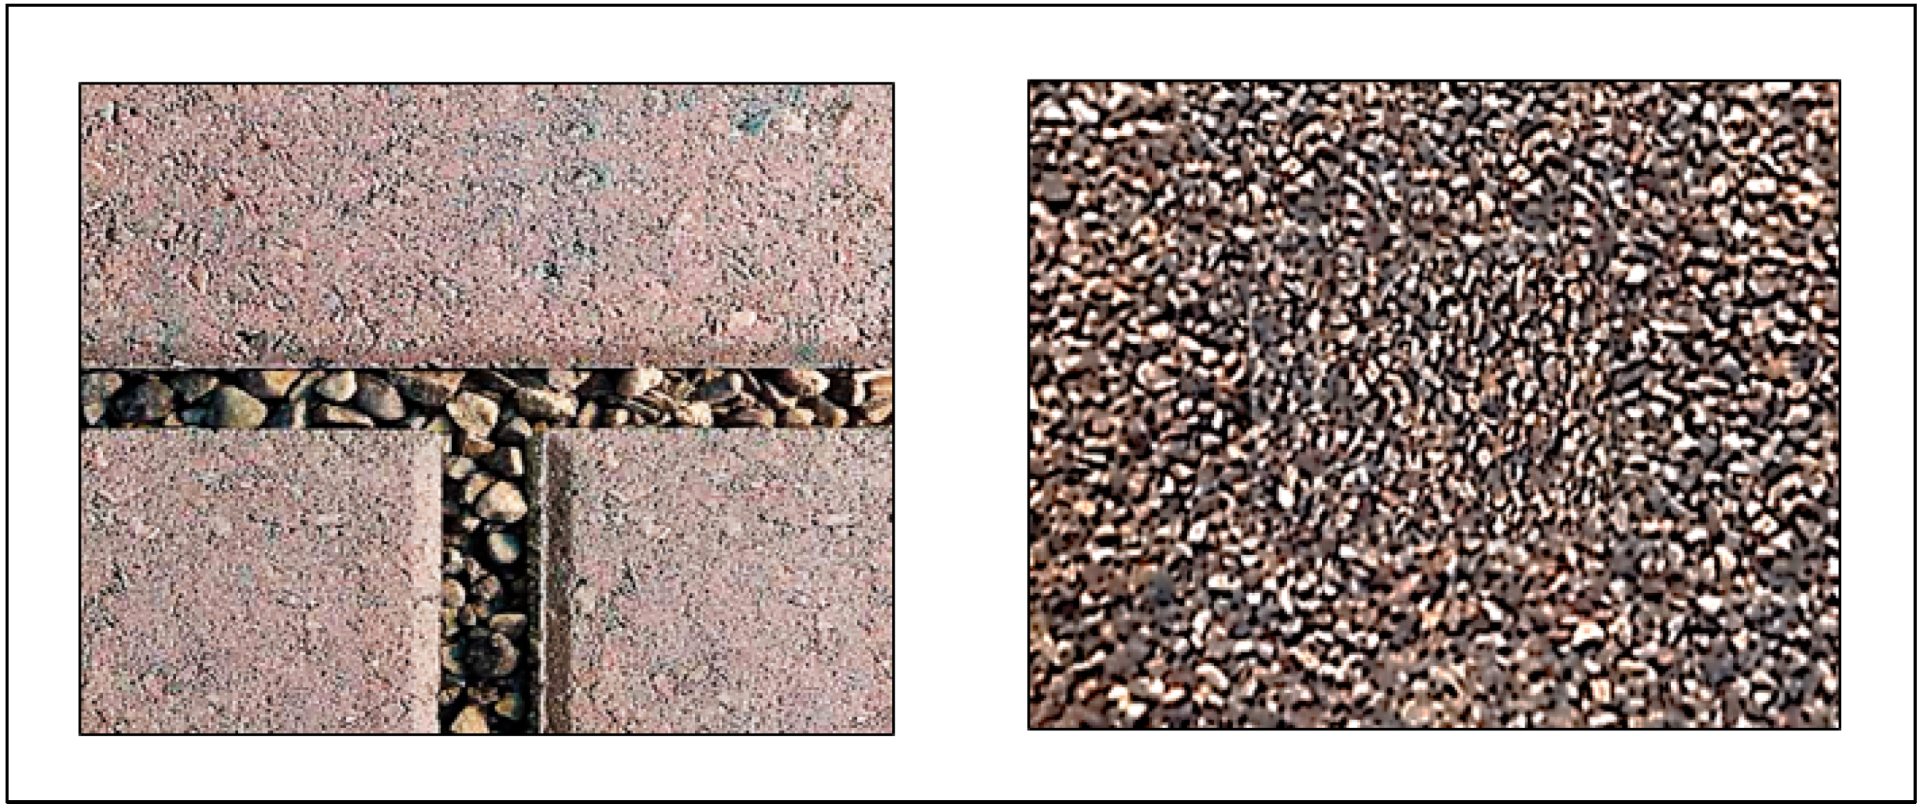
The spacing of the joints was selected at 10 mm between the pavers, as shown below in Figure 11, which is the middle value between the recommended range (6–13 mm) for achieving a minimum of 2540 mm/h surface runoff infiltration. The adopted aggregate to fill the gaps between the joints was a chipped, angular, and crushed type (6 mm), as shown in Figure 11, which served as an initial filter course in capturing debris. In addition, the aggregate between the joints strengthens the bond between the concrete blocks.
2.3.3. Bedding Layer—ASTM No. 8
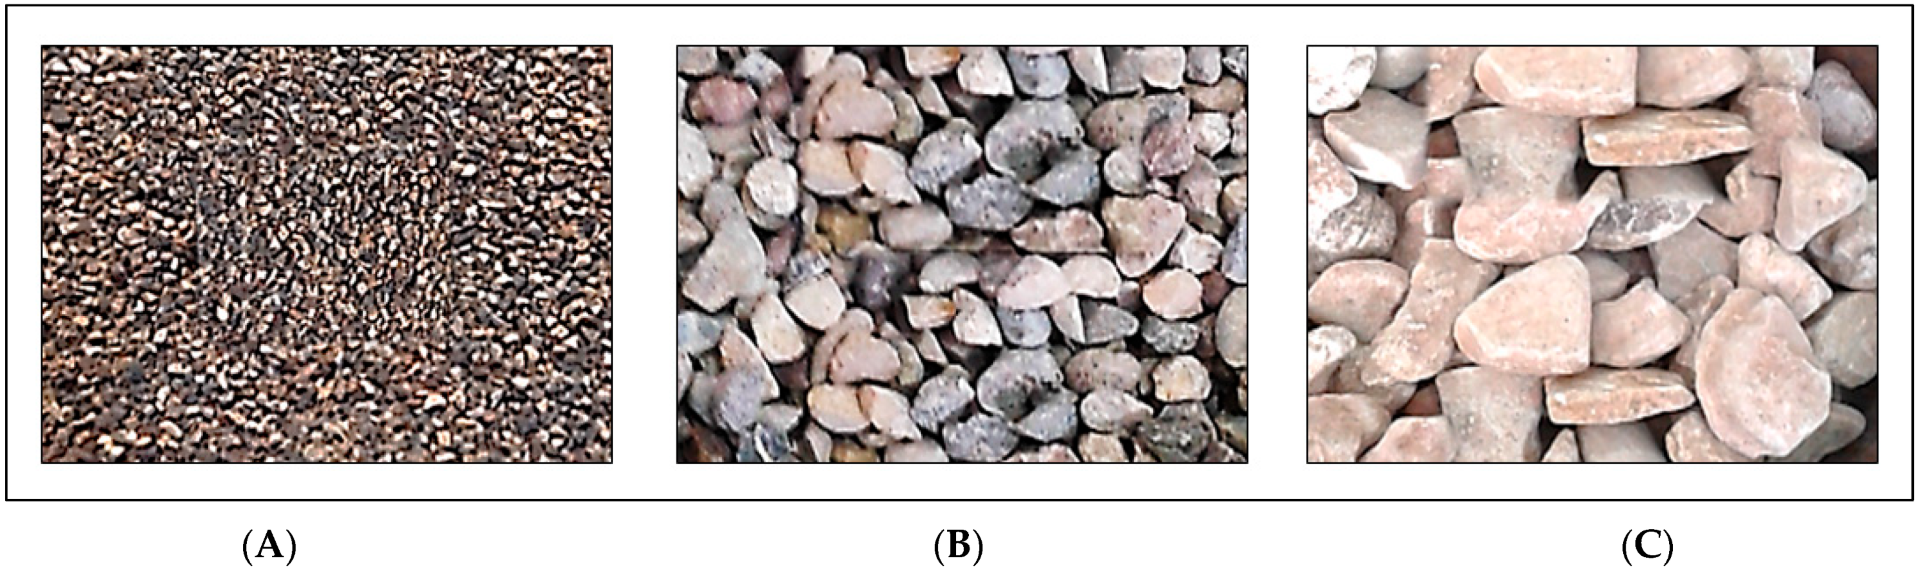
A bedding layer is a layer of material that is placed underneath a PICP system to provide a stable base for the PICP to rest on. The ASTM No. 8 specification includes requirements for the bedding layer, such as thickness, compaction, and drainage. The conducted thickness of this layer is 5 cm, which was selected to provide a firm foundation for the concrete pavers. The selected aggregate for constructing this layer consisted of small-sized chipped and angular stones with an open gradation, as shown in Figure 12. The used aggregate was well washed and cleaned so that water could soak in quickly at a rate of more than 12,700 mm/h.
2.3.4. Base Layer—ASTM No. 57
A base layer is a layer of material that is placed underneath the bedding layer in a PICP system. The ASTM No. 57 specification includes requirements for the size, shape, and gradation of the coarse aggregate used in the base layer, as well as the maximum allowable amount of fines (small particles) that can be present in the aggregate. The base layer is at least 10 cm in thickness and made with a standard openly graded crushed and angular aggregate (12.5–25 mm), as shown in Figure 12. The base layer acts as a transition zone between two layers, like tree roots, with an infiltration rate of over 12,700 mm/h.
2.3.5. Reservoir or Subbase Layer—ASTM No. 2
The reservoir or subbase layer is the layer of material that is placed underneath the base layer in a PICP system.
The ASTM No. 2 specification includes requirements for the size, shape, and gradation of the coarse aggregate used in the reservoir or subbase layer, as well as the maximum allowable amount of fines (small particles) that can be present in the aggregate. The reservoir or subbase layer is usually constructed using an open gradation of crushed and angular aggregate (50–63 mm), as shown in Figure 12, and its thickness is predicted depending on the structural and hydraulic design to achieve effective performance. This layer is a firm pillar for weak soils by increasing their stability. The rate of infiltration for this layer is over 12,700 mm/h.
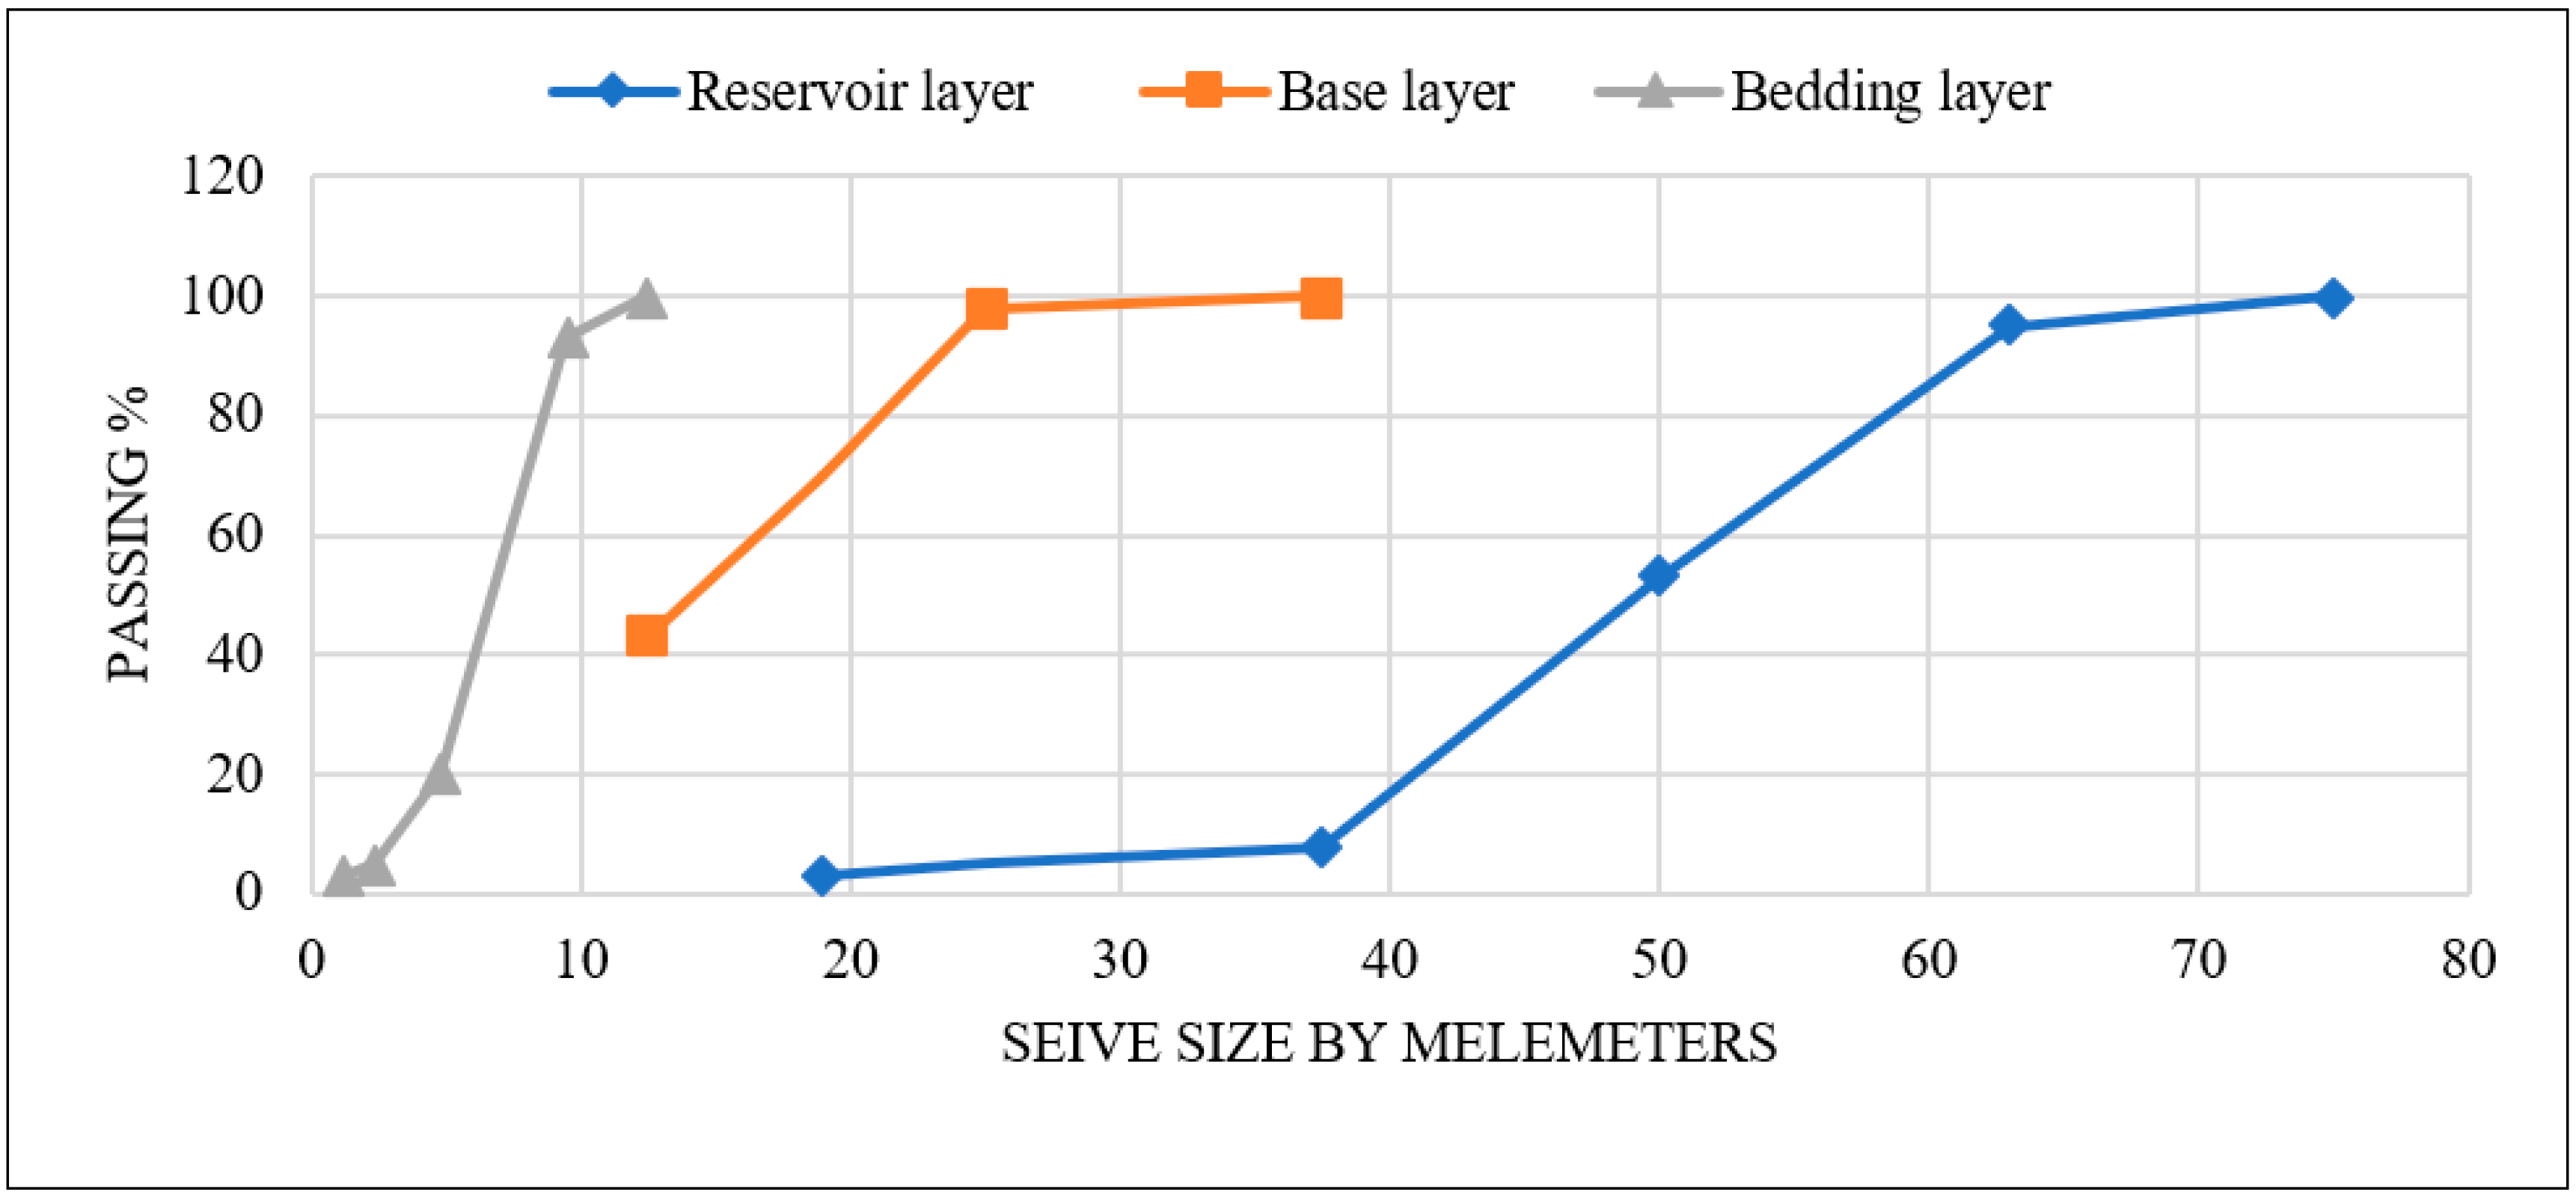
Well-known quarries in Iraq supply all the needed types of aggregate, which must be cleaned and double-washed to remove fine debris that could clog the interconnected voids. The adopted gradation of aggregate for the PICP layers was selected in keeping with ASTM D448 and is presented in Figure 13.
2.4. Determining the Thickness of the Reservoir Layer
Two design methods were conducted in this study, depending on the structural and hydraulic design to efficiently resist the anticipated traffic loads, as well as to temporarily preserve the infiltrated water.
2.4.1. Designing by Structural Method
This method varies, depending on the pavement type and the magnitude of anticipated loading conditions. The thickness of the reservoir layer must be adequately designed to withstand the applied loads and to perform as temporary water storage. In cases of weak underlying soils with a California Bearing Ratio (CBR) lower than 4%, additional compacting may be required to achieve 95% of the standard Proctor density. The AASHTO 93 guidance for designing pavement structures [44] is the most consulted source for transportation design.
Construction materials were examined and totaled to see if they suited the structural number (SN) of the design, in order to determine the thickness of the layers required for permeable pavement. The structural number (SN) was predicted using Equation (1):
where: a1, a2, a3: are the layer coefficients that can be determined from Table 3, in accordance with AASHTO 93.
D1, D2, D3: layer thicknesses for paving, base, and reservoir or subbase layers.
2.4.2. Designing by the Hydraulic Method
A reservoir layer of permeable pavement must be designed to store the stormwater retention volume (SWRv). An adequate calculation must be made, considering the volume of the water stored in the pavements in terms of how much water soaks into the ground and how much water flows out through any underdrains [45]. Equation (2) was used to calculate the depth of the reservoir or subbase layer.
dP = The layer of reservoir or subbase depth in ft.
DA = Permeable pavement surface or drainage contributing area (ft2).
Ap = Surface area of permeable pavement (ft2).
P = Rain-falling depth for the SWRv (ft).
Rvi = Impermeable cover coefficient of runoff (0.95).
tf = Filling time by day (approximately 2 h).
i = Subgrade soils infiltration rate at field (ft/day).
ηr = Reservoir porosity (0.4)
The calculated reservoir depth (dP) using this method must be checked with (dP-Maximum) according to Equation (3):
td = Time of reservoir draindown (48 h).
The calculated depths in both structural and hydraulic design are provided in Table 4.
The selected depth of the reservoir layer is 35 cm in accordance with the structural design method, as shown in Figure 14.
2.5. Laying the Layers of PICP within the Steel Box
The sequence of permeable pavement layers inside the steel box of the simulator, as well as the mechanism of water infiltration, is demonstrated in Figure 15.
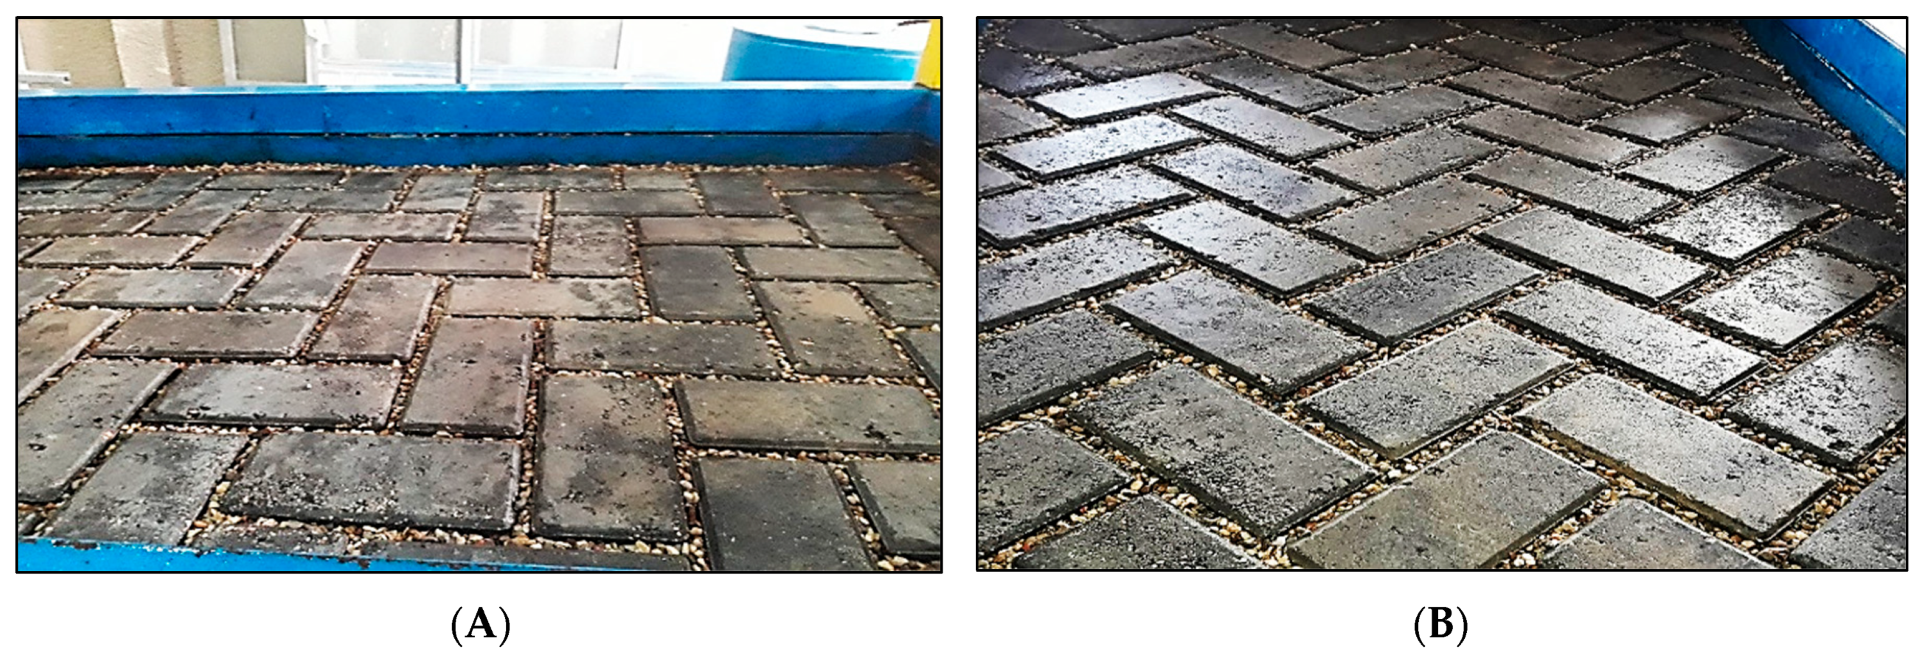
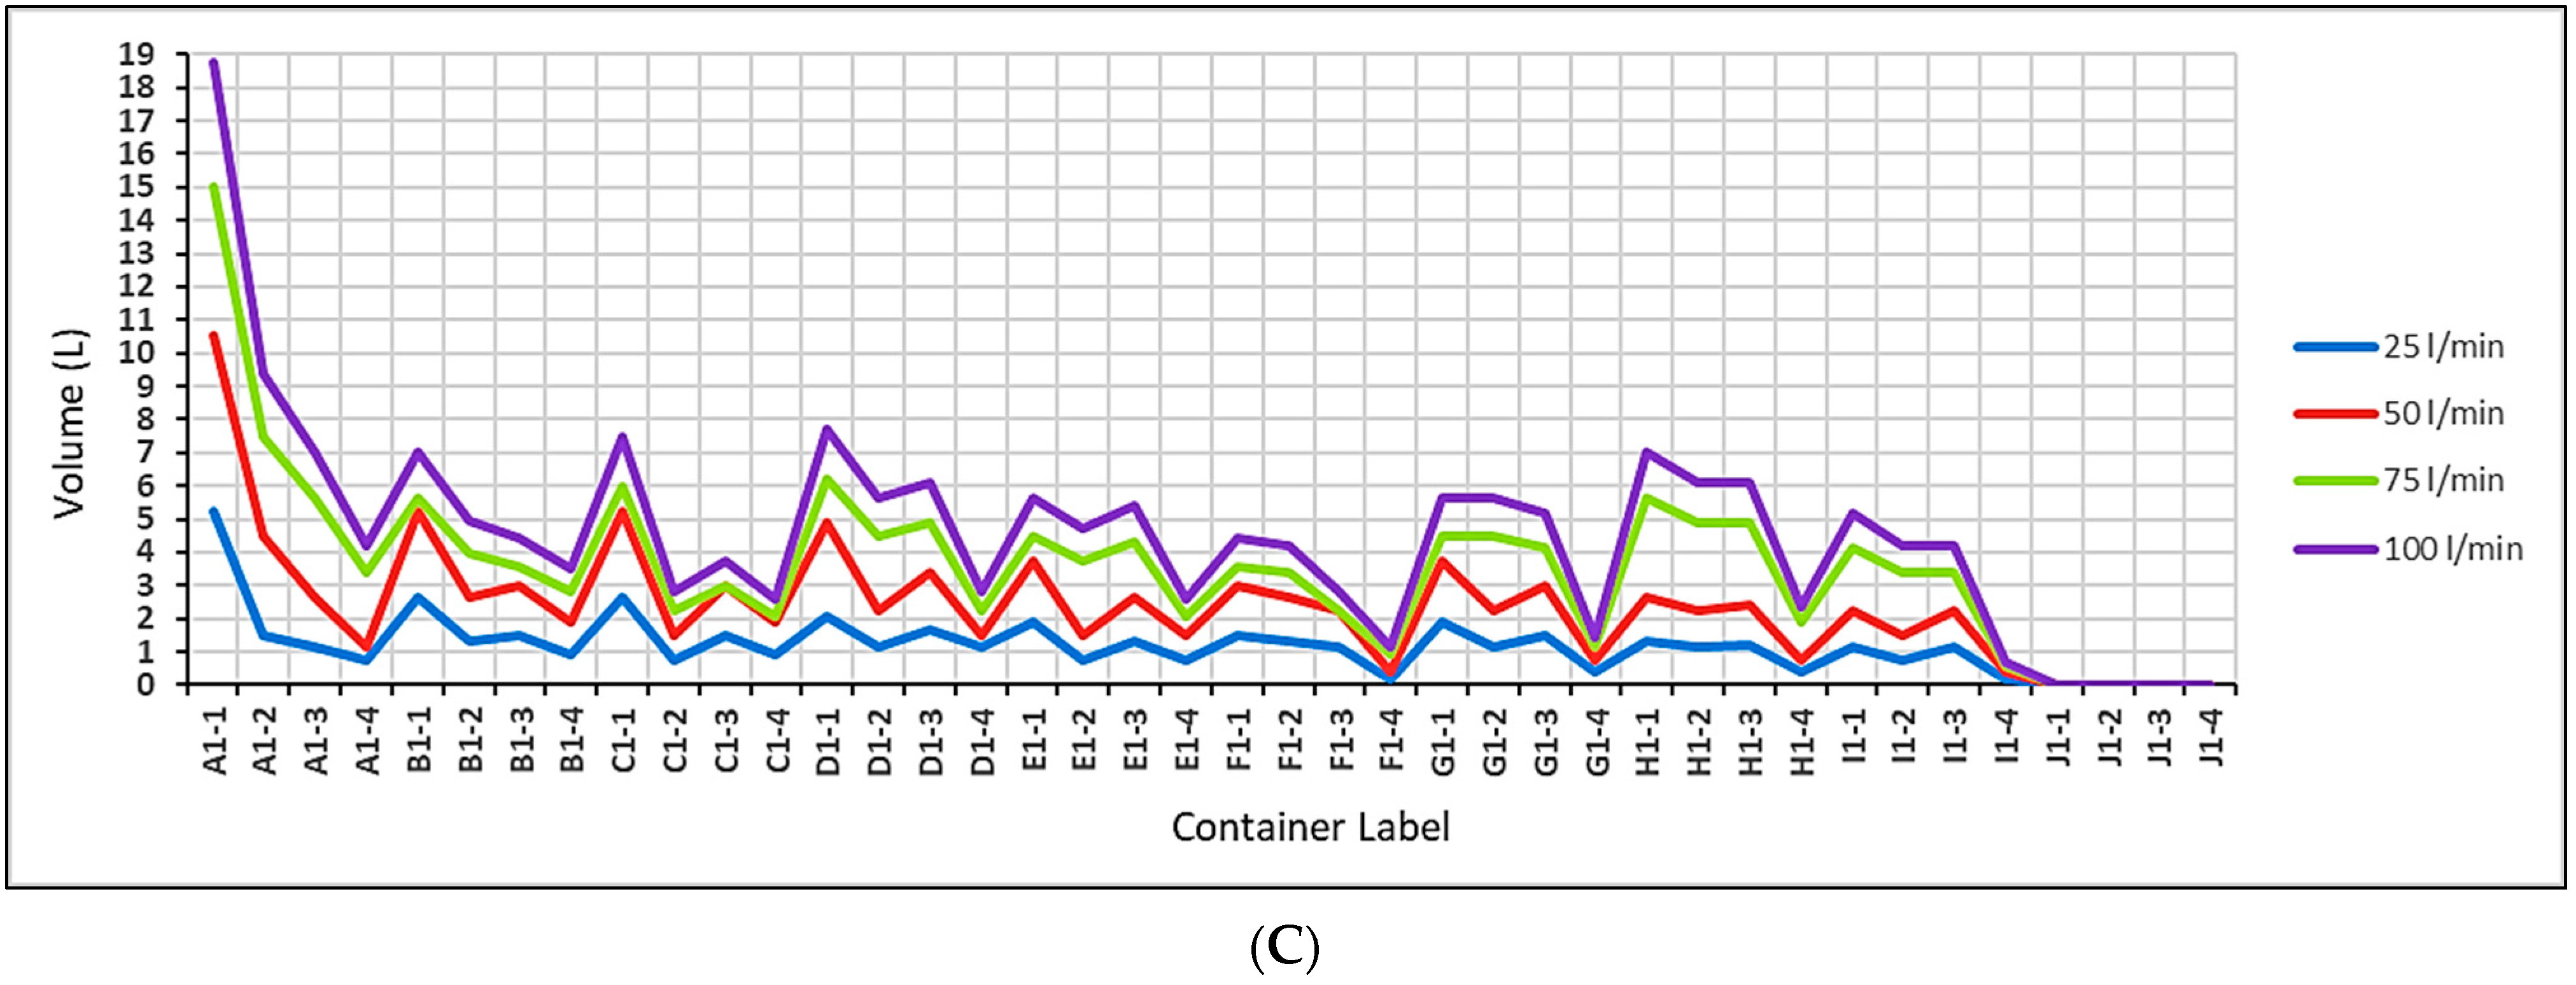
The rain fell through the simulator pipes at four intensities (25, 50, 75, and 100 L/min) to reveal the infiltration ratio through the layers of PICP with two different surface patterns, as shown in Figure 16. In addition, the geometric design of the paver’s surface was changed by applying different levels of longitudinal and side slopes. The conducted slopes in the long direction of the paver were 0, 2.5, 5, and 7.5%, while the slopes in the transverse direction were 0, 2.5, and 5%. The operating time of the simulator was 120 s for rainfall, as shown in Figure 17.
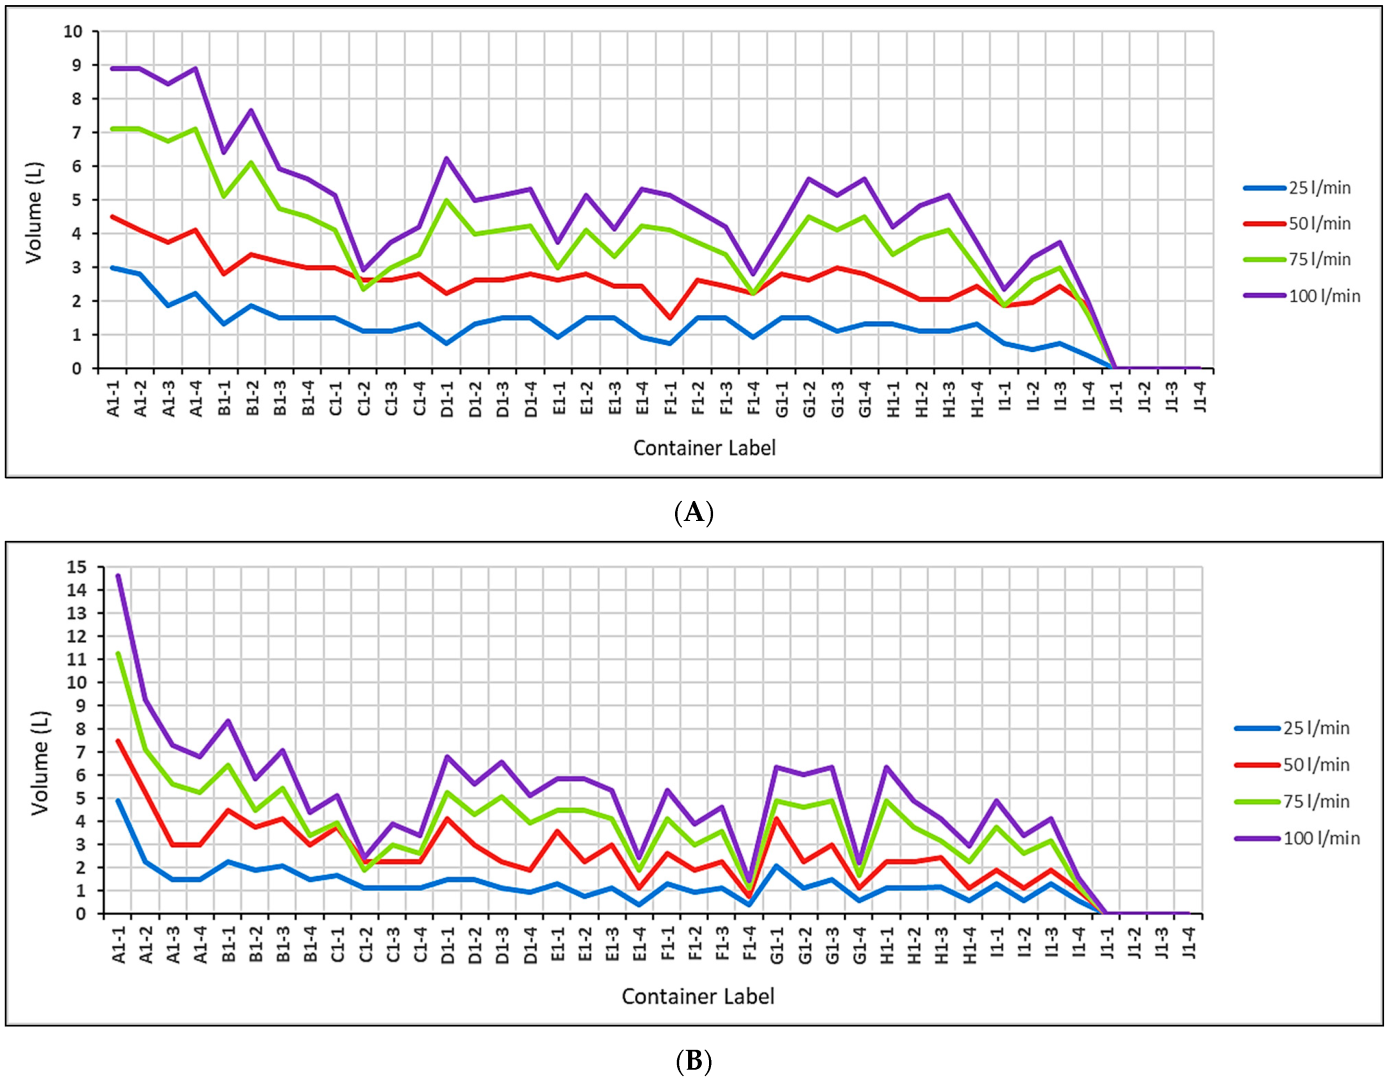
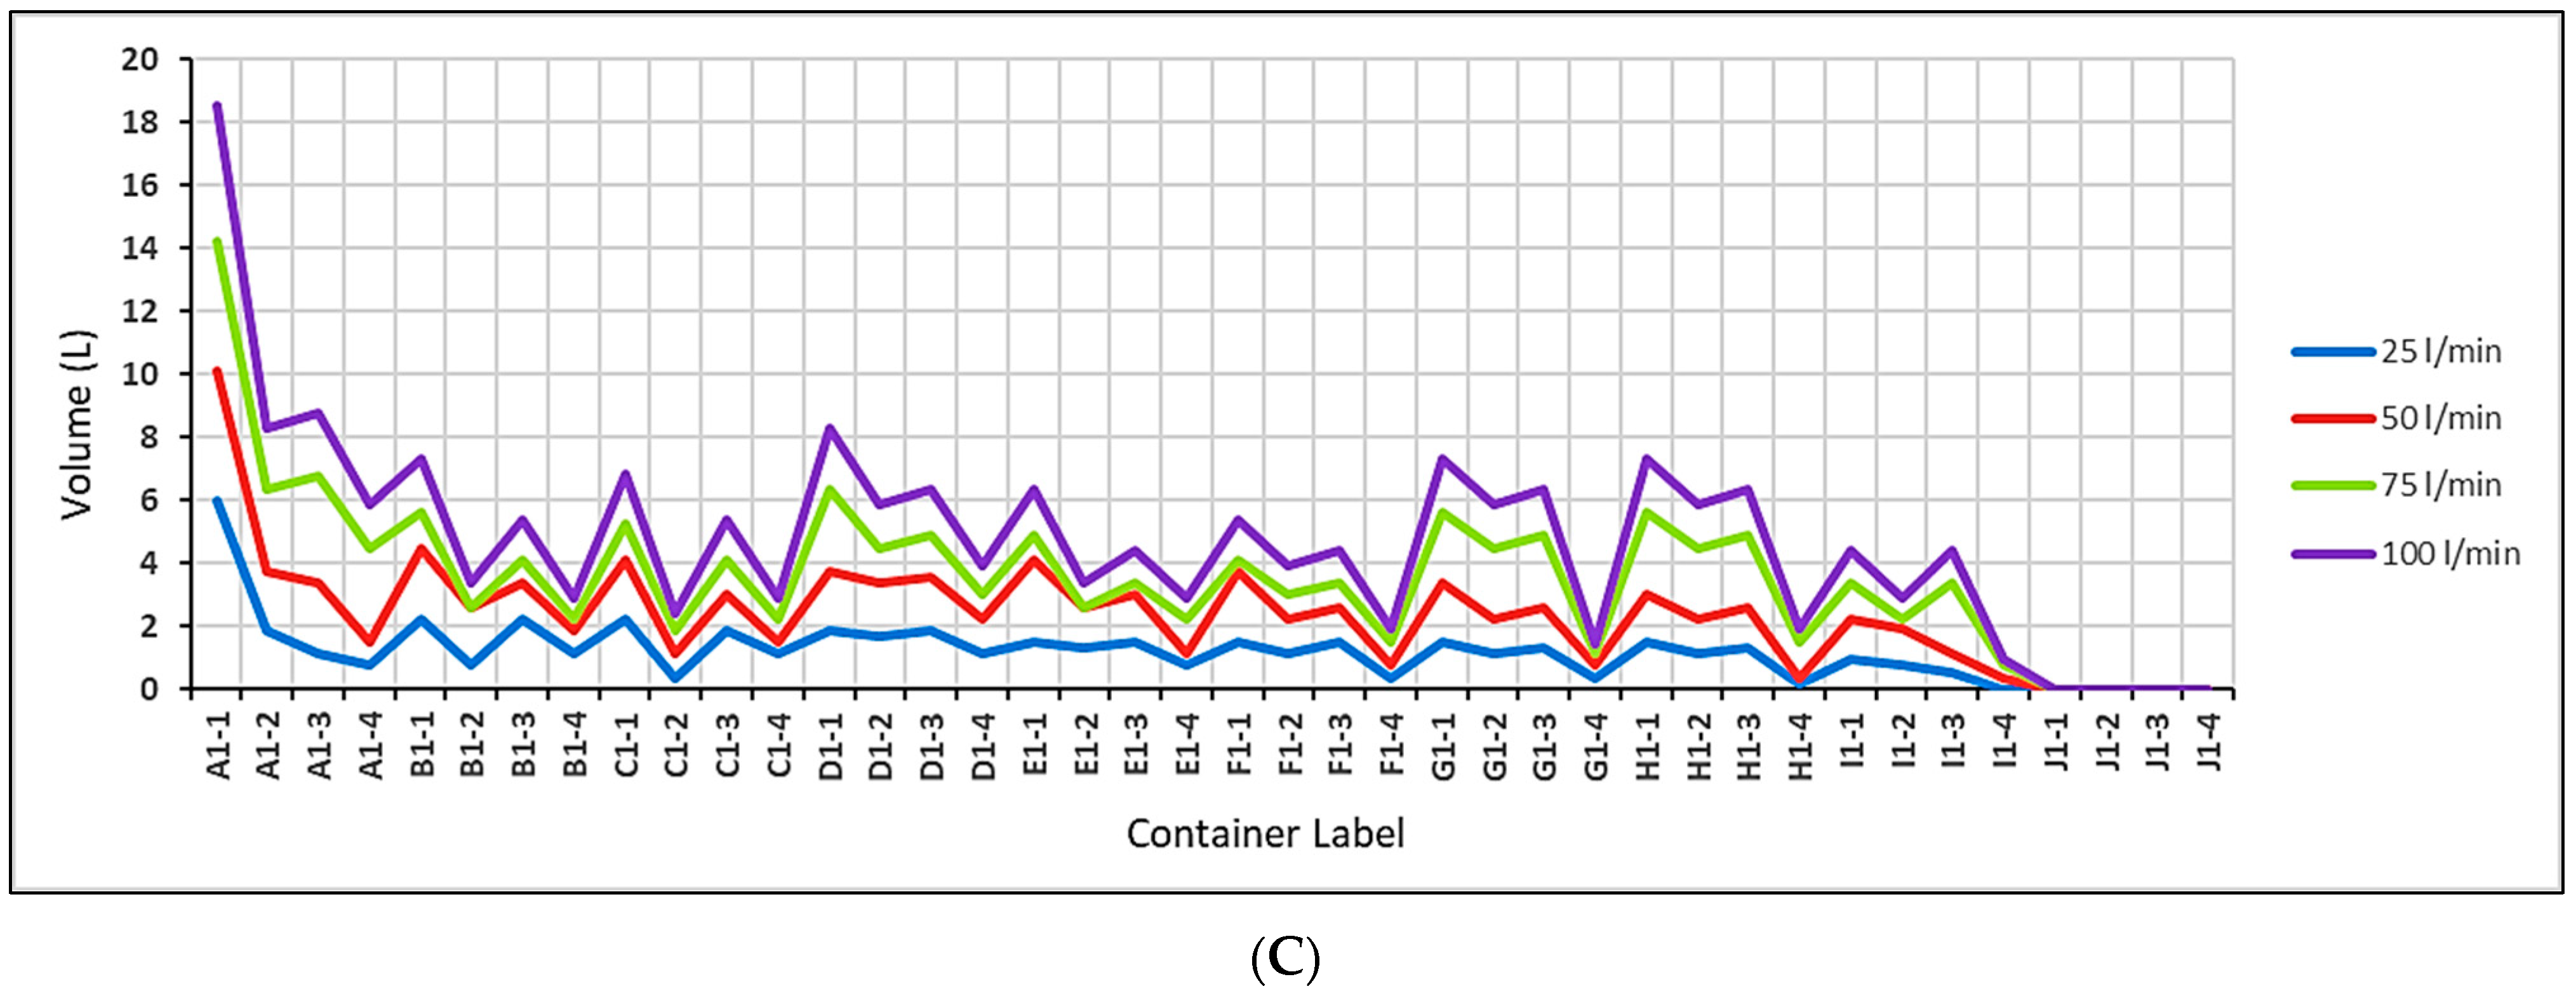
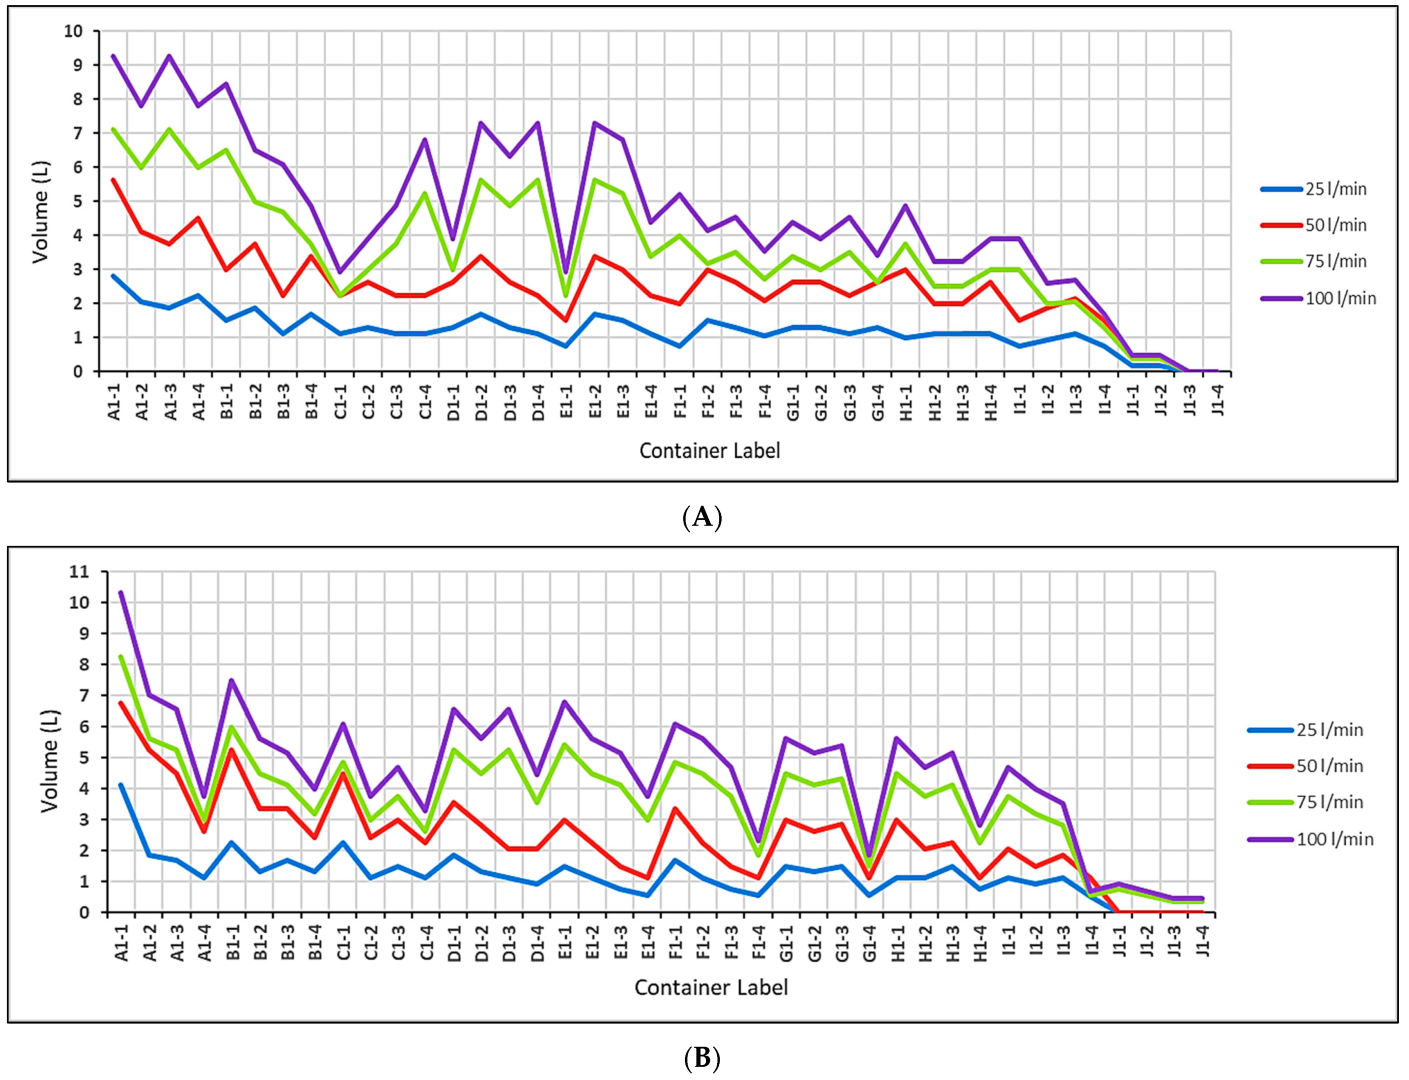
The water that seeps through the compacted layers of PICP was collected beneath the steel box of the simulator in specific containers (40 ones). Furthermore, the used containers were labeled successively, as shown in Figure 18A,B, starting with the first row, from A1-1, B1-1, C1-1, D1-1, E1-1, F1-1, G1-1, H1-1, I1-1, and J1-1, the second row from A1-2 to J1-2, the third row from A1-3 to J1-3, and the fourth row from A1-4 to J1-4. Uninfiltrated runoff was gathered or collected in an iron content which was located at the short side of the apparatus base.
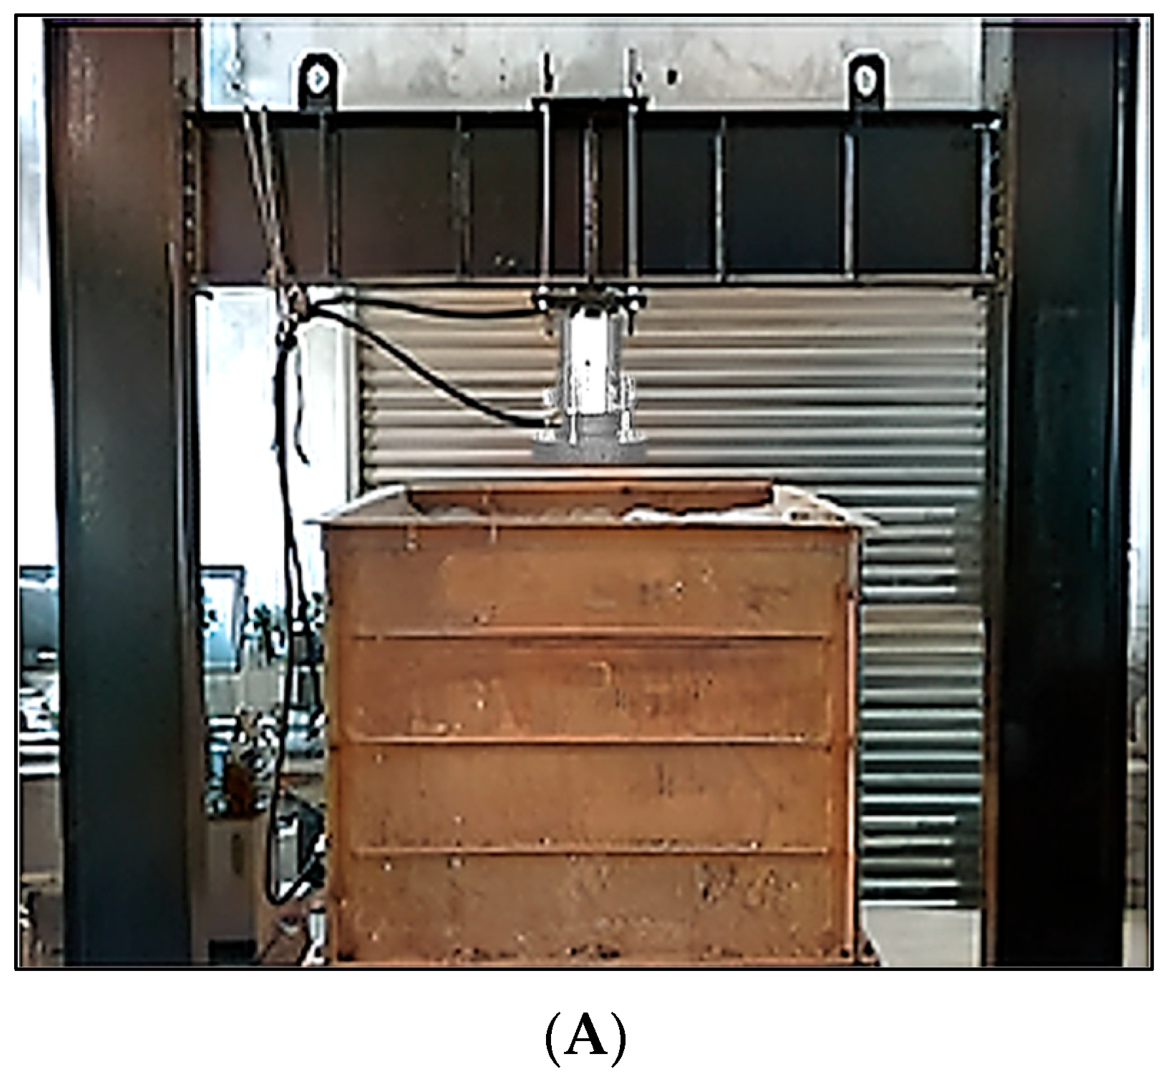
2.6. PICP Static Load Test
The performed test was carried out in the lab by using a fabricated scale model composed of an iron box similar to the dimensions of the steel simulator’s box (65 cm height × 1.5 m length × 1.0 m width), as shown in Figure 19. PICP layers were laid out in the box in a manner similar to that in the simulator and in the same sequence. By employing a hydraulic compressor, a normal force of 50 kN was applied through a 250 mm circular plate in the middle of the pavement’s surface. The grown deflection in both surface patterns of PICP was measured using two gauges with 0.01 mm sensitivity, which were positioned 150 mm from the middle center of the applied load.
3. Results and Discussion
3.1. Water Infiltration through Both 45° and 90° Herringboned Surface Patterns
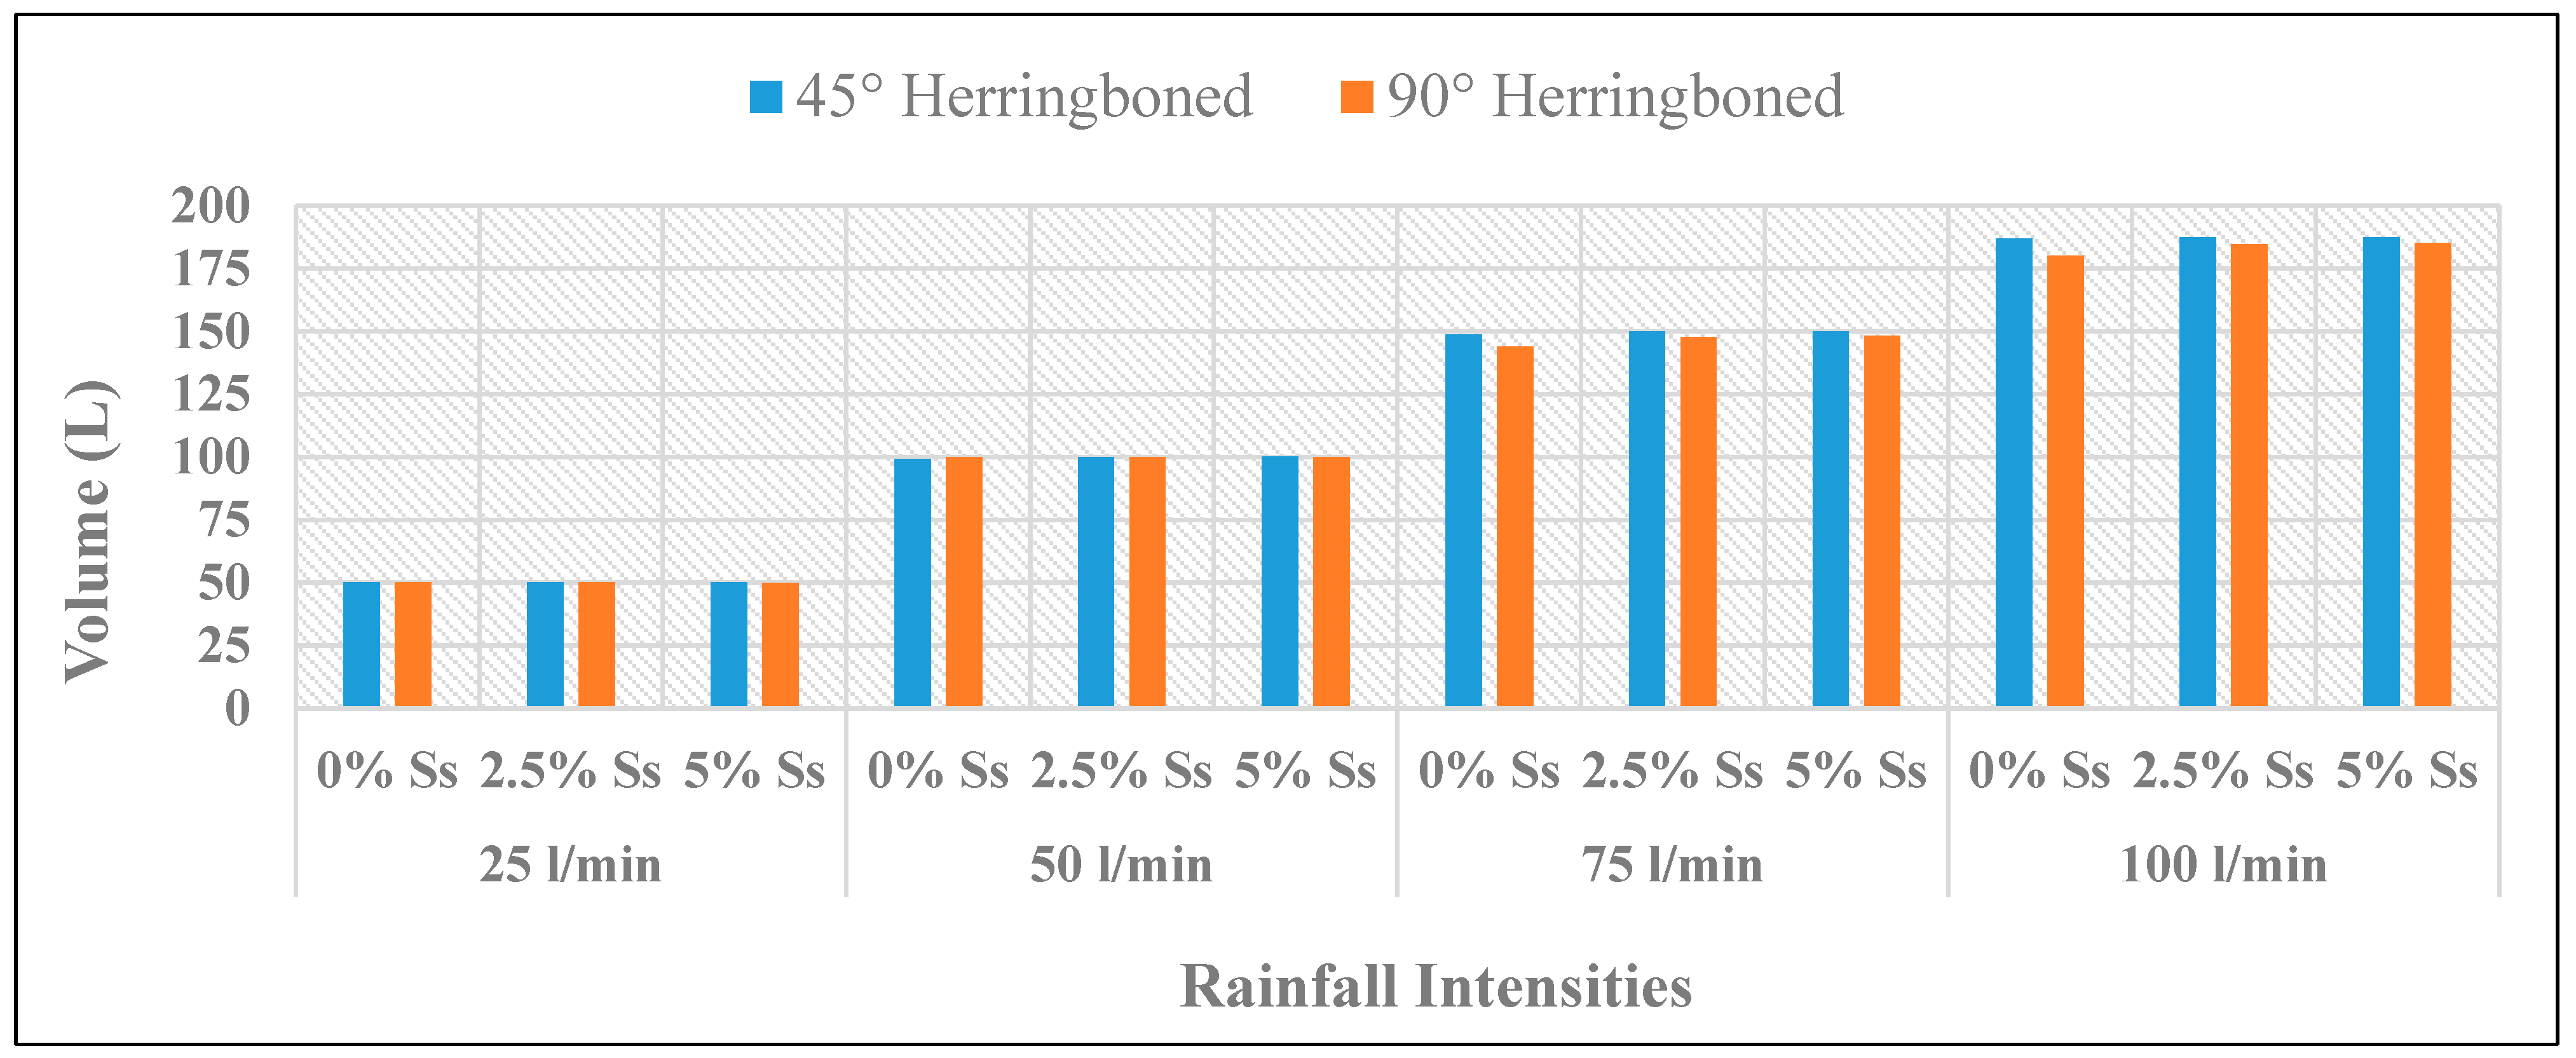
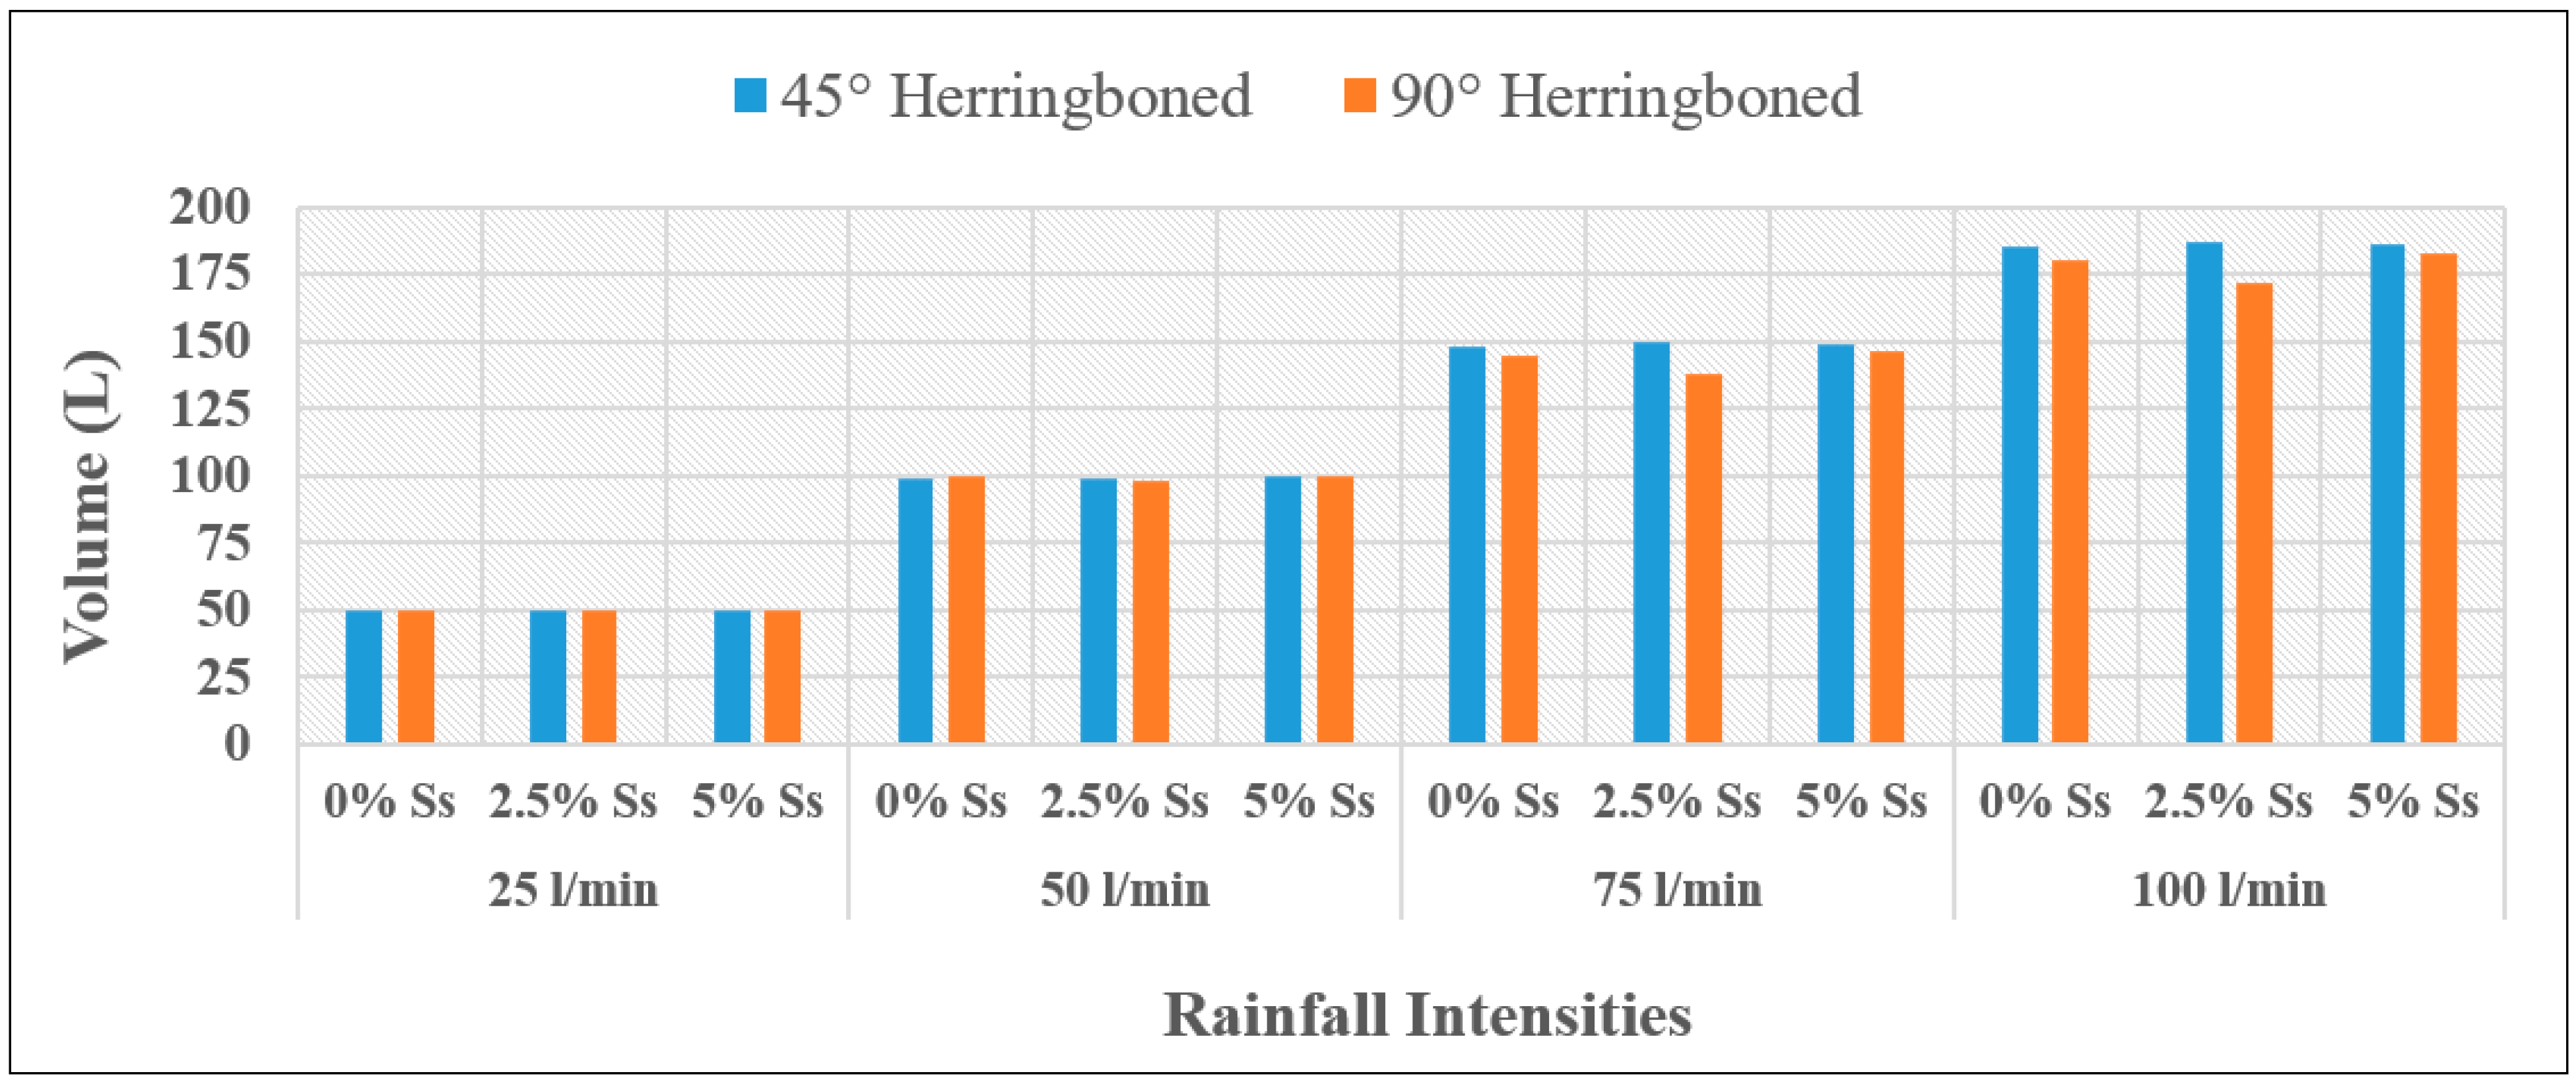
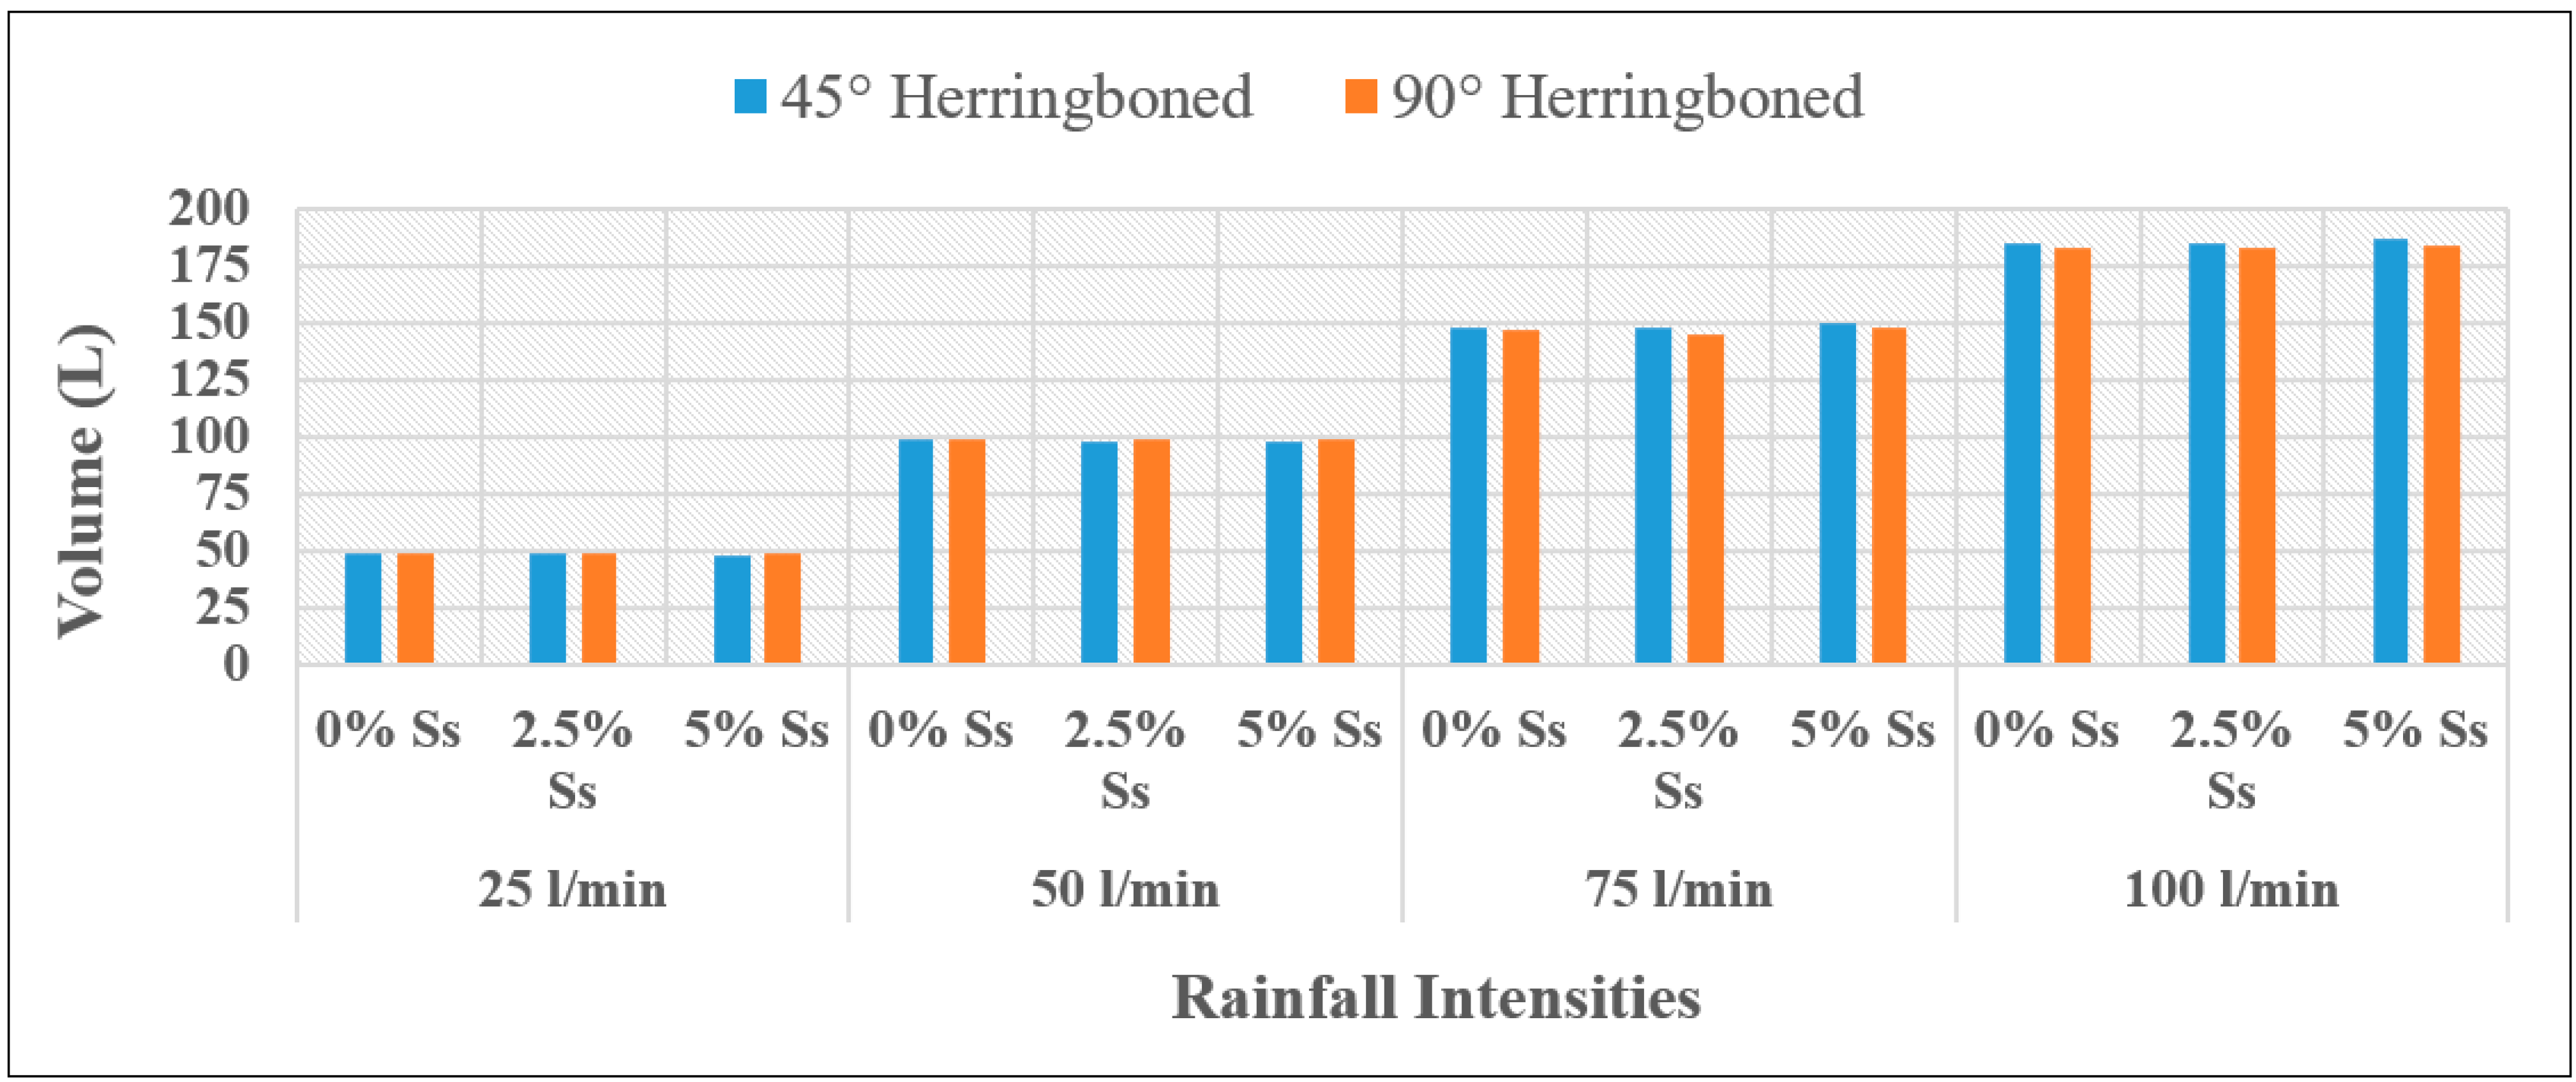
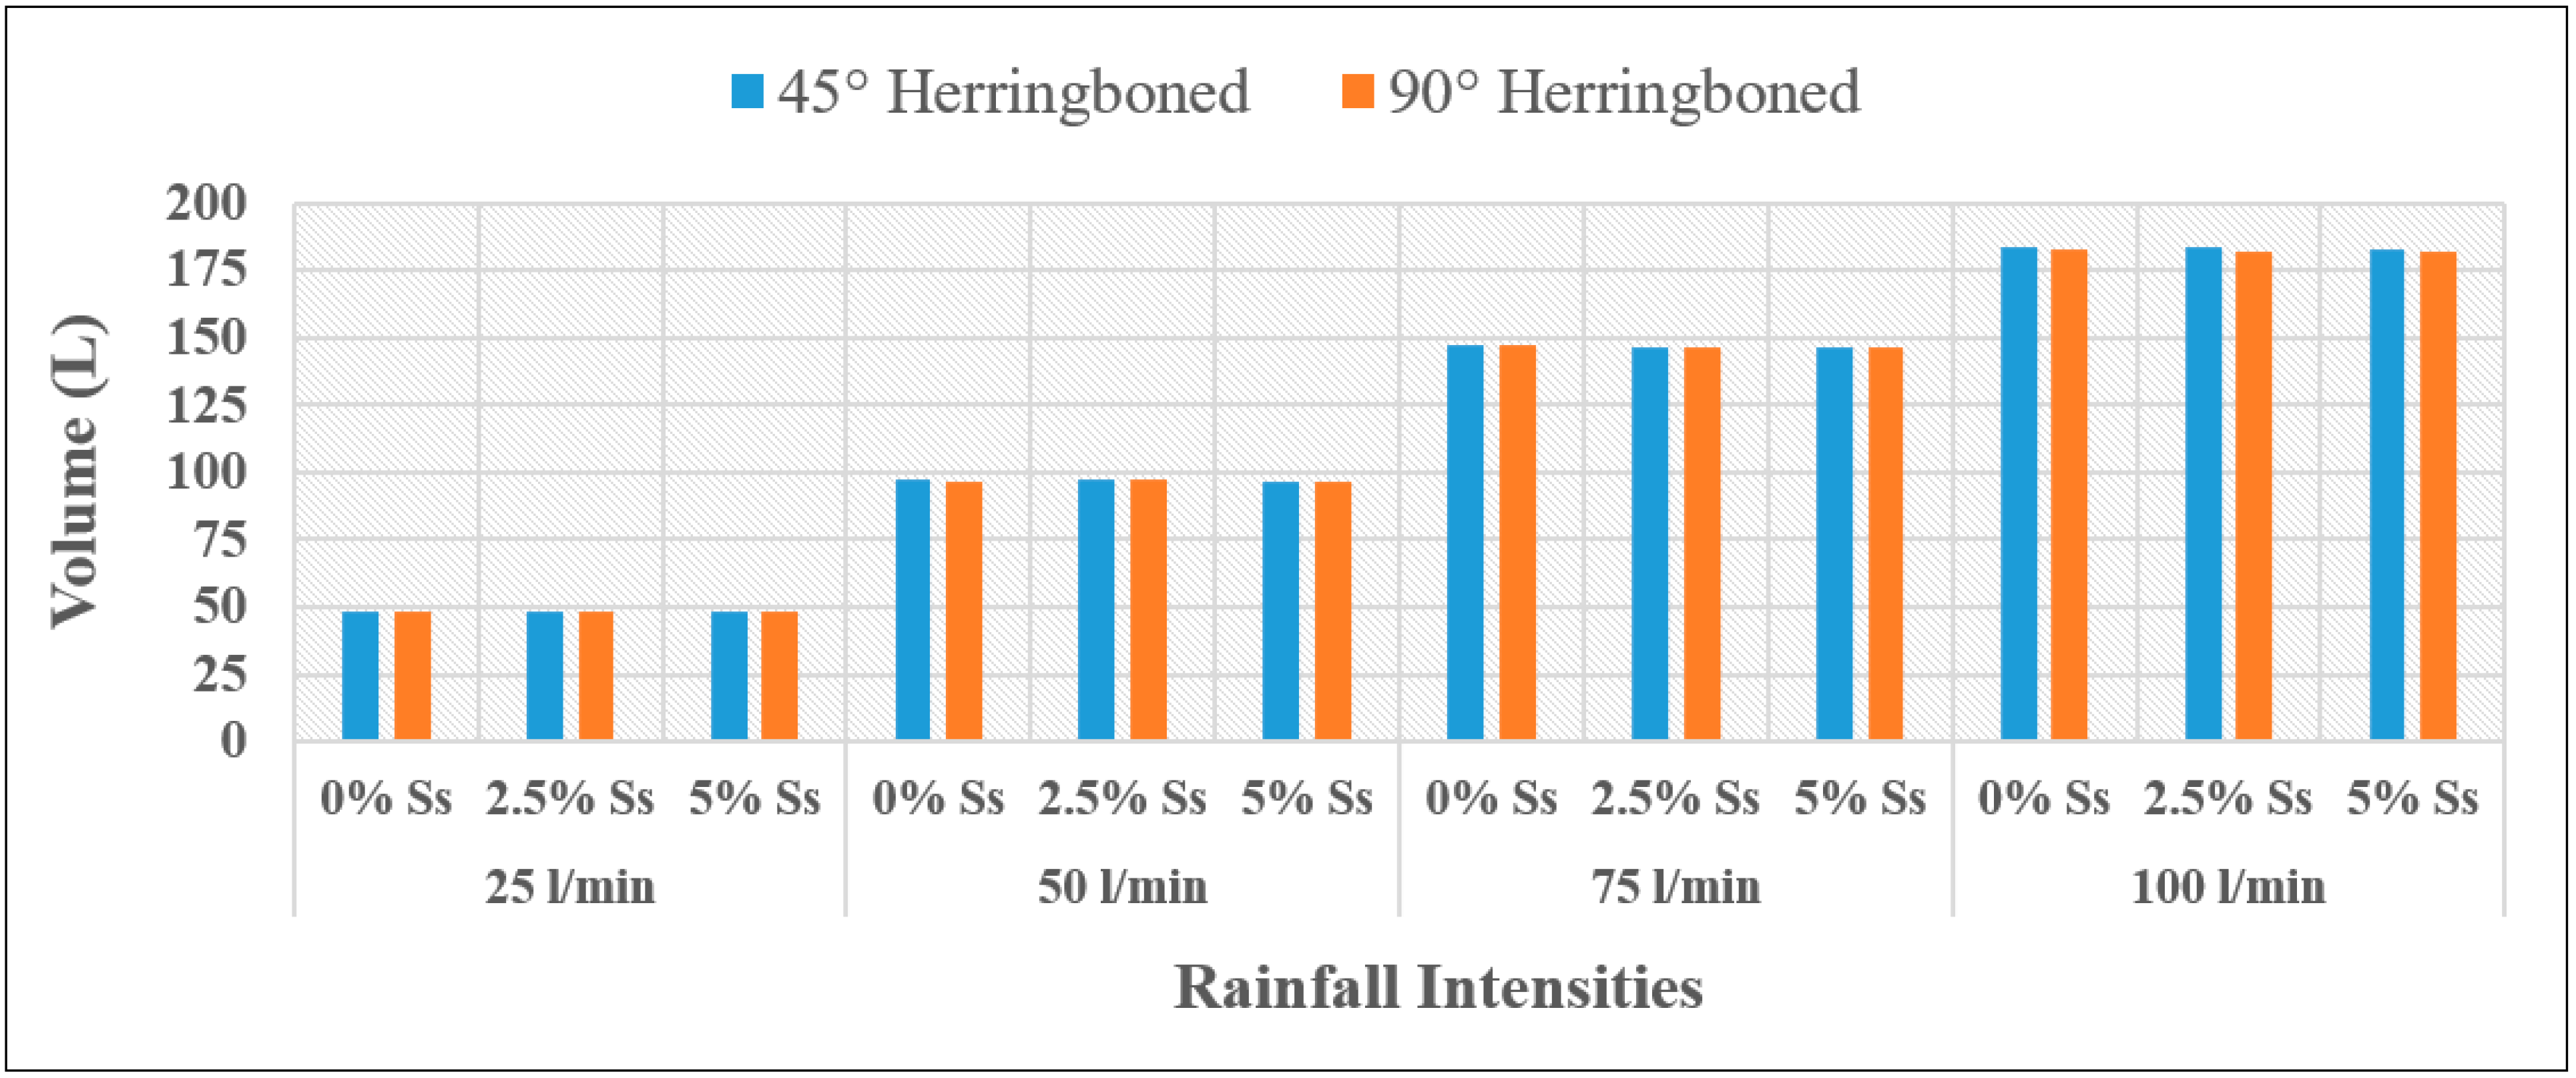
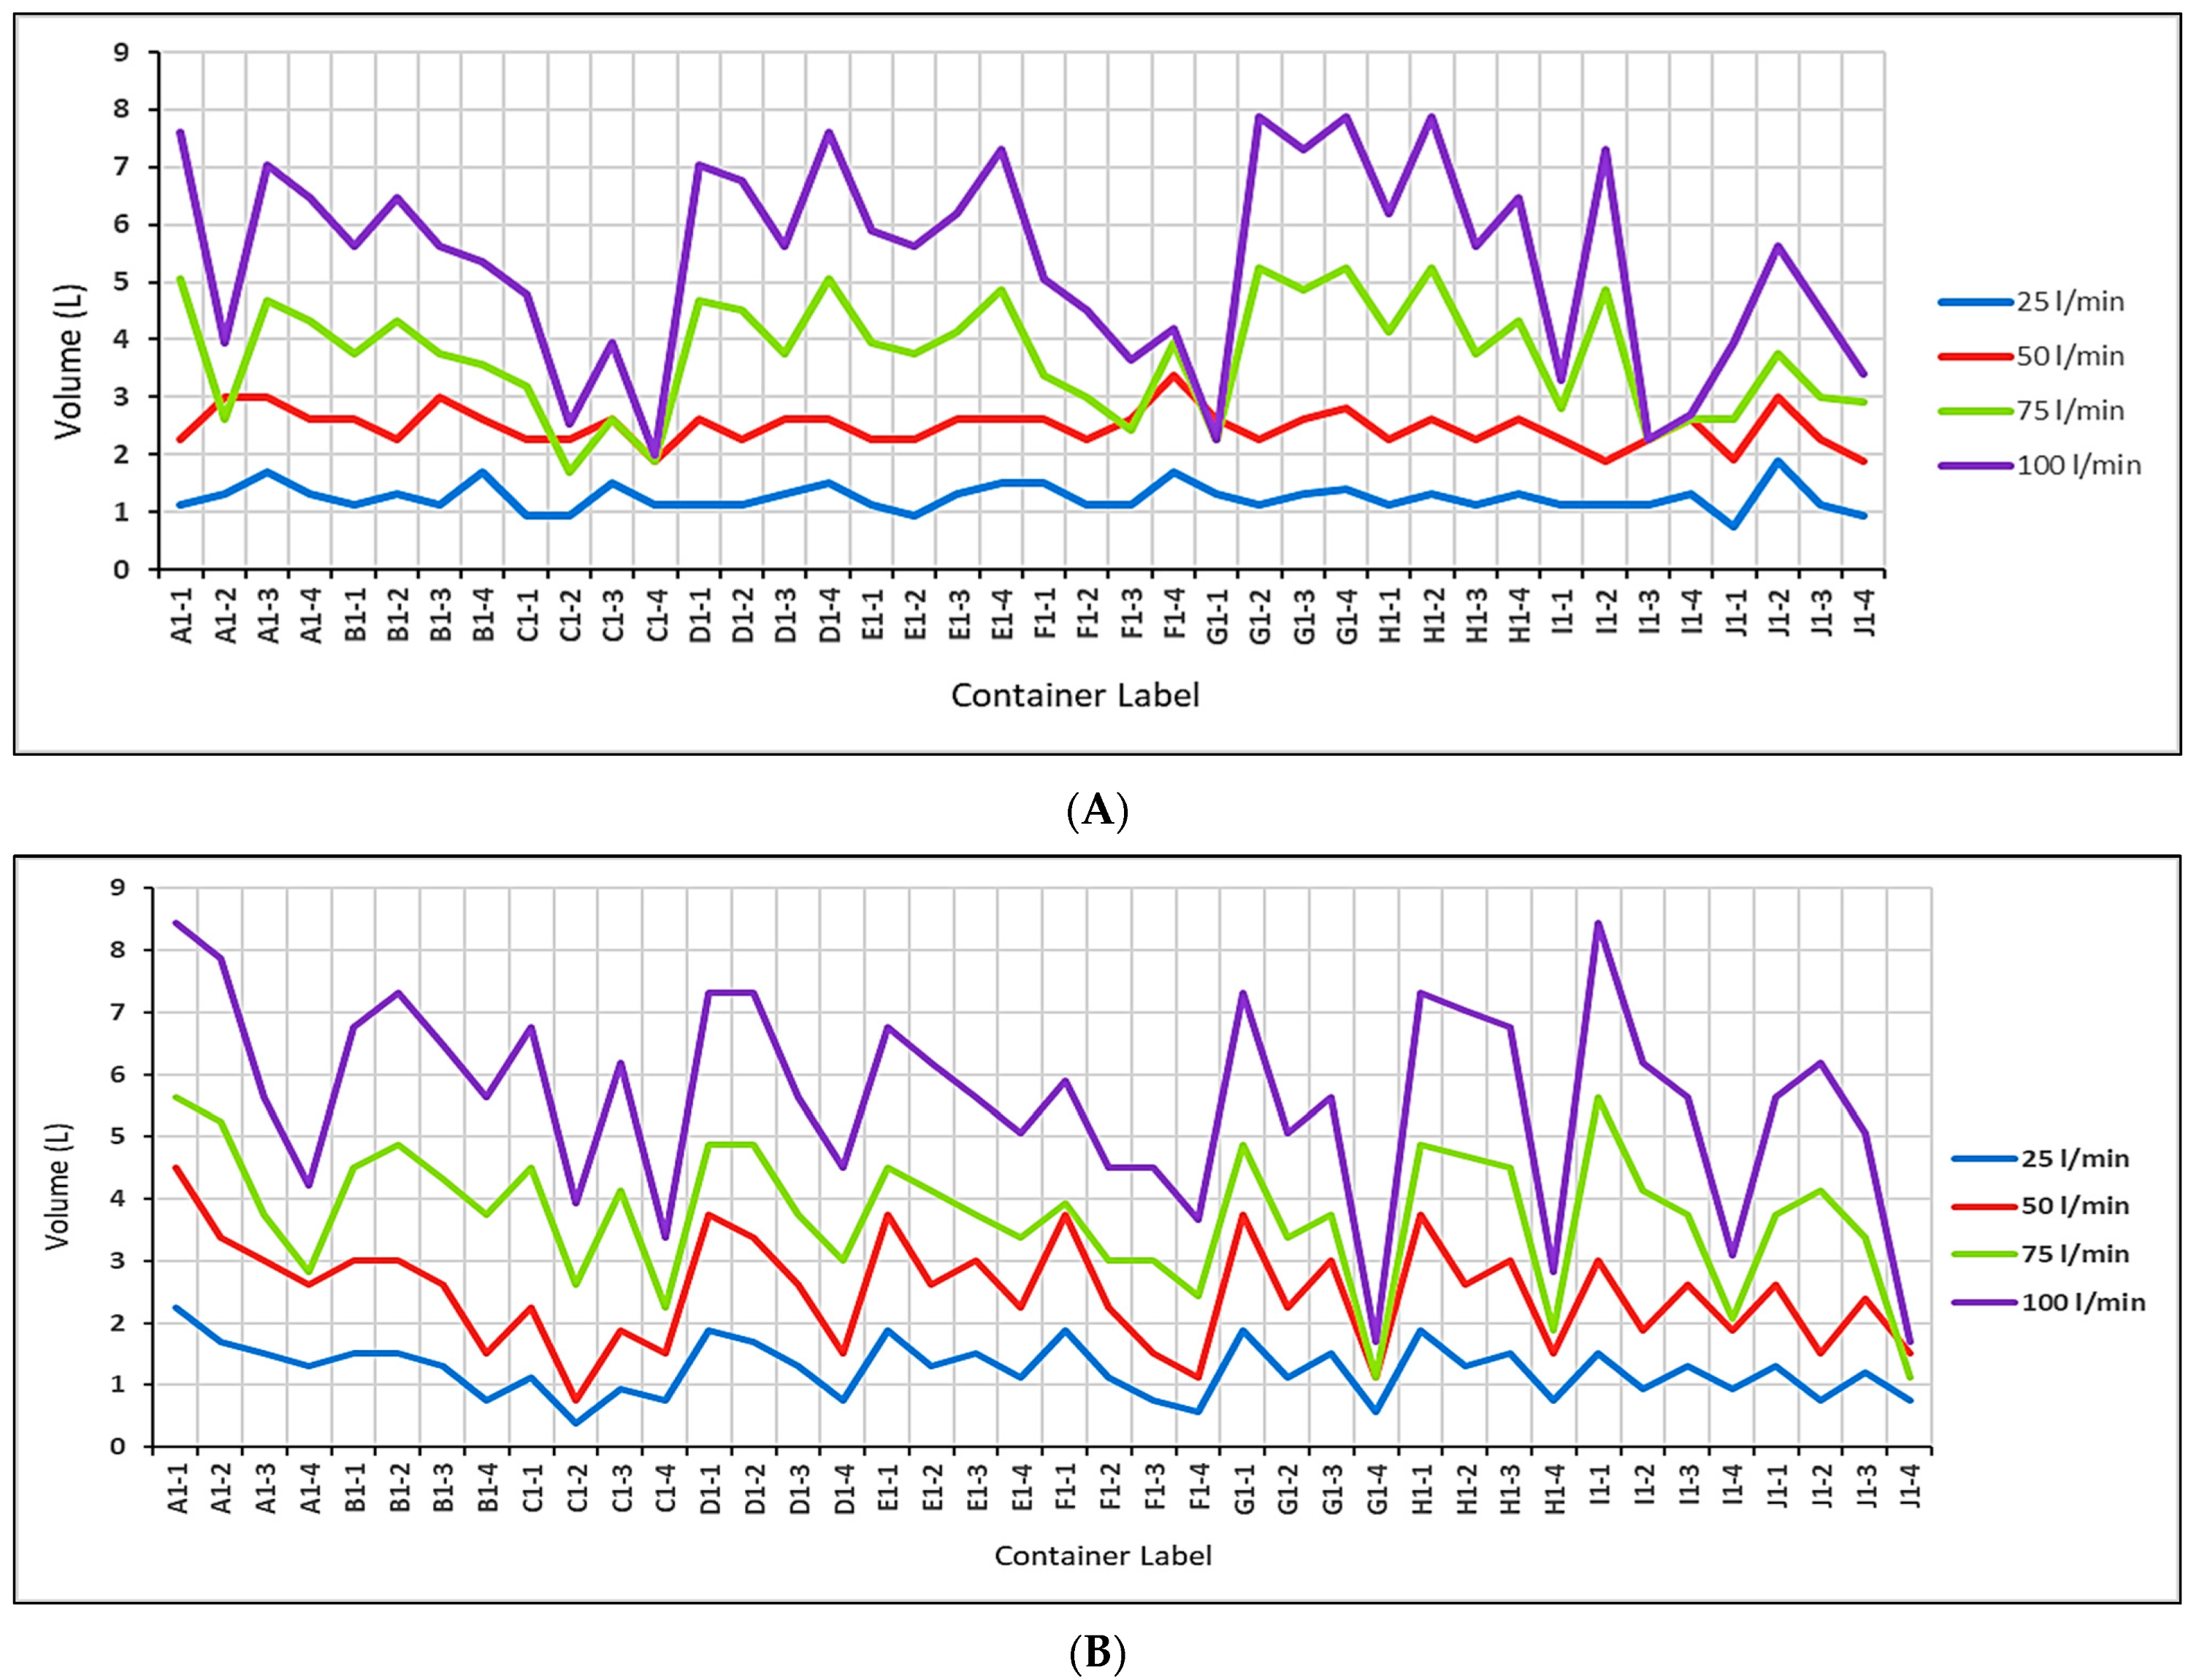
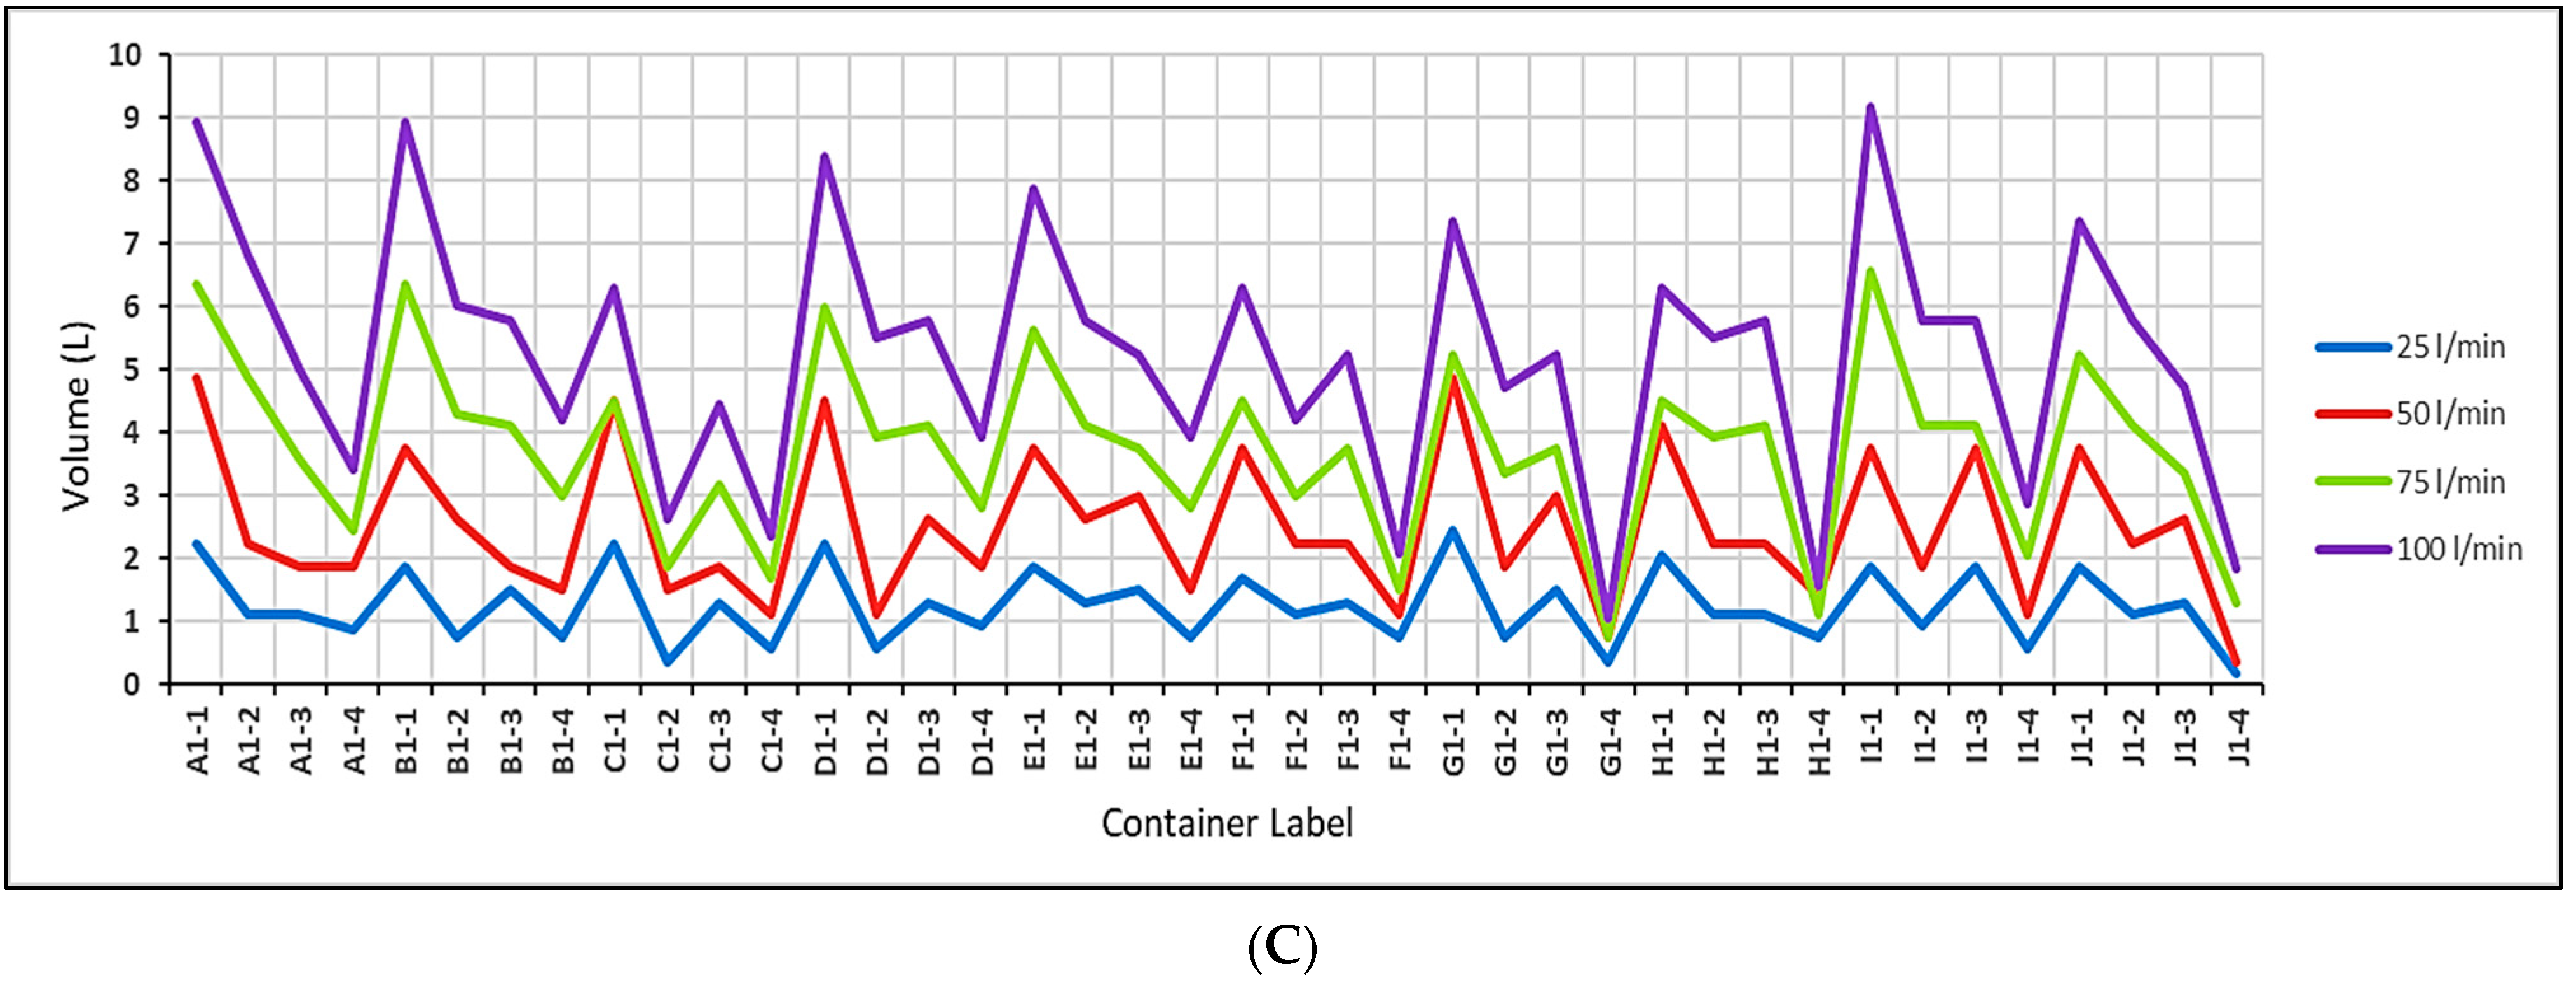
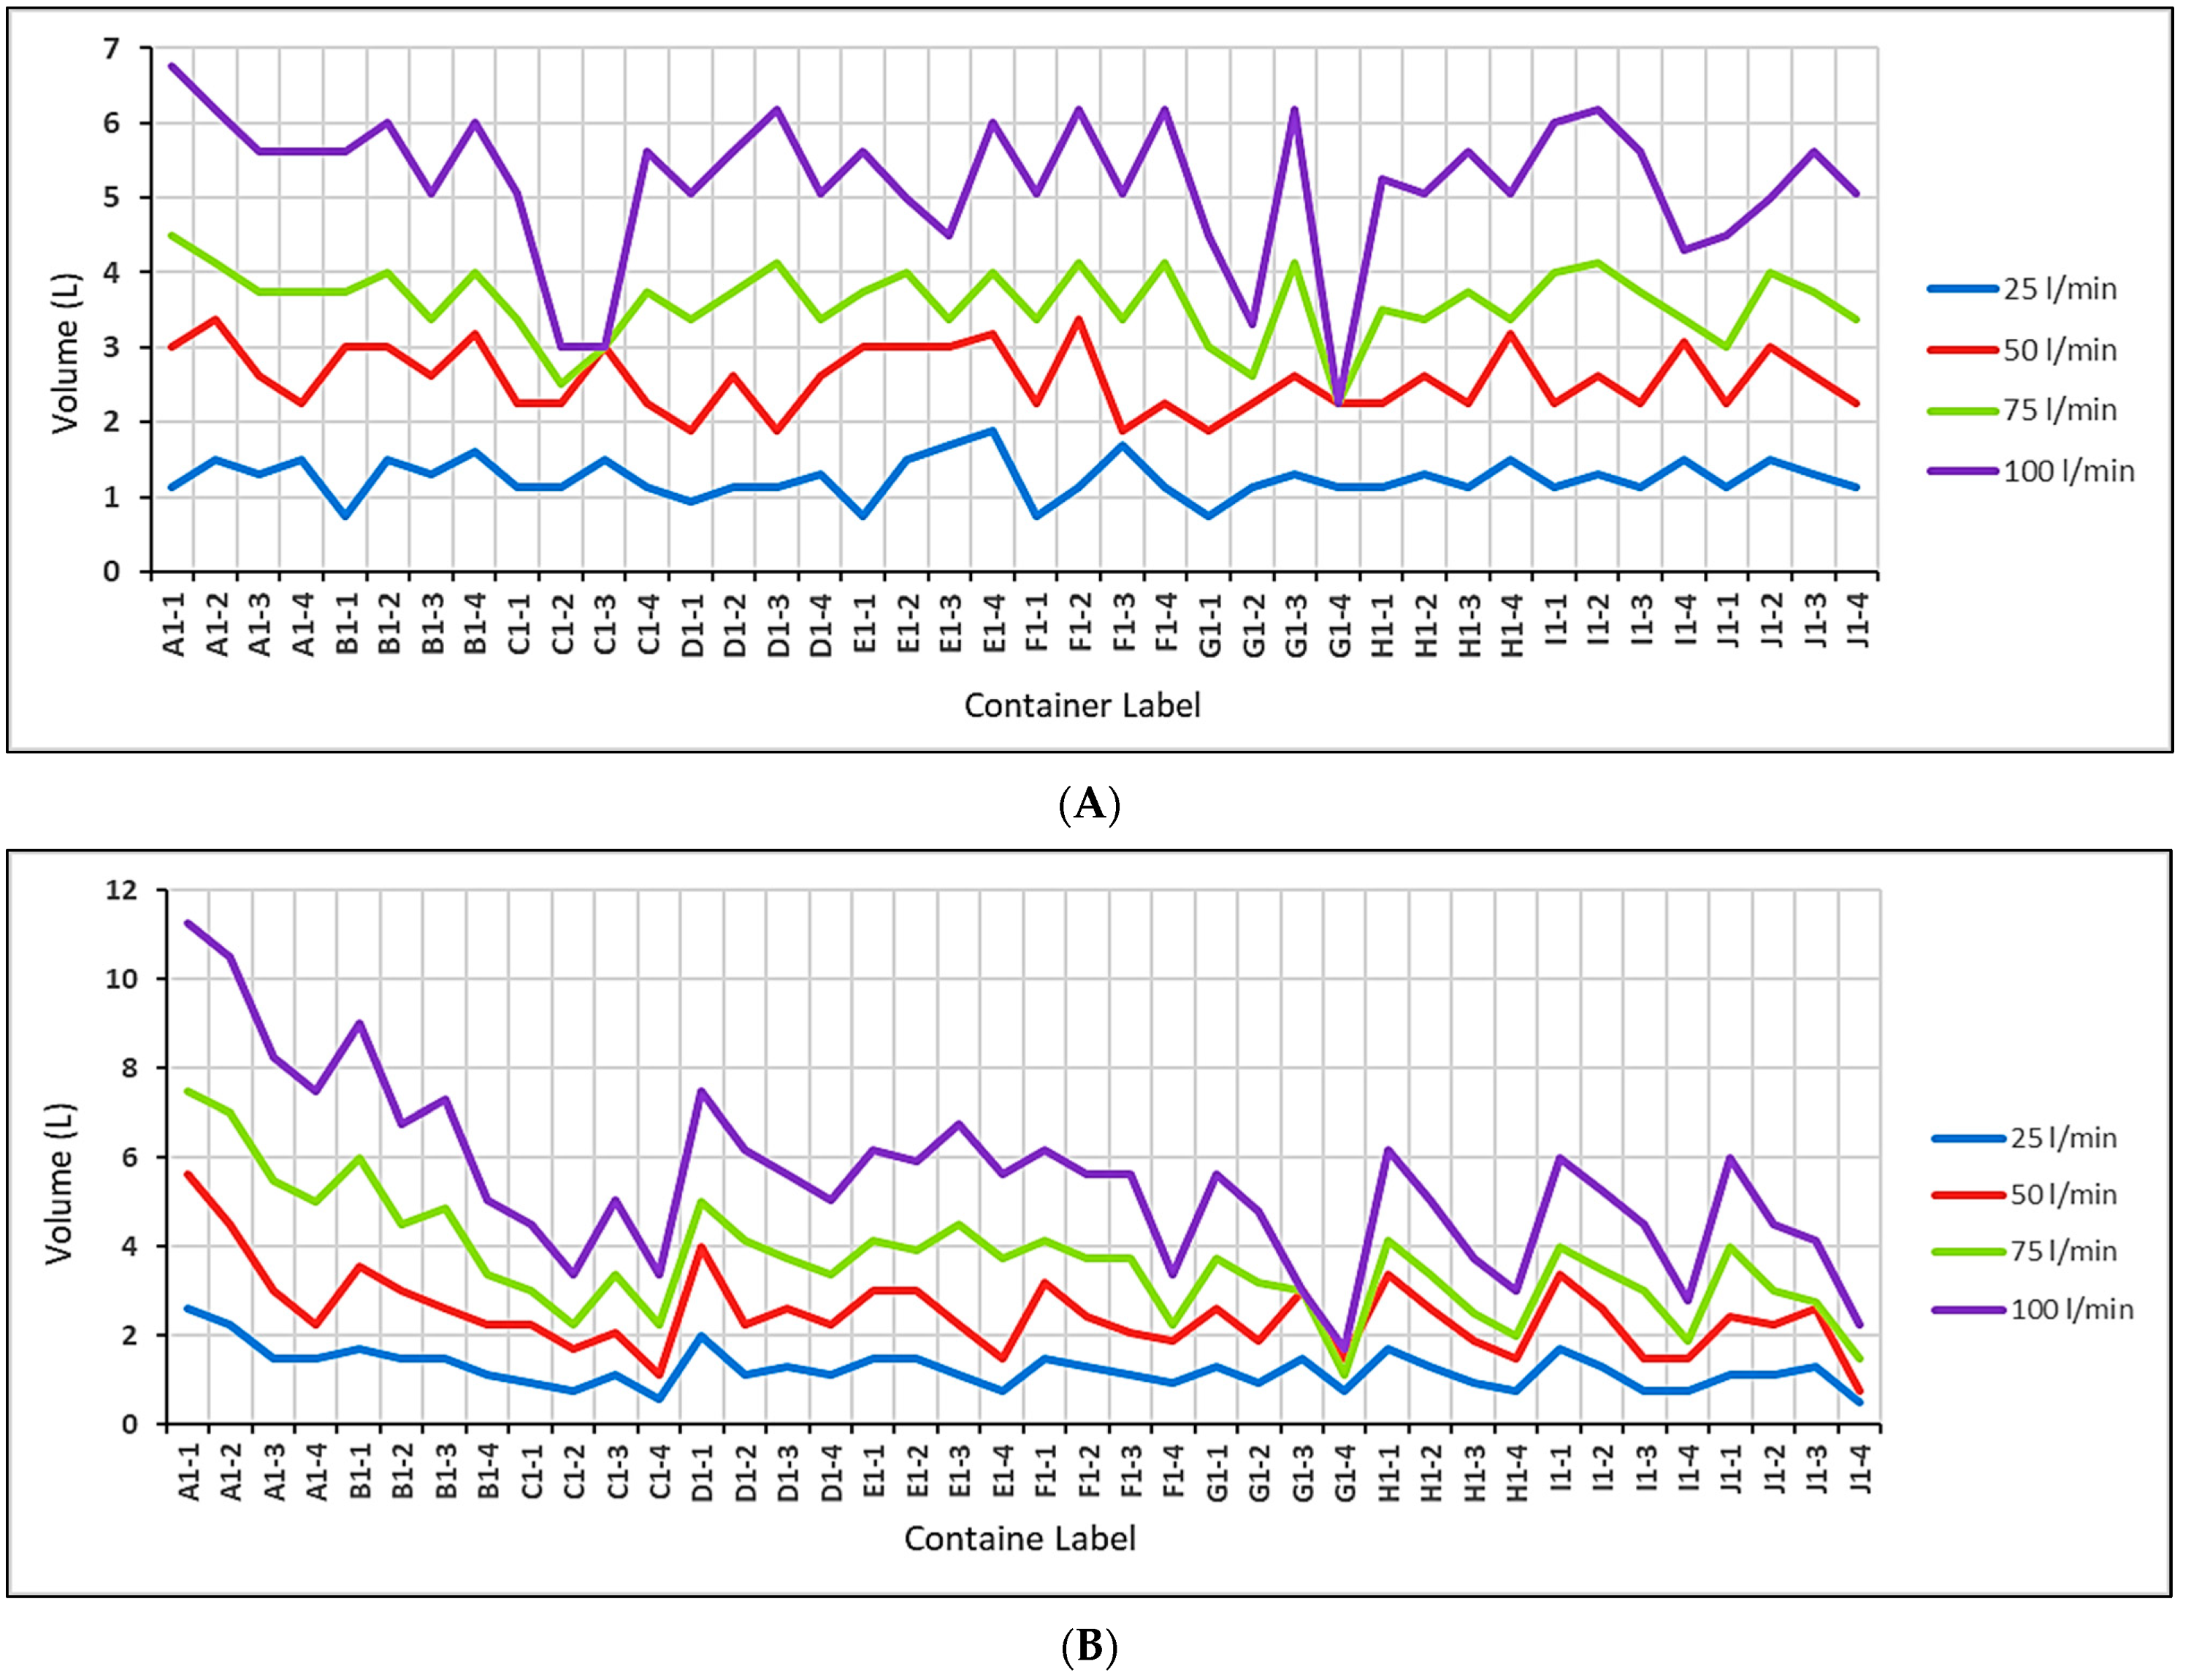
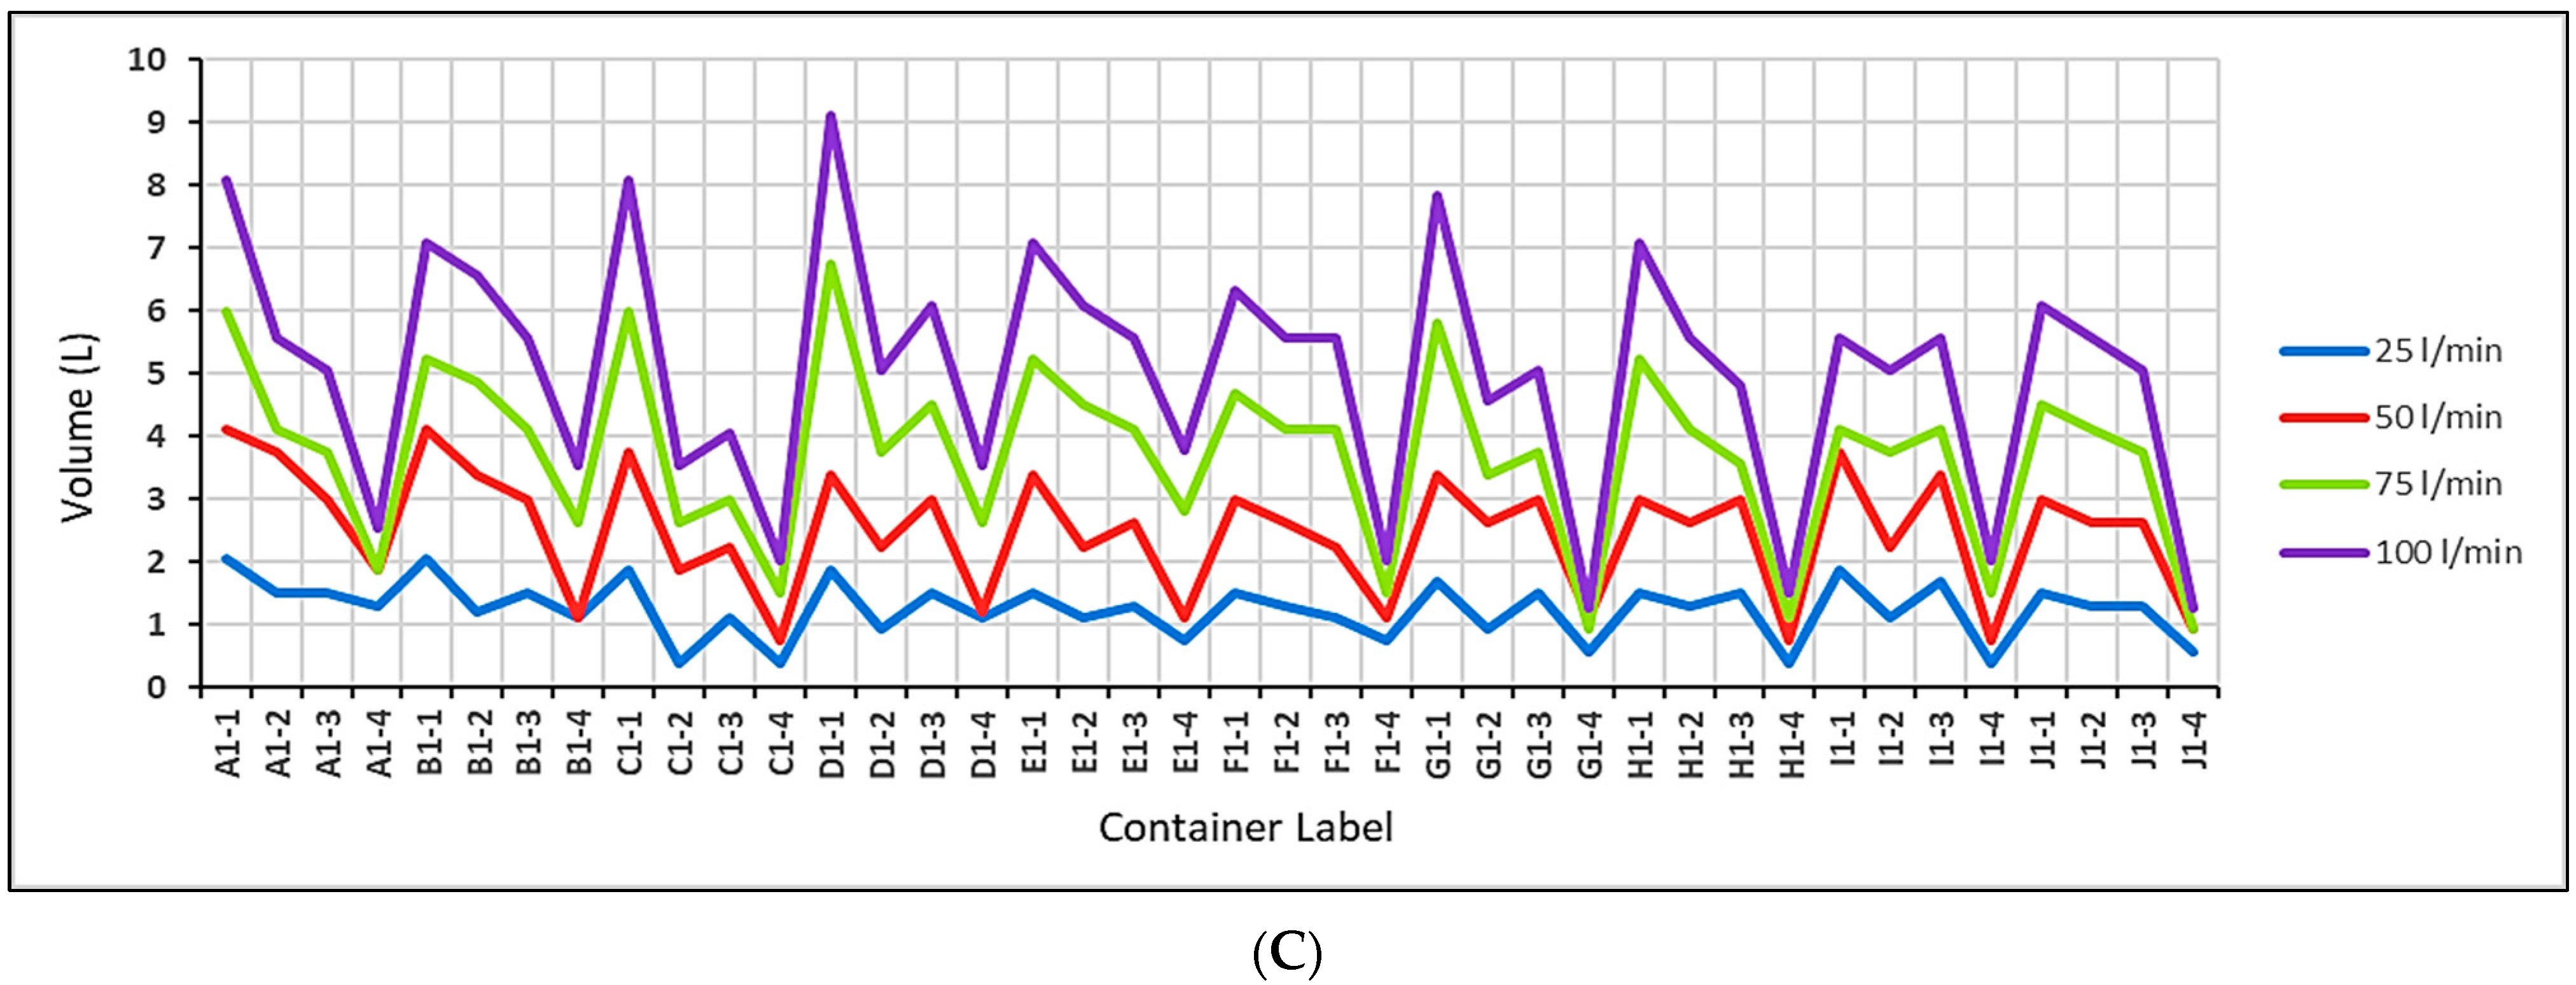
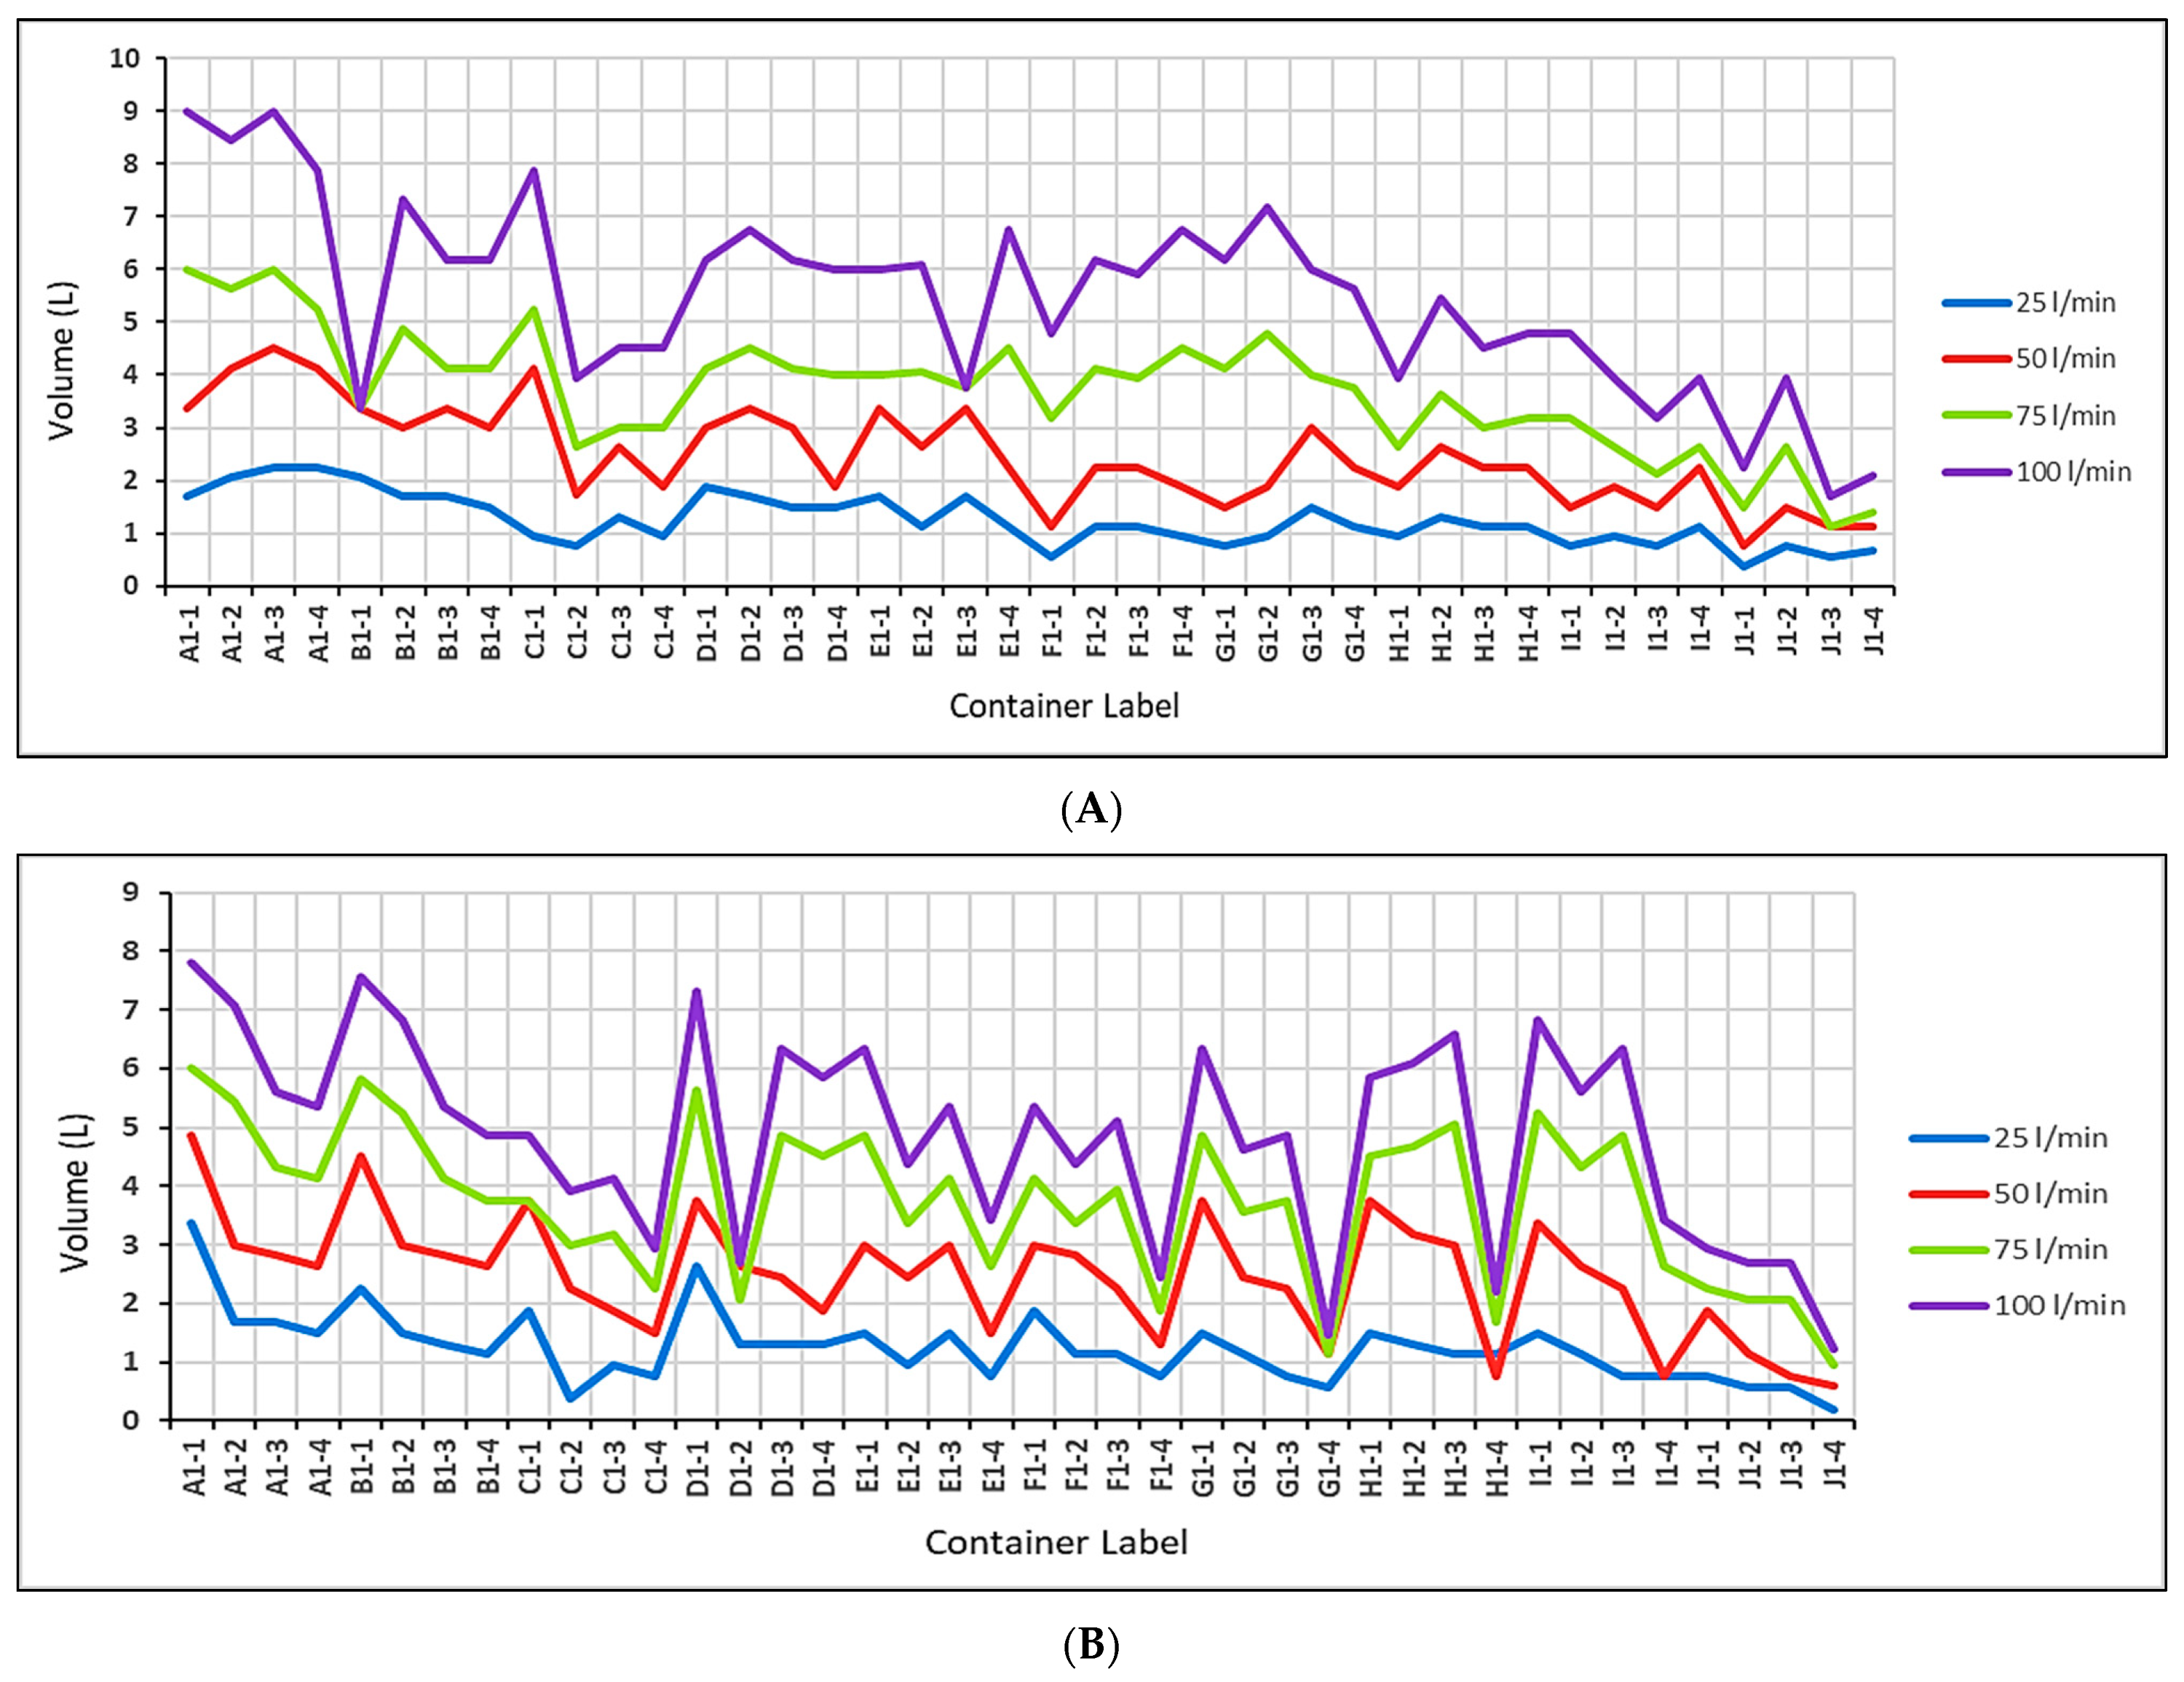
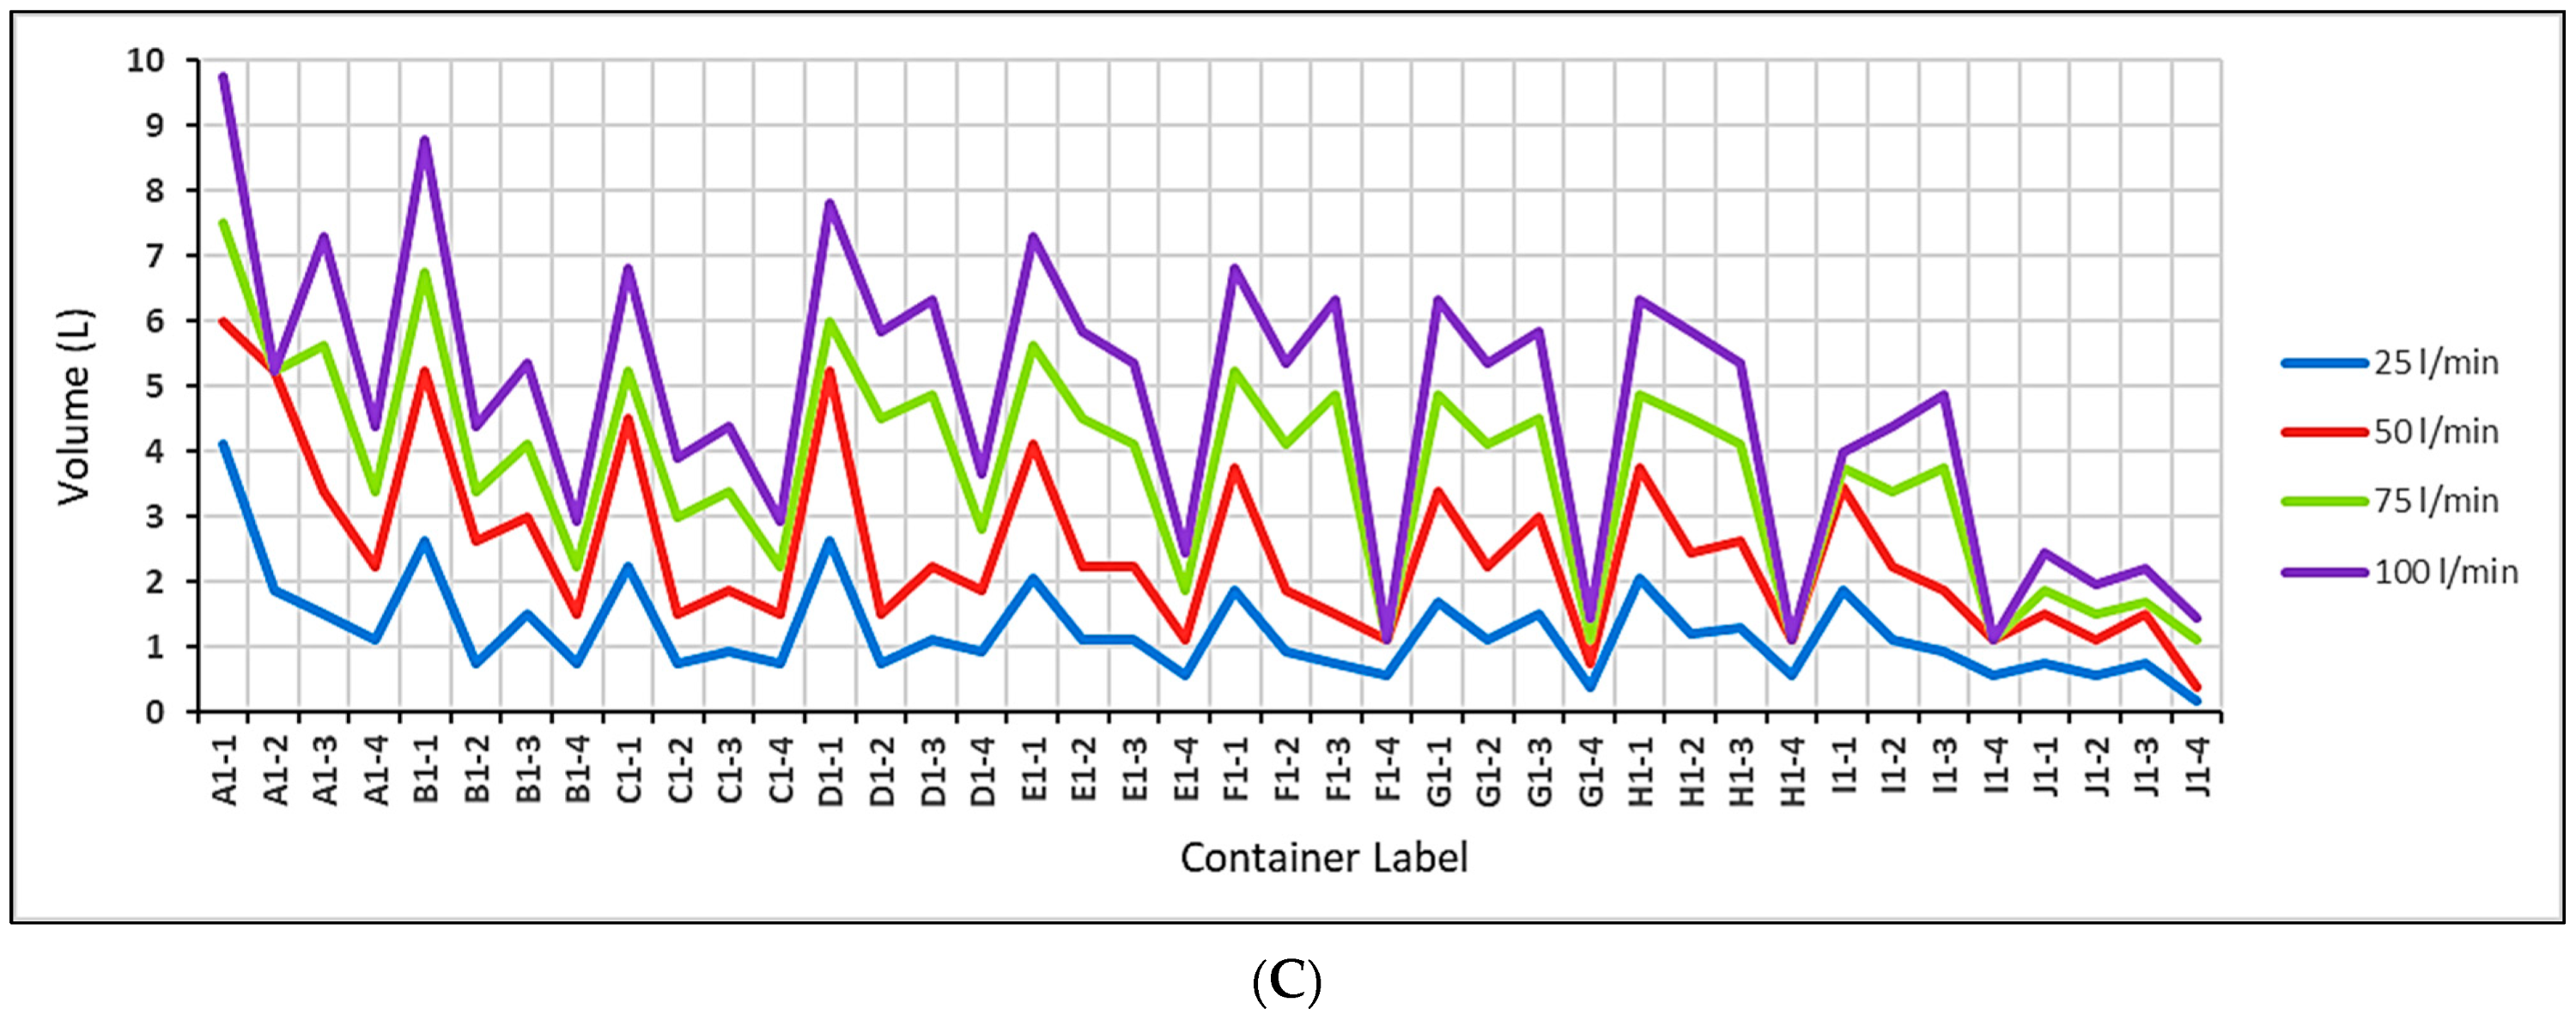
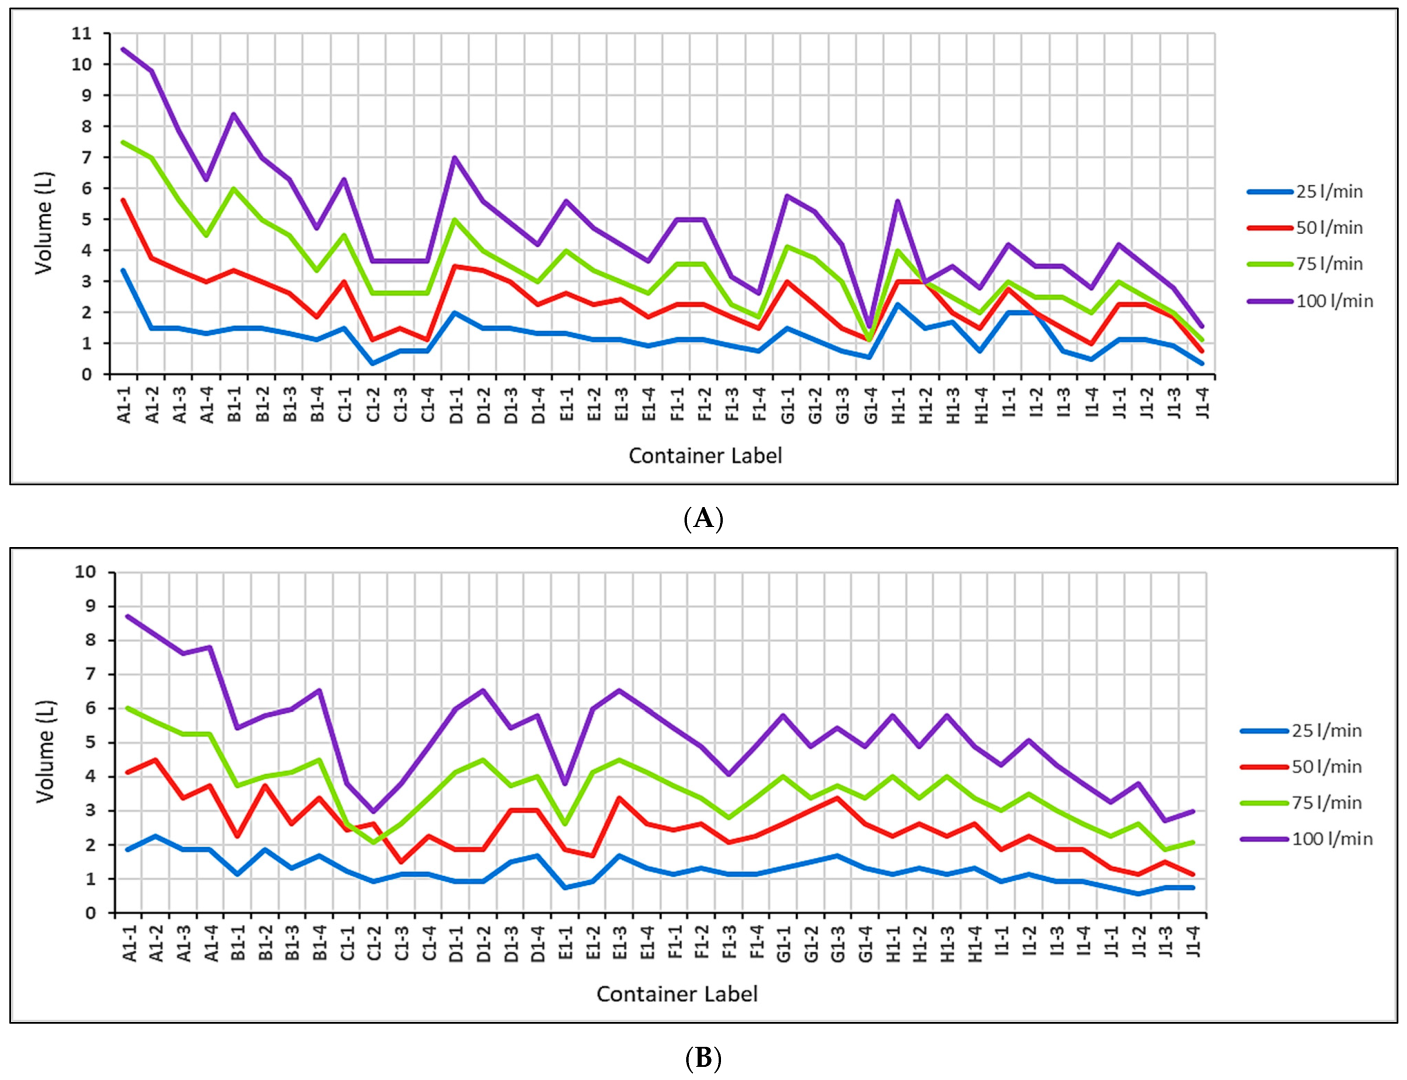
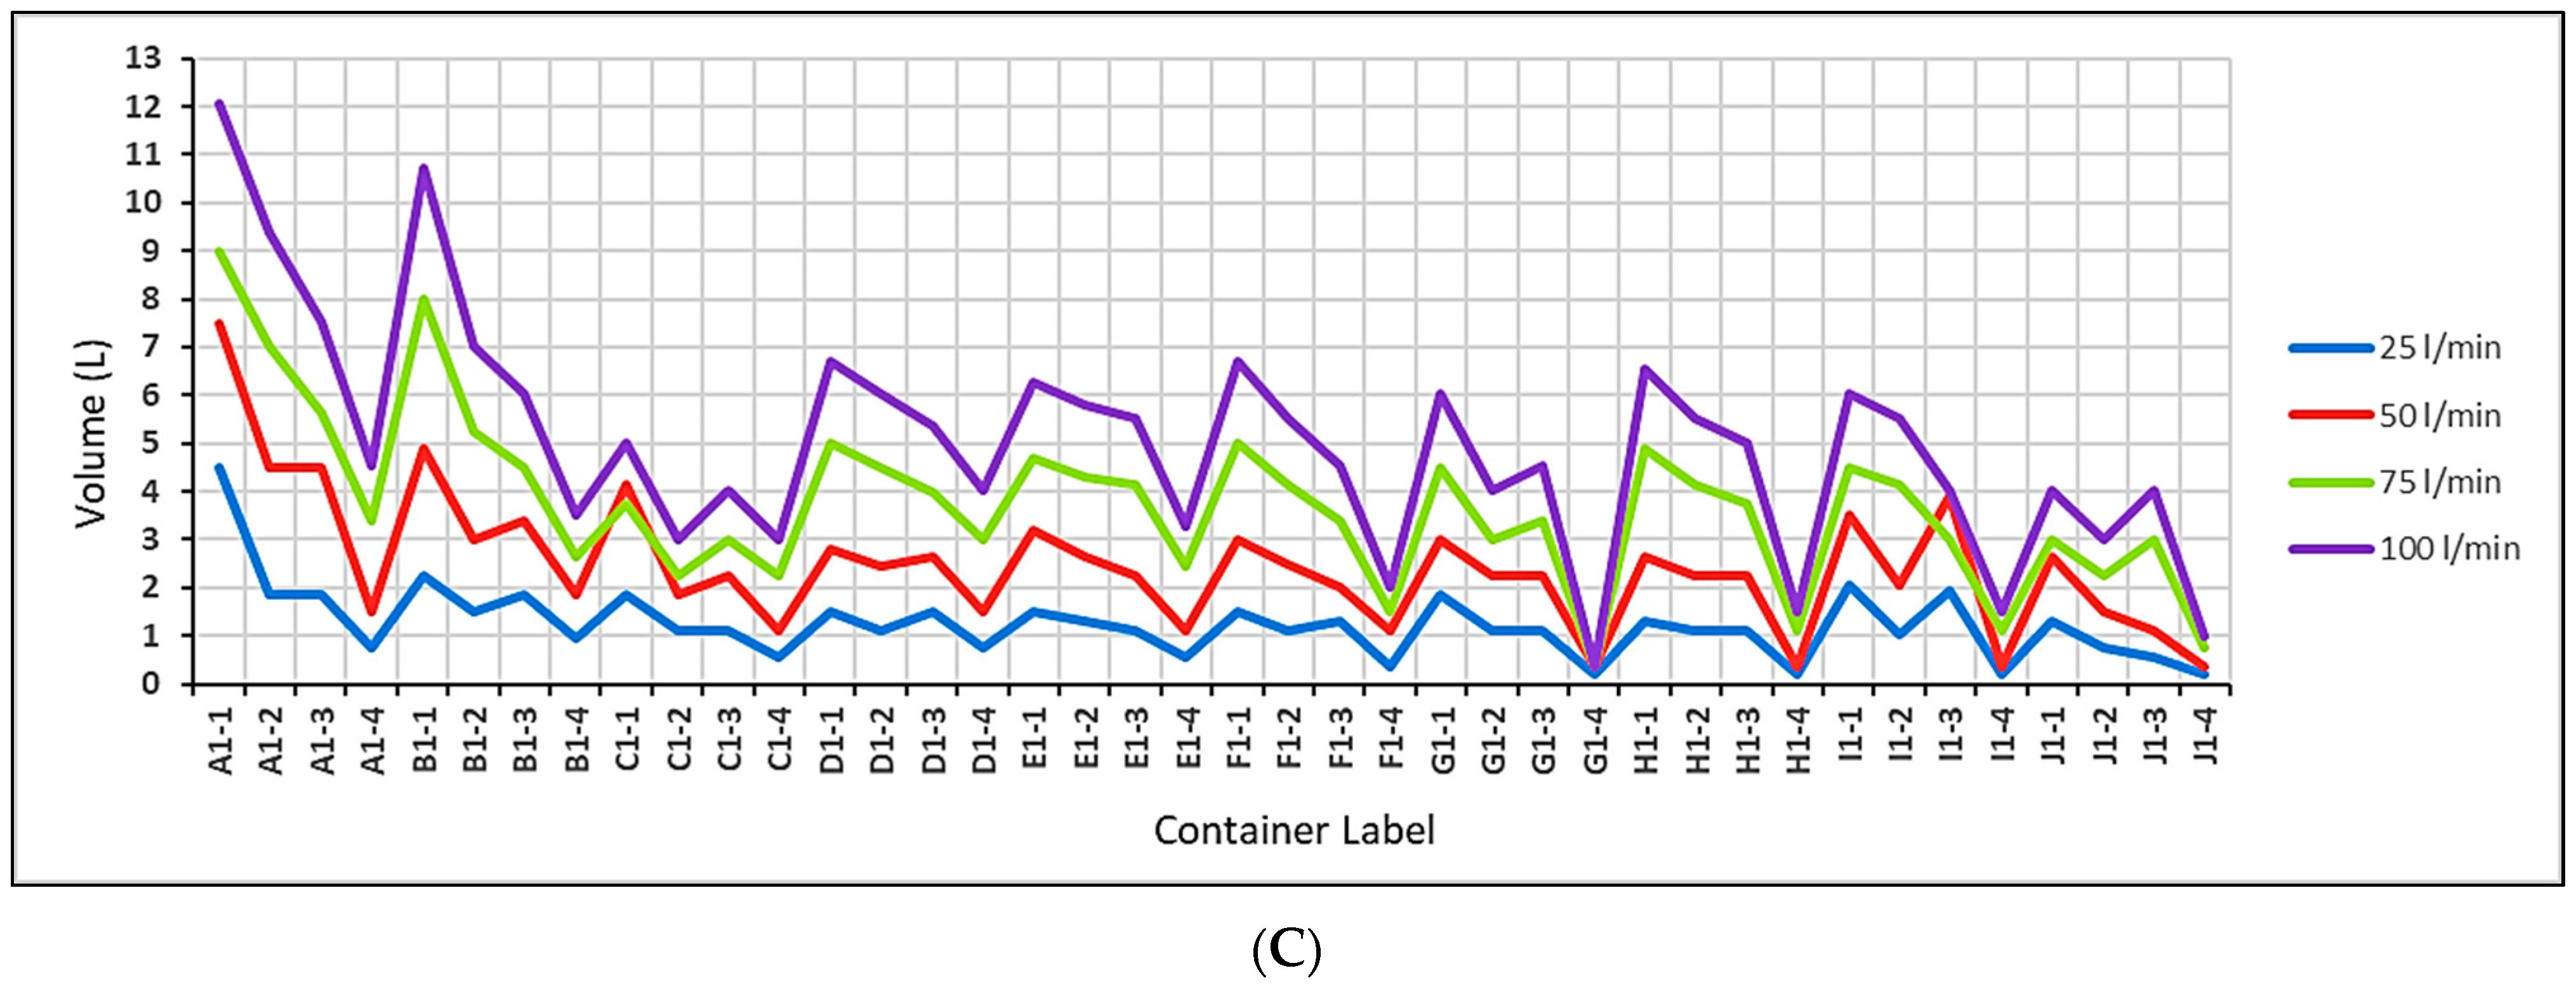
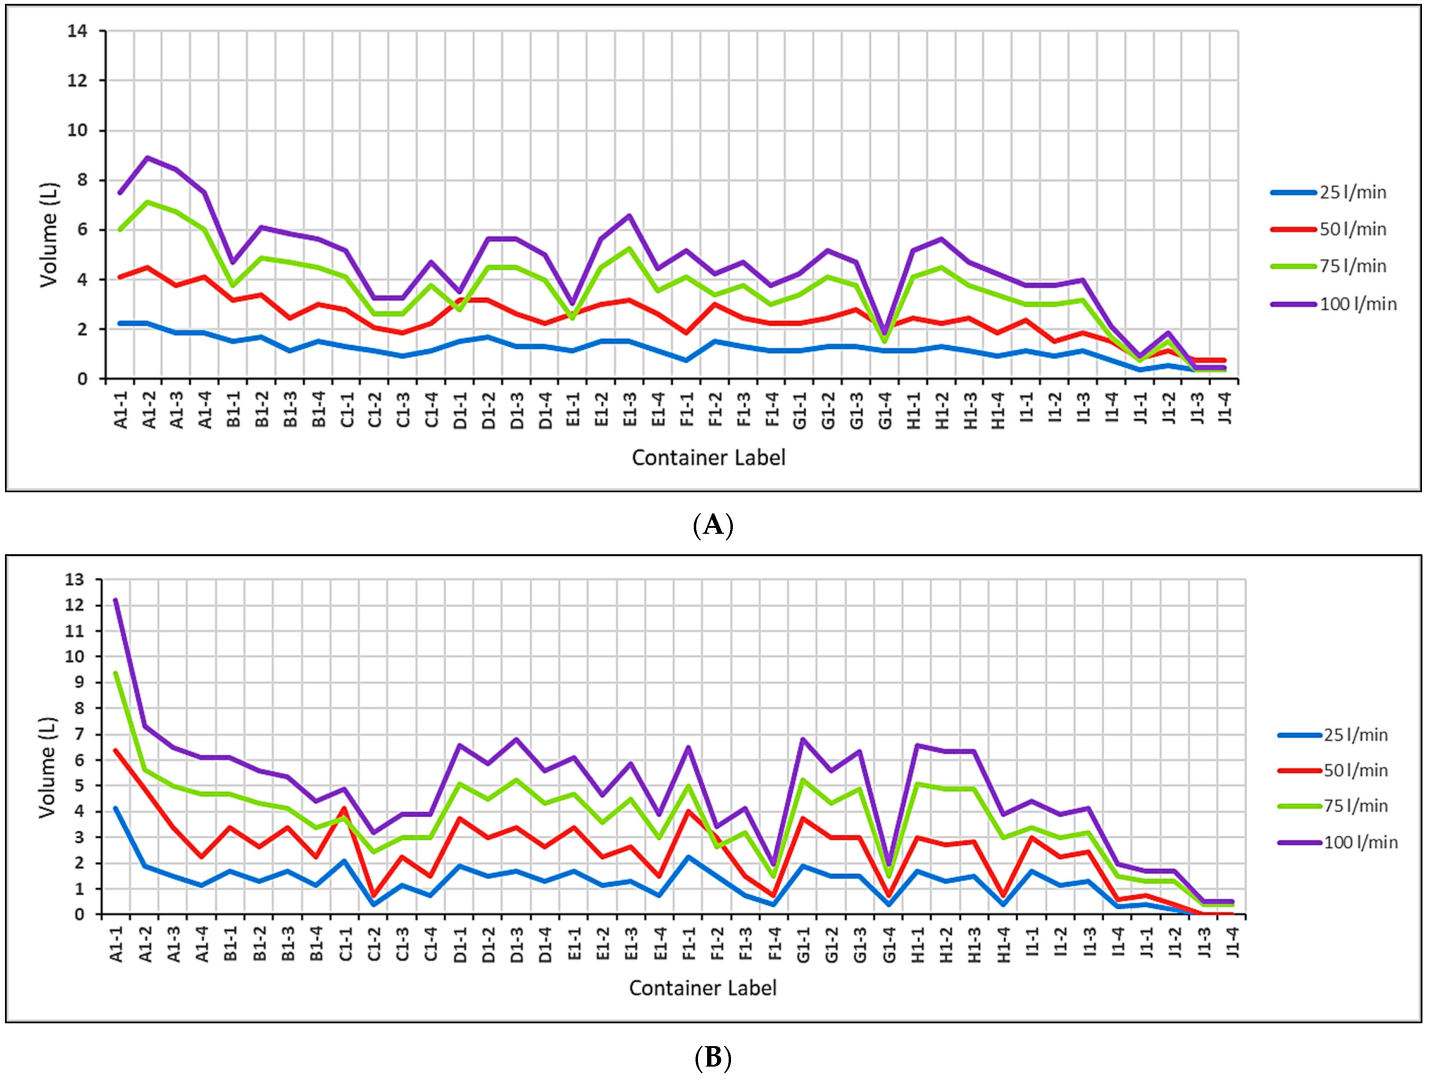
The longitudinal and side slopes (LS and SS) of the surface paver were adjusted to reveal their effects on the volume of infiltrated water at four different rainfall intensities under 2 min of rainfall. Figure 20, Figure 21, Figure 22 and Figure 23 describe the behavior of both patterns under different geometric and weather conditions.
The behavior of both patterns under different slopes and rainfall intensities can be interpreted as follow:
i. In the cases of permeable pavements with 45° and 90° herringboned surface patterns at both 25 and 50 L/min rainfall intensities, the infiltrated water volume for both types were approximately equal at all the adopted longitudinal and side slopes. The reason behind such behavior at low intensities is that the surface joints of both types were working at the same efficiency by absorbing all the surface water, regardless of the applied slopes.
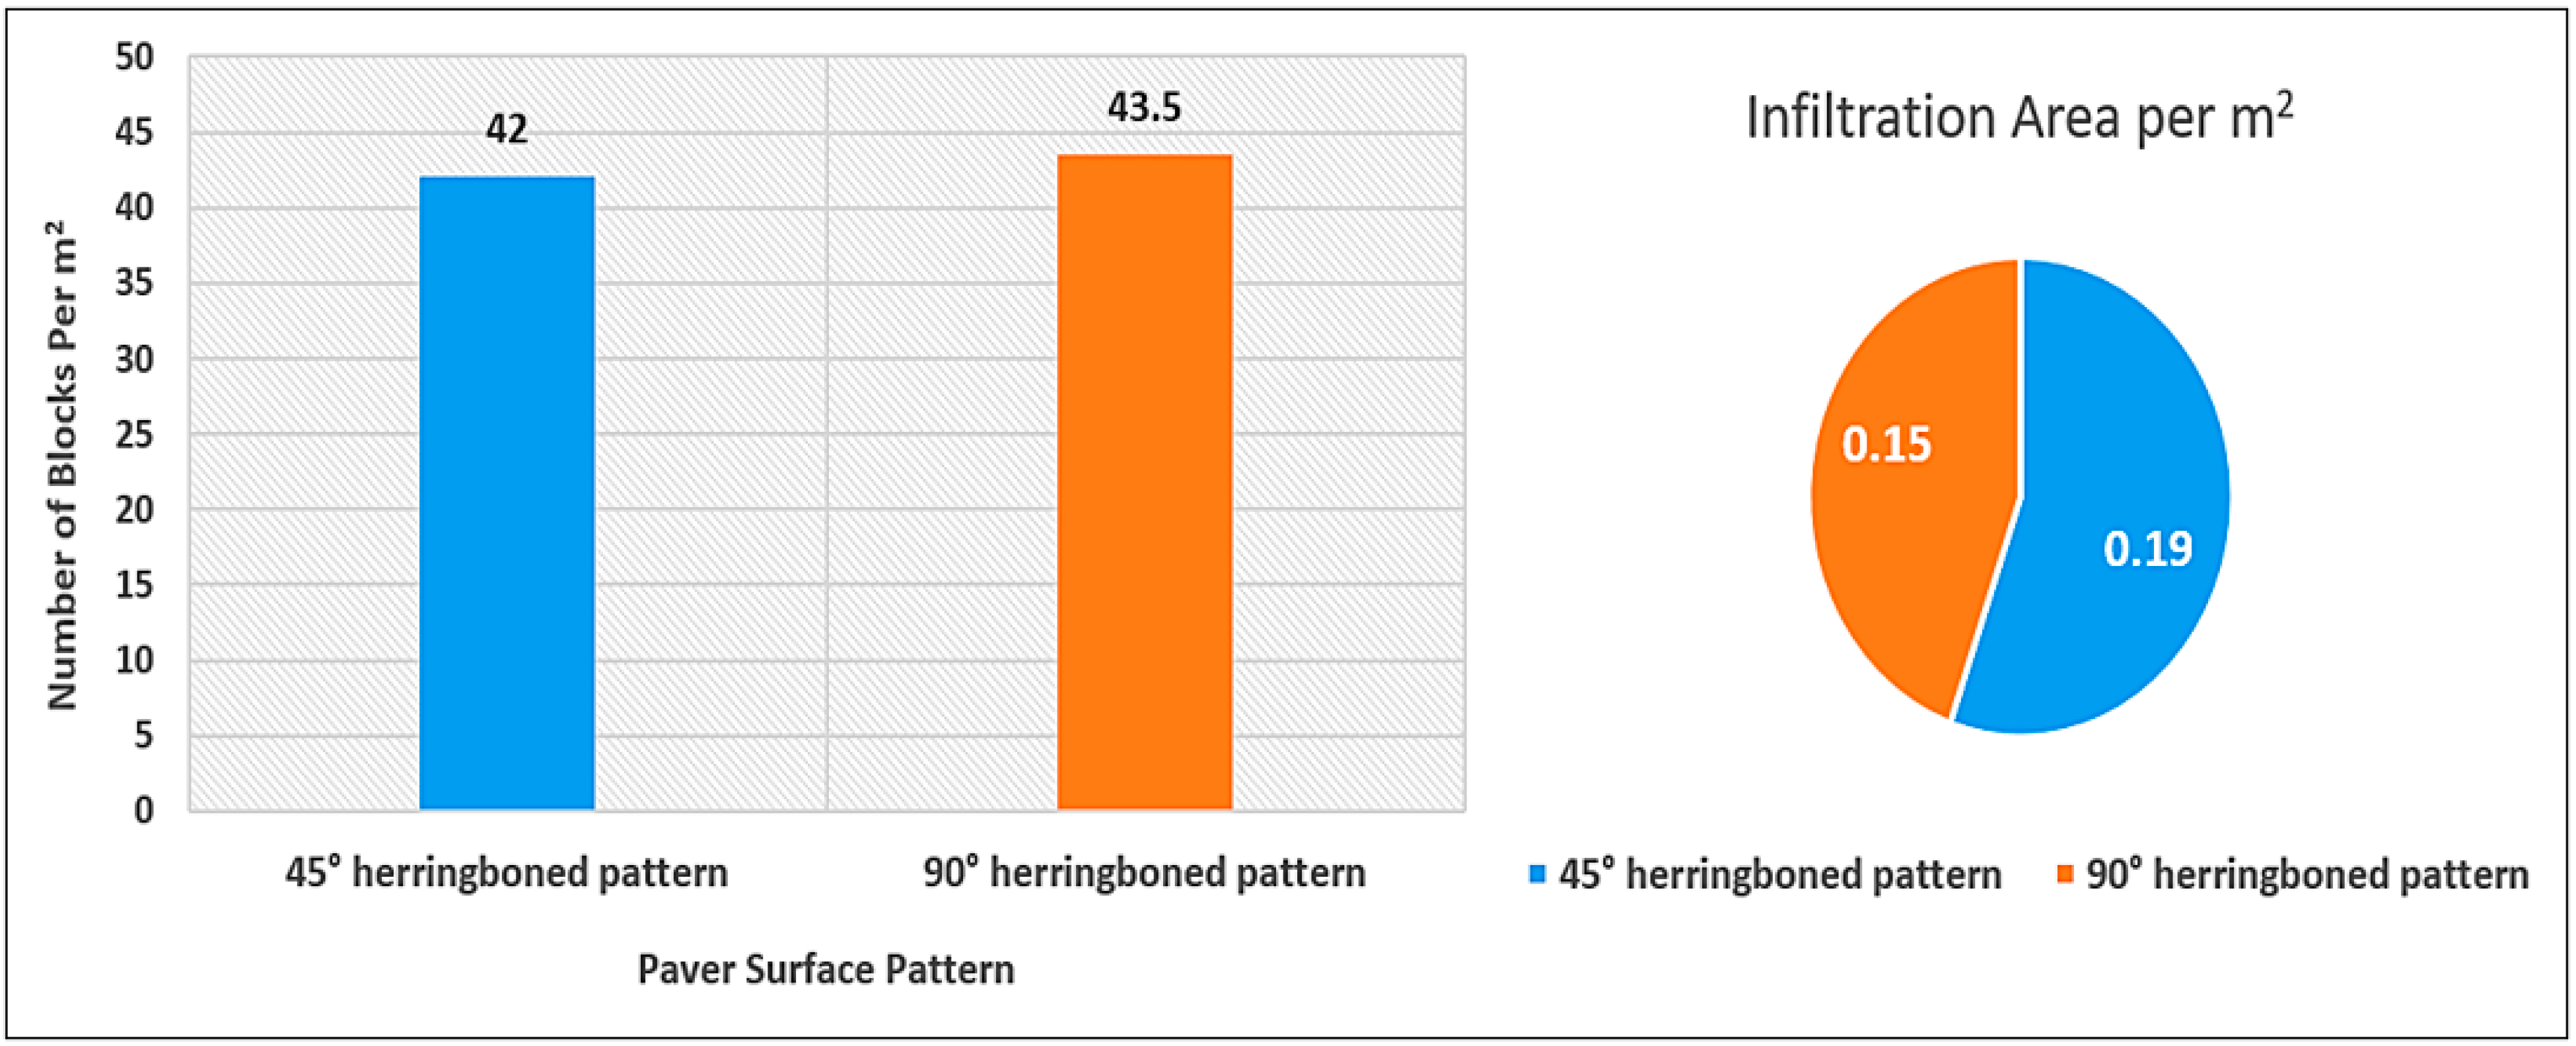
ii. In the cases of permeable pavements with 45° and 90° herringboned surface patterns at both 75 and 100 L/min rainfall intensities, the infiltrated water volume of the 45° herringboned surface pattern was relatively higher than that of the 90° herringboned at all the adopted longitudinal and side slopes. The reason behind such behavior at high intensities is that the surface area of the joints within the 45° herringboned pattern was higher than that of 90° herringboned, as shown in Figure 24. Therefore, this advantage works for the benefit of the 45° herringboned pattern, especially at high rainfall intensities (>75 L/min). In other words, the runoff of the 90° herringboned surface pattern was higher than that of the 45° herringboned surface pattern.
3.2. The Distribution of Infiltrated Water Beneath the Layers of PICP
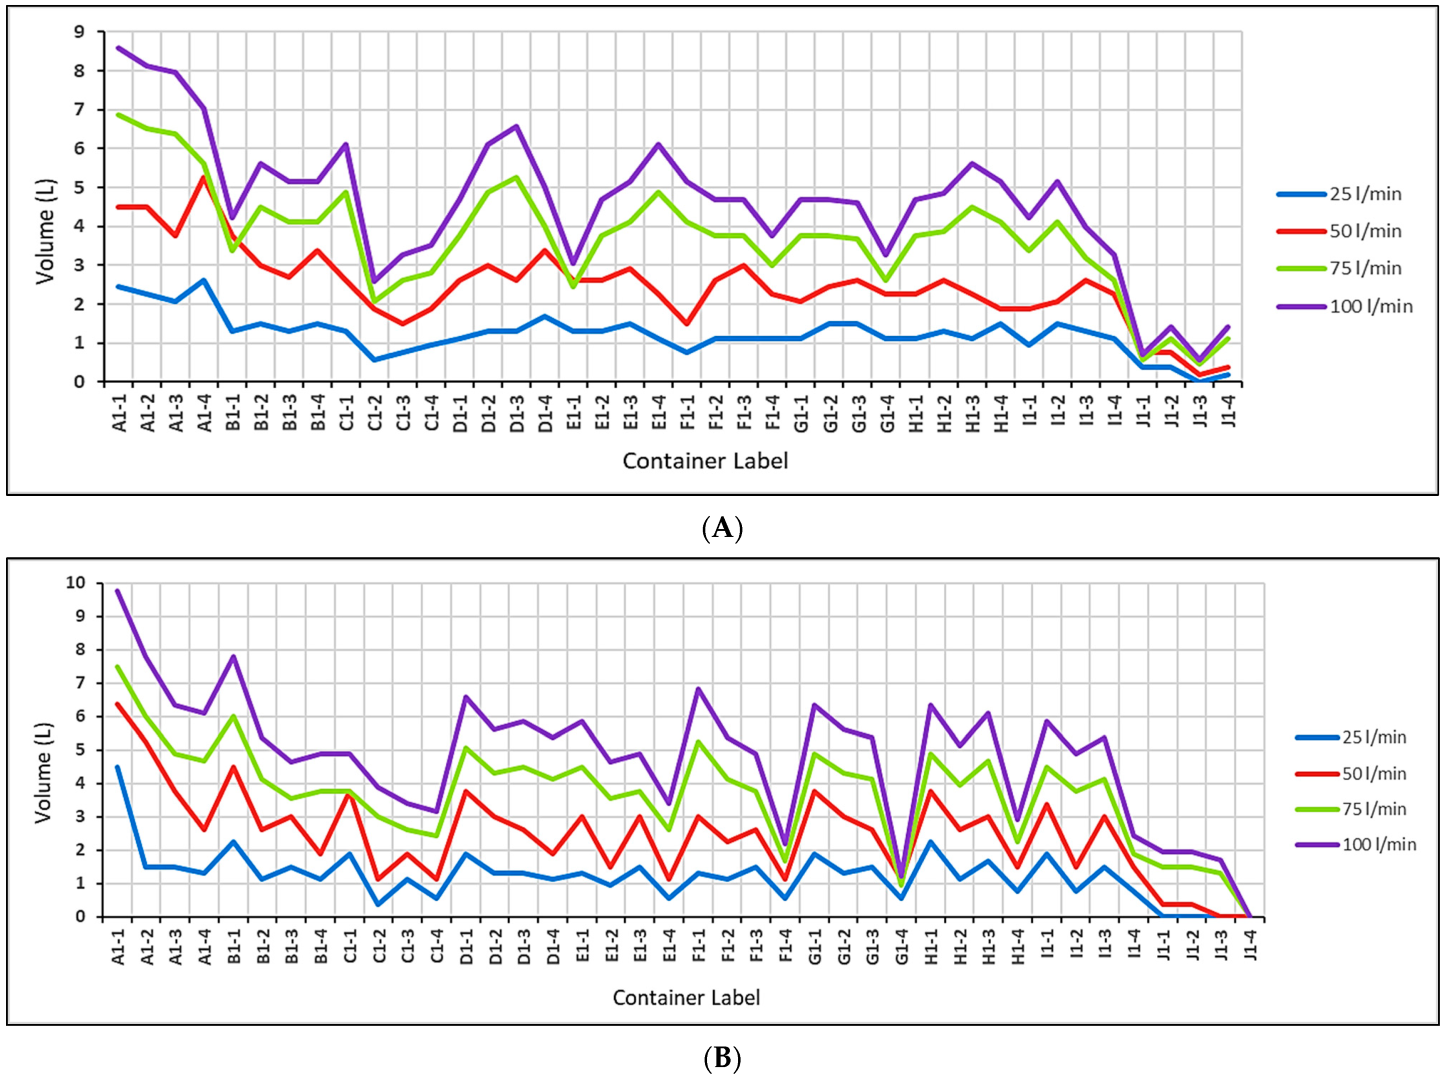
The water distribution pattern mainly depends on the conducted longitudinal (LS) and side slopes (SS) of the surface paver. Direct measuring of the volume of water within the gathering containers was considered to reveal the distribution of water beneath the layers of PICP and is presented in the following cases.
i. Applying 0% LS + 0% SS on the paver’s surface led to an equal distribution of the infiltrated water for both surface patterns, especially at low rainfall intensities (25 and 50 L/min), as shown in Figure 25A and Figure 26A). Basically, in this case, there was no slope for the infiltrated water to follow, leading to a more even distribution of water beneath the surface. This even distribution was especially noticeable at low rainfall intensities (25 and 50 L/min), since the volume of water infiltrated was lower and the infiltrated water had more time to spread out across the surface.
ii. Applying 0% LS + 2.5 and 5% SS on the paver’s surface led to filling the containers that were located on the edge of the long side within the simulator, with water to a high level, as shown in Figure 25B,C and Figure 26B,C).The intended containers were labeled from A1-1 to A1-10 or D1-1 to D1-10. The containers located on the edge of the long side within the simulator represented the edge of the pavement. As water flowed over the surface of the pavement, it collected at the containers due to the slope. The filling with water to a high level of the containers located below the pavement layers on the edge of the long side within the simulator indicated that the permeable interlocking concrete pavement was functioning properly.
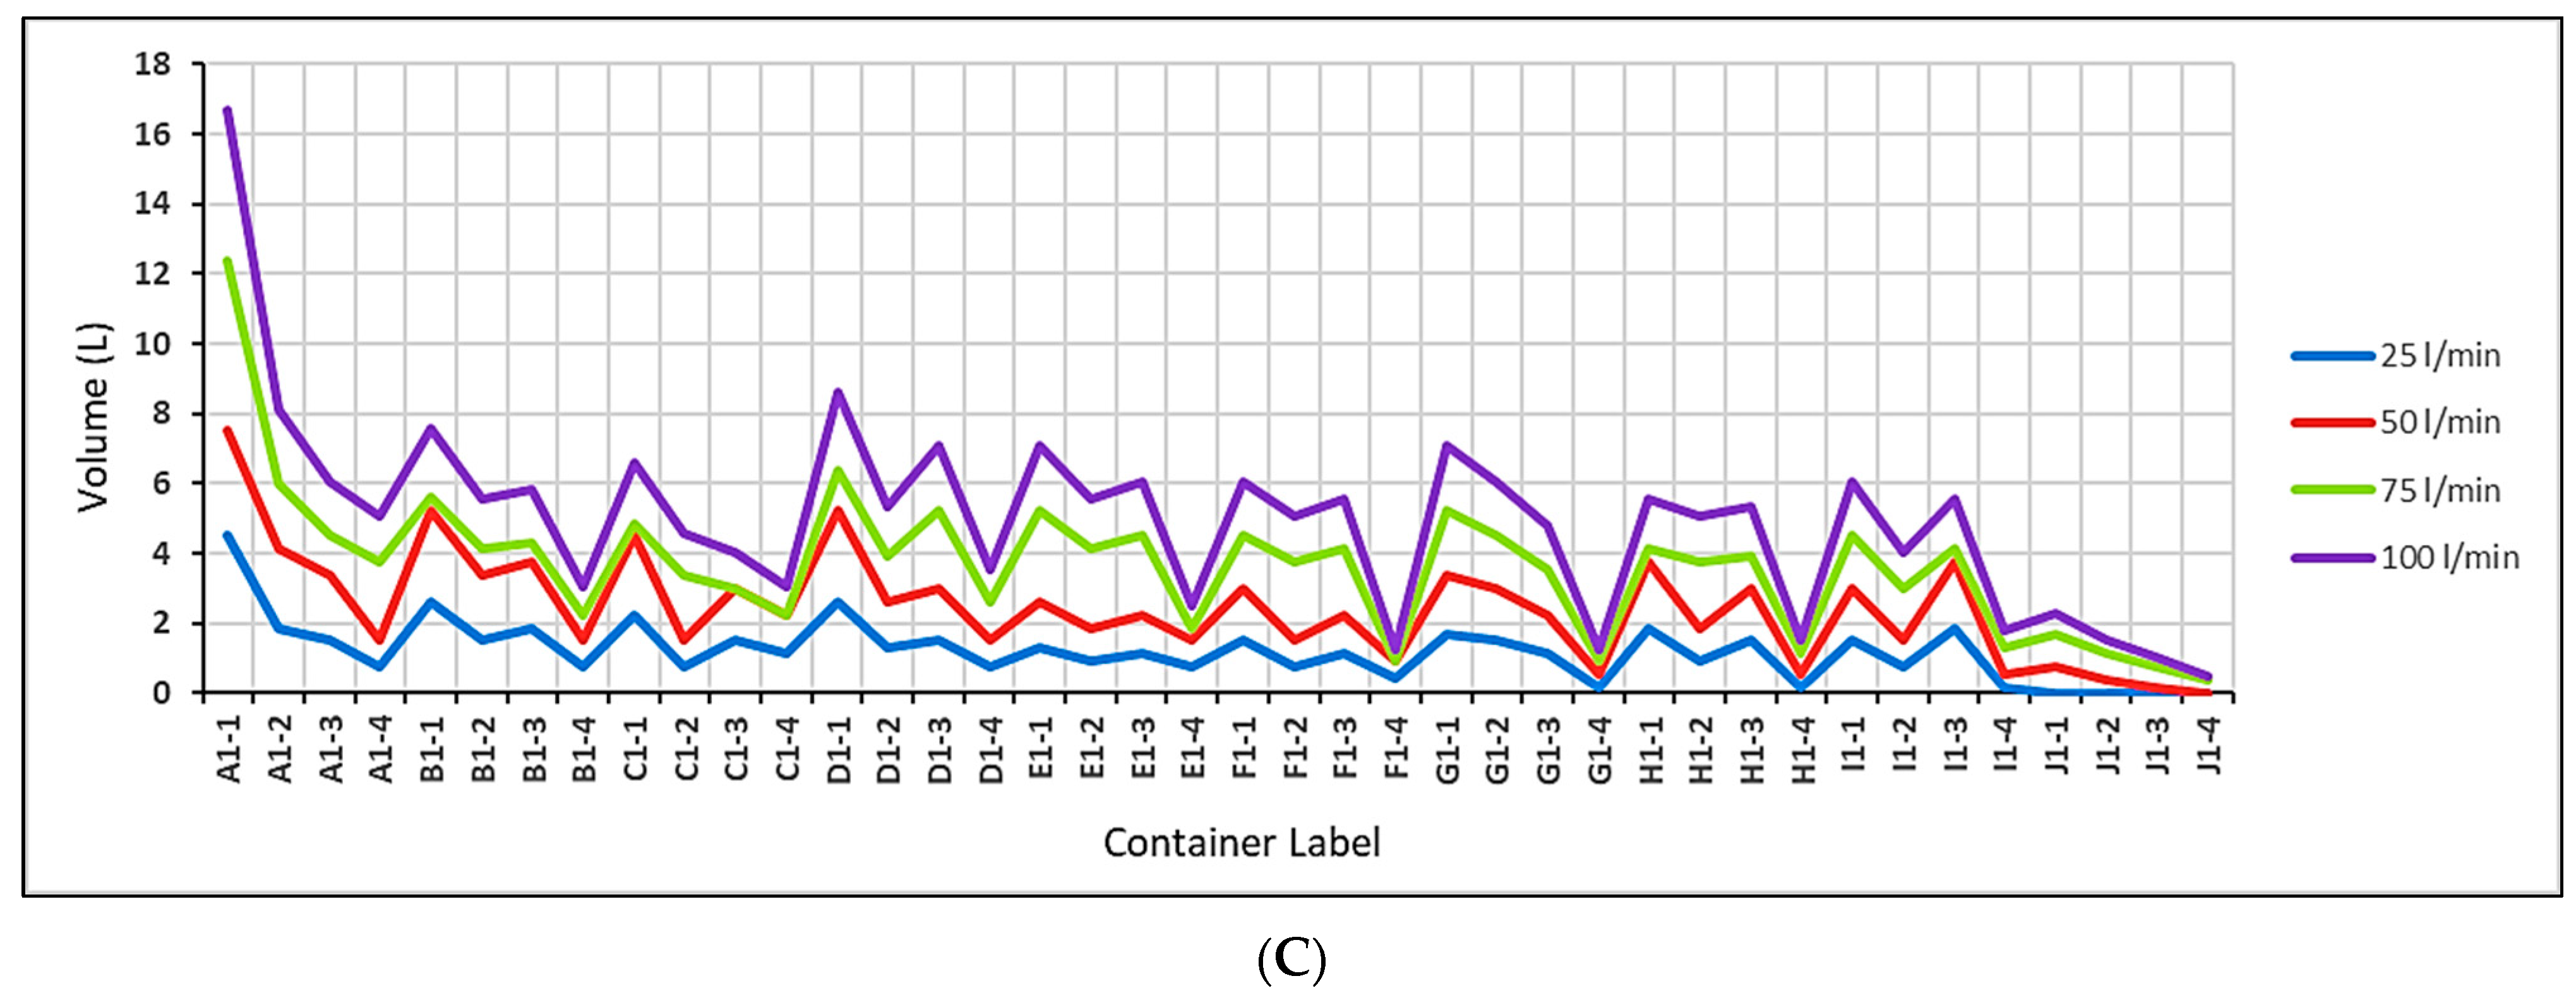
iii. Applying 2.5, 5, and 7.5% LS + 0% SS on the paver’s surface led to filling the containers that are located on the edge of the short side within the simulator with water to a high level, as shown in Figure 27A, Figure 28A, Figure 29A, Figure 30A, Figure 31A, Figure 32A. The intended containers were labeled A1-1, B1-1, C1-1, and D1-1 or A1-10, B1-10, C1-10, and D1-10. The slope toward the edge of the pavement was designed to direct water toward the drainage system and prevent it from ponding on the surface. The filling with water to a high level of the containers located below the pavement layers on the edge of the short side within the simulator indicated that the permeable interlocking concrete pavement was functioning properly and allowing water to infiltrate into the underlying soil as intended.
Top of Form
iv. Applying both LS and SS as a combination on the paver’s surface led to gathering the seeped water at the corners of the apparatus’s iron frame because the combination of LS and SS can create a low point or depression at the corners—specifically at A1-1 or A1-10 or D1-1 or D1-10—where water can collect and pool, as shown in Figure 27B,C, Figure 28B,C, Figure 29B,C, Figure 30B,C, Figure 31B,C, Figure 32B,C). The water behavior under such slopes can be attributed to the powers of gravity influencing it to take the runoff direction instead of the infiltration direction.
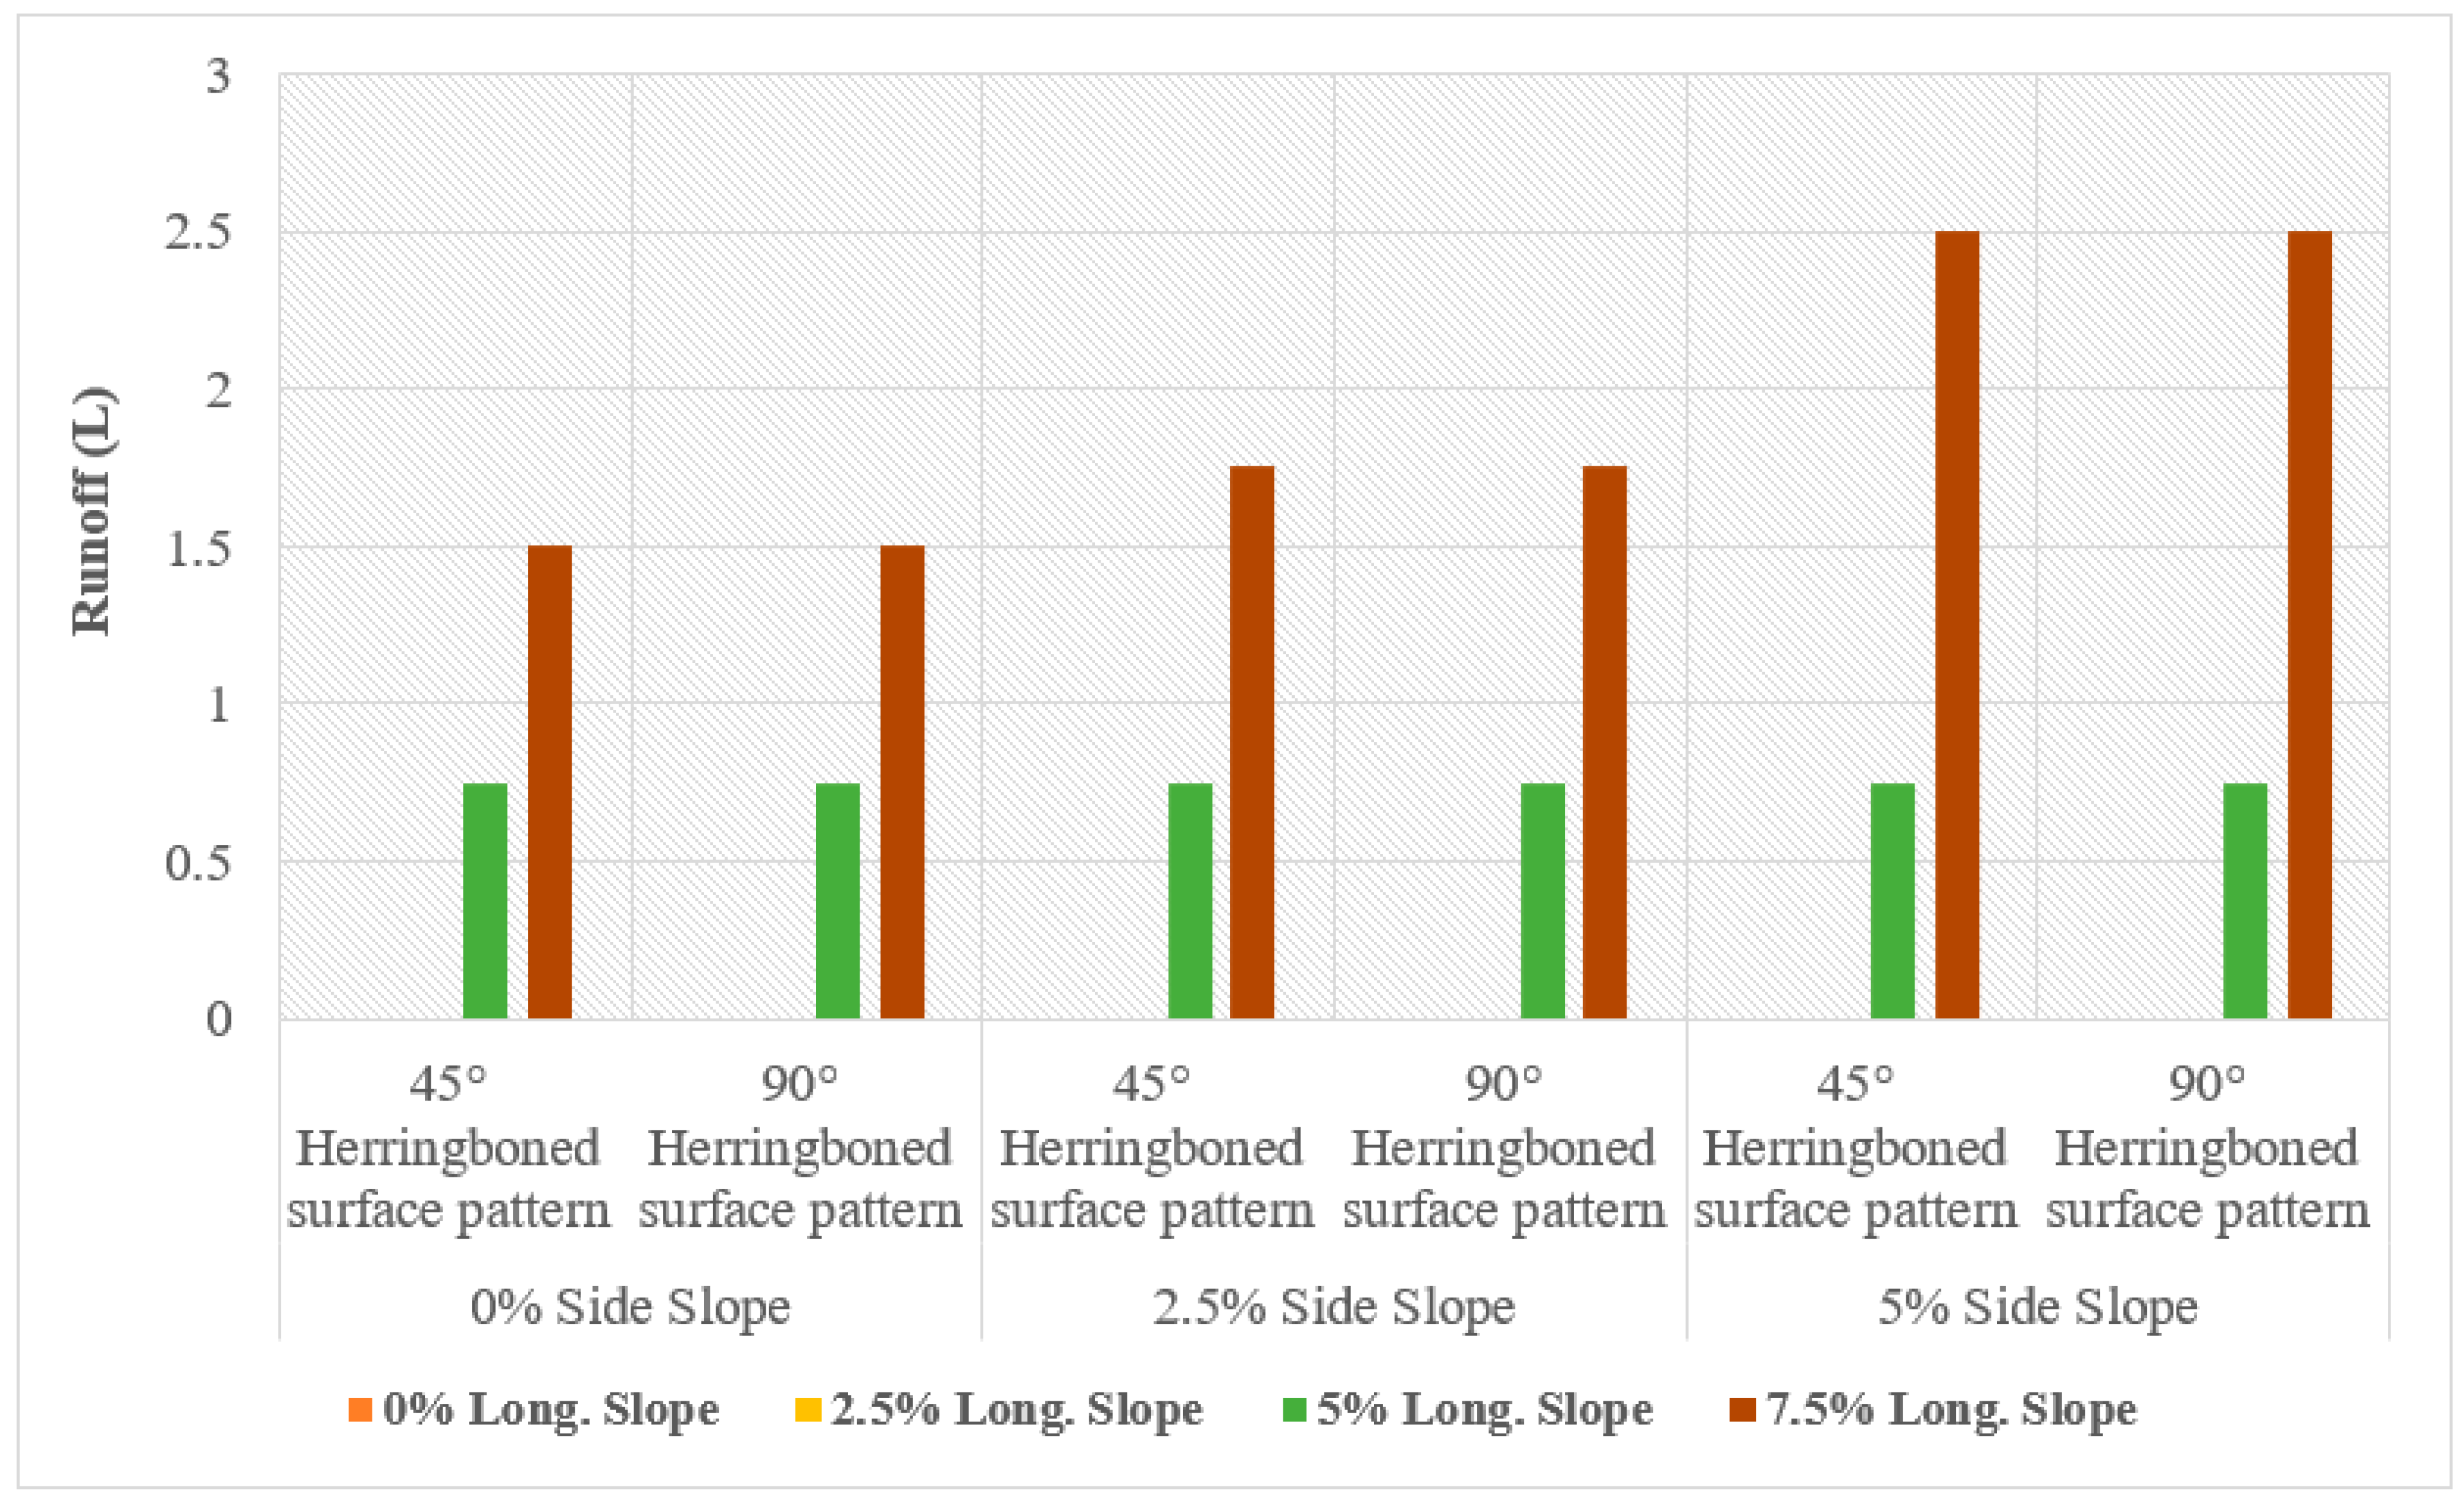
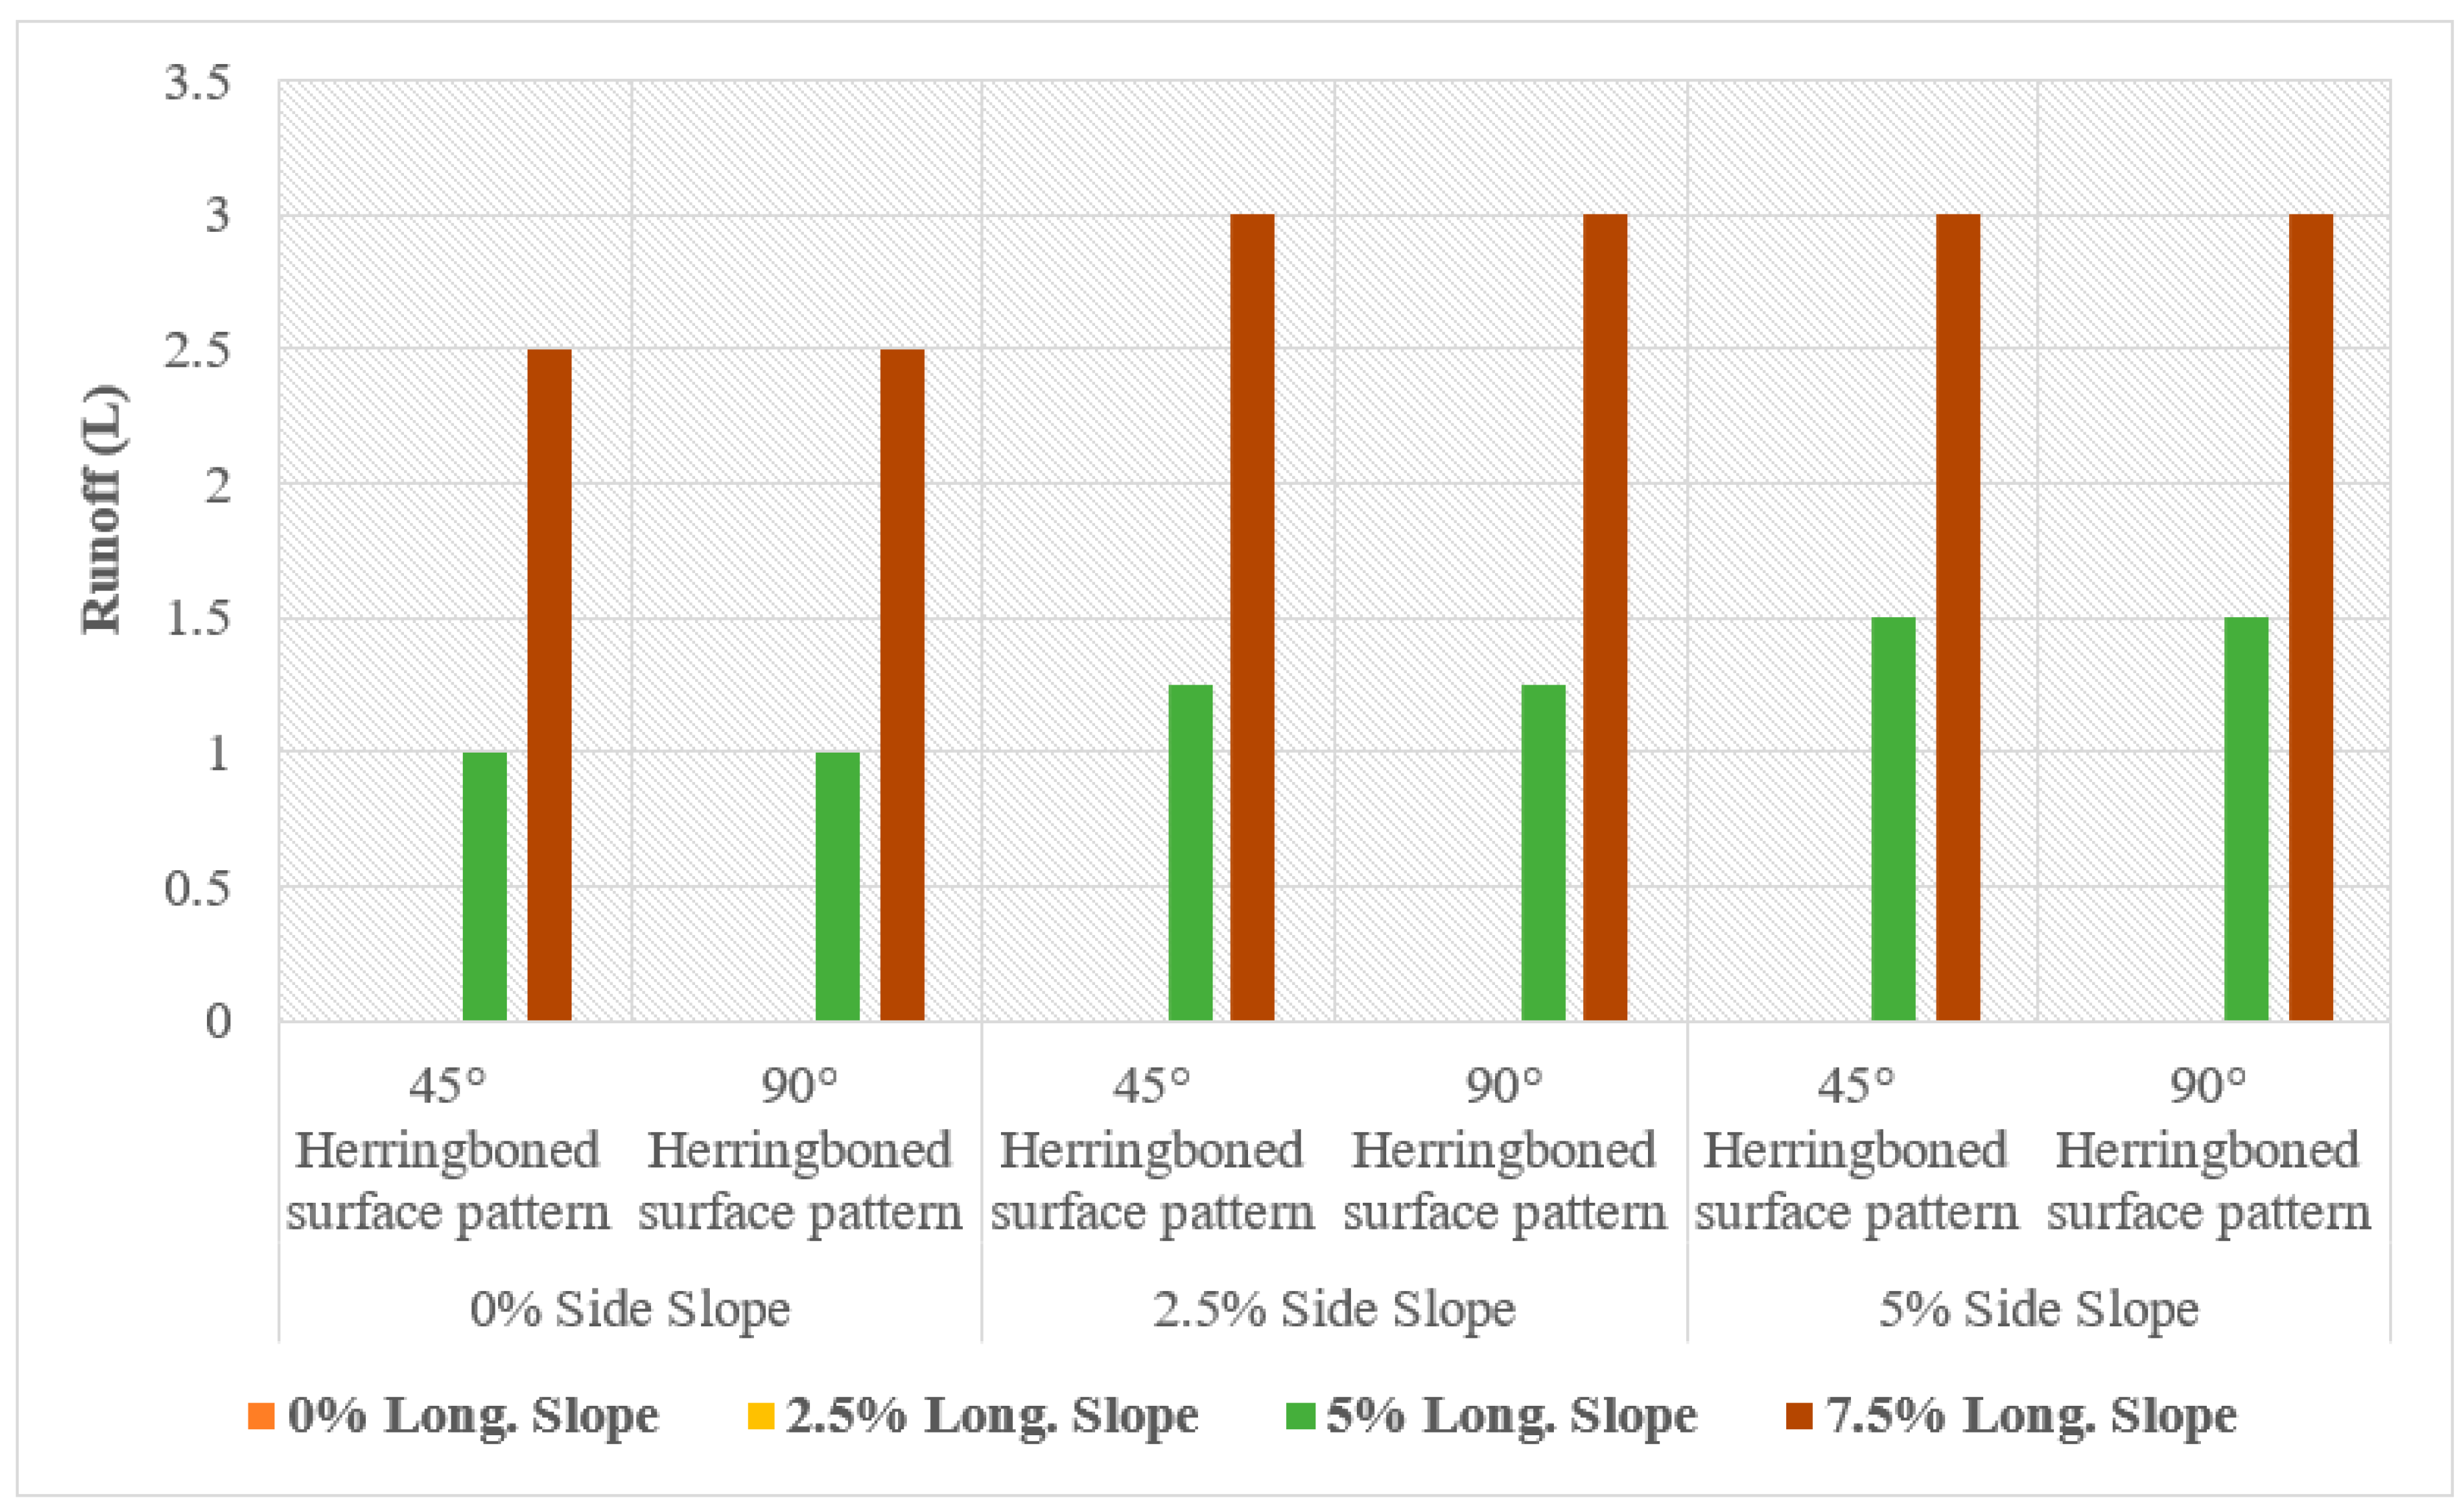
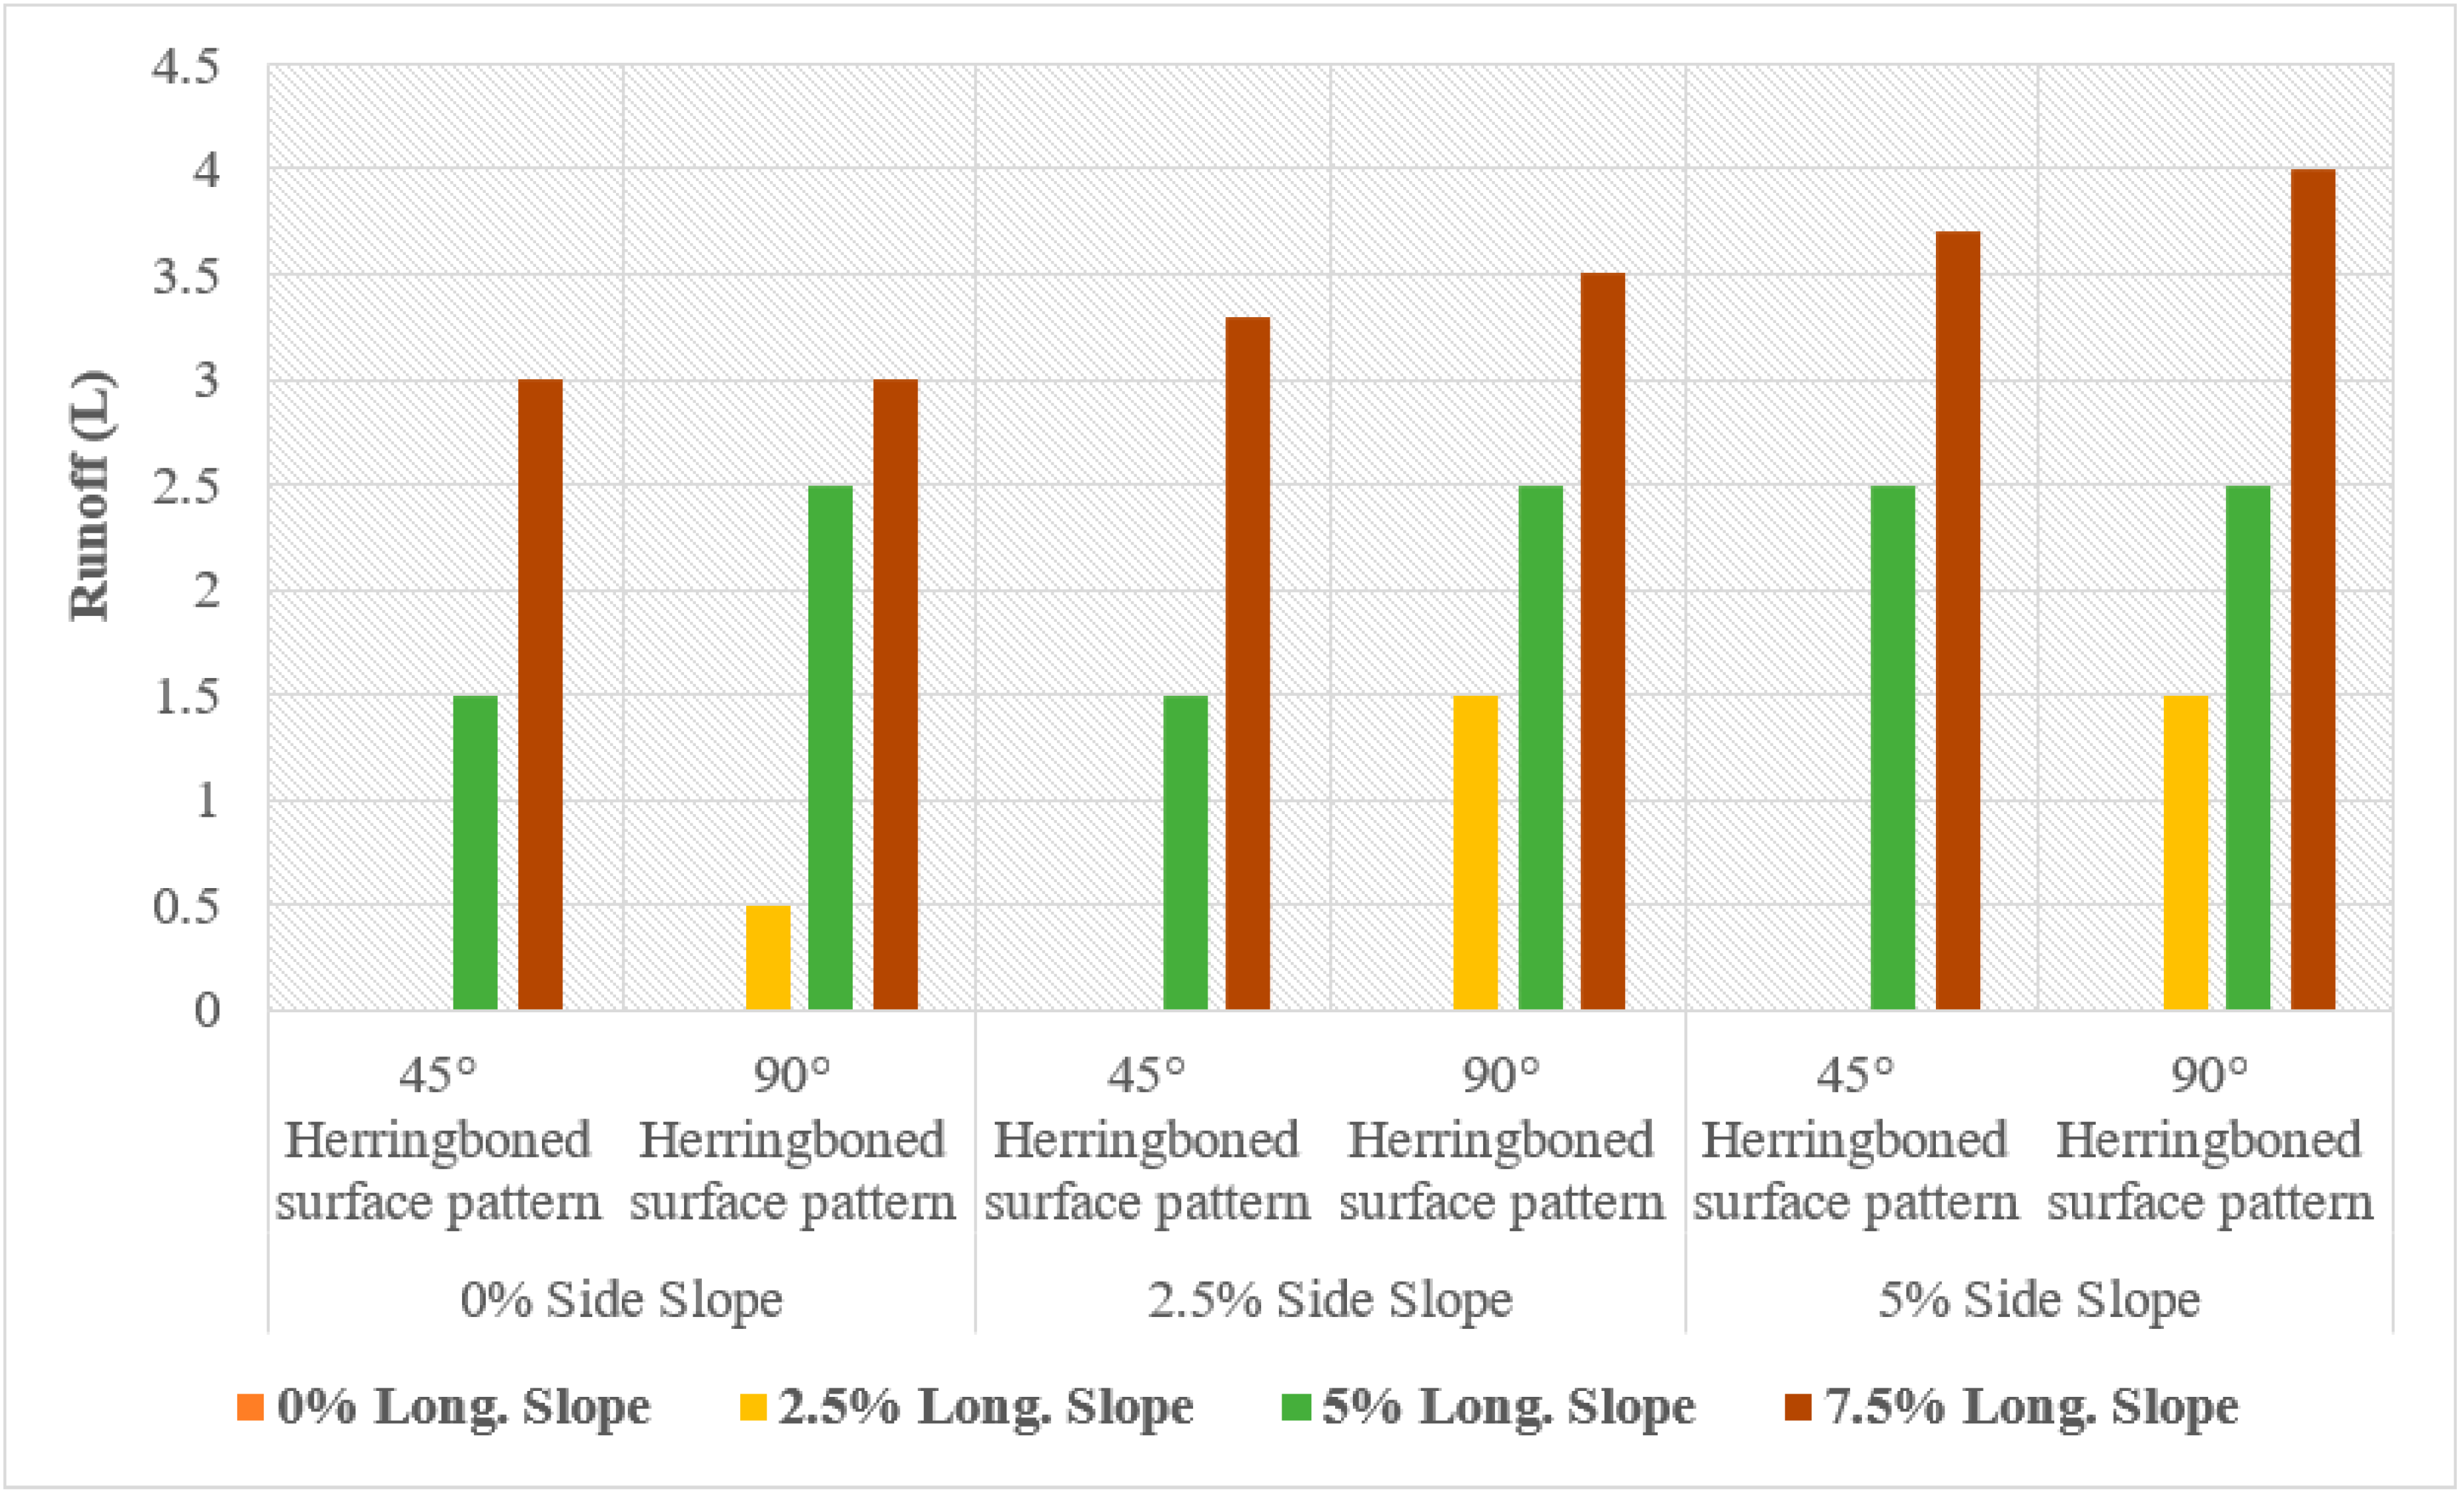
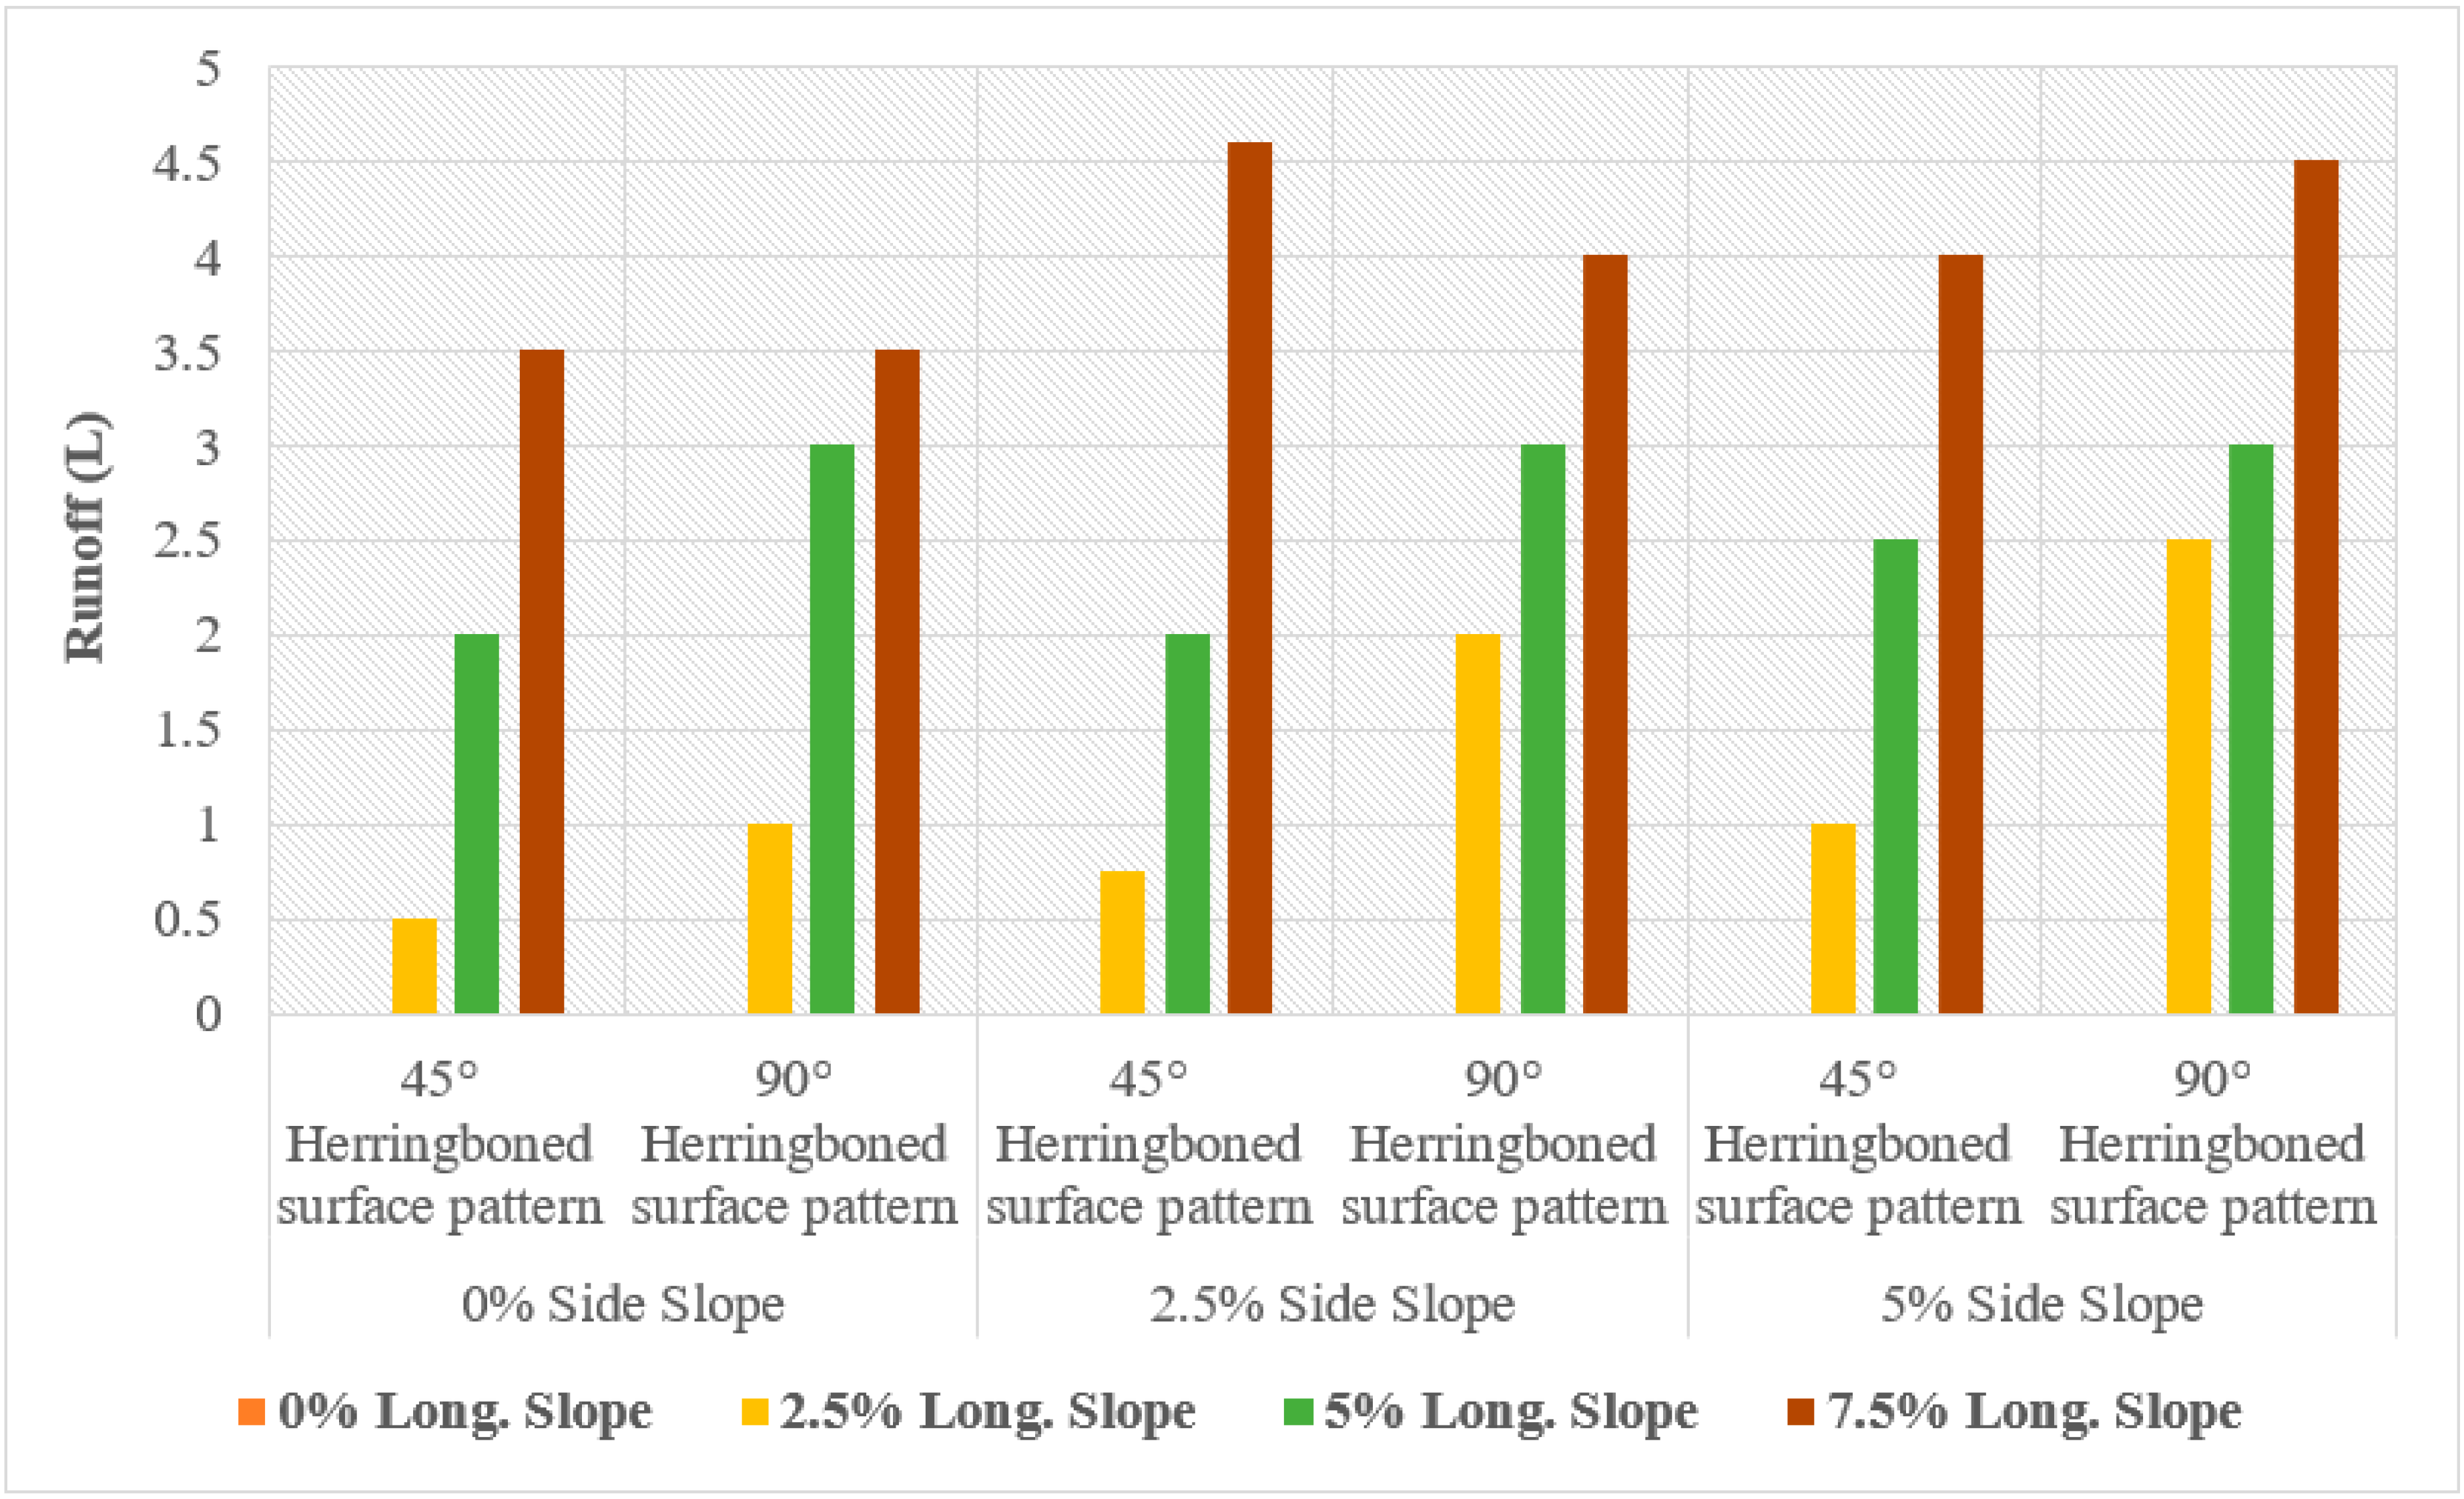
3.3. Runoff Water Volume for Both Surface Types of PICP
The level of runoff is greatly affected by the spacing per square meter and the opening size. As shown in Figure 33, Figure 34, Figure 35 and Figure 36, at low rainfall intensities (25 and 50 L/min), the volume of runoff water was equal to zero at 0 and 2.5% longitudinal slopes, corresponding to all values of side slopes at 0, 2.5, and 5%. In addition, the runoff appeared at 5 and 7.5% longitudinal slopes with equal levels for both 45° and 90° herringboned surface patterns.
At high rainfall intensities (75 and 100 L/min), the runoff levels were equal to zero at 0% longitudinal slopes, corresponding to all values of side slopes at 0, 2.5, and 5%. By increasing the longitudinal slopes from 0 to 2.5% to 5 to 7.5%, the runoff appeared and started to increase by increasing the values of geometrical slopes. Furthermore, high runoff was recorded for the 90° herringboned surface pattern compared to that recorded for the 45° herringboned surface pattern, due to lower water infiltration of the 90° herringboned surface pattern at high rainfall intensities in comparison to the 45° herringboned surface pattern.
This study and Smith et al. [46] explored the application of PICP to control surface runoff during different rainfall events. To improve the results of the previous research, the current study enlarged the design parameters of the PICP by using varied rainfall intensities, a new geometric design for the surface, and different block spacing.
Although residual runoff is the most essential component in conducting the optimal surface pattern, other key factors, such as the ultimate loading resistance of traffic, aesthetics, and functionality, as well as the performance of the structure hydraulically, must be taken into account.
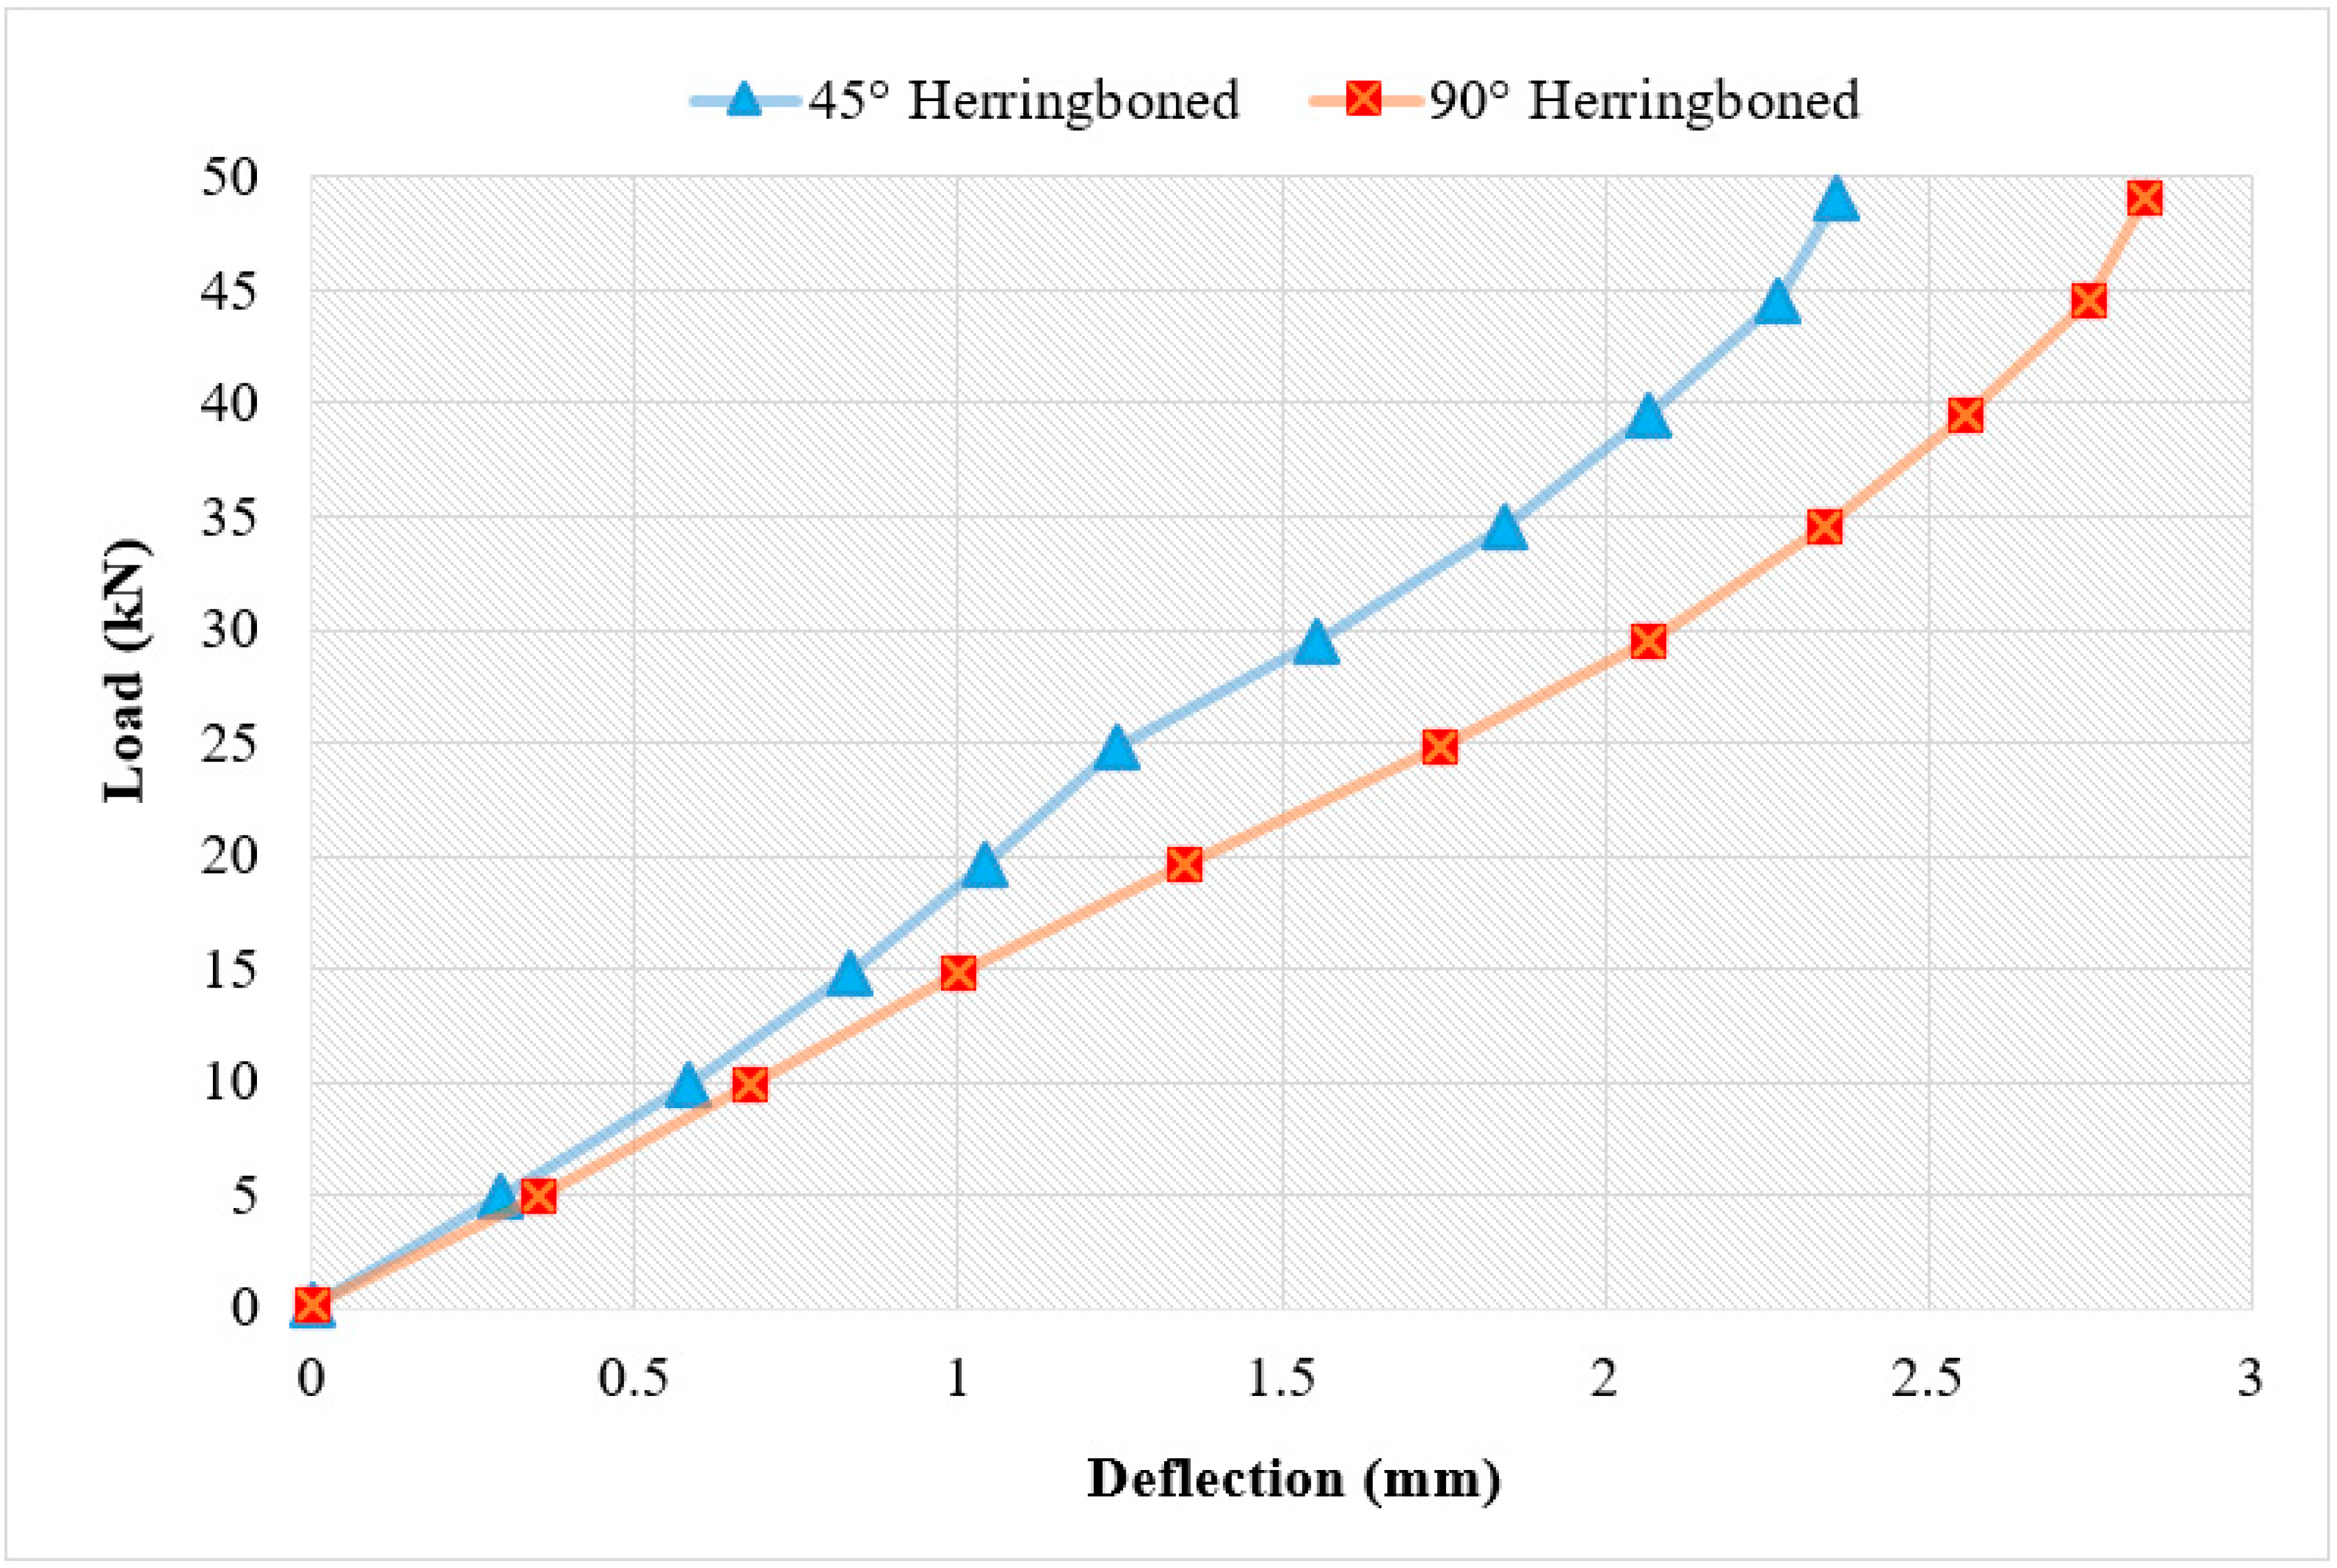
3.4. Load-Resistance forBboth Types of PICP
Many factors affect PICP behavior under static loading test, including the following: Paver’s shape: The employed blocks were rectangular with a thickness of 80 mm, a length of 20 cm, and a width of 10 cm. The performance of a loaded PICP is significantly influenced by the design of the pavers, whereas the ability of pavers to transfer a load is determined by the vertical contact area and the frictional surfaces of the blocks.
Paver’s thickness: Due to their high friction area, thick concrete blocks distribute loads well. Thus, 80-cm-thick concrete blocks reduce the developed deflection.
Spacing size between the pavers: 10 mm spacing between the blocks was selected to construct the permeable surface, whereas the behavior of such a system exhibited less deflection due to substantial frictional forces between the blocks at 10 mm spacings.
Surface pattern of pavers: For this kind of pavement, different surface patterns are used. The conducted patterns in this research were 45° and 90° herringboned surface patterns.
As shown in Figure 37, the 45° herringboned surface pattern showed high resistance to deflection in comparison to the 90° herringboned surface pattern, due to the high structural bonding between the blocks at the 45° herringboned surface pattern. This result accorded well with the results gained by Pal et al. [47] which indicated an appropriate aperture diameter and its laying pattern to maximize the permeability of interlocking concrete paver blocks (CPBs) and investigating their impact on strength. In addition, the current work continued the earlier work by using two types of PICP laying patterns and evaluating those two types under static loading.
4. Conclusions
After operating the rainfall simulator at various intensities, the PICP function was revealed by displaying the distribution of infiltrated water beneath the layers of PICP in terms of water volume collected in the containers at all the adopted slopes in both longitudinal and transverse directions. The volume of surface runoff was measured at various geometrical slopes and design parameters to determine the quantity of surface runoff. In addition, a static loading test was used to assess the load resistance of permeable herringboned concrete blocks. The following conclusions were drawn from the results and from earlier discussions.
i. PICP with the 45° herringboned surface pattern infiltrated more water at high rainfall intensities (75 and 100 L/min) at all the applied longitudinal slopes (0, 2.5, 5, and 7.5%) and side slopes (0, 2.5, and 5%), compared to PICP with the 90° herringbone pattern.
ii. At high rainfall intensities, PICP with the 45° herringboned surface pattern resultedin a greater runoff volume, compared to PICP with the 45° herringbone surface pattern, at all the applied longitudinal slopes and side slopes.
iii. The load resistance of PICP with the 45° herringboned surface pattern was higher than that of PICP with the 90° herringboned surface pattern under the same static loading conditions.
iv. The behavior of PICP with the 45° herringbone surface pattern, in terms of runoff reduction and load resistance, was better than that of PICP with the 90° herringboned surface pattern under the same geometrical and weathering conditions.
v. Both surface patterns of PICP (45° and 90° herringbone) showed high performance during the operating tests, putting them at the same level as regular pavement.
The surface patterns of permeable interlocking pavement were considered in terms of ability to infiltrate water, runoff volume, and behavior under static loading at different longitudinal and side slopes and various rainfall intensities. However, the main limitations of this study were that we employed only one spacing value between permeable pavers and did not perform a statistical analysis. Future efforts should thoroughly investigate these issues.
In summary, PICP with 45° and 90° herringboned surface patterns are effective design options for permeable interlocking concrete pavements (PICPs), due to their interlocking geometry, which provides greater structural stability and load-bearing capacity. However, the success of a PICP project depends on proper design, proper installation, and proper maintenance to ensure effective stormwater management and long-term durability. It is important to consider the design of the base and subbase, the thickness of the aggregate layers, and regular maintenance to ensure the long-term effectiveness of PICP as a stormwater management tool.
Author Contributions
Conceptualization, M.S.N. and T.M.H.; validation, A.S. and A.K.; formal analysis, A.S.; investigation, M.S., T.M.H. and A.S.; resources, A.S. and A.K.; writing—original draft preparation, M.S.N., A.K., T.M.H. and A.S.; writing—review and editing, M.S.N., A.K., T.M.H. and A.S.; visualization, M.S.N., A.K., T.M.H. and A.S.; supervision, M.S.N. and M.S.; project administration, M.S.N. All authors have read and agreed to the published version of the manuscript.
Funding
This research received no external funding.
Data Availability Statement
Date provided within manuscript.
Conflicts of Interest
The authors declare no conflict of interest.
References
- Hussein, S.A.; Al-Khafaji, Z.; Alfatlawi, T.J.M.; Abbood, A.-K.N. Improvement of Permeable Asphalt Pavement by adding Crumb Rubber. Open Eng. 2022, 12, 1030–1037. [Google Scholar] [CrossRef]
- Hashim, T.M.; Nasr, M.S.; Jebur, Y.M.; Kadhim, A.; Alkhafaji, Z.; Baig, M.G.; Adekunle, S.K.; Al-Osta, M.A.; Ahmad, S.; Yaseen, Z.M. Evaluating Rutting Resistance of Rejuvenated Recycled Hot-Mix Asphalt Mixtures Using Different Types of Recycling Agents. Materials 2022, 15, 8769. [Google Scholar] [CrossRef] [PubMed]
- Al-Khafaji, Z.S.; Jafer, H.; Dulaimi, A.F.; Atherton, W.; Al Masoodi, Z. The Soft Soil Stabilisation Using Binary Blending of Ordinary Portland Cement And High Alumina Silica Waste Material. In Proceedings of the The 3rd BUiD Doctoral Research Conference, Dubai, United Arab Emirates, 13 May 2017. [Google Scholar]
- Al-Masoodi, Z.O.; Al-Khafaji, Z.; Jafer, H.M.; Dulaimi, A.; Atherton, W. The effect of a high alumina silica waste material on the engineering properties of a cement-stabilised soft soil. In Proceedings of the 3rd BUiD Doctoral Research Conference, Dubai, United Arab Emirates, 13 May 2017. [Google Scholar]
- Al-Masoodi, Z.; Dulaimi, A.; Jafer, H.; Al-Khafaji, Z.; Atherton, W.; Safa, H. Soft Soil Treated with Waste Fluid Catalytic Cracking as a Sustainable Stabilizer Material. Iraqi Geol. J. 2022, 54, 84–98. [Google Scholar] [CrossRef]
- Hussain, A.J.; Al-Khafaji, Z.S. Reduction of environmental pollution and improving the (Mechanical, physical and chemical characteristics) of contaminated clay soil by using of recycled oil. J. Adv. Res. Dyn. Control Syst. 2020, 12, 1276–1286. [Google Scholar] [CrossRef]
- Hein, D.K.; Eng, P. Development of an ASCE standard for permeable interlocking concrete pavement. In Proceedings of the 2014 Conference of the Transportation Association of Canada Montréal, Montreal, QC, Canada, 28 September–1 October 2014; Volume 416, pp. 1–15. [Google Scholar]
- Yaseen, Z.M.; Jaafar, O.; Deo, R.C.; Kisi, O.; Adamowski, J.; Quilty, J.; El-Shafie, A. Stream-flow forecasting using extreme learning machines: A case study in a semi-arid region in Iraq. J. Hydrol. 2016, 542, 603–614. [Google Scholar] [CrossRef]
- Okasha, A.M.; Deraz, N.; Elmetwalli, A.H.; Elsayed, S.; Falah, M.W.; Farooque, A.A.; Yaseen, Z.M. Effects of Irrigation Method and Water Flow Rate on Irrigation Performance, Soil Salinity, Yield, and Water Productivity of Cauliflower. Agriculture 2022, 12, 1164. [Google Scholar] [CrossRef]
- Leipard, A.R.; Kevern, J.T.; Richardson, J.R. Hydraulic characterization and design of permeable interlocking concrete pavement. In Proceedings of the World Environmental and Water Resources Congress 2015, Austin, TX, USA, 17–21 May 2015. [Google Scholar]
- Hussein, S.A.; Al-Khafaji, Z.; Alfatlawi, T.; Abbood, A.-K.N. Assessment of Surface and Subsurface Drainage from Permeable Friction Course (As a Sustainable Pavement) under Different Geometric and Hydrologic Conditions. Iraqi Geol. J. 2022, 55, 196–207. [Google Scholar] [CrossRef]
- Smith, D.R. Permeable Interlocking Concrete Pavement [Techbrief]; Federal Highway Administration: Washington, DC, USA, 2019.
- Kayhanian, M.; Li, H.; Harvey, J.T.; Liang, X. Application of permeable pavements in highways for stormwater runoff management and pollution prevention: California research experiences. Int. J. Transp. Sci. Technol. 2019, 8, 358–372. [Google Scholar] [CrossRef]
- Drake, J.; Bradford, A.; Van Seters, T. Stormwater quality of spring–summer-fall effluent from three partial-infiltration permeable pavement systems and conventional asphalt pavement. J. Environ. Manag. 2014, 139, 69–79. [Google Scholar] [CrossRef]
- Drake, J.; Sarabian, T.; Jody, S. Maintenance Equipment Testing on Accelerated Clogged Permeable Interlocking Concrete Pavements; Interlocking Concrete Pavement Institute Foundation for Education and Research: Chantilly, VA, USA, 2020. [Google Scholar]
- Milad, A.; Adwan, I.; Majeed, S.A.; Yusoff, N.I.M.; Al-Ansari, N.; Yaseen, Z.M. Emerging Technologies of Deep Learning Models Development for Pavement Temperature Prediction. IEEE Access 2021, 9, 23840–23849. [Google Scholar] [CrossRef]
- Milad, A.; Yusoff, N.I.M.; Majeed, S.A.; Ali, Z.H.; Solla, M.; Al-Ansari, N.; Rahmat, R.A.; Yaseen, Z.M. An Educational Web-Based Expert System for Novice Highway Technology in Flexible Pavement Maintenance. Complexity 2021, 2021, 6669010. [Google Scholar] [CrossRef]
- Al Qurishee, M. Application of geosynthetics in pavement design. Int. Res. J. Eng. Technol. 2017, 4, 1–7. [Google Scholar]
- Zhang, K.; Kevern, J. Review of porous asphalt pavements in cold regions: The state of practice and case study repository in design, construction, and maintenance. J. Infrastruct. Preserv. Resil. 2021, 2, 4. [Google Scholar] [CrossRef]
- Hein, D.K.; Strecker, E.; Poresky, A.; Roseen, R. Permeable Shoulders with Stone Reservoirs; American Association of State Highway and Transportation Officials (AASHTO): Washington, DC, USA; Standing Committee on the Environment: Washington, DC, USA, 2013.
- Revitt, D.M.; Lundy, L.; Coulon, F.; Fairley, M. The sources, impact and management of car park runoff pollution: A review. J. Environ. Manag. 2014, 146, 552–567. [Google Scholar] [CrossRef] [PubMed]
- Weiss, P.T.; Kayhanian, M.; Khazanovich, L.; Gulliver, J.S. Permeable Pavements in Cold Climates: State of the Art and Cold Climate Case Studies; Center for Transportation Studies, University of Minnesota: Minneapolis, MN, USA, 2015. [Google Scholar]
- Admute, A.M.; Gandhi, A.V.; Adsul, S.S.; Agarkar, A.A.; Bhor, G.S.; Kolte, G.P. Permeable pavements: New technique for construction of road pavements in India. Int. Res. J. Eng. Technol. 2017, 4, 1810–1814. [Google Scholar]
- Zoccali, P.; Loprencipe, G.; Galoni, A. Sampietrini stone pavements: Distress analysis using pavement condition index method. Appl. Sci. 2017, 7, 669. [Google Scholar] [CrossRef]
- Hashim, T.M.; Al-mulali, M.Z.; Al-Khafaji, F.F.; Alwash, A.A.A.; Ali, Y.A. An Experimental Comparison between Different Types of Surface Patterns of Permeable Interlocking Concrete Pavement for Roadway Subsurface Drainage. Case Stud. Constr. Mater. 2022, 17, e01227. [Google Scholar] [CrossRef]
- Poulikakos, L.D.; Gubler, R.; Partl, M.N.; Pittet, M.; Arnaud, L.; Junod, A.; Dumont, A.-G.; Simond, E. Mechanical Properties of Porous Asphalt, Recommendations for Standardization; EMPA: Dübendorf, Switzerland, 2006. [Google Scholar]
- Huang, B.; Wu, H.; Shu, X.; Burdette, E.G. Laboratory evaluation of permeability and strength of polymer-modified pervious concrete. Constr. Build. Mater. 2010, 24, 818–823. [Google Scholar] [CrossRef]
- Lichten, K.; Schaus, L.K. How Should You Be Designing Your Permeable Pavements? New ASCE Standard. In Proceedings of the World Environmental and Water Resources Congress 2017, Sacramento, CA, USA, 21–25 May 2017; pp. 266–281. [Google Scholar]
- Liu, B.K.; Armitage, N.P. The link between Permeable Interlocking Concrete Pavement (PICP) design and nutrient removal. Water 2020, 12, 1714. [Google Scholar] [CrossRef]
- Simpson, I.M.; Winston, R.J.; Tirpak, R.A. Assessing maintenance techniques and in-situ pavement conditions to restore hydraulic function of permeable interlocking concrete pavements. J. Environ. Manag. 2021, 294, 112990. [Google Scholar] [CrossRef] [PubMed]
- Nichols, P.W.B.; Lucke, T.; Dierkes, C. Comparing two methods of determining infiltration rates of permeable interlocking concrete pavers. Water 2014, 6, 2353–2366. [Google Scholar] [CrossRef]
- Tirpak, A.; Winston, R.J.; Feliciano, M.; Dorsey, J.D. Stormwater quality performance of permeable interlocking concrete pavement receiving run-on from an asphalt traffic lane in a cold climate. Environ. Sci. Pollut. Res. 2020, 27, 21716–21732. [Google Scholar] [CrossRef]
- Smith, D.R.; Hein, D.K. Development of a National ASCE standard for permeable interlocking concrete pavement. In Proceedings of the Second Conference on Green Streets, Highways, and Development, Austin, TX, USA, 3–6 November 2013; pp. 89–105. [Google Scholar]
- Imran, H.M.; Akib, S.; Karim, M.R. Permeable pavement and stormwater management systems: A review. Environ. Technol. 2013, 34, 2649–2656. [Google Scholar] [CrossRef]
- Van Vuuren, J.H.; Dippenaar, M.A.; Van Biljon, R.; Van Rooy, L. Seepage through permeable interlocking concrete pavements and their subgrades using a large infiltration table apparatus. Int. J. Pavement Res. Technol. 2022, 15, 44–62. [Google Scholar] [CrossRef]
- Alzamly, S.A.; Aldefae, A.H.; Humaish, W.H.; Sinichenko, E.K.; Zubaidi, S.L. Design and manufacturing of rainfall simulator machine for the soil erosion investigation. In Geotechnical Engineering and Sustainable Construction: Sustainable Geotechnical Engineering; Springer: Berlin/Heidelberg, Germany, 2022; pp. 177–190. [Google Scholar]
- Mhaske, S.N.; Pathak, K.; Basak, A. A comprehensive design of rainfall simulator for the assessment of soil erosion in the laboratory. Catena 2019, 172, 408–420. [Google Scholar] [CrossRef]
- Yusuf, K.O.; Olaoke, S.O.; Iwayemi, A.K.; Adewoye, W.A.; Oyebode, O.O.; Omokore, S. Design and construction of a simple rainfall simulator from locally available materials. LAUTECH J. Eng. Technol. 2015, 9, 13–19. [Google Scholar]
- Mendes, T.A.; Pereira, S.A.D.S.; Rebolledo, J.F.R.; Gitirana, G.D.F.N., Jr.; Melo, M.T.D.S.; Luz, M.P.D. Development of a rainfall and runoff simulator for performing hydrological and geotechnical tests. Sustainability 2021, 13, 3060. [Google Scholar] [CrossRef]
- Kayhanian, M.; Weiss, P.T.; Gulliver, J.S.; Khazanovich, L. The Application of Permeable Pavement with Emphasis on Successful Design, Water Quality Benefits, and Identification of Knowledge and Data Gaps; National Center for Sustainable Transportation: Davis, CA, USA, 2015. [Google Scholar]
- Holmes, N.; O’Malley, H.; Cribbin, P.; Mullen, H.; Keane, G. Performance of masonry blocks containing different proportions of incinator bottom ash. Sustain. Mater. Technol. 2016, 8, 14–19. [Google Scholar] [CrossRef]
- ASTM, C. 563 standard: Standard test method for optimum SO3 in hydraulic cement using 24-h compressive strength. Annu. Book ASTM Stand. Sect. 2017, 4, 279–281. [Google Scholar]
- Kumar, G.R.; Sharma, U.K. Standard test methods for determination of abrasion resistance of concrete. Int. J. Civ. Eng. Res. 2014, 5, 155–162. [Google Scholar]
- Abdollahi, S.F.; Lanotte, M.; Kutay, M.E.; Bahia, H. AASHTO 1993 Plus: An alternative procedure for the calculation of structural asphalt layer coefficients. Int. J. Pavement Eng. 2022, 1–10. [Google Scholar] [CrossRef]
- Knothe, G.J. The Influence of Urbanization on Streams: The Use of GIS Spatial Analysis to Study Land Use Influence on Fish Communities, Water Quality and Physical Habitats in Southeast Texas; University of Houston-Clear Lake: Houston, TX, USA, 2012; ISBN 1267390638. [Google Scholar]
- Smith, D.R.; Sinagra, E.; Duvall, J. Surface Characteristics of Segmental Concrete Pavements Acceptable to Wheelchair Users. In Proceedings of the 12th International Conference on Concrete Block Pavement, Seoul, Republic of Korea, 16–19 October 2018; Volume 16. [Google Scholar]
- Pal, A.C.; Das, S.S. Interlocking aperture concrete block: An answer to permeable pavement. J. Inst. Eng. Ser. A 2019, 100, 427–438. [Google Scholar] [CrossRef]
Figure 1.
Hydraulic designs of PICP [19]. (A) PICP with full-infiltration design; (B) PICP with partial-infiltration design; (C) PICP with no-infiltration design.
Figure 1.
Hydraulic designs of PICP [19]. (A) PICP with full-infiltration design; (B) PICP with partial-infiltration design; (C) PICP with no-infiltration design.

Figure 2.
Surface types of permeable pavements [27]. (A) Porous asphalt; (B) PICP; (C) pervious concrete.
Figure 2.
Surface types of permeable pavements [27]. (A) Porous asphalt; (B) PICP; (C) pervious concrete.

Figure 3.
Different types of PICP surface patterns [28]. (A) Running bond; (B) 90° herringbone; (C) 45° herringbone; (D) double basket wave; (E) single basket wave; (F) Spanish bond.
Figure 3.
Different types of PICP surface patterns [28]. (A) Running bond; (B) 90° herringbone; (C) 45° herringbone; (D) double basket wave; (E) single basket wave; (F) Spanish bond.

Figure 4.
The fabricated simulator.

Figure 5.
Rain-dropping system.

Figure 6.
Water-feeding system.

Figure 7.
A mesh of collecting containers.

Figure 8.
Runoff-collecting container.

Figure 9.
Full-infiltration design.

Figure 10.
Concrete block paver.

Figure 11.
PICP joints’ filling.

Figure 12.
Aggregate gradation of PICP layers. (A) Bedding aggregate; (B) base aggregate; (C) subbase aggregate.
Figure 12.
Aggregate gradation of PICP layers. (A) Bedding aggregate; (B) base aggregate; (C) subbase aggregate.

Figure 13.
Aggregate gradation for PICP layers.

Figure 14.
Layer thicknesses of PICP.

Figure 15.
Water infiltration process within the layers of PICP inside the simulator.

Figure 16.
PICP’s surface patterns. (A) 90° herringbone; (B) 45° herringbone.

Figure 17.
Rainfall on both surface patterns of PICP. (A) 90° herringbone; (B) 45° herringbone.

Figure 18.
Water-gathering containers. (A) Water-gathering containers; (B) 2D drawing of the simulator demonstrating the number of collecting containers.
Figure 18.
Water-gathering containers. (A) Water-gathering containers; (B) 2D drawing of the simulator demonstrating the number of collecting containers.

Figure 19.
PICP loading test for both types of surface patterns. (A) Static load applying; (B) loading of 45° herringbone; (C) loading of 90° herringbone.
Figure 19.
PICP loading test for both types of surface patterns. (A) Static load applying; (B) loading of 45° herringbone; (C) loading of 90° herringbone.


Figure 20.
Water infiltrated volume for both surface patterns of PICP at 0% LS + (0, 2.5, and 5%) SS.
Figure 20.
Water infiltrated volume for both surface patterns of PICP at 0% LS + (0, 2.5, and 5%) SS.

Figure 21.
Water-infiltrated volume for both surface patterns of PICP at 2.5% LS + (0, 2.5, and 5%) SS.
Figure 21.
Water-infiltrated volume for both surface patterns of PICP at 2.5% LS + (0, 2.5, and 5%) SS.

Figure 22.
Water-infiltrated volume for both surface patterns of PICP at 5% LS + (0, 2.5, and 5%) SS.
Figure 22.
Water-infiltrated volume for both surface patterns of PICP at 5% LS + (0, 2.5, and 5%) SS.

Figure 23.
Water-infiltrated volume for both surface patterns of PICP at 7.5% LS + (0, 2.5, and 5%) SS.
Figure 23.
Water-infiltrated volume for both surface patterns of PICP at 7.5% LS + (0, 2.5, and 5%) SS.

Figure 24.
Number of blocks and infiltration area for both 45° and 90° herringboned surface patterns.
Figure 24.
Number of blocks and infiltration area for both 45° and 90° herringboned surface patterns.

Figure 25.
The distribution of infiltrated water from the 45° herringboned surface pattern at 0% LS and 0, 2.5, and 5% SS. (A) 45° herringboned surface pattern at 0% LS and 0% SS; (B) 45° herringboned surface pattern at 0% LS and 2.5% SS; (C) 45° herringboned surface pattern at 0% LS and 5% SS.
Figure 25.
The distribution of infiltrated water from the 45° herringboned surface pattern at 0% LS and 0, 2.5, and 5% SS. (A) 45° herringboned surface pattern at 0% LS and 0% SS; (B) 45° herringboned surface pattern at 0% LS and 2.5% SS; (C) 45° herringboned surface pattern at 0% LS and 5% SS.


Figure 26.
The distribution of infiltrated water from the 90° herringboned surface pattern at 0% LS and 0, 2.5, and 5% SS. (A) 90° herringboned surface pattern at 0% LS and 0% SS; (B) 90° herringboned surface pattern at 0% LS and 2.5% SS; (C) 90° herringboned surface pattern at 0% LS and 5% SS.
Figure 26.
The distribution of infiltrated water from the 90° herringboned surface pattern at 0% LS and 0, 2.5, and 5% SS. (A) 90° herringboned surface pattern at 0% LS and 0% SS; (B) 90° herringboned surface pattern at 0% LS and 2.5% SS; (C) 90° herringboned surface pattern at 0% LS and 5% SS.


Figure 27.
The distribution of infiltrated water from the 45° herringboned surface pattern at 2.5% LS and 0, 2.5, and 5% SS. (A) 45° herringboned surface pattern at 2.5% LS and 0% SS; (B) 45° herringboned surface pattern at 2.5% LS and 2.5% SS; (C) 45° herringboned surface pattern at 2.5% LS and 5% SS.


Figure 28.
The distribution of infiltrated water from the 90° herringboned surface pattern at 2.5% LS and 0, 2.5, and 5% SS. (A) 90° herringboned surface pattern at 2.5% LS and 0% SS; (B) 90° herringboned surface pattern at 2.5% LS and 2.5% SS; (C) 90° herringboned surface pattern at 2.5% LS and 5% SS.


Figure 29.
The distribution of infiltrated water from the 45° herringboned surface pattern at 5% LS and 0, 2.5, and 5% SS. (A) 45° herringboned surface pattern at 5% LS and 0% SS; (B) 45° herringboned surface pattern at 5% LS and 2.5% SS; (C) 45° herringboned surface pattern at 5% LS and 5% SS.
Figure 29.
The distribution of infiltrated water from the 45° herringboned surface pattern at 5% LS and 0, 2.5, and 5% SS. (A) 45° herringboned surface pattern at 5% LS and 0% SS; (B) 45° herringboned surface pattern at 5% LS and 2.5% SS; (C) 45° herringboned surface pattern at 5% LS and 5% SS.


Figure 30.
The distribution of infiltrated water from the 90° herringboned surface pattern at 5% LS and 0, 2.5, and 5% SS. (A) 90° herringboned surface pattern at 5% LS and 0% SS; (B) 90° herringboned surface pattern at 5% LS and 2.5% SS; (C) 90° herringboned surface pattern at 5% LS and 5% SS.
Figure 30.
The distribution of infiltrated water from the 90° herringboned surface pattern at 5% LS and 0, 2.5, and 5% SS. (A) 90° herringboned surface pattern at 5% LS and 0% SS; (B) 90° herringboned surface pattern at 5% LS and 2.5% SS; (C) 90° herringboned surface pattern at 5% LS and 5% SS.


Figure 31.
The distribution of infiltrated water from the 45° herringboned surface pattern at 7.5% LS and 0, 2.5, and 5% SS. (A) 45° herringboned surface pattern at 7.5% LS and 0% SS; (B) 45° herringboned surface pattern at 7.5% LS and 2.5% SS; (C) 45° herringboned surface pattern at 7.5% LS and 5% SS.


Figure 32.
The distribution of infiltrated water from the 90° herringboned surface pattern at 7.5% LS and 0, 2.5, and 5% SS.; (A) 90° herringboned surface pattern at 7.5% LS and 0% SS; (B) 90° herringboned surface pattern at 7.5% LS and 2.5% SS; (C) 90° herringboned surface pattern at 7.5% LS and 5% SS.


Figure 33.
Volume of runoff water at 25 L/min rainfall intensity.

Figure 34.
Volume of runoff water at 50 L/min rainfall intensity.

Figure 35.
Volume of runoff water at 75 L/min rainfall intensity.

Figure 36.
Volume of runoff water at 100 L/min rainfall intensity.

Figure 37.
Load resistance for both types of PICP.


Table 1.
PICP layers in detail.
| Layer Type | Role | Size of Aggregate | Designed Thickness |
|---|---|---|---|
| Concrete pavers | Permeable surface interlocking blocks to withstand the applied loads directly | Normal concrete block with 1:3:5 mixing proportion by volume | 8–10 cm of PICP [25]. |
| Bedding layer | Accommodation of the surface layer and distribution of the applied load to underlying layers | Small-sized, open-graded aggregate (AASHTO No. 8) [25]. | 4–5 cm of PICP [25]. |
| Reservoir layer | Temporary storage for infiltrated water | Base and subbase layers constructed using open-graded aggregate (AASHTO No. 57 over No. 2, 3, or 4) [25]. |
Table 2.
The pavers’ physical characteristics.
| Property | Compressive Strength | Absorption | SO3 | Thickness Reduction due to Abrasion |
|---|---|---|---|---|
| Result | 38.32 N/m2 | 2.63% | 2.75% | 1.84 mm |
| Limits | Minimum 35 N/m2 | Maximum 7% | Maximum 6% by weight of cement | Maximum 3.0 mm |
| Standards | ASTM C140 [41]. | ASTM C140 [41]. | ASTM C563-96 [42]. | ASTM C418 [43]. |
Table 3.
Layer coefficients of permeable pavement [44].
Table 3.
Layer coefficients of permeable pavement [44].
| Paving Layers | Surface Paver and Bedding | Base | Reservoir (Subbase) |
|---|---|---|---|
| Layer coefficient a | 0.3 | 0.09 | 0.06 |
Table 4.
The design depth of the reservoir layer.
| Design Method | Structural Method | Hydraulic Method |
|---|---|---|
| Reservoir depth | 35 cm | 30 cm |
| Design criteria | Minimum 20 cm | |
Disclaimer/Publisher’s Note: The statements, opinions and data contained in all publications are solely those of the individual author(s) and contributor(s) and not of MDPI and/or the editor(s). MDPI and/or the editor(s) disclaim responsibility for any injury to people or property resulting from any ideas, methods, instructions or products referred to in the content. |
© 2023 by the authors. Licensee MDPI, Basel, Switzerland. This article is an open access article distributed under the terms and conditions of the Creative Commons Attribution (CC BY) license (https://creativecommons.org/licenses/by/4.0/).
Share and Cite
MDPI and ACS Style
Shubbar, A.; Nasr, M.S.; Kadhim, A.; Hashim, T.M.; Sadique, M. Performance Comparison of 45° and 90° Herringboned Permeable Interlocking Concrete Pavement. Infrastructures 2023, 8, 97. https://doi.org/10.3390/infrastructures8050097
AMA Style
Shubbar A, Nasr MS, Kadhim A, Hashim TM, Sadique M. Performance Comparison of 45° and 90° Herringboned Permeable Interlocking Concrete Pavement. Infrastructures. 2023; 8(5):97. https://doi.org/10.3390/infrastructures8050097
Chicago/Turabian StyleShubbar, Ali, Mohammed Salah Nasr, Abdullah Kadhim, Tameem Mohammed Hashim, and Monower Sadique. 2023. "Performance Comparison of 45° and 90° Herringboned Permeable Interlocking Concrete Pavement" Infrastructures 8, no. 5: 97. https://doi.org/10.3390/infrastructures8050097