
The Visual Behaviour of the Cyclist: Comparison between Simulated and Real Scenarios

 ,
,  ,
,  and
and
Abstract
:1. Introduction
1.1. Eye Tracking Applied to Road Safety
1.2. The Visual Behavior of Road Users
2. Materials and Methods
2.1. Experimental Procedure
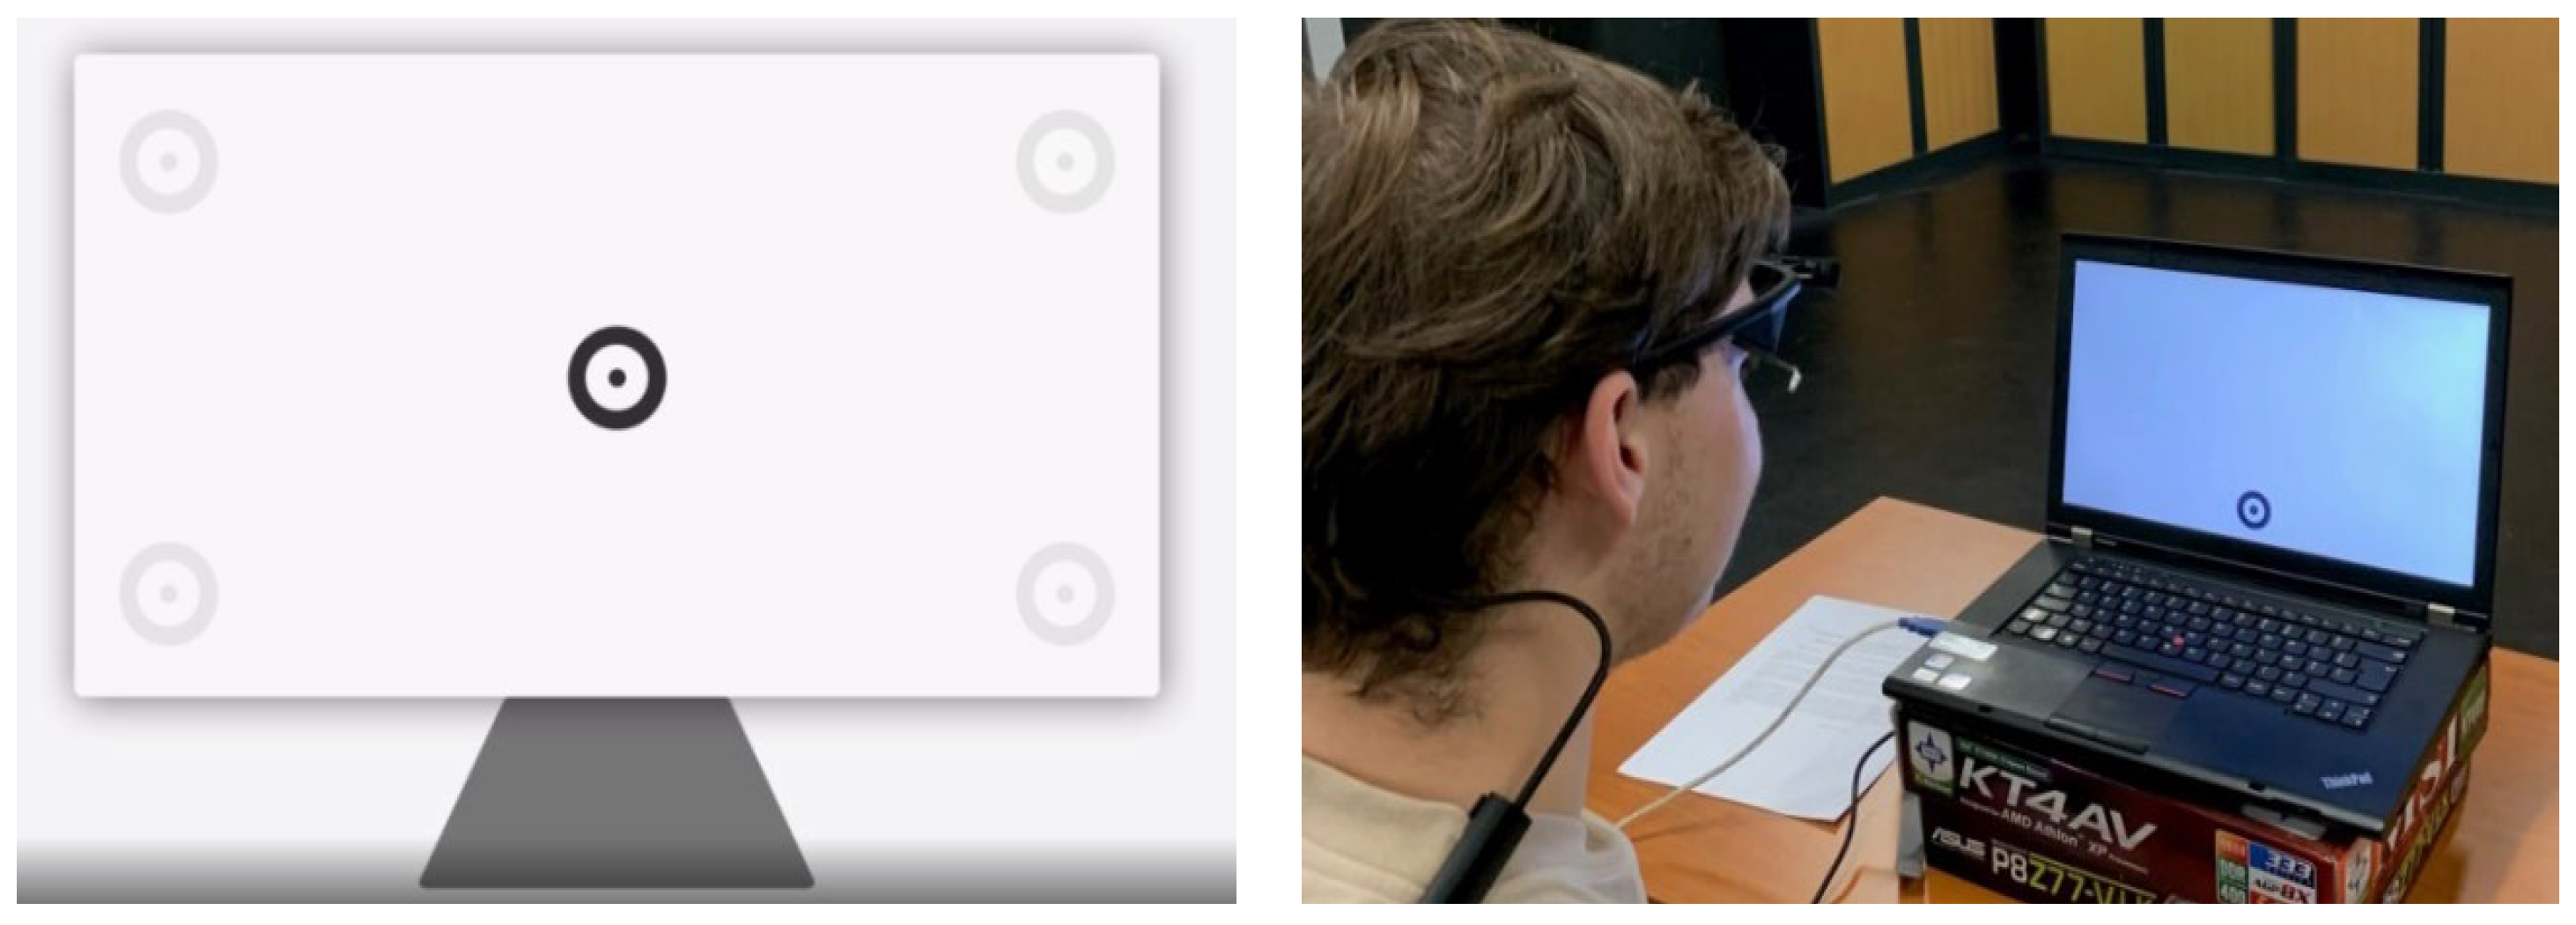
2.2. Instrument and Data Analysis
- Infrastructure, which includes sidewalks and streets;
- Users, correlated with cars, parked cars, pedestrians, and bicycles;
- Signs, considering horizontal, vertical, pedestrian passage, and traffic lights;
- background, including buildings, vegetation, street lamps, and sky;
- Bicycle tests, such as handlebars, pedals, and GPS.
3. Results and Discussion
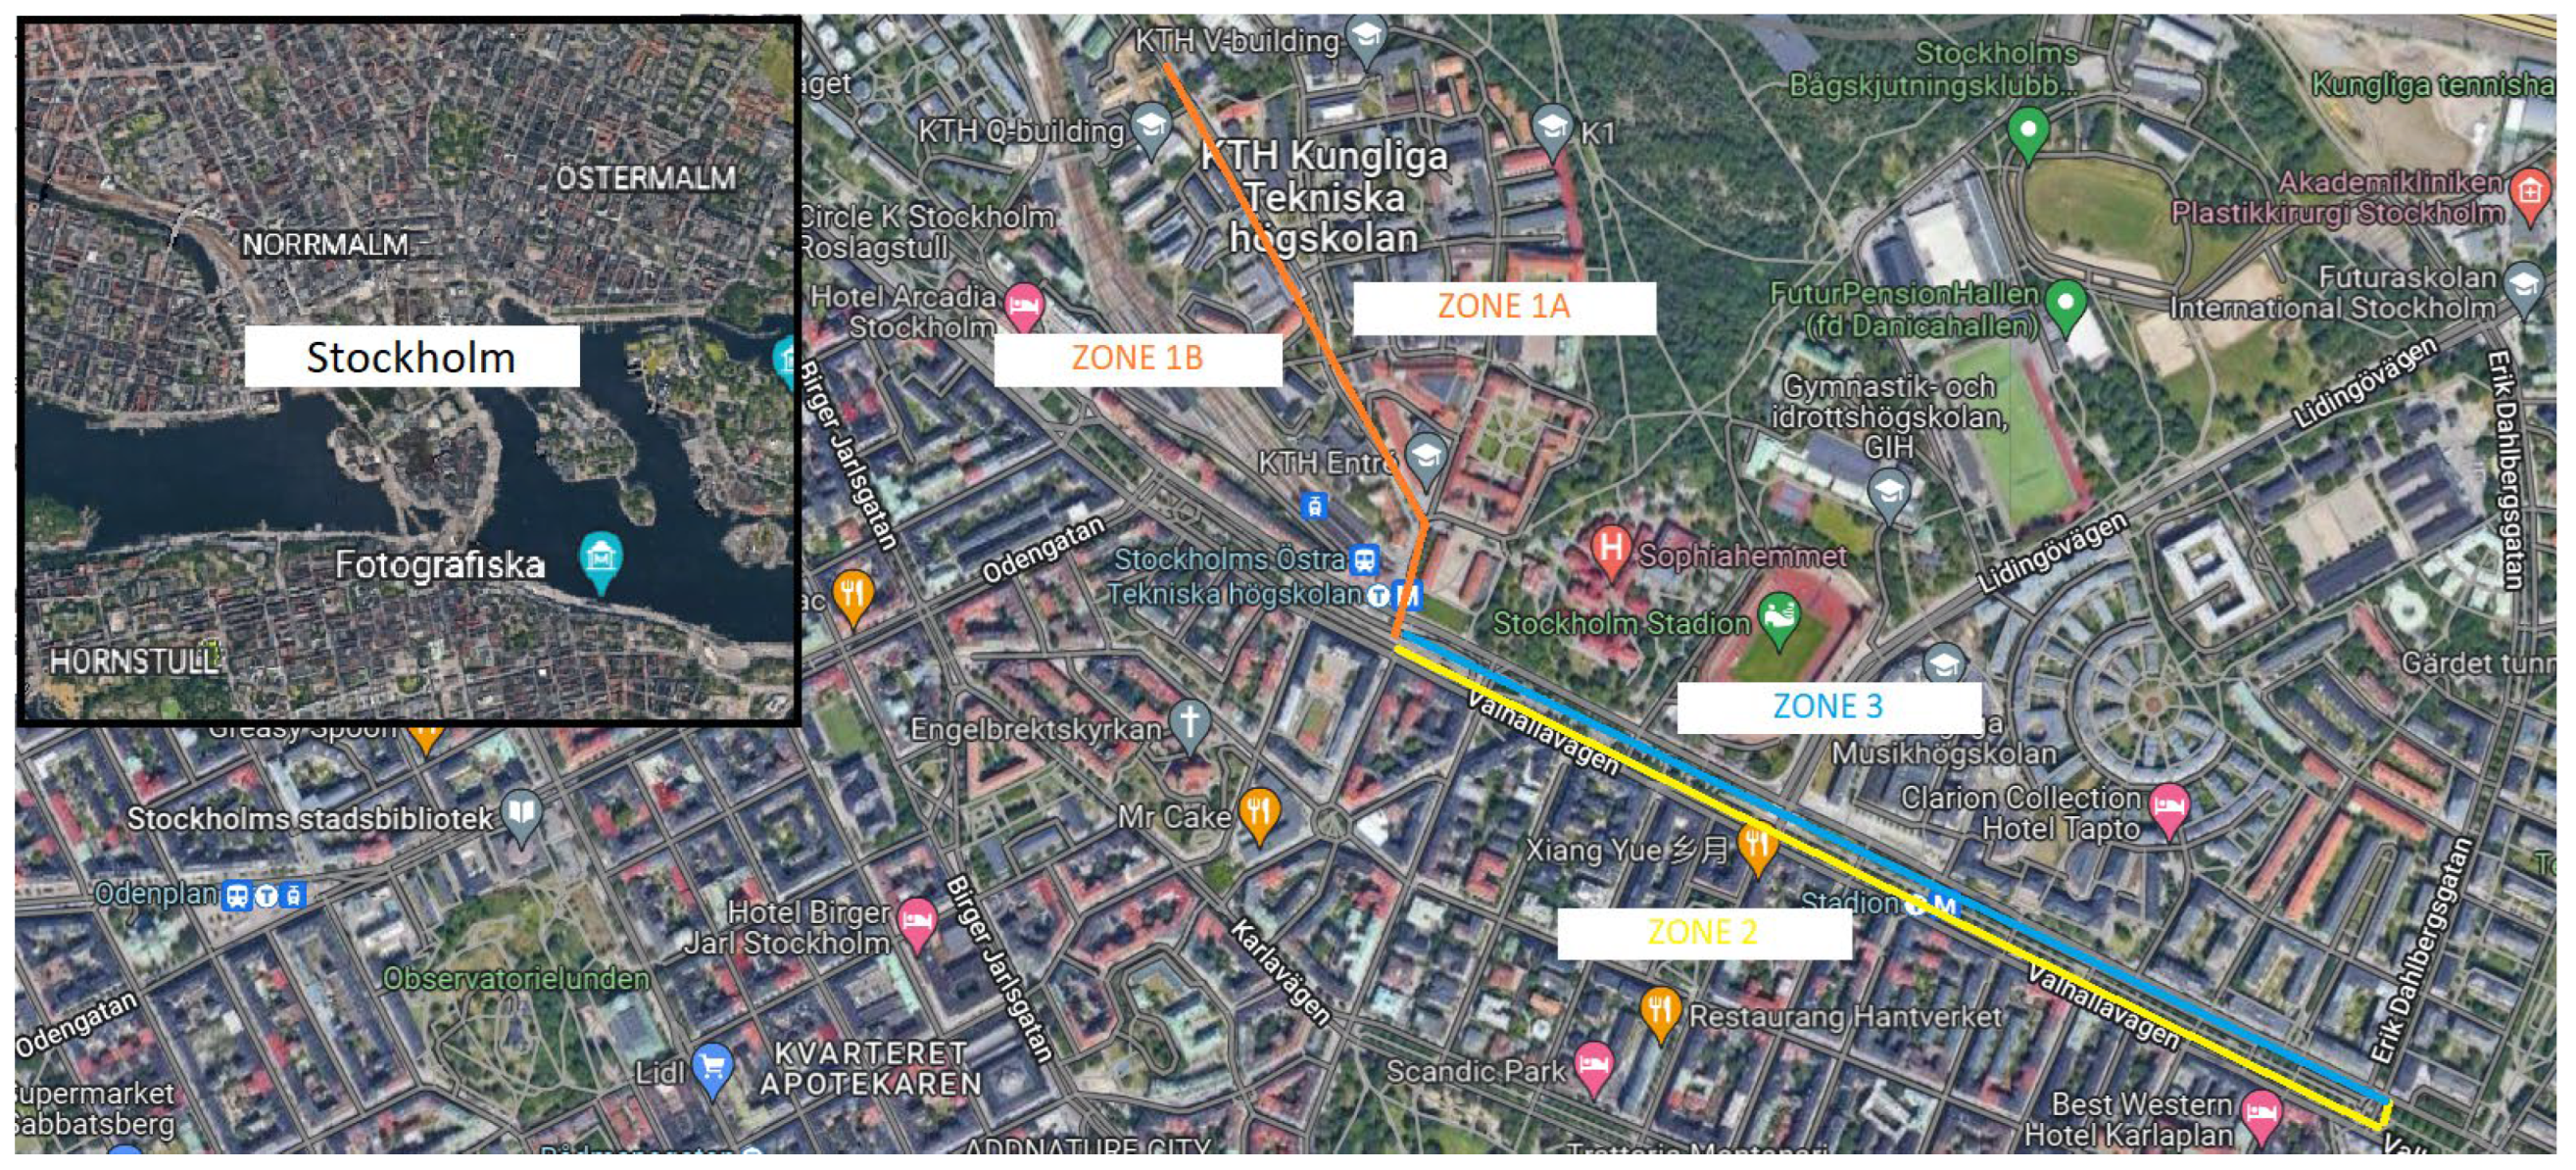
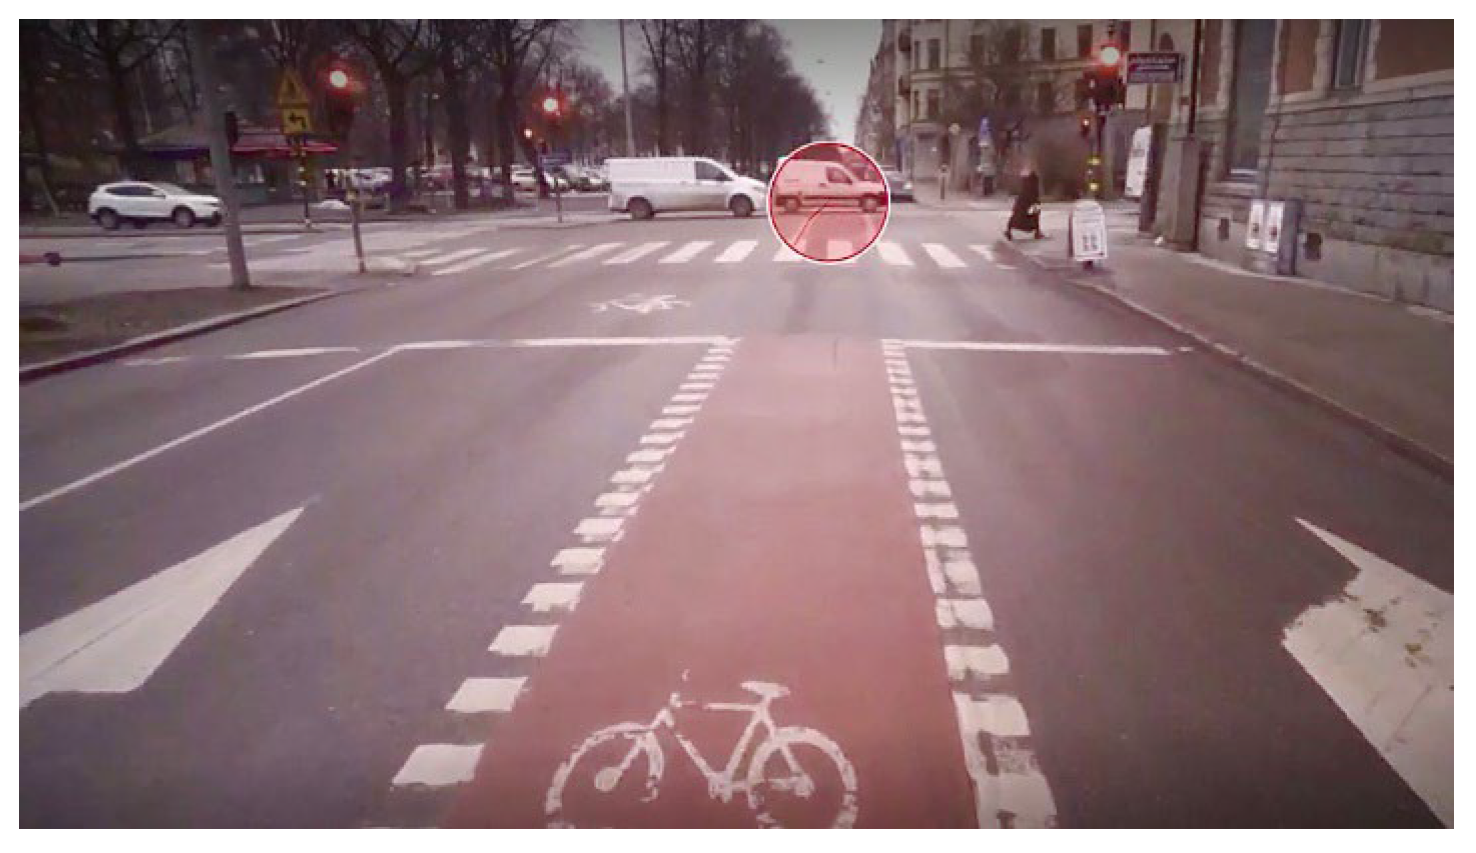
3.1. On-Site Test
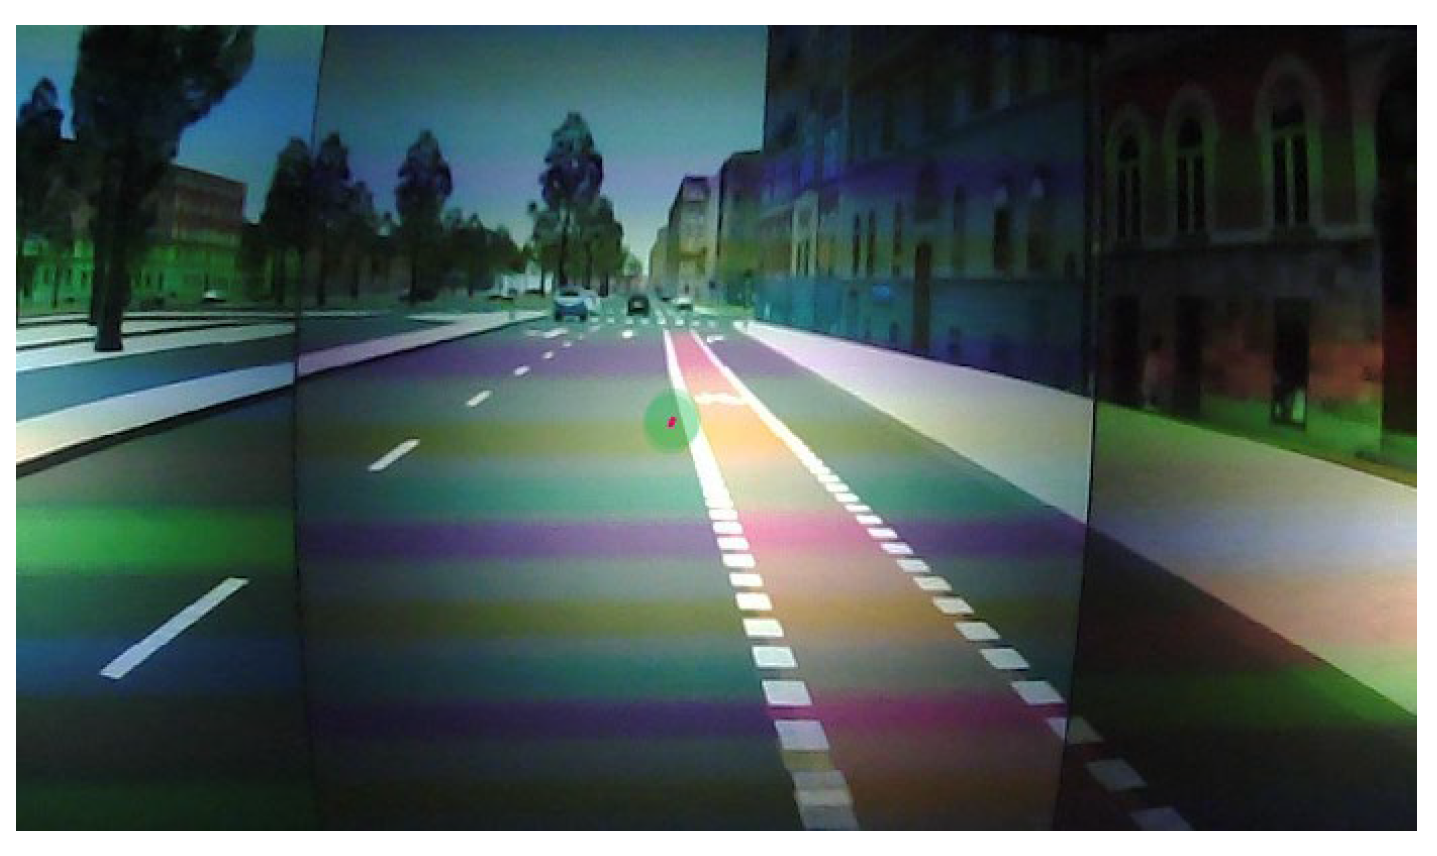
3.2. Simulated Test
3.3. Comparison
4. Conclusions
Author Contributions
Funding
Acknowledgments
Conflicts of Interest
References
- Ahlstrom, C.; Kircher, K.; Kircher, A. A gaze-based driver distraction warning system and its effect on visual behavior. IEEE Trans. Intell. Transp. Syst. 2013, 14, 965–973. [Google Scholar] [CrossRef]
- Massey, H.S.; Whitehead, A.E.; Marchant, D.; Polman, R.C.; Williams, E.L. An investigation of expertise in cycling: Eye tracking, Think Aloud and the influence of a competitor. Psychol. Sport Exerc. 2020, 49, 101681. [Google Scholar] [CrossRef]
- Cortez, A.; Vázquez, P.P. Advanced Visual Interaction with Public Bicycle Sharing Systems. In WSCG 2021 Proceedings; Václav Skala—UNION Agency: Pilsen, Czech Republic, 2021. [Google Scholar]
- Walker, I. Drivers overtaking bicyclists: Objective data on the effects of riding position, helmet use, vehicle type and apparent gender. Accid. Anal. Prev. 2007, 39, 417–425. [Google Scholar] [CrossRef] [PubMed]
- Ryerson, M.S.; Long, C.S.; Fichman, M.; Davidson, J.H.; Scudder, K.N.; Kim, M.; Katti, R.; Poon, G.; Harris, M.D. Evaluating cyclist biometrics to develop urban transportation safety metrics. Accid. Anal. Prev. 2021, 159, 106287. [Google Scholar] [CrossRef]
- Villing, J. Towards Dialogue Strategies for Cognitive Workload Man. Accid. Anal. Prev. 2015, 41, 924–930. [Google Scholar]
- Bucchi, A.; Sangiorgi, C.; Vignali, V. Traffic Psychology and Driver Behavior. Procedia Soc. Behav. Sci. 2012, 53, 972–979. [Google Scholar] [CrossRef]
- Khan, M.Q.; Lee, S. Gaze and eye tracking: Techniques and applications in ADAS. Sensors 2019, 24, 5540. [Google Scholar] [CrossRef]
- Recarte, M.A.; Nunes, L.M. Mental Workload While Driving: Effects on Visual Search, Discrimination, and Decision Making. J. Exp. Psychol. Appl. 2003, 9, 119–137. [Google Scholar] [CrossRef]
- Recarte, M.A.; Nunes, L.M. Effects of Verbal and Spatial-Imagery Tasks on Eye Fixations While Driving. J. Exp. Psychol. Appl. 2000, 6, 31–43. [Google Scholar] [CrossRef]
- Pashkevich, A.; Burghardt, T.E.; Puławska-Obiedowska, S.; Šucha, M. Visual attention and speeds of pedestrians, cyclists, and electric scooter riders when using shared road–a field eye tracker experiment. Case Stud. Transp. Policy 2022, 10, 549–558. [Google Scholar] [CrossRef]
- Nabatilan, L.B.; Aghazadeh, F.; Nimbarte, A.D.; Harvey, C.C.; Chowdhury, S.K. Effect of driving experience on visual behavior and driving performance under different driving conditions. Cogn. Technol. Work. 2012, 14, 355–363. [Google Scholar] [CrossRef]
- Fournier, N.; Bakhtiari, S.; Valluru, K.D.; Campbell, N.; Christofa, E.; Roberts, S.; Knodler, M., Jr. Accounting for drivers’ bicycling frequency and familiarity with bicycle infrastructure treatments when evaluating safety. Accid. Anal. Prev. 2020, 137, 105410. [Google Scholar] [CrossRef] [PubMed]
- Wang, Y.; Bao, S.; Du, W.; Ye, Z.; Sayer, J.R. Examining drivers’ eye glance patterns during distracted driving: Insights from scanning randomness and glance transition matrix. J. Saf. Res. 2017, 63, 149–155. [Google Scholar] [CrossRef] [PubMed]
- Liang, Y.; Lee, J.D. Combining cognitive and visual distraction: Less than the sum of its parts. Accid. Anal. Prev. 2010, 42, 881–890. [Google Scholar] [CrossRef]
- Beratis, I.N.; Pavlou, D.; Papadimitriou, E.; Andronas, N.; Kontaxopoulou, D.; Fragkiadaki, S.; Yannis, G.; Papageorgiou, S.G. Mild Cognitive Impairment and driving: Does in-vehicle distraction affect driving performance? Accid. Anal. Prev. 2017, 103, 148–155. [Google Scholar] [CrossRef]
- Regan, M.A.; Hallett, C.; Gordon, C.P. Driver distraction and driver inattention: Definition, relationship and taxonomy. Accid. Anal. Prev. 2011, 43, 1771–1781. [Google Scholar] [CrossRef]
- Gordon, C. Driver Distraction: An Initial Examination of the ‘Attention Diverted by’ Contributory Factor Codes from Crash Reports and Focus Group Research on Perceived Risks. 2005, 350, 1–14. Available online: https://www.transportationgroup.nz/papers/2005/04_Gordon.pdf (accessed on 20 February 2023).
- Kircher, K.; Ahlstrom, C. Minimum Required Attention: A Human-Centered Approach to Driver Inattention. Hum Factors 2017, 59, 471–484. [Google Scholar] [CrossRef] [PubMed]
- Crundall, D.; Underwood, G.; Chapman, P. Driving experience and the functional field of view. Perception 1999, 28, 1075–1088. [Google Scholar] [CrossRef]
- Kass, S.J.; Cole, K.S.; Stanny, C.J. Effects of distraction and experience on situation awareness and simulated driving. Transp Res Part F Traffic Psychol Behav 2007, 10, 321–329. [Google Scholar] [CrossRef]
- Jiang, K.; Yang, Z.; Feng, Z.; Sze, N.N.; Yu, Z.; Huang, Z.; Chen, J. Effects of using mobile phones while cycling: A study from the perspectives of manipulation and visual strategies. Transp. Res. Part. F Traffic. Psychol. Behav. 2021, 83, 291–303. [Google Scholar] [CrossRef]
- Bao, S.; Flannagan, C.; Xiong, H.; Sayer, J. Eye glance behavior associated with cell-phone use: Examination with naturalistic driving data. In Proceedings of the Human Factors and Ergonomics Society; Human Factors an Ergonomics Society Inc.: Washington, DC, USA, 2014; pp. 2112–2116. [Google Scholar] [CrossRef]
- Fitch, G.M.; Bartholomew, P.R.; Hanowski, R.J.; Perez, M.A. Drivers’ visual behavior when using handheld and hands-free cell phones. J. Saf. Res. 2015, 54, 105.e29–108. [Google Scholar] [CrossRef]
- Crundall, D.; van Loon, E.; Underwood, G. Attraction and distraction of attention with roadside advertisements. Accid. Anal. Prev. 2006, 38, 671–677. [Google Scholar] [CrossRef]
- Costa, M.; Bonetti, L.; Vignali, V.; Bichicchi, A.; Lantieri, C.; Simone, A. Driver’s visual attention to different categories of roadside advertising signs. Appl. Ergon. 2019, 78, 127–136. [Google Scholar] [CrossRef] [PubMed]
- Dukic, T.; Ahlstrom, C.; Patten, C.; Kettwich, C.; Kircher, K. Effects of Electronic Billboards on Driver Distraction. Traffic. Inj. Prev. 2013, 14, 469–476. [Google Scholar] [CrossRef] [PubMed]
- Stavrinos, D.; Mosley, P.R.; Wittig, S.M.; Johnson, H.D.; Decker, J.S.; Sisiopiku, V.P.; Welburn, S.C. Visual behavior differences in drivers across the lifespan: A digital billboard simulator study. Transp. Res. Part F Traffic. Psychol. Behav. 2016, 41, 19–28. [Google Scholar] [CrossRef]
- Mantuano, A.; Bernardi, S.; Rupi, F. Cyclist gaze behavior in urban space: An eye-tracking experiment on the bicycle network of Bologna. Case Stud. Transp. Policy 2017, 5, 408–416. [Google Scholar] [CrossRef]
- Schepers, J.P.; Kroeze, P.A.; Sweers, W.; Wüst, J.C. Road factors and bicycle-motor vehicle crashes at unsignalized priority intersections. Accid. Anal. Prev. 2011, 43, 853–861. [Google Scholar] [CrossRef]
- Walker, G.H.; Stanton, N.A.; Chowdhury, I. Self Explaining Roads and situation awareness. Saf. Sci. 2013, 56, 18–28. [Google Scholar] [CrossRef]
- Kovácsová, N.; Cabrall, C.D.D.; Antonisse, S.J.; de Haan, T.; van Namen, R.; Nooren, J.L.; Schreurs, R.; Hagenzieker, M.P.; de Winter, J.C.F. Cyclists’ eye movements and crossing judgments at uncontrolled intersections: An eye-tracking study using animated video clips. Accid. Anal. Prev. 2018, 120, 270–280. [Google Scholar] [CrossRef]
- Vignali, V.; Cuppi, F.; Acerra, E.; Bichicchi, A.; Lantieri, C.; Simone, A.; Costa, M. Effects of median refuge island and flashing vertical sign on conspicuity and safety of unsignalized crosswalks. Transp. Res. Part F Traffic Psychol. Behav. 2019, 60, 427–439. [Google Scholar] [CrossRef]
- Von Stülpnagel, R. Gaze behavior during urban cycling: Effects of subjective risk perception and vista space properties. Transp. Res. Part F Traffic. Psychol. Behav. 2020, 75, 222–238. [Google Scholar] [CrossRef]
- Räsänen, M.; Koivisto, I.; Summala, H. Car Driver and Bicyclist Behavior at Bicycle Crossings Under Different Priority Regulations. J. Saf. Res. 1999, 30, 67–77. [Google Scholar] [CrossRef]
- Atkinson, J.E.; Hurst, P.M. Collisions between cyclists and motorists in New Zealand. Accid. Anal. Prev. 1983, 15, 137–151. [Google Scholar] [CrossRef]
- Prati, G.; Marín Puchades, V.; De Angelis, M.; Fraboni, F.; Pietrantoni, L. Factors contributing to bicycle–motorised vehicle collisions: A systematic literature review. Transp. Rev. 2018, 38, 184–208. [Google Scholar] [CrossRef]
- Vansteenkiste, P.; Zeuwts, L.; Cardon, G.; Philippaerts, R.; Lenoir, M. The implications of low quality bicycle paths on gaze behavior of cyclists: A field test. Transp. Res. Part F Traffic. Psychol. Behav. 2014, 23, 81–87. [Google Scholar] [CrossRef]
- Pai, C.W.; Jou, R.C. Cyclists’ red-light running behaviours: An examination of risk-taking, opportunistic, and law-obeying behaviours. Accid. Anal. Prev. 2014, 62, 191–198. [Google Scholar] [CrossRef] [PubMed]
- Wu, C.; Yao, L.; Zhang, K. The red-light running behavior of electric bike riders and cyclists at urban intersections in China: An observational study. Accid. Anal. Prev. 2012, 49, 186–192. [Google Scholar] [CrossRef] [PubMed]
- Godley, S.T.; Triggs, T.J.; Fildes, B.N. Driving simulator validation for speed research. Accid. Anal. Prev. 2002, 34, 589–600. [Google Scholar] [CrossRef]
- Bogacz, M.; Hess, S.; Calastri, C.; Choudhury, C.F.; Erath, A.; Van Eggermond, M.A.B.; Mushtaq, F.; Nazemi, M.; Awais, M. Comparison of cycling behavior between keyboard-controlled and instrumented bicycle experiments in virtual reality. Transp. Res. Rec. 2020, 2674, 244–257. [Google Scholar] [CrossRef]
- O’Hern, S.; Oxley, J.; Stevenson, M. Validation of a bicycle simulator for road safety research. Accid. Anal. Prev. 2017, 100, 53–58. [Google Scholar] [CrossRef]
- He, Q.; Fan, X.; Ma, D. Full bicycle dynamic model for interactive bicycle simulator. J. Comput. Inf. Sci. Eng. 2005, 5, 373–380. [Google Scholar] [CrossRef]
- Kwon, D.S.; Yang, G.H.; Lee, C.W.; Shin, J.C.; Park, Y.; Jung, B.; Lee, D.Y.; Lee, K.; Han, S.H.; Yoo, B.H.; et al. KAIST interactive bicycle simulator. Proc. IEEE Int. Conf. Robot. Autom. 2001, 3, 2313–2318. [Google Scholar] [CrossRef]
- Herpers, R.; Heiden, W.; Kutz, M.; Scherfgen, D.; Hartmann, U.; Bongartz, J.; Schulzyk, O. FIVIS bicycle simulator: An immersive game platform for physical activities. In Proceedings of the 2008 Conference on Future Play: Research, Play, Share, Toronto, ON, Canada, 3–5 November 2008; pp. 244–247. [Google Scholar]
- Törnros, J. Driving behaviour in a real and a simulated road tunnel—A validation study. Accid. Anal. Prev. 1998, 30, 497–503. [Google Scholar] [CrossRef] [PubMed]
- De Waard, D.; Westerhuis, F.; Lewis-Evans, B. More screen operation than calling: The results of observing cyclists’ behaviour while using mobile phones. Accid. Anal. Prev. 2015, 76, 42–48. [Google Scholar] [CrossRef] [PubMed]
- Planek, T.W.; Sinelnikov, S.; Thomas, J.; Kolosh, K.; Porretta, K. Letter from the Editors-Fourth international symposium on naturalistic driving research. J. Saf. Res. 2015, 54, 29. [Google Scholar] [CrossRef]
- Gadsby, A.; Watkins, K. Instrumented bikes and their use in studies on transportation behaviour, safety, and maintenance. Transp. Rev. 2020, 40, 774–795. [Google Scholar] [CrossRef]
- Bernard, G.E.; van Dongen, W.F.; Guay, P.J.; Symonds, M.R.; Robinson, R.W.; Weston, M.A. Bicycles evoke longer flight-initiation distances and higher intensity escape behaviour of some birds in parks compared with pedestrians. Landsc. Urban Plan. 2018, 178, 276–280. [Google Scholar] [CrossRef]
- Ma, C.; Yang, D.; Zhou, J.; Feng, Z.; Yuan, Q. Risk riding behaviors of urban e-bikes: A literature review. Int. J. Environ. Res. Public Health 2019, 16, 2308. [Google Scholar] [CrossRef]
- Shoman, M.; Imine, H.; Johansson, K.; Wallqvist, V. Bicycle instrumentation and analysis of the output signals. Highlights Veh. 2022. under submission. [Google Scholar]
- Cao, A.; Chintamani, K.K.; Pandya, A.K.; Ellis, R.D. NASA TLX: Software for assessing subjective mental workload. Behav. Res. Methods 2009, 41, 113–117. [Google Scholar] [CrossRef]
- Ghasemi, N.; Acerra, E.; Vignali, V.; Lantieri, C.; Simone, A.; Imine, H. Road Safety Review update by using innovative technologies to investigate driver behaviour. Transp. Res. Procedia 2020, 45, 368–375. [Google Scholar] [CrossRef]
- Acerra, E.M.; Lantieri, C.; Simone, A.; Di Flumeri, G.; Borghini, G.; Babiloni, F.; Vignali, V. The Impact of the Adaptive Cruise Control on the Drivers’ Workload and Attention. 2022. Available online: http://dx.doi.org/10.2139/ssrn.4281921 (accessed on 20 February 2023).
- Ghasemi, N.; Acerra, E.M.; Lantieri, C.; Simone, A.; Rupi, F.; Vignali, V. Urban Mid-Block Bicycle Crossings: The Effects of Red Colored Pavement and Portal Overhead Bicycle Crossing Sign. Coatings 2022, 12, 150. [Google Scholar] [CrossRef]
- Lantieri, C.; Costa, M.; Vignali, V.; Acerra, E.M.; Marchetti, P.; Simone, A. Flashing in-curb LEDs and beacons at unsignalized crosswalks and driver’s visual attention to pedestrians during nighttime. Ergonomics 2021, 64, 330–341. [Google Scholar] [CrossRef] [PubMed]
- Shoman, M.; Imine, H. Bicycle Simulator Improvement and Validation. IEEE Access 2021, 9, 55063–55076. [Google Scholar] [CrossRef]
- Jelijs, B.; Heutink, J.; de Waard, D.; Brookhuis, K.A.; Melis-Dankers, B.J. How visually impaired cyclists ride regular and pedal electric bicycles. Transp. Res. Part F Traffic Psychol. Behav. 2020, 69, 251–264. [Google Scholar] [CrossRef]
- Shoman, M.; Simone, A.; Vignali, V. Looking behavior to vertical road signs on rural roads. MOJ Civ. Eng. 2018, 4, 75–79. [Google Scholar]
- Shoman, M.; Imine, H. Subjective validity of bicycle simulators. In Proceedings of the VEHICULAR 2020: The Ninth International Conference on Advances in Vehicular Systems, Technologies and Application, Porto, Portugal, 18–22 October 2020; pp. 1–6. [Google Scholar]
- Shoman, M.M.; Imine, H.; Acerra, E.M.; Lantieri, C. Evaluation of cycling safety and comfort in bad weather and surface conditions using an instrumented bicycle. IEEE Access 2023, 11, 15096–15108. [Google Scholar] [CrossRef]
- Heinovski, J.; Stratmann, L.; Buse, D.S.; Klingler, F.; Franke, M.; Oczko, M.-C.H.; Sommer, C.; Scharlau, I.; Dressler, F. Modeling Cycling Behavior to Improve Bicyclists’ Safety at Intersections-A Networking Perspective. In Proceedings of the 2019 IEEE 20th International Symposium on “A World of Wireless, Mobile and Multimedia Networks” (WoWMoM), Washington, DC, USA, 10–12 June 2019; IEEE: New York, NY, USA, 2019; pp. 1–8. [Google Scholar]


| Zones | Total Frames | Total Fixation Duration [s] | Fixation Duration of Attention [s] | Percentage of Attention [%] | Fixation Duration of Inattention [s] | Percentage of Attention [%] |
|---|---|---|---|---|---|---|
| 1A | 23,359 | 934.36 | 845.32 | 90 | 89.04 | 10 |
| 2 | 50,545 | 2021.8 | 1756.34 | 88 | 265.46 | 12 |
| 3 | 44,412 | 1776.48 | 1547.35 | 87 | 229.13 | 13 |
| 1B | 29,924 | 1196.96 | 1032.03 | 86 | 164.93 | 14 |
| Categories | Total Frames | Total Fixation Duration [s] | Average Percentage [%] |
|---|---|---|---|
| Sidewalk | 3013 | 121 | 2 |
| Street | 101,635 | 4065 | 78 |
| Car | 5916 | 237 | 5 |
| Parked car | 2818 | 113 | 2 |
| Pedestrian | 5617 | 225 | 4 |
| Bicycle | 1417 | 57 | 1 |
| Horizontal Signs | 803 | 32 | 1 |
| Vertical Signs | 755 | 30 | 1 |
| Pedestrian passage | 2138 | 86 | 2 |
| Traffic light | 5414 | 217 | 4 |
| Categories | Total Frames | Total Fixation Duration [s] | Average Percentage [%] |
|---|---|---|---|
| Buildings | 3066 | 123 | 16 |
| Vegetation | 774 | 31 | 4 |
| Street lamps | 601 | 25 | 3 |
| Sky | 7 | 0.28 | 0 |
| Handlebar | 2136 | 85 | 11 |
| Pedals | 721 | 29 | 4 |
| GPS | 11,410 | 456 | 61 |
| Zones | Total Frames | Total Fixation Duration [s] | Fixation Duration of Attention [s] | Percentage of Attention [%] | Fixation Duration of Inattention [s] | Percentage of Inattention [%] |
|---|---|---|---|---|---|---|
| 1A | 12,168 | 487 | 386 | 79 | 101 | 21 |
| 2 | 24,315 | 973 | 813 | 84 | 159.48 | 16 |
| 3 | 16,712 | 668 | 492 | 74 | 176.24 | 26 |
| 1B | 8771 | 351 | 297 | 85 | 53.6 | 15 |
| Categories | Total Frames | Total Fixation Duration [s] | Average Percentage [%] |
|---|---|---|---|
| Sidewalk | 19,203 | 768 | 9 |
| Street | 159,839 | 6394 | 78 |
| Car | 9355 | 374 | 5 |
| Parked car | 4053 | 162 | 2 |
| Pedestrian | 3272 | 131 | 2 |
| Bicycle | 2026 | 81 | 1 |
| Horizontal Signs | 0 | 0 | 0 |
| Vertical Signs | 25 | 1 | 0 |
| Pedestrian passage | 2782 | 111 | 1 |
| Traffic light | 5476 | 219 | 3 |
| Categories | Total Frames | Total Fixation Duration [s] | Average Percentage [%] |
|---|---|---|---|
| Buildings | 23,795 | 952 | 64 |
| Vegetation | 11,535 | 461 | 31 |
| Street lamps | 45 | 2 | 0 |
| Sky | 1106 | 44 | 3 |
| Handlebar | 744 | 30 | 2 |
| Pedals | 17 | 0.68 | 0 |
| GPS | 0 | 0 | 0 |
Disclaimer/Publisher’s Note: The statements, opinions and data contained in all publications are solely those of the individual author(s) and contributor(s) and not of MDPI and/or the editor(s). MDPI and/or the editor(s) disclaim responsibility for any injury to people or property resulting from any ideas, methods, instructions or products referred to in the content. |
© 2023 by the authors. Licensee MDPI, Basel, Switzerland. This article is an open access article distributed under the terms and conditions of the Creative Commons Attribution (CC BY) license (https://creativecommons.org/licenses/by/4.0/).
Share and Cite
Acerra, E.M.; Shoman, M.; Imine, H.; Brasile, C.; Lantieri, C.; Vignali, V. The Visual Behaviour of the Cyclist: Comparison between Simulated and Real Scenarios. Infrastructures 2023, 8, 92. https://doi.org/10.3390/infrastructures8050092
Acerra EM, Shoman M, Imine H, Brasile C, Lantieri C, Vignali V. The Visual Behaviour of the Cyclist: Comparison between Simulated and Real Scenarios. Infrastructures. 2023; 8(5):92. https://doi.org/10.3390/infrastructures8050092
Chicago/Turabian StyleAcerra, Ennia Mariapaola, Murad Shoman, Hocine Imine, Claudia Brasile, Claudio Lantieri, and Valeria Vignali. 2023. "The Visual Behaviour of the Cyclist: Comparison between Simulated and Real Scenarios" Infrastructures 8, no. 5: 92. https://doi.org/10.3390/infrastructures8050092