
Evaluation of the Szapáry Long-Span Box Girder Bridge Using Static and Dynamic Load Tests

1
Department of Structural and Geotechnical Engineering, Széchenyi István University, 9026 Győr, Hungary
2
Department of Machine Design, Faculty of Mechanical Engineering, Informatics and Electrical Engineering, Széchenyi István University, 9026 Győr, Hungary
*
Author to whom correspondence should be addressed.
Infrastructures 2023, 8(5), 91; https://doi.org/10.3390/infrastructures8050091
Submission received: 6 April 2023
/
Revised: 25 April 2023
/
Accepted: 27 April 2023
/
Published: 9 May 2023
(This article belongs to the Special Issue Structural Health Monitoring and Performance Evaluation of Bridges and Structural Elements)
Abstract
:This paper presents the results of a recent field test carried out before the opening phases of the Szapáry motorway bridge across the Tisza River in central Hungary. The evaluation test was based on static and dynamic load tests that provided information on deflection, stresses, and dynamic mode shapes along the bridge. The structure has two large continuous independent steel box girders that cover spans across the floodplain and river. Various configurations of truck loading applied up to 6400 kN of loading on the deck. During the static tests, string potentiometers recorded deflections at mid-span. Additionally, strain gauges enabled strain/stress measurements at the mid-point of the longest span and directly above one support. Dynamic loadings showed variation in deflection response due to vehicle speed, and ambient vibration testing led to determining vibration modes and frequencies. A three-dimensional finite-element model produced similar deflections, stresses, and modal behavior. Measured and modeled deflections and stresses indicated that the bridge performed within design margins. The testing and analysis results will be part of a future program assessing conditioned-based maintenance.
1. Introduction
Bridges are an important and costly part of any transportation infrastructure. Their design and performance often dictate the capacity of an entire highway or railway segment. During the design phase, conflicting goals may arise based on economy, capacity, durability, aesthetics, and road performance. Many design alternatives are available to the bridge engineer; however, this article focuses on a steel box girder design with multiple long spans and modest clearance. The Szapáry bridge crosses the Tisza River and floodway north of Szolnok, Hungary, as part of the new M4 motorway connecting Budapest to central Eastern Hungary and Romania. The design is especially suited to the Tisza, where there are broad floodways and significant changes in river level. The long spans reduce the number of piers in the floodway, limiting the environmental footprint and flow obstruction and minimizing costly foundation works. In the case of steel bridges, box girders were more suitable for constructing long bridges with larger spans and wider decks.
The serviceability of long-span bridges will decrease over time; the primary source of this decreasing function is the cyclic load on the girders caused by the vehicle loadings [1]. One parameter to determine bridge serviceability is the vertical deflection of the spans. Many factors contribute to vertical deflection, including the stiffness of the main box beam, vertical stiffness of the foundation systems, presence of expansion joints, and degree of composite action with the concrete bridge deck [2,3,4]. The ideal testing system would include locations throughout the bridge and evaluate each component independently, i.e., the relative stiffness of the box beam and foundation system. That would require a testing program that is quite complex, time-consuming, and costly. The next best option is to evaluate measurements by modeling the entire bridge [5]. Deflection measurement under static and moving loads is essential for bridge design, function, and structural health [6,7]. The Szapáry bridge was load-tested to demonstrate bridge safety to the public and assess its performance under static and moving loads.
When bridge deflections exceed specified design limits, they may experience damage or collapse, posing a severe threat to the public and likely causing significant economic losses. Thus, the deflections should be within design limits (L/400) given by the Hungarian annex [8] and in accordance with the AASHTO code (L/800) [9]. The project required a proof load test, which involved applying loads that were greater than those used in a diagnostic test [10]; several bridges have collapsed during such load tests including the steel framework bridge over the Morava River near Ljubitschewo in Serbia, the road bridge near Salez in Switzerland, and a suspension bridge in Maurin in France [11]. For this reason, testing bridges is a critical task for structural engineers. Careful monitoring enables the early detection of defective fractures, misalignments, and assembly errors, reducing maintenance and repair costs and lowering the risk of bridge collapses or other serious accidents [12,13,14].
Engineers often test bridges before they open to traffic. Fang et al. [15] conducted 40 different static field loading tests to examine the behavior of the Kao-Ping-His bridge, the longest bridge in Taiwan. Wei-Xin et al. [16] implemented field static load tests and numerical analyses on the Qingzhou cable-stayed bridge in Fuzhou, China. The deflection results of both tests revealed that the bridge had linear characteristics, which indicates that the bridge has an adequate load-carrying capacity. The analytical results agreed well with the test results.
An early study by Hassan et al. [17] evaluated the behavior of the North Halawa Valley viaduct on the island of Oahu, HI, USA, under numerous static truck-loading combinations. They reported that load testing is a crucial starting point for structural monitoring and bridge repair. In addition, the load test results verified the structure’s suitability in the short term while predicting its potential long-term performance.
Galati et al. [18] conducted a series of static, dynamic field load tests of the A6102 Lexington Bridge in Hardin, MO, USA. They compared their measurements with AASHTO LRFD bridge design calculations and their finite element model (FEM). Their results revealed that the bridge would be safe for service, as the field tests produced lower deflection values than the results of the AASHTO analysis. Similar findings were found by Wang et al. [19] after comparing the complex Pingnan Xiangsizhou bridge deflection results produced by the non-destructive load tests and numerical simulation, followed by an evaluation of the bridge’s fundamental characteristics in order to ensure that the structure was up to standard.
The Szczercowska bridge required testing before the structure reinforcement to better assess the benefits of strengthening the bridge structure. The tests and numerical modeling results showed that the bridge has sufficient strength reliability, as the field tests always underestimate the results of the finite element modeling analysis [19]. According to Zheng et al.’s [20] analysis, the experimental deflection values were higher than the theoretical results as the material exhibited less rigid behavior at the time of the test; thus, the bridge structural stiffness was different from what theoretical calculations predicted, and there was insufficient safety reserve.
Typically, engineers and designers perform several checks and tests throughout the construction phase of complex structures like the steel box bridge in this study. The final testing phase may require more exhaustive static and dynamic tests [21,22]. According to Sun et al. [23], the dynamic vehicle loading test evaluates the load-carrying capacity of a bridge better than the analysis. The moving trucks used to load the bridge are typically modeled numerically as additional masses. They are, in fact, complex dynamic systems that may have significant effects when interacting with the bridge.
More recently, researchers have investigated how moving vehicles interact dynamically with bridges, focusing primarily on how the characteristics of the road and moving vehicles affect the bridge dynamics [24,25,26]. The stress and deflection values increase with increasing vehicle load and velocity, making these two factors the most important in determining girder deflections [27]. According to the literature review, trucks weighing more than 20 tons and traveling at speeds ranging from 10 to 80 km/h are commonly used in field testing [28,29].
Numerical models rely on full-scale tests under traffic [30] for validation. Several model validation studies describe the process of direct measurements under static and moving loads, such as strains, displacements, and accelerations [15,31]; or derived from acceleration records, such as natural frequencies and mode shapes [22,28,32].
The load tests aim to understand better the bridge response to static and dynamic loadings and calibrate the initial FEM model. The measured data provides an initial database for future health monitoring of the new structure. Future condition evaluations will then compare their assessment to the initial conditions. In their studies, Sousa et al. [33] stated that vertical deflection is related to bridge performance under short-term and long-term observations.
This paper reports a recent investigation as the initial step in the structural health behavior of a continuous long-span box girder bridge with a main span that extends to 148 m in Hungary. The field load tests of the Szapáry bridge performed before its opening will be summarized. The geometry of the bridge and the truck’s position will be considered throughout the comparison to accurately reflect the actual field conditions. As a primary goal, the study will follow the load testing process to validate our numerical model and provide a baseline for further numerical studies of what-if structural health situations. Our future goal is to determine the feasibility of structural health monitoring by measuring response to dynamic loads.
2. Testing the Szapáry Bridge on the Tisza River in Hungary
2.1. Description of the Szapáry Bridge
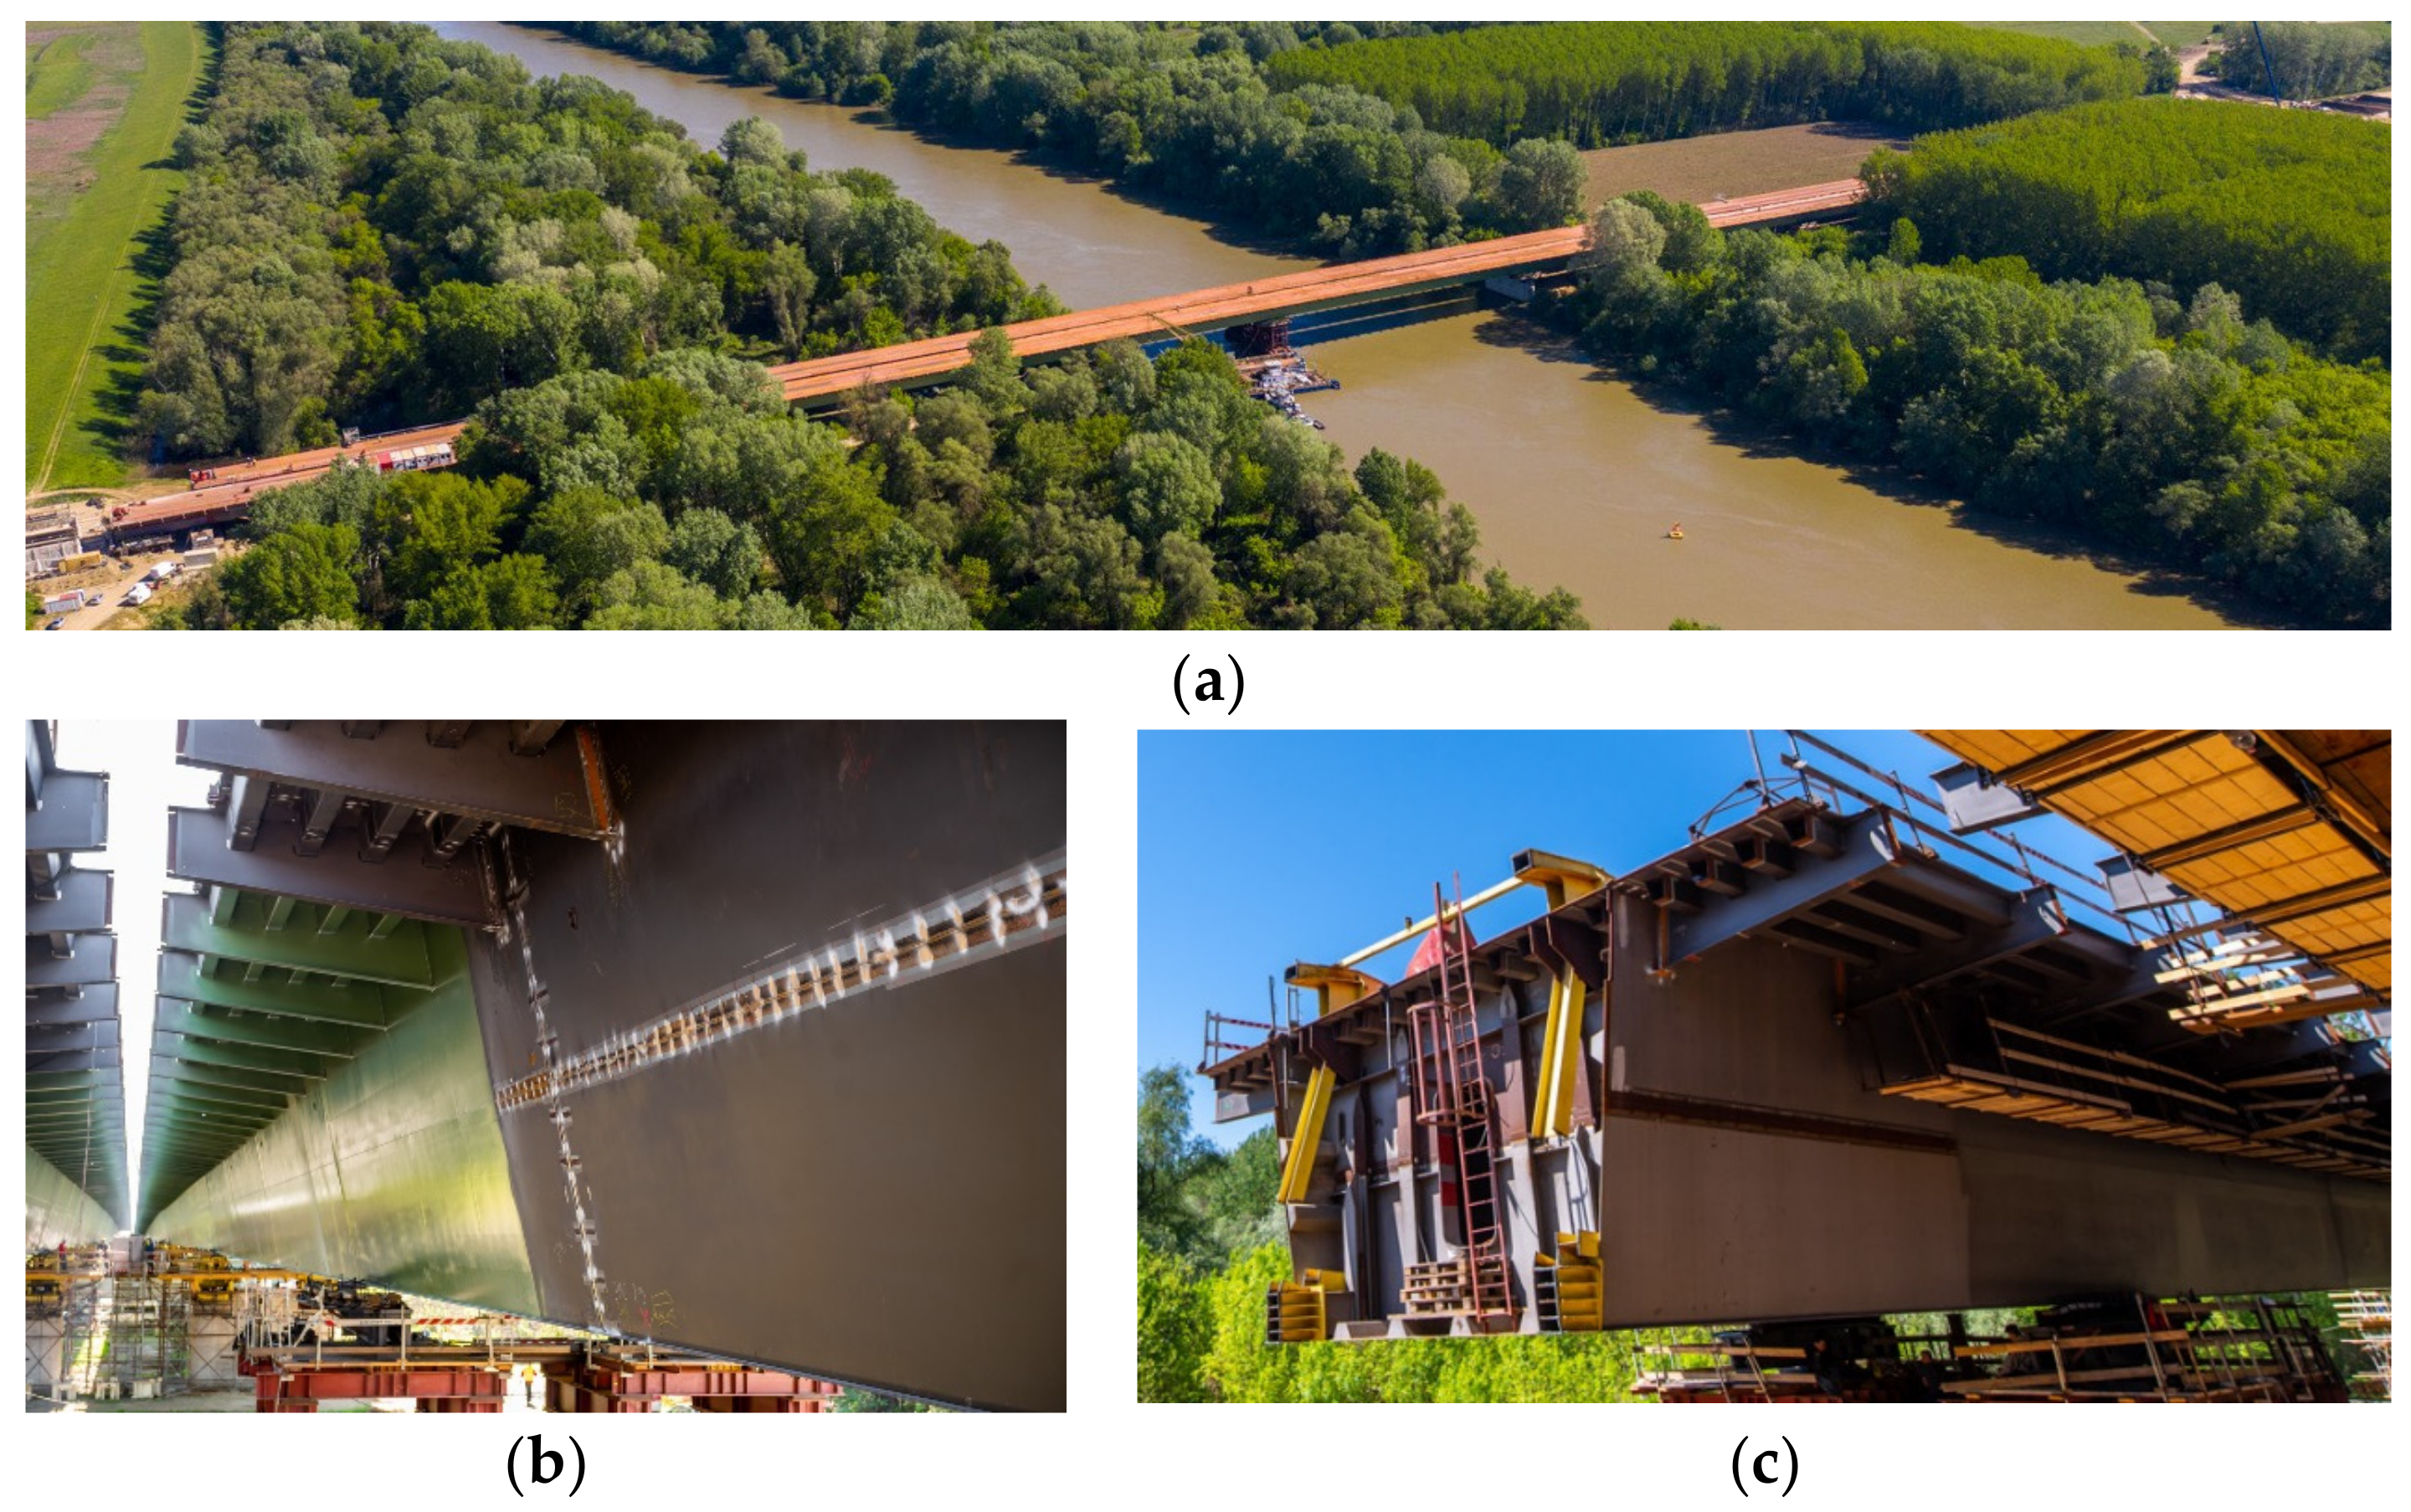
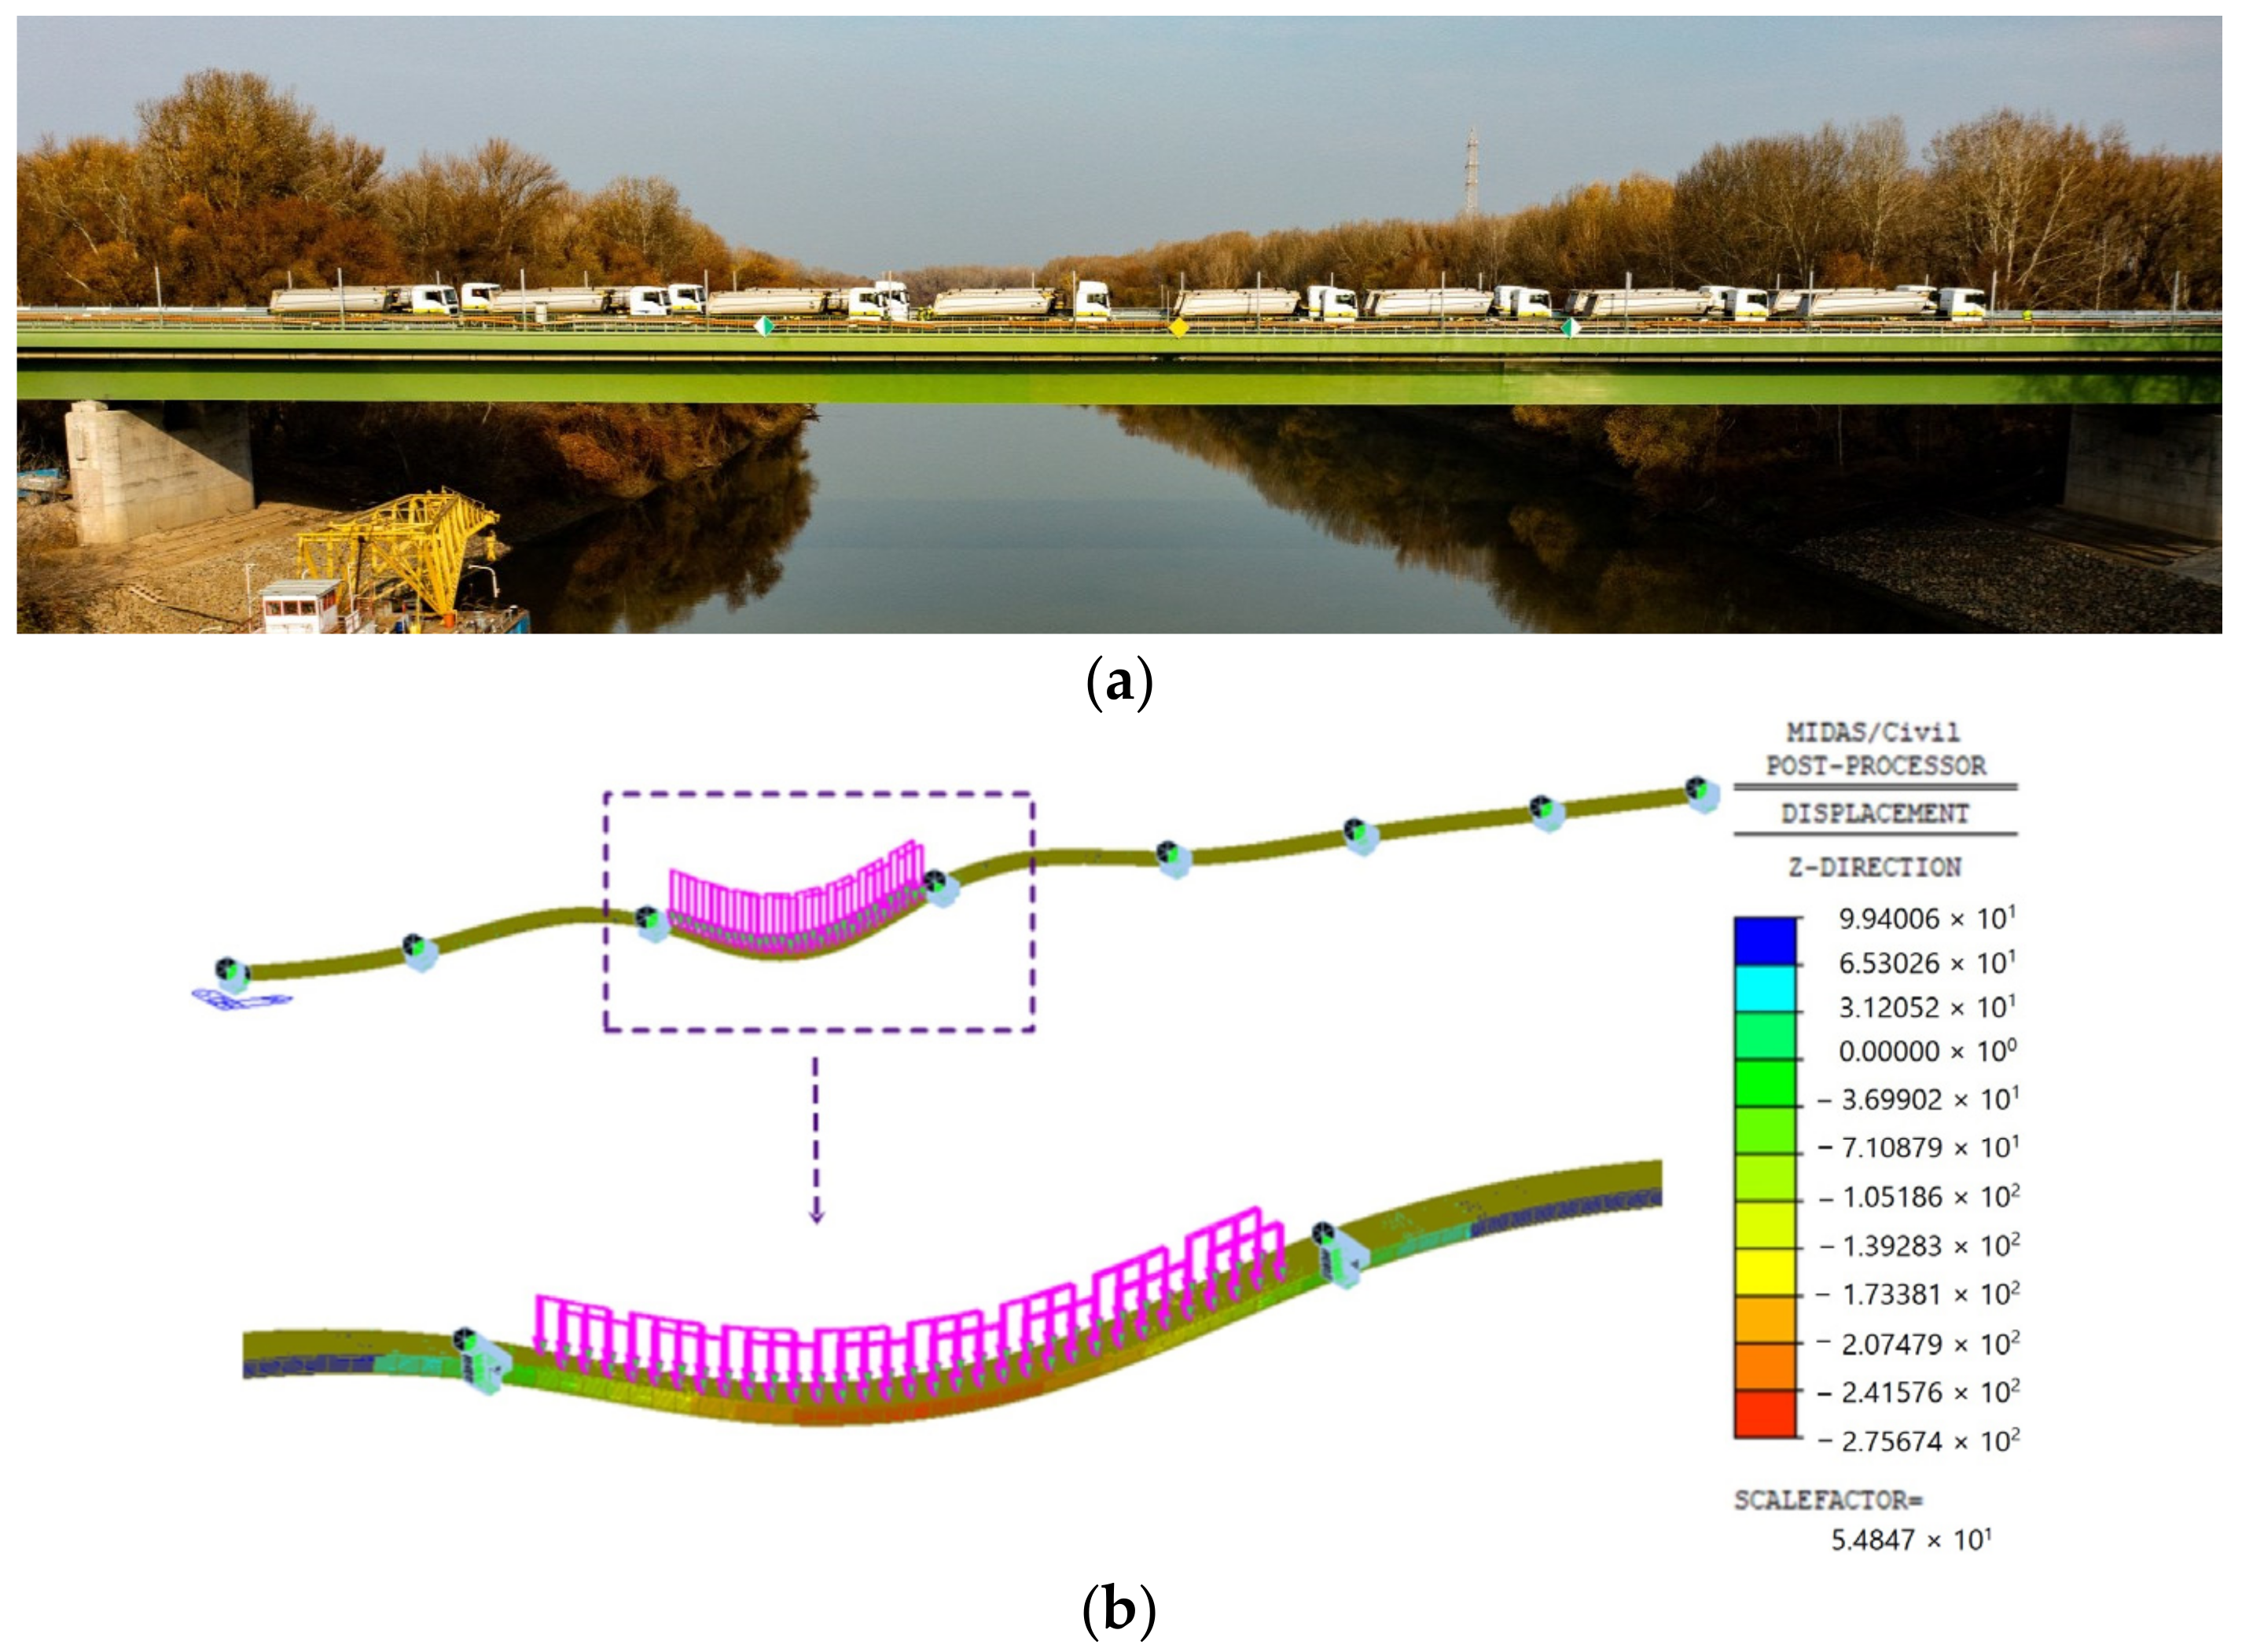
Hungary’s new M4 Tisza motorway bridge is a continuous seven-span box-girder bridge. It measures 756 m overall, with span lengths of (96 + 120 + 148 + 120 + 96 + 96 + 80) m, respectively, as shown in Figure 1a. The 148 m span of the bridge over the Tisza River is the longest in Hungary for this type of design. The bridge consists of two separated trapezoidal single-box girders supporting two traffic directions (Figure 1b). The girder’s top slab extends 13.815 m wide and cantilevers 3.309 m and 2.886 m along the outer and inner edges. The base flange is 5.50 m wide. The height of the box girder ranges from 4.60 m to 4.412 m on the right and left sides (Figure 1c).
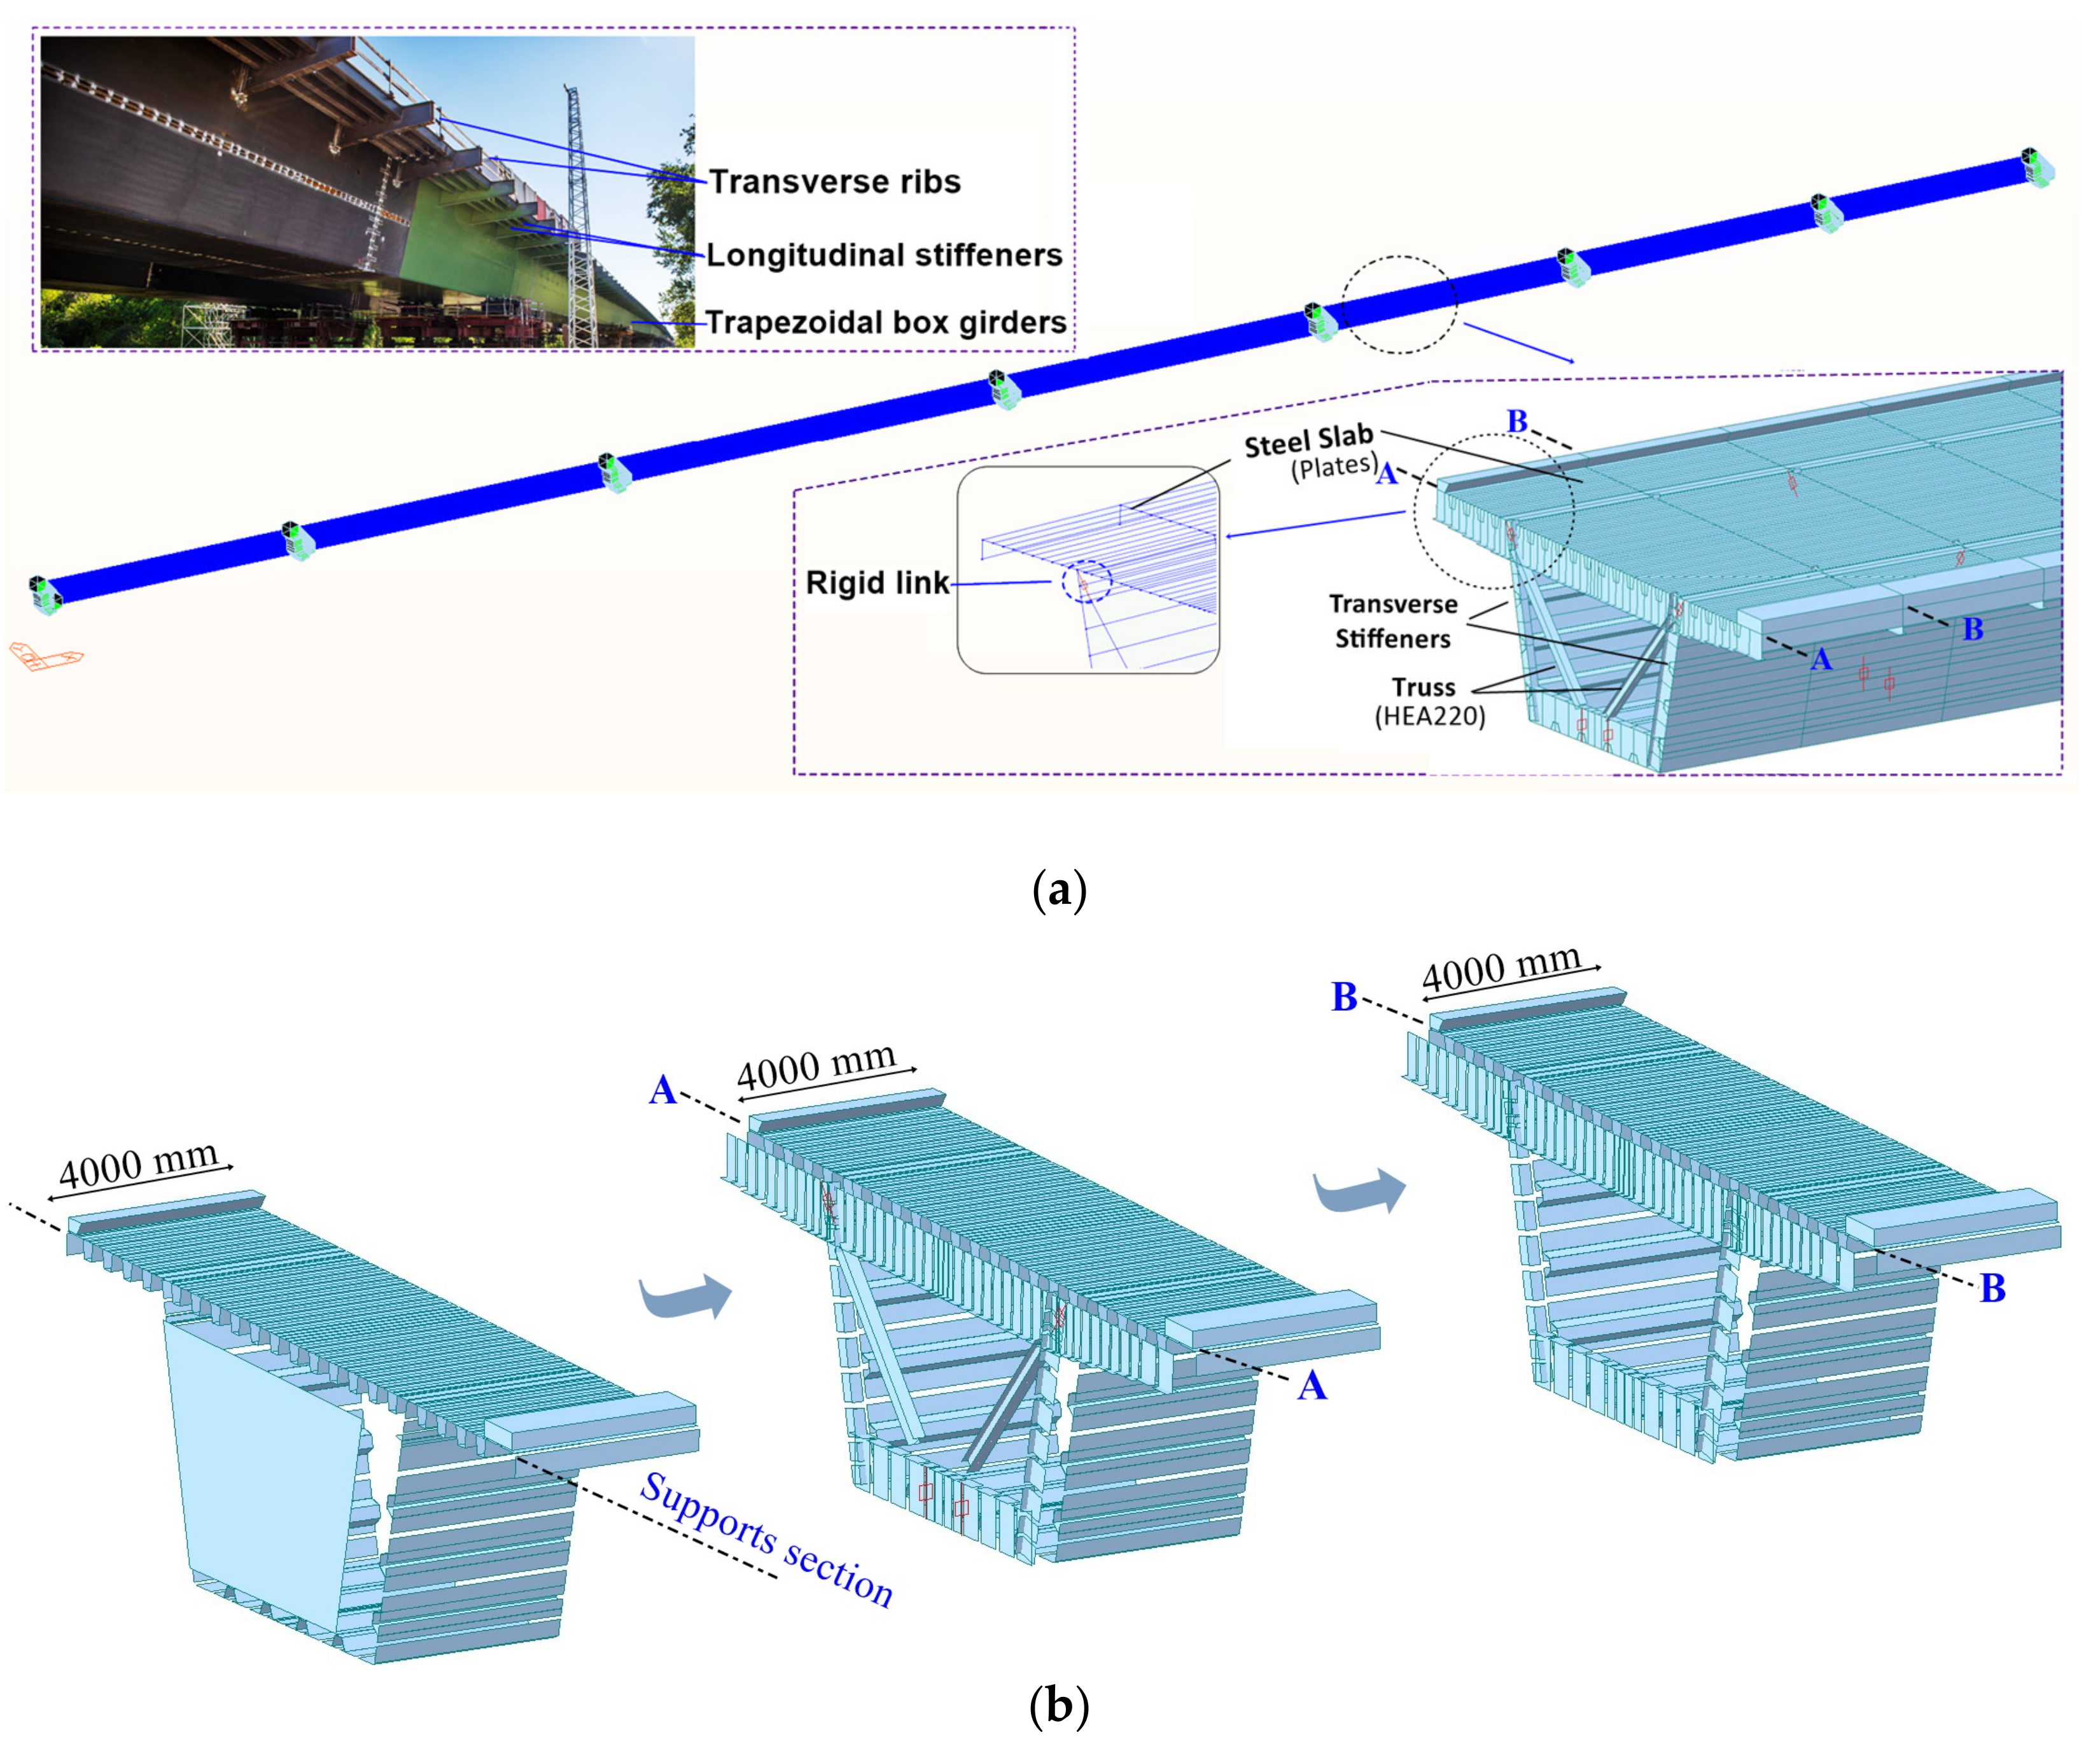
The trapezoidal deck consists of plate girders with 12–50 mm thicknesses. Longitudinal stiffeners and crossbeams support it in perpendicular directions. The main girders span the box’s upper section to support the deck (see Figure 1c). The longitudinal stiffeners are U-shaped sections spaced 600 mm on the top, 1100 mm on the bottom, and 221mm and 229 mm on the sides. Transverse stiffeners are I-shaped sections placed at 4000 mm intervals. In addition, steel diaphragm sections stiffen the structure above each support. The orthotropic steel deck connects to the junction with trusses type HEA220, each 8000 mm, and assists in providing lateral stability to the girders. Welding these elements increases durability, eases inspection, and improves aesthetic quality. The following sections concisely describe the measurement results, their interpretation, and conclusions.
2.2. Experimental Program
In this study, load testing and monitoring of the bridge provided information on its response under static and moving loads. Specifically, the measurements provided vertical deflection of the bridge deck at mid-span and other critical locations. The test involved placing the trucks in various positions and measuring the resulting deflections at the mid-span locations along all the bridge’s seven spans.
Testing started with static tests, wherein up to 16,400 kN (5-axle) trucks loaded the deck. The field test configuration appears in Figure 2, and tables presented below detailed results showing the testing order. The test was performed on the right track of the Tisza bridge.
Following the static loading, one pair of trucks (total 800 kN), running side by side, drove the length of the bridge at constant speeds from 10 to 90 km/h. The moving load tests provided data on stiffness and vibration response. In addition, the testing program measured the bridge response to ambient excitation using acceleration-time records, and the bridge modal parameter results will appear in a forthcoming paper.
Measurement of Deflections and Stresses
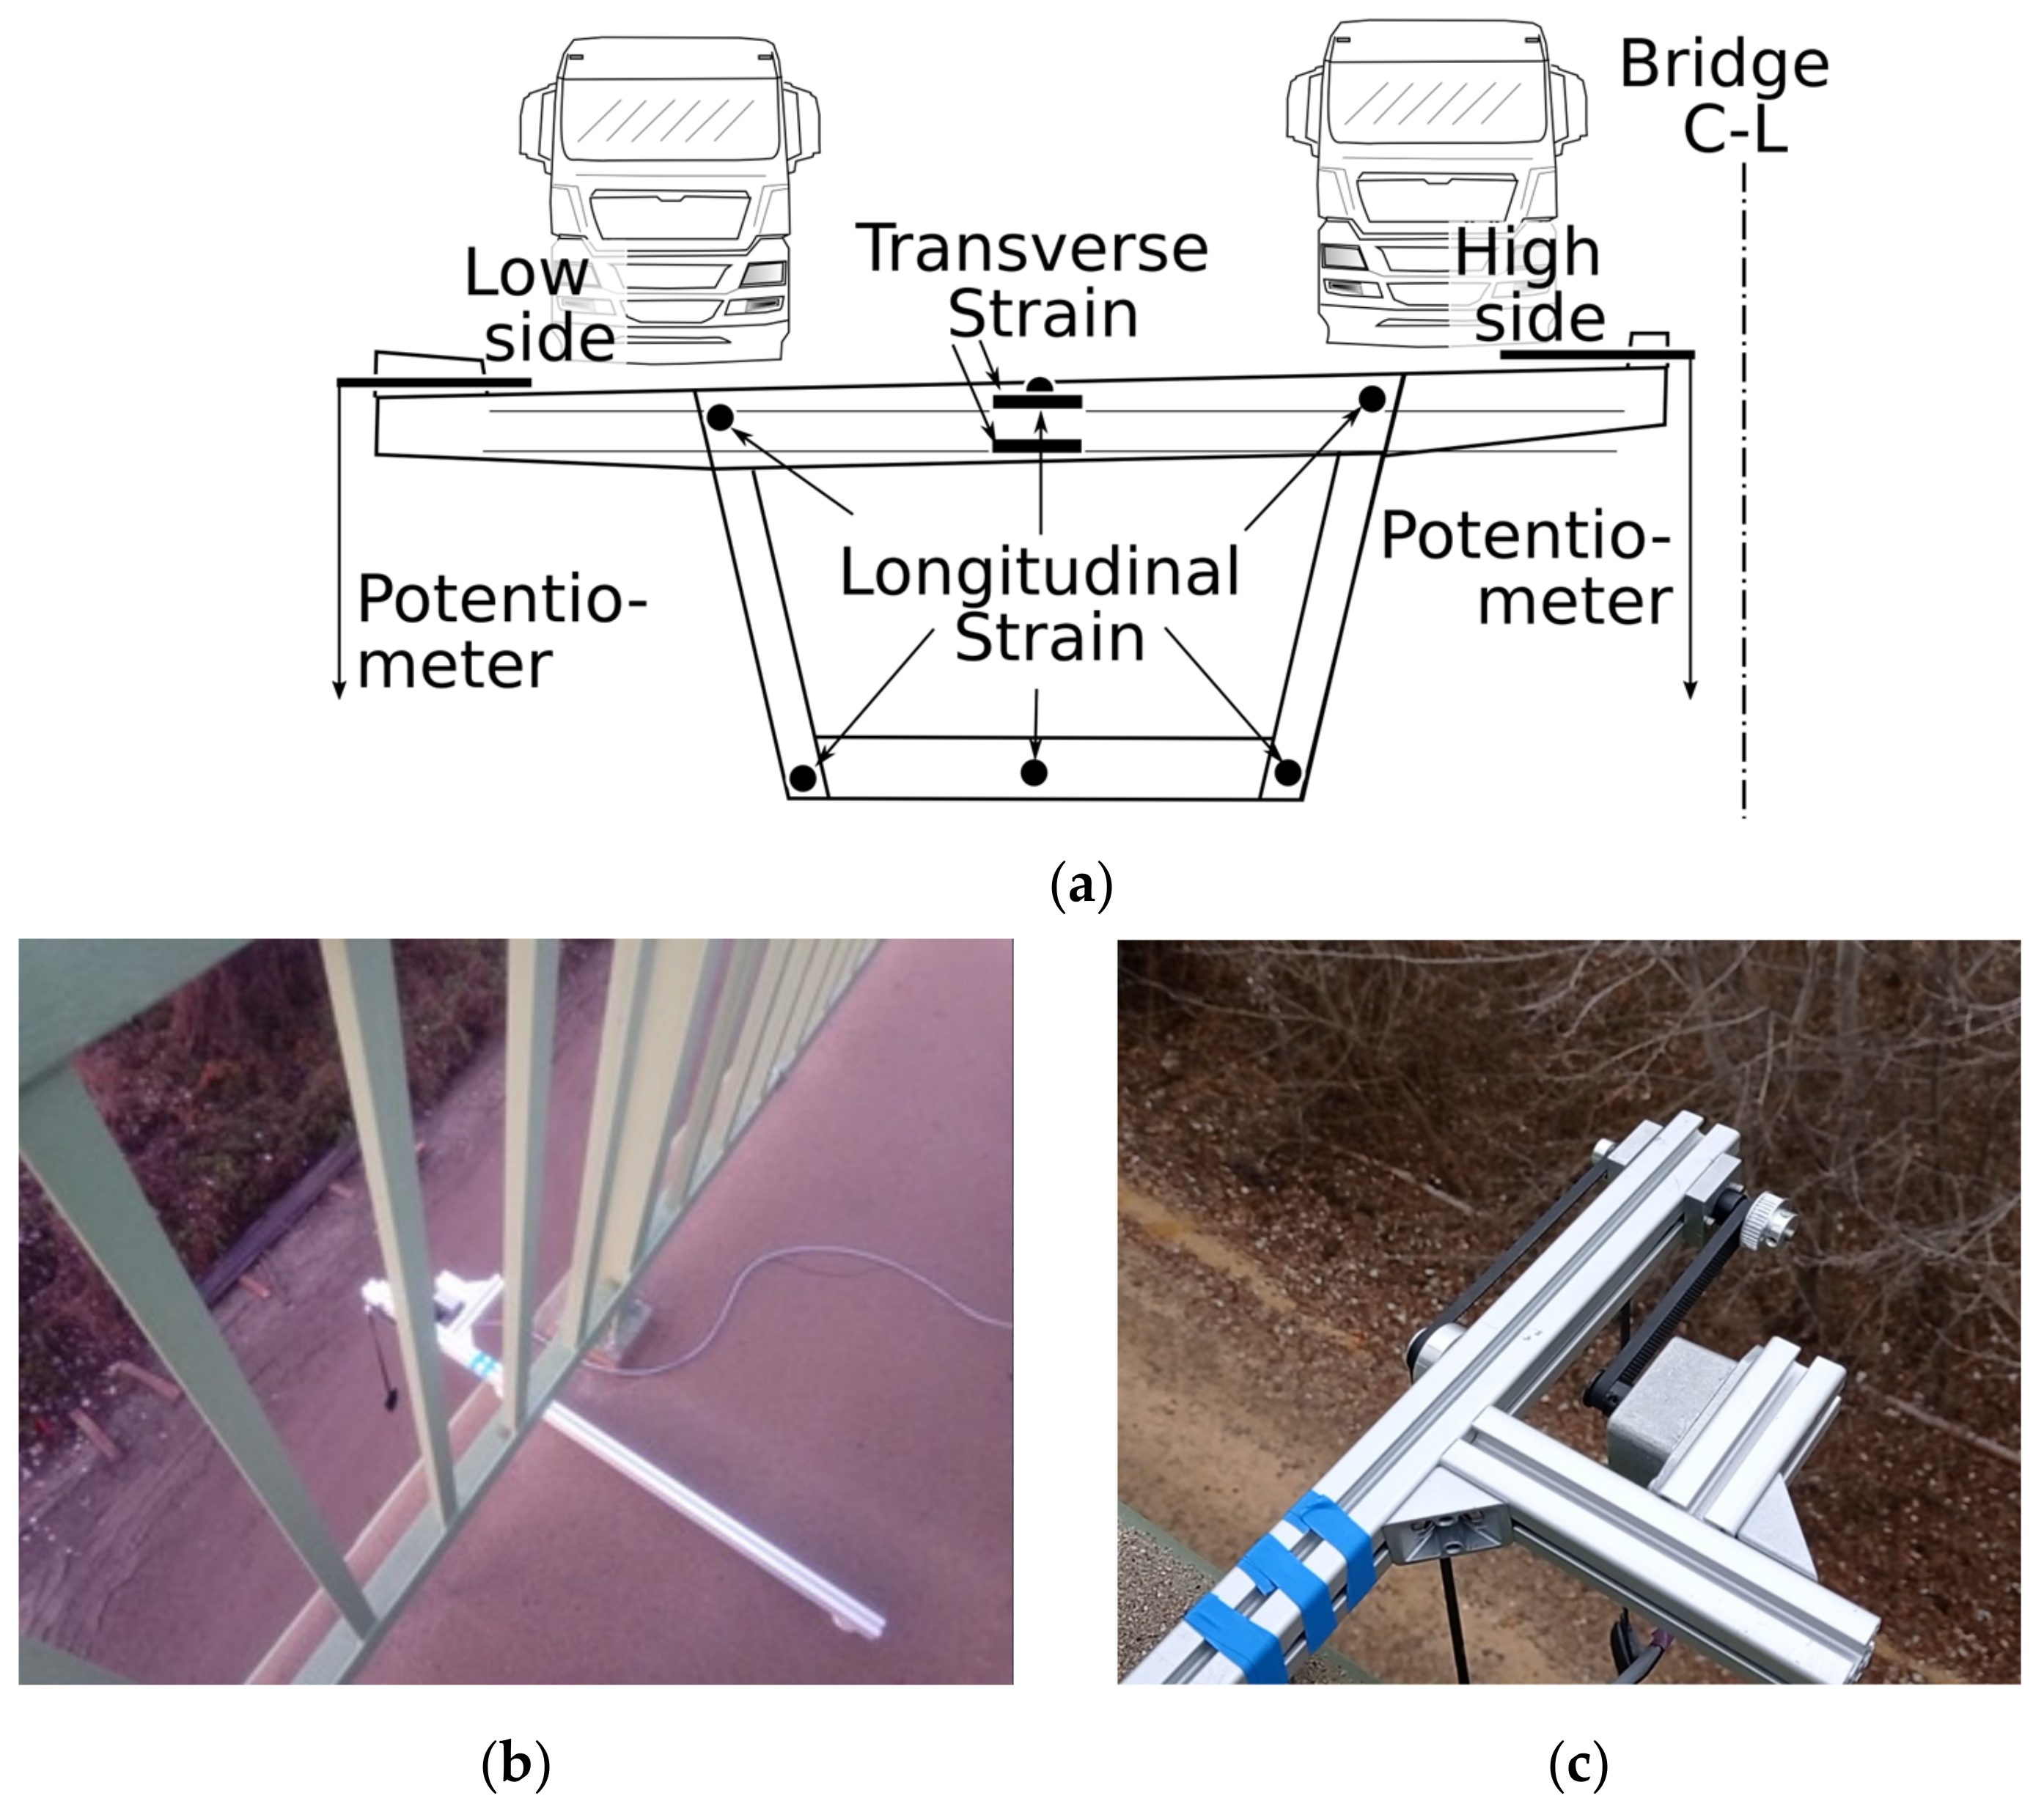
The vertical deflection measurements occurred on each of the seven segments at mid-span, delivering 14 continuous readings. Deflection and strain gauge positions marked high and low sides appear in Figure 3a. High refers to the side of the deck near the bridge centerline where the elevation was slightly higher due to the slight inclination for deck drainage.
A rotary resistance meter fastened to the loaded bridge provided measurements with its reference cable anchored to the ground surface. The error of the device remained well below 0.5% full scale. The error translated to less than 1 mm for the range of measurements performed during the load tests. The longest loaded span used the adjacent unloaded span as a stable reference point since river traffic made anchors problematic. Additionally, the deck inclination was measured to produce a pair of deflections similar to the other spans. Optical leveling provided an additional deflection check along the loaded and unloaded bridges. The deflection of foundation piers was negligible.
Twelve longitudinal and two transverse locations measured strain continuously throughout testing. The gauges measured longitudinal stresses in the main girder across two sections: above the third support and in the middle of the longest span. Three-gauge locations provided readings at the top and three at the bottom plates, with one on the bridge’s axis and two near the spines (Figure 3a). One pair of gauges measured transverse strain on the upper girder of the cross-section (Figure 3a). The testing was conducted during overcast weather conditions with a slight temperature variation of 2 °C, which had no significant impact on the measurement readings. The strain gauges primarily contributed to relative changes between loaded and unloaded conditions for static and dynamic tests.
2.3. Tests Interpretation through Numerical Modeling
In her investigations, Gouda [34] demonstrated that FEM modeling could predict the linear structural response of such bridges with high accuracy. A finite-element model of the Szapáry bridge superstructure was developed in Midas Civil [35] to provide an interpretation of the main results of the experimental tests. The analysis also offered insight into the effects of load placement on bridge deflection.
Concerning the bridge, the deck consisted of straight elastic beam elements with variable cross-sections representing steel stiffeners, cross beams, and diaphragms. Truss elements with uniform cross-sections modeled truss members. End restraint conditions duplicated field conditions. Plate elements having different thicknesses and located in the midplane of the slabs simulated the orthotropic deck slabs, as shown in Figure 4b. Elastic links represented the stability of the elements with rollers and pinned constraints providing boundary support. The constraints allowed horizontal translation in the transverse direction. Rigid links (Figure 4a) attached the trusses to the deck. The connections are between plate elements and trusses at the bottom and top of the deck. This procedure guaranteed rotational continuity.
All components represented field conditions with identical geometries and materials. The model consisted of 16,329 plates, 21,336 beams, and 196 truss elements, connecting 23,759 nodes. A perspective view of a model section appears in Figure 4.
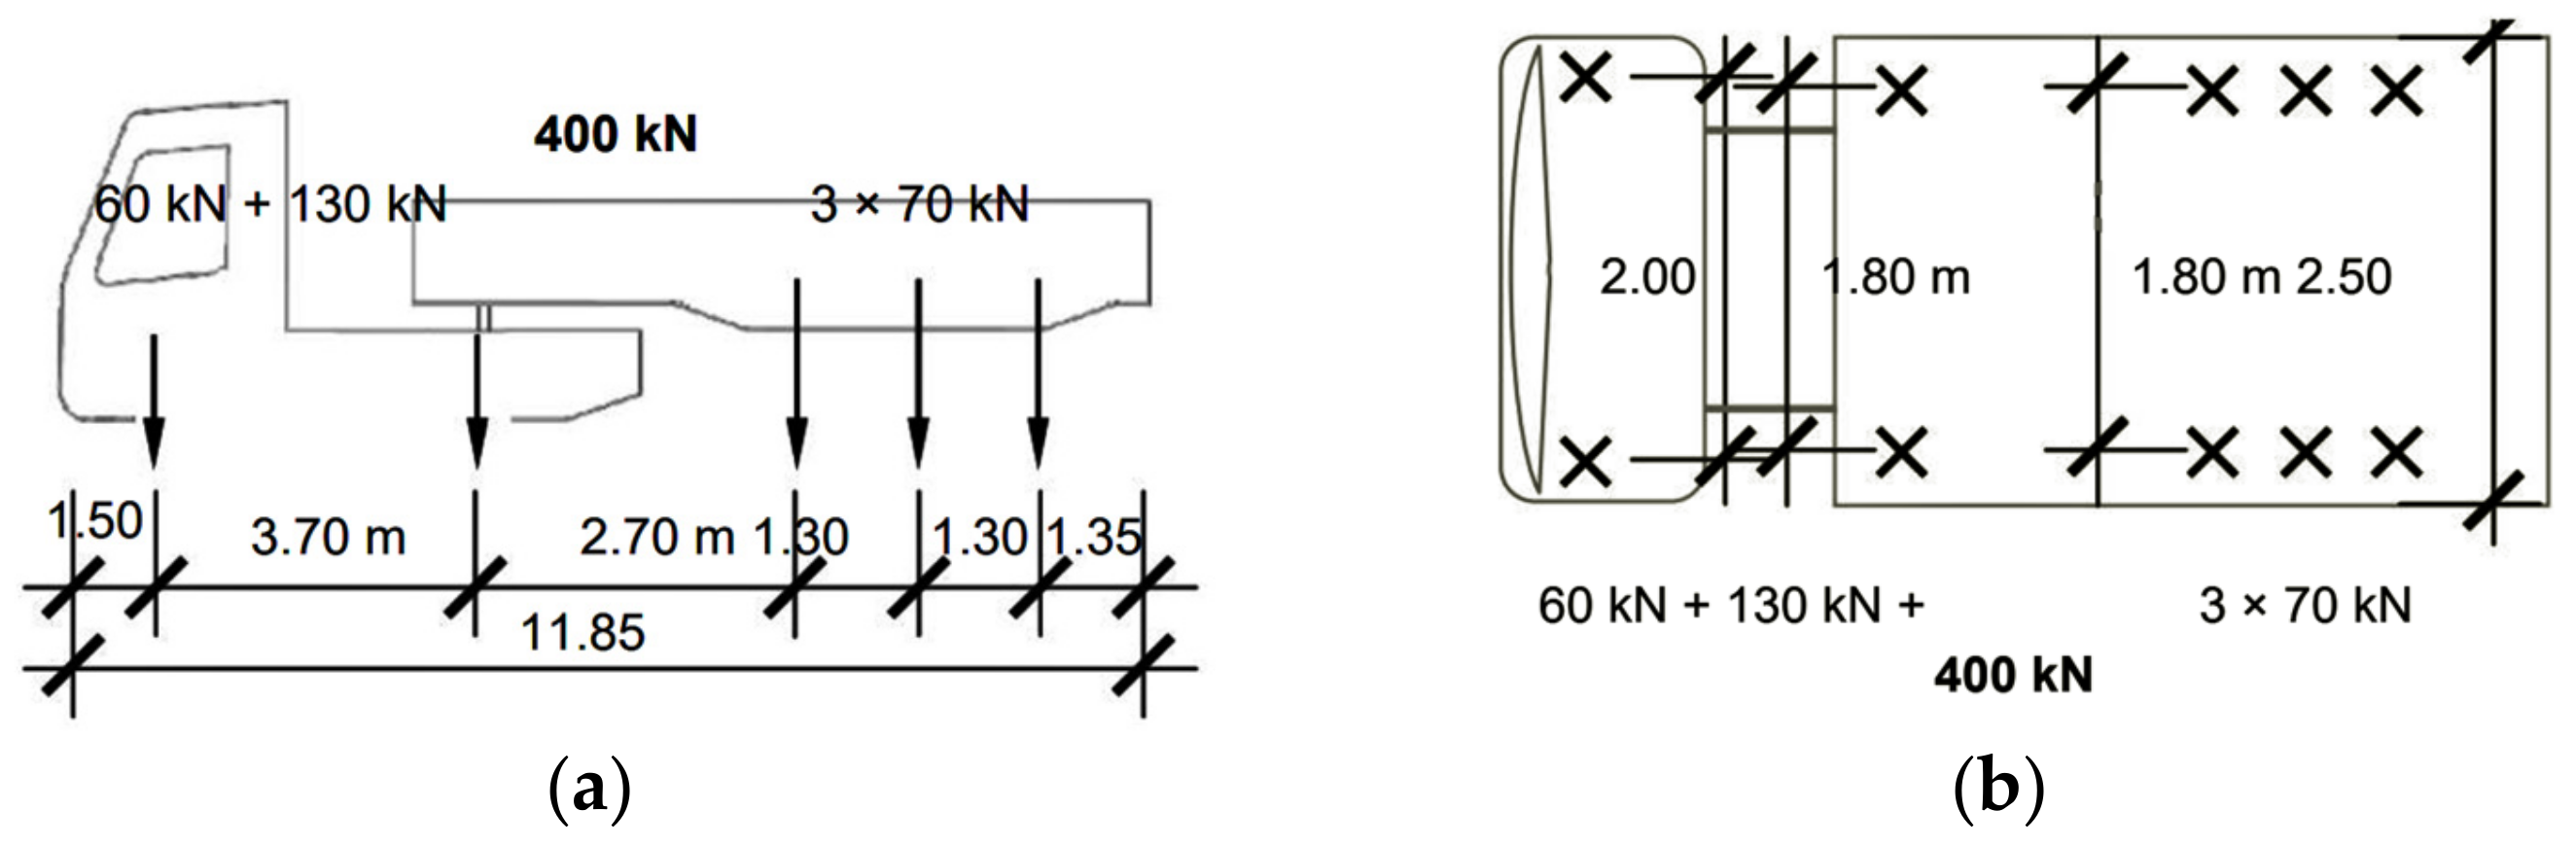
Material properties used for all elements are S355 grade steel (EN 1993-2) [36], with Young’s modulus of 210,000 MPa (N/mm2), Poisson’s ratio of 0.3, and a weight density value of 76.98 kN/m3. All beam member sections represented identical field members in the as-built structure based on measurements from the geometrical survey. Permanent loads (structural self-weight) act on the bridge everywhere, while variable loads represent the positions of traffic (loaded trucks for testing). Detailed truck data appears in Figure 5, and the loading patterns for the static and dynamic tests.
3. Field Tests and FEM Model: Results and Discussions
Comparing the FEM deflections due to static and moving load to measured deflections will validate the bridge model and define the bridge’s global behavior. The proper modeling approach for this study provides results necessary in determining the existence of systematic errors. Therefore, the fundamental knowledge and information for the modeling should be adequately understood and applied correctly to ensure accurate and quality data [37].
3.1. Bridge Deflection under Static Loadings
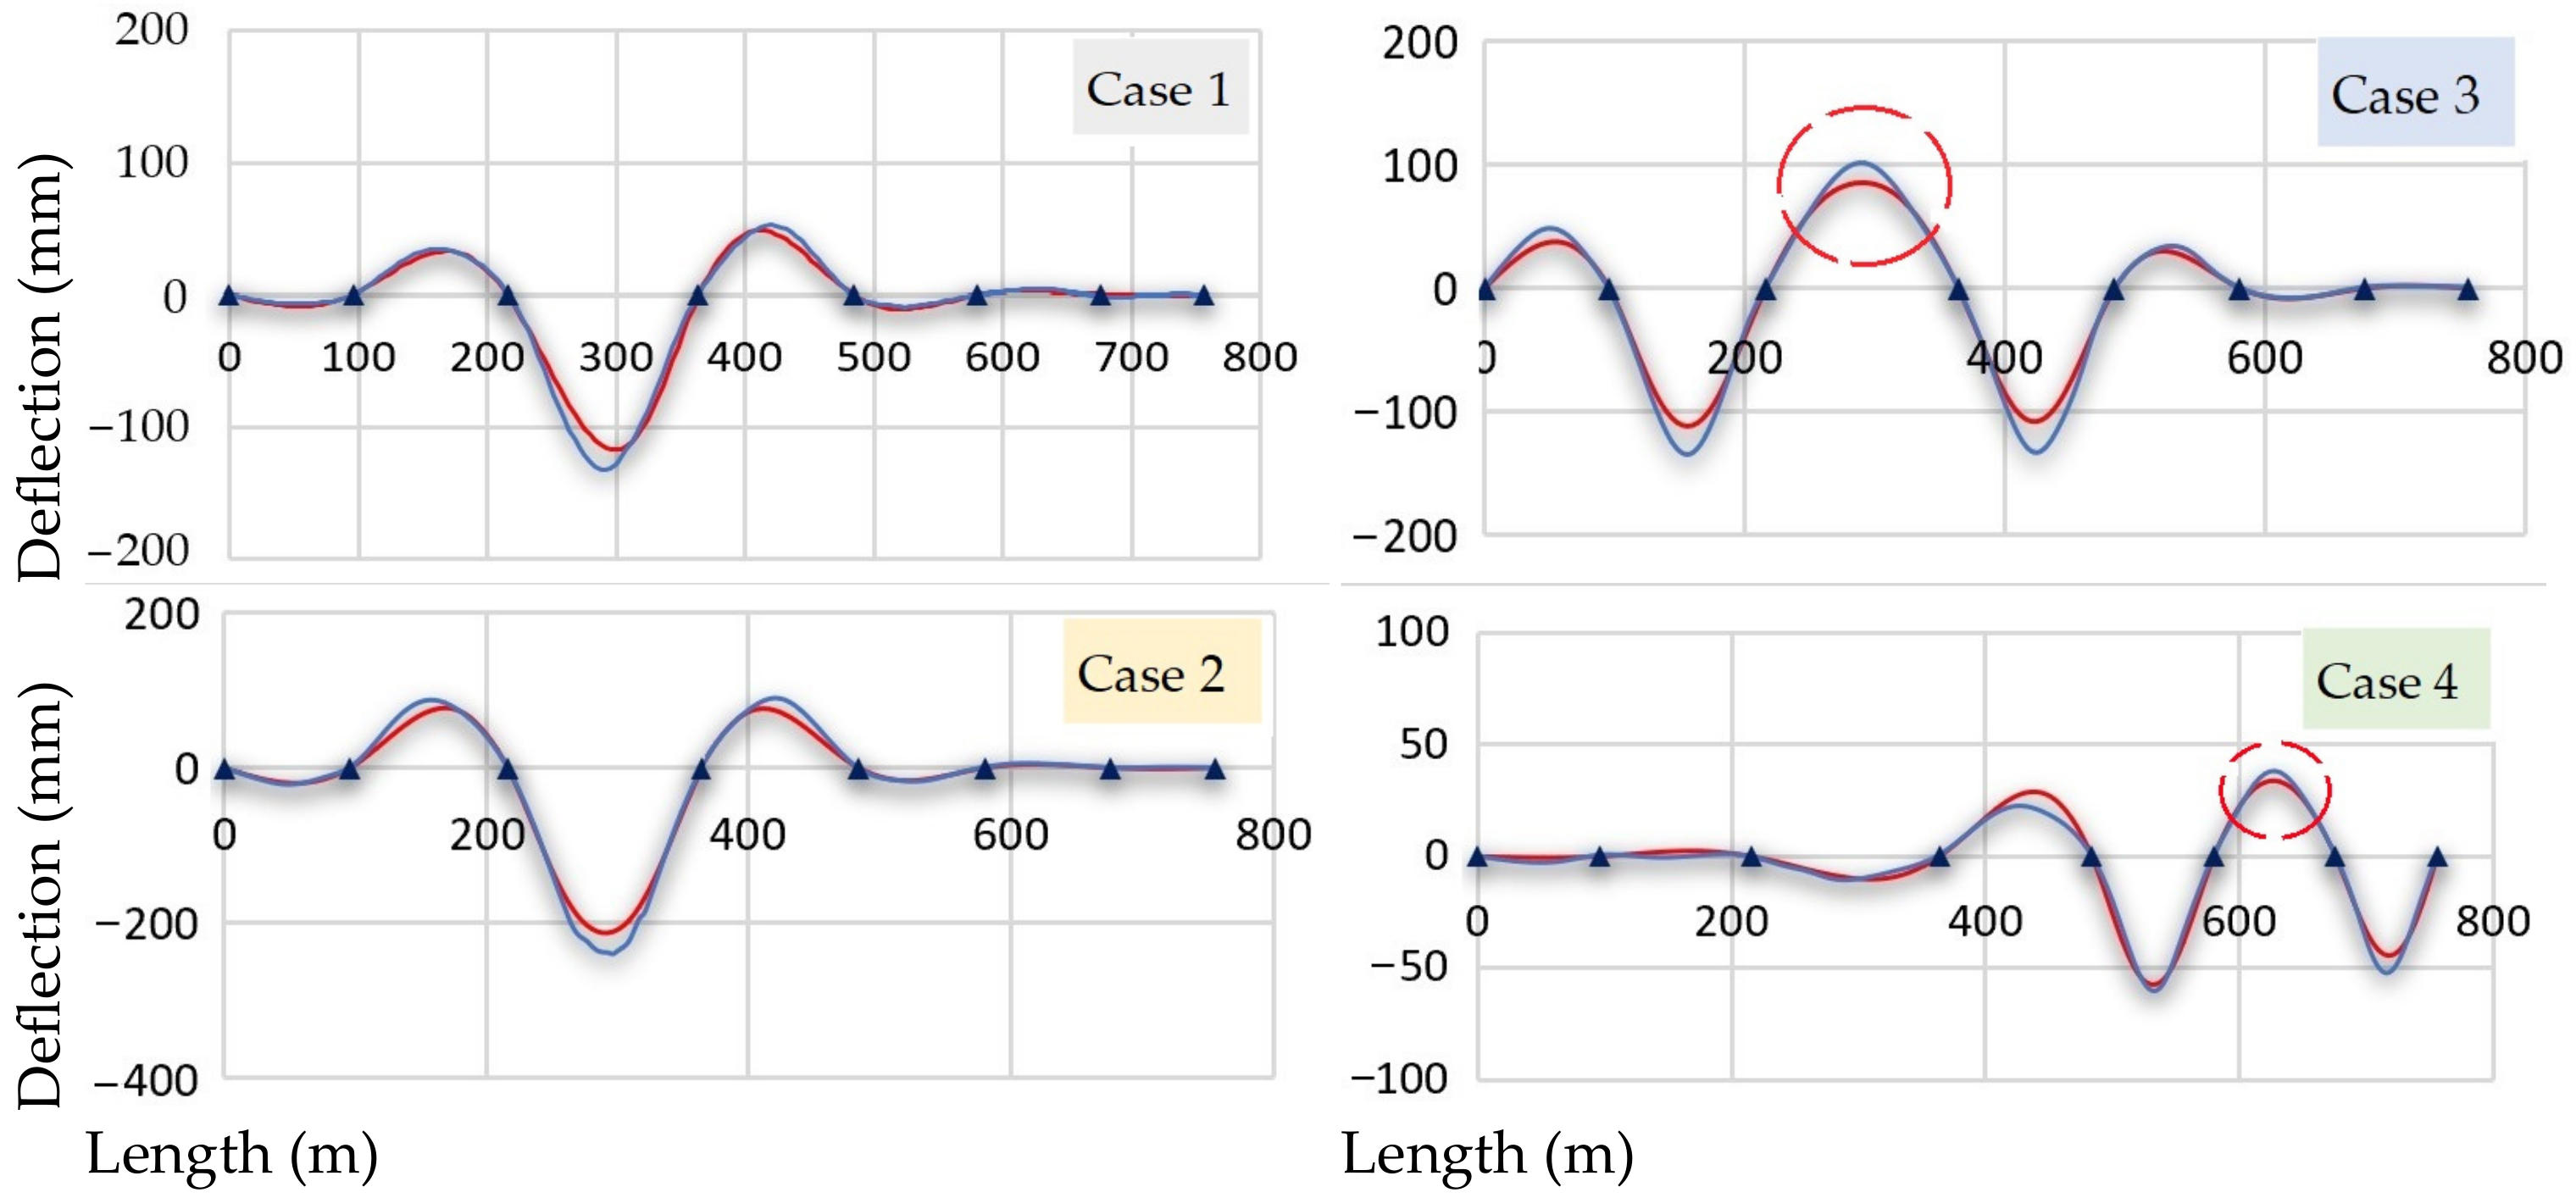
As mentioned before, the longitudinal arrangements of the load combinations and deflection results appear in the following sections. Table 1, Table 2, Table 3 and Table 4 summarize the static loading case arrangements where every colored rectangle represents a 15 m space for a 400 kN truck. The blued curve represents measured vertical deflections interpolated between the mid-span and each pier. The red curve represents deflections at every 4 m along the bridge model.
- (a)
- Load Configuration 01 (LC1)
The LC1 load cases followed the sequence shown in Table 1. The deck deflection measurements were taken during load cases 1, 2, 3 and 4. Figure 6 shows the vertical deflection predictions and calculations graphs for two loaded lanes at span 3 (Case 1,2), spans 2 and 4 (Case 3) and spans 5 and 7 (Case 5). Note the different vertical scales for deflection. As expected from Cases 1 and 2, the girder deflections increase as the truckload number increases in the center of the span. Therefore, the backspan upward deflections (the same graph, spans 2 and 4) also increase. From load cases 04 and 05, a critical upward deflection between the loaded spans appears, equal to 75% of the maximum deflection for case 03 and 63% for case 04. Note that upward deflection means moment reversal that may harm the plate deck. An example of the Case 2 field test and analytical results appears in Figure 7.
- (b)
- Load Configuration 02 (LC2)
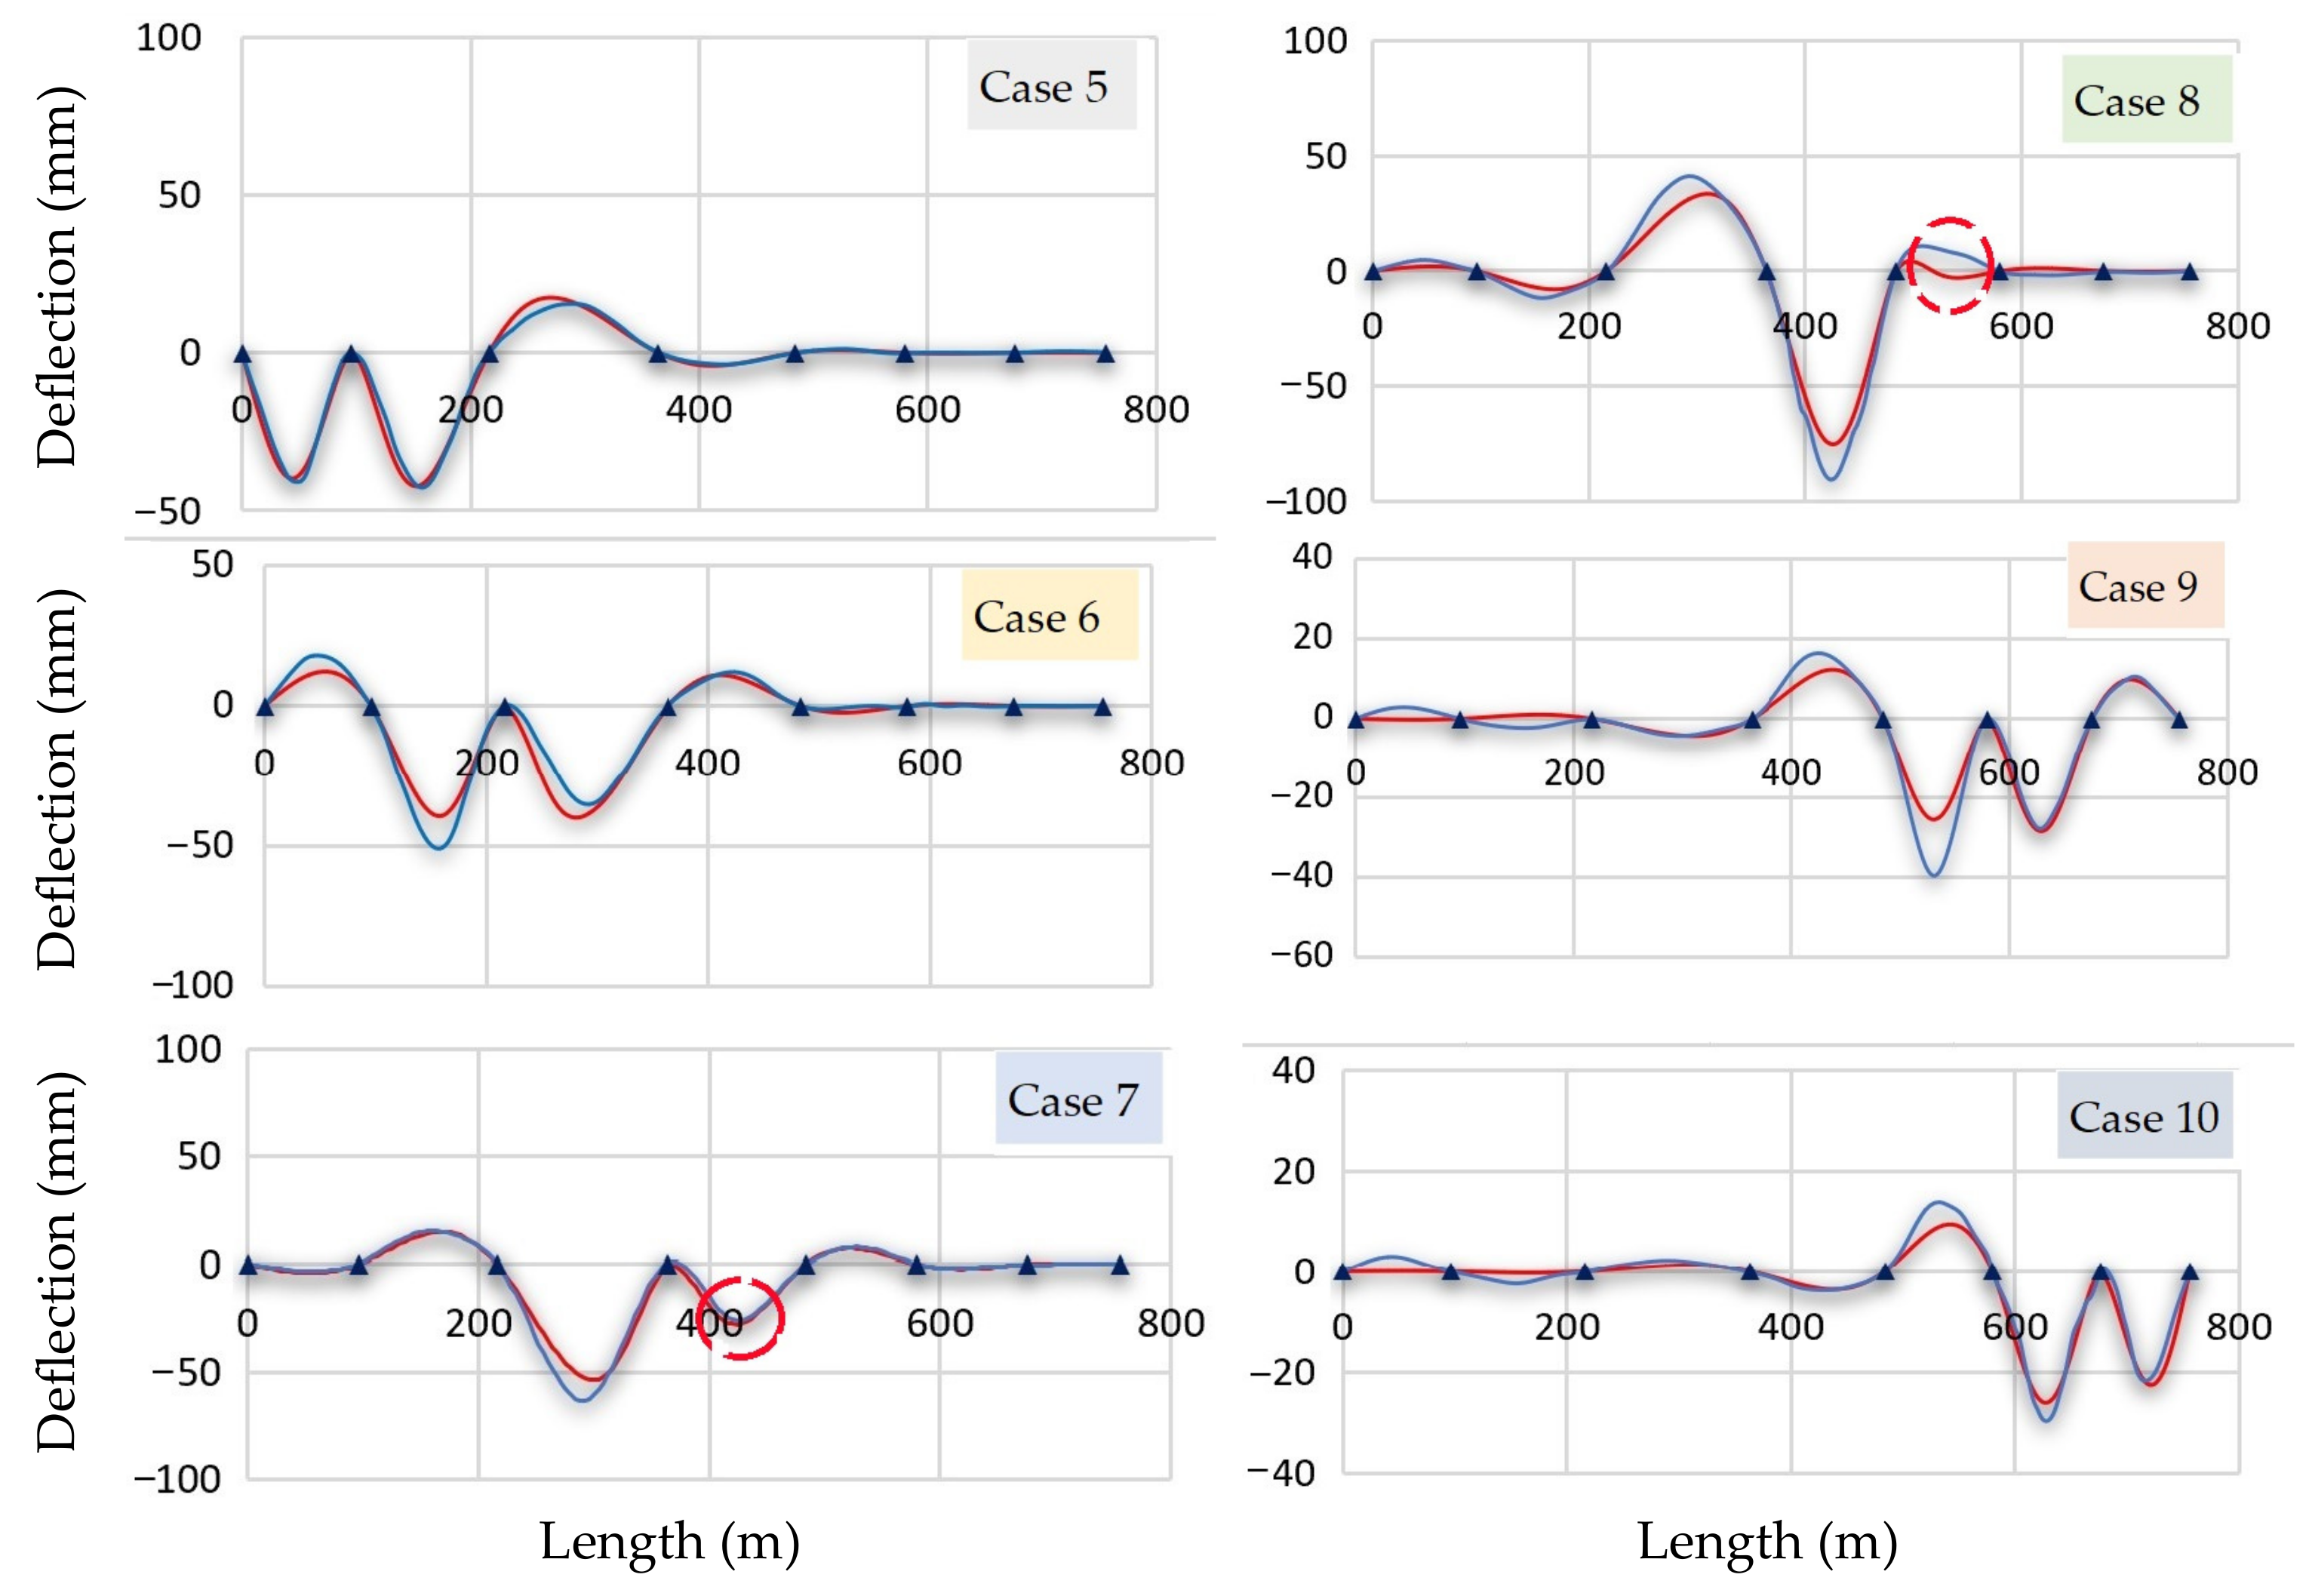
LC2 creates strong negative bending at the supports. Eight trucks apply load on one side (typically) and eight on the other. The loadings progress along the bridge deck at each support location, as shown in Table 2. The support sections are critical locations that require test loading. Figure 8 reveals that deflections occur only locally. Note the changing vertical scales again. For every case, except 07 and 08, spans adjacent to the load deflect slightly, and those farther away very little. Case 07 produces a lower deflection of span 4 than span 3 due to the different span lengths. The figure shows noticeable upward deflections in span 2 for this loading. Case 08 yields a more significant deflection in span 4 and less deflection in span 5 compared with the symmetrical loadings in LC-2. Loading on span 4 consists of 10 trucks, while on span 5, 6 trucks. While the 10-truck load dominates the deflection shape, the 6-truck loading attenuates deflection in span 5. Another effect from Case 08 is significant upward deflection in span 3, the longest span.
- (c)
- Load Configuration 03 (LC3)
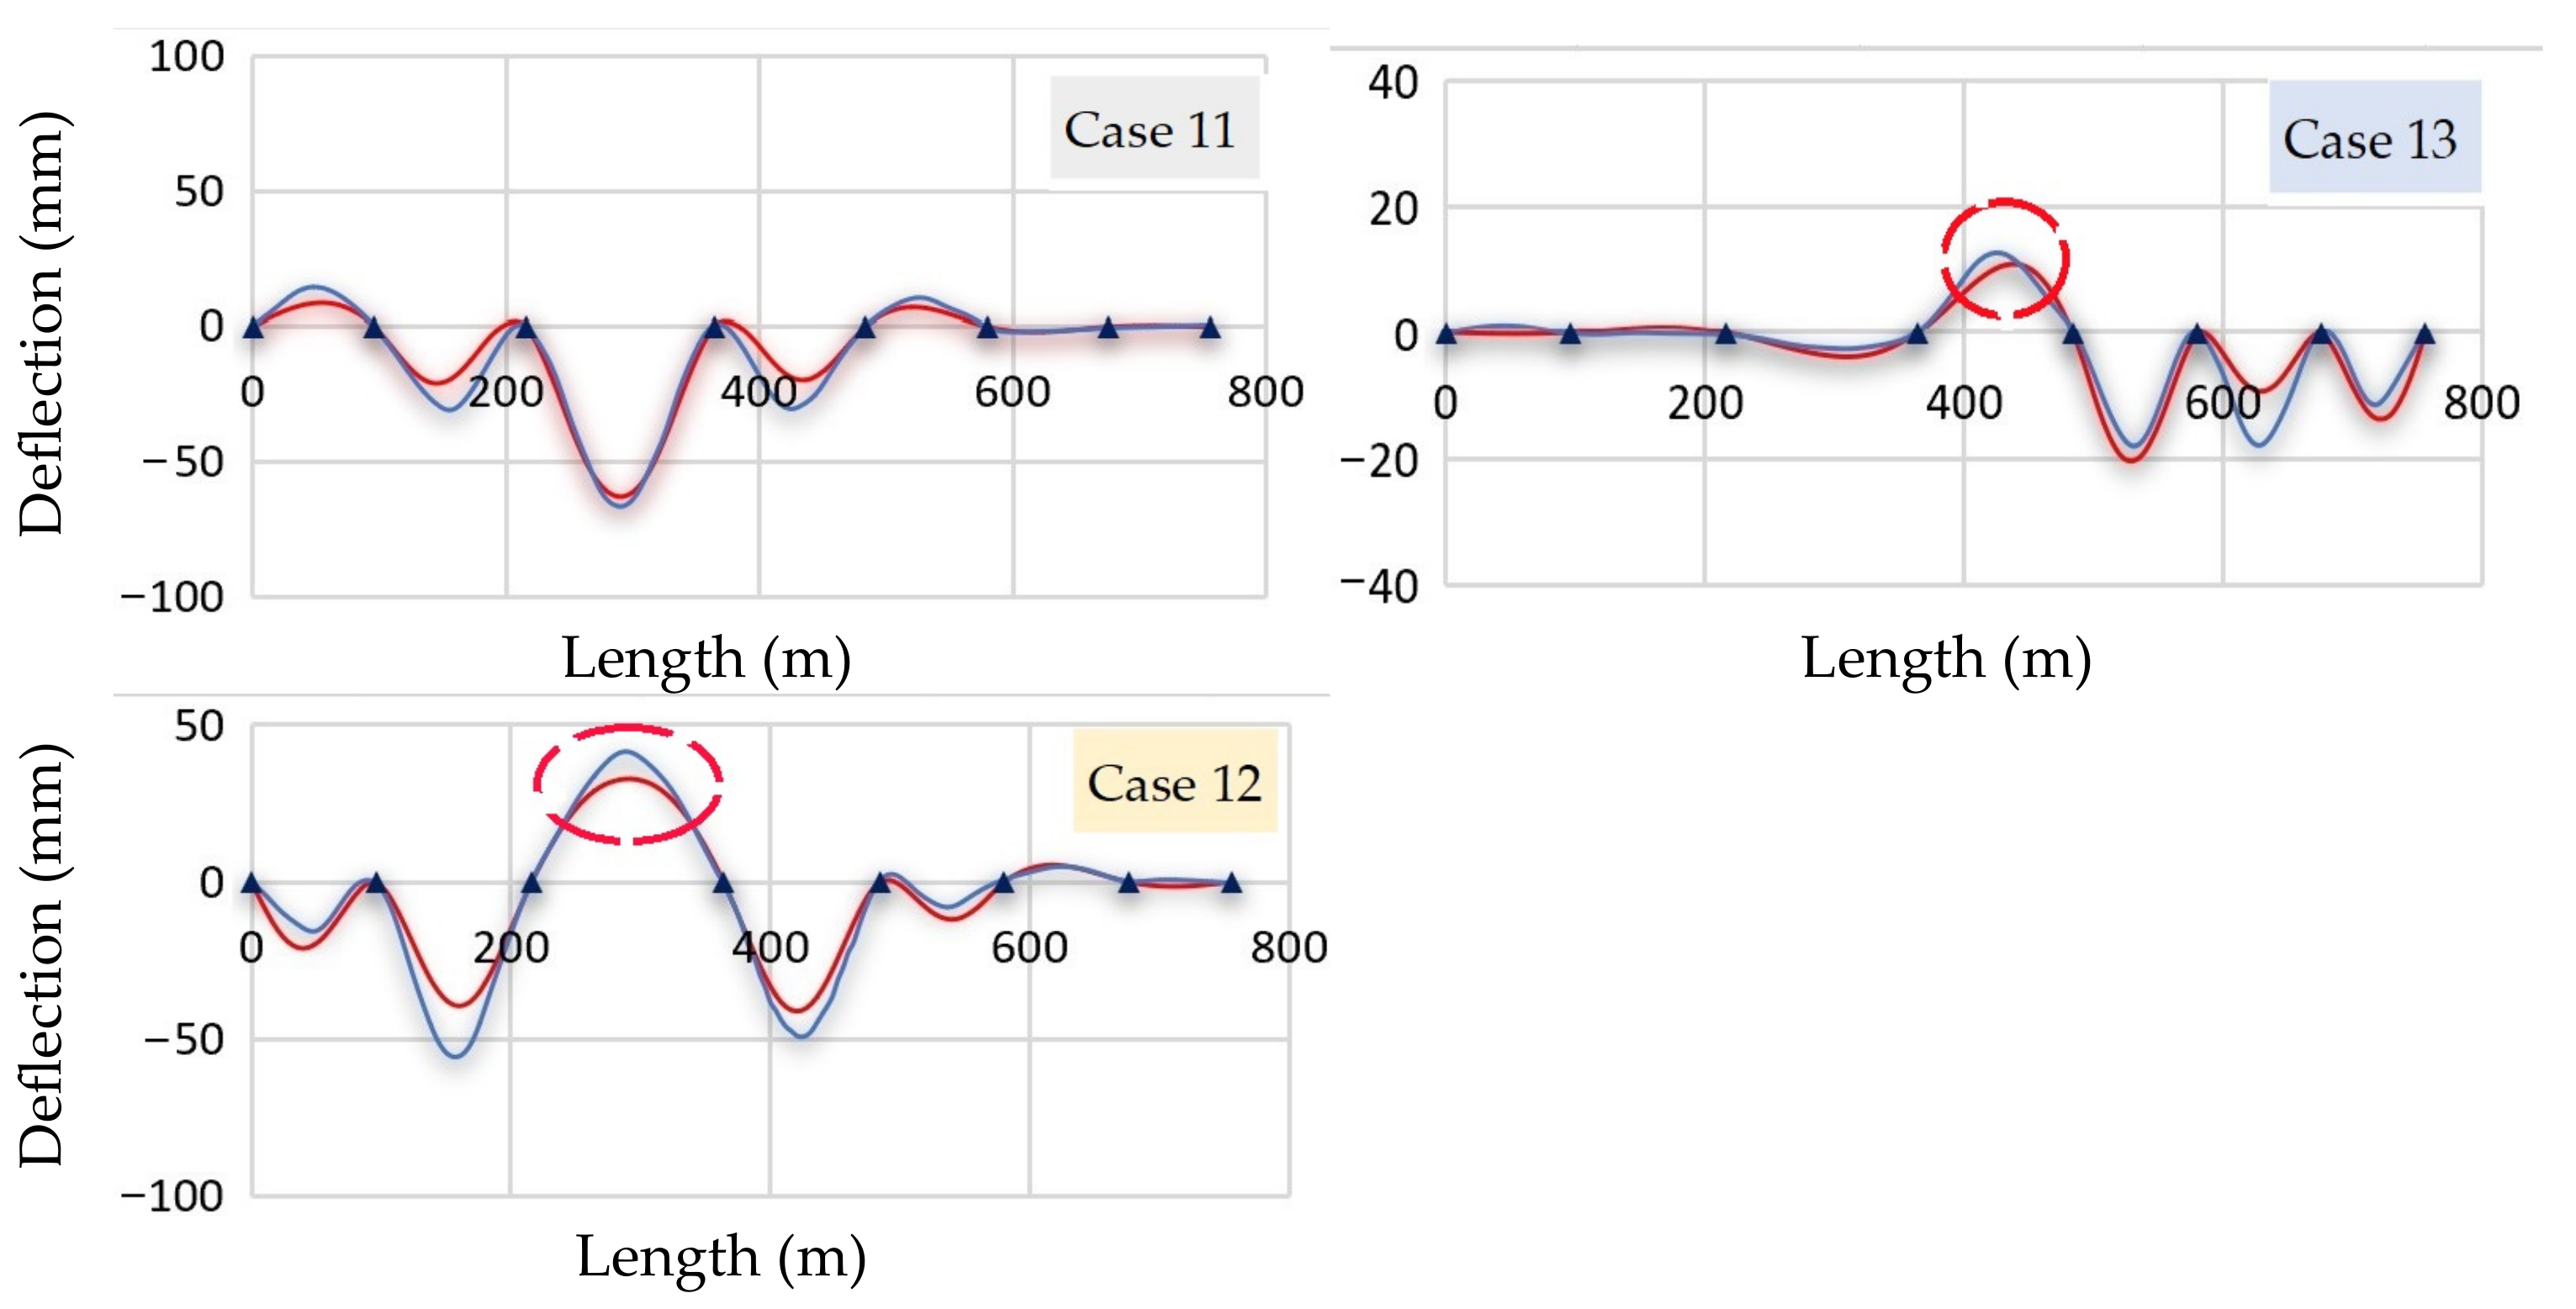
Load configuration 03 creates torsional deflections by alternating lanes in successive spans. The arrangement of trucks forces a downward twist on the loaded edge and an upward twist on neighboring spans in the same lane. The twist increases further due to the loads applied on neighboring spans but in the other lane, as shown in Table 3. Figure 9 shows the results of a typical torsional truck loading. There was a significant difference between the measured and analytical results in the loaded area because the number of loaded spans has increased compared to the other load cases. Differences in torsional stiffness, loading location, and measurement may account for the variance between measured and calculated deflections. Deflection estimates appear slightly overestimated in case 12 (red circle). In the backspan of case 13 (red circle), which represents 54 % of the maximum deflection, these deflections are also due to the torsional effect. An example of this effect appears in Figure 10.
- (d)
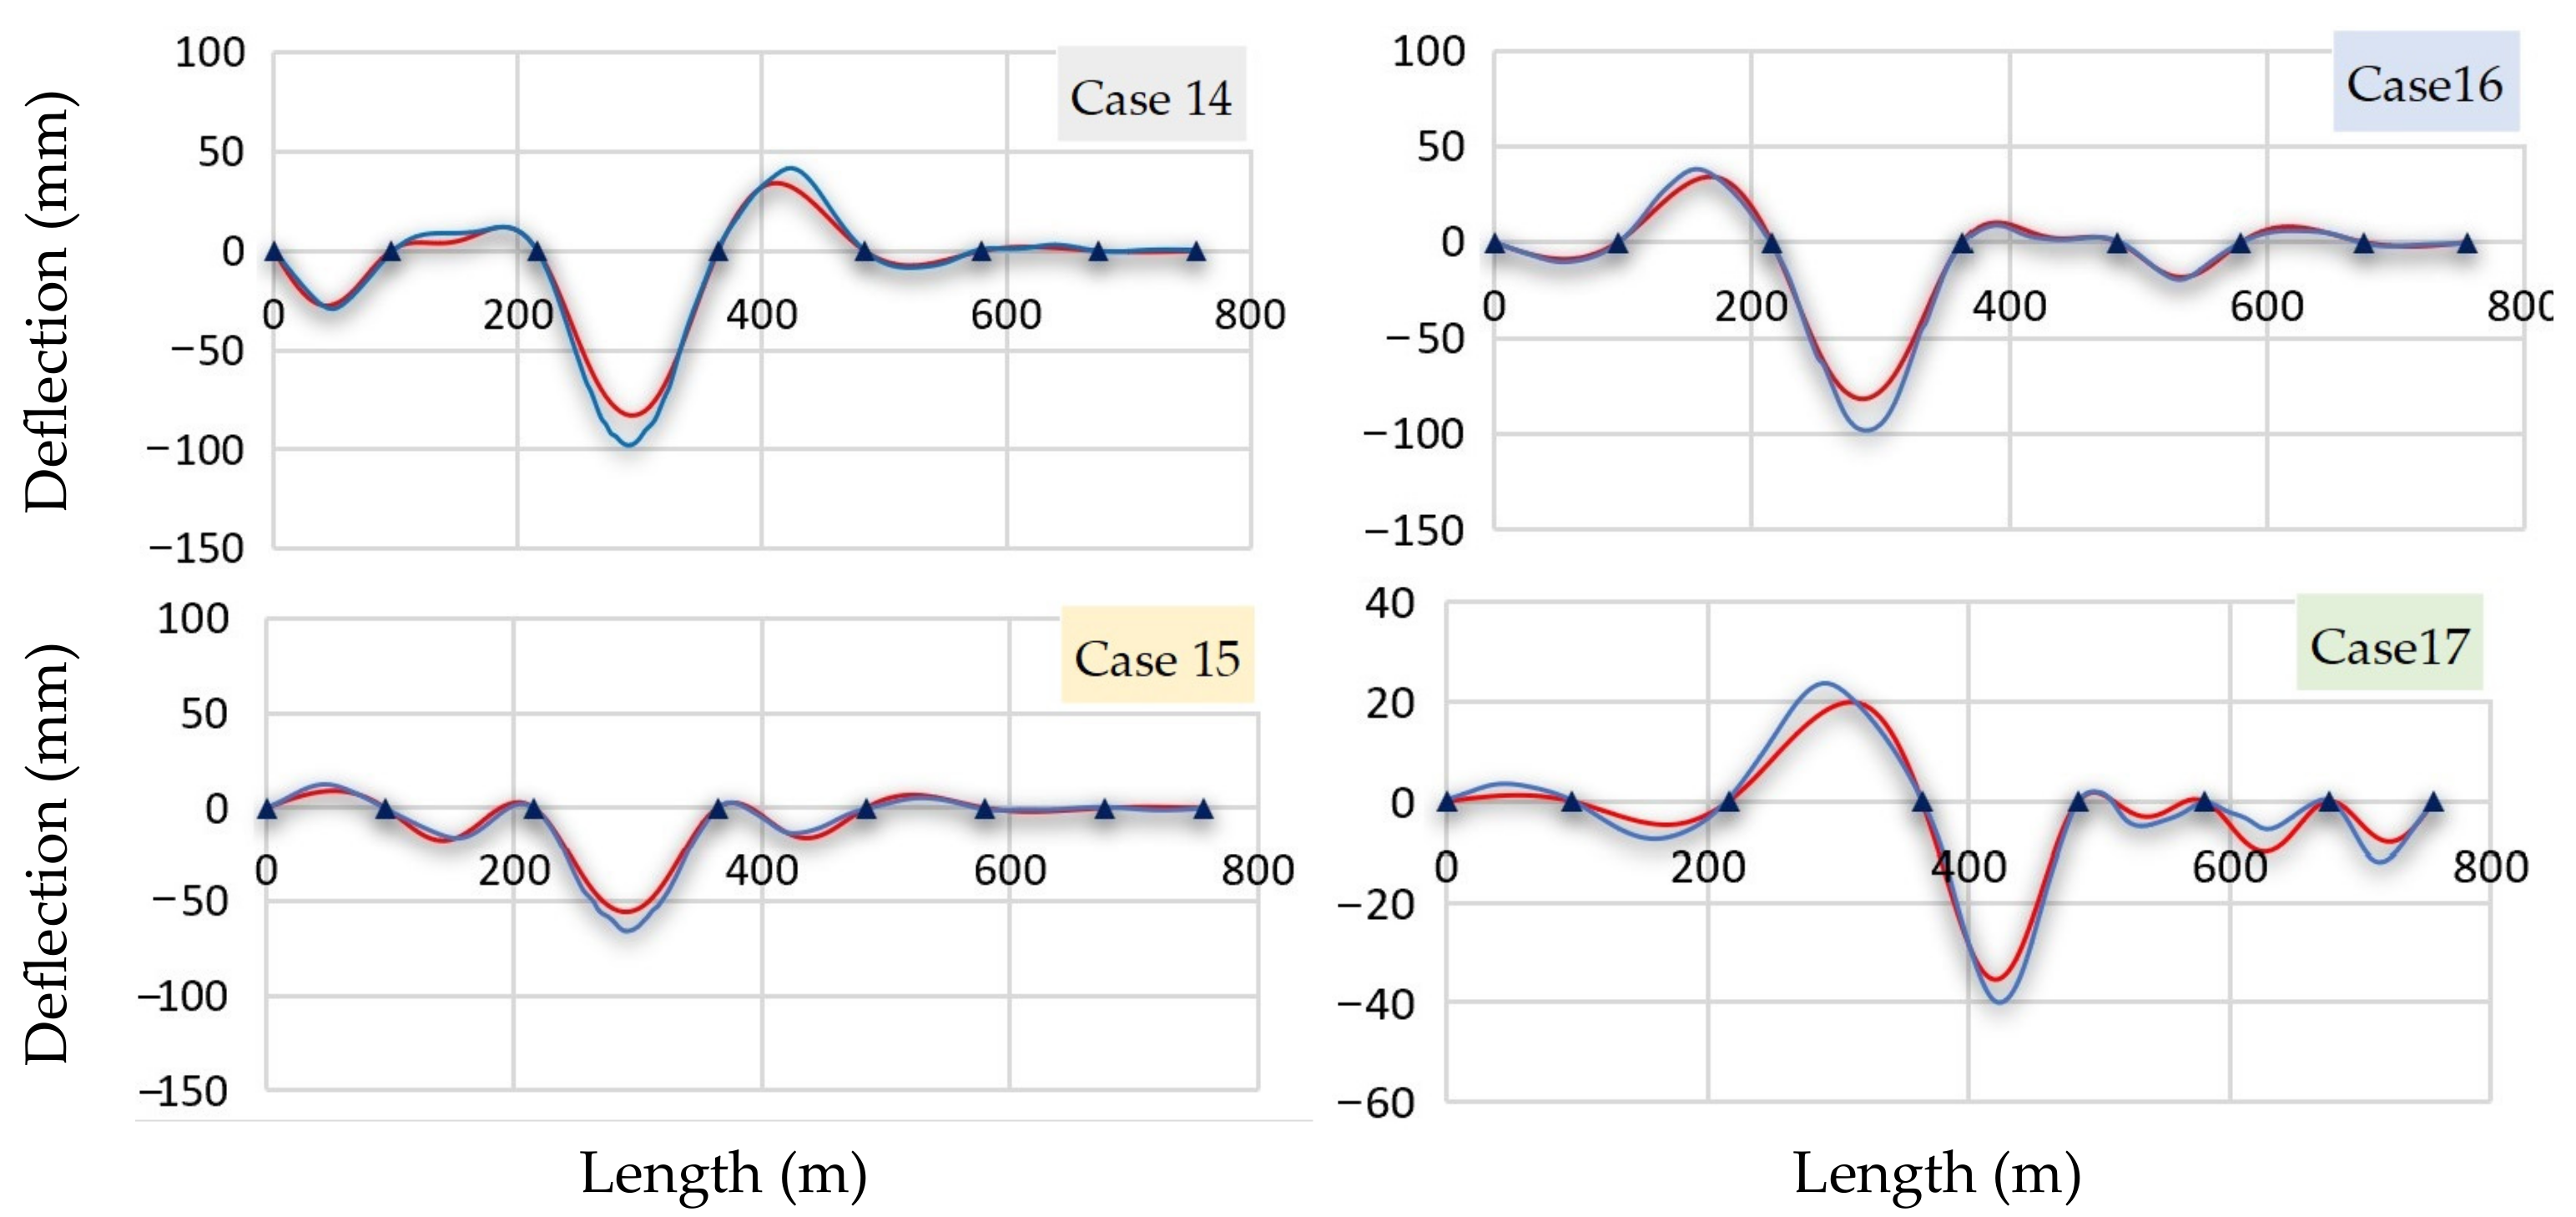
- Load Configuration 04 (LC4)
The one-side loadings arrangement appears in Table 4. Figure 11 shows the resulting deck deflections caused by these loads, a significant vertical deflection appears only in the third span, and this is due to the number of trucks (8 trucks) compared to the other spans (4 trucks). For the other spans (4 trucks), a lower deflection is noticeable, representing 1/3 of the maximum deflection for load cases 14, 15 and 17 and 1/6 for case 16.
3.1.1. Discussion of Static Deflection Results
There were 17 load tests subject to the weight of various operational trucks. The measured and computed deflections along the bridge appear in graphs. Based on the comparison figures above, the computed deflections in the relevant places and situations are considerably not different from the real state. Observations confirmed that the supports did not settle during the load test, and a visual inspection of the bridges showed no other noticeable damage.
Static load configuration 3, an alternating lane loading case, was found to be a critical design loading position for the box girder bridge due to the possibility of a torsional effect. Furthermore, in static load tests 3 and 4, the large spacing between the loaded spans produces an adverse upward deflection. In general, most of the test cases revealed that the viaduct behaved elastically, with deformations proportional to the applied truck loads and with negligible residual displacements (significantly below an average of 15 mm of the elastic deformation).
For the approval of the constructed bridge, the Hungarian national authority annex [8] allows an error range of no more than 20% between the maximum remaining elastic deformation and maximum detected deformation for steel bridge structures. From Table 5, the results show an average error between 1–21%. These differences may occur because of the deck stiffness variation caused by the non-modeled secondary elements (guard rails and pavement layers); thus, the tested bridge meets the authority requirements.
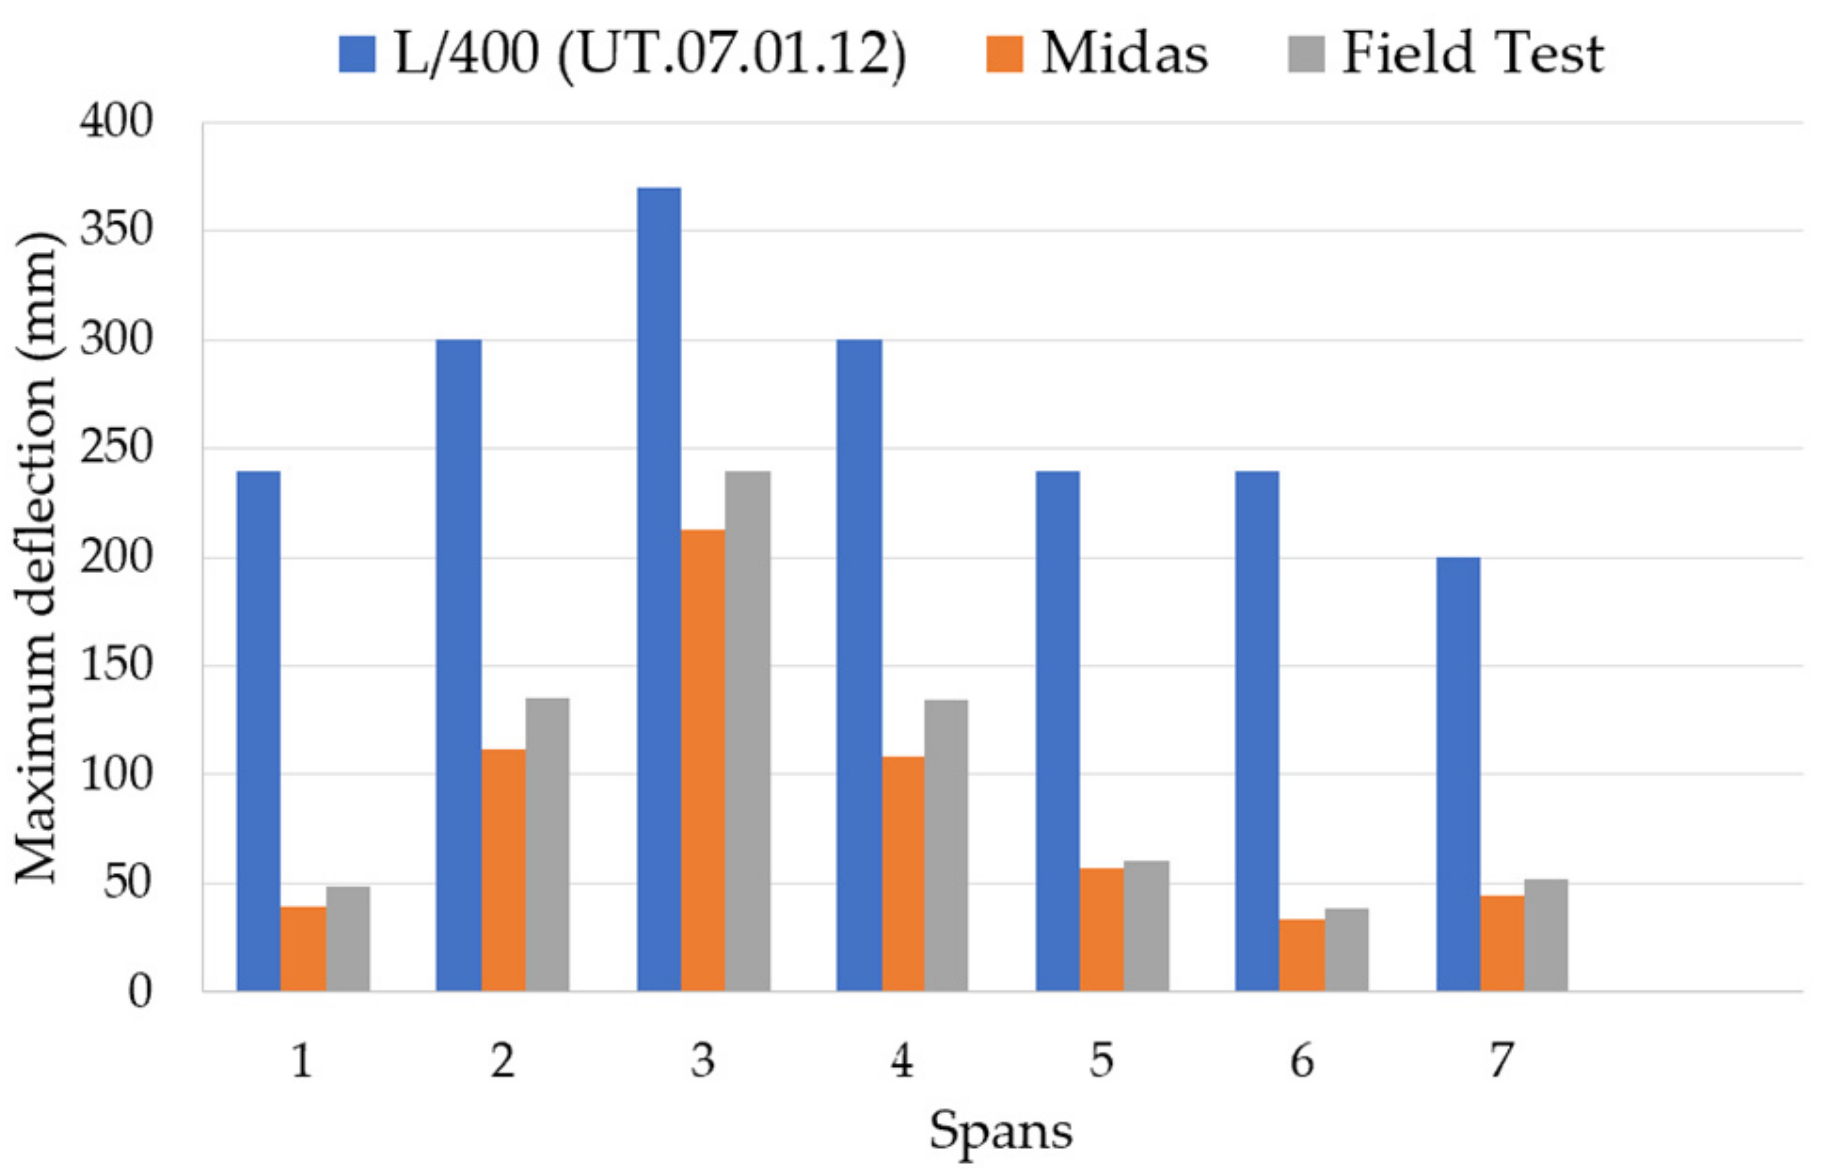
3.1.2. Deflection Limit Check
The deflection limit check applies to the center of the span. The critical value of maximum displacement is more significant than (L/400) according to the National Annex e-UT 07.01.12 [8], as presented in Equation (1). Bridge engineers commonly use this limit to evaluate the serviceability of the bridge. Here L is the span length: 96, 120, 148, 120, 96, 96 and 80 m, respectively. So, the calculated allowed deflection is, L/400 = 240, 300, 370, 300, 240, 240 and 200 mm for each span. The maximum displacements of the mid-spans under static vehicle load appear in Figure 12 and fall within the serviceability deflection limit. In conclusion, the bridge fulfills the standard’s serviceability requirement.
DZ ELS (MIDAS) & DZ ELS (Field test) < L/400,
3.2. Bridge Deflection under Dynamic Loadings
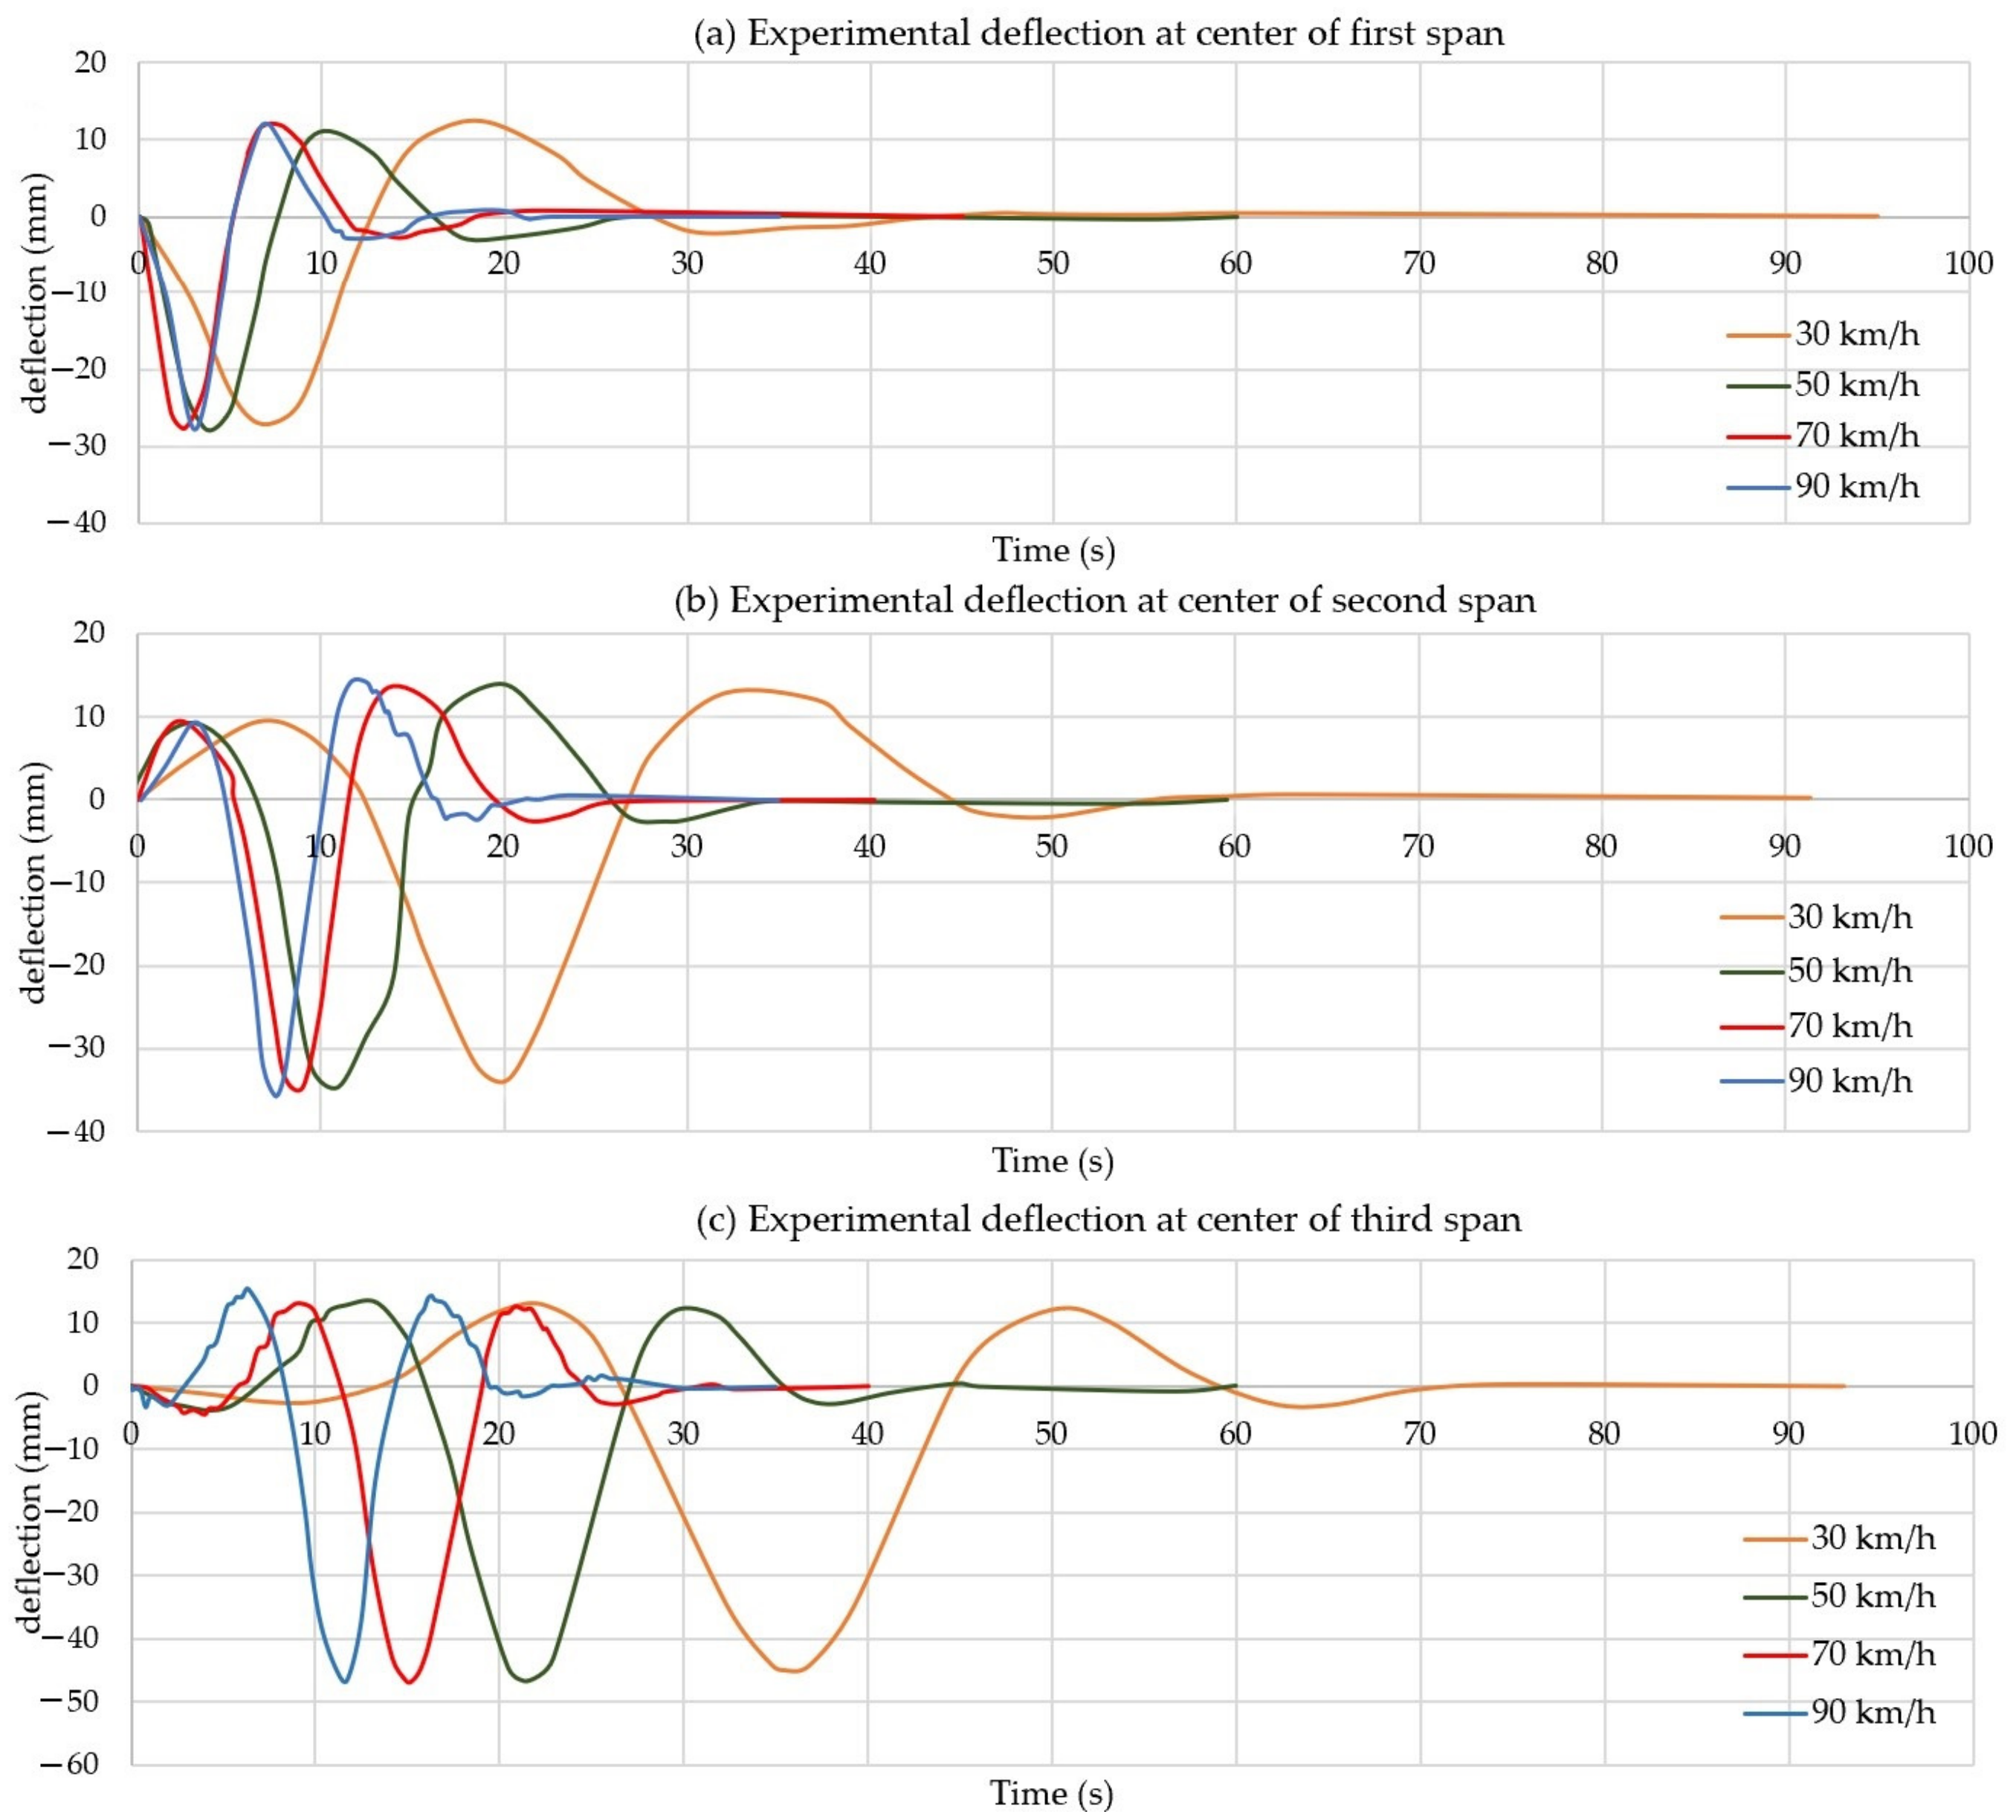
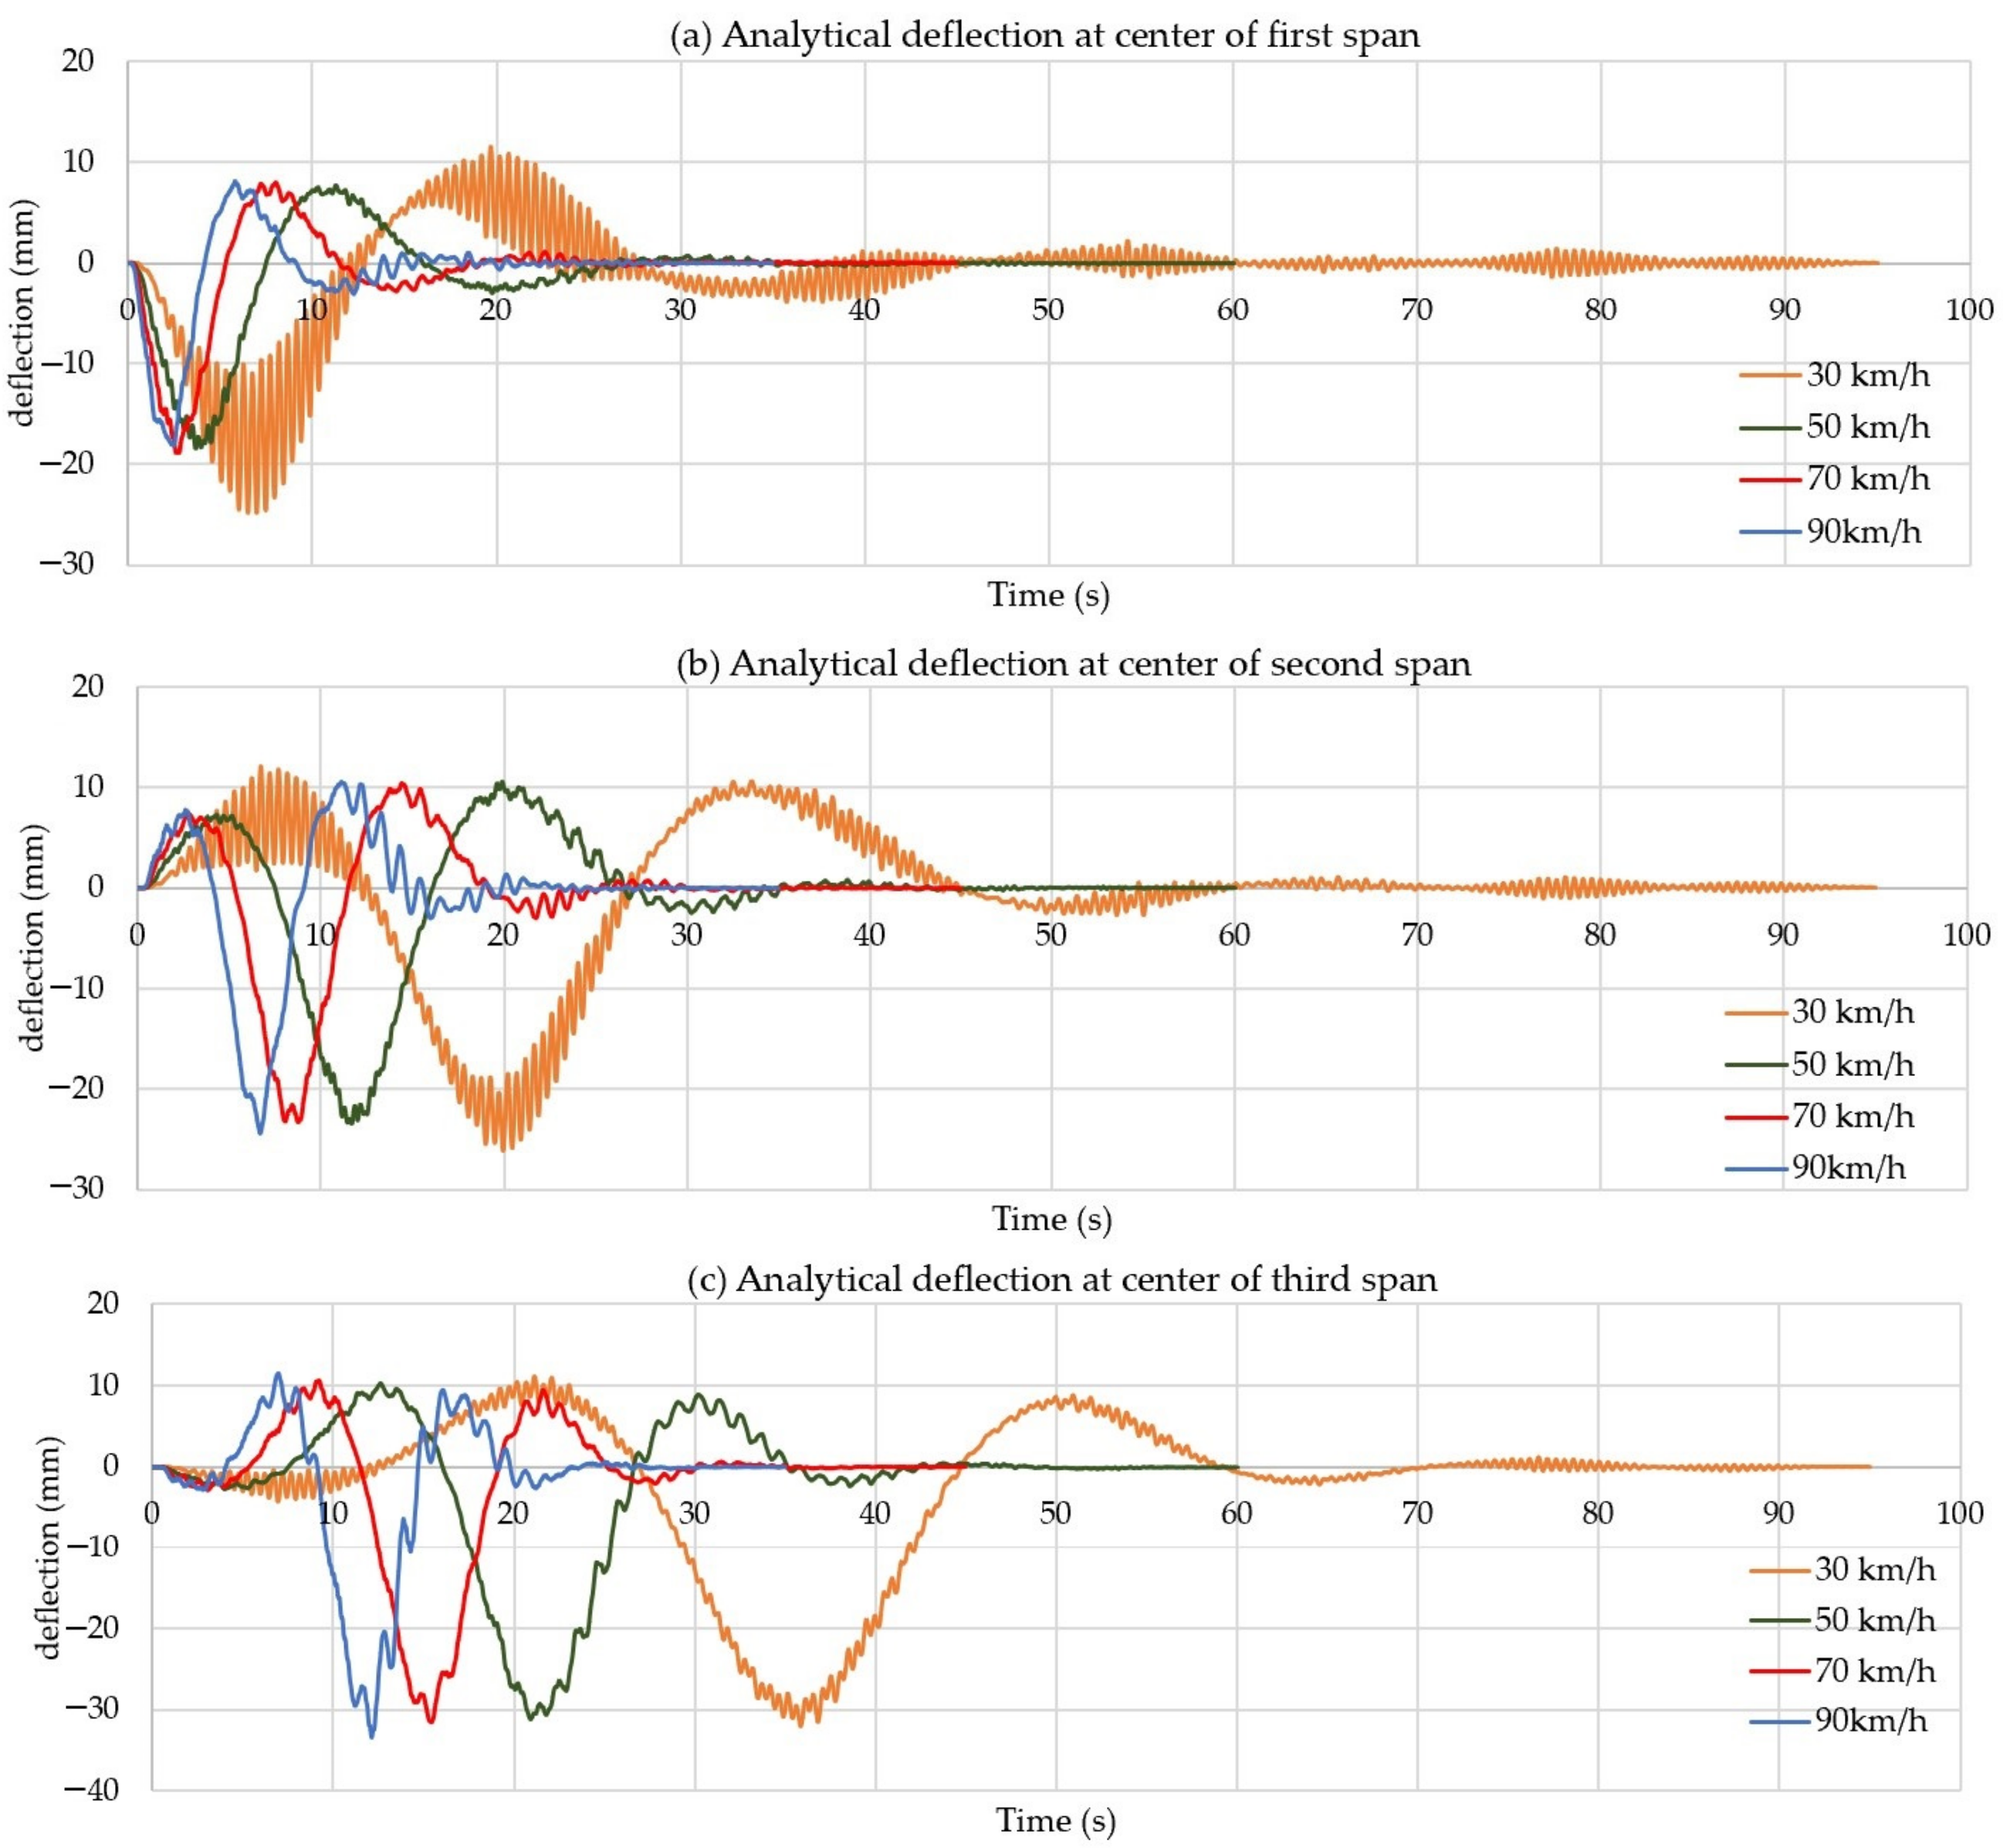
A linear time history analysis predicted the moving load effect on the model; the results of the dynamic deflection responses at the midpoint of the first three spans appear in Figure 13 and Figure 14. The applied loads in the model matched the test trucks’ weight and velocity.
As can be seen above, the differences between the recorded and calculated dynamic deflections of the deck along the longitudinal axis under dynamic loadings for different speeds agree closely, with some residual deflections reaching an average of 12 mm at the longest span. These differences may be caused by the truck FE-Model simulated using constantly moving nodal loads without considering the truck’s dynamic properties. In addition, there is no significant variation between the maximum amplitudes of deflection that occur at the midpoint of the seven spans.
When the trucks travel at a speed of 30 km/h, the dynamic deflection curves tend to fluctuate more across most of the bridge spans. However, the amplitude of the variability is relatively low. In contrast, at a speed of 90 km/h, the fluctuation of the deflection curve is less pronounced, but the amplitude of the variation is significantly higher. The cause of this behavior is the resonant frequencies of the dynamic system that consists of the moving trucks and the bridge.
Dynamic Amplification Factor
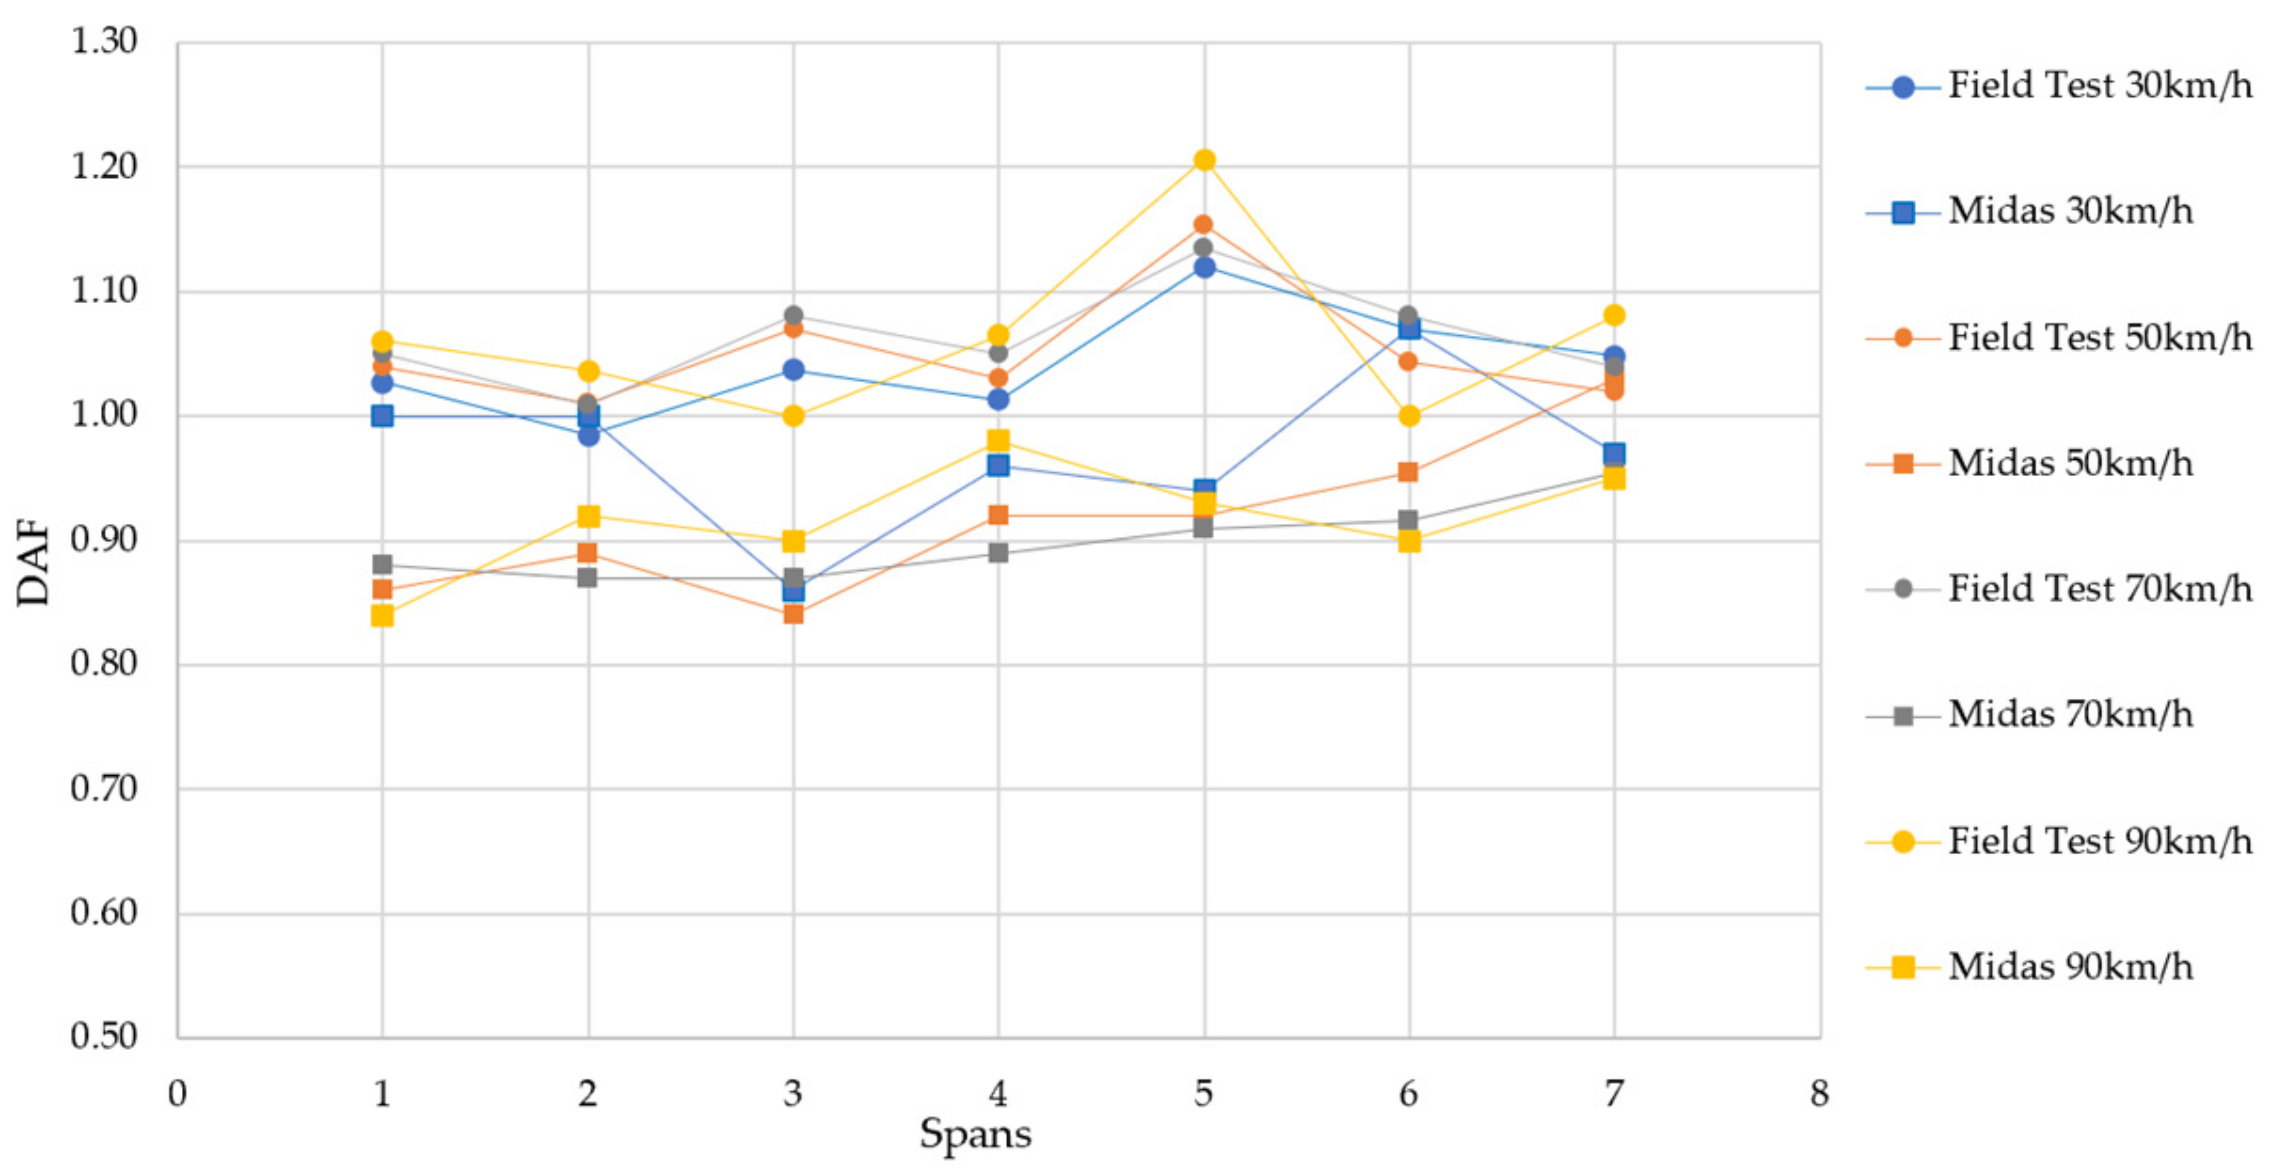
According to Eurocode 1 [38], the dynamic amplification factor φ (DAF), calculated by Equation (2), is the quotient between the dynamic and static response. It is included in traffic load models and depends on several parameters and actions. Eurocode limits φ to a maximum value of 1.7.
DAF was difficult to assess since the static loading configurations differed significantly from the dynamic loads (8–10 trucks vs. 2 trucks). The alternative here substitutes the 10 km/h test for static conditions. Figure 15 shows that the maximum DAF value is about 1.21 for the field test at 90 km/h on span 5. All test results and computations produced values much less than 1.7, so the bridge works within the appropriate limits with an elastic behavior.
4. Stresses in the Steel-Box Deck
During the static load tests, embedded strain gauges recorded stresses in the top and bottom bridge deck panels. A comparison of the longitudinal stresses to the finite element model is presented in Table 6 for the first 10 static loadings in the middle of the longest span and one of its supports, respectively (negative values indicate compression).
Table 6 shows that the measured stresses are similar to those calculated. The magnitude of the deviations is generally small since the changes in stiffness due to pavement layers may cause variations. The trends are very similar and show an acceptable variation.
5. Conclusions
The Szapáry Bridge is one of Hungary’s longest bridges constructed with steel box girders. A comprehensive FEM of the bridge was modeled and calibrated to the proof load test measurements to demonstrate the bridge’s serviceability before opening to the traffic. Based on the results obtained from the calibrated model, the following conclusions were derived:
- The finite-element model sufficiently represented the bridge field behavior and accurately estimated the deck deflection. This model can serve as a baseline for the as-built conditions of the structure and a starting point for the long-term monitoring of the Szapáry bridge.
- On the basis of the deflection comparison, the method proposed in this paper can be used for reliability and safety assessment of the bridge’s state under different loads. The information is more direct when compared to working exclusively with components and structural database. When combined with inspection and maintenance, it will provide valuable information on the bridge’s condition over time.
- The structural load-carrying capacity fulfilled the requirements of the original design. It confirmed an appropriate response for serviceability since the experimental deflections align well with the computed values according to the design provisions.
- However, critical load arrangements could damage the long-term bridge serviceability. Thus, designers should consider the many possible load combinations when evaluating deflections.
- For the box girder bridge design, multiple truck loading arrangements must account for any possible torsional action and damage that may occur.
Author Contributions
Conceptualization, M.B. and R.P.R.; methodology, R.P.R.; software, M.B.; validation, R.P.R. and R.K.; resources, M.B. and R.P.R.; data curation, R.P.R.; investigation, R.K.; writing—original draft preparation, M.B.; writing—review and editing, R.P.R. and R.K.; supervision, R.P.R. and R.K. All authors have read and agreed to the published version of the manuscript.
Funding
This research received no external funding.
Institutional Review Board Statement
Not applicable.
Informed Consent Statement
Not applicable.
Data Availability Statement
The data presented in this study are available from the corresponding author upon reasonable request.
Acknowledgments
The authors thank Teiter Zoltan and Péter Hudacsek for providing the data and design information.
Conflicts of Interest
The authors declare no conflict of interest.
References
- Hidayat, I.; Suangga, M.; Maulana, M.R. The effect of load position to the accuracy of deflection measured with LVDT sensor in I-girder bridge. IOP Conf. Ser. Earth Environ. Sci. 2018, 109, 012024. [Google Scholar] [CrossRef]
- Minsili, L.S.; Tchemou, G.; Louis, M.A.O.; Josette, M.L.A. Parametric Analysis of Vertical Deflections of Bridges under Moving. Sch. Bull. 2017, 3, 685–694. [Google Scholar]
- Birhane, F.N.; Kim, S.I.; Jang, S.Y. Long-term deflection of prestressed concrete bridge considering nonuniform shrinkage and crack propagation by equivalent load approach. Appl. Sci. 2020, 10, 7754. [Google Scholar] [CrossRef]
- Ma, Y.; Chen, H.; Han, Q. Sensitivity Analysis of Factors Affecting down Deflection of Long-span Continuous Rigid Frame Bridge. IOP Conf. Ser. 2021, 781, 022048. [Google Scholar] [CrossRef]
- Robertson, I.N. Prediction of vertical deflections for a long-span prestressed concrete bridge structure. Eng. Struct. 2005, 27, 1820–1827. [Google Scholar] [CrossRef]
- Brownjohn, J.M.W.; Magalhaes, F.; Caetano, E.; Cunha, A. Ambient vibration re-testing and operational modal analysis of the Humber Bridge. Eng. Struct. 2010, 32, 2003–2018. [Google Scholar] [CrossRef] [Green Version]
- Bardakis, V.G.; Fardis, M.N. A displacement-based seismic design procedure for concrete bridges having deck integral with the piers. Bull. Earthq. Eng. 2011, 9, 537–560. [Google Scholar] [CrossRef]
- Ájpli, B.; Borzsák, P. e-UT 07.01.12—Structural Calculation. Design Code of Highway Bridges 2; Hungarian roads association: Budapest, Hungary, 2011. (In Hungarian) [Google Scholar]
- Dong, C.; Bas, S.; Debees, M.; Alver, N.; Catbas, F.N. Bridge Load Testing for Identifying Live Load Distribution, Load Rating, Serviceability and Dynamic Response. Front. Built Environ. 2020, 6, 1–14. [Google Scholar] [CrossRef]
- Lantsoght, E.O. Load Testing of Bridges; Proof Load Testing and the Future of Load Testing; CRC Press: London, UK, 2019; Volume 13. [Google Scholar] [CrossRef]
- Schacht, G.; Krontal, M.; Marx, S.; Bolle, G.; Wismar, H. Loading Tests of Existing Concrete Structures-Historical Development and Present Practise. In Proceedings of the Fib Symposium, Prague, Czech Republic, 8–10 June 2011. [Google Scholar]
- Jenkins, C.H.; Kjerengtroen, L.; Oestensen, H. Sensitivity of Parameter Changes in Structural Damage Detection. Shock. Vib. 1997, 4, 807239. [Google Scholar] [CrossRef]
- Dolati, S.S.K.; Caluk, N.; Armin, B.M.; Dolati, S.S.K. Non-Destructive Testing Applications for Steel Bridges. Appl. Sci. 2021, 11, 9757. [Google Scholar] [CrossRef]
- Zhu, Y.F.; Ren, W.X.; Wang, Y.F. Structural health monitoring on Yangluo Yangtze River Bridge: Implementation and demonstration. Adv. Struct. Eng. 2022, 25, 1431–1448. [Google Scholar] [CrossRef]
- Fang, I.-K.; Chen, C.-R.; Chang, I.-S. Field Static Load Test on Kao-Ping-Hsi Cable-Stayed Bridge. J. Bridg. Eng. 2004, 9, 531–540. [Google Scholar] [CrossRef]
- Ren, W.-X.; Lin, Y.-Q.; Peng, X.-L. Field Load Tests and Numerical Analysis of Qingzhou Cable-Stayed Bridge. J. Bridg. Eng. 2007, 12, 261–270. [Google Scholar] [CrossRef]
- Hassan, M.; Burdet, O.; Favre, R. Analysis and Evaluation of Bridge Behavior Under Static Load Testing Leading to Better Design and Judgment Criteria. In Proceedings of the Fourth Bridge Engineering Conference, Transportation Research Board (TRB), San Francisco, CA, USA, 28–30 August 1995. [Google Scholar]
- Galati, N.; Casadei, P.; Nanni, A. In-Situ Load Testing of Bridge a6101 Lexington, MO; Center for infrastructure engineering studies: Washington, DC, USA, 2005. [Google Scholar]
- Wang, X.; Wang, L.; Wang, H.; Ning, Y.; Huang, K.; Wang, W. Performance evaluation of a long-span cable-stayed bridge using non-destructive field loading tests. Appl. Sci. 2022, 12, 2367. [Google Scholar] [CrossRef]
- Zheng, X.; Du, H.; Zhang, R.; Ma, Q.; Gao, H. Static load test of RC T-beam bridge flexural strengthening with externally bonded steel plates. IOP Conf. Ser. Earth Environ. Sci. 2021, 791, 012018. [Google Scholar] [CrossRef]
- Cao, W.J.; Koh, C.G.; Smith, I.F.C. Enhancing static-load-test identification of bridges using dynamic data. Eng. Struct. 2019, 186, 410–420. [Google Scholar] [CrossRef]
- Bayraktar, A.; Türker, T.; Tadla, J.; Kurşun, A.; Erdiş, A. Static and dynamic field load testing of the long span Nissibi cable-stayed bridge. Soil Dyn. Earthq. Eng. 2017, 94, 136–157. [Google Scholar] [CrossRef]
- Sun, Z.; Siringoringo, D.M.; Fujino, Y. Load-carrying capacity evaluation of girder bridge using moving vehicle. Eng. Struct. 2021, 229, 111645. [Google Scholar] [CrossRef]
- Cantero, D.; Gonzáez, A.; Obrien, E.J. Comparison of bridge dynamic amplifications due to articulated 5-axle trucks and large cranes. Balt. J. Road Bridg. Eng. 2011, 6, 39–47. [Google Scholar] [CrossRef]
- Lak, M.A.; Degrande, G.; Lombaert, G. The effect of road unevenness on the dynamic vehicle response and ground-borne vibrations due to road traffic. Soil Dyn. Earthq. Eng. 2011, 31, 1357–1377. [Google Scholar] [CrossRef]
- Cantero, D.; Hester, D.; Brownjohn, J. Evolution of bridge frequencies and modes of vibration during truck passage. Eng. Struct. 2017, 152, 452–464. [Google Scholar] [CrossRef] [Green Version]
- Moussa, A.I.; Shahawy, M.A. Dynamic and static tests of prestressed concrete girder bridges in Florida. Struct. Res. Cent. 1993, 80. [Google Scholar]
- Hernandez, W.; Viviescas, A.; Riveros-Jerez, C.A. Vehicle Bump Testing Parameters Influencing Modal Identification of Long-Span Segmental Prestressed Concrete Bridges. Sensors 2022, 22, 1219. [Google Scholar] [CrossRef] [PubMed]
- Gatti, M. Structural health monitoring of an operational bridge: A case study. Eng. Struct. 2019, 195, 200–209. [Google Scholar] [CrossRef]
- Meixedo, A.; Ribeiro, D.; Santos, J.; Calçada, R.; Todd, M. Progressive numerical model validation of a bowstring-arch railway bridge based on a structural health monitoring system. J. Civ. Struct. Health Monit. 2021, 11, 421–449. [Google Scholar] [CrossRef]
- De Angelis, A.; Pecce, M.R. Model assessment of a bridge by load and dynamic tests. Eng. Struct. 2023, 275, 115282. [Google Scholar] [CrossRef]
- Qin, S.; Zhang, Y.; Zhou, Y.L.; Kang, J. Dynamic model updating for bridge structures using the kriging model and PSO algorithm ensemble with higher vibration modes. Sensors 2018, 18, 1879. [Google Scholar] [CrossRef] [PubMed] [Green Version]
- Sousa, H.; Cavadas, F.; Henriques, A.; Bento, J.; Figueiras, J. Bridge deflection evaluation using strain and rotation measurements. Smart Struct. Syst. 2013, 11, 365–386. [Google Scholar] [CrossRef]
- Gouda, L.P. Study on Parametric Behaviour of Single Cell Box Girder under Different Radius of Curvature. Master’s Thesis, National Institute of Technology Rourkela, Rourkela, India, 2013. [Google Scholar]
- MIDAS Civil. Midas User Manual; MIDAS Information Technology Co.: Seongnam, Republic of Korea, 2018. [Google Scholar]
- EN 1993-2; Eurocode 3: Design of steel structures—Part 2: Steel bridges. CEN-European Committee for Standardization: Brussels, Belgium, 2006.
- Gupta, P.K.; Singh, K.K.; Mishra, A. Parametric Study on Behaviour of Box-Girder Bridges Using Finite Element Method. Asian J. Civ. Eng. 2010, 11, 135–148. [Google Scholar]
- EN 1991-3; Eurocode 1: Basis of design and actions on structures—Part 2: Traffic loads on bridges. CEN-European Committee for Standardization: Brussels, Belgium, 2003.
Figure 1.
The bridge on the Tisza River: during construction: (a) aerial view; (b) lateral viaduct view; (c) steel box section view.
Figure 1.
The bridge on the Tisza River: during construction: (a) aerial view; (b) lateral viaduct view; (c) steel box section view.

Figure 2.
Bridge Truck loading test in 2 × 2 configuration.

Figure 3.
Measurement of deflections: (a) plan of the test measurement; (b,c) measurement instrument.
Figure 3.
Measurement of deflections: (a) plan of the test measurement; (b,c) measurement instrument.

Figure 4.
Finite element model of the Szapáry bridge: (a) Details of the FE model; (b) Arrangement of bridge cross-sections: along support, Sec A-A, Sec B-B, as marked in (a).
Figure 4.
Finite element model of the Szapáry bridge: (a) Details of the FE model; (b) Arrangement of bridge cross-sections: along support, Sec A-A, Sec B-B, as marked in (a).

Figure 5.
Design truck: (a) elevation and total applied axle loads; (b) plan view.

Figure 6.
Comparison LC 1 of experimental tests (blue) with numerical analyses (red).

Figure 7.
Load case 02 with 16 trucks: (a) load test; (b) vertical deflection result by FEM.

Figure 8.
Comparison LC 2 of experimental tests (blue) with numerical analyses (red).

Figure 9.
Comparison LC 2 of experimental tests (blue graphs) with numerical analyses (red graphs).

Figure 10.
Load case 11, deflections due to torsional loading.

Figure 11.
Comparison LC 1 of experimental tests (blue graphs) with numerical analyses (red graphs).
Figure 11.
Comparison LC 1 of experimental tests (blue graphs) with numerical analyses (red graphs).

Figure 12.
Maximum mid-span deflections of the bridge.

Figure 13.
Recorded data of dynamic deflection under moving trucks.

Figure 14.
FEM results of dynamic deflection under moving trucks.

Figure 15.
Dynamic amplification factor DAF as a function of truck speed.


Table 1.
Longitudinal arrangements of load configuration 01.
 |
Table 2.
Longitudinal arrangement of load configuration 02.
 |
Table 3.
Longitudinal arrangement of load configuration 03.
 |
Table 4.
Longitudinal arrangement of load configuration 04.
 |
Table 5.
The maximum error between the maximum calculated and measured deflections.
| Cases | 1 | 2 | 3 | 4 | 5 | 6 | 7 | 8 | 9 | 10 | 11 | 12 | 13 | 14 | 15 | 16 | 17 |
| MaxError (mm) | 10.30 | 25.26 | 23.57 | 2.78 | 0.48 | 6.56 | 7.10 | 15.42 | 0.58 | 3.82 | 2.73 | 7.73 | 2.53 | 14.99 | 10.12 | 16.42 | 4.33 |
| MaxError (%) | 8.78 | 11.88 | 21.04 | 4.85 | 1.14 | 16.36 | 13.27 | 20.50 | 2.06 | 14.68 | 4.34 | 18.78 | 12.40 | 18.08 | 18.19 | 20.09 | 12.21 |
Table 6.
Stress variations from static load cases.
| Load Cases | Stress Variations (N/mm2) | |||||||
|---|---|---|---|---|---|---|---|---|
| Middle Top Plate Midspan | Middle Bottom Plate Midspan | Middle Top Plate Near Support | Middle Bottom Plate Near Support | |||||
| Measured | Analytical | Measured | Analytical | Measured | Analytical | Measured | Analytical | |
| 1 | −25.6 | −25.1 | 35.4 | 37.3 | 12.2 | 14 | −14.8 | −16.2 |
| 2 | −46.4 | −46.9 | 69.2 | 71.7 | 32.4 | 32.3 | −33.5 | −37.6 |
| 3 | 13.9 | 13.7 | −20.9 | −20.9 | 11.3 | 11.9 | −9.5 | −15.7 |
| 4 | 0.2 | −1.4 | 2.5 | 2 | 2.7 | 1 | −0.3 | −1.2 |
| 5 | 2 | 3 | −3.5 | −4.6 | 4.3 | 6.1 | −4.1 | −7.9 |
| 6 | −6.3 | −10.4 | 9.6 | 13.3 | 26.6 | 29.1 | −25.7 | −29.4 |
| 7 | −10.7 | −11.8 | 15.9 | 17.4 | 6 | 6.5 | −6.1 | −7.5 |
| 8 | 5.1 | 4.6 | −7.7 | −6.7 | −3.5 | −3.3 | 3.9 | 3.9 |
| 9 | −0.9 | −0.6 | 0.8 | 0.9 | 0.2 | 0.4 | −0.3 | −0.5 |
| 10 | 0.2 | 0.2 | −0.3 | −0.2 | −0.2 | −0.1 | 0.3 | 0.1 |
Disclaimer/Publisher’s Note: The statements, opinions and data contained in all publications are solely those of the individual author(s) and contributor(s) and not of MDPI and/or the editor(s). MDPI and/or the editor(s) disclaim responsibility for any injury to people or property resulting from any ideas, methods, instructions or products referred to in the content. |
© 2023 by the authors. Licensee MDPI, Basel, Switzerland. This article is an open access article distributed under the terms and conditions of the Creative Commons Attribution (CC BY) license (https://creativecommons.org/licenses/by/4.0/).
Share and Cite
MDPI and ACS Style
Brinissat, M.; Ray, R.P.; Kuti, R. Evaluation of the Szapáry Long-Span Box Girder Bridge Using Static and Dynamic Load Tests. Infrastructures 2023, 8, 91. https://doi.org/10.3390/infrastructures8050091
AMA Style
Brinissat M, Ray RP, Kuti R. Evaluation of the Szapáry Long-Span Box Girder Bridge Using Static and Dynamic Load Tests. Infrastructures. 2023; 8(5):91. https://doi.org/10.3390/infrastructures8050091
Chicago/Turabian StyleBrinissat, Marame, Richard Paul Ray, and Rajmund Kuti. 2023. "Evaluation of the Szapáry Long-Span Box Girder Bridge Using Static and Dynamic Load Tests" Infrastructures 8, no. 5: 91. https://doi.org/10.3390/infrastructures8050091