
Numerical and Experimental Behavior Analysis of Slabs Strengthened Using Steel Plates and Slurry-Infiltrated Mat Concrete (SIMCON) Laminates

Abstract
:1. Introduction
2. Experimental Work
2.1. Properties of Materials
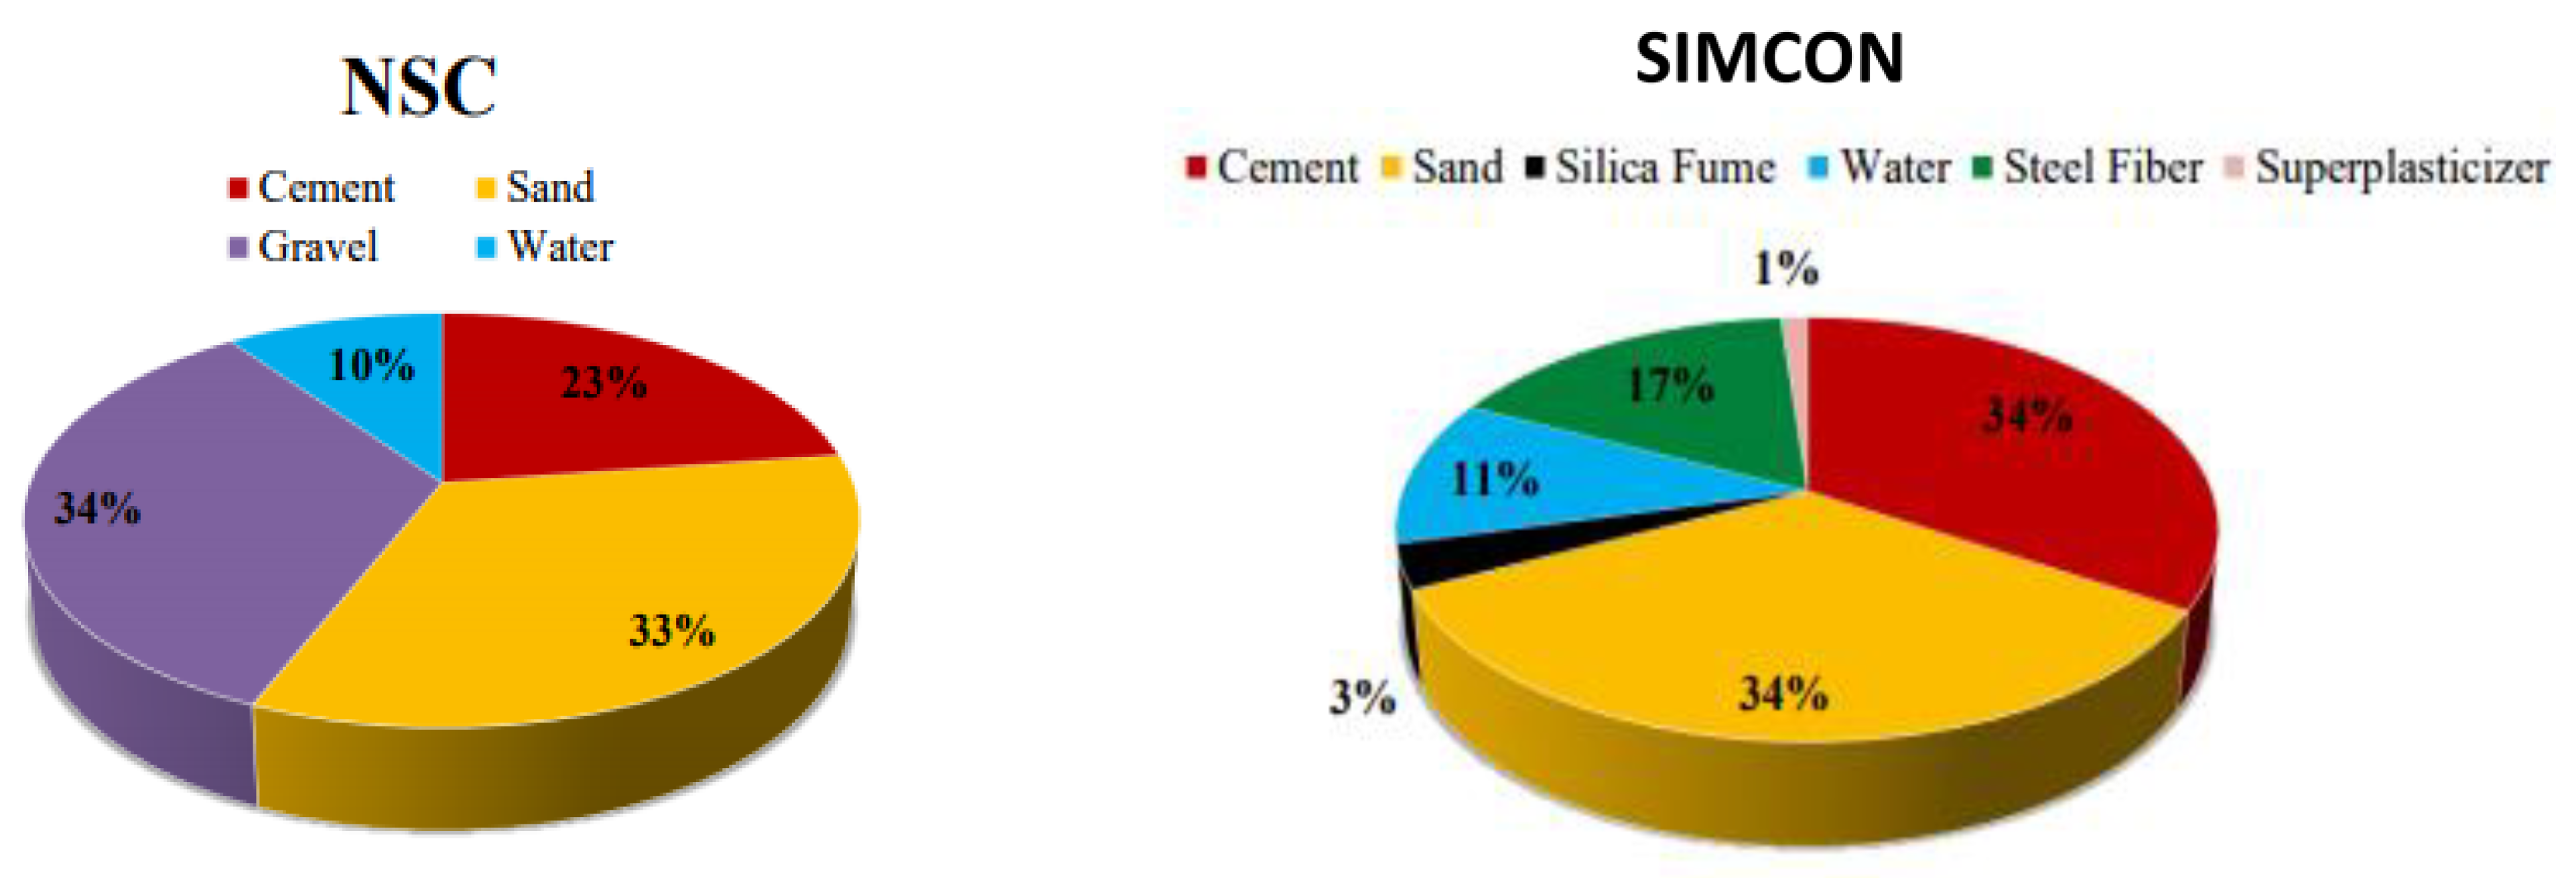
2.2. Mix Design
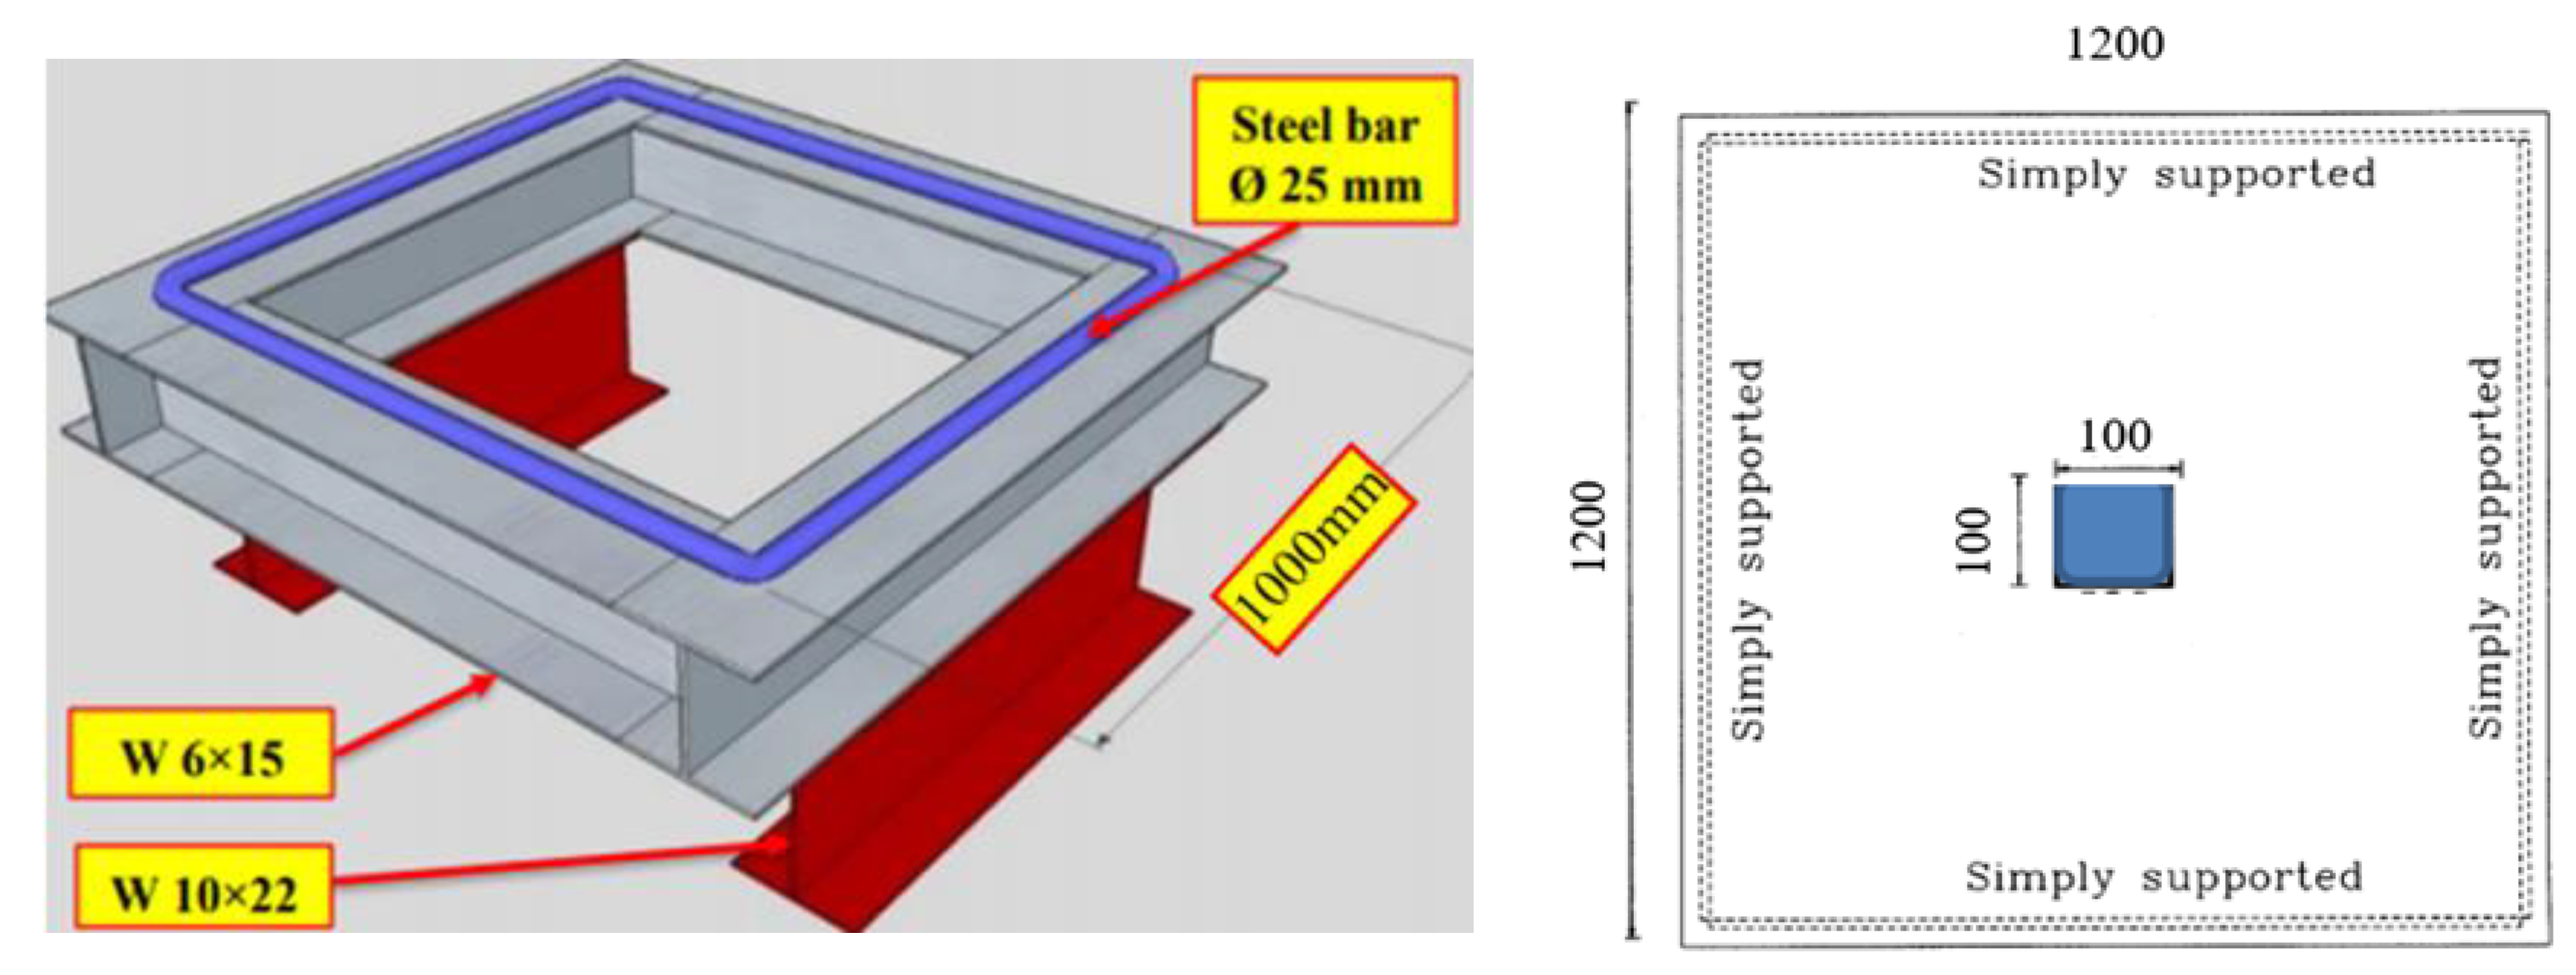
2.3. Samples Description
- ▪
- Group 1 includes the control samples. This group includes four non-strengthened slab specimens intended to measure either the cyclic or impact load applied onto the slab specimens.
- ▪
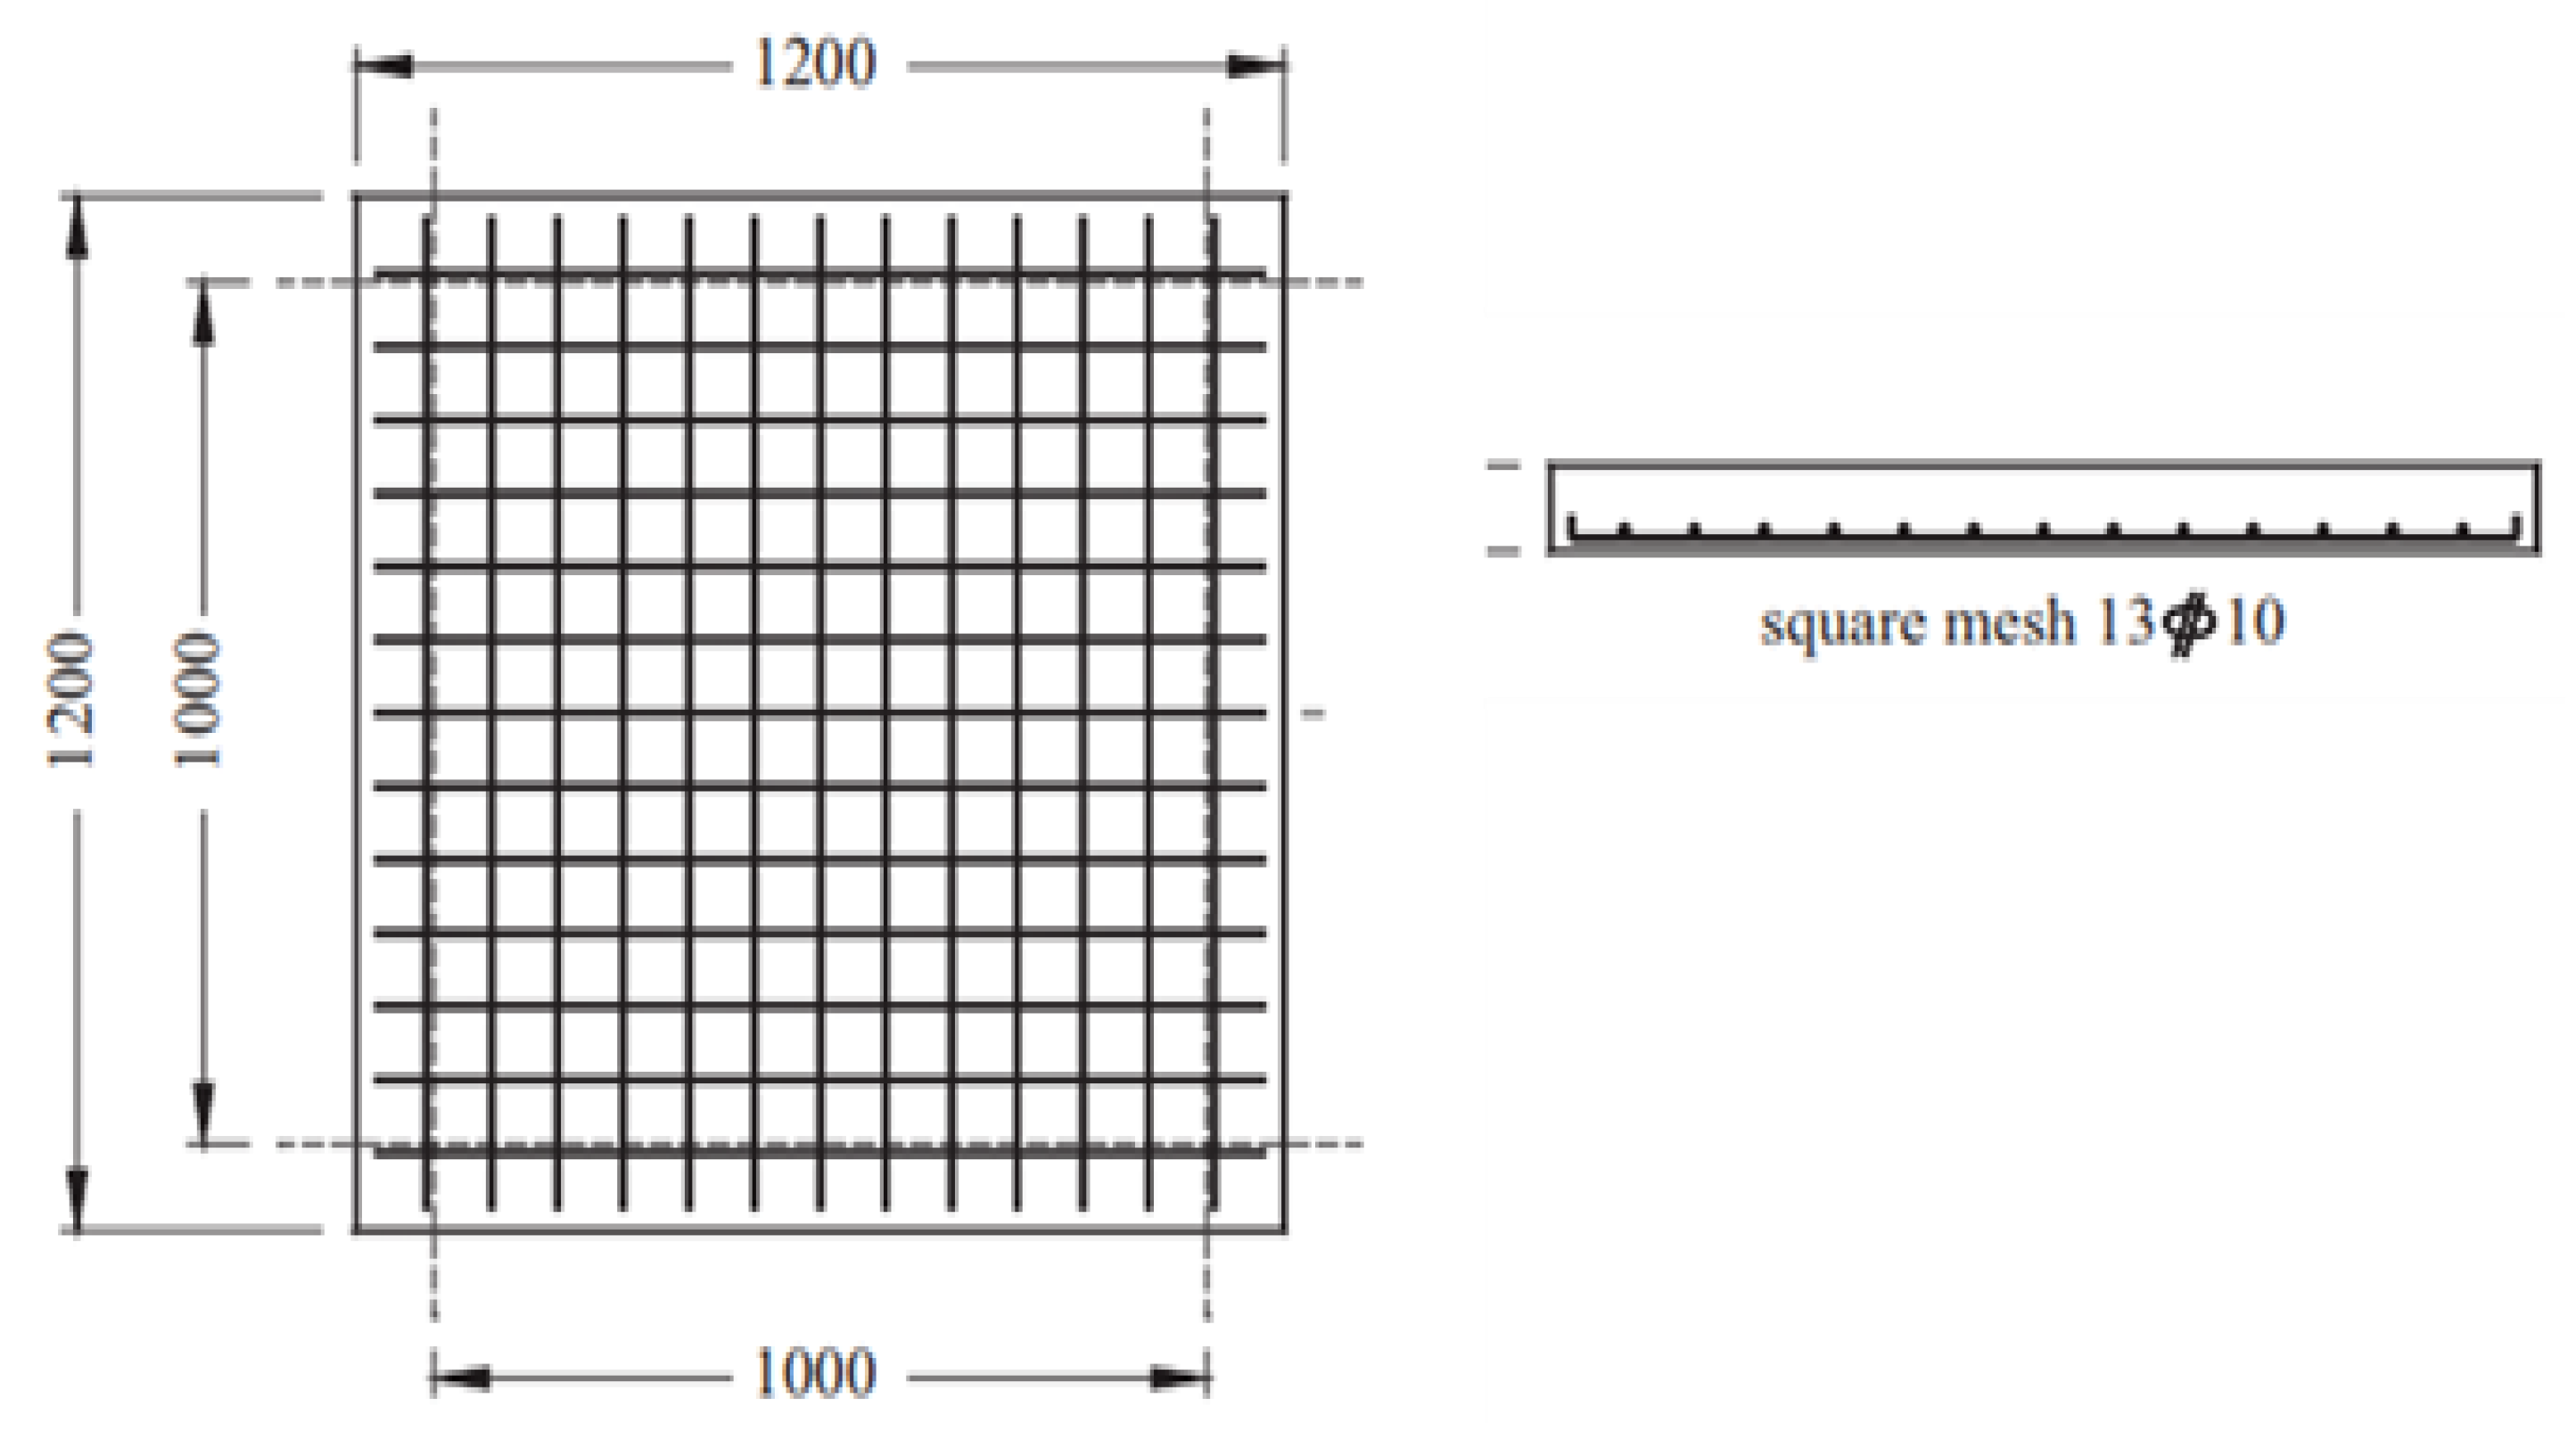
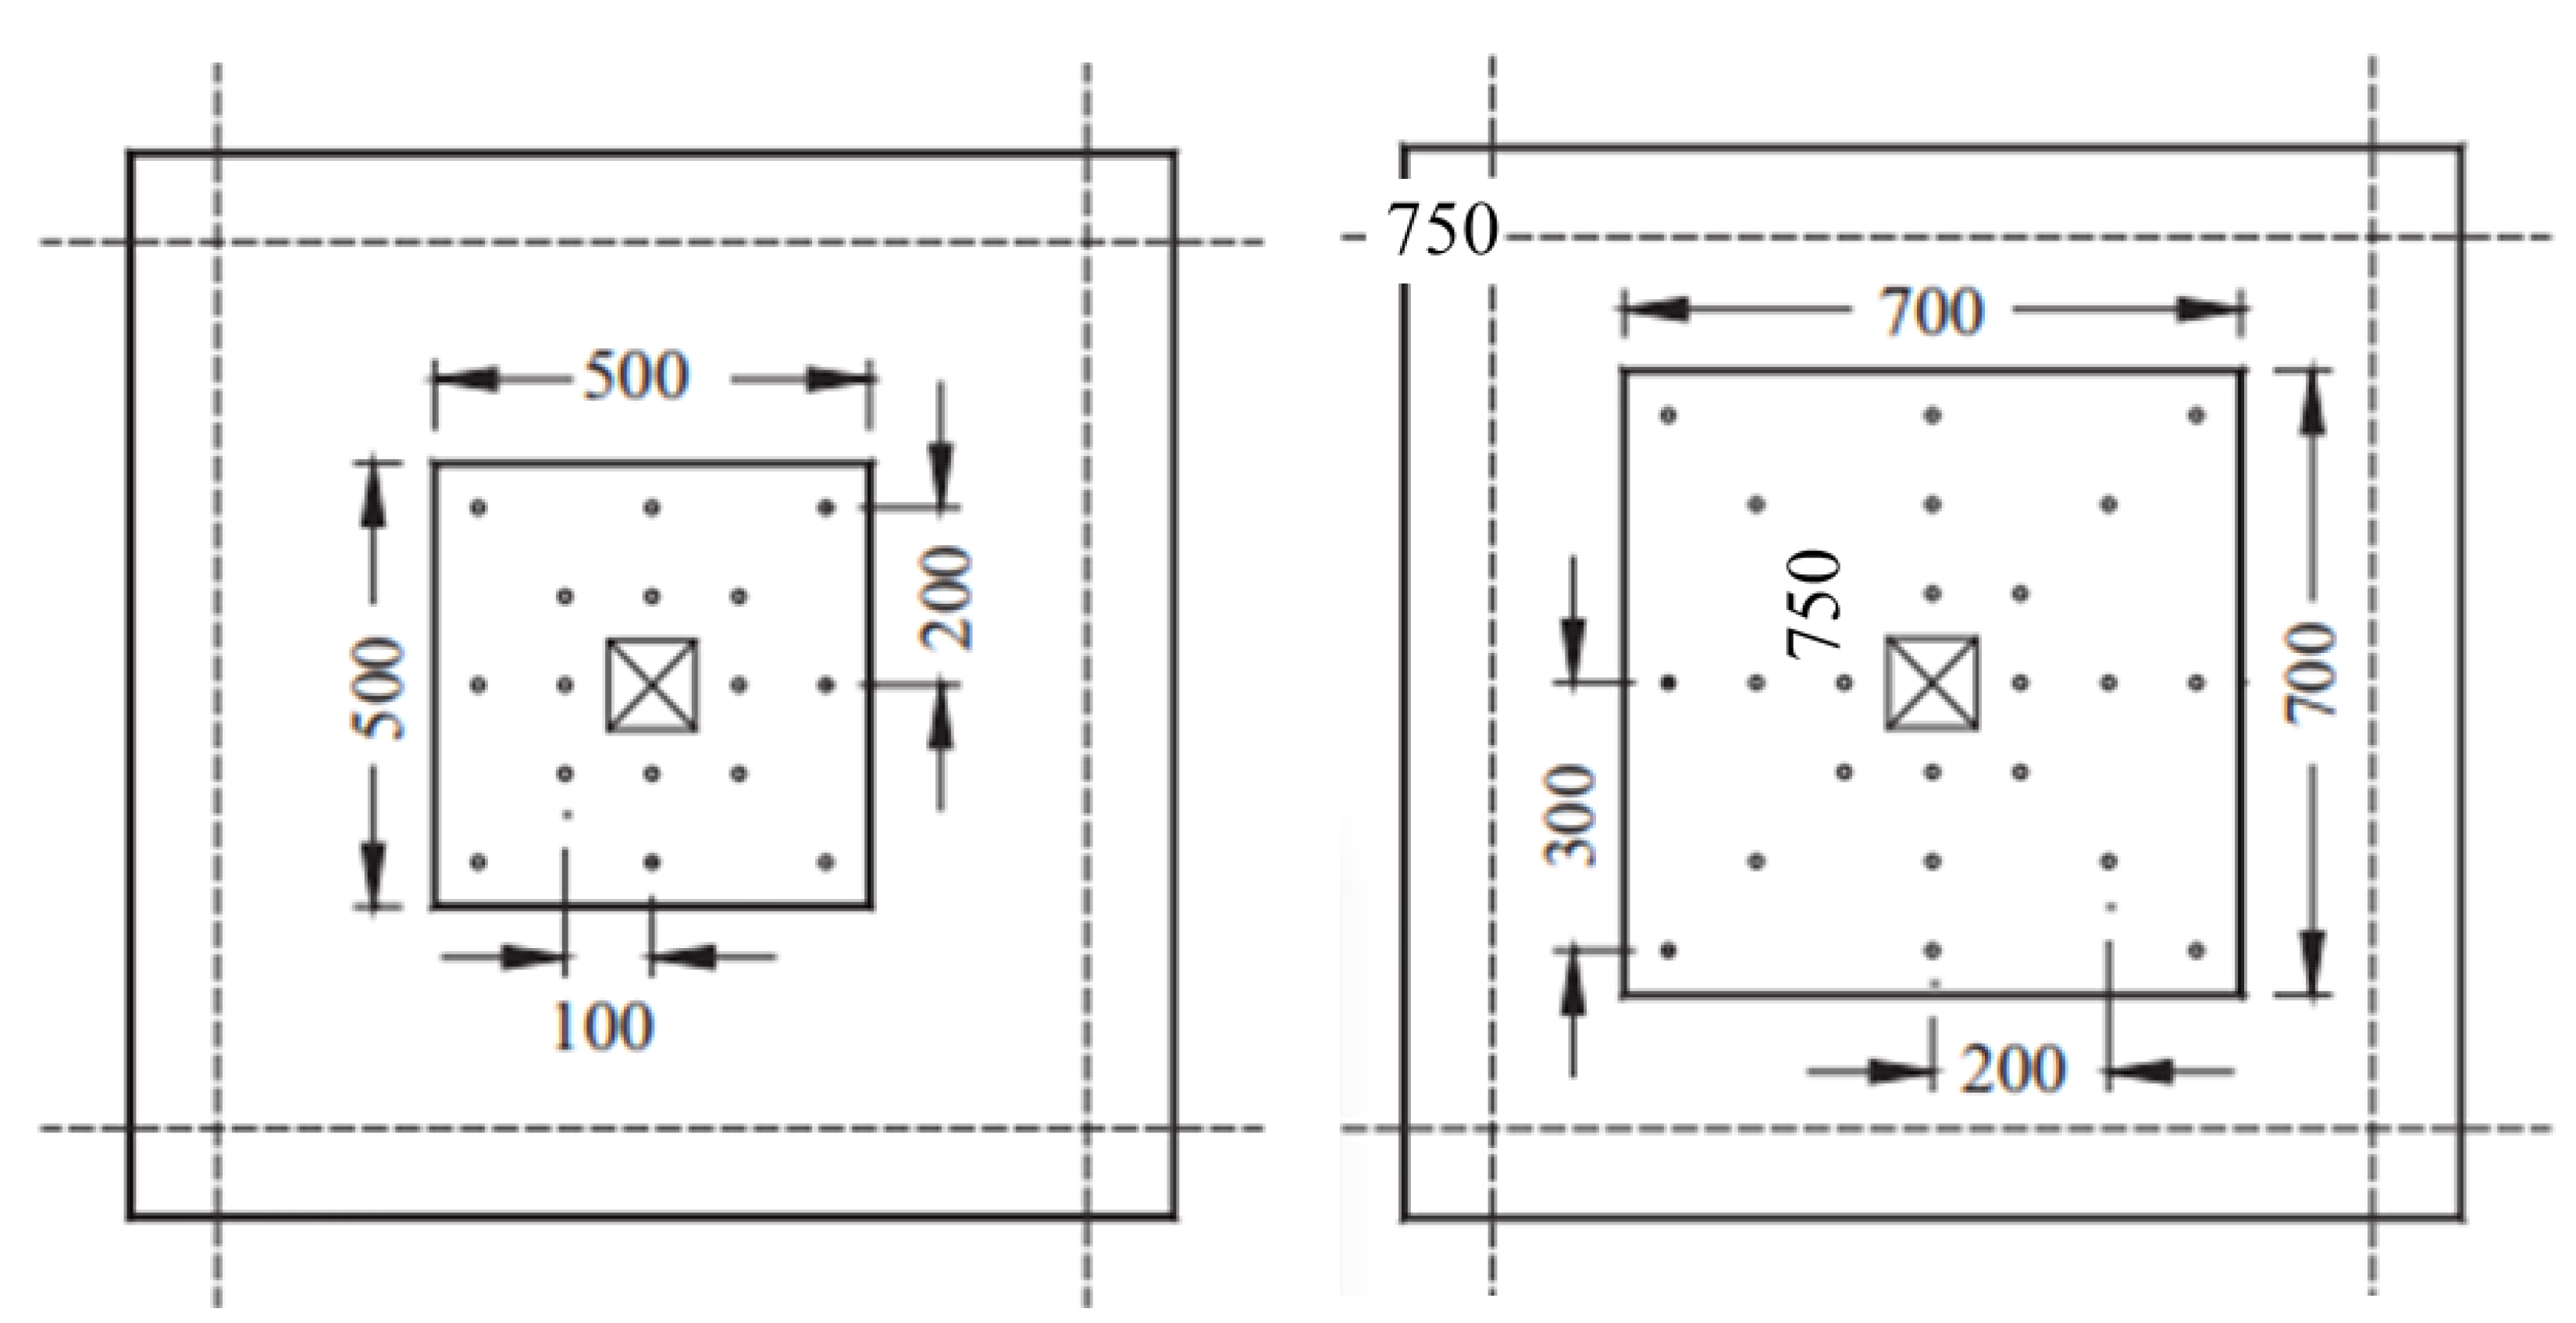
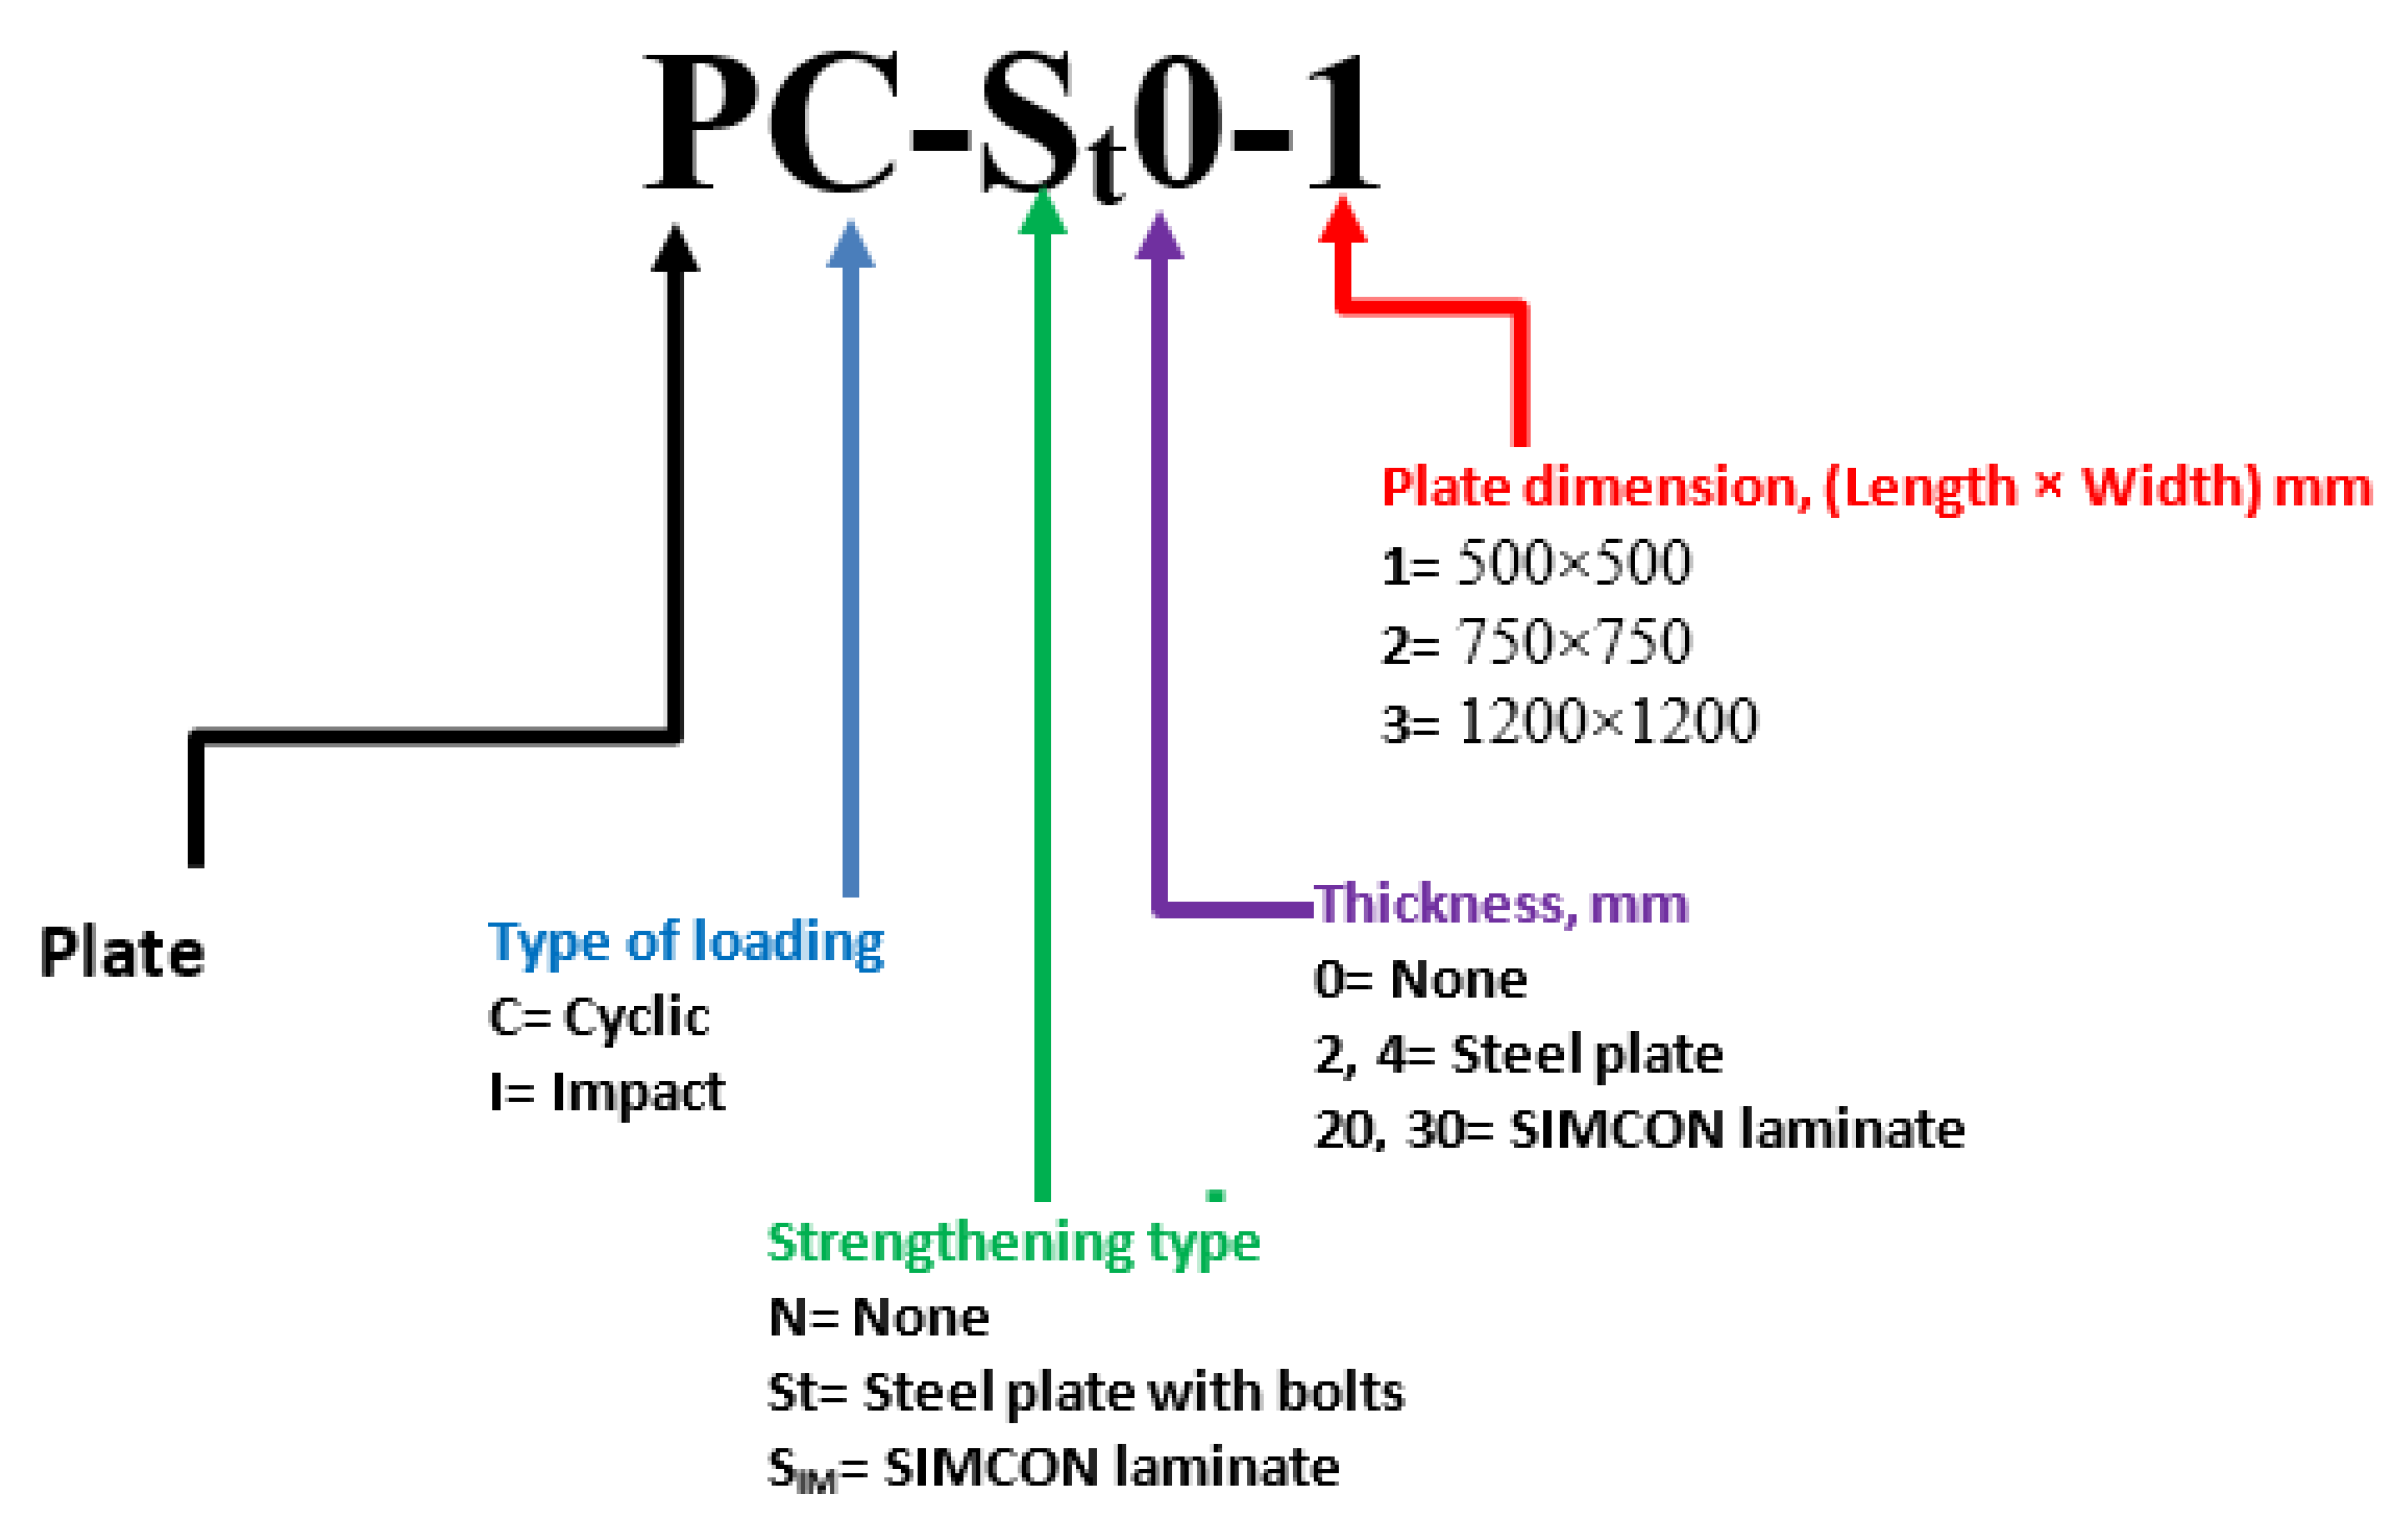
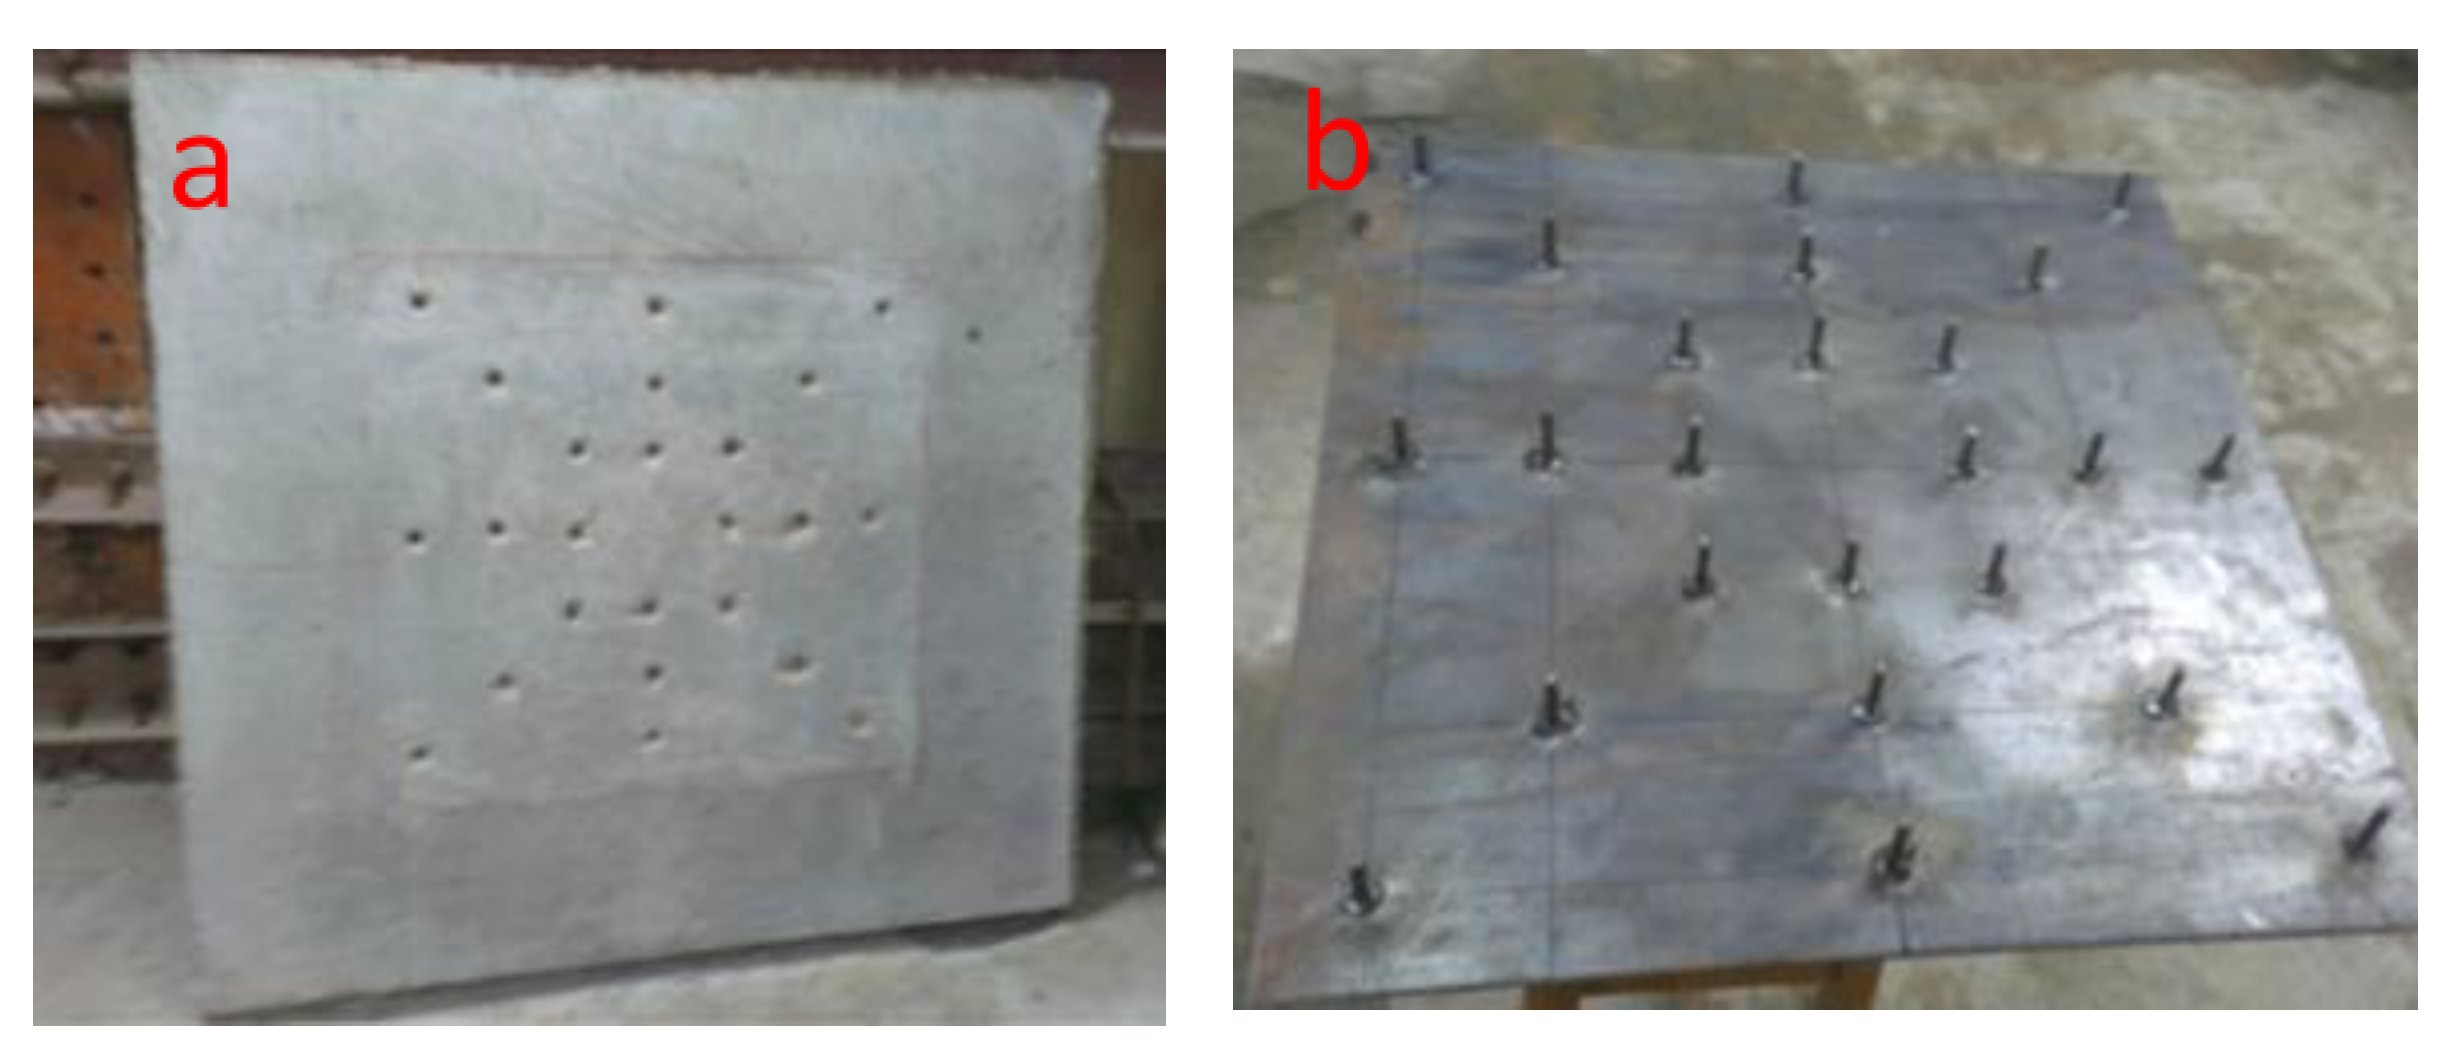
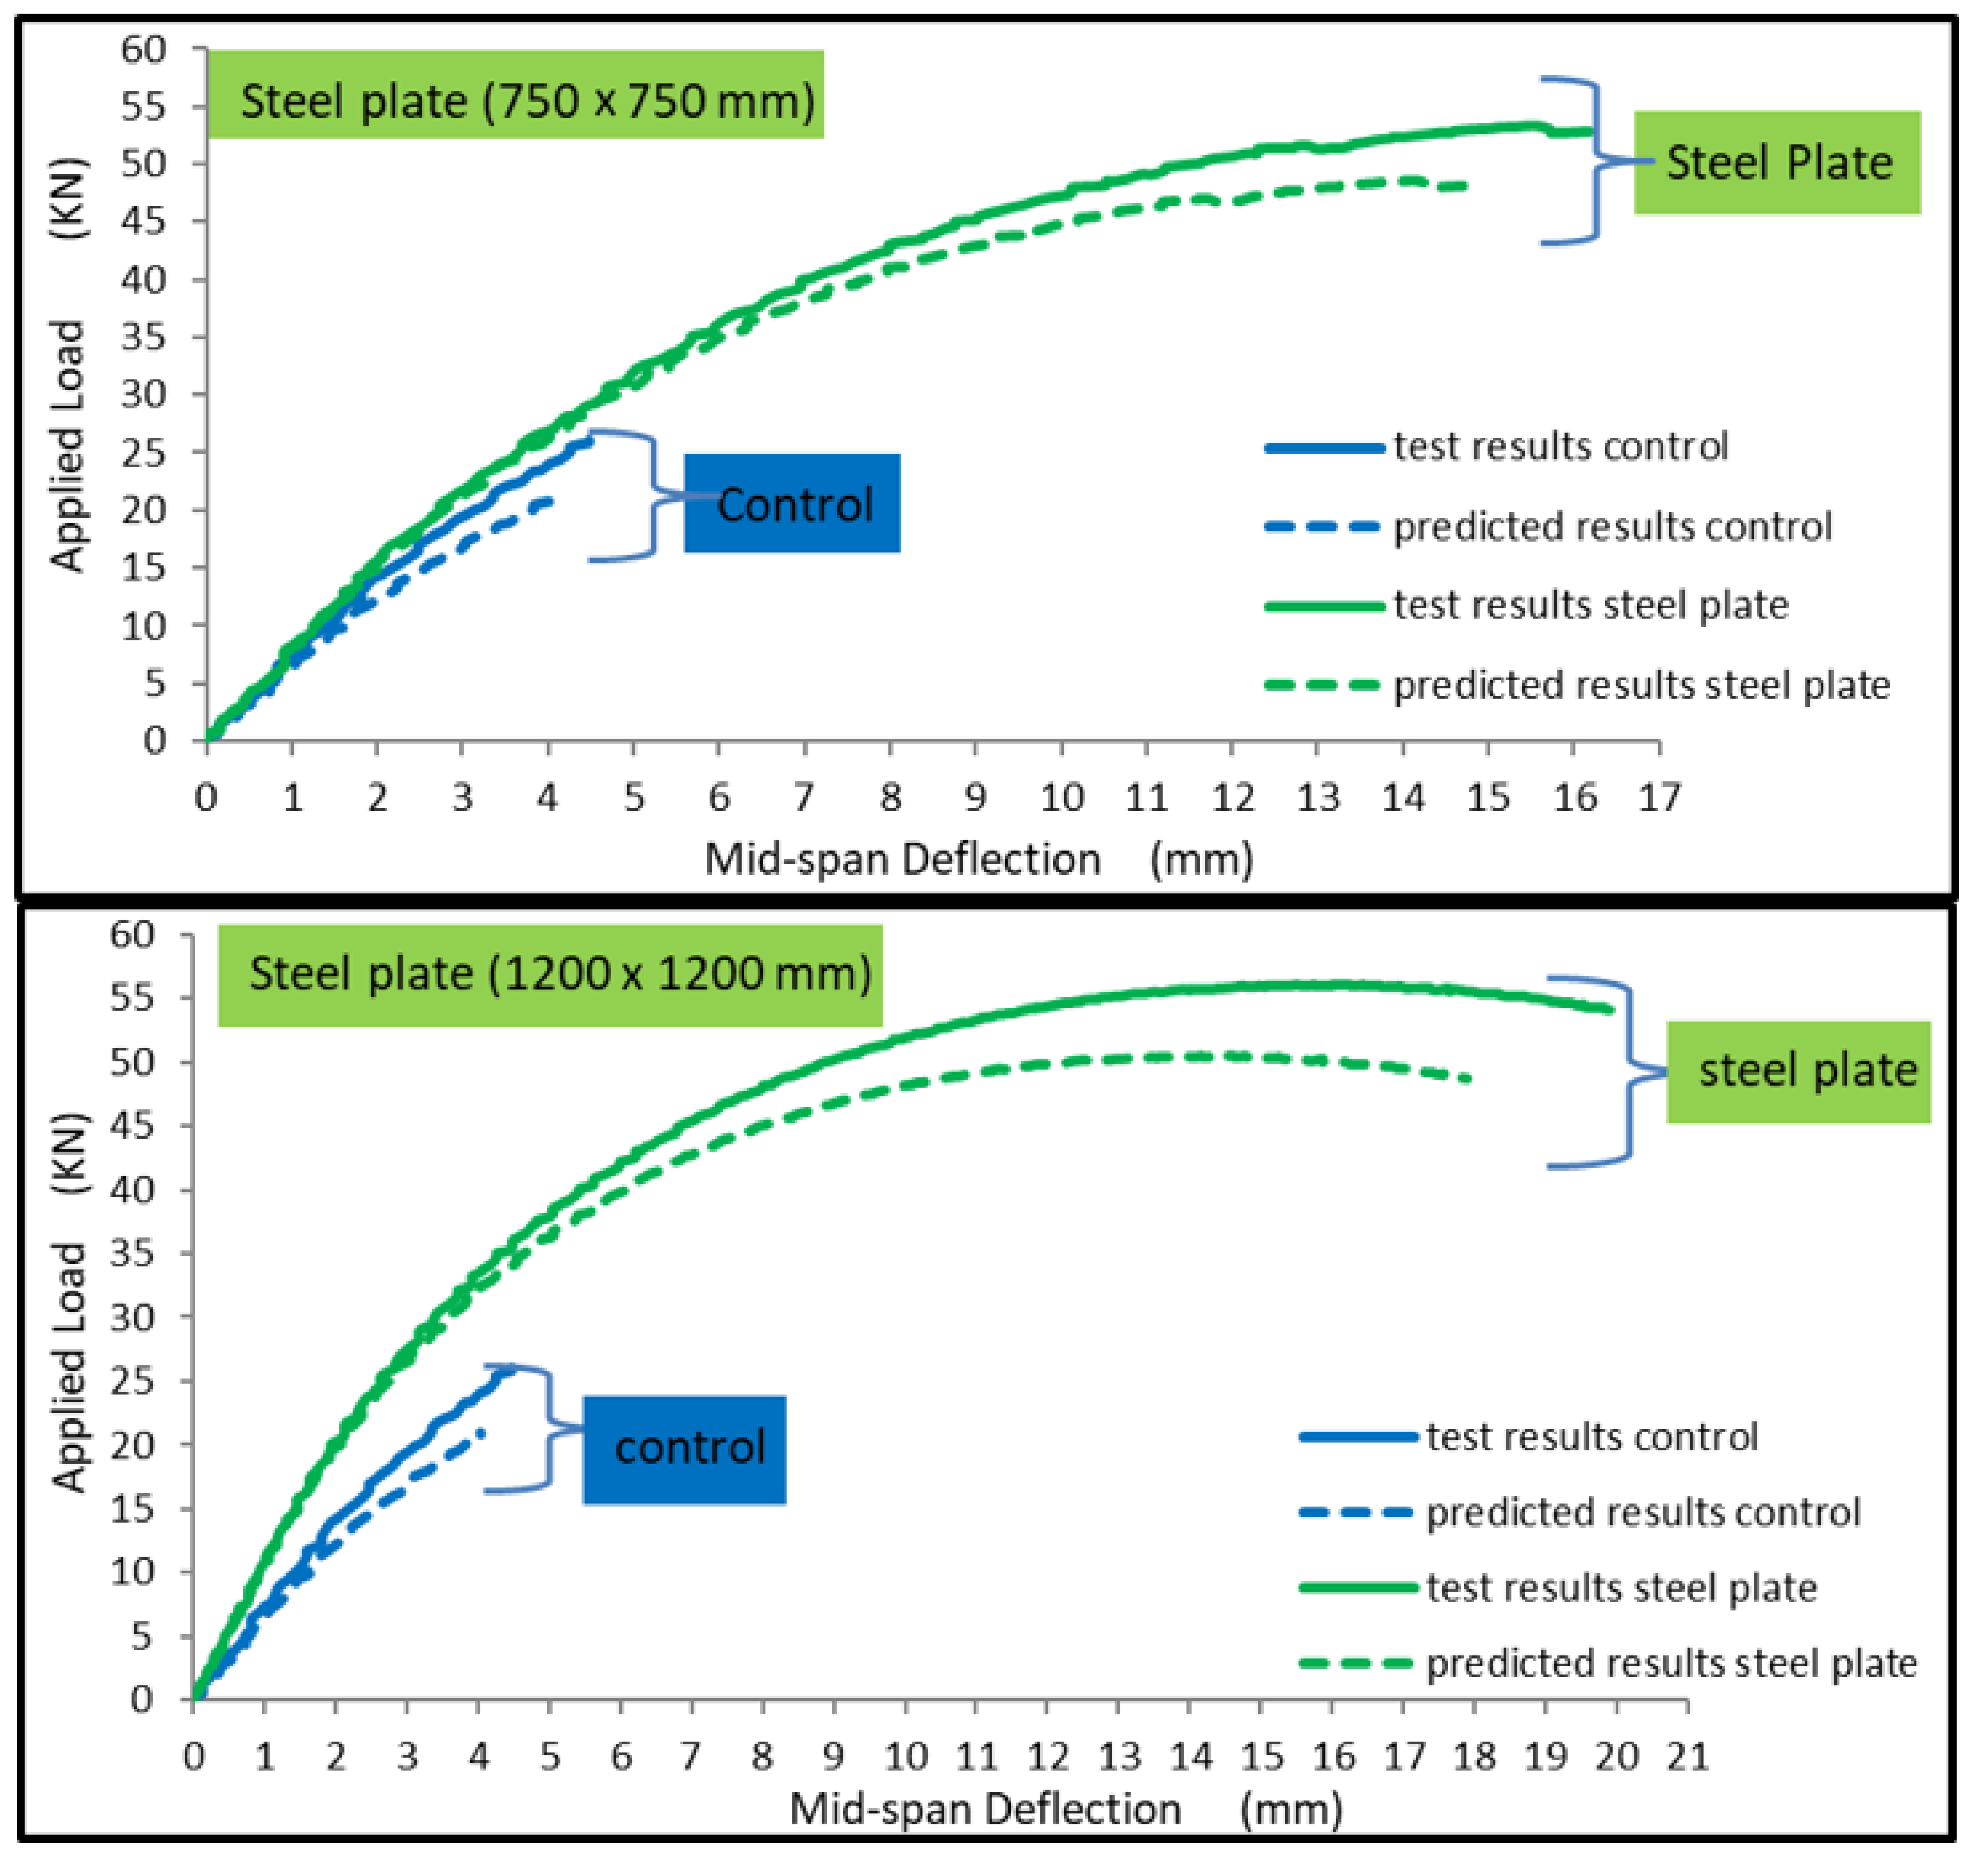
- Group 2 includes 12 samples that are strengthened using a steel plate with steel bolts, which are also subjected to either impact or cyclic loads. The steel plates are (500 mm × 500 mm), (750 mm × 750 mm), and (full scale = 1200 mm × 1200 mm) dimensions, having variable thicknesses (2 and 4 mm). These steel plates are externally bonded at the center of the slab tension face, presented in Figure 3, whereby (16, 24, 32) steel shear bolts of 6 mm in diameter and 60 mm length are welded to the steel plate in order of size (from smallest to greatest, respectively). Next, it is embedded into the concrete plate to enhance the composite action of the specimen.
- ▪
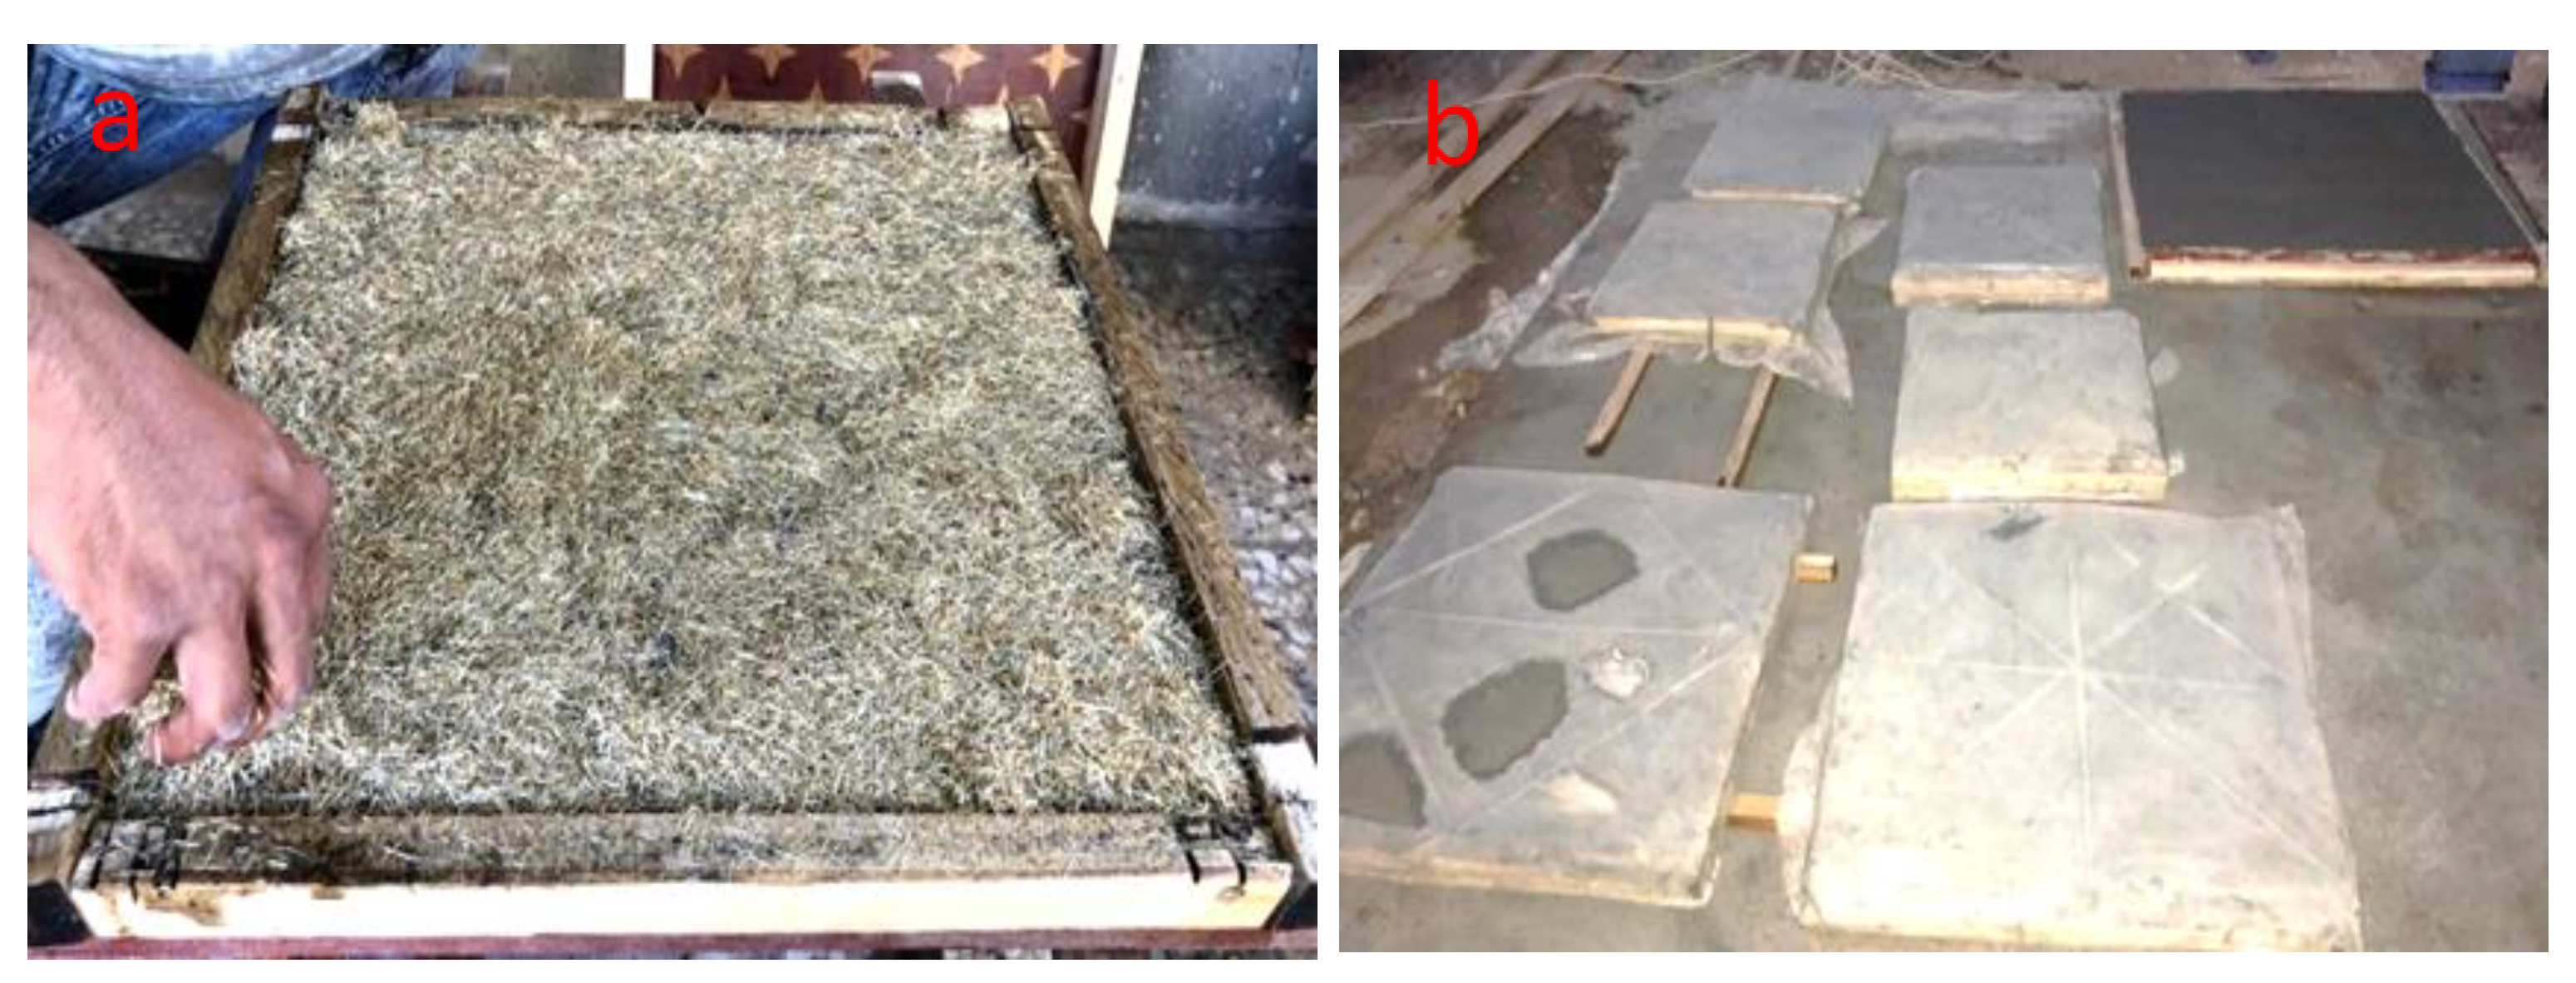
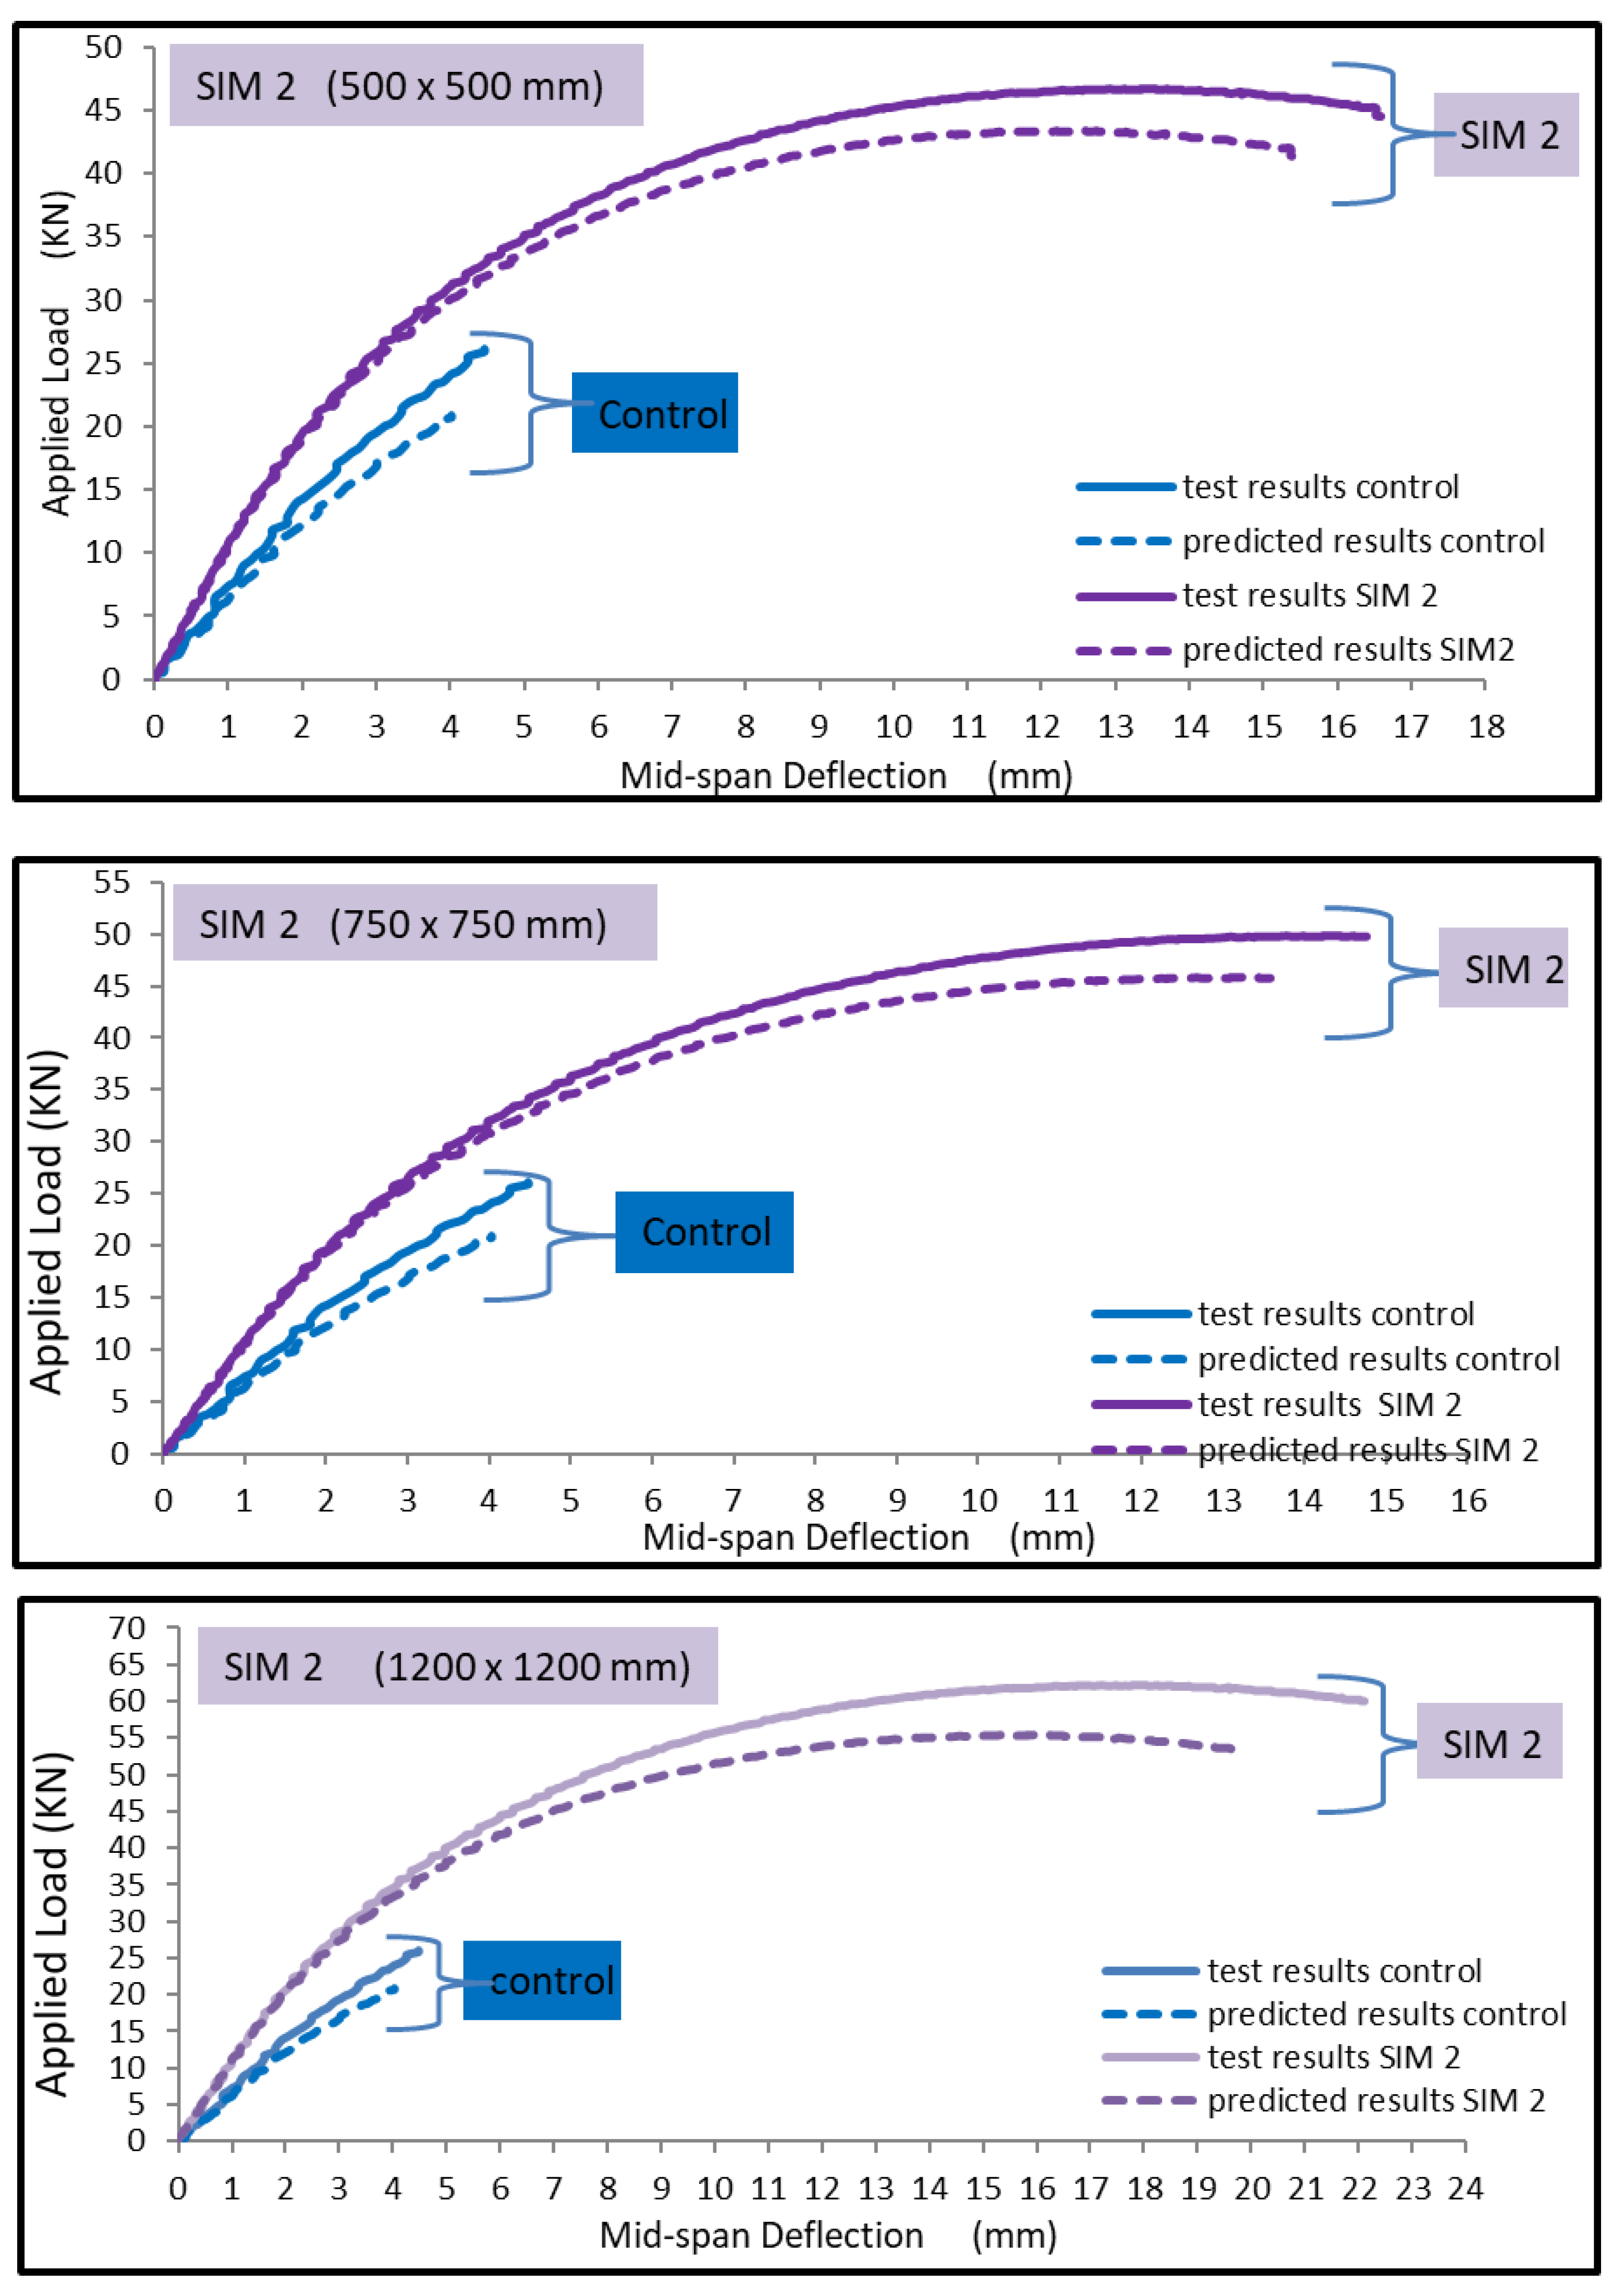
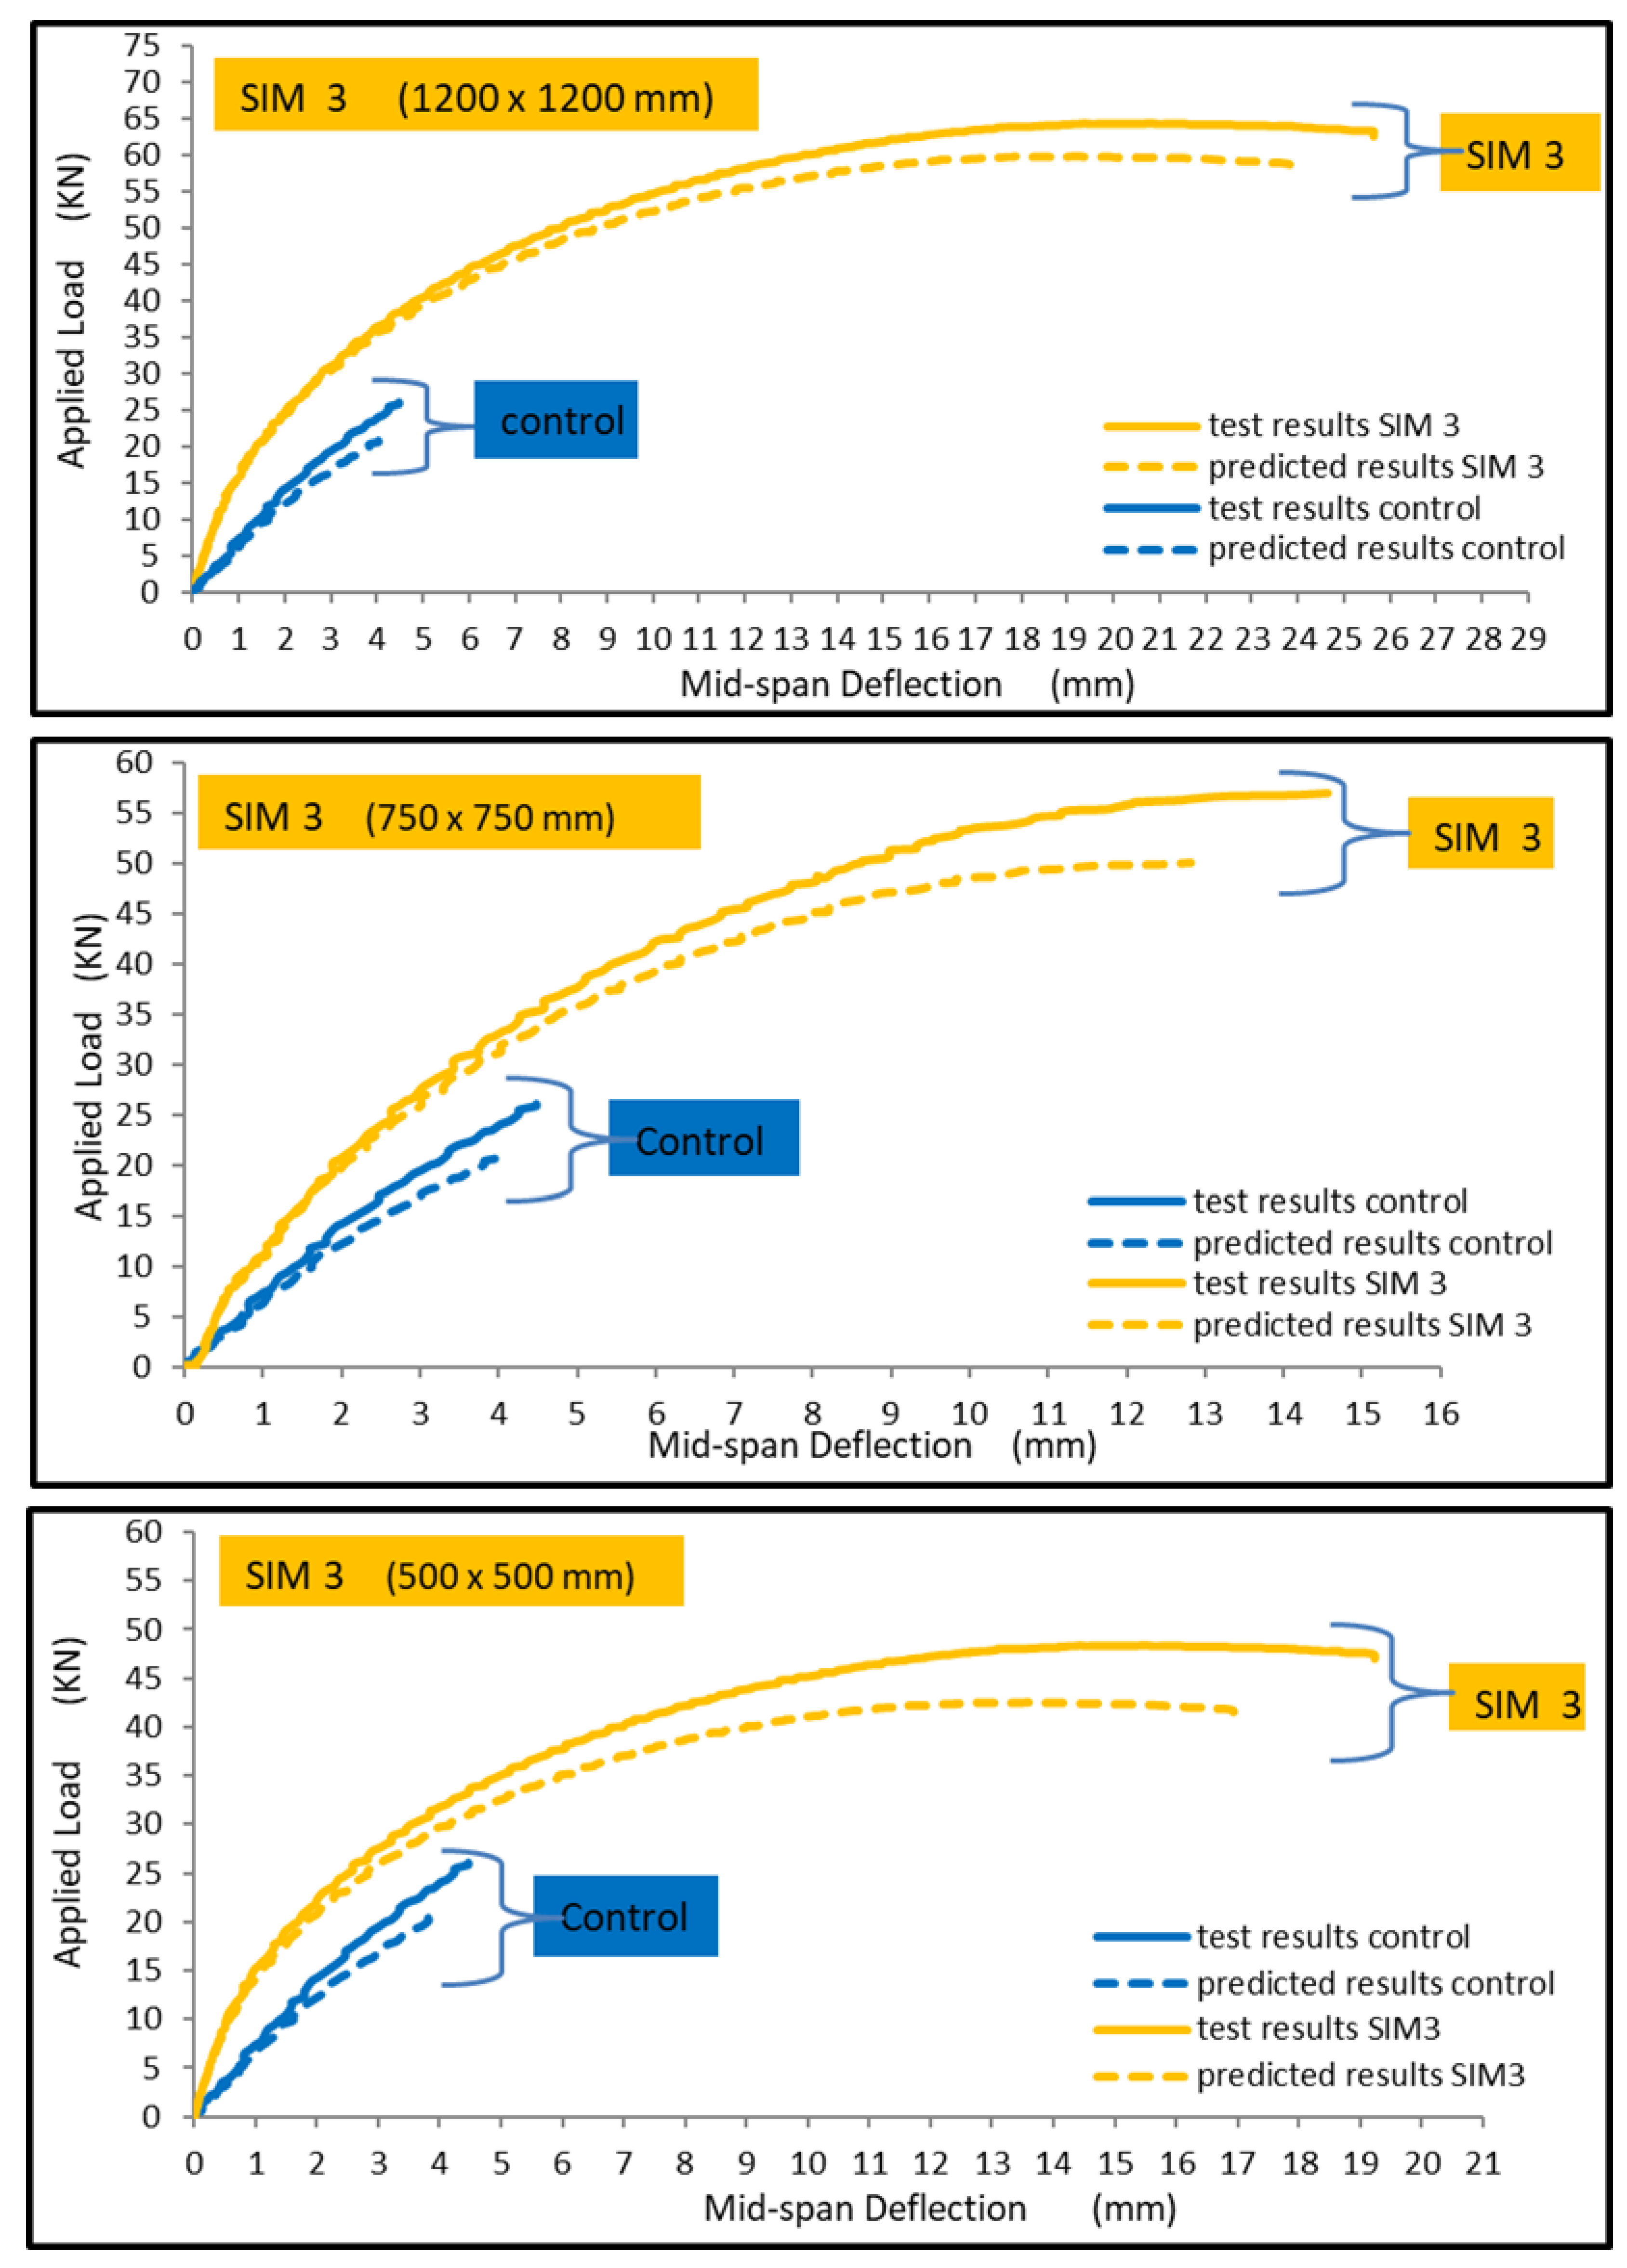
- Group 3 involves 12 specimens that are strengthened using SIMCON laminates (hybrid concrete) of (500 mm × 500 mm), (750 mm × 750 mm), and (full scale = 1200 mm × 1200 mm) dimensions with variable thicknesses (20 and 30 mm). They are also subjected to either impact load or cyclic load.
2.4. Construction Procedure
- The forms are oiled prior to placing the reinforcements. The cage is then put into the form with the support of several chairs.
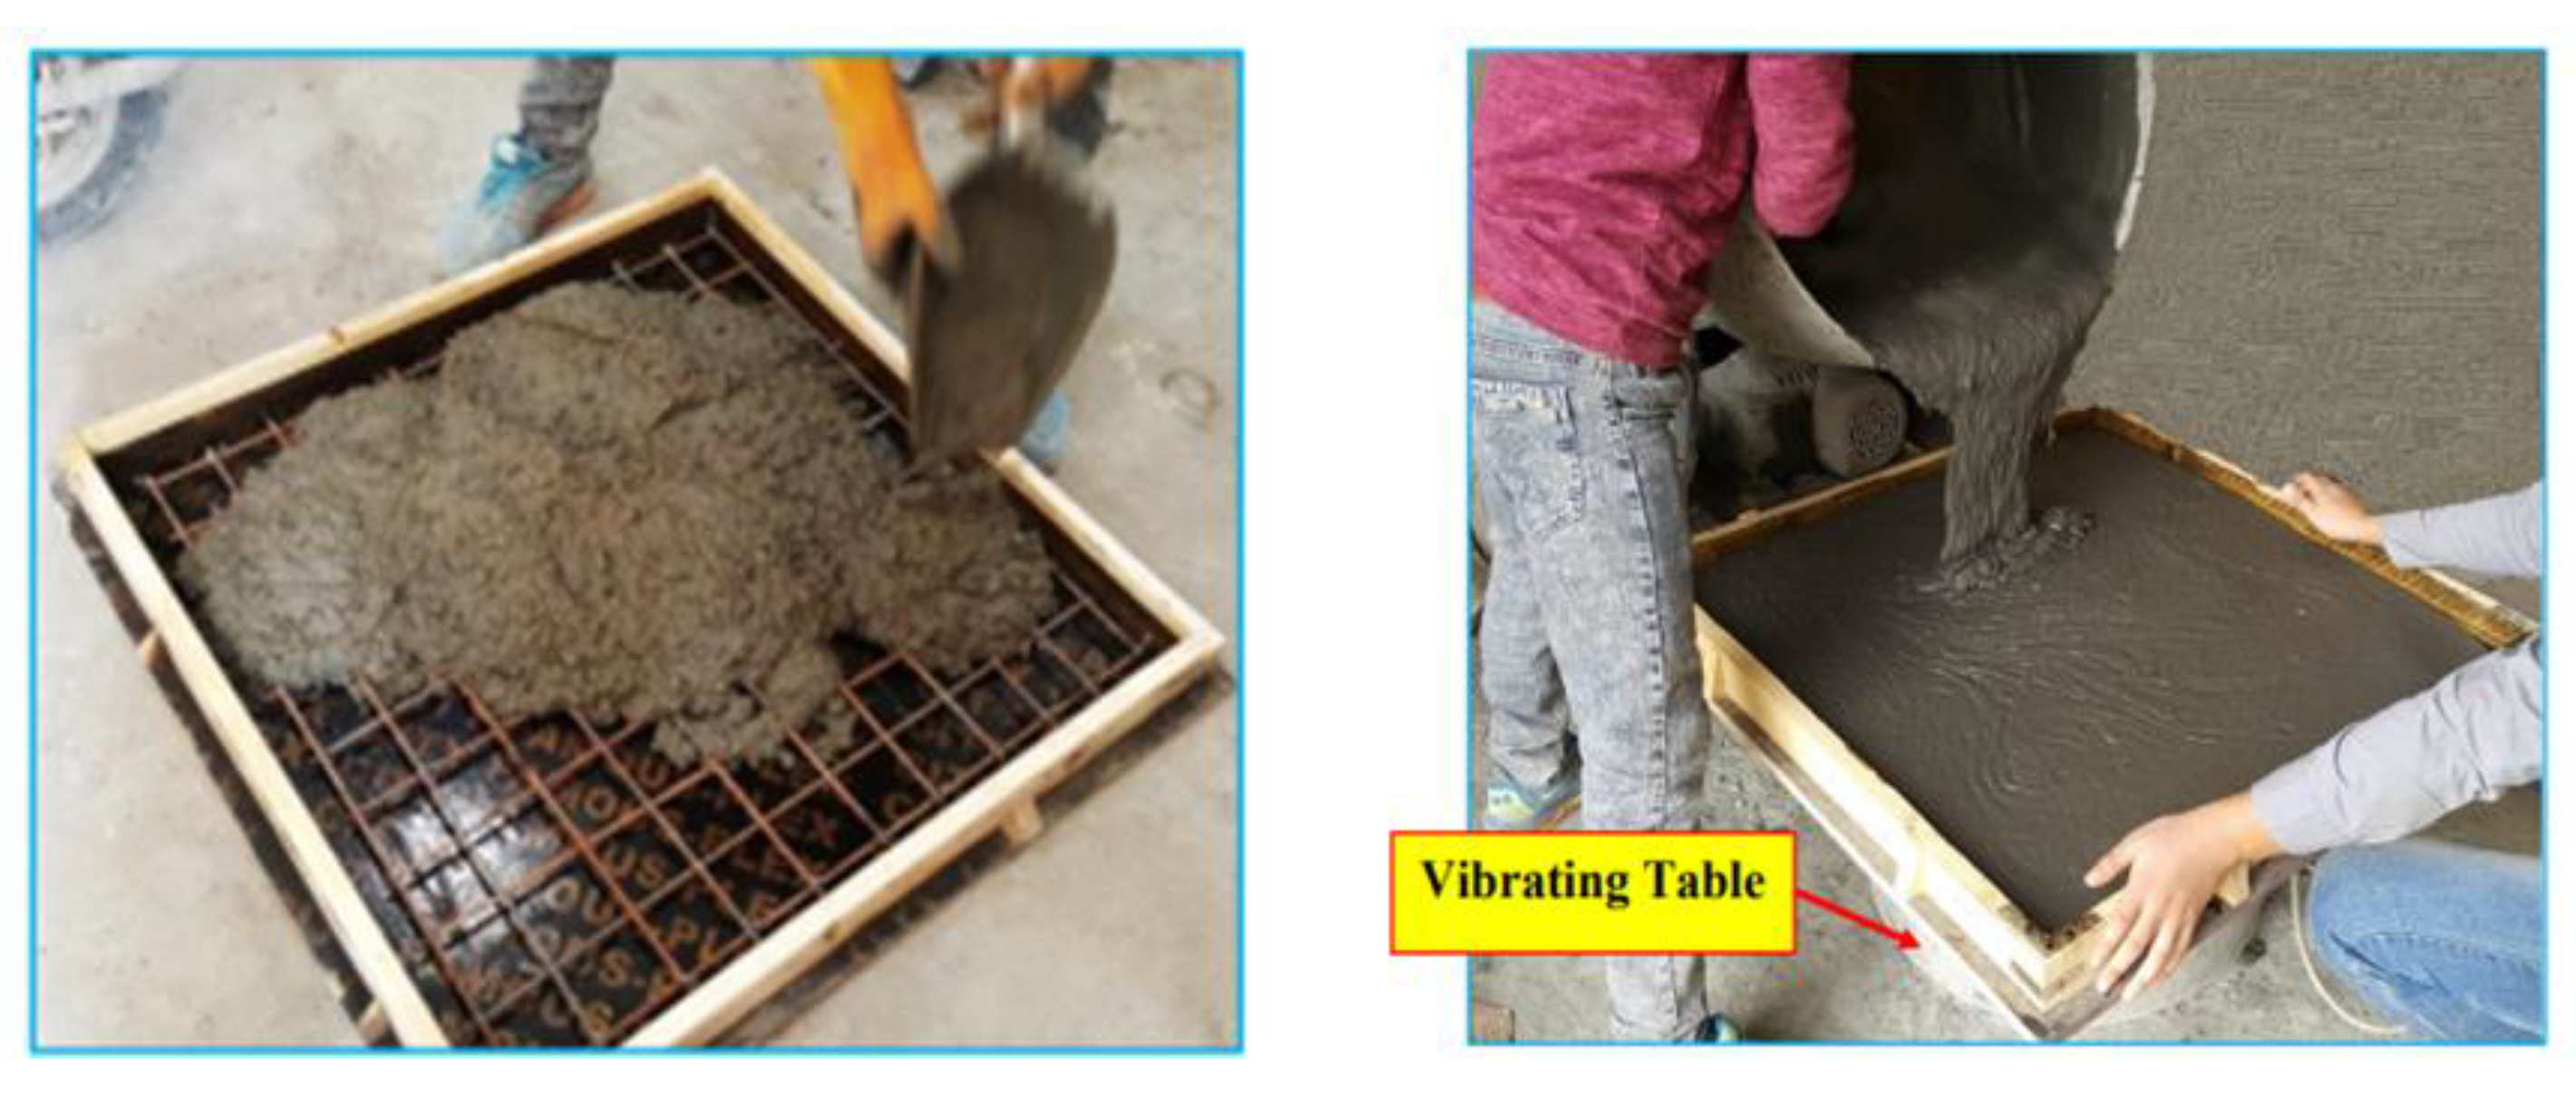
- All specimens are cast simultaneously to minimize any variation in material properties, as presented in Figure 5.
- Concrete buckets are used for pouring the mix into the forms, after which they are vibrated. The air bubbles that appear on the surface indicate that the forms are fully compacted.
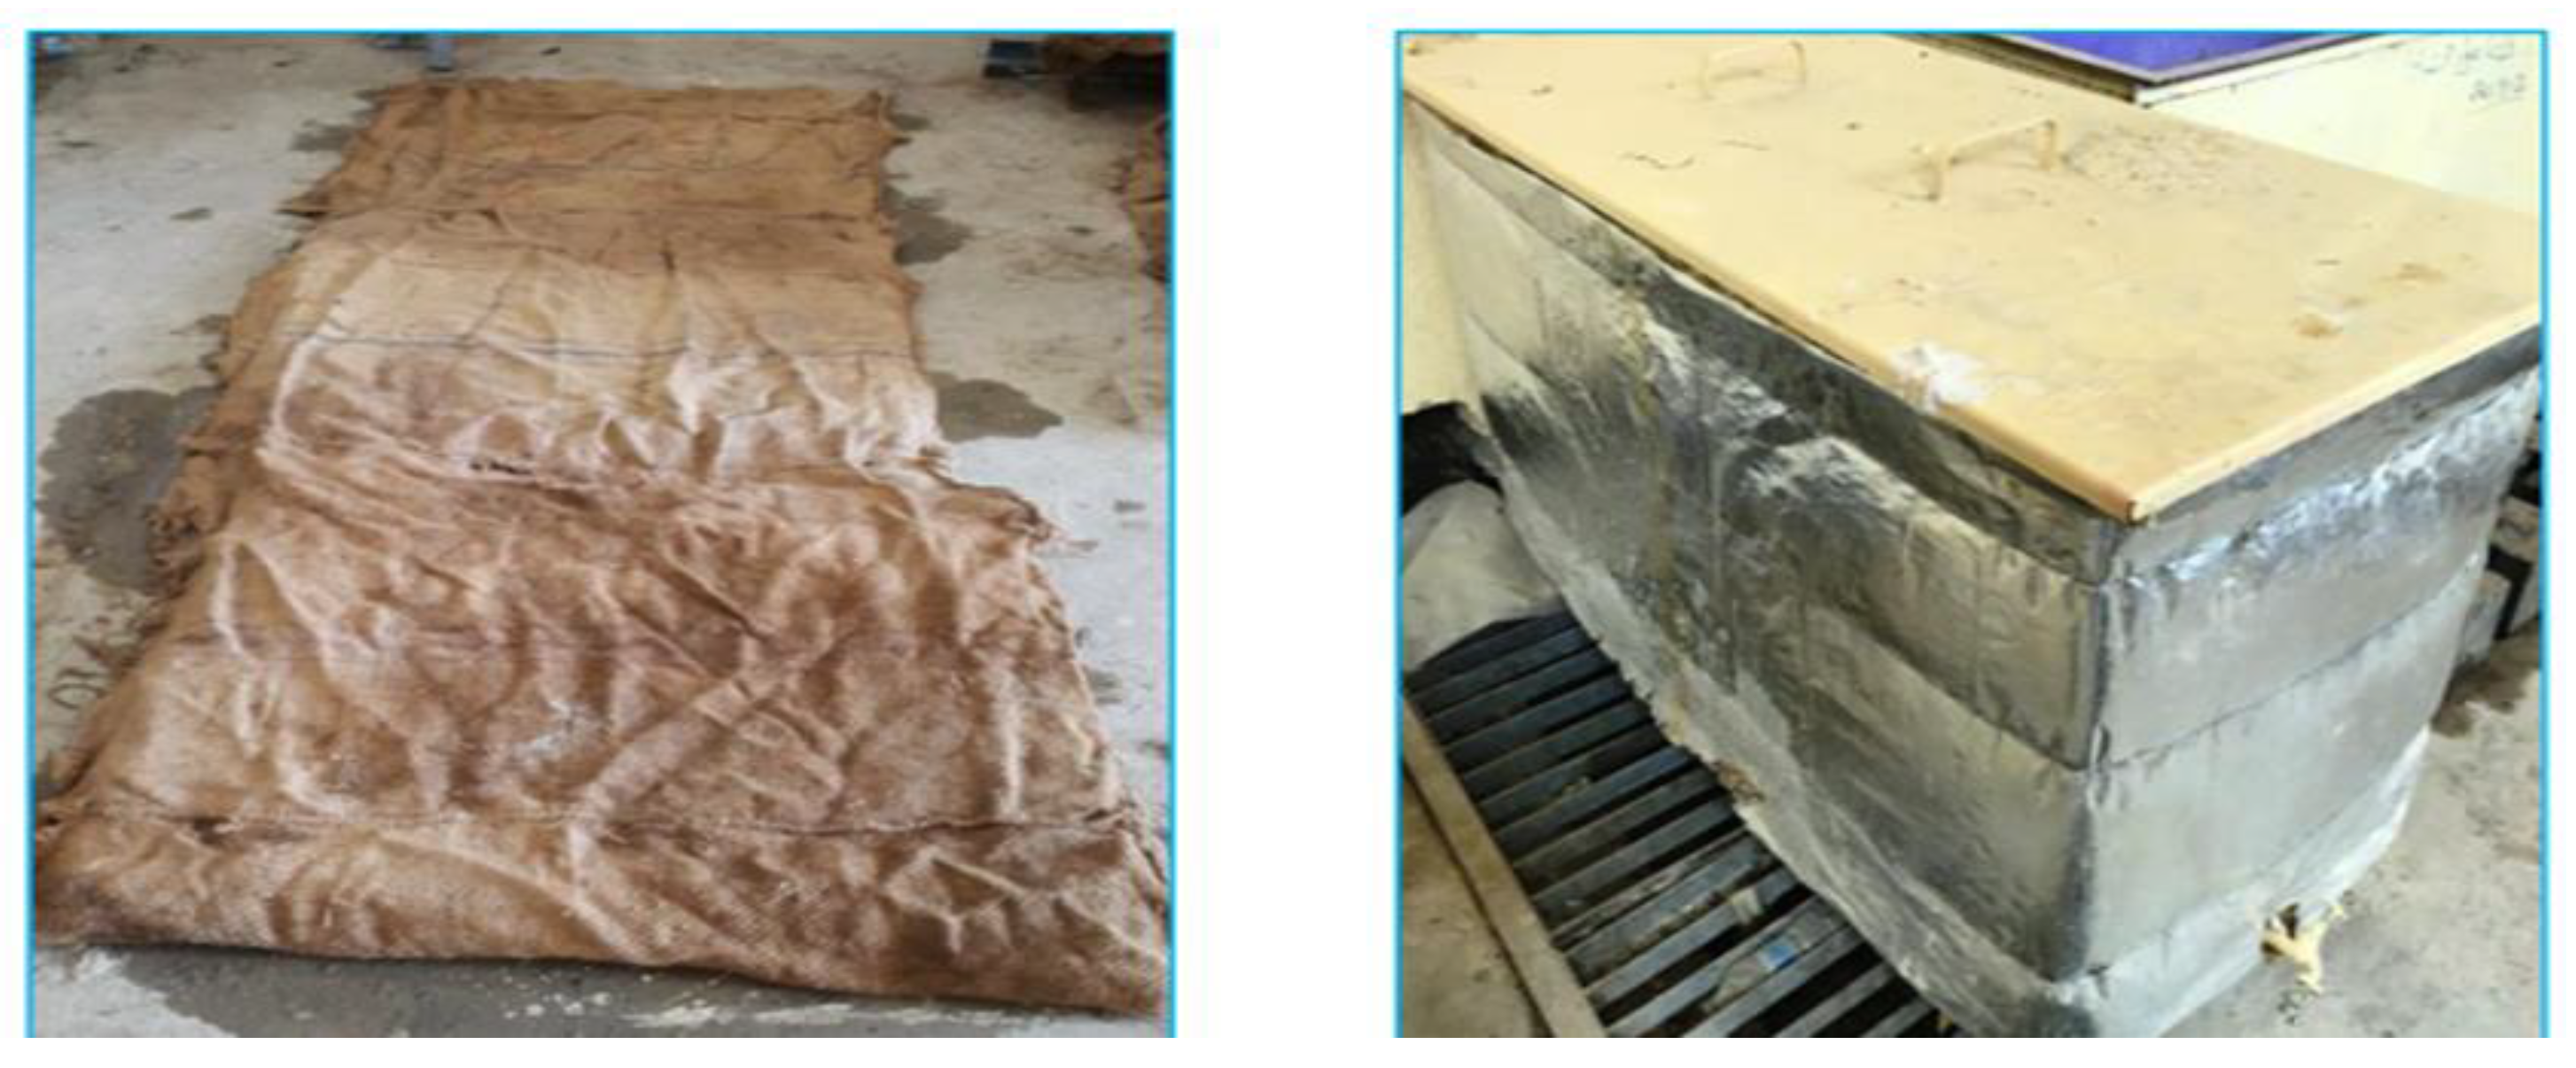
- At the end of the casting process, and after that, the top surface of each specimen is finished off; polyethylene sheets are used to cover the molded samples to prevent any loss of moisture. The specimens are left in the casting room for (72 h) at a temperature of (25 ± 2 °C) until the specimens are demolded (see Figure 6).
- Finally, burlaps are used to cure the plate specimens using saturated wet coverings. The samples are cured in water tanks at a temperature of (23 ± 2 °C), as presented in Figure 6.
2.4.1. Steel Plate Strengthening Procedures
2.4.2. SIMCON Laminate Strengthening Procedure
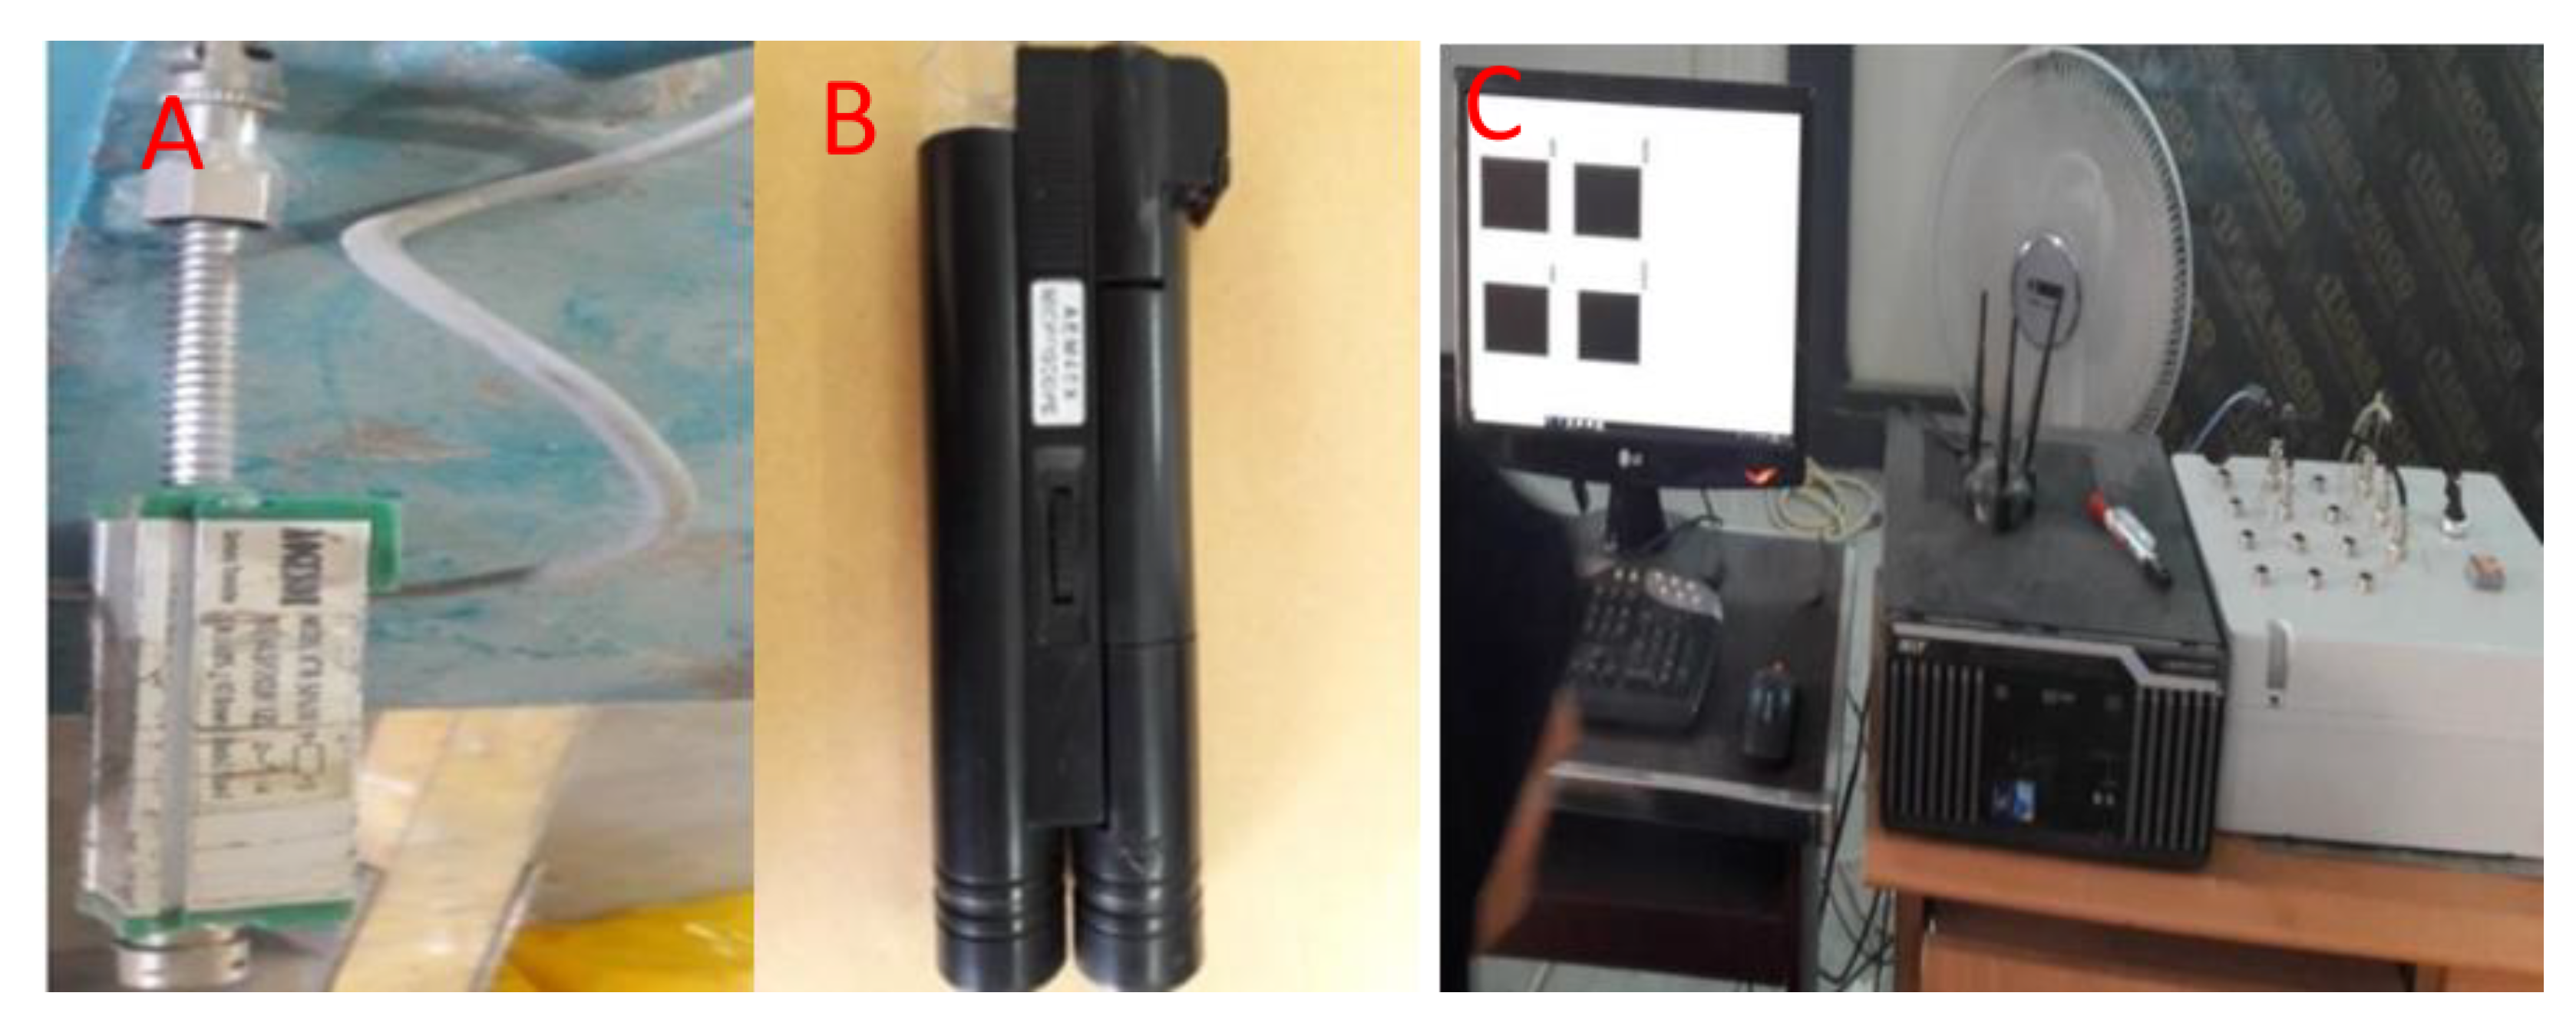
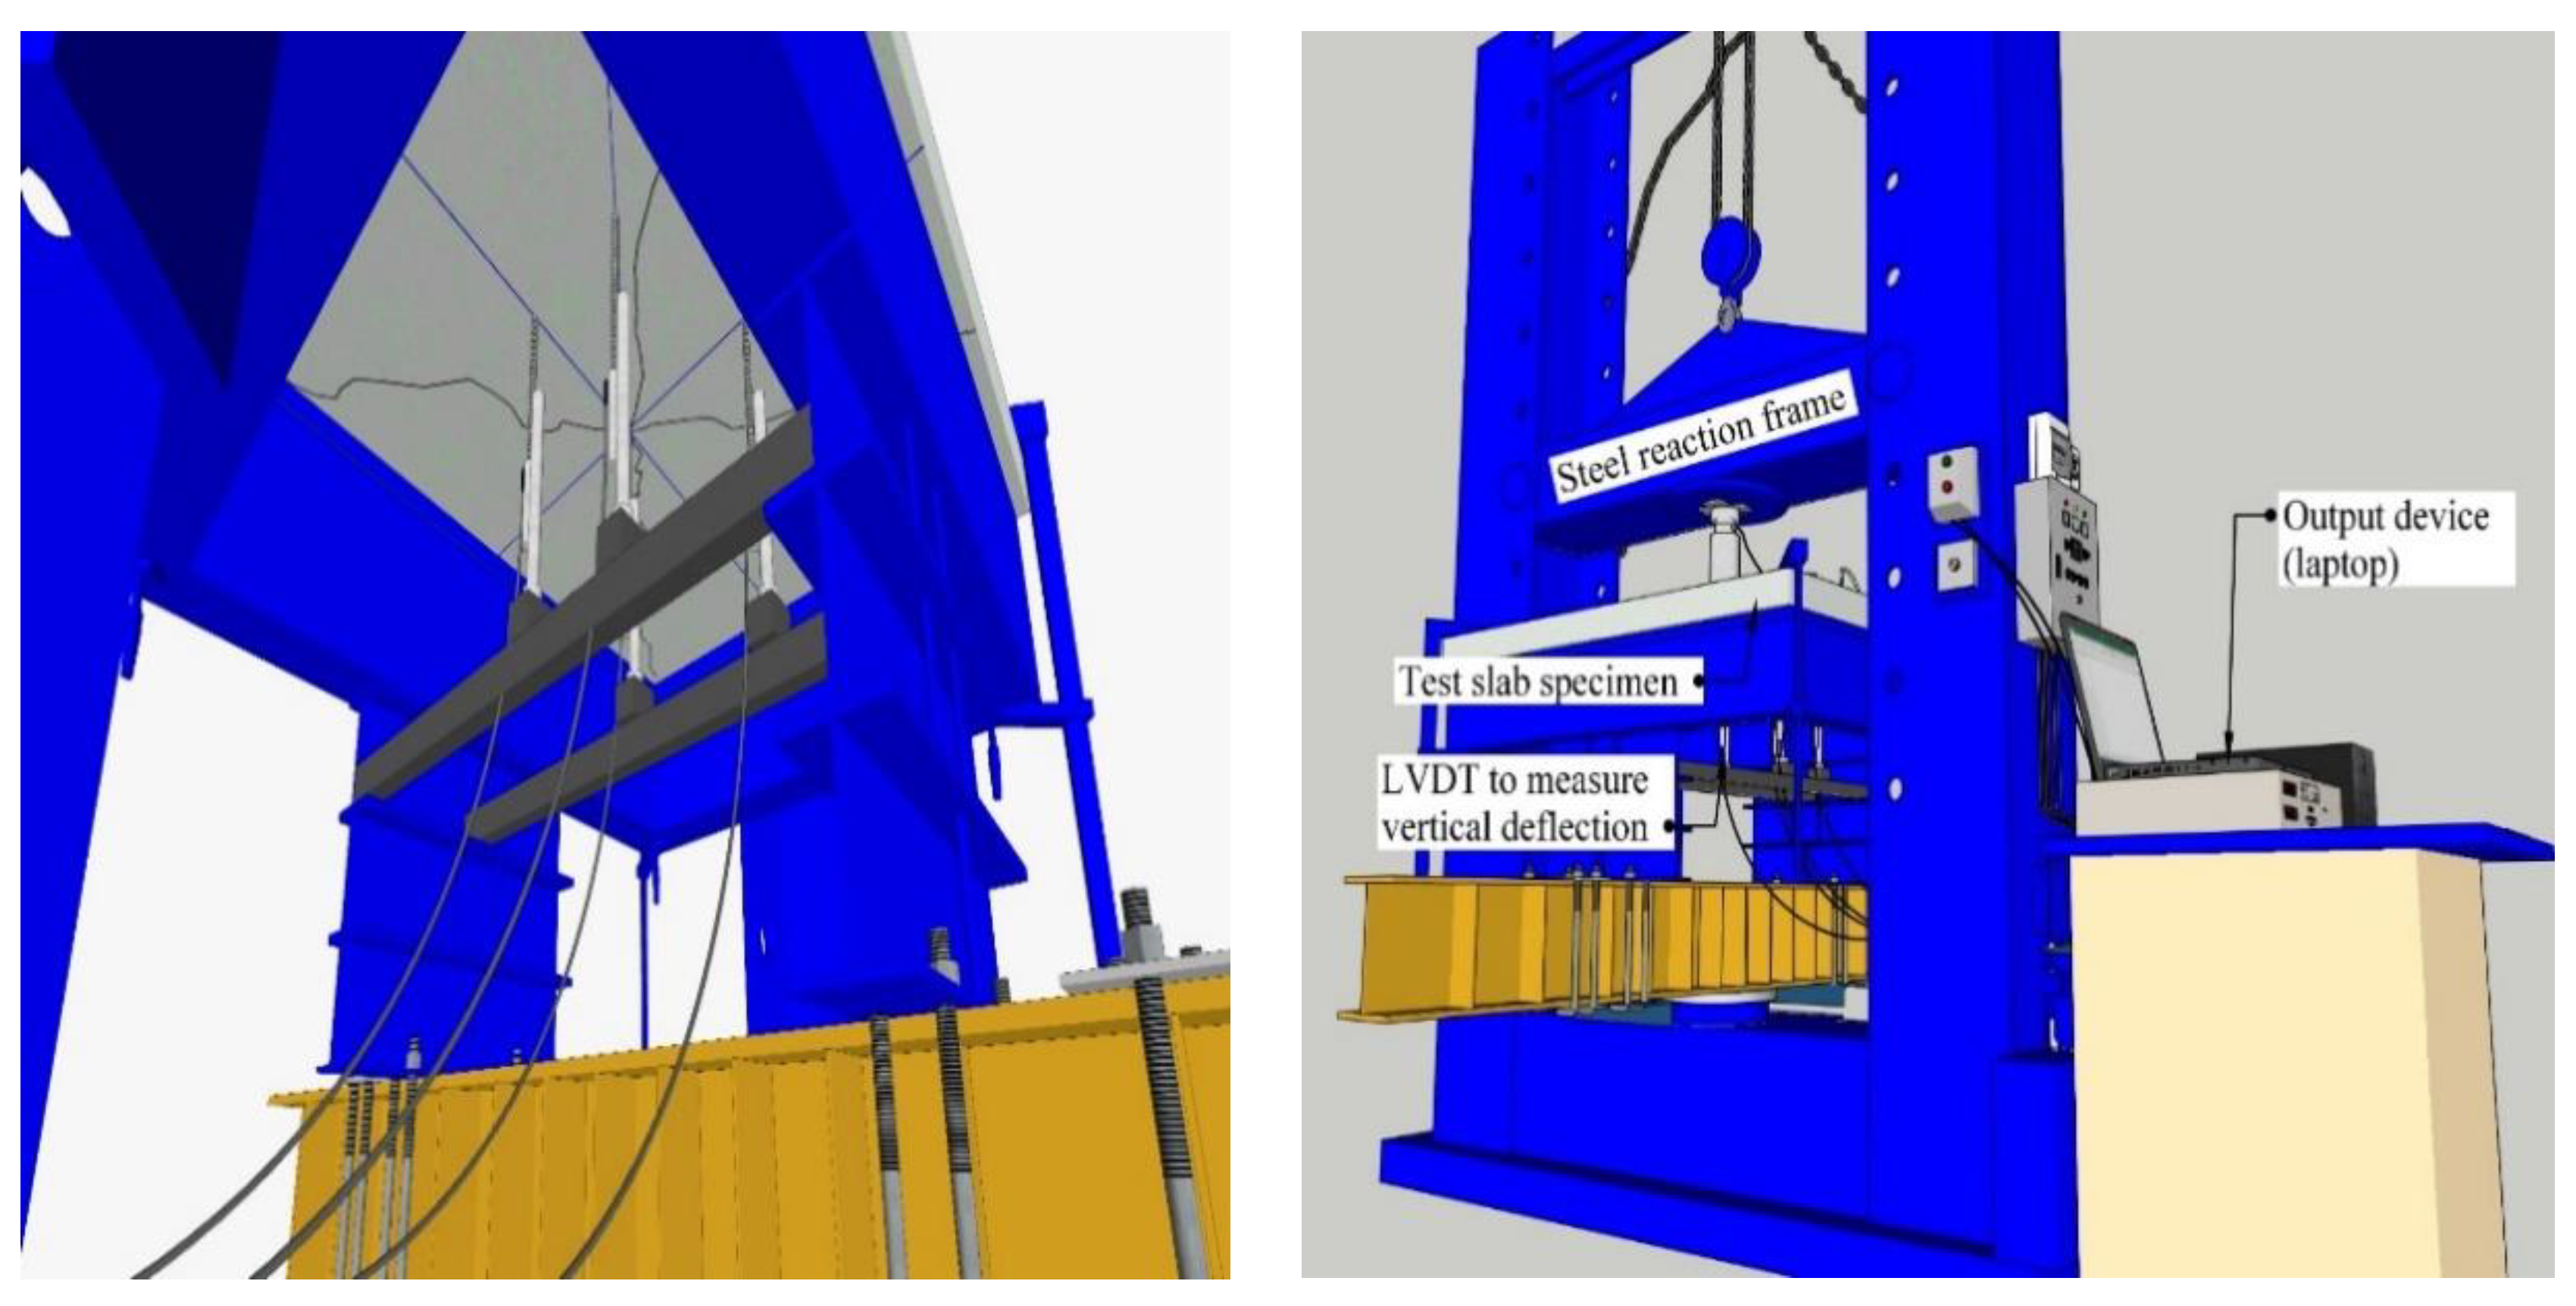
2.5. Test Set-up and Instrumentation
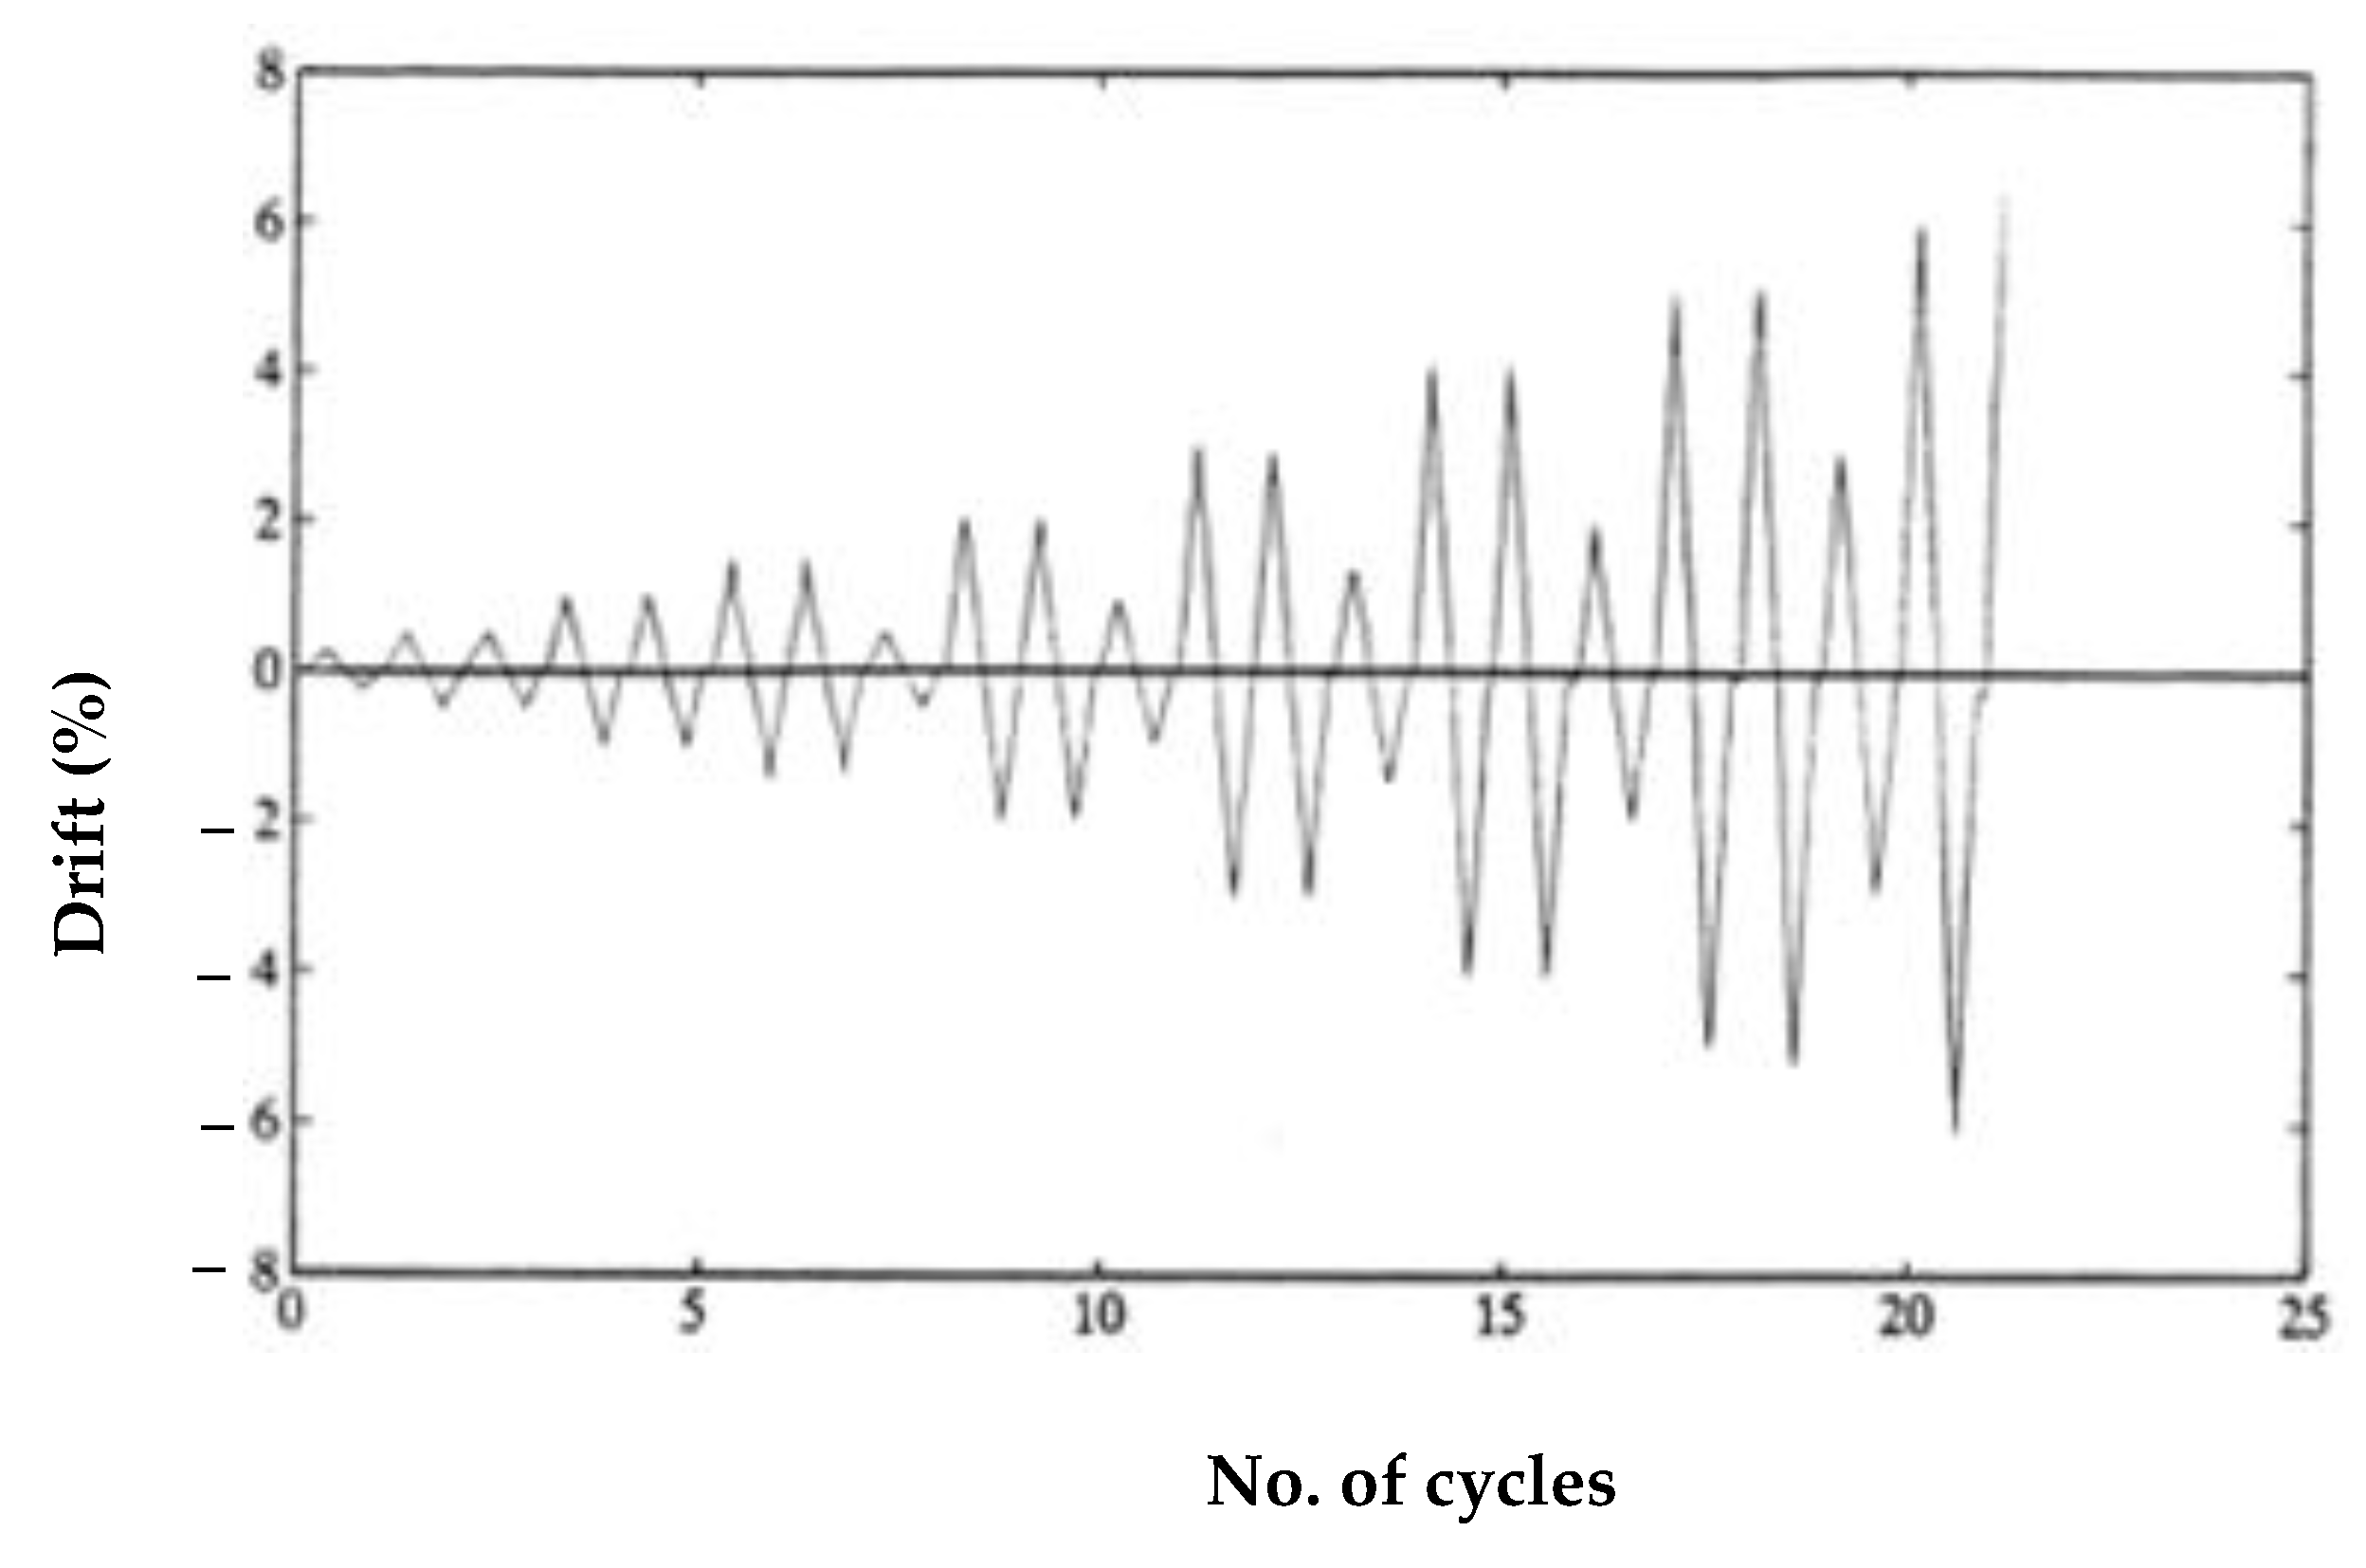
2.5.1. Cyclic Loading Test of Plates
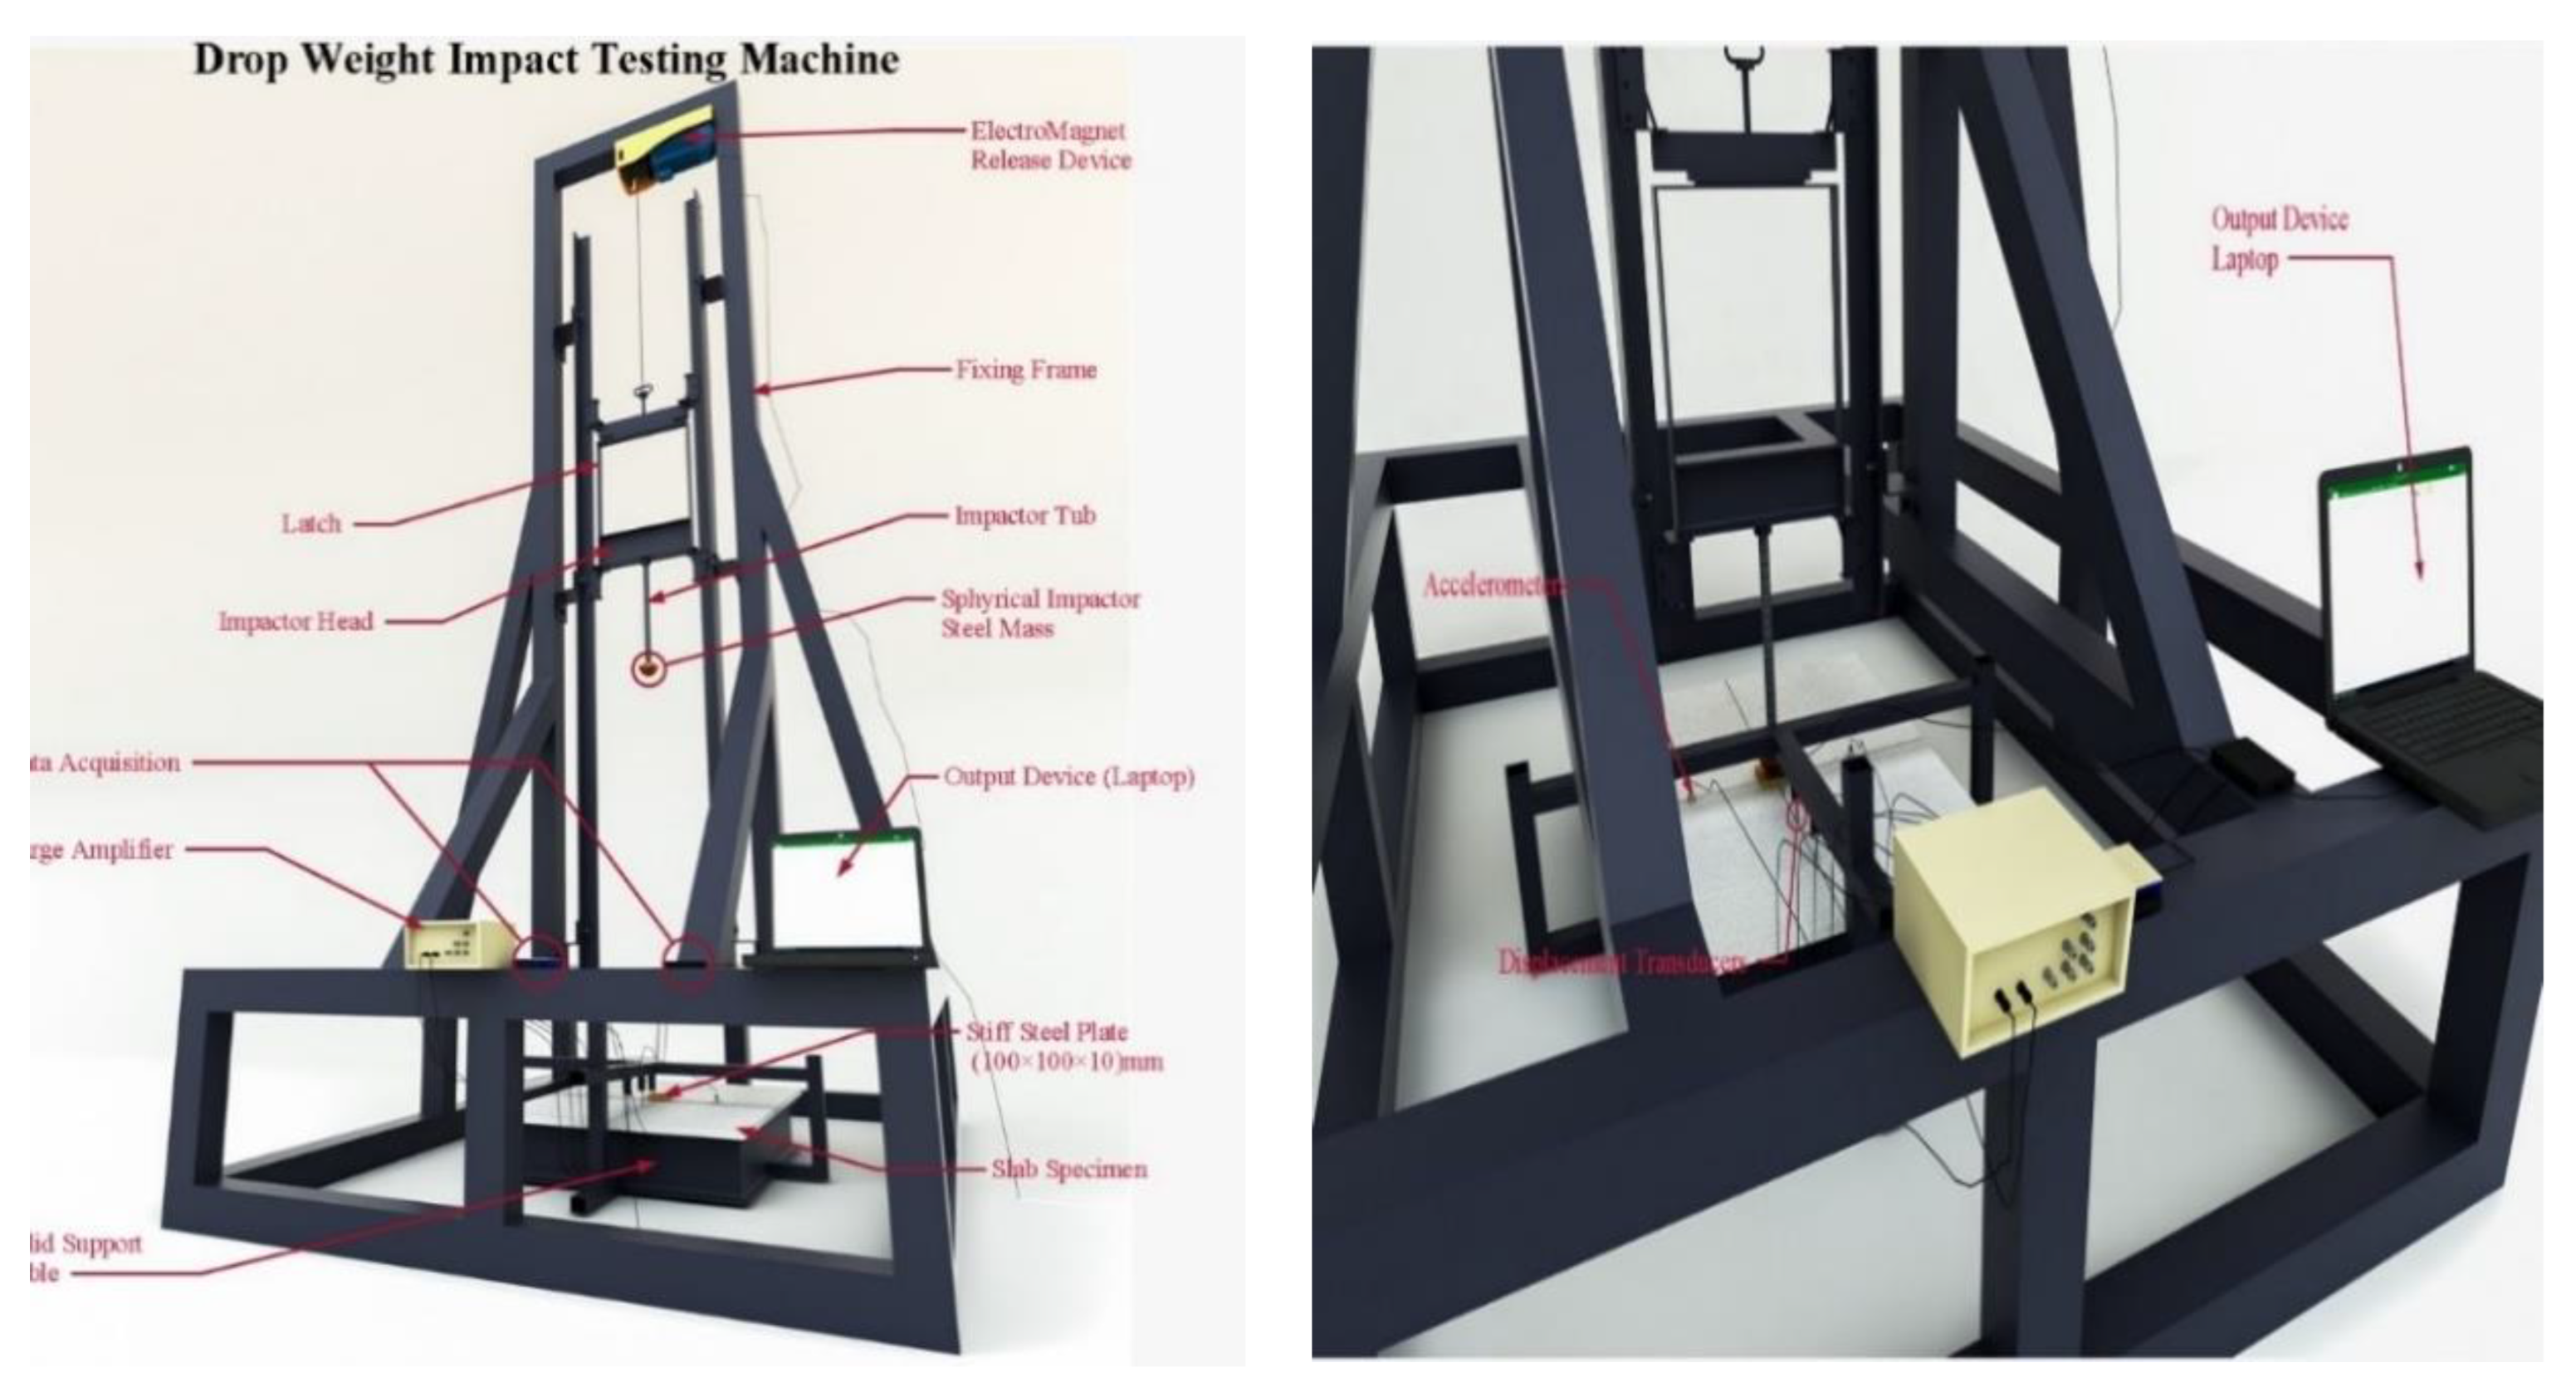
2.5.2. Impact Loading Test of Plates
3. Numerical Modeling and Experimental Results
3.1. Modelling and Analysis of Slab Specimens
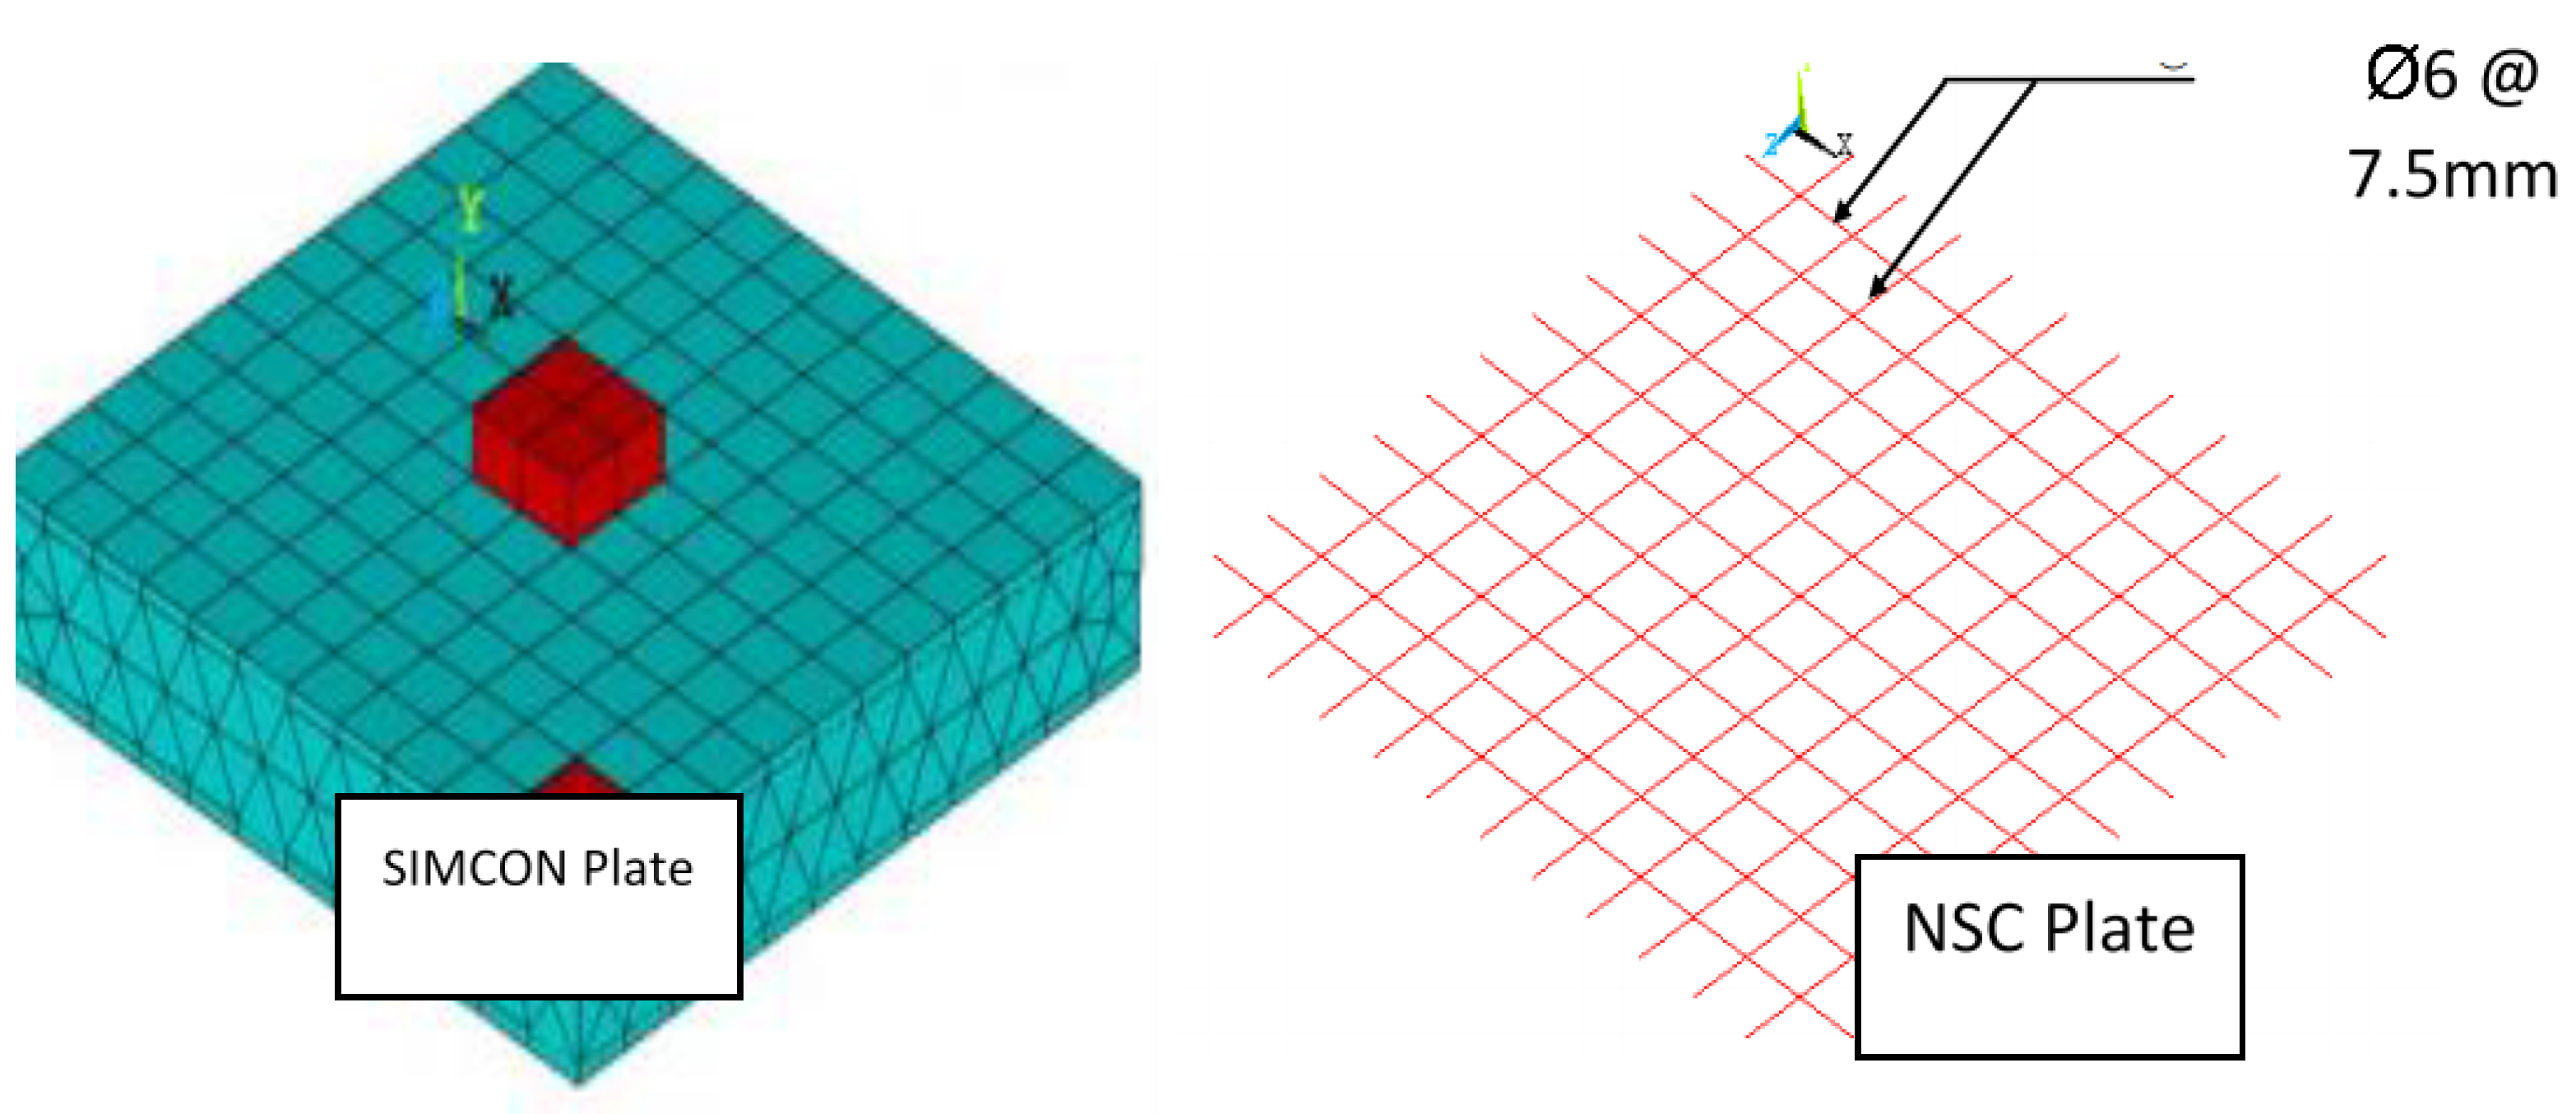
3.2. Finite Element Mesh and Boundary Conditions
3.3. Cyclic and Impact Analysis Model
3.3.1. Punching Shear
3.3.2. American Concrete Institute Building Code ACI 318-14
3.3.3. British Standard Institution BS 8110-1985
3.3.4. Eurocode 2-2004
3.4. Dynamic Analysis
3.4.1. Time History of Impact and Reaction Forces and Deflection of Slab Specimens
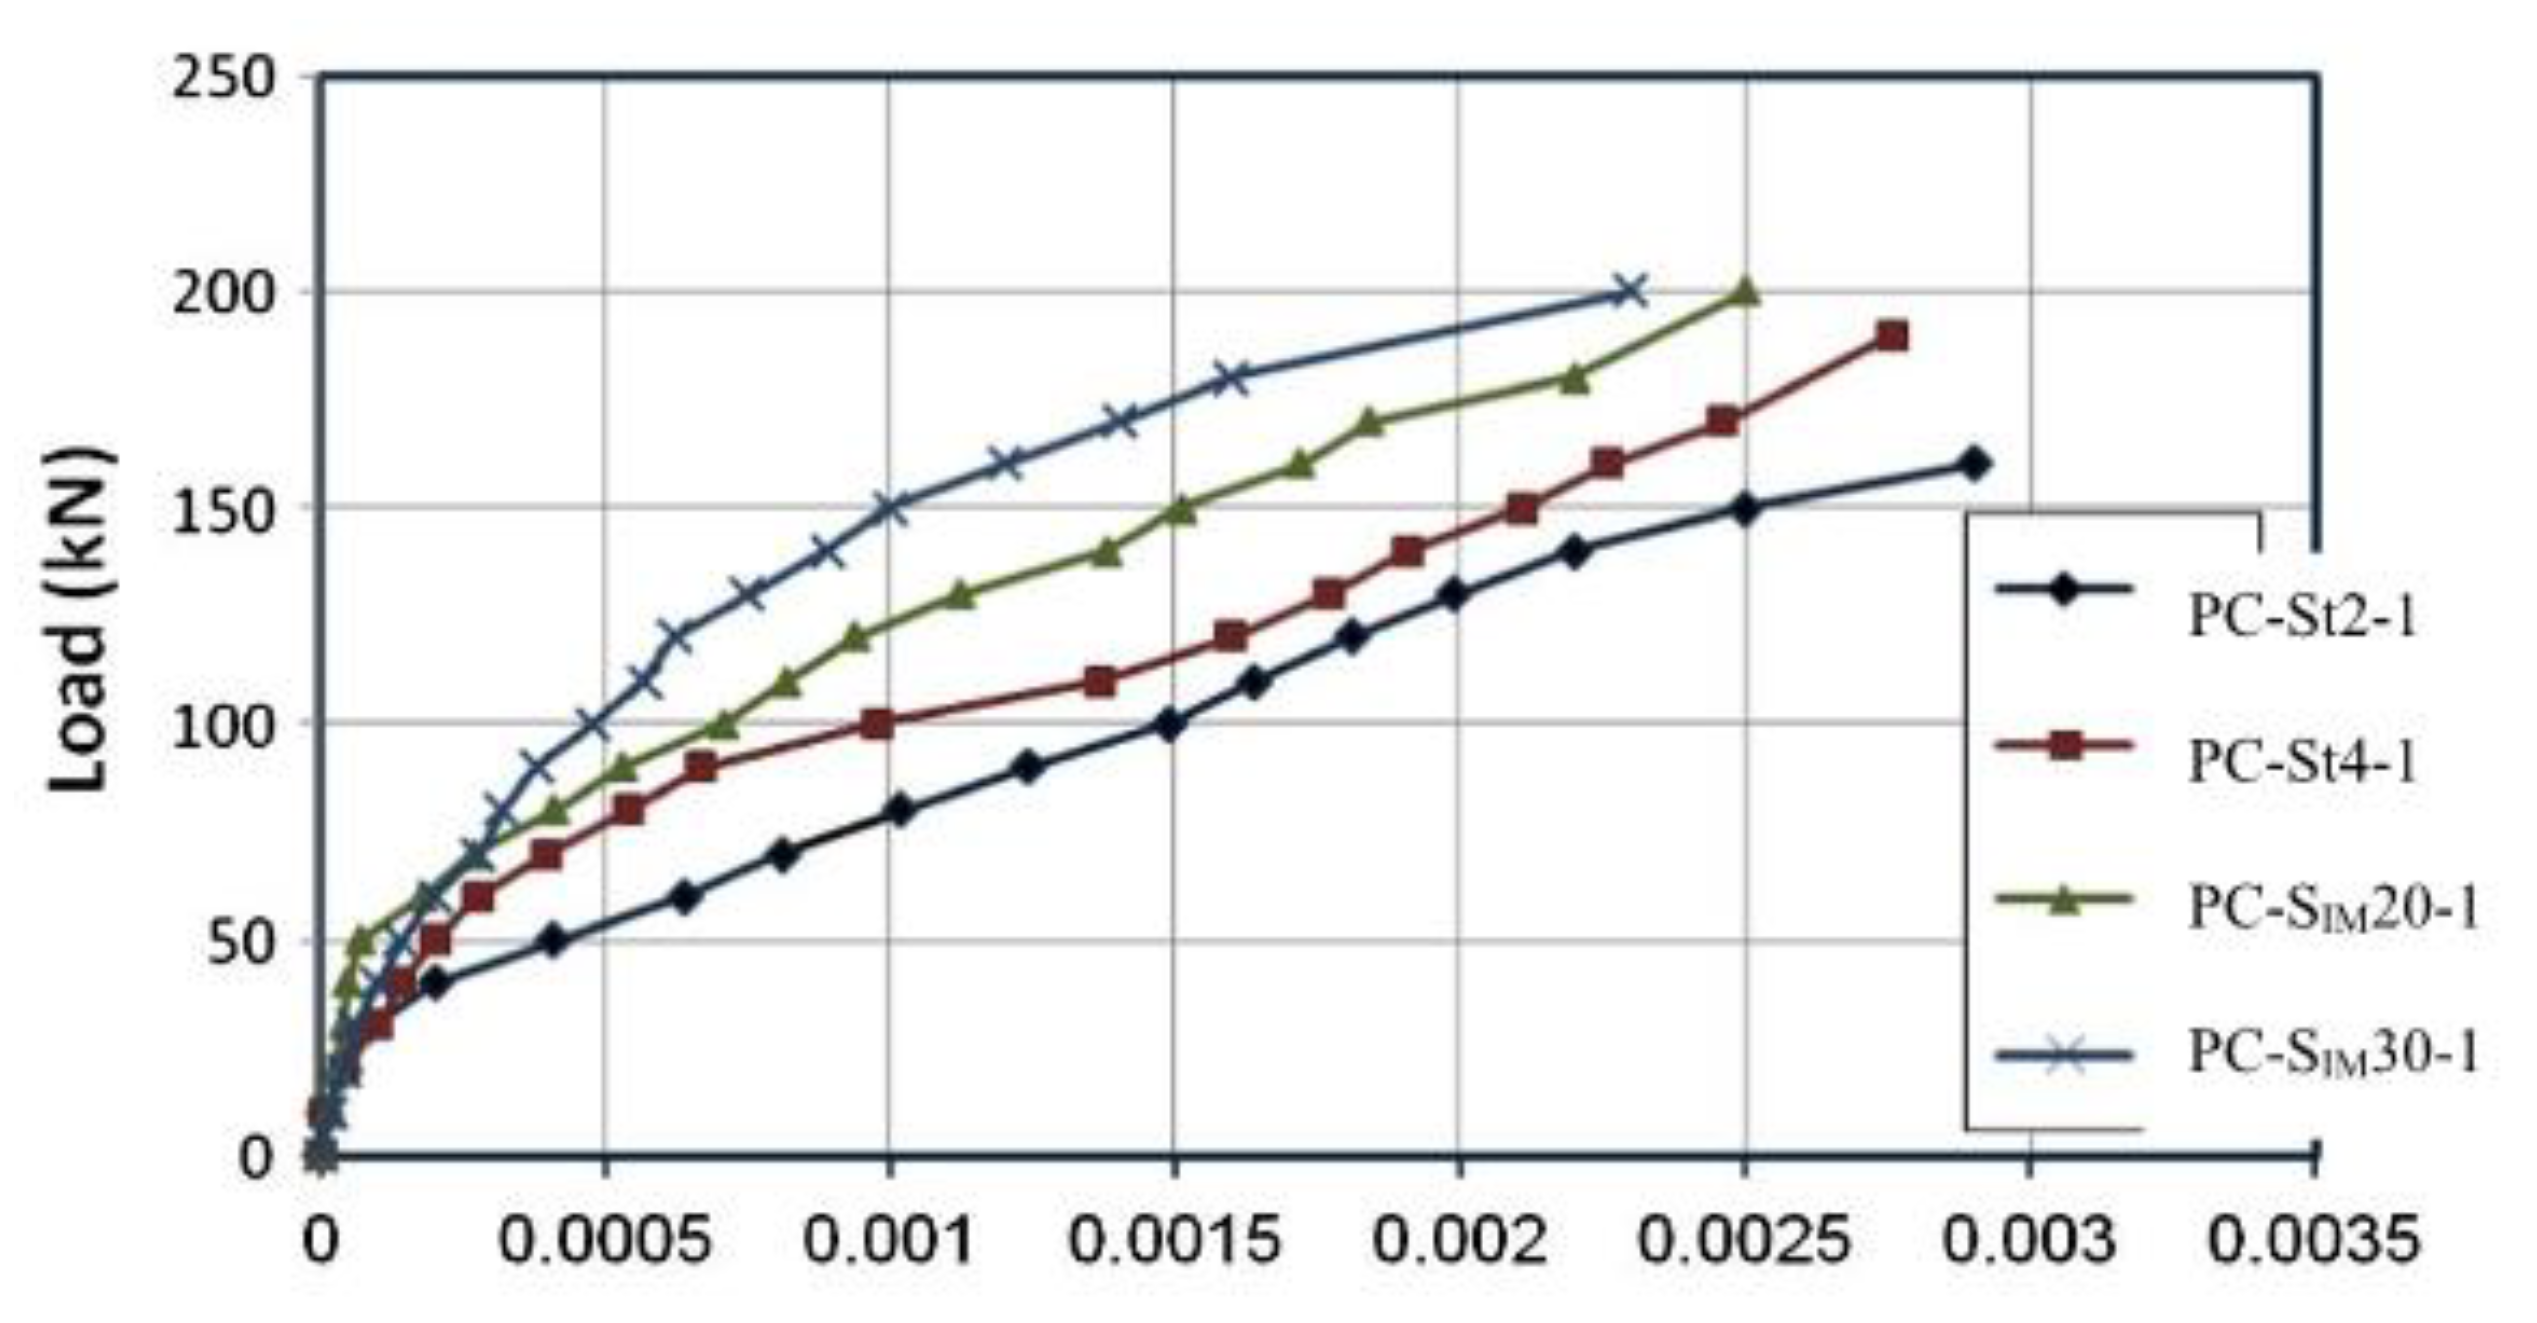
3.4.2. Strain Gauge Measurements of SIMCON Plates
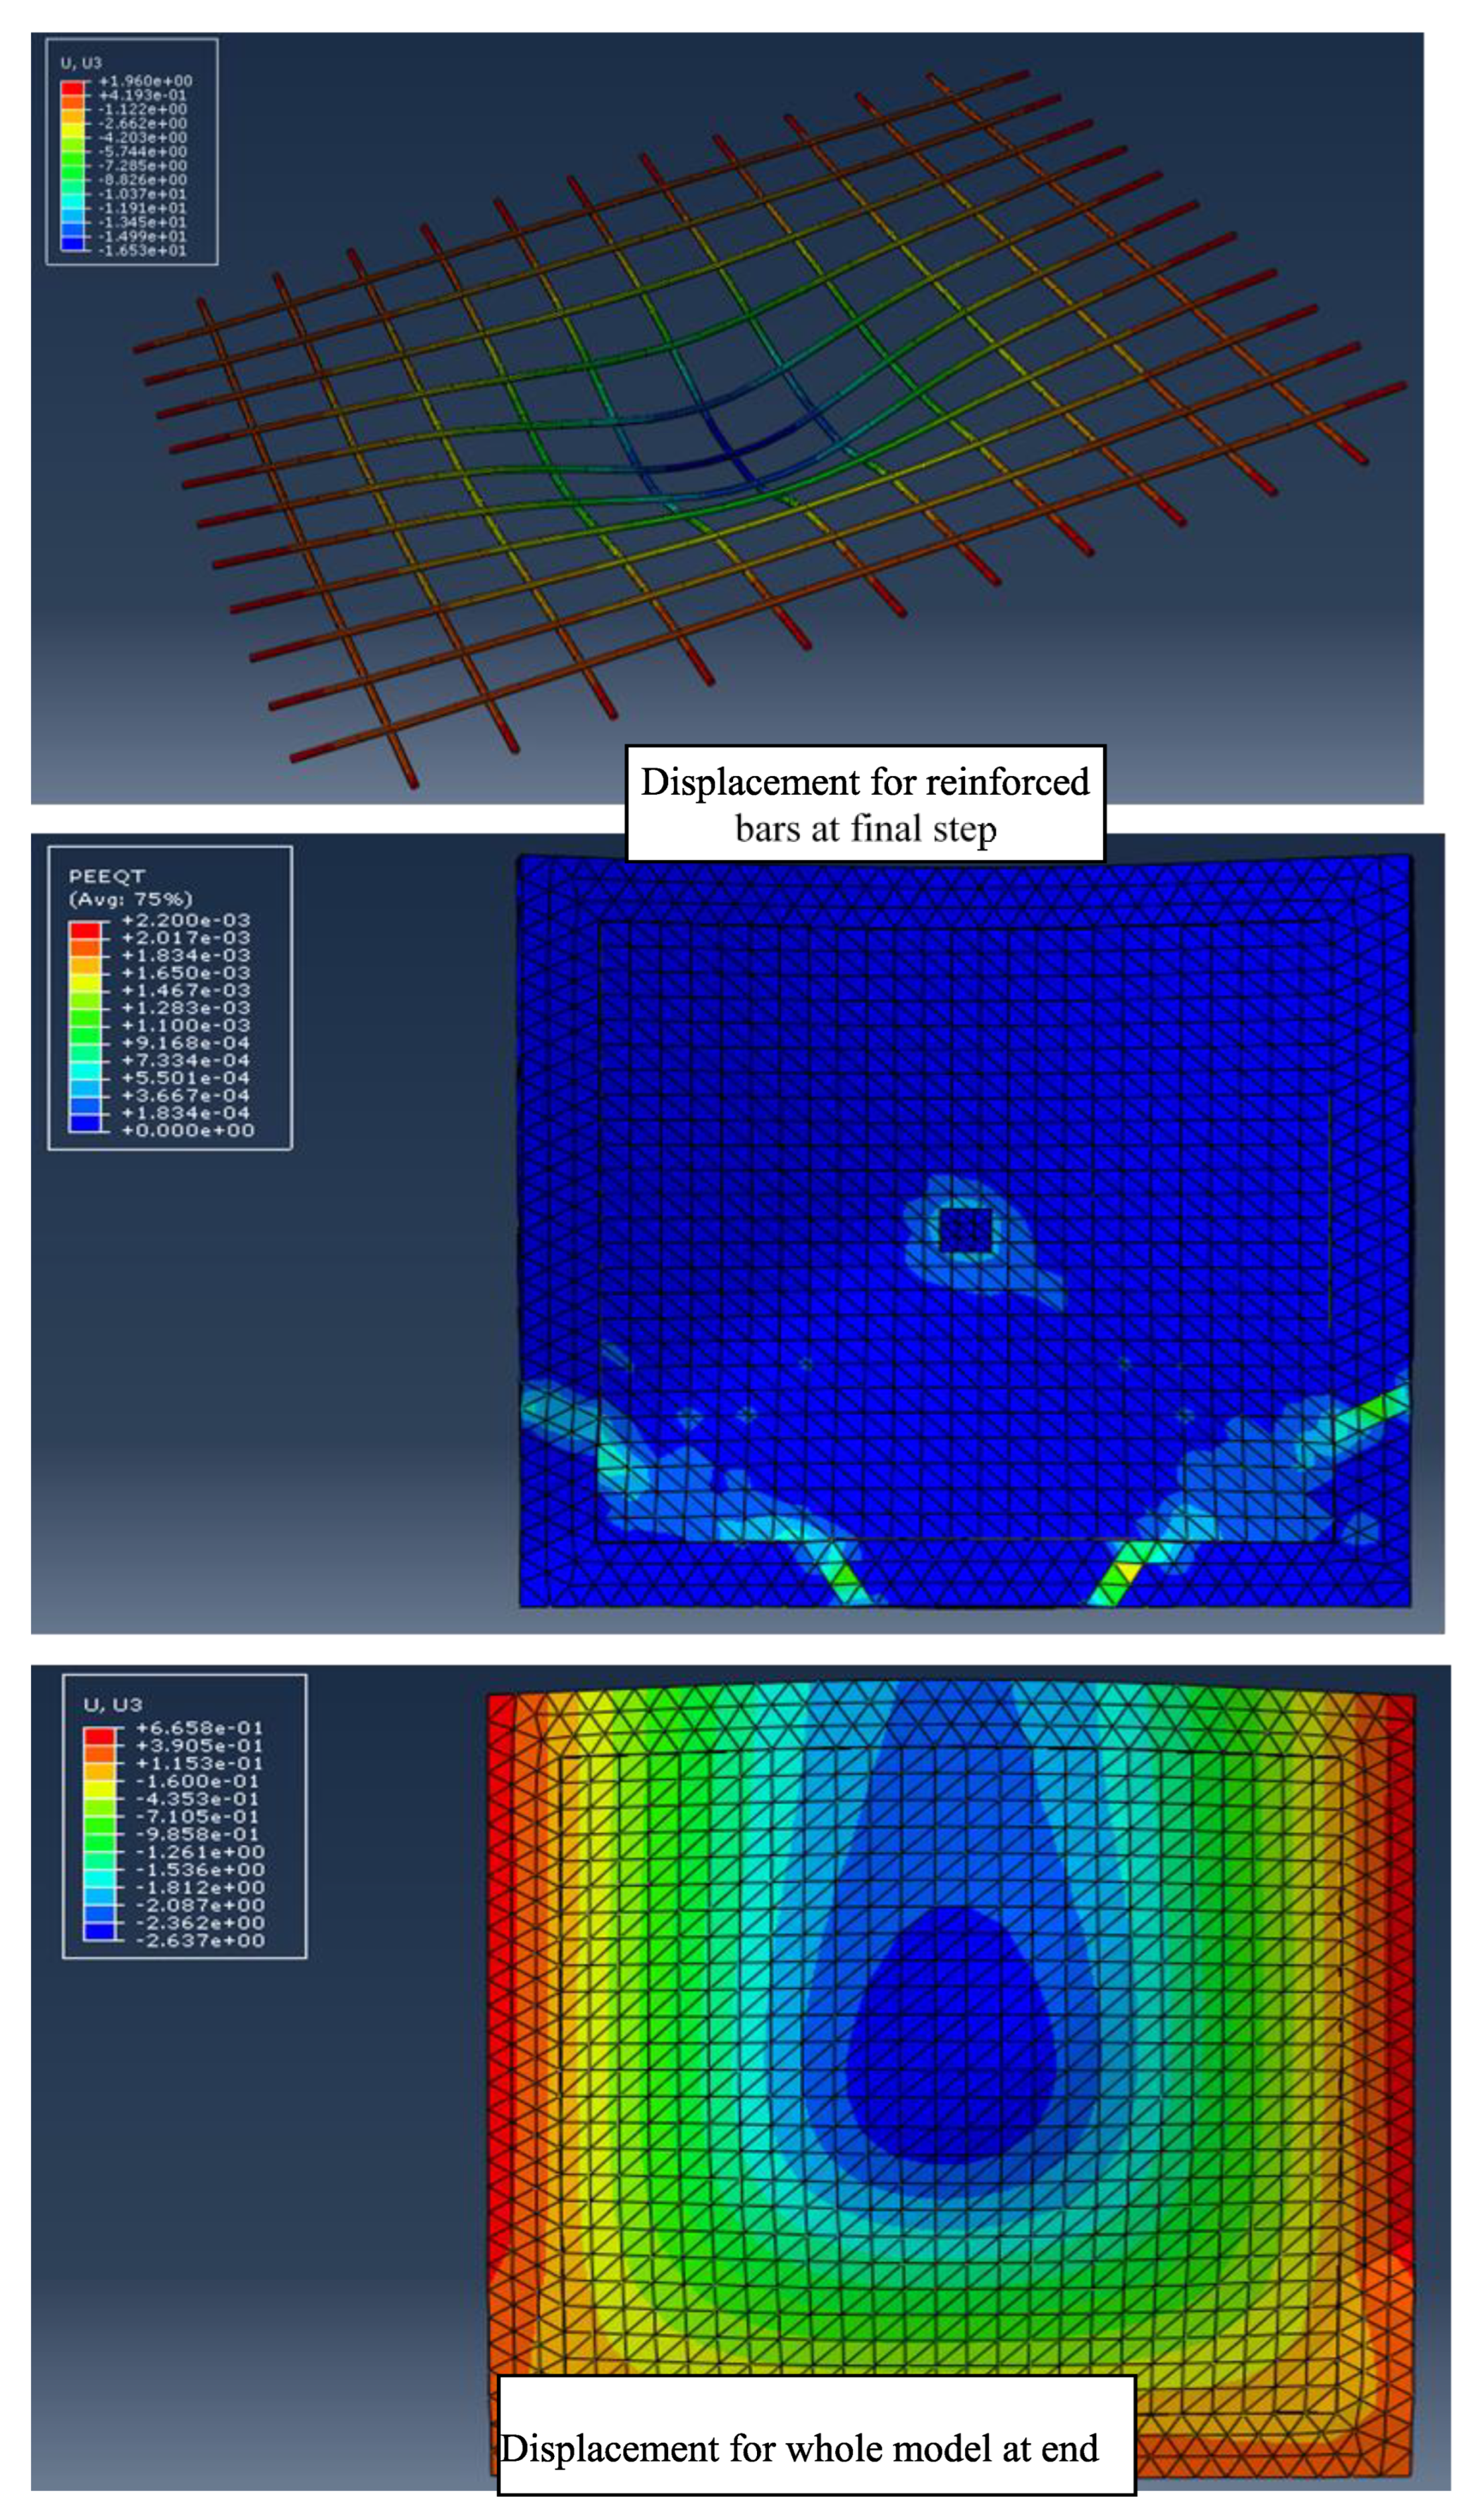
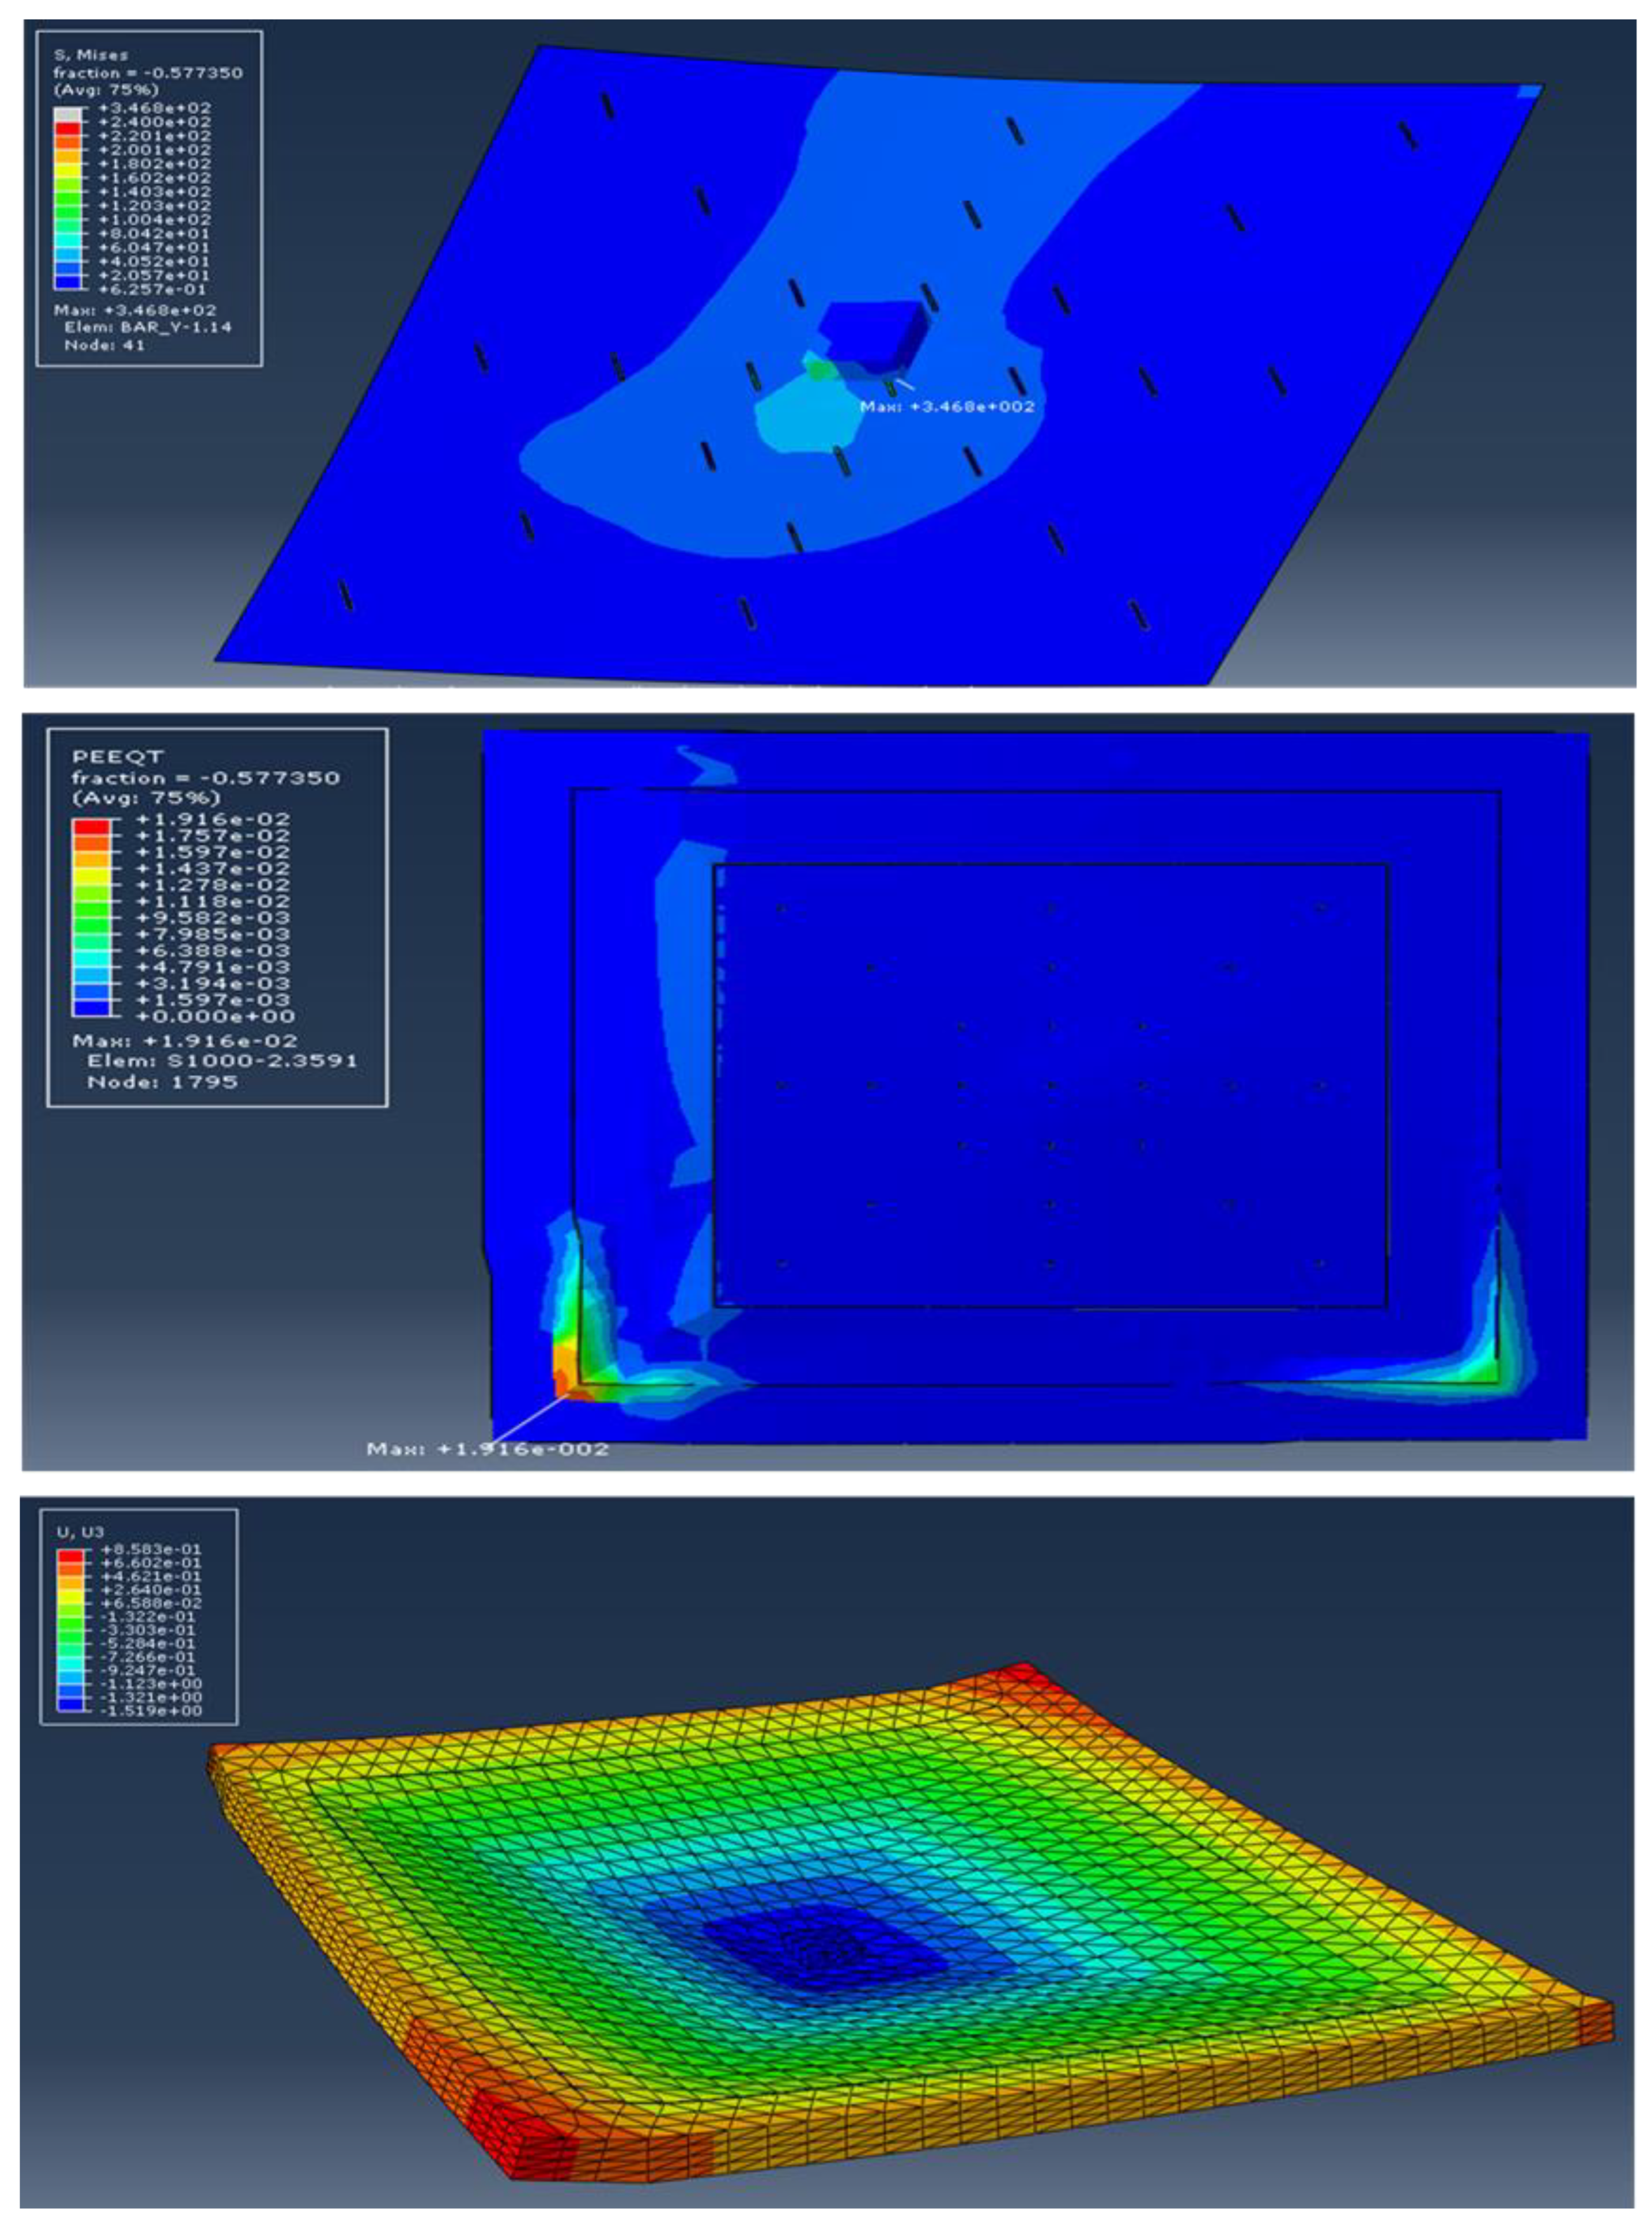
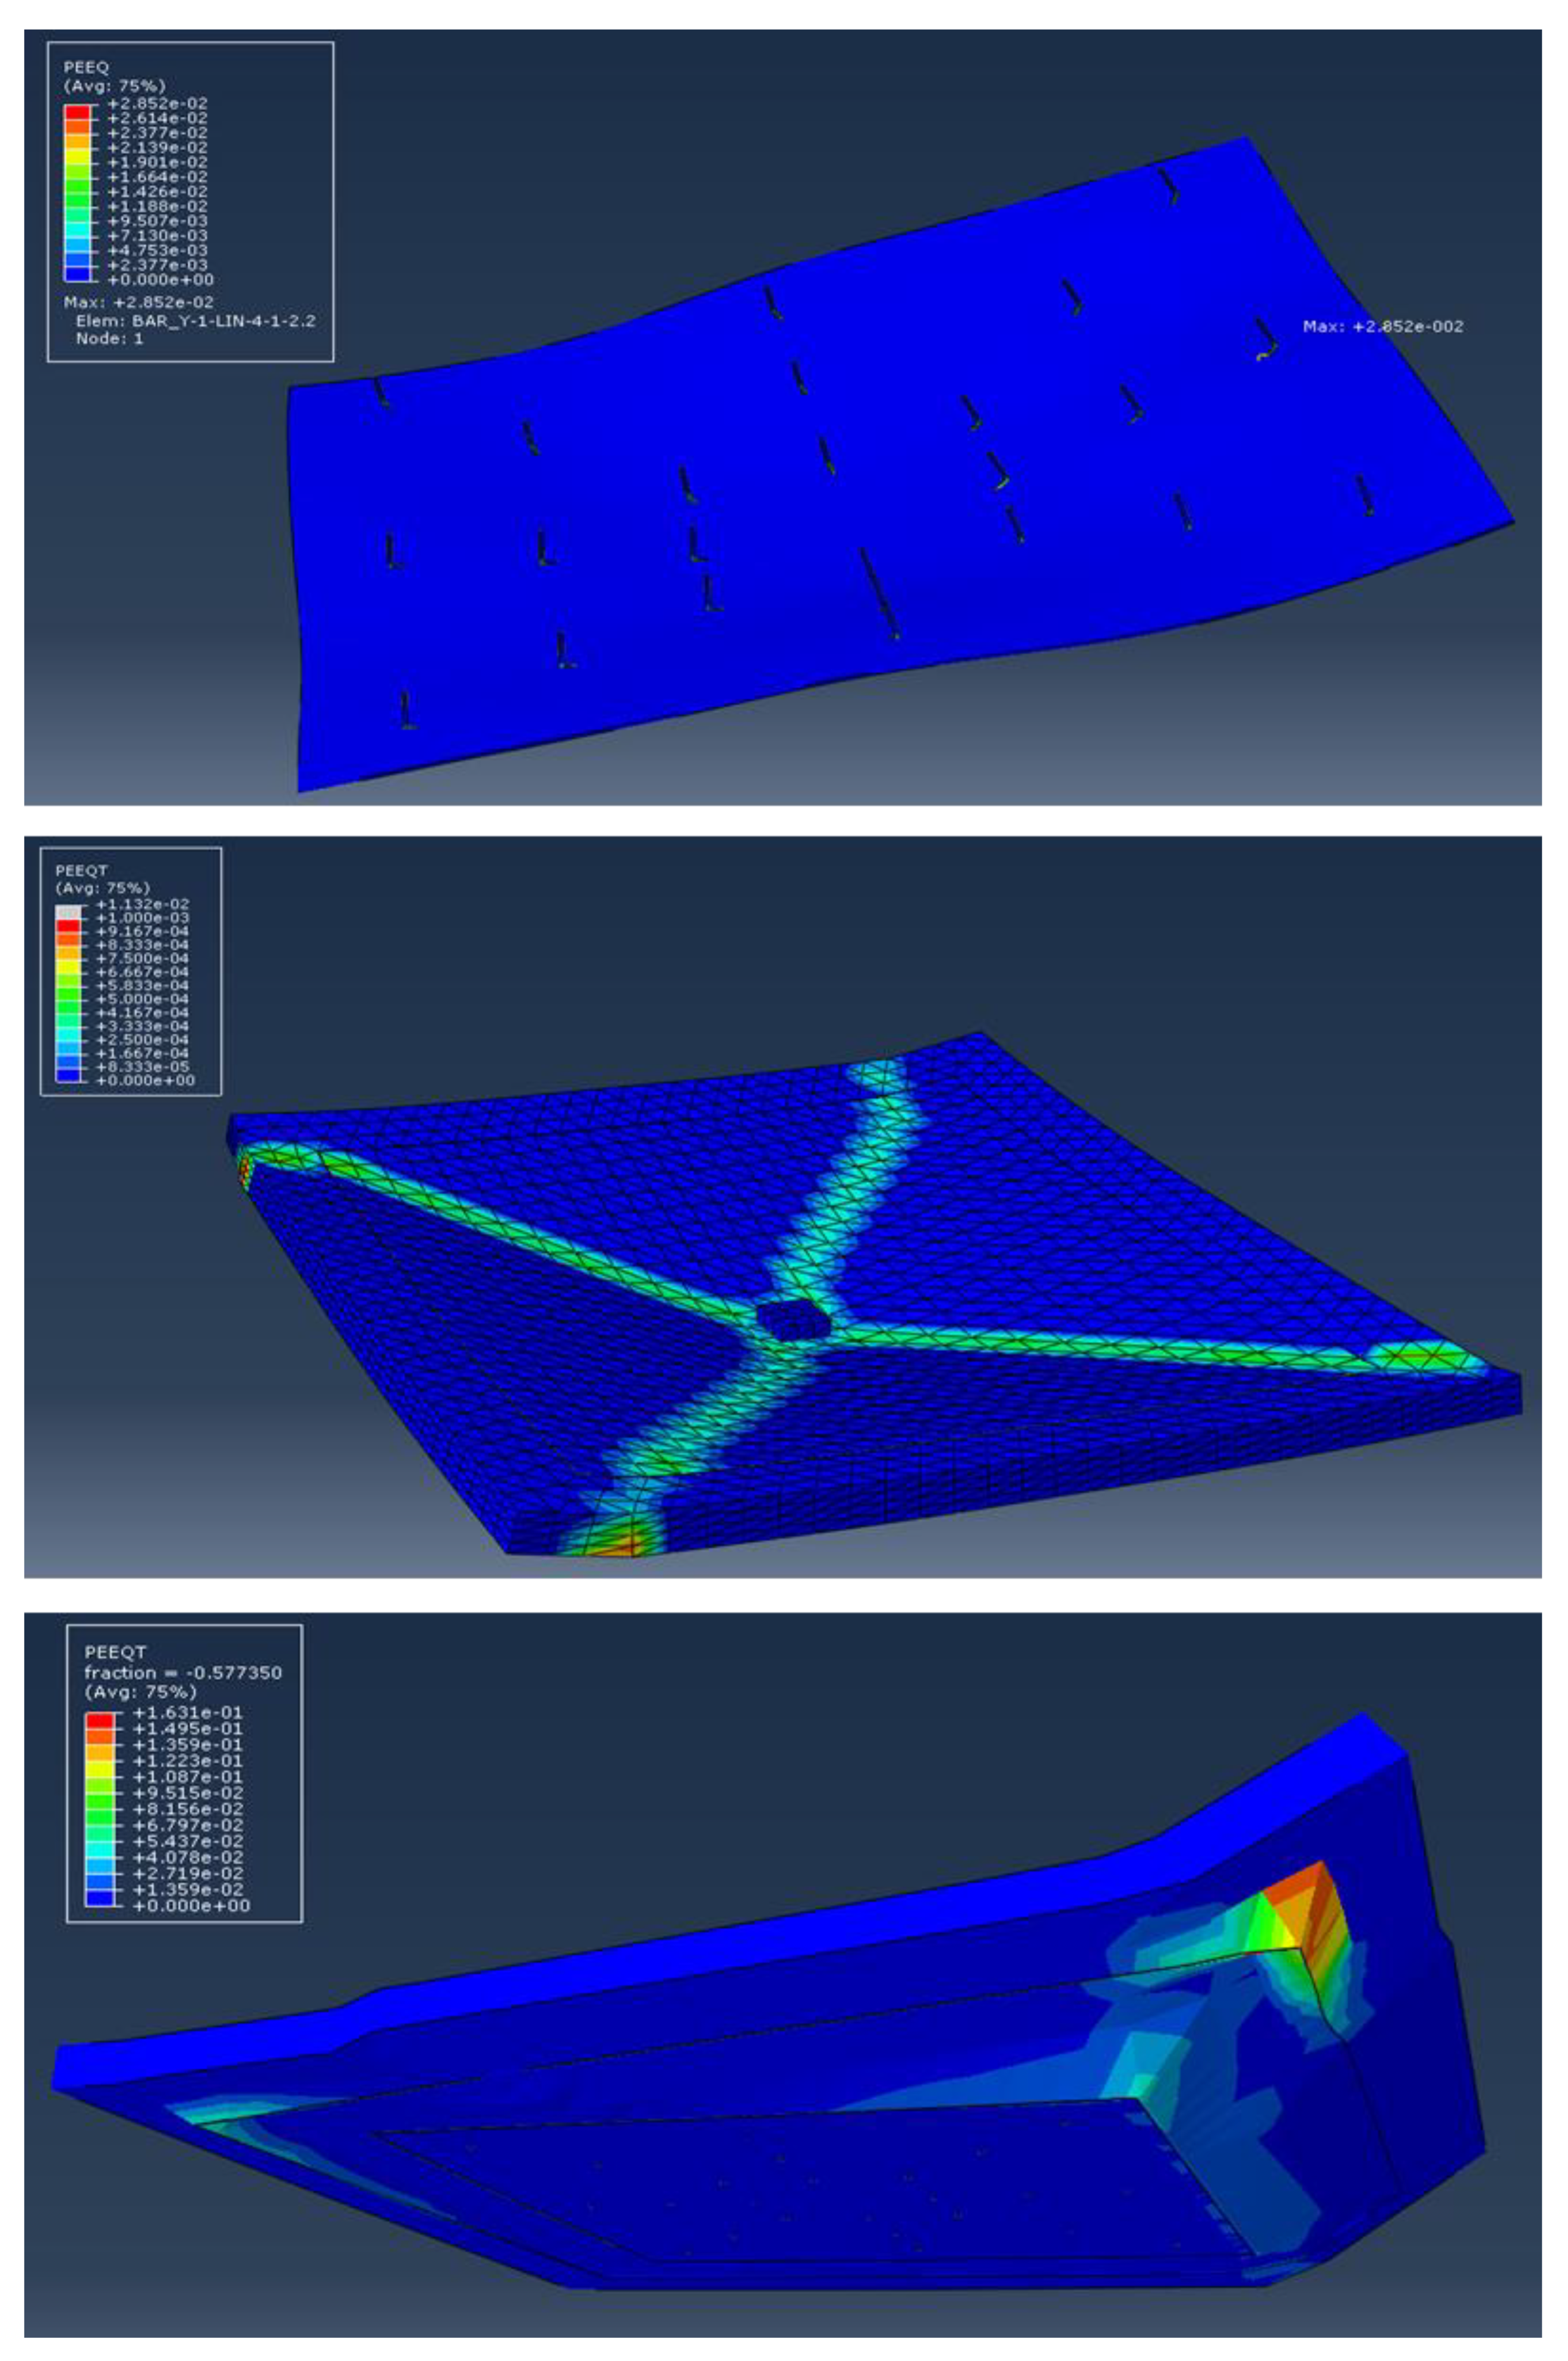
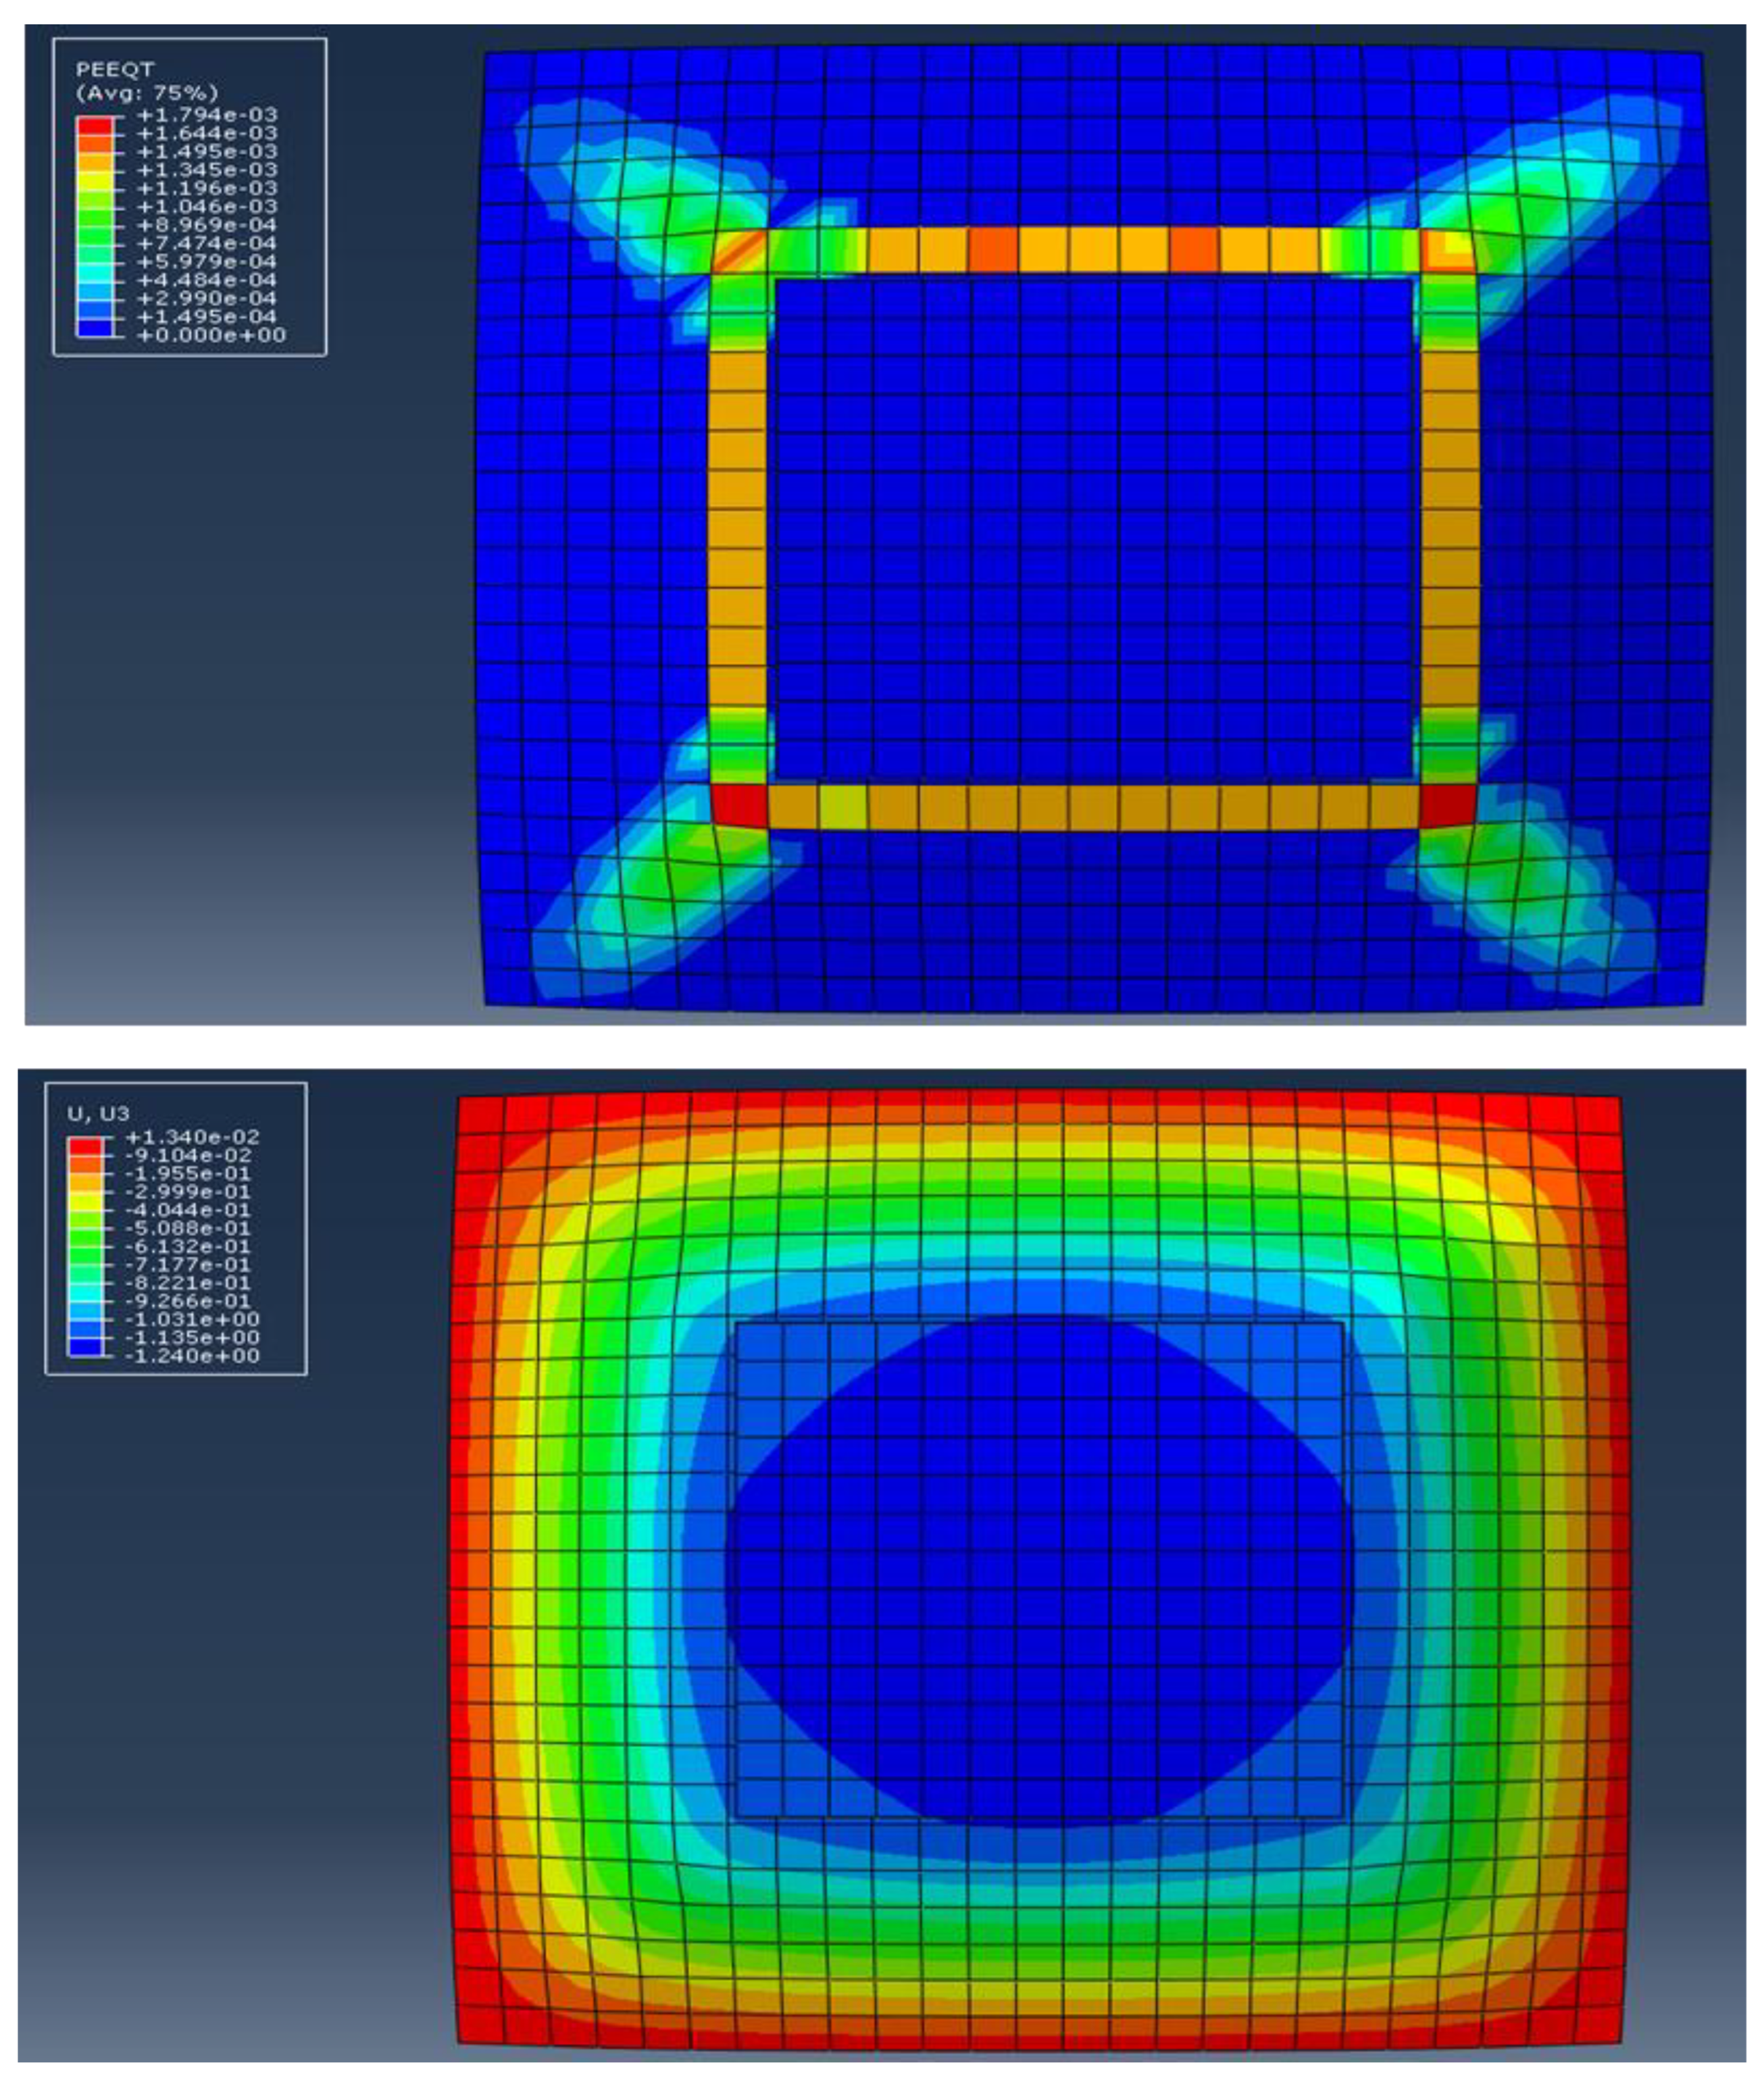
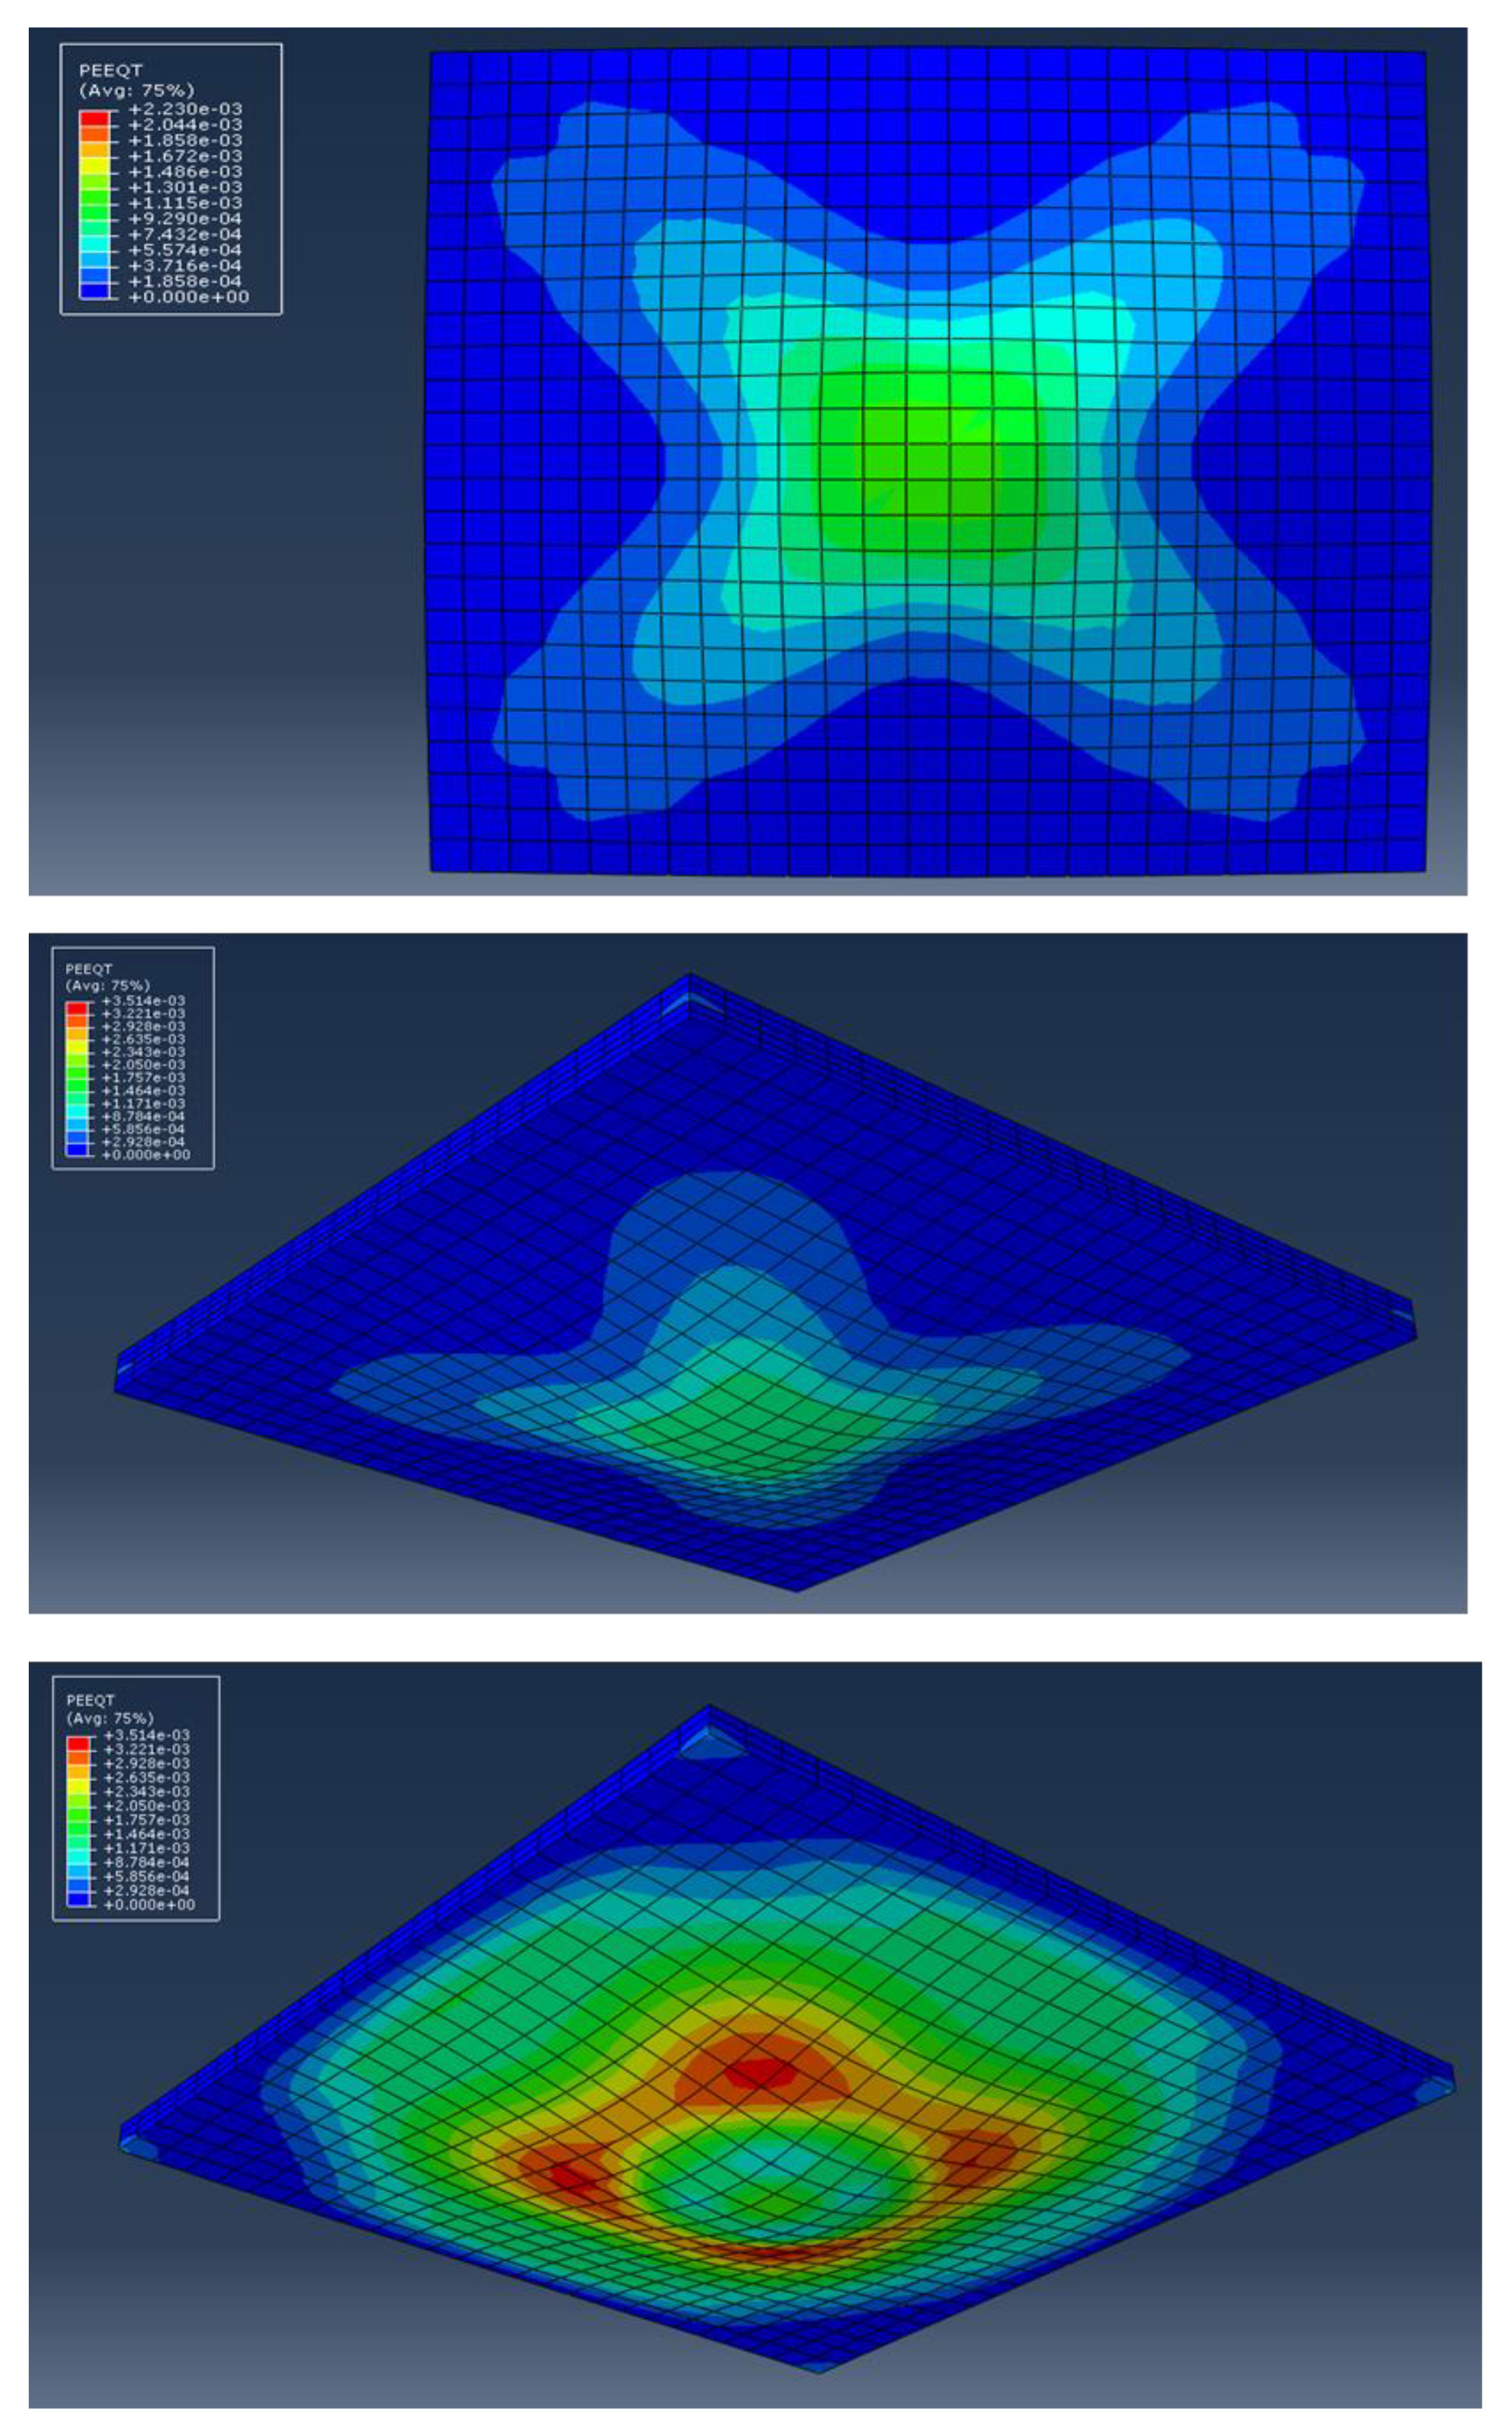
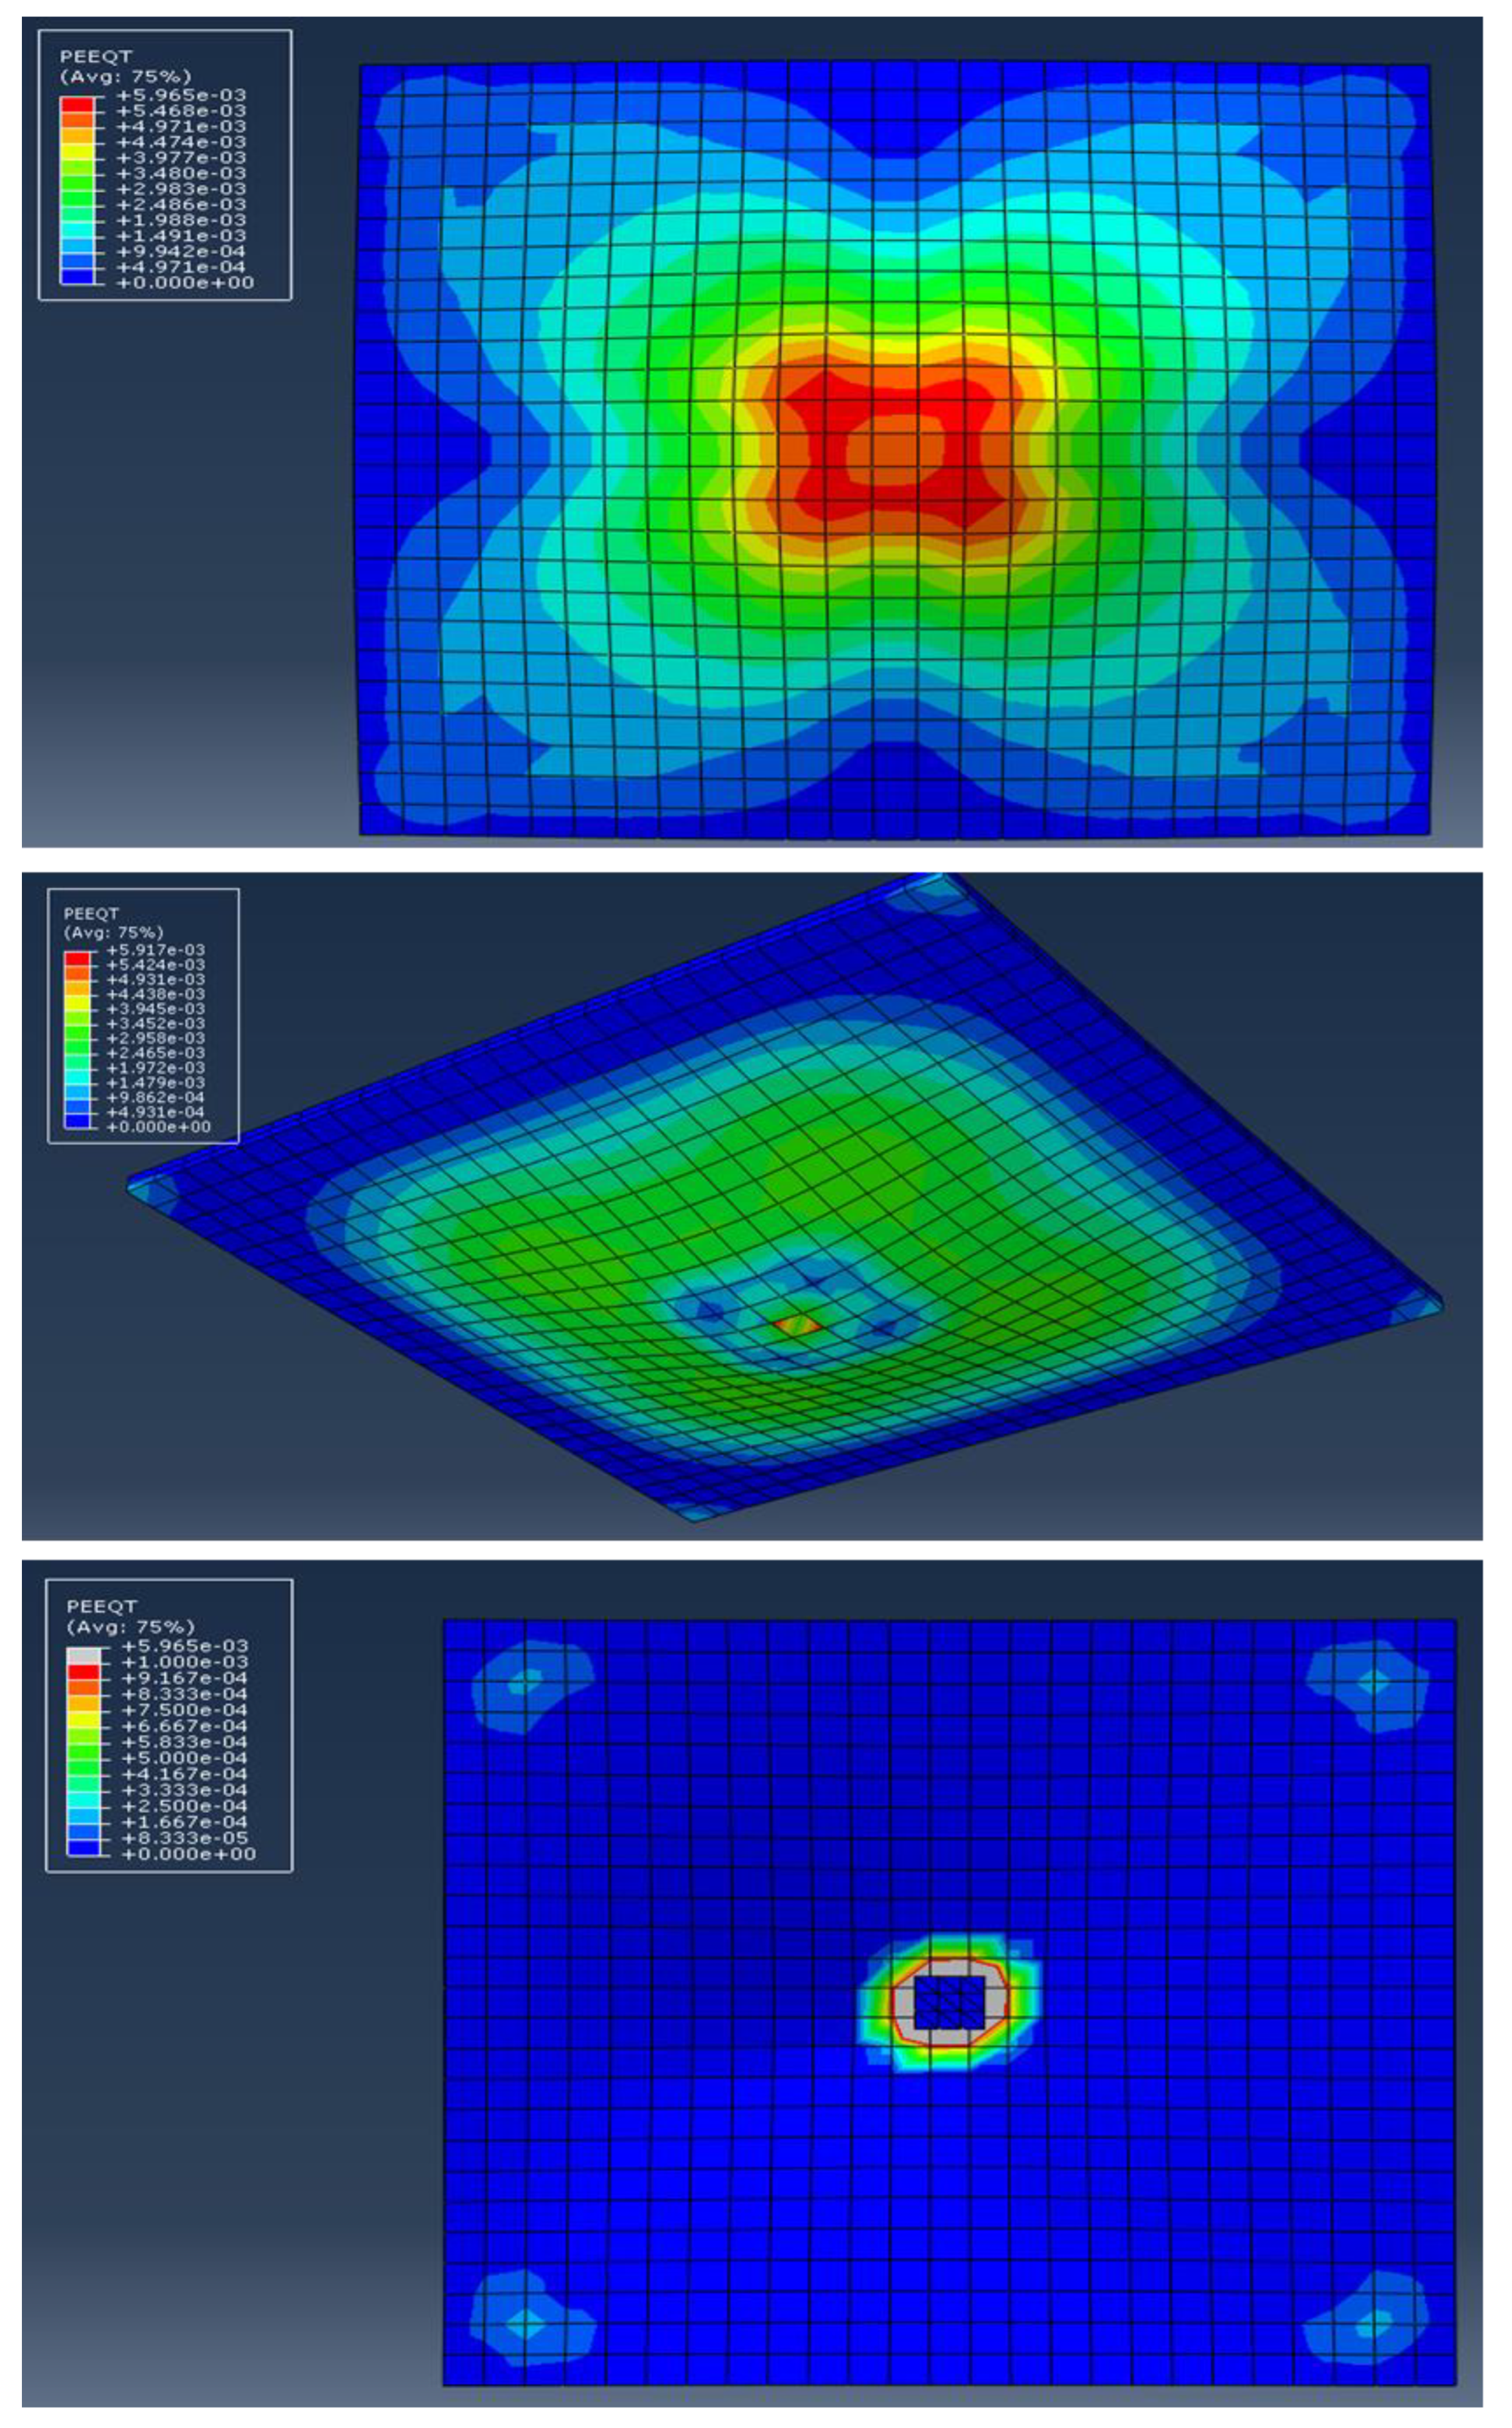
3.5. Finite Element Analysis Results and Discussion
4. Conclusions
- (a)
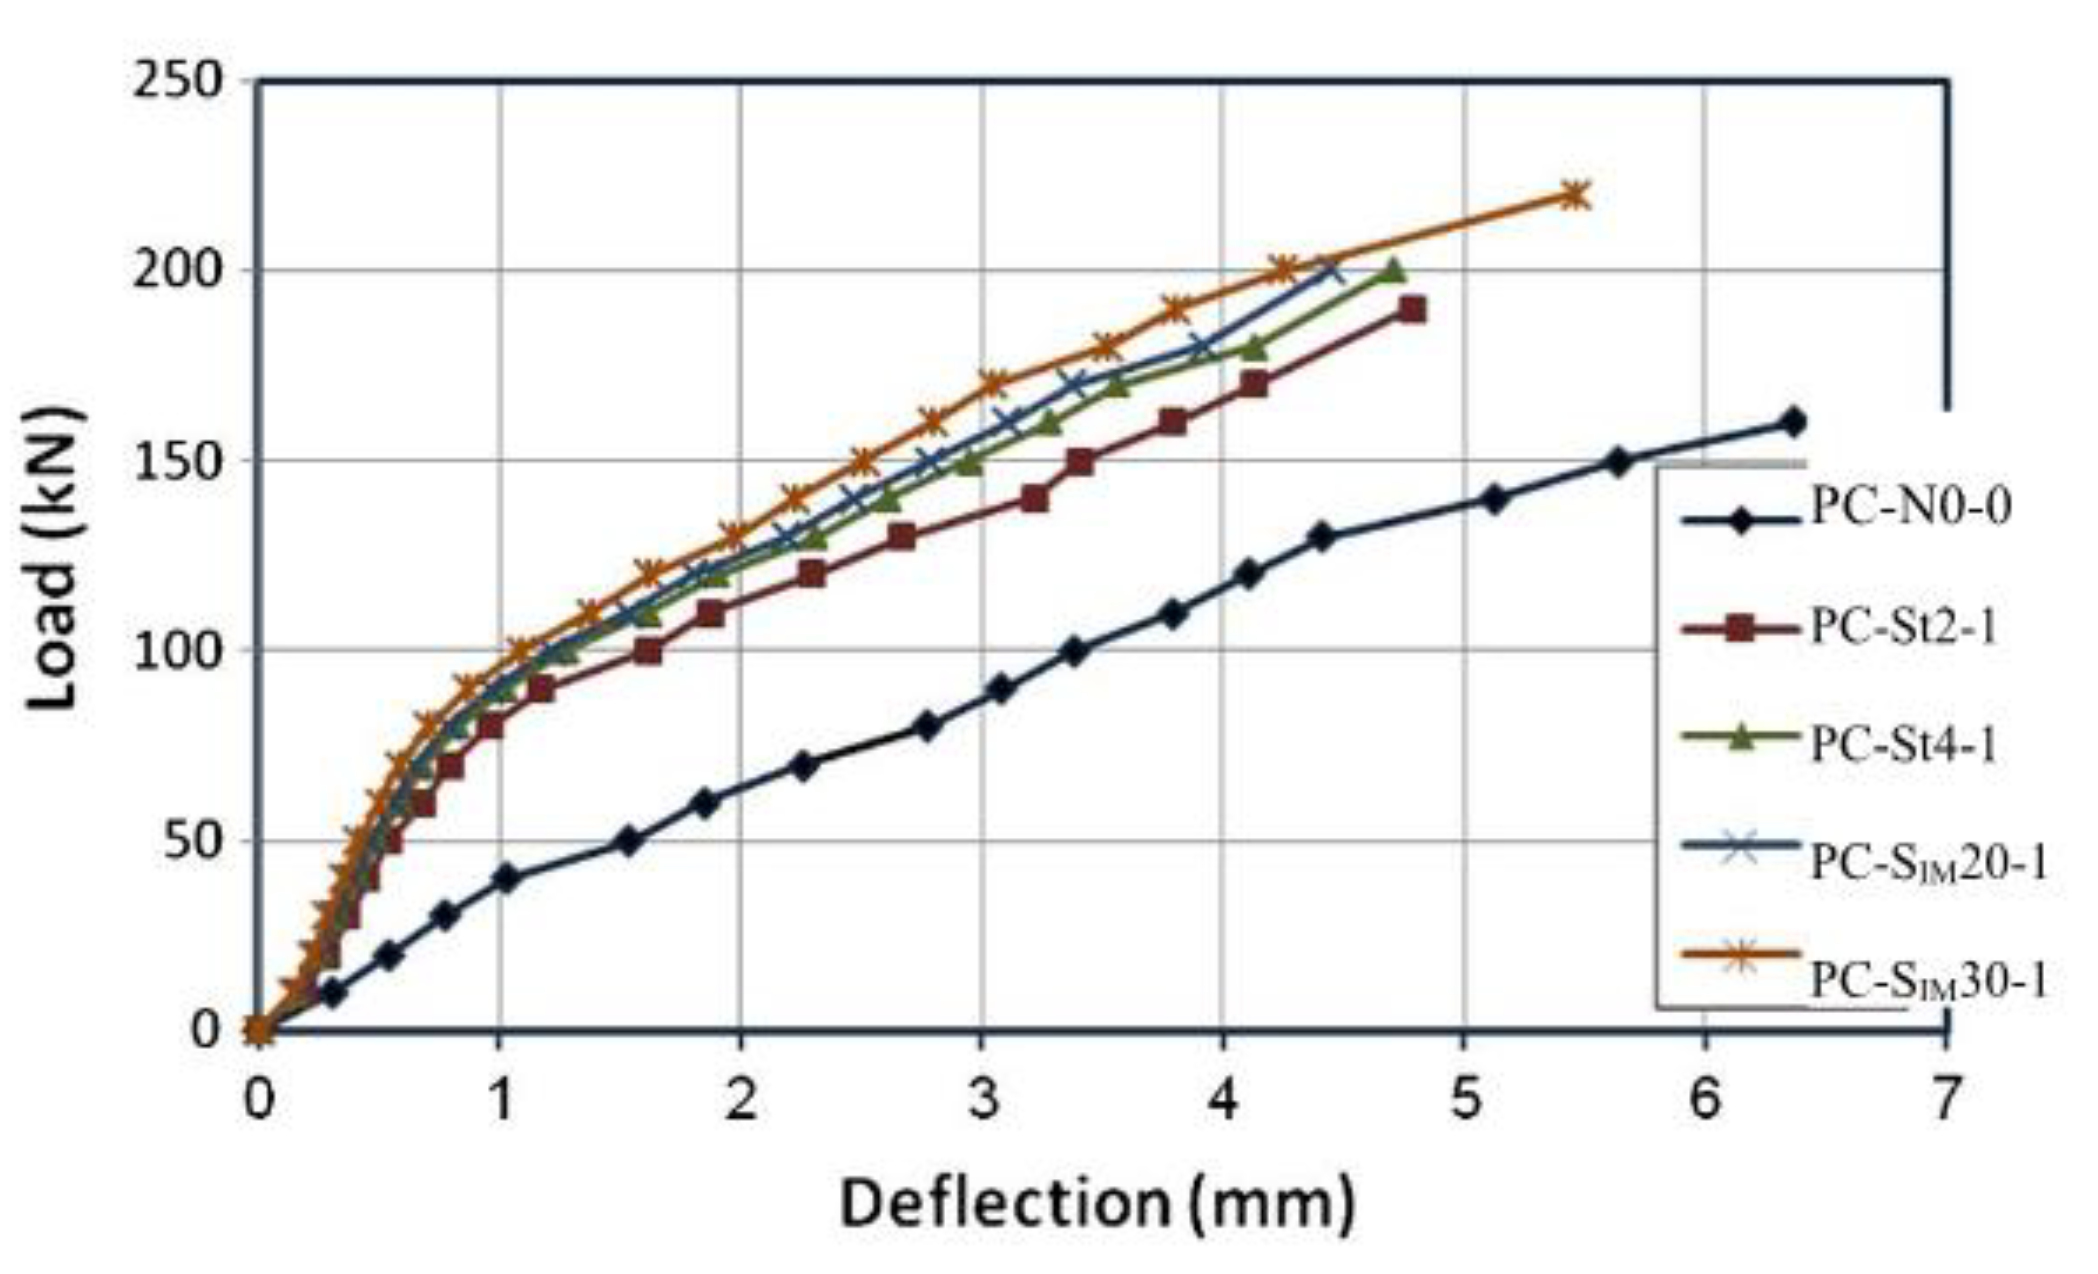
- The numerical results show that the plate thickness of SIMCON significantly affects the load-carrying capacity, and it increases along with the increase in thickness. Moreover, using strengthening from steel plates gives a higher load-carrying capacity.
- (b)
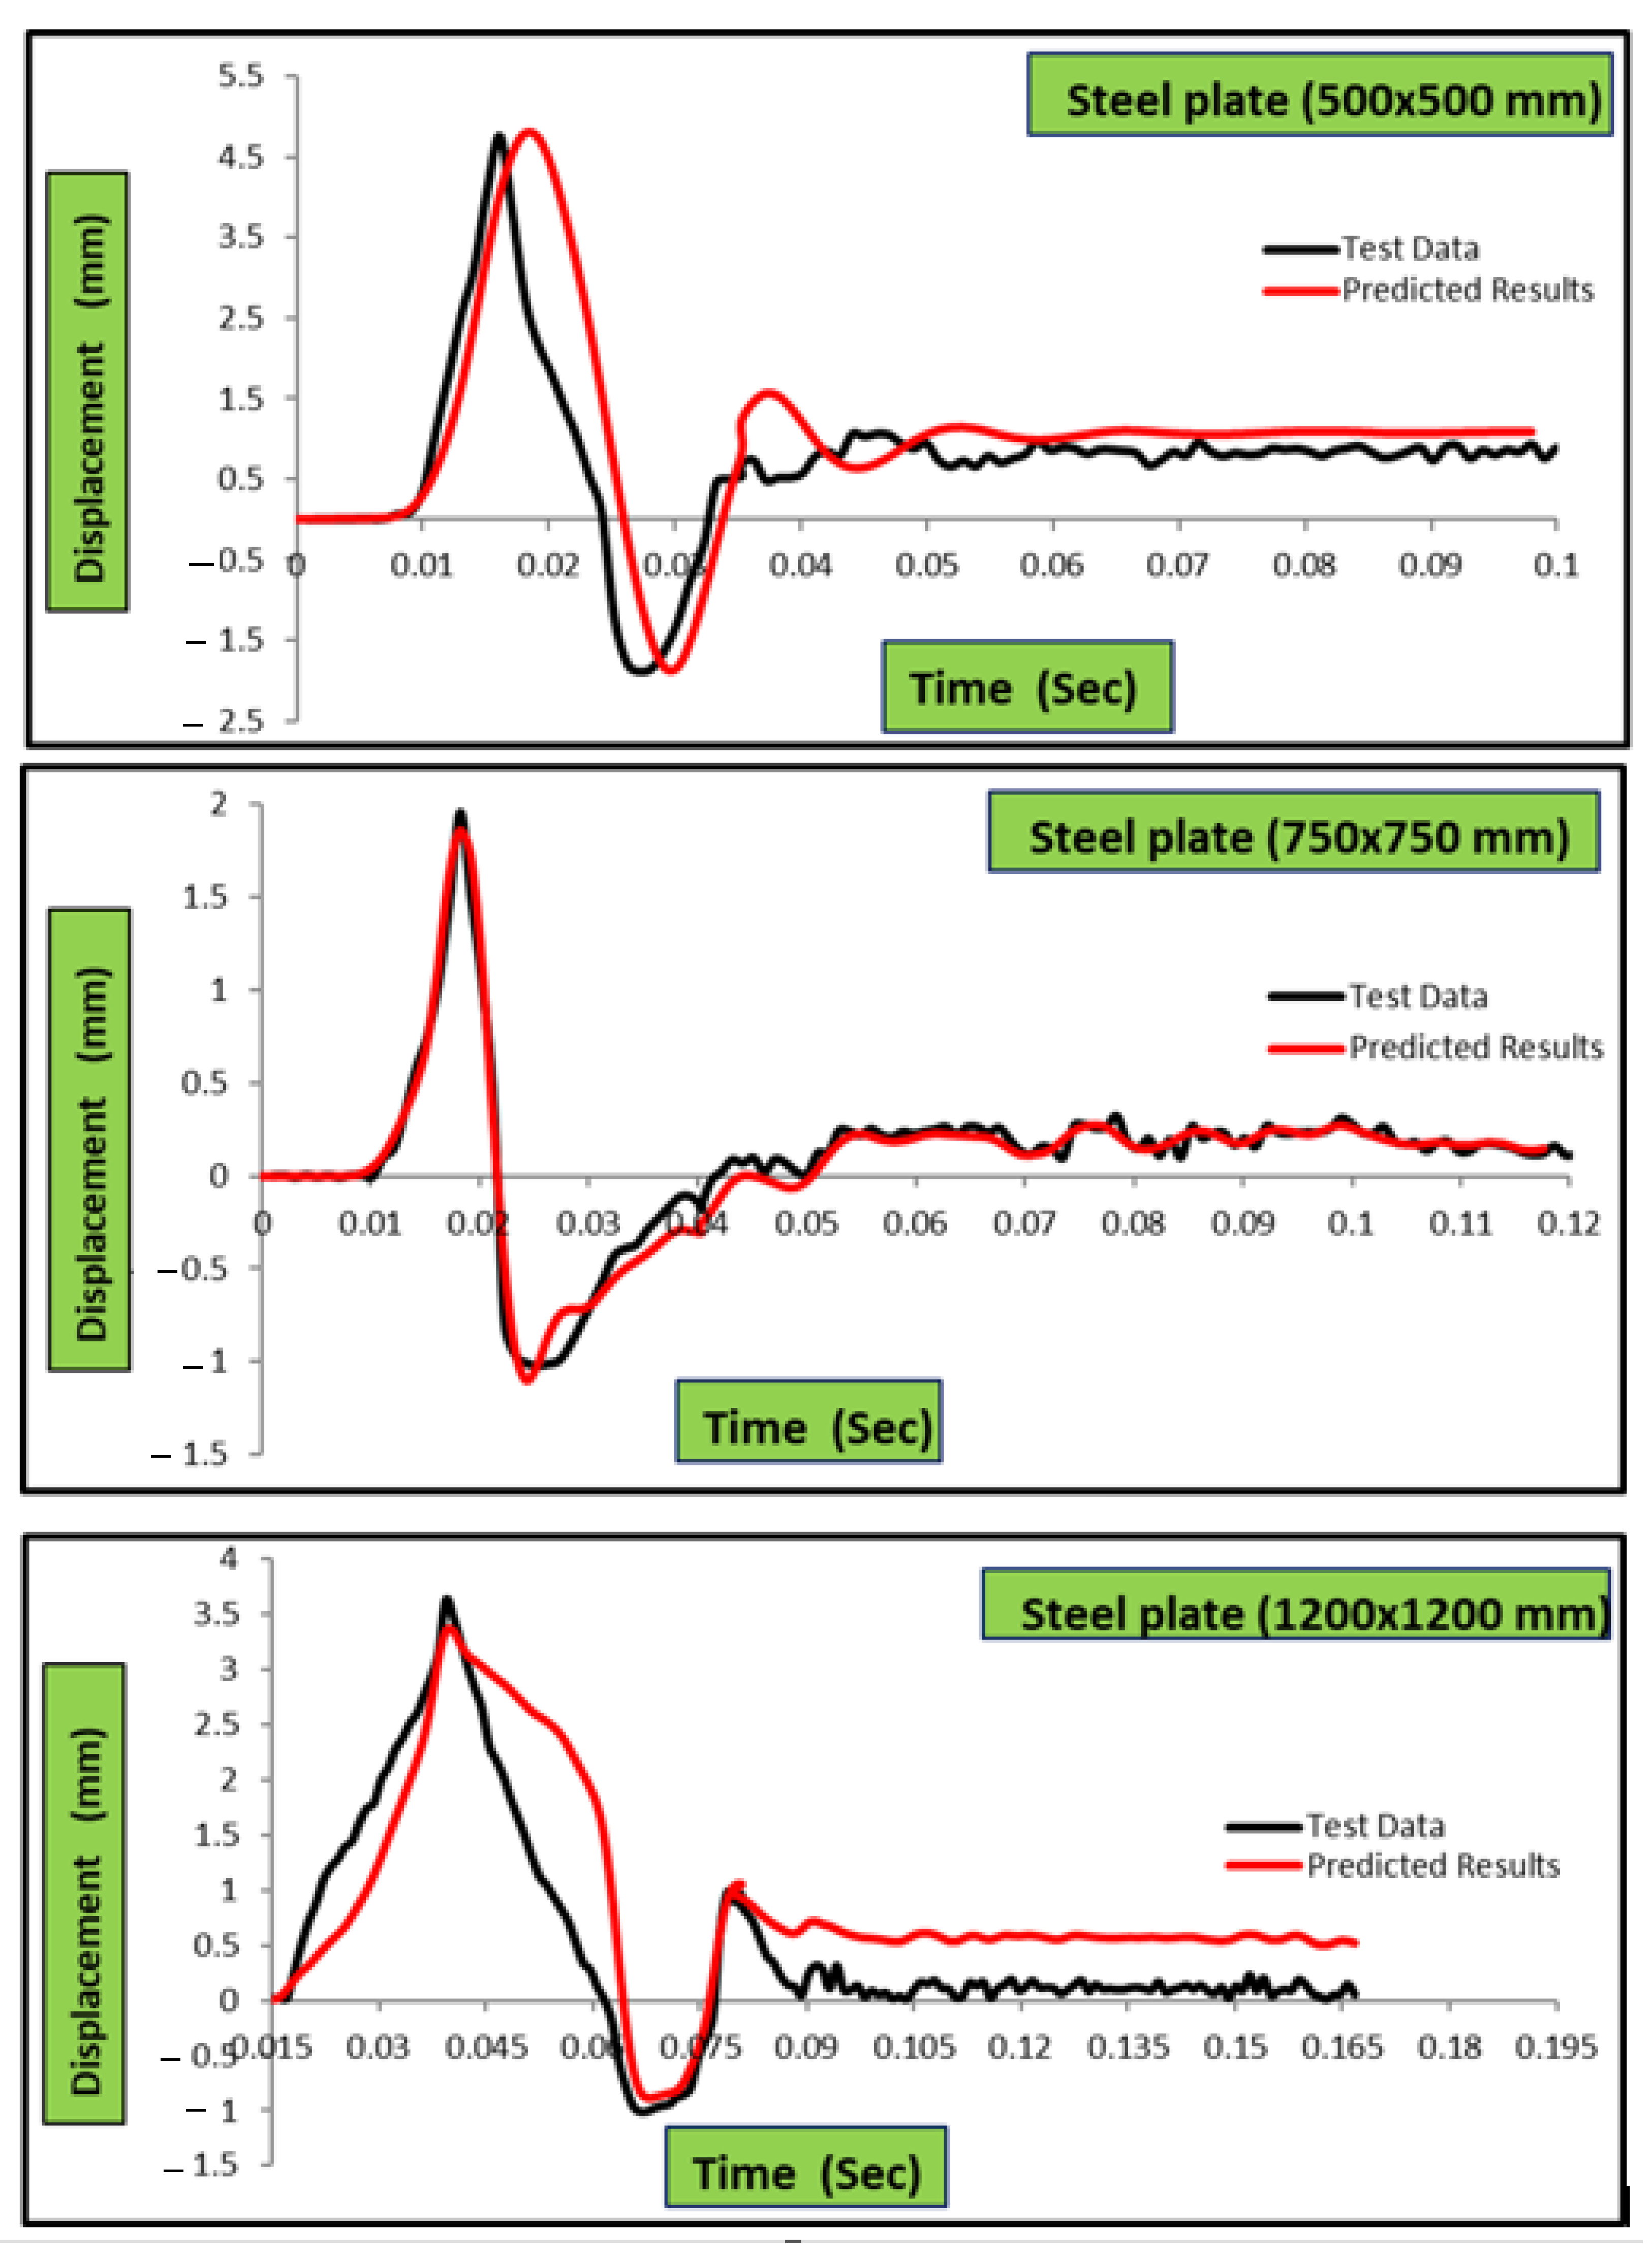
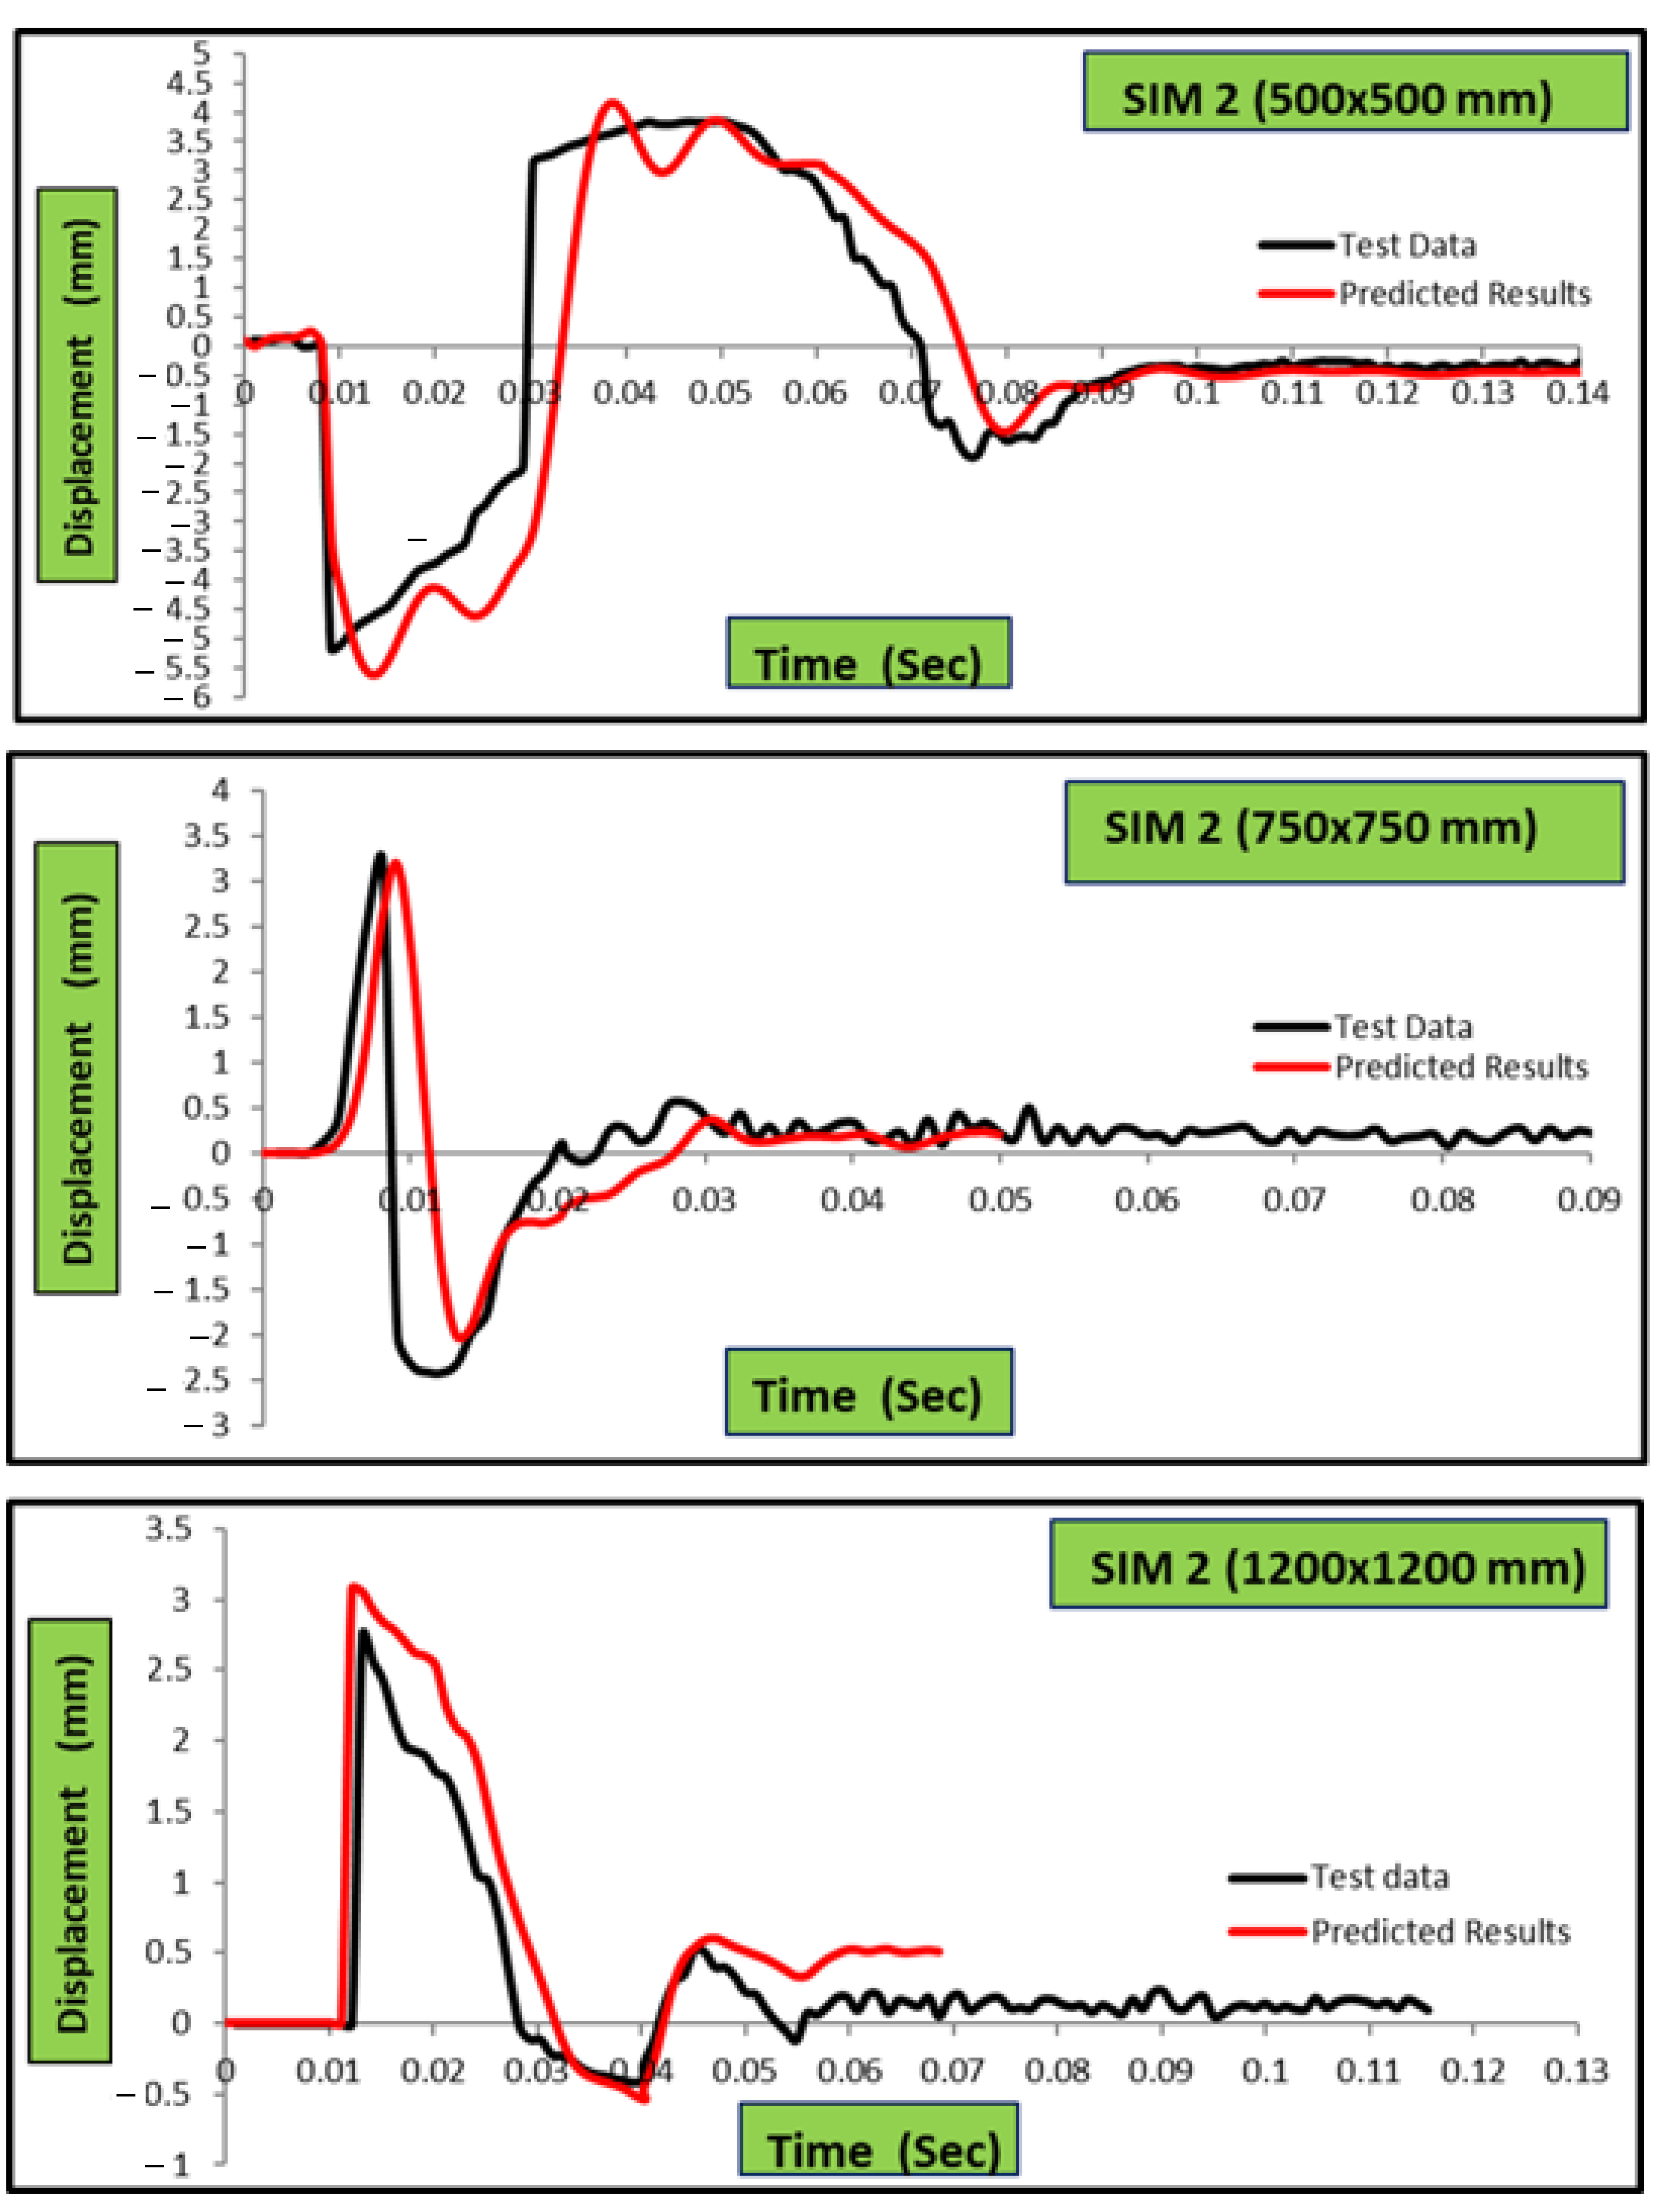
- The numerically obtained curves of the time history did not differ much from the experimentally obtained ones. Meanwhile, the numerically obtained maximal impact force was less than the experimentally obtained values. Regarding the reaction force, the time and deflection histories did not indicate any significant differences in shape.
- (c)
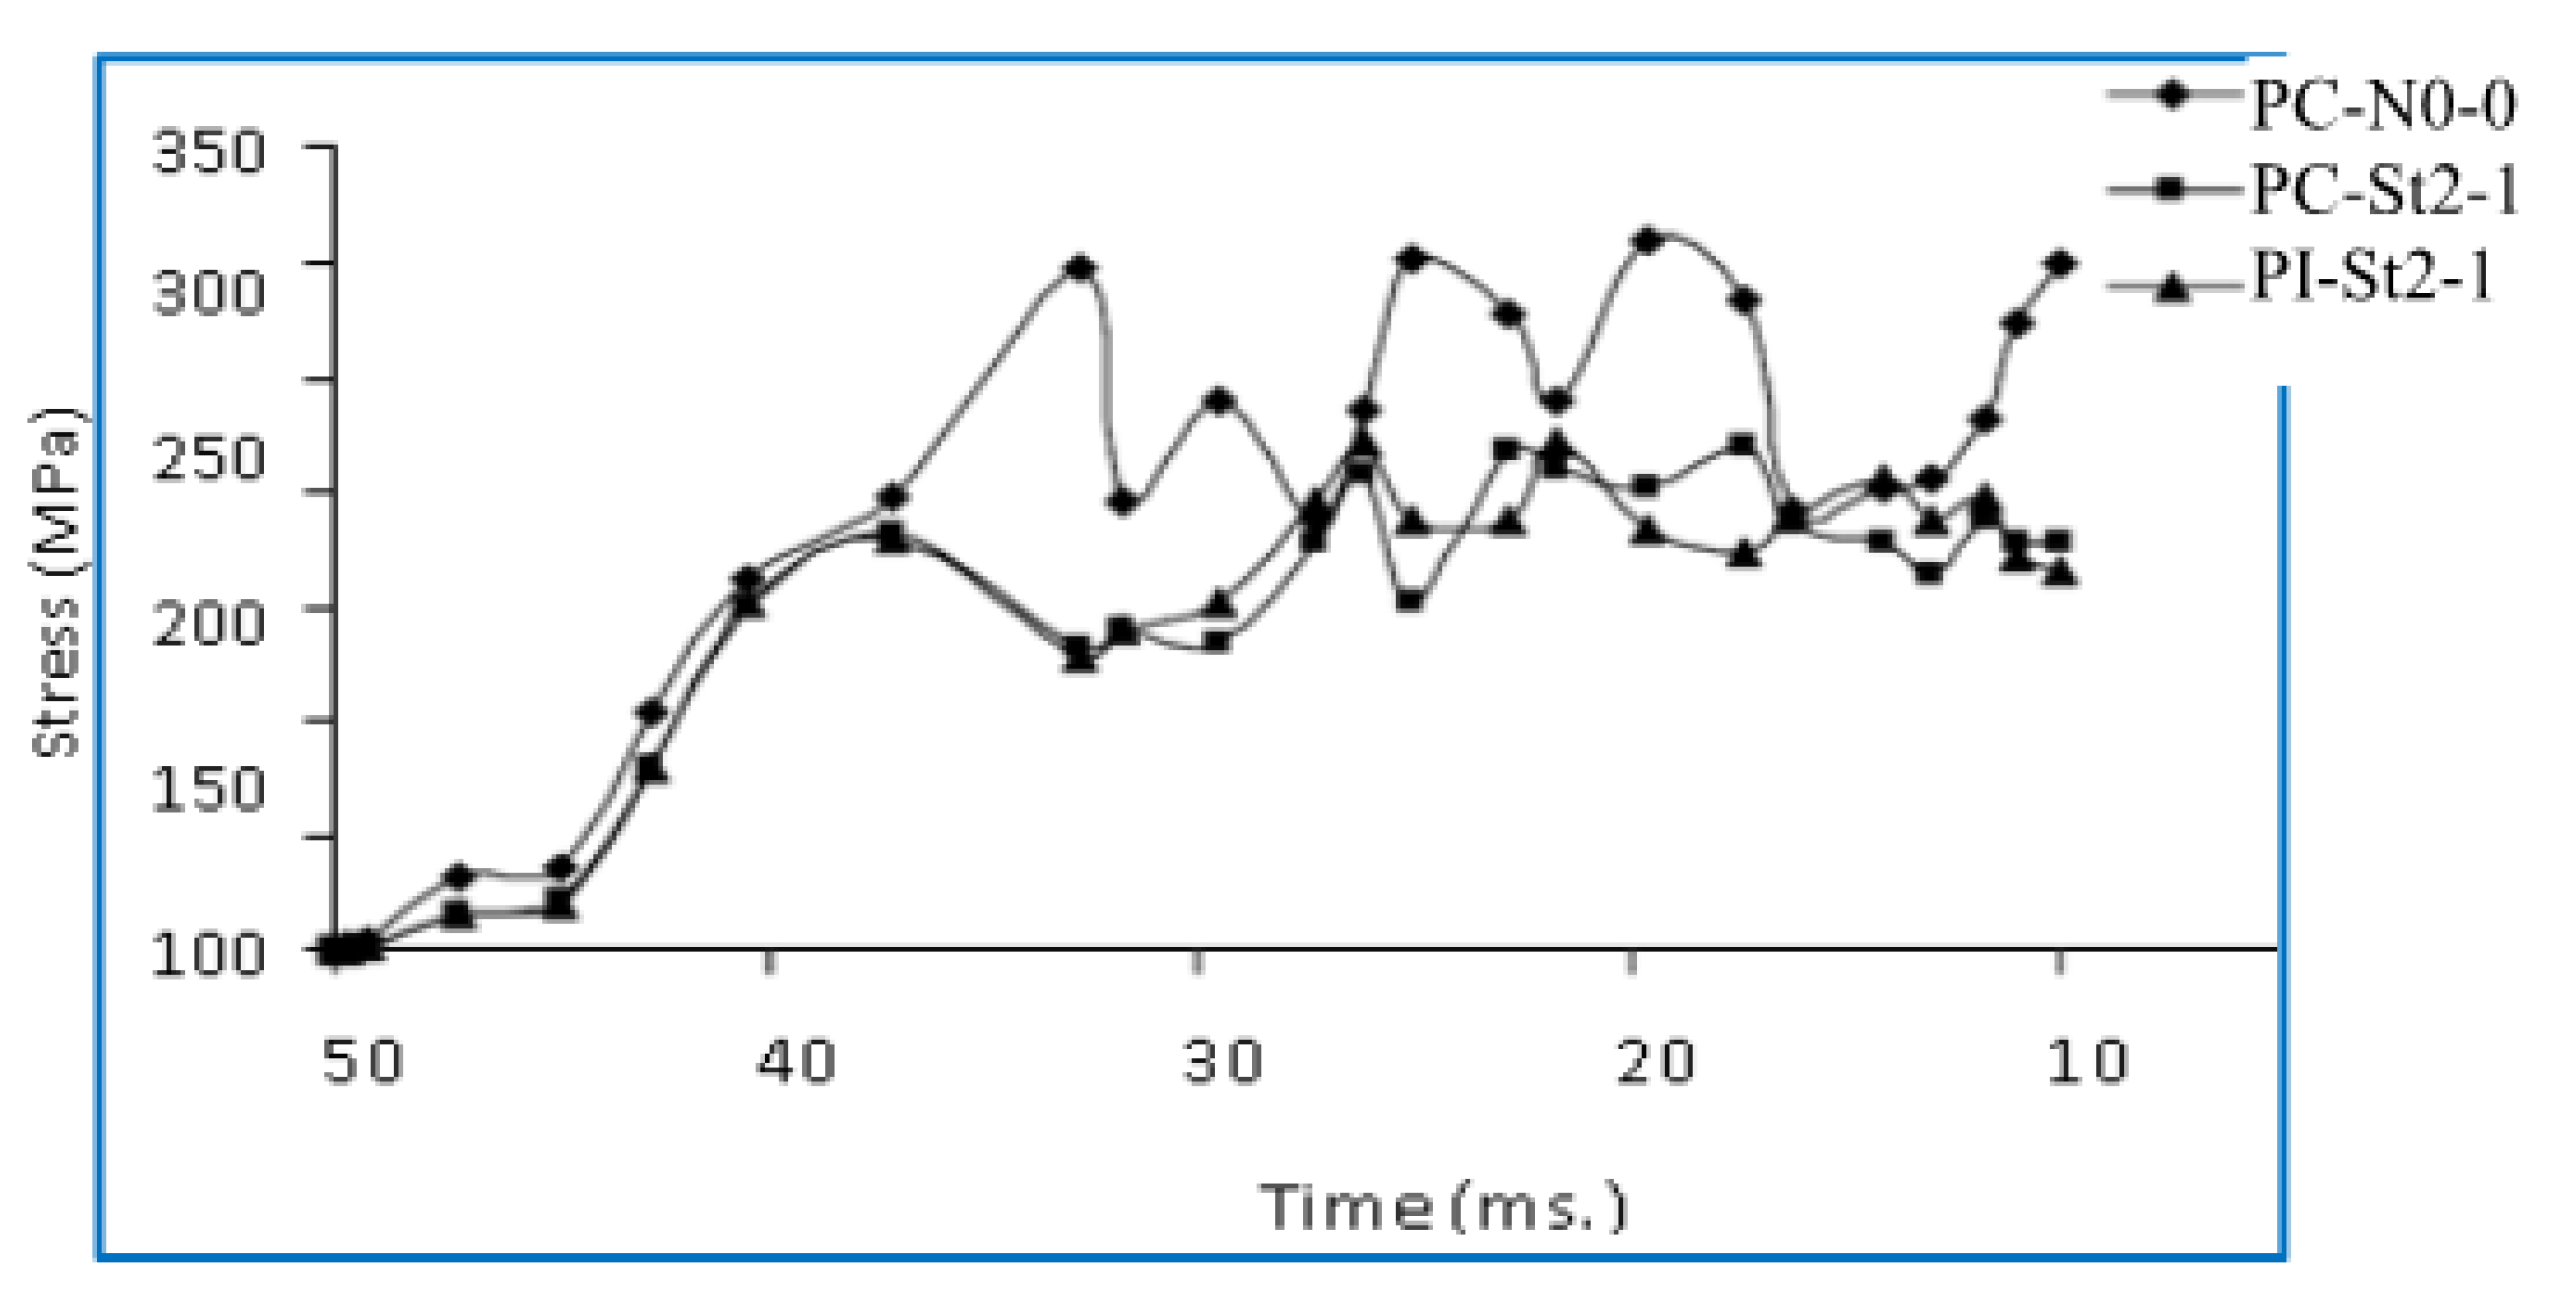
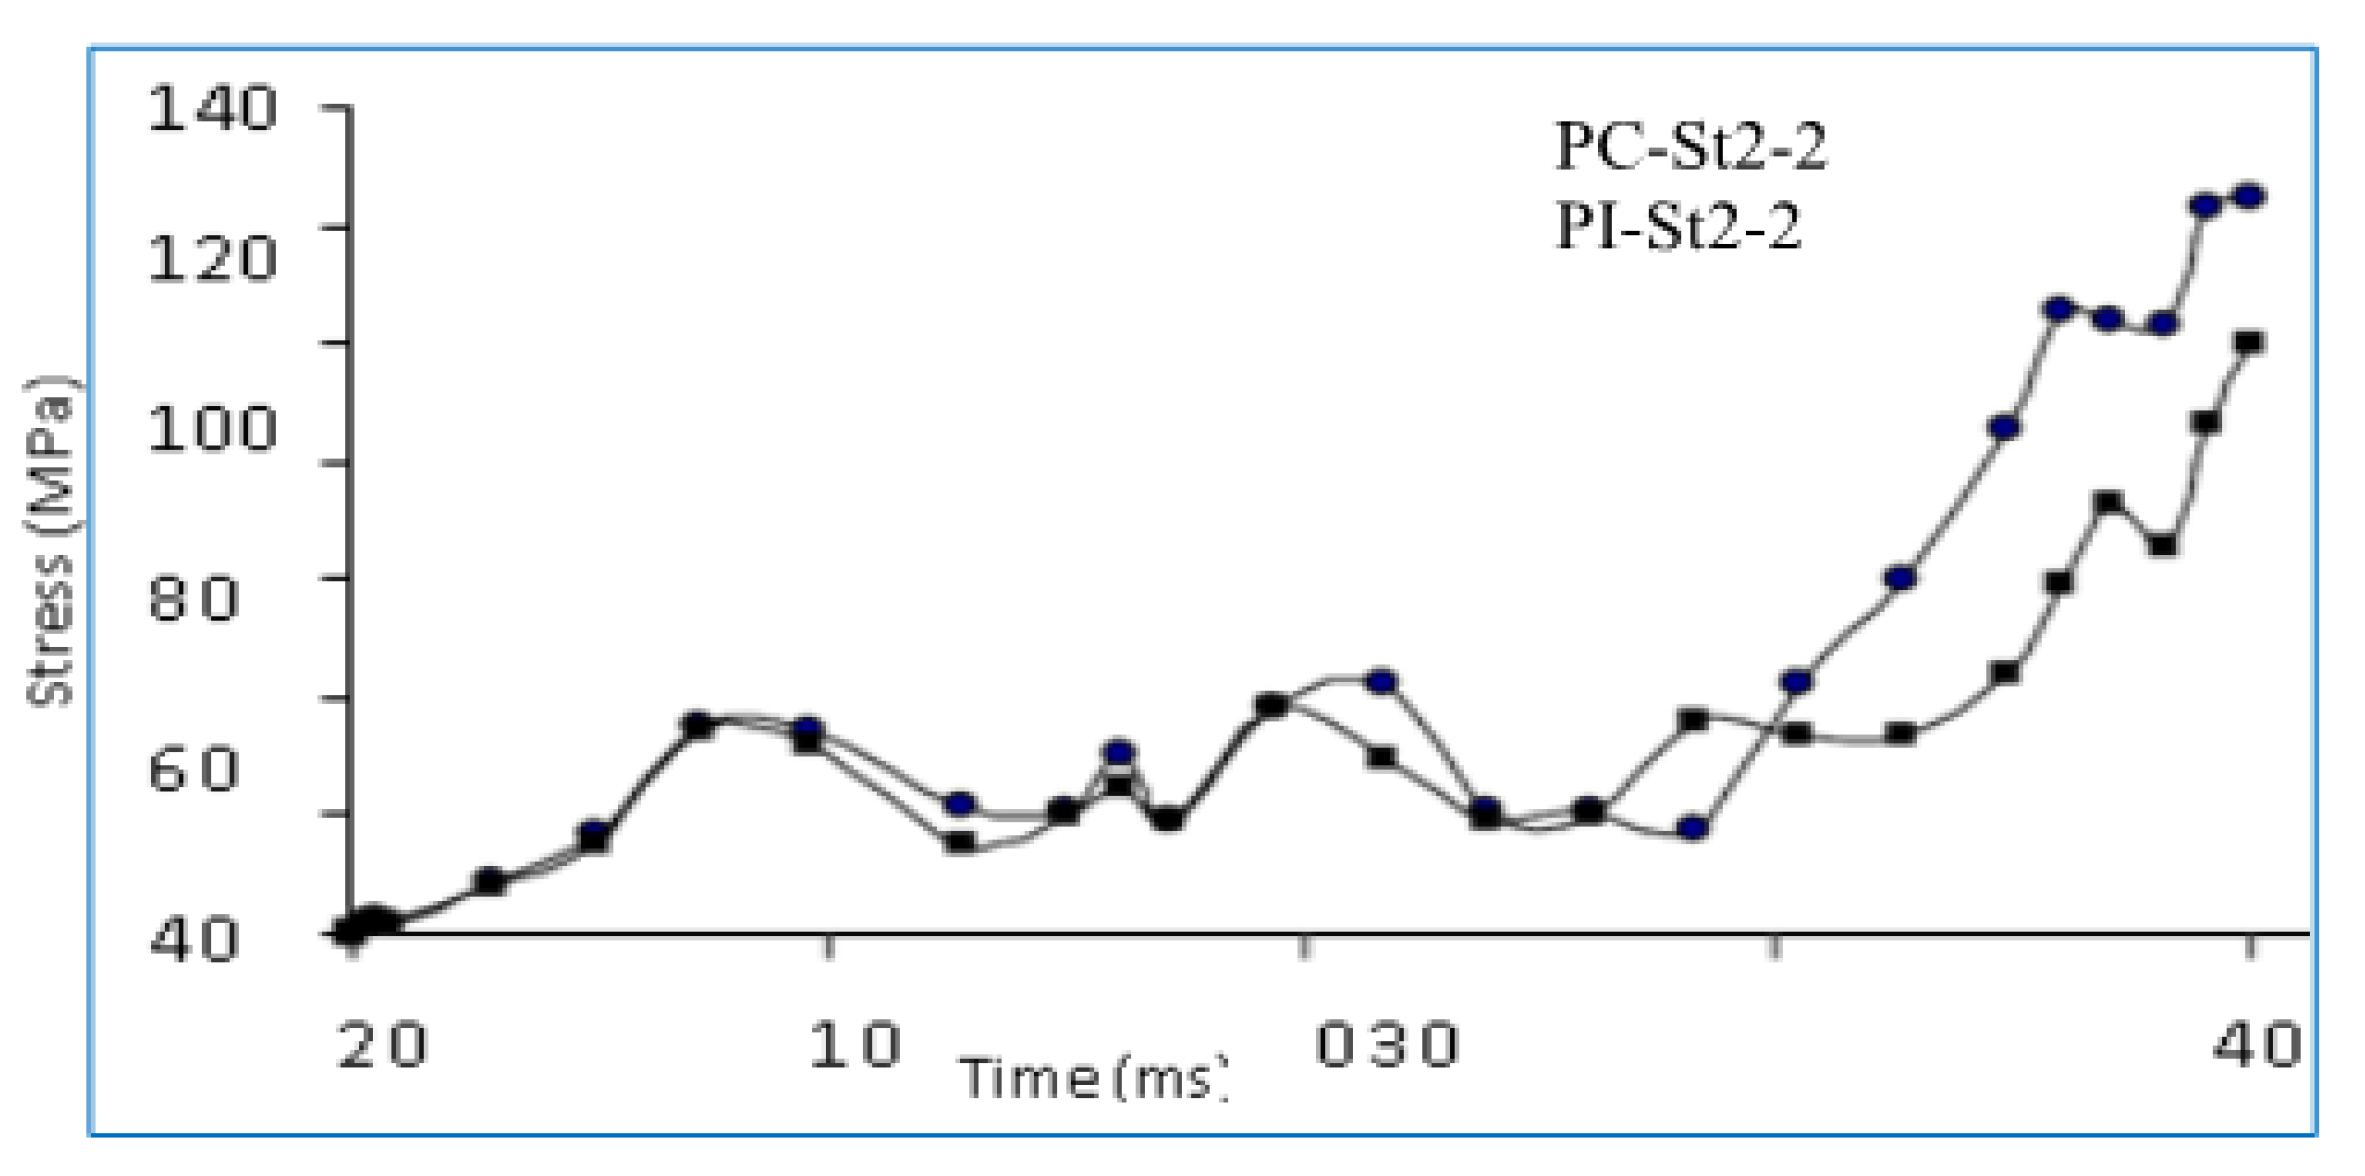
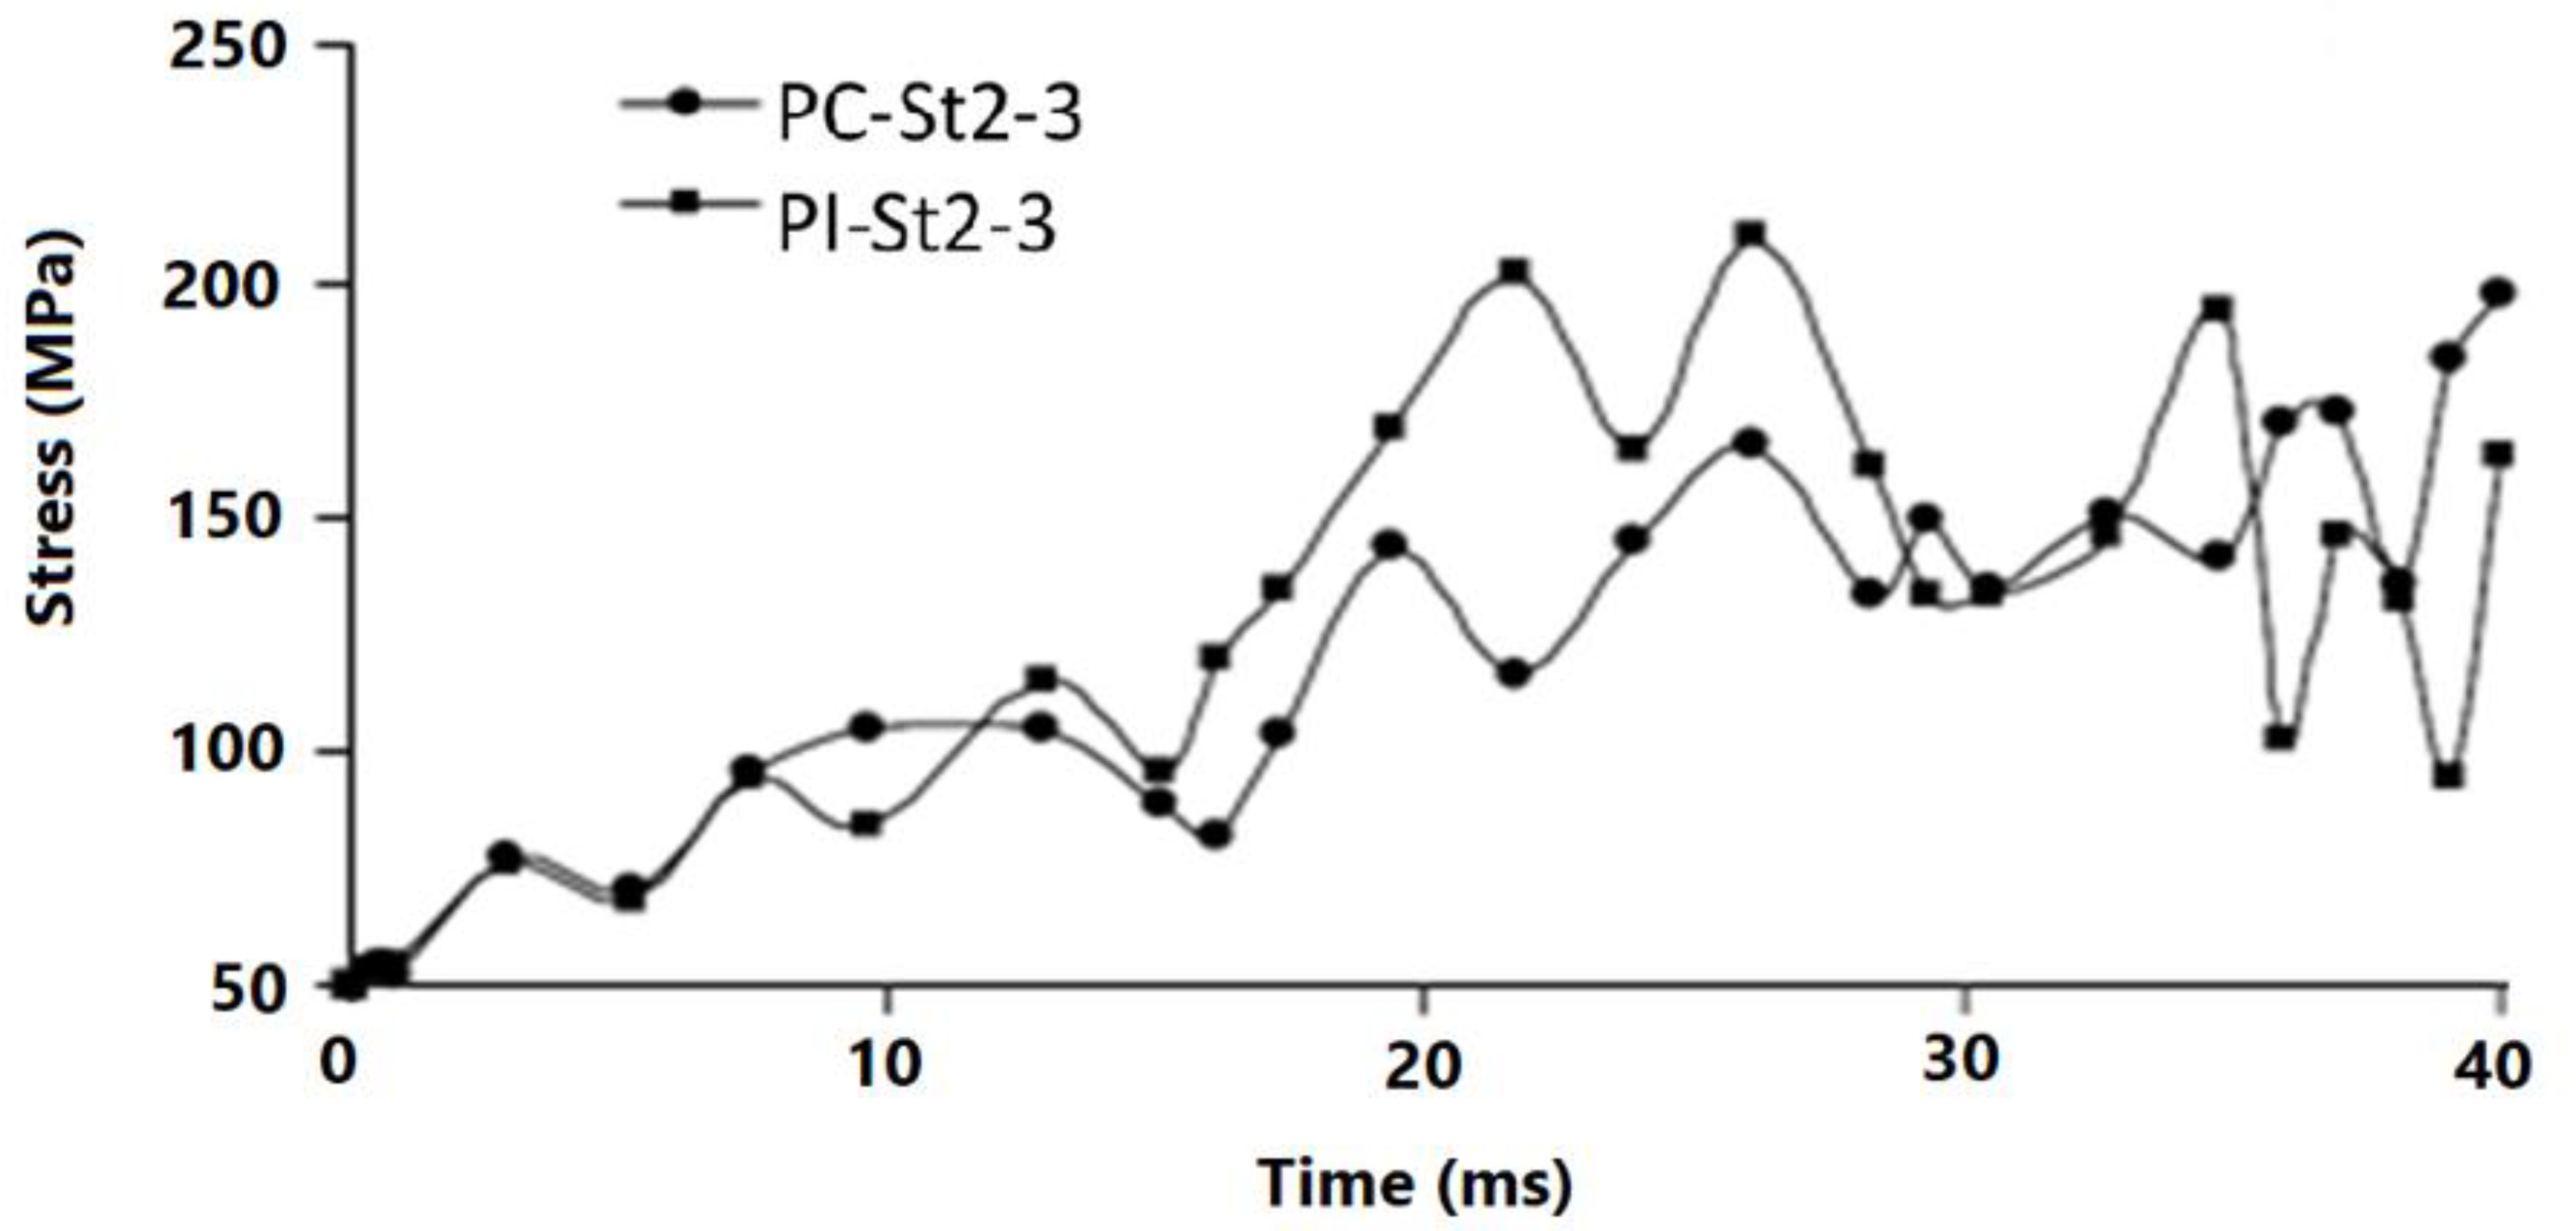
- The impact tests indicate the significance of the inertia forces. Based on the force-time history of the test, the impact force appears to undergo resistance throughout the inertial force of SIMCON plates initially. The forces that are created at the supports tend to increase in prominence during the post-impact stage, reaching their equilibrium. In addition, the measurements indicate great similarities in terms of reaction force, yet there are variations in terms of impact force and magnitude-to-mass times acceleration values.
- (d)
- The deflection of strengthened specimens is found to be less than the values obtained for the control specimens. The deflection rates between the strengthened control specimens in percentages are found to be between (43–57%) of the control specimens.
- (e)
- It has been observed that the increase in steel plate size results in an increase in the total slab stiffness. The essential parameter that influences the overall results of slab specimens strengthened with steel plates is the suitable location of the steel plates.
- (f)
- The stiffness of slabs strengthening with SIMCON is relatively higher than slabs strengthened with steel plates. Moreover, the axial load-displacement relation indicates that all the numerical models present a stiffer behavior than experimental axial load-displacement relations. The experimentally and numerically obtained results show how the slabs strengthened with 20 mm; SIMCON provided higher results than slabs strengthened with steel plates.
- (g)
- The strain gauges of SIMCON-strengthened slabs indicate that negative values were obtained at the bottom face strains during impact; meanwhile, the top surface strains obtained positive values. This could indicate that the slabs tend to show deflection upwards during impact, eventually causing compression on the bottom surface as opposed to the tension on top during the impact.
- (h)
- The strengthening technique used in the experiment led to a significant improvement in slab impact behavior. The ABAQUS FE analysis software is used for the verification of the obtained test results, whereby the specimens are simulated numerically. Despite the differences in results, it can be stated that numerically simulating the specimens has reduced the working load significantly, guiding the researchers with regard to the behavior of structural members under impact loading.
- (i)
- The SIMCON strengthening resulted in a considerable decrease in maximal slab displacement value due to impact. The crack width and quantity decreased significantly, especially lower for steel plate-strengthened slabs in all cases.
- (j)
- The increase in the area of SIMCON from 500 × 500 mm to 1200 × 1200 mm reduced the maximal displacement value of the test specimens. The results indicate that full-scale SIMCON-strengthened plates have remarkably lower damage rates under impact energy levels, withstanding higher impact energy values.
- (k)
- A significant reduction is found for SIMCON and steel plate-strengthened RC slabs. As for the residual displacement values, they represent the plastic deformation caused to the test specimens via impact loading.
- (l)
- Significant improvements have been observed in the impact behavior of slab specimens in light of the experimentally strengthened techniques used. Full-scale 30 mm SIMCON strengthening showed the highest performance.
- (m)
- The use of local, externally bonded steel and SIMCON plates to strengthen reinforced slabs against punching shear has proven the tensile face to be efficient.
- (n)
- As for the improvement of slab punching shear capacities, the bonding technique is found to be more efficient than the thickness of steel plates. Moreover, using SIMCON strengthening indicated a larger enhancement of punching shear strength than steel plates.
- (o)
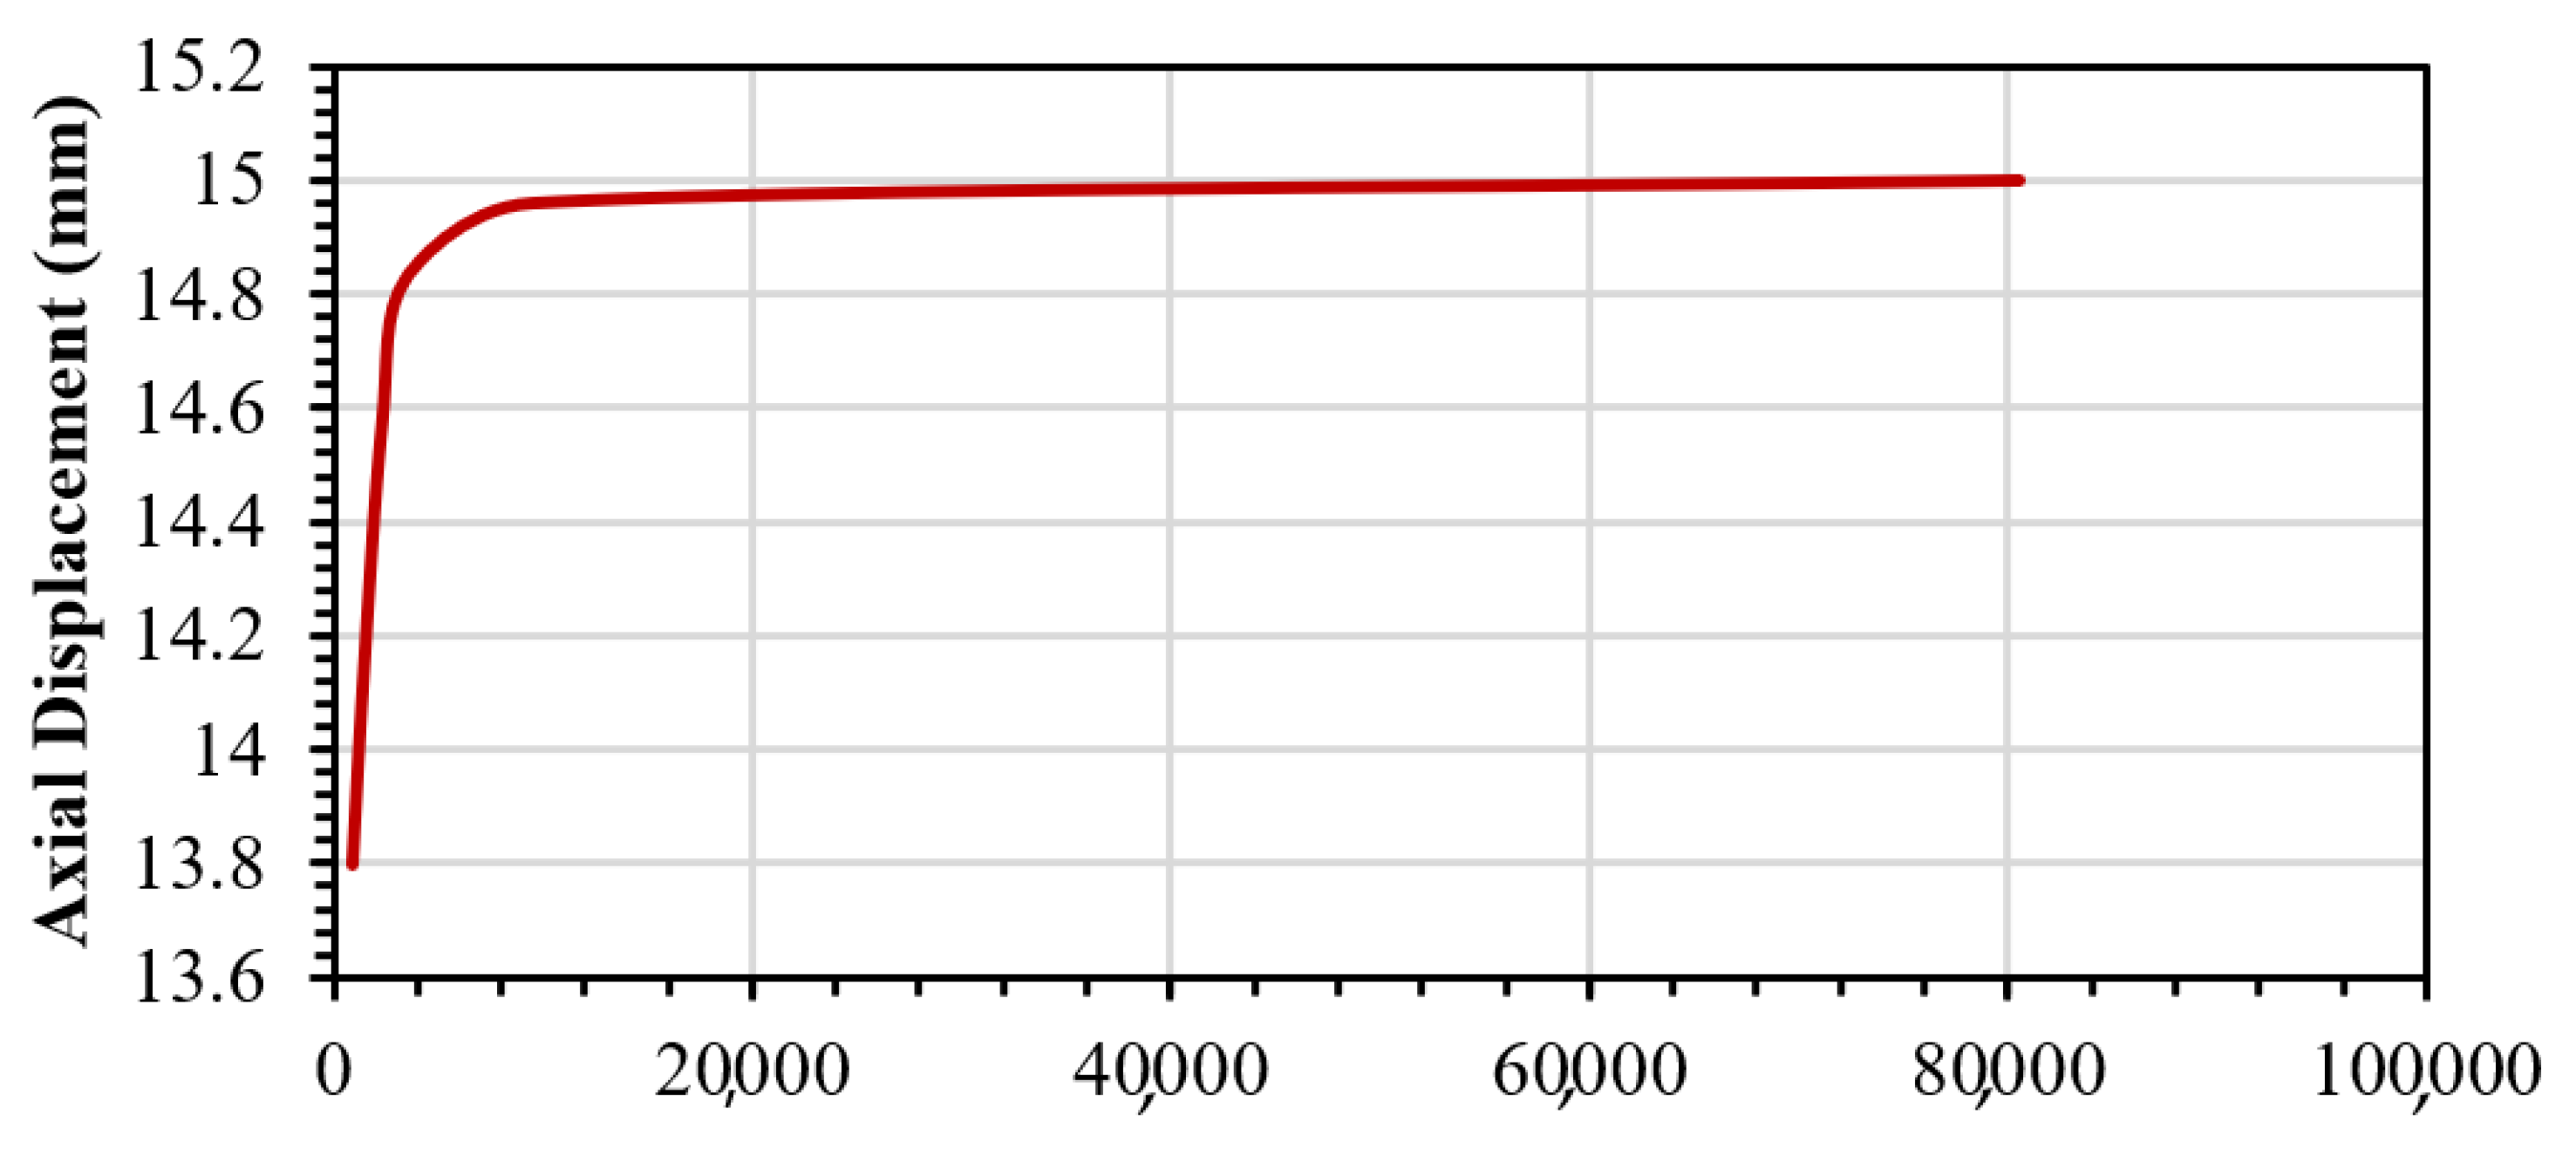
- From the effect of strengthening type and thickness of SIMCON on the displacement of experimental tests and FE analysis of slabs over time, it is found that the numerically predicted ultimate axial deformations are lower than the observed values, having an average experimental-to-numerical ratio of (1.024). It is also found that the displacement-time history is affected slightly by the thickness of SIMCON, but it is very clear when comparing the use of the strengthening types.
Author Contributions
Funding
Data Availability Statement
Conflicts of Interest
References
- Alexander, M.; Beushausen, H. Durability, service life prediction, and modelling for reinforced concrete structures–review and critique. Cem. Concr. Res. 2019, 122, 17–29. [Google Scholar] [CrossRef]
- Kadhim, A.; Sadique, M.; Al-Mufti, R.; Hashim, K. Long-term performance of novel high-calcium one-part alkali-activated cement developed from thermally activated lime kiln dust. J. Build. Eng. 2020, 32, 101766. [Google Scholar] [CrossRef]
- Kadhum, M.M.; M. Harbi, S.; S. Khamees, S.; Abdulraheem, M.S.; Farsangi, E.N. Punching shear behavior of flat slabs utilising reactive powder concrete with and without flexural reinforcement. Pract. Period. Struct. Des. Constr. 2021, 26, 04020060. [Google Scholar] [CrossRef]
- Shubbar, A.A.; Sadique, M.; Shanbara, H.K.; Hashim, K. The Development of a New Low Carbon Binder for Construction as an Alternative to Cement. In Advances in Sustainable Construction Materials and Geotechnical Engineering, 1st ed.; Springer: Berlin/Heidelberg, Germany, 2020; pp. 205–213. [Google Scholar]
- Shubbar, A.A.; Nasr, M.S.; Islam, G.M.S.; Al-Khafaji, Z.S.; Sadique, M.; Hashim, K.; Assi, L.N. Early Age and Long-term Mechanical Performance of Mortars Incorporating High-volume GGBS. In Proceedings of the Advances in Civil Engineering: Select Proceedings of ICACE, Singapore, 31st October 2022; pp. 267–274.
- Majdi, H.S.; Shubbar, A.; Nasr, M.S.; Al-Khafaji, Z.S.; Jafer, H.; Abdulredha, M.; Masoodi, Z.A.; Sadique, M.; Hashim, K. Experimental data on compressive strength and ultrasonic pulse velocity properties of sustainable mortar made with high content of GGBFS and CKD combinations. Data Brief 2020, 31, 105961–105972. [Google Scholar] [CrossRef] [PubMed]
- Shubbar, A.A.; Sadique, M.; Nasr, M.S.; Al-Khafaji, Z.S.; Hashim, K.S. The impact of grinding time on properties of cement mortar incorporated high volume waste paper sludge ash. Karbala Int. J. Mod. Sci. 2020, 6, 7. [Google Scholar] [CrossRef]
- Sulyman, M.; Haponiuk, J.; Formela, K. Utilization of recycled polyethylene terephthalate (PET) in engineering materials: A review. Int. J. Environ. Sci. Dev. 2016, 7, 100–108. [Google Scholar] [CrossRef]
- Moffatt, E.G.; Thomas, M.D. Durability of rapid-strength concrete produced with ettringite-based binders. ACI Mater. J. 2018, 115, 105–115. [Google Scholar] [CrossRef]
- Teng, K.H.; Kot, P.; Muradov, M.; Shaw, A.; Hashim, K.; Gkantou, M.; Al-Shamma’a, A. Embedded Smart Antenna for Non-Destructive Testing and Evaluation (NDT&E) of Moisture Content and Deterioration in Concrete. Sensors 2019, 19, 547–559. [Google Scholar]
- Lua, T.W.; Mendis, P.; Ngo, T.; Zhang, L.; Mohotti, D.; Sofi, M. Blast studies on bridges–A state-of-the-art review. Electron. J. Struct. Eng. 2014, 1, 7–19. [Google Scholar] [CrossRef]
- Malak, S.A.; Krstulovic-Opara, N. Micromechanical Tensile Behavior of Slurry Infiltrated Mat Concrete with Inclined Fibers. ACI Mater. J. 2019, 116, 69–80. [Google Scholar]
- Khamees, S.S.; Kadhum, M.M.; Alwash, N.A. Experimental and numerical investigation on the axial behavior of solid and hollow SIFCON columns. SN Appl. Sci. 2020, 2, 1094. [Google Scholar] [CrossRef]
- Zareei, S.A.; Ameri, F.; Bahrami, N.; Shoaei, P.; Musaeei, H.R.; Nurian, F. Green high strength concrete containing recycled waste ceramic aggregates and waste carpet fibers: Mechanical, durability, and microstructural properties. J. Build. Eng. 2019, 26, 100914. [Google Scholar] [CrossRef]
- Khamees, S.S.; Kadhum, M.M.; Alwash, N.A. Effect of hollow ratio and cross-section shape on the behavior of hollow SIFCON columns. J. King Saud Univ. -Eng. Sci. 2021, 33, 166–175. [Google Scholar] [CrossRef]
- Hashim, A.M.; Kadhum, M.M. Numerical and experimental study of postfire behavior of concentrically loaded SIFCON columns. ACI Struct. J. 2021, 118, 73–86. [Google Scholar]
- Khamees, S.S.; Kadhum, M.M.; Nameer, A.A. Effects of steel fibers geometry on the mechanical properties of SIFCON concrete. Civ. Eng. J. 2020, 6, 21–33. [Google Scholar] [CrossRef]
- Hackman, L.E.; Farrell, M.B.; Dunham, O.O. Slurry infiltrated mat concrete (SIMCON). Concr. Int. 1992, 14, 53–56. [Google Scholar]
- Krstulovic-Opara, N.; Malak, S. Tensile behavior of slurry infiltrated mat concrete (SIMCON). Mater. J. 1997, 94, 39–46. [Google Scholar]
- Yas, M.H.; Kadhum, M.M.; Al-Dhufairi, W.G. Development of an Engineered Slurry-Infiltrated Fibrous Concrete: Experimental and Modelling Approaches. Infrastructures 2023, 8, 19. [Google Scholar] [CrossRef]
- Subramani, T.; Senthilkumar, M. Finite element analysis of RC beams with externally bonded SIMCON laminates by using ANSYS. Int. J. Appl. Or Innov. Eng. Manag. (IJAIEM) 2016, 5, 148–155. [Google Scholar]
- Krstulovic-Opara, N.; Al-Shannag, M.J. Compressive Behavior of Slurry Infiltrated Mat Concrete (SIMCON). Mater. J. 1999, 96, 367–377. [Google Scholar]
- Gilani, A.M. Various Durability Aspects of Slurry Infiltrated Fiber Concrete. Ph.D. Thesis, Middle East Technical University, Ankara, Turkey, 2007. [Google Scholar]
- Mohsin, M.S.; Alwash, N.A.; Kadhum, M.M. Structural behavior of reinforced concrete beams with out of plane part. Case Stud. Constr. Mater. 2021, 15, e00767. [Google Scholar] [CrossRef]
- Krstulovic-Opara, N. SIMCON—A Novel High Performance Fiber-Mat Reinforced Cement Composite for Repair, Retrofit and New Construction. In Proceedings of the Materials for the New Millennium, New York, NY, USA, 10–14 November 1996; pp. 288–297. [Google Scholar]
- Ahmed, H.U.; Faraj, R.H.; Hilal, N.; Mohammed, A.A.; Sherwani, A.F.H. Use of recycled fibers in concrete composites: A systematic comprehensive review. Compos. Part B Eng. 2021, 215, 108769. [Google Scholar] [CrossRef]
- Balamuralikrishnan, R.; Jeyasehar, C.A. Experimental Investigation of RC Beams Retrofitted with Externally Bonded SIMCON Laminates. IUP J. Struct. Eng. 2009, 2, 32–46. [Google Scholar]
- Harris, D.K. Characterization of Punching Shear Capacity of Thin UHPC Plates. Ph.D. Thesis, Virginia Tech. University, Blacksburg, VA, USA, 2004. [Google Scholar]
- Elbakry, H.M.; Allam, S.M. Punching strengthening of two-way slabs using external steel plates. Alex. Eng. J. 2015, 54, 1207–1218. [Google Scholar] [CrossRef]
- Zhang, J.; Teng, J.; Wong, Y.; Lu, Z. Behavior of two-way RC slabs externally bonded with steel plate. J. Struct. Eng. 2001, 127, 390–397. [Google Scholar] [CrossRef]
- Sim, J.; Oh, H. Structural improvement of strengthened deck panels with externally bonded plates. Cem. Concr. Res. 2005, 35, 1420–1429. [Google Scholar] [CrossRef]
- Adhikary, S.D.; Li, B.; Fujikake, K. Residual resistance of impact-damaged reinforced concrete beams. Mag. Concr. Res. 2015, 67, 364–378. [Google Scholar] [CrossRef]
- Saatci, S.; Vecchio, F.J. Effects of shear mechanisms on impact behavior of reinforced concrete beams. ACI Struct. J. 2009, 106, 78–87. [Google Scholar]
- Batarlar, B. Behavior of Reinforced Concrete Slabs Subjeted to Impact Loads. Master’s Thesis, Izmir Institute of Technology, Gülbahçe, Turkey, 2013. [Google Scholar]
- Mohsin, M.S.; Alwash, N.A.; Kadhum, M.M. Comparative Study on Structural Behavior of Reinforced Concrete Straight Beam and Beams with out of Plane Parts. Int. J. Eng. 2021, 34, 2280–2293. [Google Scholar]
- Mahdi, Z.H.; Kadhum, M.M.; Abdulghani, M.R.; Abdulghani, G.R.; Hwaiai, D.A. Investigation about the Optimum Alternative of Polypropylene Fibers in Conventional Concrete. J. Eng. Sci. Technol. 2022, 17, 2658–2670. [Google Scholar]
- Sabar, A.H.A.; Kadhum, M.M. Strengthening of fire damaged, light weight, high strength reinforced concrete beam using SIFCON jacket. Period. Eng. Nat. Sci. 2022, 10, 587–606. [Google Scholar]
- Khalil, W.; Al-Daebal, T. Engineering Properties of Sustainable Self-Compacting Concrete With Clay Bricks Waste Aggregate. Kufa J. Eng. 2018, 9, 223–237. [Google Scholar] [CrossRef]
- Robertson, I.N.; Durrani, A.J. Gravity load effect on seismic behavior of interior slab-column connections. Struct. J. 1993, 89, 37–45. [Google Scholar]
- Marzouk, H.; Osman, M.; Hussein, A. Cyclic loading of high-strength lightweight concrete slabs. Struct. J. 2001, 98, 207–214. [Google Scholar]
- Ali, A.S.; Riyadh, Z. Experimental and Numerical Study on the Effects of Size and type of Steel Fibers on the (SIFCON) Concrete Specimens. Int. J. Appl. Eng. Res. 2018, 13, 1344–1353. [Google Scholar]
- American Concrete Institute (ACI). Specifications for Structural Concrete for Buildings; ACI: Farmington Hills, MI, USA, 2014. [Google Scholar]
- British Standards Institution (BSI). Code of Practice for Design and Construction: BS 8110; BSI: London, UK, 1985. [Google Scholar]
- Eurocode. Design of Concrete Structures—Part 1: General Rules and Rules for Buildings; Department of Communities and Local Government: London, UK, 2004. [Google Scholar]
- Simulia, D.S. Abaqus 6.14 CAE User Guide; Dassault Systèmes Simulia Corp.: Providence, RI, USA, 2015. [Google Scholar]
- Anil, Ö.; Durucan, C.; Erdem, R.T.; Yorgancilar, M.A. Experimental and numerical investigation of reinforced concrete beams with variable material properties under impact loading. Constr. Build. Mater. 2016, 125, 94–104. [Google Scholar] [CrossRef]
- Vamvatsikos, D.; Cornell, C.A. Incremental dynamic analysis. Earthq. Eng. Struct. Dyn. 2002, 31, 491–514. [Google Scholar] [CrossRef]
- Li, C.; Hao, H.; Bi, K. Numerical study on the seismic performance of precast segmental concrete columns under cyclic loading. Eng. Struct. 2017, 148, 373–386. [Google Scholar] [CrossRef]
- Birtel, V.; Mark, P. Parameterised finite element modelling of RC beam shear failure. In Proceedings of the ABAQUS Users’ Conference, Providence, RI, USA, 23–25 May 2006. [Google Scholar]
- Lubliner, J.; Oliver, J.; Oller, S.; Oñate, E. A plastic-damage model for concrete. Int. J. Solids Struct. 1989, 25, 299–326. [Google Scholar] [CrossRef]
- Lee, J.; Fenves, G.L. Plastic-damage model for cyclic loading of concrete structures. J. Eng. Mech. 1998, 124, 892–900. [Google Scholar] [CrossRef]
- Mander, J.B.; Priestley, M.J.; Park, R. Theoretical stress-strain model for confined concrete. J. Struct. Eng. 1988, 114, 1804–1826. [Google Scholar] [CrossRef]
- Wang, T.; Hsu, T.T. Non-linear finite element analysis of concrete structures using new constitutive models. Comput. Struct. 2001, 79, 2781–2791. [Google Scholar] [CrossRef]
- Malvar, L.J.; Ross, C.A. Review of strain rate effects for concrete in tension. ACI Mater. J. 1998, 95, 735–739. [Google Scholar]
- Fan, W.; Yuan, W.; Yang, Z.; Fan, Q. Dynamic demand of bridge structure subjected to vessel impact using simplified interaction model. J. Bridge Eng. 2011, 16, 117–126. [Google Scholar] [CrossRef]
- Do, T.V.; Pham, T.M.; Hao, H. Numerical investigation of the behavior of precast concrete segmental columns subjected to vehicle collision. Eng. Struct. 2018, 156, 375–393. [Google Scholar] [CrossRef]
- Sha, Y.; Hao, H. Laboratory tests and numerical simulations of barge impact on circular reinforced concrete piers. Eng. Struct. 2013, 46, 593–605. [Google Scholar] [CrossRef]
- Zangeneh Kamali, A. Shear Strength of Reinforced Concrete Beams Subjected to Blast Loading: Non-Linear Dynamic Analysis. Master’s Thesis, Royal Institute of Technology (KTH), Stockholm, Sweden, 2012. [Google Scholar]
- Demir, A.; Caglar, N.; Ozturk, H.; Sumer, Y. Non-linear finite element study on the improvement of shear capacity in reinforced concrete T-Section beams by an alternative diagonal shear reinforcement. Eng. Struct. 2016, 120, 158–165. [Google Scholar] [CrossRef]
- Zhu, H.; Stephens, M.T.; Roeder, C.W.; Lehman, D.E. Inelastic response prediction of CFST columns and connections subjected to lateral loading. J. Constr. Steel Res. 2017, 132, 130–140. [Google Scholar] [CrossRef]
- Obaidat, Y.T.; Heyden, S.; Dahlblom, O. The effect of CFRP and CFRP/concrete interface models when modelling retrofitted RC beams with FEM. Compos. Struct. 2010, 92, 1391–1398. [Google Scholar] [CrossRef]
- Hashim, A.M.; Kadhum, M.M. Compressive strength and elastic modulus of slurry infiltrated fiber concrete (SIFCON) at high temperature. Civ. Eng. J. 2020, 6, 265–275. [Google Scholar] [CrossRef]
- Abbas, A.S.; Kadhum, M.M. Impact of fire on mechanical properties of slurry infiltrated fiber concrete (SIFCON). Civ. Eng. J. 2020, 6, 12–23. [Google Scholar] [CrossRef]


| Summary of Specimens | Type of Loading | ||||||
|---|---|---|---|---|---|---|---|
| Cyclic | Impact | ||||||
| Type | Dimensions | 500 × 500 | 750 × 750 | 1200 × 1200 | 500 × 500 | 750 × 750 | 1200 × 1200 |
| Steel | 2 mm | PC-St2-1 | PC-St2-2 | PC-St2-3 | PI-St2-1 | PI -St2-2 | PI -St2-3 |
| 4 mm | PC-St4-1 | PC-St4-1 | PC-St4-1 | PI -St4-1 | PI -St4-1 | PI -St4-1 | |
| SIMCON | 20 mm | PC-SIM20-1 | PC-SIM20-2 | PC-SIM20-3 | PI -SIM20-1 | PI -SIM20-2 | PI -SIM20-3 |
| 30 mm | PC-SIM30-1 | PC-SIM30-2 | PC-SIM30-3 | PI -SIM30-1 | PI -SIM30-2 | PI -SIM30-3 | |
| Control | PC-N0-0 | PI-N0-0 | |||||
| Concrete | |
| Elastic modulus | 23,500 Mpa |
| Compressive strength | 25 Mpa |
| Tensile stress | 3.12 Mpa |
| Poisson’s ratio | 0.2 |
| ψ | 30 |
| e | 0.1 |
| b0/c0 | 1.16 |
| Kc | 0.6667 |
| 0.0001 | |
| Steel reinforcement | |
| Elastic modulus | 200,000 Mpa |
| Poisson’s ratio | 0.3 |
| Yield stress | 425 Mpa |
| Steel hammer-steel loading plate | |
| Elastic modulus | 200,000 Mpa |
| Poisson’s ratio | 0.3 |
| Parameter | Value |
|---|---|
| K0 | 640 Mpa |
| max | 3 Mpa |
| Gcr | 900 J/m2 |
| = | 1.5 Mpa |
| 90 J/m2 | |
| 900 J/m2 | |
| 900 J/m2 | |
| 1.45 |
| Parameter | Specimen | ||||
|---|---|---|---|---|---|
| PC-N0-0 = 6.35 | PC-St2-1 = 3.87 | PC-St-1 = 3.26 | PC-SIM-20-1 = 2.94 | PC-SIM-30-1 = 2.86 | |
| Test deflection (mm) | 7.24 | 3.91 | 3.42 | 3.22 | 2.87 |
| Normalized deflection (mm) | 7.82 | 3.91 | 3.42 | 3.22 | 2.87 |
| Slab | Load (kN) | Increase Ratio (%) |
|---|---|---|
| PC-N0-0 | 160 | - |
| PC-St2-1 | 190 | 18.75 |
| PC-St4-1 | 200 | 25 |
| PC-SIM20-1 | 200 | 25 |
| PC-SIM30-1 | 220 | 37.5 |
Disclaimer/Publisher’s Note: The statements, opinions and data contained in all publications are solely those of the individual author(s) and contributor(s) and not of MDPI and/or the editor(s). MDPI and/or the editor(s) disclaim responsibility for any injury to people or property resulting from any ideas, methods, instructions or products referred to in the content. |
© 2023 by the authors. Licensee MDPI, Basel, Switzerland. This article is an open access article distributed under the terms and conditions of the Creative Commons Attribution (CC BY) license (https://creativecommons.org/licenses/by/4.0/).
Share and Cite
Qanber, A.S.G.; Yas, M.H.; Kadhum, M.M. Numerical and Experimental Behavior Analysis of Slabs Strengthened Using Steel Plates and Slurry-Infiltrated Mat Concrete (SIMCON) Laminates. Infrastructures 2023, 8, 85. https://doi.org/10.3390/infrastructures8050085
Qanber ASG, Yas MH, Kadhum MM. Numerical and Experimental Behavior Analysis of Slabs Strengthened Using Steel Plates and Slurry-Infiltrated Mat Concrete (SIMCON) Laminates. Infrastructures. 2023; 8(5):85. https://doi.org/10.3390/infrastructures8050085
Chicago/Turabian StyleQanber, Ali Sadik Gafer, Mohammed H. Yas, and Mohammed M. Kadhum. 2023. "Numerical and Experimental Behavior Analysis of Slabs Strengthened Using Steel Plates and Slurry-Infiltrated Mat Concrete (SIMCON) Laminates" Infrastructures 8, no. 5: 85. https://doi.org/10.3390/infrastructures8050085