
Environmental Impact Analysis of Alkali-Activated Concrete with Fiber Reinforcement


Abstract
:
1. Introduction
2. Materials and Methods
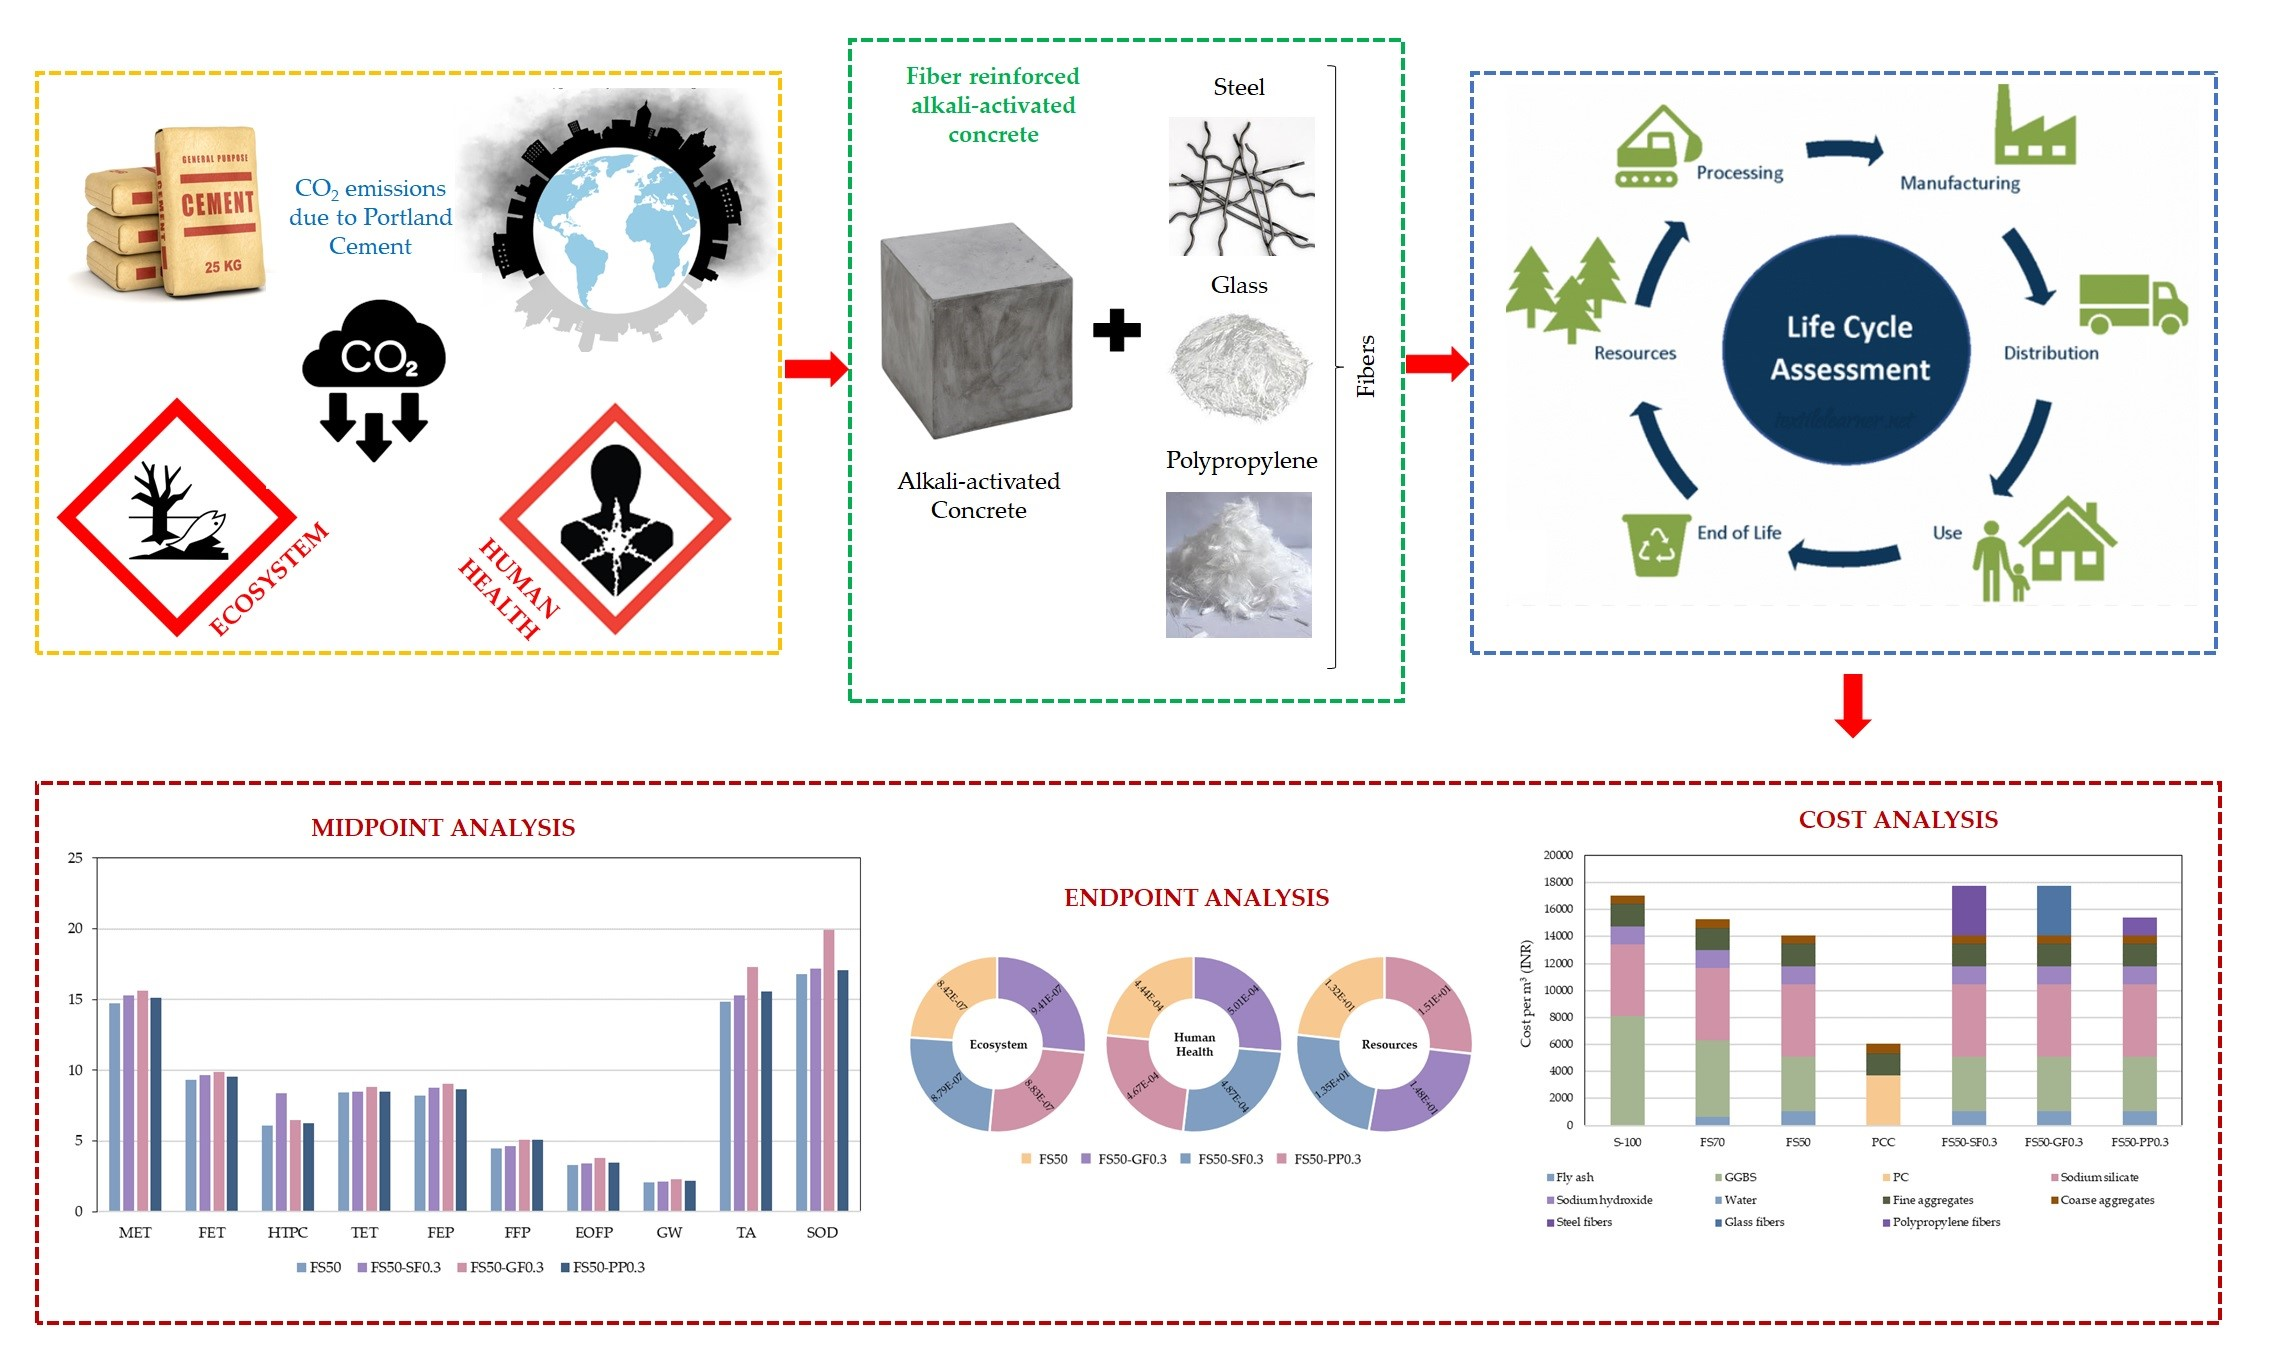
2.1. Materials
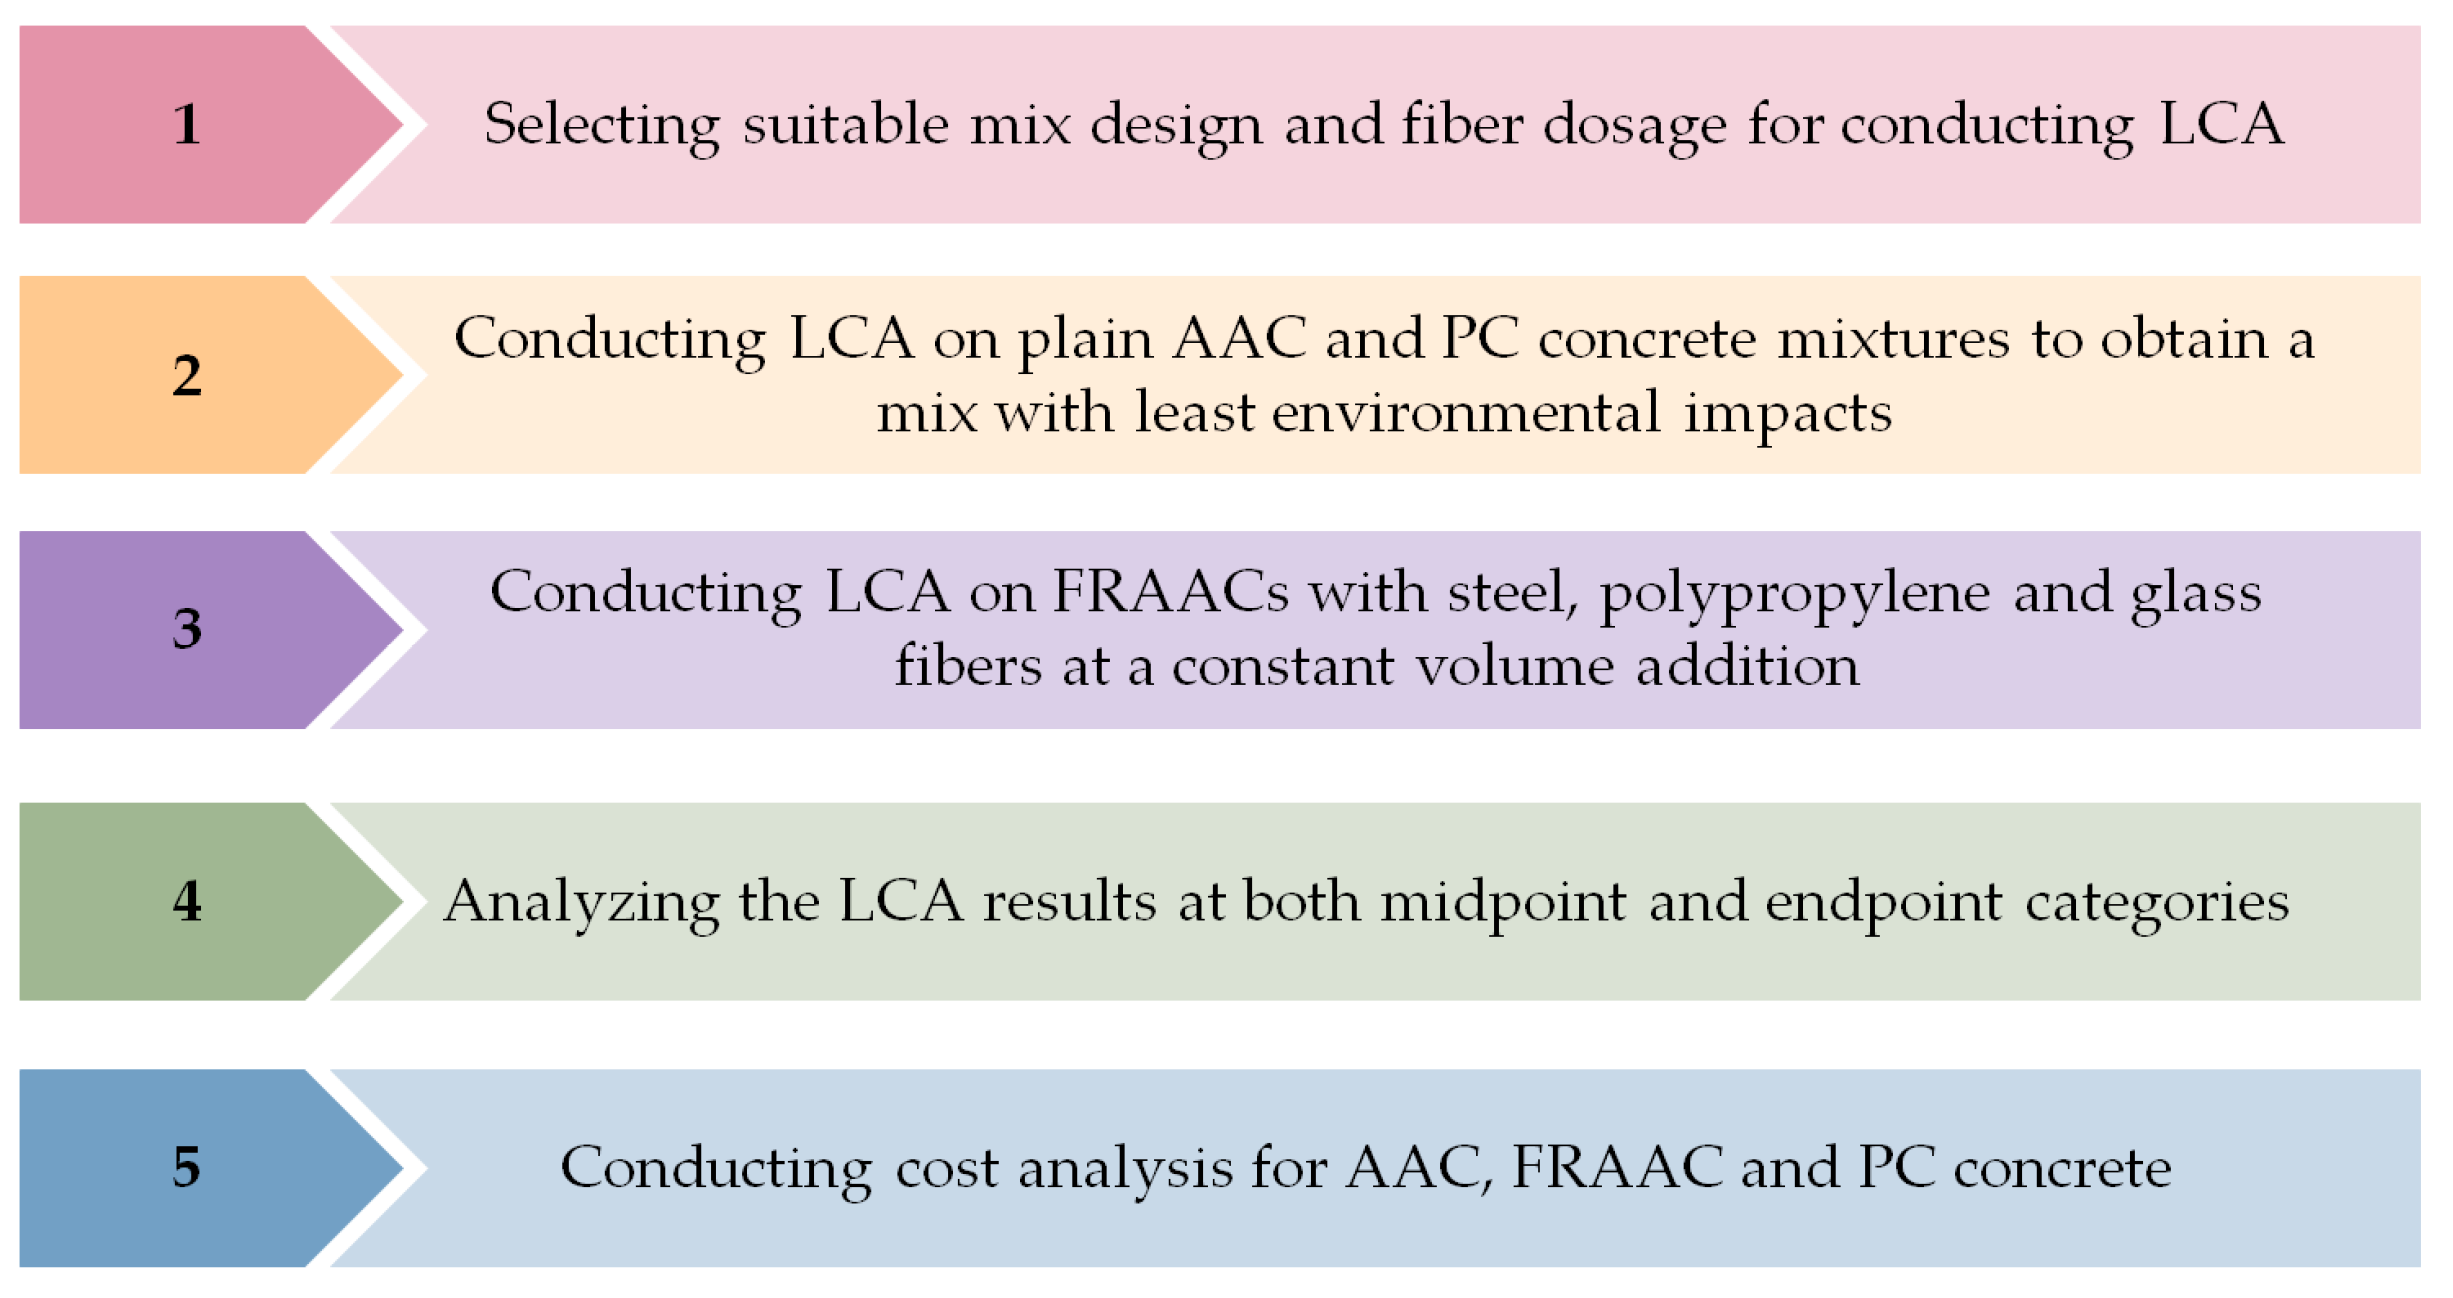
2.2. Methodology
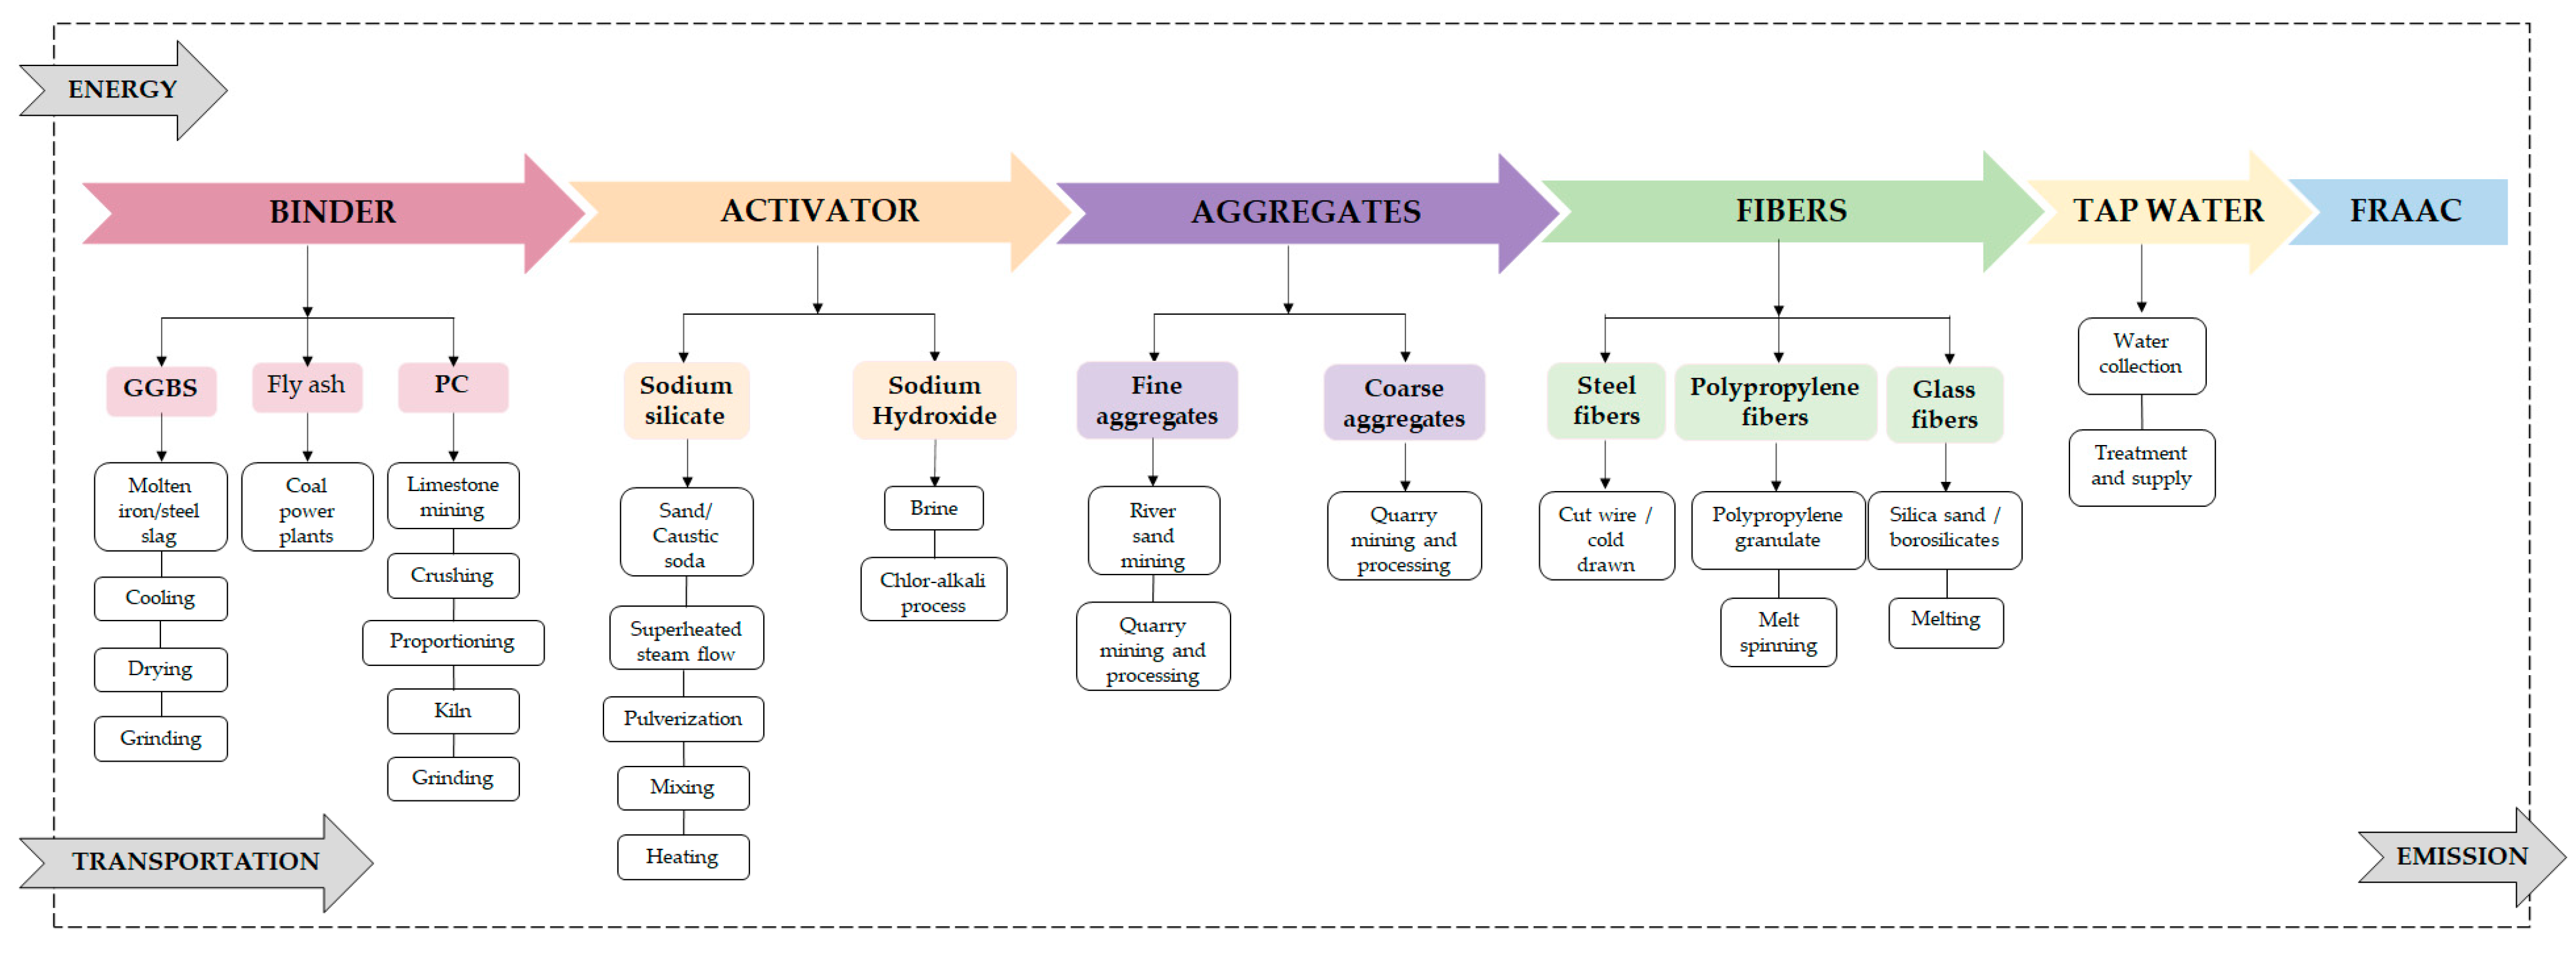
Concrete Mix Design Description
2.3. Life Cycle Assessment Method
2.3.1. Objective and Scope
2.3.2. Inventory Analysis
2.3.3. Life Cycle Impact Assessment (LCIA)
2.3.4. Life Cycle Interpretation
3. Results and Discussion
3.1. Plain Concrete
3.1.1. Midpoint Assessment
3.1.2. Endpoint Assessment
3.2. Fiber Reinforced Alkali Activated Concrete
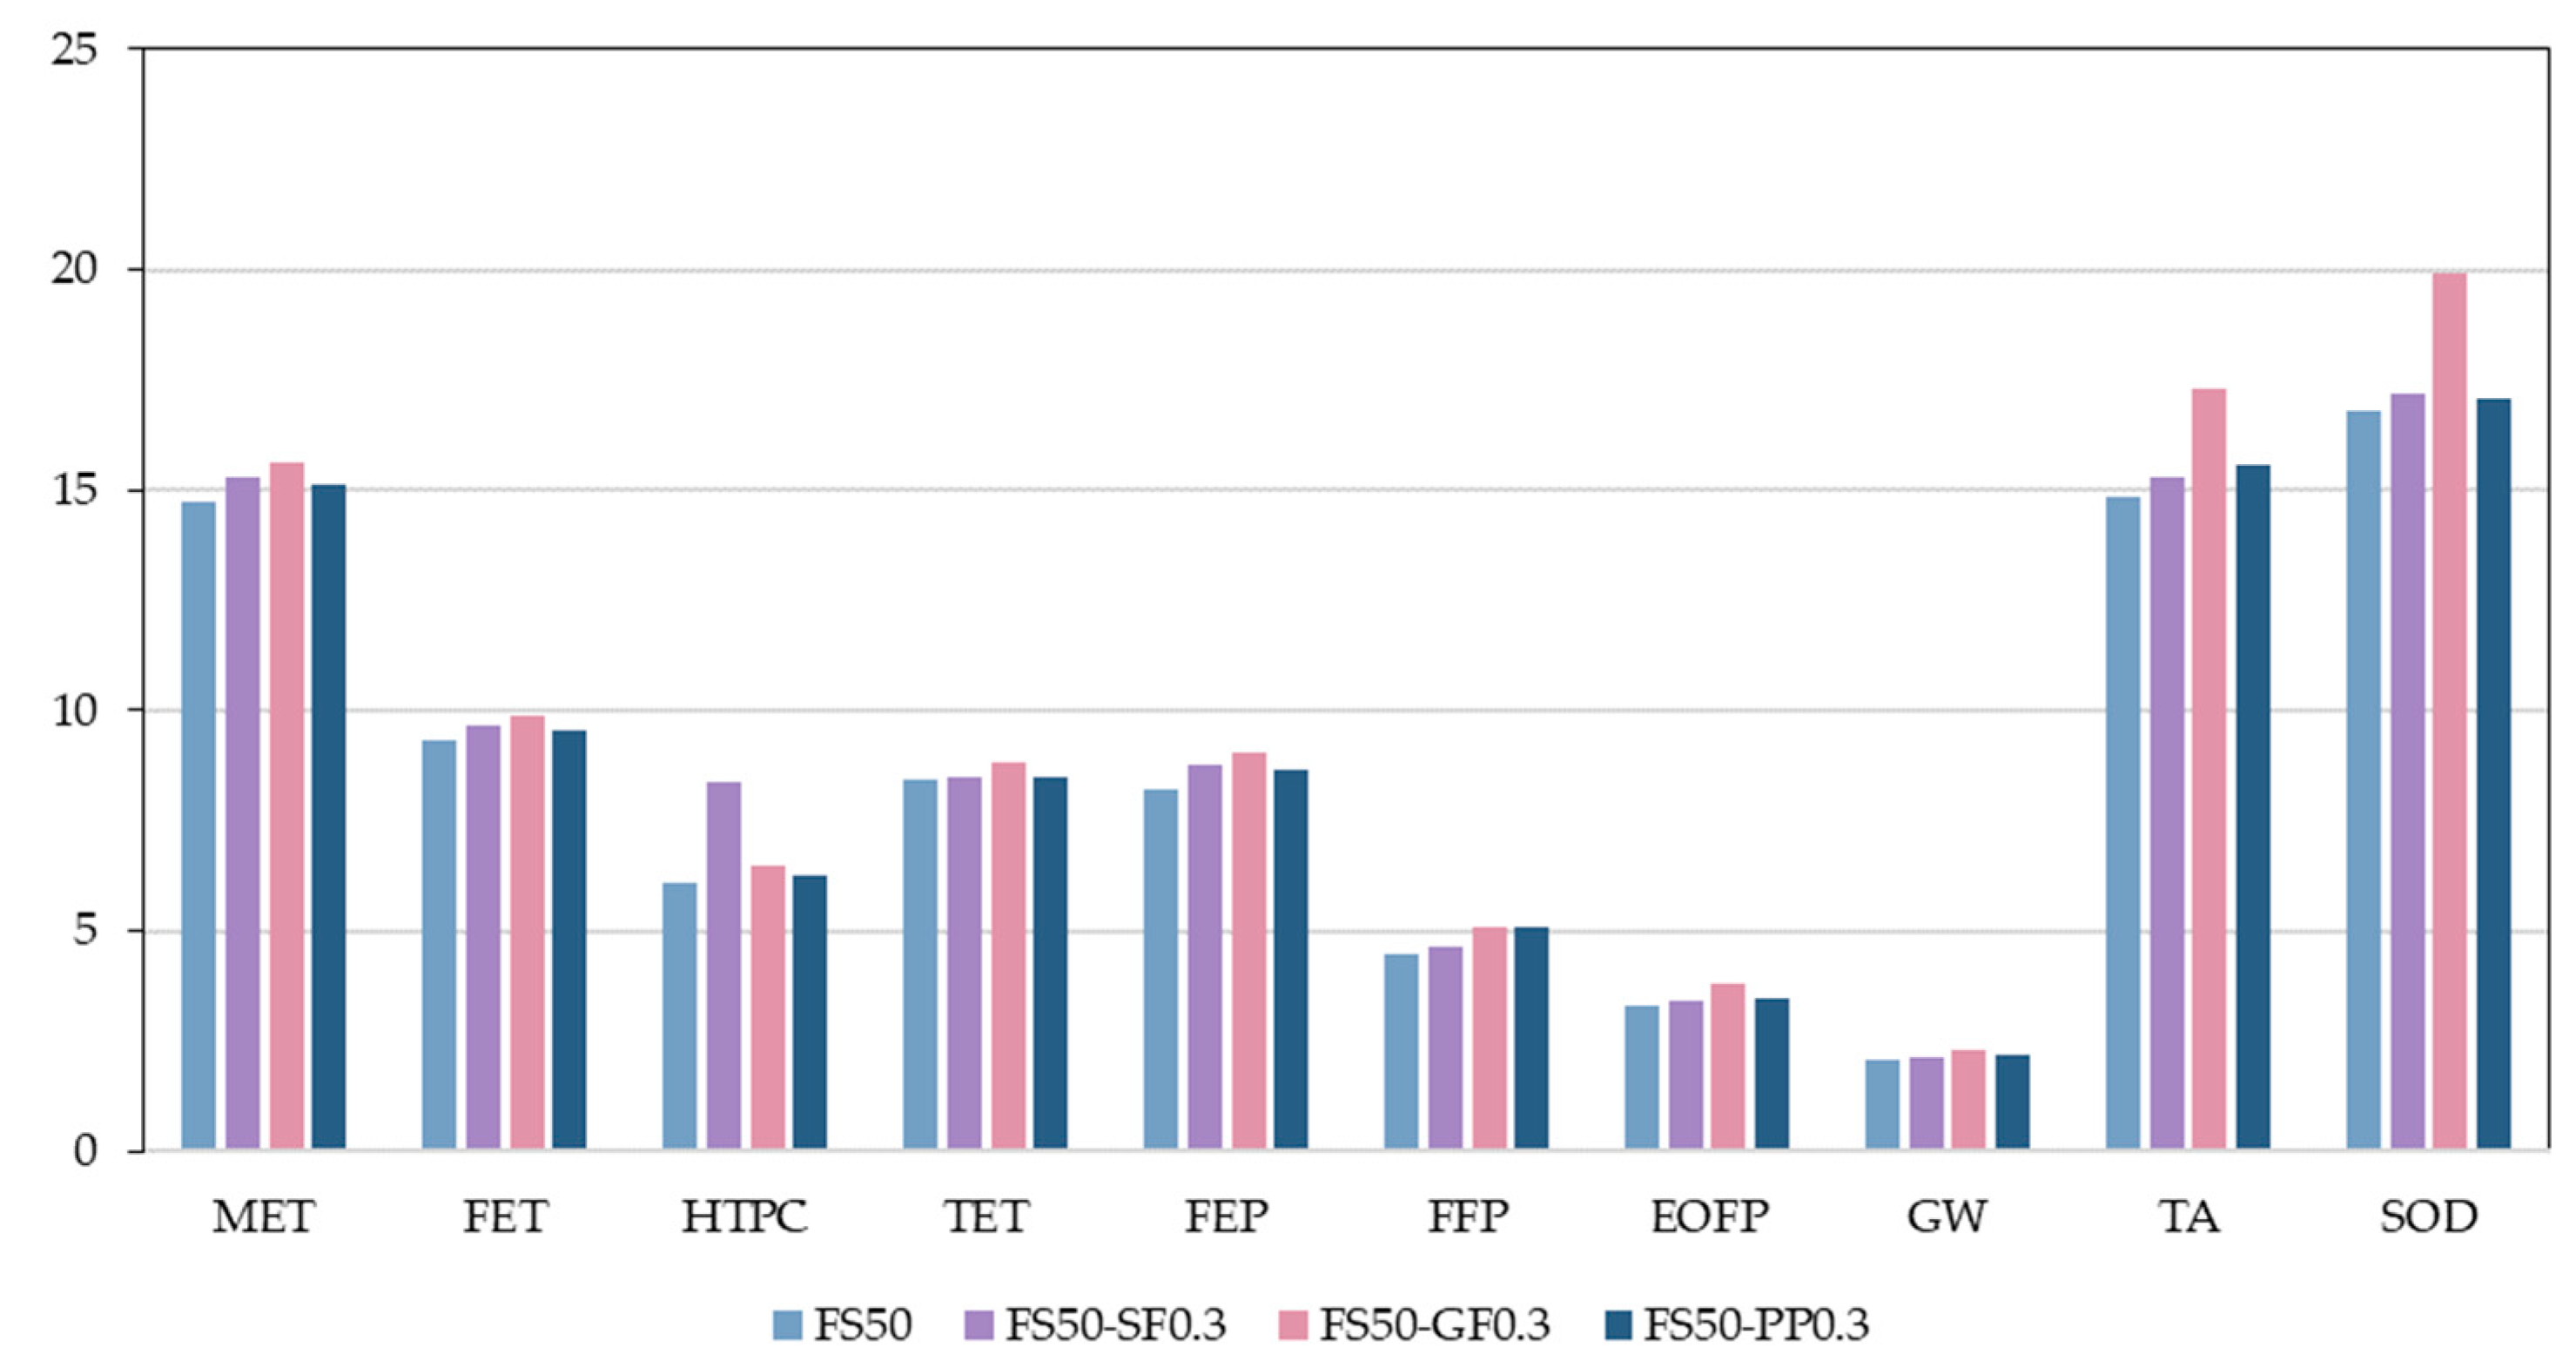
3.2.1. Midpoint Assessment
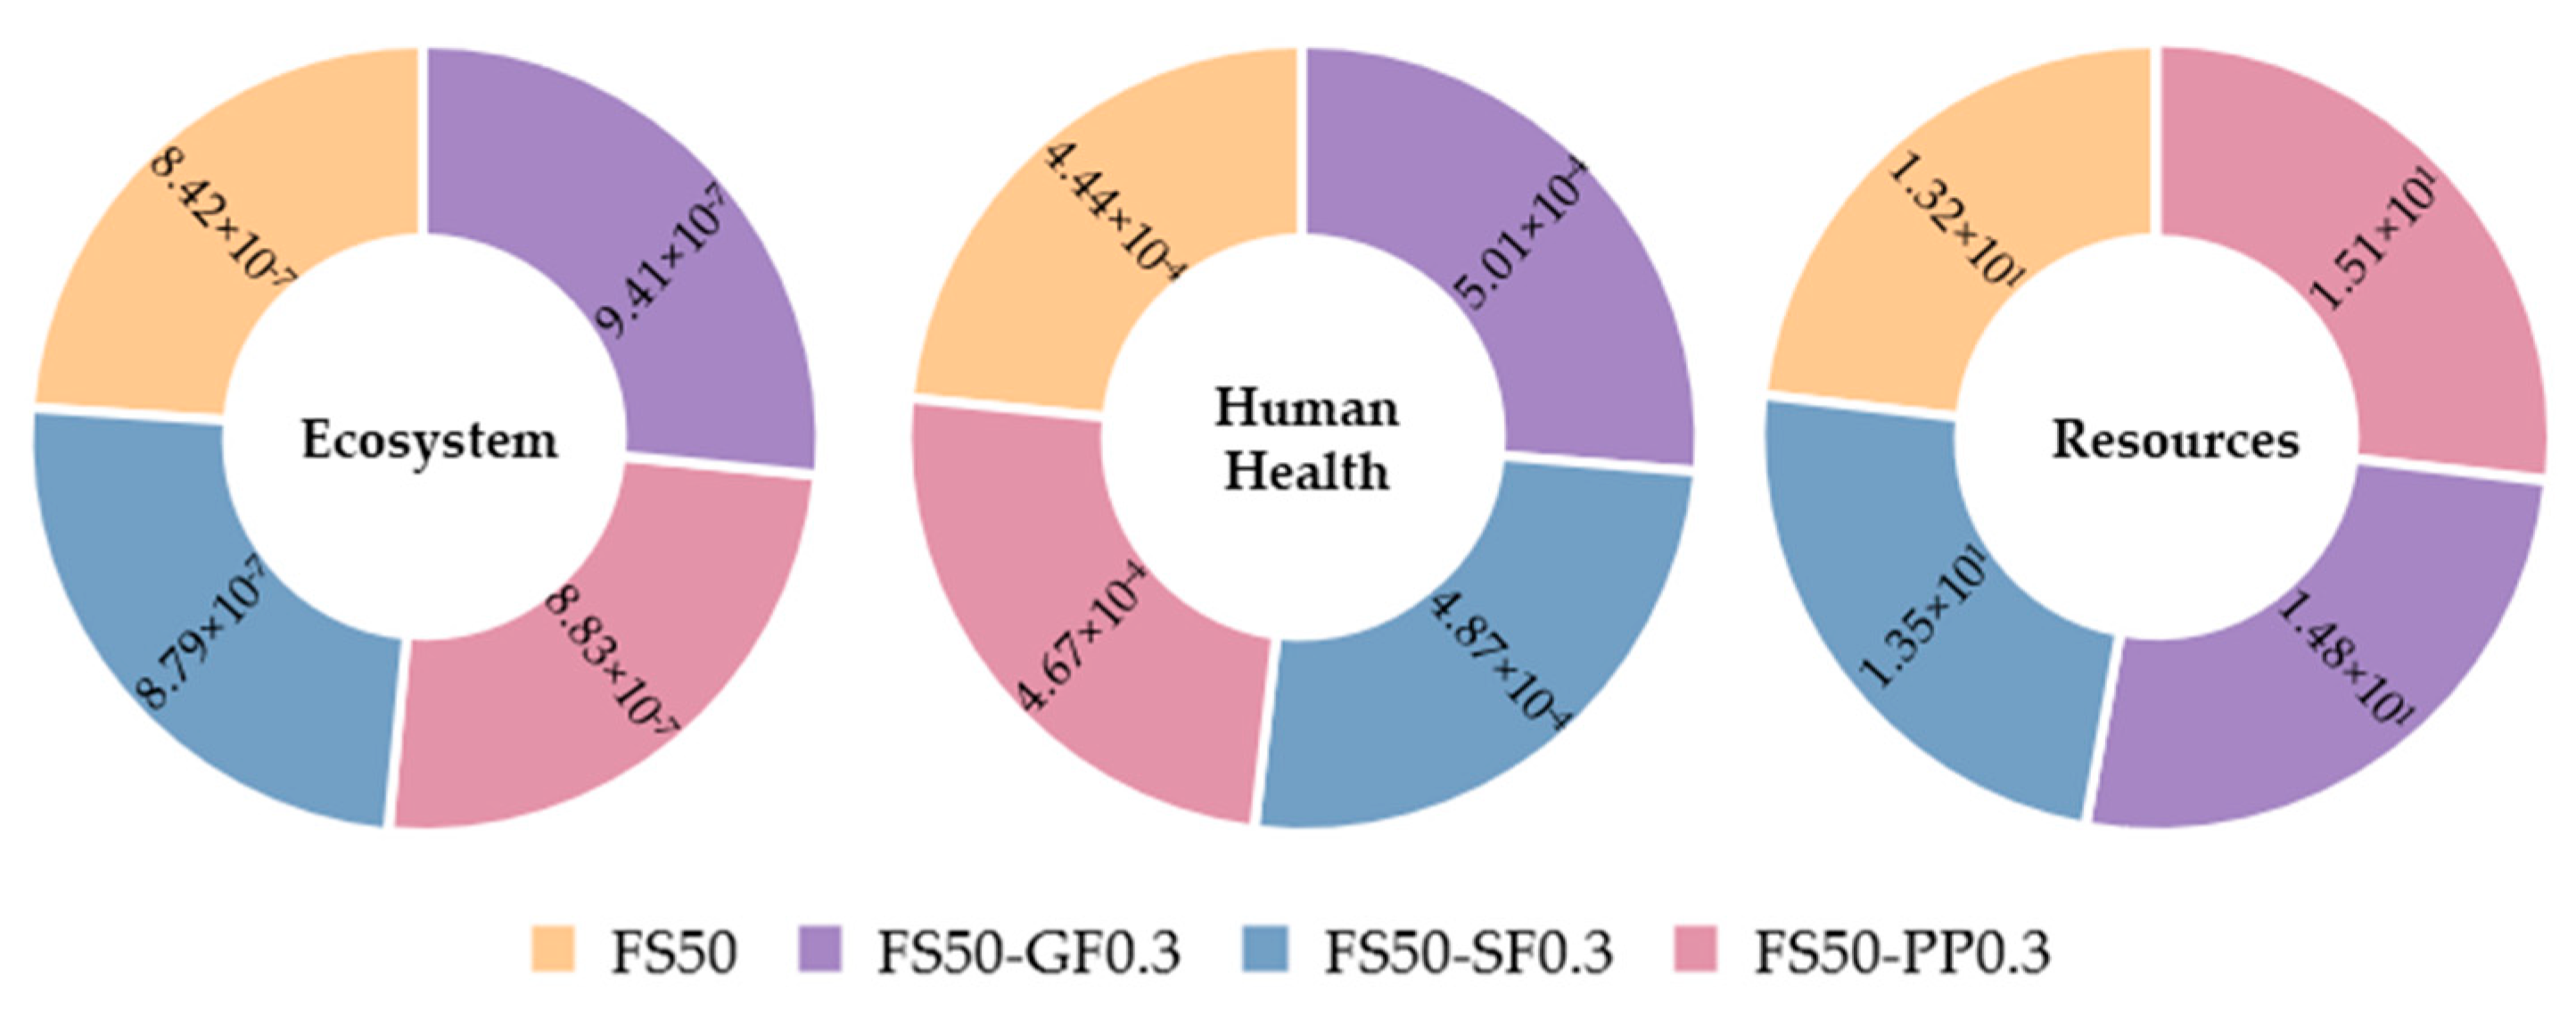
3.2.2. Endpoint Assessment
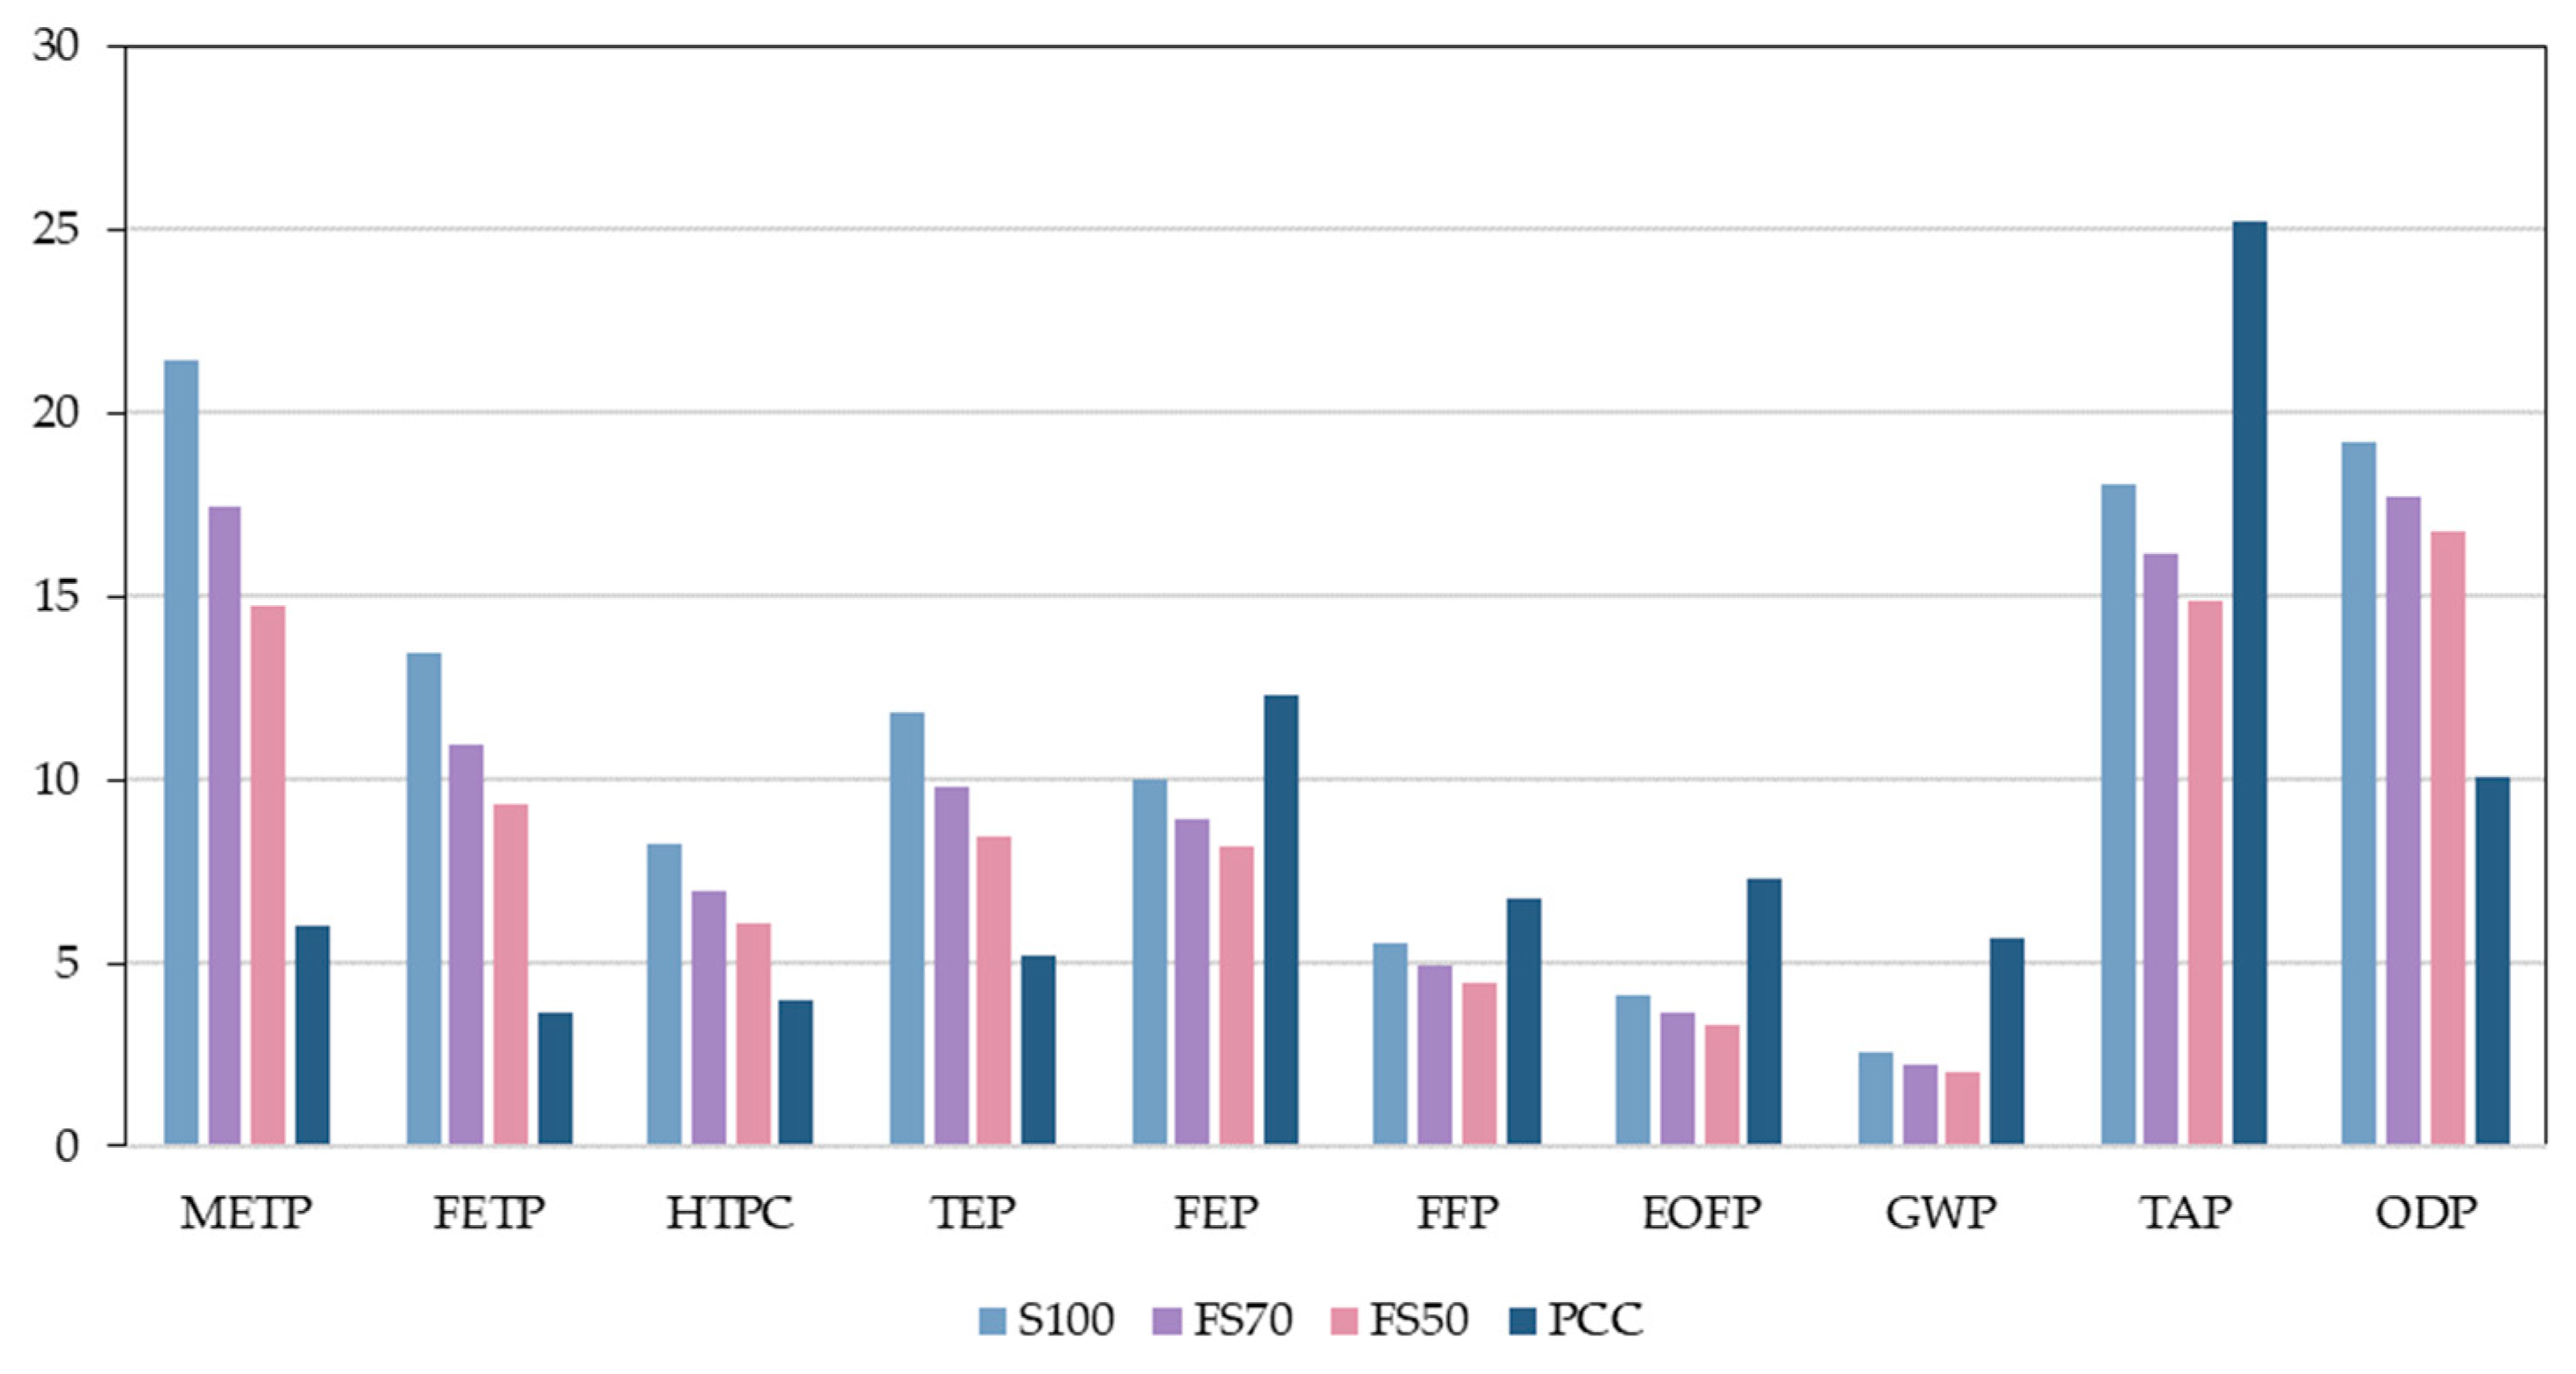
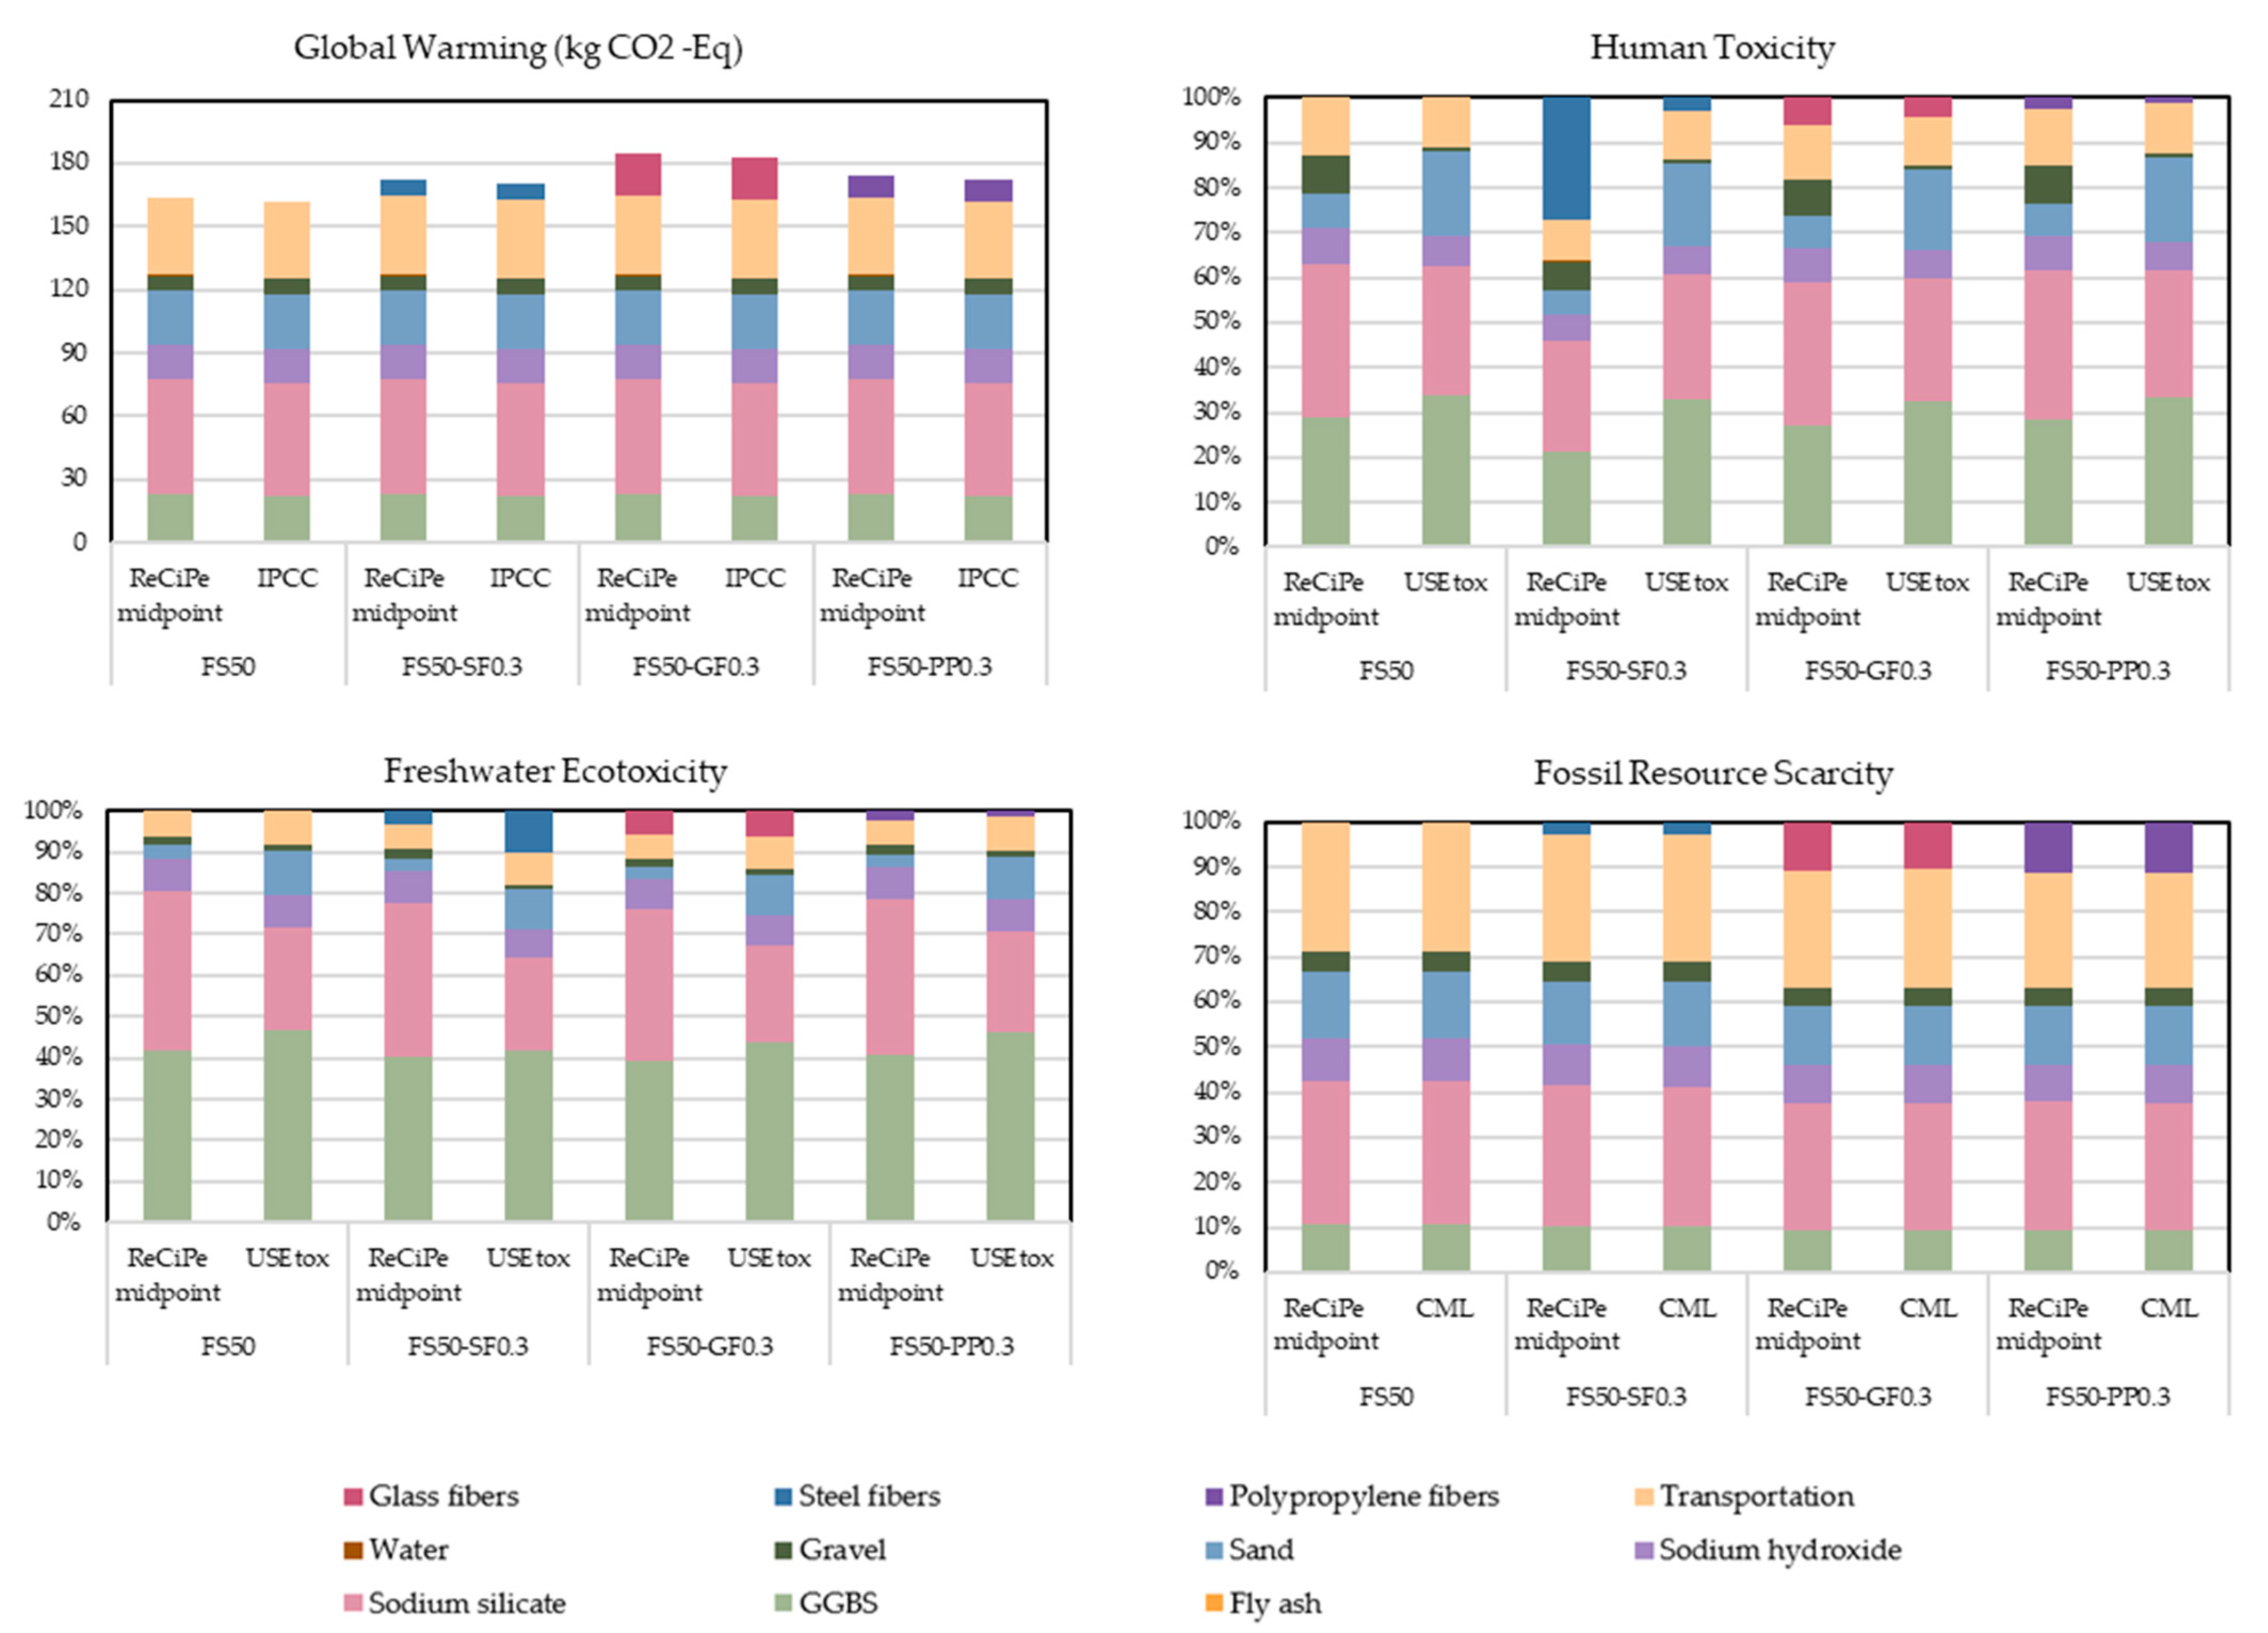
3.3. Comparison with ILCD Recommended Impact Assessment Methods
3.4. Cost Analysis
4. Conclusions
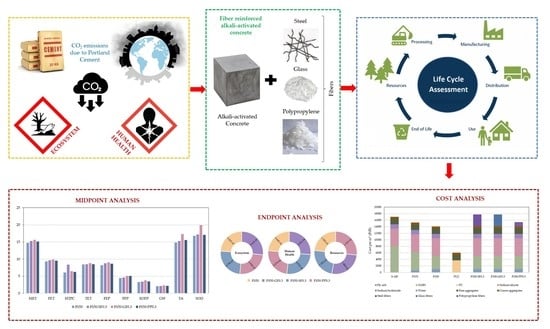
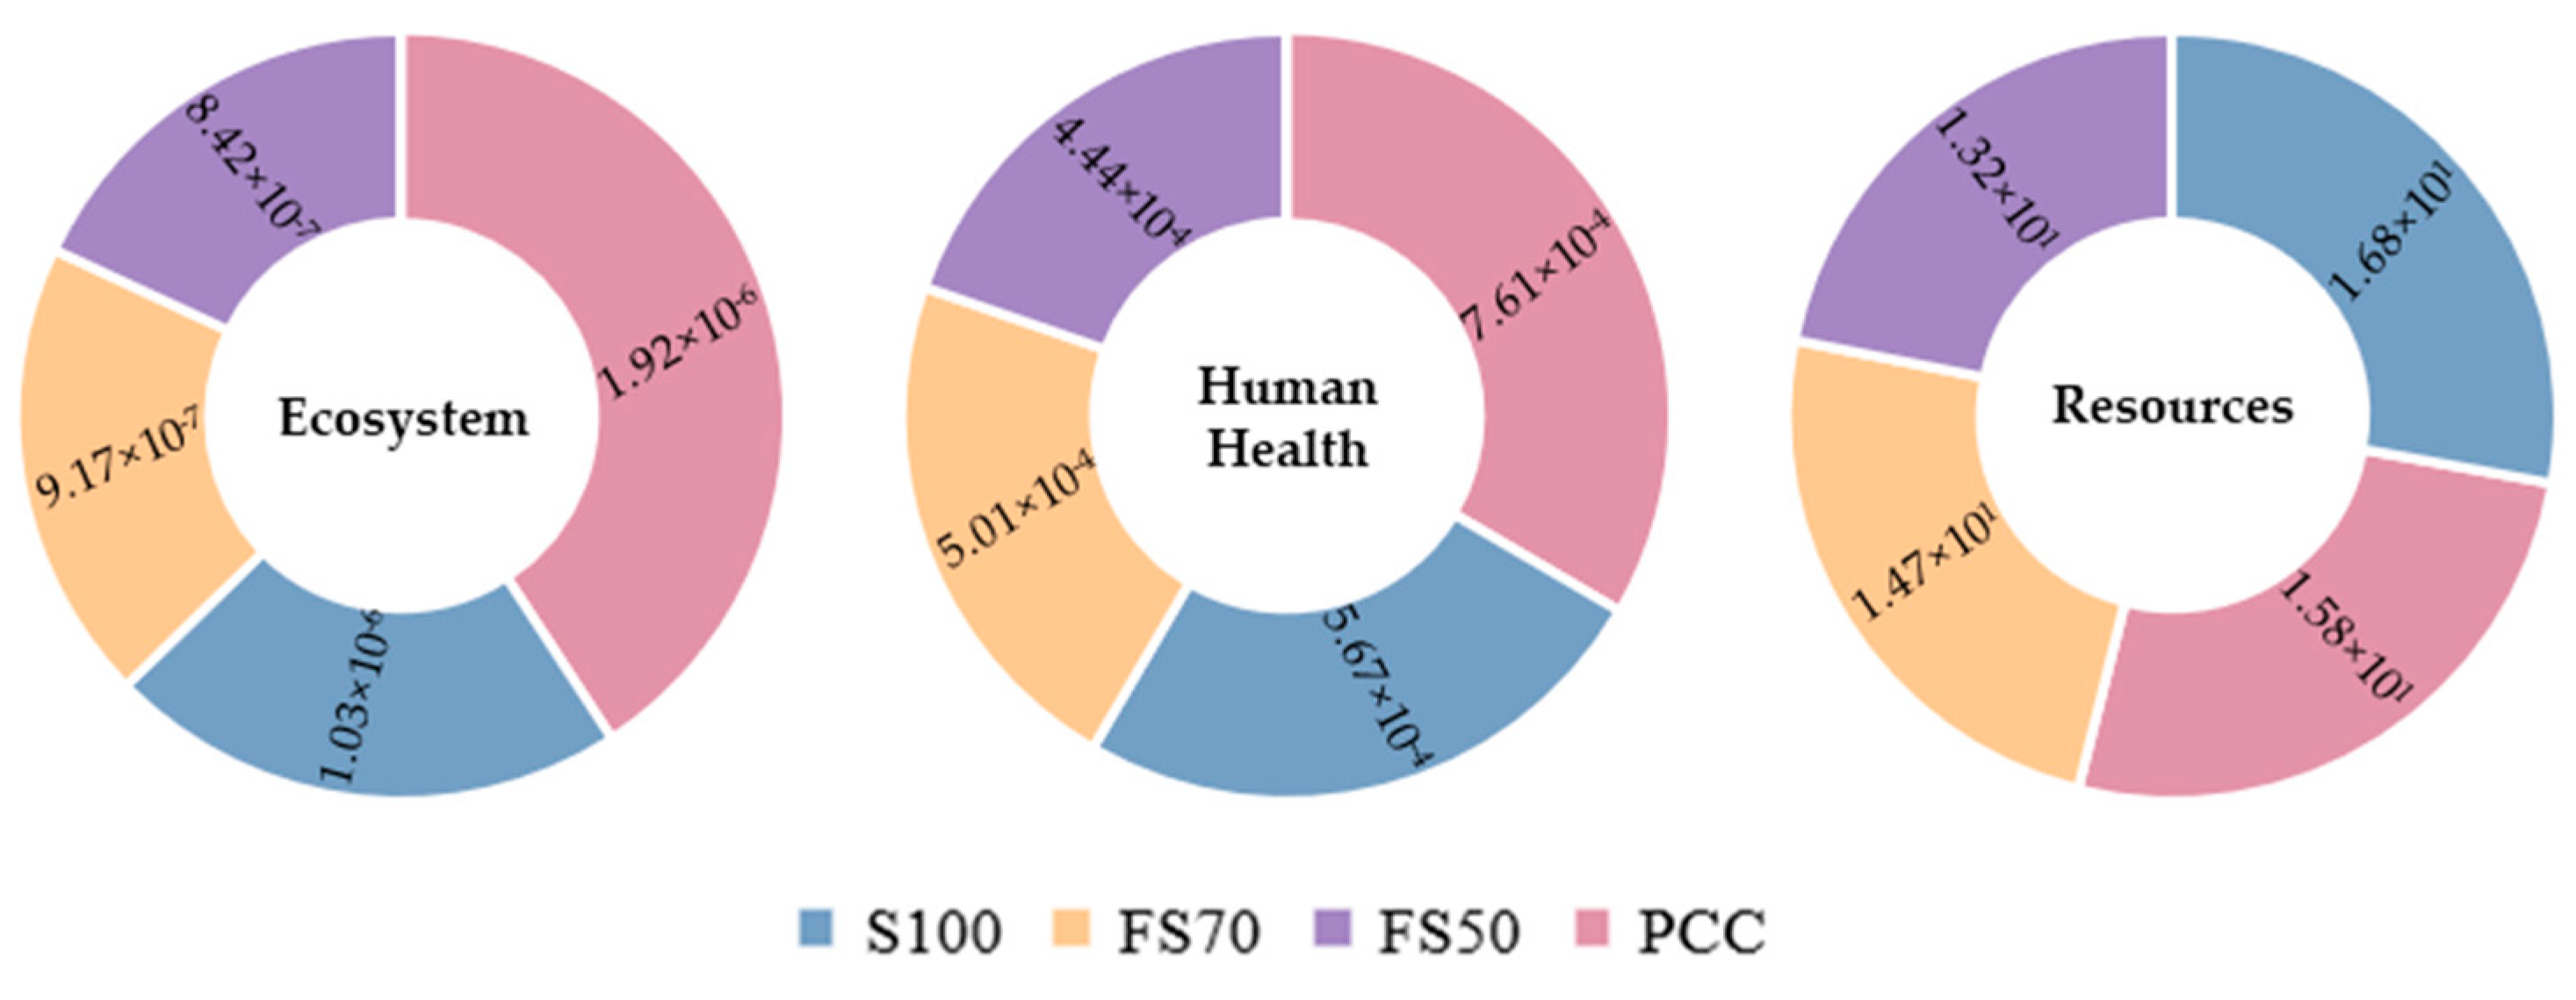
- Among the plain concrete mixtures, PC concrete is found to have 86% and 34% higher impacts than AAC on ecosystem quality and human health, respectively. Portland Cement is the key contributor to the high environmental impacts of PC concrete.
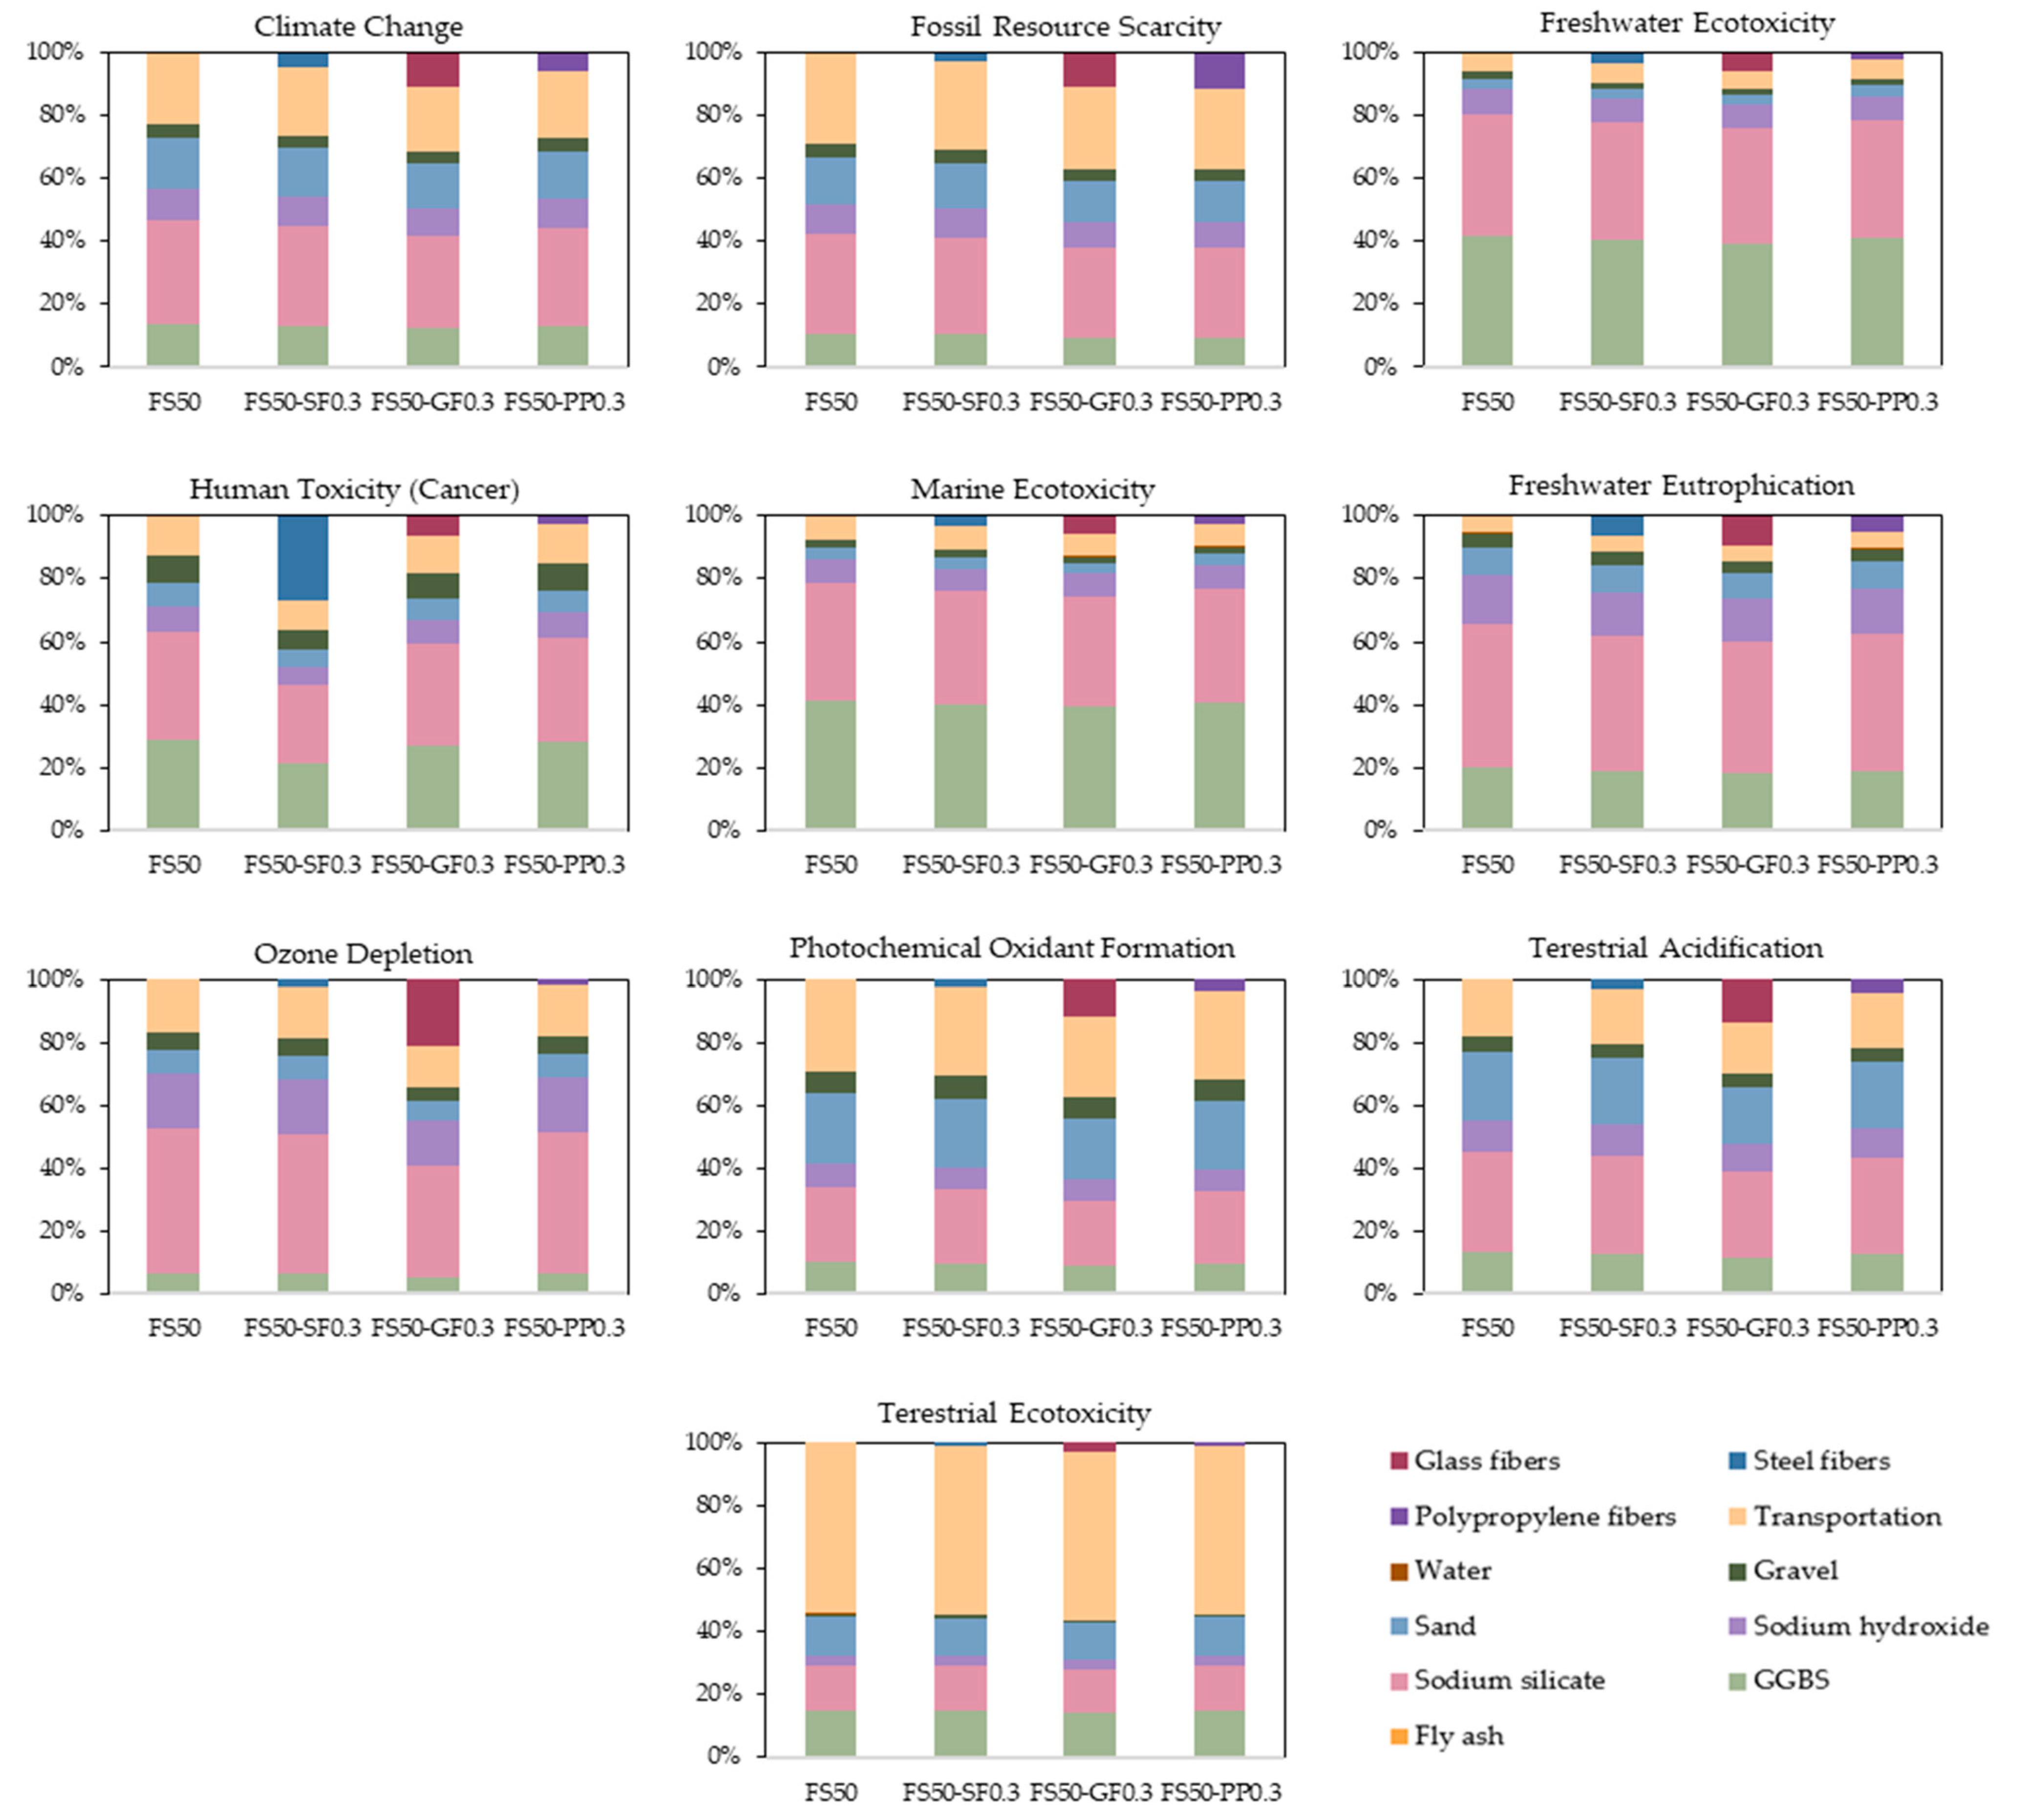
- The impacts on environment from AAC are mostly attributed to the use of sodium silicate in the activator. In all midpoint impact categories, sodium silicate accounts for 30–50% of the total impact.
- The partial replacement of GGBS with fly ash helps in reducing the environmental impacts of AAC by 7–18%. An AAC mixture with 50% fly ash and 50% of GGBS (FS50) has the least environmental impacts among the plain concrete mixtures.
- Among the FRAAC mixtures, glass fiber addition resulted in higher impacts to the environment, compared to polypropylene and steel fibers.
- The addition of glass fibers at 0.3% volume fraction in the FS50 mixture resulted in 12% and 13% higher impacts on the quality of the ecosystem and human health, respectively, when compared to FS50 without fibers.
- The cost analysis indicated that AAC has at least a 132% increase in costs when compared to conventional PC concrete. The increase in the cost of AAC is mainly attributed to the use of sodium silicate in the alkaline-activator. In FRAACs, the addition of 0.3% of polypropylene fibers resulted in the lowest impact on production cost.
Author Contributions
Funding
Data Availability Statement
Conflicts of Interest
References
- Zabalza Bribián, I.; Valero Capilla, A.; Aranda Usón, A. Life Cycle Assessment of Building Materials: Comparative Analysis of Energy and Environmental Impacts and Evaluation of the Eco-Efficiency Improvement Potential. Build. Environ. 2011, 46, 1133–1140. [Google Scholar] [CrossRef]
- World GBC. Bringing Embodied Carbon Upfront: Coordinated Action for the Building and Construction Sector to Tackle Embodied Carbon; World Green Building Council: London, UK, 2019. [Google Scholar]
- Xiao, J.; Li, W.; Poon, C. Recent Studies on Mechanical Properties of Recycled Aggregate Concrete in China—A Review. Sci. China Technol. Sci. 2012, 55, 1463–1480. [Google Scholar] [CrossRef]
- Davidovits, J. Synthesis of New High-temperature Geo-polymers for Reinforced Plastics/Composites. In Proceedings of the PACTEC ‘79 Society of Plastics Engineers, Costa Mesa, CA, USA, 31 January–2 February 1979; pp. 151–154. [Google Scholar]
- Albitar, M.; Mohamed Ali, M.S.; Visintin, P.; Drechsler, M. Durability Evaluation of Geopolymer and Conventional Concretes. Constr. Build. Mater. 2017, 136, 374–385. [Google Scholar] [CrossRef]
- al Bakri, A.M.M.; Kamarudin, H.; Binhussain, M.; Nizar, I.K.; Rafiza, A.R.; Zarina, Y. Comparison of Geopolymer Fly Ash and Ordinary Portland Cement to the Strength of Concrete. Adv. Sci. Lett. 2013, 19, 3592–3595. [Google Scholar] [CrossRef]
- Kurtoğlu, A.E.; Alzeebaree, R.; Aljumaili, O.; Niş, A.; Gülşan, M.E.; Humur, G.; Çevik, A. Mechanical and Durability Properties of Fly Ash and Slag Based Geopolymer Concrete. Adv. Concr. Constr. 2018, 6, 345–362. [Google Scholar] [CrossRef]
- Ramagiri, K.K.; Kar, A. Environmental Impact Assessment of Alkali-Activated Mortar with Waste Precursors and Activators. J. Build. Eng. 2021, 44, 103391. [Google Scholar] [CrossRef]
- Ramagiri, K.K.; Chintha, R.; Bandlamudi, R.K.; Kara De Maeijer, P.; Kar, A. Cradle-to-Gate Life Cycle and Economic Assessment of Sustainable Concrete Mixes—Alkali-Activated Concrete (AAC) and Bacterial Concrete (BC). Infrastructures 2021, 6, 104. [Google Scholar] [CrossRef]
- Salas, D.A.; Ramirez, A.D.; Ulloa, N.; Baykara, H.; Boero, A.J. Life Cycle Assessment of Geopolymer Concrete. Constr. Build. Mater. 2018, 190, 170–177. [Google Scholar] [CrossRef]
- McGrath, T.E.; Cox, S.; Soutsos, M.; Kong, D.; Mee, L.P.; Alengaram, J.U.J. Life Cycle Assessment of Geopolymer Concrete: A Malaysian Context. IOP Conf. Ser. Mater. Sci. Eng. 2018, 431, 092001. [Google Scholar] [CrossRef] [Green Version]
- Garces, J.I.T.; Dollente, I.J.; Beltran, A.B.; Tan, R.R.; Promentilla, M.A.B. Life Cycle Assessment of Self-Healing Geopolymer Concrete. Clean. Eng. Technol. 2021, 4, 100147. [Google Scholar] [CrossRef]
- Abdulkareem, M.; Havukainen, J.; Horttanainen, M. How Environmentally Sustainable Are Fibre Reinforced Alkali-Activated Concretes? J. Clean. Prod. 2019, 236, 117601. [Google Scholar] [CrossRef]
- Bajpai, R.; Choudhary, K.; Srivastava, A.; Sangwan, K.S.; Singh, M. Environmental Impact Assessment of Fly Ash and Silica Fume Based Geopolymer Concrete. J. Clean. Prod. 2020, 254, 120147. [Google Scholar] [CrossRef]
- Adesanya, E.; Perumal, P.; Luukkonen, T.; Yliniemi, J.; Ohenoja, K.; Kinnunen, P.; Illikainen, M. Opportunities to Improve Sustainability of Alkali-Activated Materials: A Review of Side-Stream Based Activators. J. Clean. Prod. 2021, 286, 125558. [Google Scholar] [CrossRef]
- Habert, G.; D’Espinose De Lacaillerie, J.B.; Roussel, N. An Environmental Evaluation of Geopolymer Based Concrete Production: Reviewing Current Research Trends. J. Clean. Prod. 2011, 19, 1229–1238. [Google Scholar] [CrossRef]
- Petrillo, A.; Cioffi, R.; de Felice, F.; Colangelo, F.; Borrelli, C. An Environmental Evaluation: A Comparison between Geopolymer and OPC Concrete Paving Blocks Manufacturing Process in Italy. Environ. Prog. Sustain. Energy 2016, 35, 1699–1708. [Google Scholar] [CrossRef]
- Rafeet, A.; Vinai, R.; Soutsos, M.; Sha, W. Guidelines for Mix Proportioning of Fly Ash/GGBS Based Alkali Activated Concretes. Constr. Build. Mater. 2017, 147, 130–142. [Google Scholar] [CrossRef] [Green Version]
- Wu, Y.F. The Effect of Longitudinal Reinforcement on the Cyclic Shear Behavior of Glass Fiber Reinforced Gypsum Wall Panels: Tests. Eng. Struct. 2004, 26, 1633–1646. [Google Scholar] [CrossRef]
- Enfedaque, A.; Cendón, D.; Gálvez, F.; Sánchez-Gálvez, V. Analysis of Glass Fiber Reinforced Cement (GRC) Fracture Surfaces. Constr. Build. Mater. 2010, 24, 1302–1308. [Google Scholar] [CrossRef] [Green Version]
- Enfedaque, A.; Cendón, D.; Gálvez, F.; Sánchez-Gálvez, V. Failure and Impact Behavior of Facade Panels Made of Glass Fiber Reinforced Cement(GRC). Eng. Fail. Anal. 2011, 18, 1652–1663. [Google Scholar] [CrossRef] [Green Version]
- Chen, Y.; Qiao, P. Crack Growth Resistance of Hybrid Fiber-Reinforced Cement Matrix Composites. J. Aerosp. Eng. 2011, 24, 154–161. [Google Scholar] [CrossRef]
- Coutts, R.S.P. A Review of Australian Research into Natural Fibre Cement Composites. Cem. Concr. Compos. 2005, 27, 518–526. [Google Scholar] [CrossRef]
- Corbière-Nicollier, T.; Gfeller Laban, B.; Lundquist, L.; Leterrier, Y.; Månson, J.A.E.; Jolliet, O. Life Cycle Assessment of Biofibres Replacing Glass Fibres as Reinforcement in Plastics. Resour. Conserv. Recycl. 2001, 33, 267–287. [Google Scholar] [CrossRef]
- Joshi, S.V.; Drzal, L.T.; Mohanty, A.K.; Arora, S. Are Natural Fiber Composites Environmentally Superior to Glass Fiber Reinforced Composites? Compos. Part A Appl. Sci. Manuf. 2004, 35, 371–376. [Google Scholar] [CrossRef]
- Satyanarayana, K.G.; Arizaga, G.G.C.; Wypych, F. Biodegradable Composites Based on Lignocellulosic Fibers—An Overview. Prog. Polym. Sci. 2009, 34, 982–1021. [Google Scholar] [CrossRef]
- Mohr, B.J.; Nanko, H.; Kurtis, K.E. Durability of Thermomechanical Pulp Fiber-Cement Composites to Wet/Dry Cycling. Cem. Concr. Res. 2005, 35, 1646–1649. [Google Scholar] [CrossRef]
- Farhan, K.Z.; Johari, M.A.M.; Demirboğa, R. Impact of Fiber Reinforcements on Properties of Geopolymer Composites: A Review. J. Build. Eng. 2021, 44, 102628. [Google Scholar] [CrossRef]
- Ranjbar, N.; Talebian, S.; Mehrali, M.; Kuenzel, C.; Cornelis Metselaar, H.S.; Jumaat, M.Z. Mechanisms of Interfacial Bond in Steel and Polypropylene Fiber Reinforced Geopolymer Composites. Compos. Sci. Technol. 2016, 122, 73–81. [Google Scholar] [CrossRef]
- Aisheh, Y.I.A.; Atrushi, D.S.; Akeed, M.H.; Qaidi, S.; Tayeh, B.A. Influence of Polypropylene and Steel Fibers on the Mechanical Properties of Ultra-High-Performance Fiber-Reinforced Geopolymer Concrete. Case Stud. Constr. Mater. 2022, 17, e01234. [Google Scholar] [CrossRef]
- Shafei, B.; Kazemian, M.; Dopko, M.; Najimi, M. State-of-the-Art Review of Capabilities and Limitations of Polymer and Glass Fibers Used for Fiber-Reinforced Concrete. Materials 2021, 14, 409. [Google Scholar] [CrossRef]
- Yang, J.; Chen, B.; Nuti, C. Influence of Steel Fiber on Compressive Properties of Ultra-High Performance Fiber-Reinforced Concrete. Constr. Build. Mater. 2021, 302, 124104. [Google Scholar] [CrossRef]
- Nematollahi, B.; Sanjayan, J.; Qiu, J.; Yang, E.H. High Ductile Behavior of a Polyethylene Fiber-Reinforced One-Part Geopolymer Composite: A Micromechanics-Based Investigation. Arch. Civ. Mech. Eng. 2017, 17, 555–563. [Google Scholar] [CrossRef]
- Midhun, M.S.; Gunneswara Rao, T.D.; Chaitanya Srikrishna, T. Mechanical and Fracture Properties of Glass Fiber Reinforced Geopolymer Concrete. Adv. Concr. Constr. 2018, 6, 29–45. [Google Scholar] [CrossRef]
- Mastali, M.; Malovrh Rebec, K.; Abdollahnejad, Z.; Alzaza, A.; Kinnunen, P.; Karhu, M.; Ducman, V.; Illikainen, M. Properties of Lightweight Fiber-Reinforced Alkali-Activated Concrete. In Handbook of Advances in Alkali-Activated Concrete; Elsevier: Amsterdam, The Netherlands, 2022; pp. 321–344. [Google Scholar] [CrossRef]
- Colangelo, F.; Farina, I.; Travaglioni, M.; Salzano, C.; Cioffi, R.; Petrillo, A. Assessment of Innovative Fiber-Reinforced Alkali-Activated Concrete. Polymers 2022, 14, 3333. [Google Scholar] [CrossRef]
- ISO 14040; Environmental Management—Life Cycle Assessment—Principles and Framework. International Organization for Standardization: Geneva, Switzerland, 2006.
- Faridmehr, I.; Nehdi, M.L.; Nikoo, M.; Huseien, G.F.; Ozbakkaloglu, T. Life-Cycle Assessment of Alkali-Activated Materials Incorporating Industrial Byproducts. Materials 2021, 14, 2401. [Google Scholar] [CrossRef]
- la Rosa, A.D.; Recca, G.; Summerscales, J.; Latteri, A.; Cozzo, G.; Cicala, G. Bio-Based versus Traditional Polymer Composites. A Life Cycle Assessment Perspective. J. Clean. Prod. 2014, 74, 135–144. [Google Scholar] [CrossRef]
- Pretot, S.; Collet, F.; Garnier, C. Life Cycle Assessment of a Hemp Concrete Wall: Impact of Thickness and Coating. Build. Environ. 2014, 72, 223–231. [Google Scholar] [CrossRef] [Green Version]
- Das, A. Strength Characterisation Fly Ash Composite Material. Ph.D. Thesis, Department of Mining Engineering, National Institute of Technology, Rourkela, India, 2009. Available online: https://core.ac.uk/download/pdf/53186996.pdf (accessed on 8 March 2023).
- Sun, S. Utilization of Fly Ash from Power Stations in India in First Half of Financial Year 2021, by Sector. Statista 2022. Available online: https://www.statista.com/statistics/1263734/india-utilization-of-fly-ash-from-power-stations-by-sector/#:~:text=Premium%20statistics-,Utilization%20of%20fly%20ash%20from%20power%20stations,H1%20FY%202021%2C%20by%20sector&text=In%20the%20first%20half%20of,which%20was%20utilized%20for%20cement (accessed on 23 March 2023).
- Hwang, C.L.; Lin, C.Y. Strength Development of Blended Blast-Furnace Slag-Cement Mortars. J. Chin. Inst. Eng. Trans. Chin. Inst. Eng. Ser. A/Chung-Kuo K. Ch’eng Hsuch K’an 1986, 9, 233–239. [Google Scholar] [CrossRef]
- Recovery. Slag Recycling. Article Appeared February 2020. Available online: https://www.recovery-worldwide.com/en/artikel/slag-recycling-3528047.html (accessed on 8 March 2023).
- Fernández-Jiménez, A.; Monzó, M.; Vicent, M.; Barba, A.; Palomo, A. Alkaline Activation of Metakaolin-Fly Ash Mixtures: Obtain of Zeoceramics and Zeocements. Microporous Mesoporous Mater. 2008, 108, 41–49. [Google Scholar] [CrossRef]
- Nath, P.; Sarker, P.K. Effect of GGBFS on Setting, Workability and Early Strength Properties of Fly Ash Geopolymer Concrete Cured in Ambient Condition. Constr. Build. Mater. 2014, 66, 163–171. [Google Scholar] [CrossRef] [Green Version]
- Al-Majidi, M.H.; Lampropoulos, A.; Cundy, A.B. Steel Fibre Reinforced Geopolymer Concrete (SFRGC) with Improved Microstructure and Enhanced Fibre-Matrix Interfacial Properties. Constr. Build. Mater. 2017, 139, 286–307. [Google Scholar] [CrossRef] [Green Version]
- IS 12269; 2013 Ordinary Portland Cement, 53 Grade Specification. Bureau of Indian Standards: New Delhi, India, 2013.
- ASTM C150/C150M-19a; Standard Specification for Portland Cement. ASTM International: West Conshohocken, PA, USA, 2019.
- Ravichandran, G.; Sivaraja, M.; Jegan, M.; Harihanandh, M.; Krishnaraja, A.R. Performance of Glass Fiber Reinforced Geopolymer Concrete under Varying Temperature Effect. Int. J. Civ. Eng. Technol. 2018, 9, 1316–1323. Available online: http://iaeme.com/Home/issue/IJCIET?Volume=9&Issue=4 (accessed on 8 March 2023).
- Sathanandam, T.; Awoyera, P.O.; Vijayan, V.; Sathishkumar, K. Low Carbon Building: Experimental Insight on the Use of Fly Ash and Glass Fibre for Making Geopolymer Concrete. Sustain. Environ. Res. 2017, 27, 146–153. [Google Scholar] [CrossRef]
- Kumar, S.; Kumar, R.; Mehrotra, S.P. Influence of Granulated Blast Furnace Slag on the Reaction, Structure and Properties of Fly Ash Based Geopolymer. J. Mater. Sci. 2010, 45, 607–615. [Google Scholar] [CrossRef]
- Vijai, K.; Kumutha, R.; Vishnuram, B.G. Properties of Glass Fibre Reinforced Geopolymer Concrete Composites. Asian J. Civ. Eng. 2012, 13, 511–520. Available online: https://en.bhrc.ac.ir/Portals/25/PropertyAgent/2905/Files/5984/511.pdf (accessed on 8 March 2023).
- Sikder, A.; Mishra, J.; Krishna, R.S.; Ighalo, J.O. Evaluation of the Mechanical and Durability Properties of Geopolymer Concrete Prepared with C-Glass Fibers. Arab. J. Sci. Eng. 2022. [Google Scholar] [CrossRef]
- Ranjbar, N.; Zhang, M. Fiber-Reinforced Geopolymer Composites: A Review. Cem. Concr. Compos. 2020, 107, 103498. [Google Scholar] [CrossRef]
- Çelik, A.İ.; Özkılıç, Y.O.; Zeybek, Ö.; Özdöner, N.; Tayeh, B.A. Performance Assessment of Fiber-Reinforced Concrete Produced with Waste Lathe Fibers. Sustainability 2022, 14, 11817. [Google Scholar] [CrossRef]
- Awolusi, T.F.; Oke, O.L.; Atoyebi, O.D.; Akinkurolere, O.O.; Sojobi, A.O. Waste Tires Steel Fiber in Concrete: A Review. Innov. Infrastruct. Solut. 2021, 6, 34. [Google Scholar] [CrossRef]
- Koenig, A.; Wuestemann, A.; Gatti, F.; Rossi, L.; Fuchs, F.; Fessel, D.; Dathe, F.; Dehn, F.; Minelli, F. Flexural Behaviour of Steel and Macro-PP Fibre Reinforced Concretes Based on Alkali-Activated Binders. Constr. Build. Mater. 2019, 211, 583–593. [Google Scholar] [CrossRef]
- Kim, S.W.; Jang, S.J.; Kang, D.H.; Ahn, K.L.; Yun, H. Do Mechanical Properties and Eco-Efficiency of Steel Fiber Reinforced Alkali-Activated Slag Concrete. Materials 2015, 8, 5383. [Google Scholar] [CrossRef] [PubMed] [Green Version]
- Alrefaei, Y.; Dai, J.G. Tensile Behavior and Microstructure of Hybrid Fiber Ambient Cured One-Part Engineered Geopolymer Composites. Constr. Build. Mater. 2018, 184, 419–431. [Google Scholar] [CrossRef]
- Bernal, S.; de Gutierrez, R.; Delvasto, S.; Rodriguez, E. Performance of an Alkali-Activated Slag Concrete Reinforced with Steel Fibers. Constr. Build. Mater. 2010, 24, 208–214. [Google Scholar] [CrossRef]
- Bernal, S.; Mejía de Gutiérrez, R.; Rodríguez, E.; Delvasto, S.; Puertas, F. Comportamiento Mecánico de Hormigones de Escoria Activada Alcalinamente Reforzados Con Fibras de Acero. Mater. De Constr. 2009, 59, 53–62. [Google Scholar] [CrossRef] [Green Version]
- BS-EN-14889-2:2006; Fibres for Concrete—Part 2: Polymer Fibres. Definitions, Specifications and Conformity. British Standard: London, UK, 2006; Volume 3.
- Machovič, V.; Lapčák, L.; Borecká, L.; Lhotka, M.; Andertová, J.; Kopecký, L.; Mišková, L. Microstructure of Interfacial Transition Zone between PET Fibres and Cement Paste. Acta Geodyn. Geomater. 2013, 10, 121–127. [Google Scholar] [CrossRef] [Green Version]
- Sukontasukkul, P.; Pongsopha, P.; Chindaprasirt, P.; Songpiriyakij, S. Flexural Performance and Toughness of Hybrid Steel and Polypropylene Fibre Reinforced Geopolymer. Constr. Build. Mater. 2018, 161, 37–44. [Google Scholar] [CrossRef]
- Ranjbar, N.; Mehrali, M.; Behnia, A.; Pordsari, A.J.; Mehrali, M.; Alengaram, U.J.; Jumaat, M.Z. A Comprehensive Study of the Polypropylene Fiber Reinforced Fly Ash Based Geopolymer. PLoS ONE 2016, 11, e0147546. [Google Scholar] [CrossRef] [PubMed] [Green Version]
- Madandoust, R.; Kazemi, M.; Talebi, P.K.; de Brito, J. Effect of the Curing Type on the Mechanical Properties of Lightweight Concrete with Polypropylene and Steel Fibres. Constr. Build. Mater. 2019, 223, 1038–1052. [Google Scholar] [CrossRef]
- Noushini, A.; Hastings, M.; Castel, A.; Aslani, F. Mechanical and Flexural Performance of Synthetic Fibre Reinforced Geopolymer Concrete. Constr. Build. Mater. 2018, 186, 454–475. [Google Scholar] [CrossRef]
- Reed, M.; Lokuge, W.; Karunasena, W. Fibre-Reinforced Geopolymer Concrete with Ambient Curing for in Situ Applications. J. Mater. Sci. 2014, 49, 4297–4304. [Google Scholar] [CrossRef] [Green Version]
- Chen, X.; Zhou, M.; Shen, W.; Zhu, G.; Ge, X. Mechanical Properties and Microstructure of Metakaolin-Based Geopolymer Compound-Modified by Polyacrylic Emulsion and Polypropylene Fibers. Constr. Build. Mater. 2018, 190, 680–690. [Google Scholar] [CrossRef]
- Rickard, W.D.A.; Vickers, L.; van Riessen, A. Performance of Fibre Reinforced, Low Density Metakaolin Geopolymers under Simulated Fire Conditions. Appl. Clay Sci. 2013, 73, 71–77. [Google Scholar] [CrossRef]
- Bagherzadeh, R.; Sadeghi, A.H.; Latifi, M. Utilizing Polypropylene Fibers to Improve Physical and Mechanical Properties of Concrete. Text. Res. J. 2012, 82, 88–96. [Google Scholar] [CrossRef]
- Błyszko, J. Comparative Analysis of Creep in Standard and Fibre Reinforced Concretes under Different Load Conditions. Procedia Eng. 2017, 193, 478–485. [Google Scholar] [CrossRef]
- BS EN 12350-2:2009; Testing Fresh Concrete—Part 2: Slump Test. British Standard Institute: London, UK, 2019. Available online: https://www.en-standard.eu/bs-en-12350-2-2019-testing-fresh-concrete-slump-test/ (accessed on 23 March 2023).
- Zhou, C.; Shi, S.Q.; Chen, Z.; Cai, L.; Smith, L. Comparative Environmental Life Cycle Assessment of Fiber Reinforced Cement Panel between Kenaf and Glass Fibers. J. Clean. Prod. 2018, 200, 196–204. [Google Scholar] [CrossRef]
- ISO 14044; Environmental Management—Life Cycle Assessment—Requirements and Guidelines. International Organization for Standardization: Geneva, Switzerland, 2006.
- Finnveden, G.; Potting, J. Life Cycle Assessment. In Encyclopedia of Toxicology; Elsevier: Amsterdam, The Netherlands, 2014; pp. 74–77. [Google Scholar]
- Wernet, G.; Bauer, C.; Steubing, B.; Reinhard, J.; Moreno-Ruiz, E.; Weidema, B. The Ecoinvent Database Version 3 (Part I): Overview and Methodology. Int. J. Life Cycle Assess. 2016, 21, 1218–1230. [Google Scholar] [CrossRef]
- Huijbregts, M.A.J.; Steinmann, Z.J.N.; Elshout, P.M.F.; Stam, G.; Verones, F.; Vieira, M.; Zijp, M.; Hollander, A.; van Zelm, R. ReCiPe2016: A Harmonised Life Cycle Impact Assessment Method at Midpoint and Endpoint Level. Int. J. Life Cycle Assess. 2017, 22, 138–147. [Google Scholar] [CrossRef]
- Acero, A.P.; Rodrigez, C.; Ciroth, A. LCIA Methods Impact Assessment Methods in Life Cycle Assessment and Their Impact Categories. Version: 1.5.5. Date: 11 May 2016. Available online: https://www.openlca.org/wp-content/uploads/2016/08/LCIA-METHODS-v.1.5.5.pdf (accessed on 8 March 2023).
- European Commission. Characterisation Factors of the ILCD Recommended Life Cycle Impact Assessment Methods. Database and Supporting Information; European Commission: Luxembourg, 2012.
- European Commission. International Reference Life Cycle Data System (ILCD) Handbook—Recommendations for Life Cycle Impact Assessment in the European Context, 1st ed.; European Commission: Luxemburg, 2011.
- Ramagiri, K.K.; Kara De Maeijer, P.; Kar, A. High-Temperature, Bond, and Environmental Impact Assessment of Alkali-Activated Concrete (AAC). Infrastructures 2022, 7, 119. [Google Scholar] [CrossRef]
- Hildenbrand, J.; Srocka, M.; Siroth, A. Why We Started the Development of OpenLCA. 2005. Available online: https://www.openlca.org/the-idea/ (accessed on 8 March 2023).
- Abbas, R.; Khereby, M.A.; Ghorab, H.Y.; Elkhoshkhany, N. Preparation of Geopolymer Concrete Using Egyptian Kaolin Clay and the Study of Its Environmental Effects and Economic Cost. Clean. Technol. Environ. Policy 2020, 22, 669–687. [Google Scholar] [CrossRef]
- Aziz, H.A.; Ghazali, M.F.; Yusoff, M.S.; Hung, Y.-T. Waste Treatment and Management in Chlor-Alkali Industries. In Handbook of Advanced Industrial and Hazardous Wastes Management, 1st ed.; CRC Press: Boca Raton, FL, USA, 2017. [Google Scholar] [CrossRef]
- Hobson, A.J.; Stewart, D.I.; Mortimer, R.J.G.; Mayes, W.M.; Rogerson, M.; Burke, I.T. Leaching Behaviour of Co-Disposed Steel Making Wastes: Effects of Aeration on Leachate Chemistry and Vanadium Mobilisation. Waste Manag. 2018, 81, 1–10. [Google Scholar] [CrossRef]
- Passuello, A.; Moriconi, G.; Shah, S.P. Cracking Behavior of Concrete with Shrinkage Reducing Admixtures and PVA Fibers. Cem. Concr. Compos. 2009, 31, 699–704. [Google Scholar] [CrossRef]
- Sleeswijk, A.W.; van Oers, L.F.C.M.; Guinée, J.B.; Struijs, J.; Huijbregts, M.A.J. Normalisation in Product Life Cycle Assessment: An LCA of the Global and European Economic Systems in the Year 2000. Sci. Total Environ. 2008, 390, 227–240. [Google Scholar] [CrossRef] [PubMed]
- Stefanini, R.; Borghesi, G.; Ronzano, A.; Vignali, G. Plastic or Glass: A New Environmental Assessment with a Marine Litter Indicator for the Comparison of Pasteurized Milk Bottles. Int. J. Life Cycle Assess. 2021, 26, 767–784. [Google Scholar] [CrossRef]
- Stocker, T. IPCC Summary for Policymakers in Climate Change 2013: The Physical Science Basis, 1st ed.; Cambridge University Press: New York, NY, USA, 2013. [Google Scholar]
- Joos, F.; Roth, R.; Fuglestvedt, J.S.; Peters, G.P.; Enting, I.G.; von Bloh, W.; Brovkin, V.; Burke, E.J.; Eby, M.; Edwards, N.R.; et al. Carbon Dioxide and Climate Impulse Response Functions for the Computation of Greenhouse Gas Metrics: A Multi-Model Analysis. Atmos. Chem. Phys. 2013, 13, 2793–2825. [Google Scholar] [CrossRef] [Green Version]
- Rosenbaum, R.K.; Bachmann, T.M.; Gold, L.S.; Huijbregts, M.A.J.; Jolliet, O.; Juraske, R.; Koehler, A.; Larsen, H.F.; MacLeod, M.; Margni, M.; et al. USEtox—The UNEP-SETAC Toxicity Model: Recommended Characterisation Factors for Human Toxicity and Freshwater Ecotoxicity in Life Cycle Impact Assessment. Int. J. Life Cycle Assess. 2008, 13, 532–546. [Google Scholar] [CrossRef] [Green Version]


| Composition (%) | GGBS | Fly Ash | PC |
|---|---|---|---|
| CaO (%) | 37.63 | 3.80 | 65.23 |
| SiO2 (%) | 34.81 | 48.81 | 18.64 |
| Al2O3 (%) | 17.92 | 31.40 | 5.72 |
| MgO (%) | 7.80 | 0.70 | 0.85 |
| SO3 (%) | 0.20 | 0.91 | 2.34 |
| Fe2O3 (%) | 0.66 | 7.85 | 4.54 |
| TiO2 (%) | - | 2.93 | 0.5 |
| K2O (%) | - | 1.52 | 0.59 |
| Na2O (%) | - | 1.04 | - |
| MnO (%) | 0.21 | - | - |
| LOI (%) | 1.41 | 3.00 | 1.69 |
| Strength activity index (%) | 114.46 | 96.46 | - |
| d50 (µm) | 13.93 | 51.90 | - |
| Blaine fineness (m2/kg) | 386.00 | 327.00 | 285 |
| Specific gravity | 2.71 | 2.06 | - |
| Material | S100 | FS70 | FS50 | PCC | FS50—SF0.3 | FS50—GF0.3 | FS50—PP0.3 |
|---|---|---|---|---|---|---|---|
| GGBS | 450 | 315 | 225 | - | 225 | 225 | 225 |
| Fly ash | - | 135 | 225 | - | 225 | 225 | 225 |
| Cement | - | - | - | 450 | - | - | - |
| Sodium silicate | 65.82 | 65.82 | 65.82 | - | 65.82 | 65.82 | 65.82 |
| Sodium hydroxide | 12.48 | 12.48 | 12.48 | - | 12.48 | 12.48 | 12.48 |
| Water | 170.21 | 170.21 | 170.21 | 150 | 170.21 | 170.21 | 170.21 |
| Fine aggregates | 645 | 645 | 645 | 623 | 645 | 645 | 645 |
| Coarse aggregates | 967 | 967 | 967 | 1084 | 967 | 967 | 967 |
| Steel fibers | - | - | - | - | 23.55 | - | - |
| Glass fibers | - | - | - | - | - | 7.80 | - |
| Polypropylene fibers | - | - | - | - | - | - | 2.715 |
| Raw Materials | Distance (km) | Cost (per kg in INR) |
|---|---|---|
| Fly ash | 202 | 4.8 |
| GGBS | 648 | 18 |
| Portland Cement | 231 | 8.3 |
| Sodium hydroxide | 28.4 | 106.2 |
| Sodium silicate | 22.8 | 81 |
| Fine aggregates | 14.6 | 2.6 |
| Coarse aggregates | 14.6 | 0.65 |
| Water | - | 0.035 |
| Glass fibers | 640 | 466.2 |
| Steel fibers | 23.4 | 156 |
| Polypropylene fibers | 23.4 | 494 |
| Midpoint Impact Category | Indicator | Characterization Factor | Unit |
|---|---|---|---|
| Climate change | Increase in infrared radiative force | Global Warming Potential (GWP) | kg CO2-eq to air |
| Ozone Depletion | Stratospheric ozone decrease | Ozone Depletion Potential (ODP) | kg CFC-11-eq to air |
| Photochemical oxidant formation: terrestrial ecosystems | Increase in tropospheric ozone | Photochemical oxidant formation potential: ecosystems (EOFP) | kg NOx-eq to air |
| Terrestrial Acidification | Proton increase in natural soils | Terrestrial Acidification Potential (TAP) | kg SO2-eq to air |
| Freshwater Eutrophication | Phosphorous increase in freshwater | Freshwater Eutrophication Potential (FEP) | kg P-eq to freshwater |
| Human Toxicity (Cancer) | Increase in risk of cancer disease | Human Toxicity Potential (HTPC) | kg 1,4 DCB-eq to urban air |
| Terrestrial Ecotoxicity | Hazard-weighted increase in natural soils | Terrestrial Ecotoxicity Potential (TEP) | kg 1,4 DCB-eq to industrial soil |
| Freshwater Ecotoxicity | Hazard-weighted increase in freshwater | Freshwater Ecotoxicity Potential (FETP) | kg 1,4 DCB-eq to freshwater |
| Marine Ecotoxicity | Hazard-weighted increase in marine water | Marine Ecotoxicity Potential (METP) | kg 1,4 DCB-eq to marine water |
| Fossil Resource Scarcity | Upper heating value | Fossil Fuel Potential (FFP) | kg oil-eq |
| Materials | GWP (kg CO2-eq) | ODP (kg CFC-11-eq) | EOFP (kg NOx-eq) | TAP (kg SO2-eq) | FEP (kg P-eq) | HTPC (kg 1,4 DCB-eq) | TEP (kg 1,4 DCB-eq) | FETP (kg 1,4 DCB-eq) | METP (kg 1,4 DCB-eq) | FFP (kg oil-eq) |
|---|---|---|---|---|---|---|---|---|---|---|
| Fly ash | 0 | 0 | 0 | 0 | 0 | 0 | 0 | 0 | 0 | 0 |
| GGBS | 0.10088 | 2.97 × 10⁻⁸ | 2.60 × 10⁻⁴ | 0.00036 | 4.70 × 10⁻⁵ | 0.02181 | 0.58493 | 0.0213 | 0.02811 | 0.02076 |
| PC | 0.88534 | 8.10 × 10⁻⁸ | 2.26 × 10⁻³ | 0.0018 | 0.00016 | 0.01528 | 0.32095 | 0.00757 | 0.0102 | 0.11112 |
| Sodium silicate | 0.82784 | 6.98 × 10⁻⁷ | 2.13 × 10⁻³ | 0.00296 | 0.00037 | 0.0873 | 1.88792 | 0.067 | 0.08638 | 0.21411 |
| Sodium hydroxide | 1.31505 | 1.42 × 10⁻⁶ | 3.49 × 10⁻³ | 0.00479 | 0.00065 | 0.10876 | 2.11257 | 0.07081 | 0.09197 | 0.32831 |
| Sand | 0.04052 | 1.23 × 10⁻⁸ | 2.10 × 10⁻⁴ | 0.00021 | 7.49 × 10⁻⁶ | 0.00192 | 0.16937 | 0.0006 | 0.0009 | 0.01002 |
| Gravel | 0.00736 | 5.73 × 10⁻⁹ | 4.44 × 10⁻⁵ | 3.06 × 10⁻⁵ | 2.48 × 10⁻⁶ | 0.00152 | 0.00754 | 0.00026 | 0.00034 | 0.00207 |
| Water | 0.00069 | 1.79 × 10⁻¹⁰ | 1.59 × 10⁻⁶ | 2.35 × 10⁻⁶ | 3.47 × 10⁻⁷ | 4.63 × 10⁻⁵ | 2.19 × 10⁻³ | 1.79 × 10⁻⁵ | 2.40 × 10⁻⁵ | 1.80 × 10⁻⁴ |
| a PP | 3.67331 | 6.71 × 10⁻⁷ | 8.40 × 10⁻³ | 0.01054 | 0.00108 | 0.16727 | 2.75053 | 0.10024 | 0.13024 | 2.06367 |
| b SF | 0.33416 | 1.08 × 10⁻⁷ | 5.60 × 10⁻⁴ | 0.00074 | 0.00016 | 0.2654 | 0.31172 | 0.01734 | 0.02343 | 0.05525 |
| c GF | 2.56128 | 3.47 × 10⁻⁶ | 9.91 × 10⁻³ | 0.0126 | 0.00069 | 0.1393 | 3.72584 | 0.08608 | 0.11299 | 0.68652 |
| Impact Category | Unit | World (2010) H Normalization Factors |
|---|---|---|
| Climate change | kg CO2-eq to air | 4.18 × 10¹³ |
| Ozone Depletion | kg CFC-11-eq to air | 2.10 × 10⁸ |
| Photochemical oxidant formation: terrestrial ecosystems | kg NOx-eq to air | 3.51 × 10¹¹ |
| Terrestrial Acidification | kg SO2-eq to air | 3.18 × 10¹¹ |
| Freshwater Eutrophication | kg P-eq to freshwater | 3.77 × 101 |
| Human Toxicity (Cancer) | kg 1,4 DCB-eq to urban air | 1.20 × 10¹² |
| Terrestrial Ecotoxicity | kg 1,4 DCB-eq to industrial soil | 3.72 × 10¹⁰ |
| Freshwater Ecotoxicity | kg 1,4 DCB-eq to freshwater | 2.94 × 10¹⁰ |
| Marine Ecotoxicity | kg 1,4 DCB-eq to marine water | 2.85 × 10¹⁰ |
| Fossil Resource Scarcity | kg oil-eq | 7.78 × 10¹² |
Disclaimer/Publisher’s Note: The statements, opinions and data contained in all publications are solely those of the individual author(s) and contributor(s) and not of MDPI and/or the editor(s). MDPI and/or the editor(s) disclaim responsibility for any injury to people or property resulting from any ideas, methods, instructions or products referred to in the content. |
© 2023 by the authors. Licensee MDPI, Basel, Switzerland. This article is an open access article distributed under the terms and conditions of the Creative Commons Attribution (CC BY) license (https://creativecommons.org/licenses/by/4.0/).
Share and Cite
Chottemada, P.G.; Kar, A.; Kara De Maeijer, P. Environmental Impact Analysis of Alkali-Activated Concrete with Fiber Reinforcement. Infrastructures 2023, 8, 68. https://doi.org/10.3390/infrastructures8040068
Chottemada PG, Kar A, Kara De Maeijer P. Environmental Impact Analysis of Alkali-Activated Concrete with Fiber Reinforcement. Infrastructures. 2023; 8(4):68. https://doi.org/10.3390/infrastructures8040068
Chicago/Turabian StyleChottemada, Pujitha Ganapathi, Arkamitra Kar, and Patricia Kara De Maeijer. 2023. "Environmental Impact Analysis of Alkali-Activated Concrete with Fiber Reinforcement" Infrastructures 8, no. 4: 68. https://doi.org/10.3390/infrastructures8040068