
A Risk Assessment Technique for Energy-Efficient Drones to Support Pilots and Ensure Safe Flying
 , , and
Abstract
:1. Introduction
1.1. General Overview of Energy Efficiency and Emission of Different Areas of Transport
1.2. Overview of Unmanned Aerial Vehicles
1.2.1. History as Well as General and Unique Applications of Unmanned Aerial Vehicles
- aviation;
- aerial and real estate photography, as well as videography;
- mapping and surveying, disaster zone mapping, disaster relief, and hidden area exploration;
- asset inspection and control, aerial surveillance, monitoring poachers, and insurance;
- payload carrying and parcel delivery;
- agriculture, bird control, crop spraying, crop monitoring, and precision farming;
- multispectral/thermal/NIR (near-infrared) cameras;
- live streaming events;
- roof inspections;
- emergency response, search and rescue, and marine rescue;
- forensics;
- construction and mining;
- military and firefighting;
- oil rigs and power line monitoring;
- medical applications;
- meteorology;
- wireless communication;
- and so on.
1.2.2. International Literature Review on Unmanned Aerial Vehicles in Special Applications
1.3. Novelty, Essence, and Structure of the Current Article
2. Materials and Methods
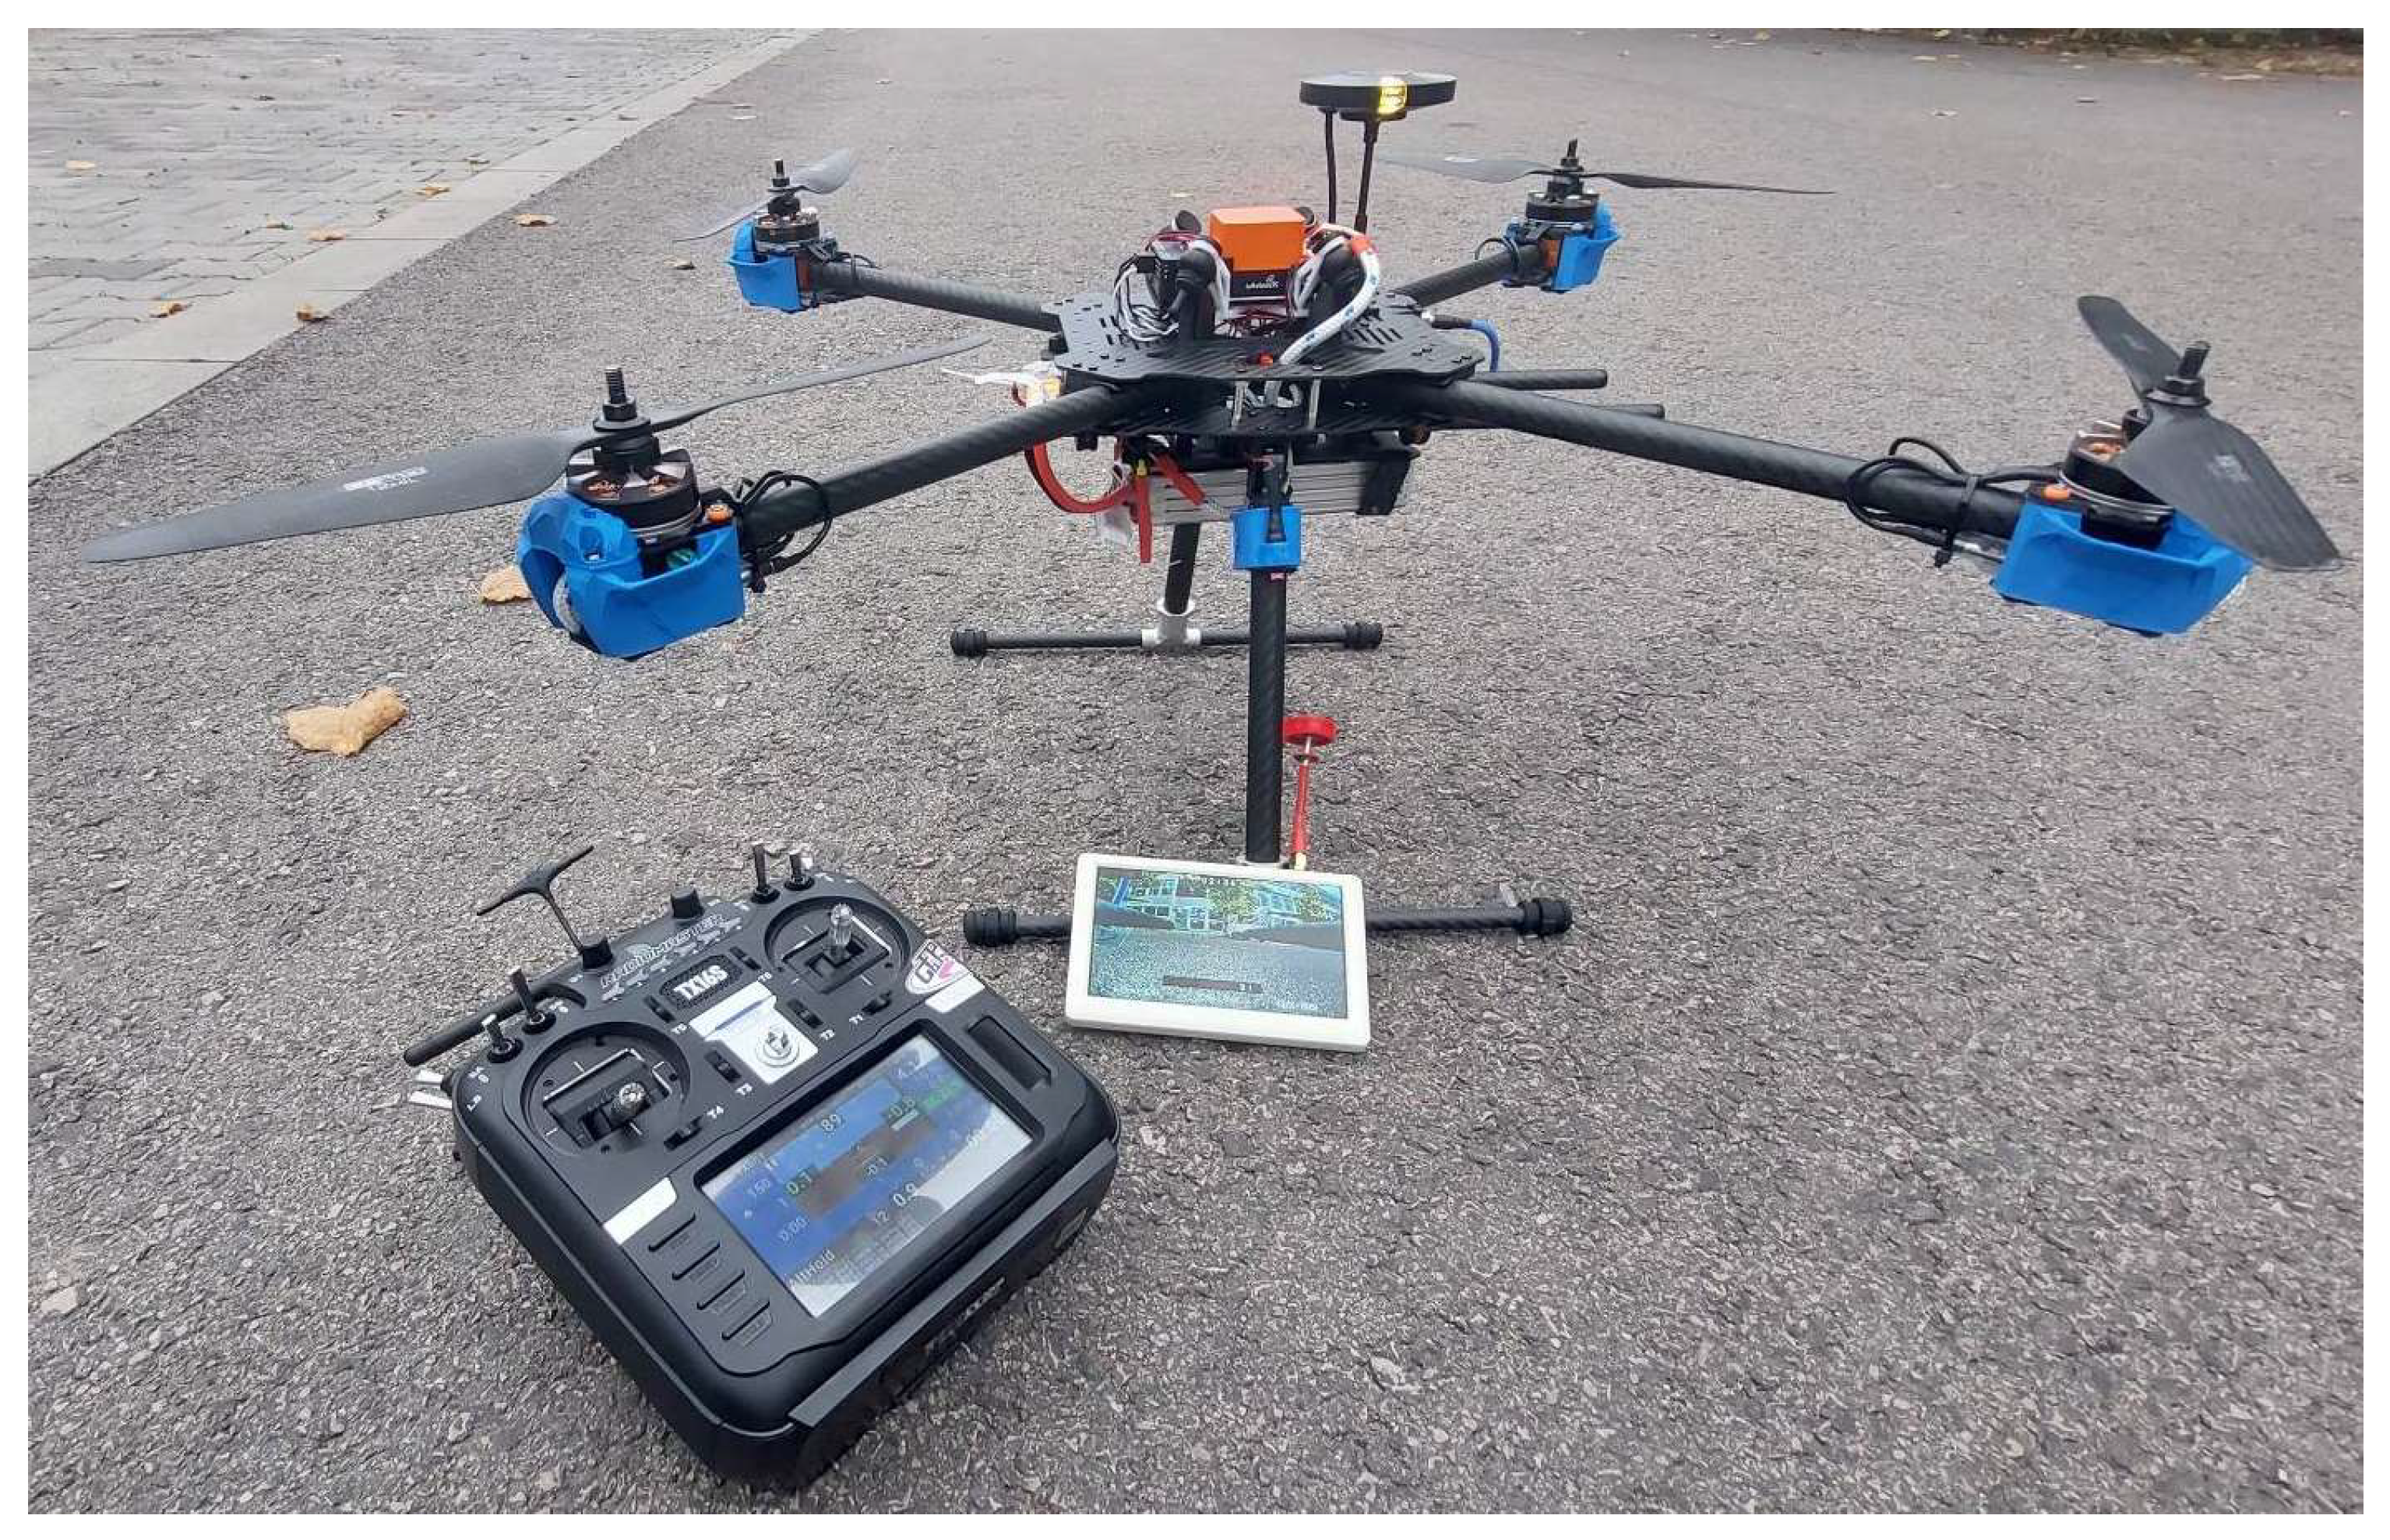
2.1. Overview of UAV Design
- motor consumption:
- ○
- 10.8 A per motor at 100% assumed average load;
- ○
- 6.9 A per motor at 75% assumed average load;
- ○
- 4.9 A per motor at 65% assumed average load;
- ○
- 2.5 A per motor at 50% assumed average load;
- consumption of additional units:
- ○
- 2 A assumed consumption due to control and telemetry systems;
- the expected energy demand of the construction (approximate, may vary depending on take-off weight):
- ○
- 3.7 Ah (battery capacity)/44 A (average load)~5 min (expected flight time);
- ○
- 3.7 Ah (battery capacity)/22 A (average load)~10 min (expected flight time);
- ○
- 3.7 Ah (battery capacity)/11 A (average load)~20 min (expected flight time);
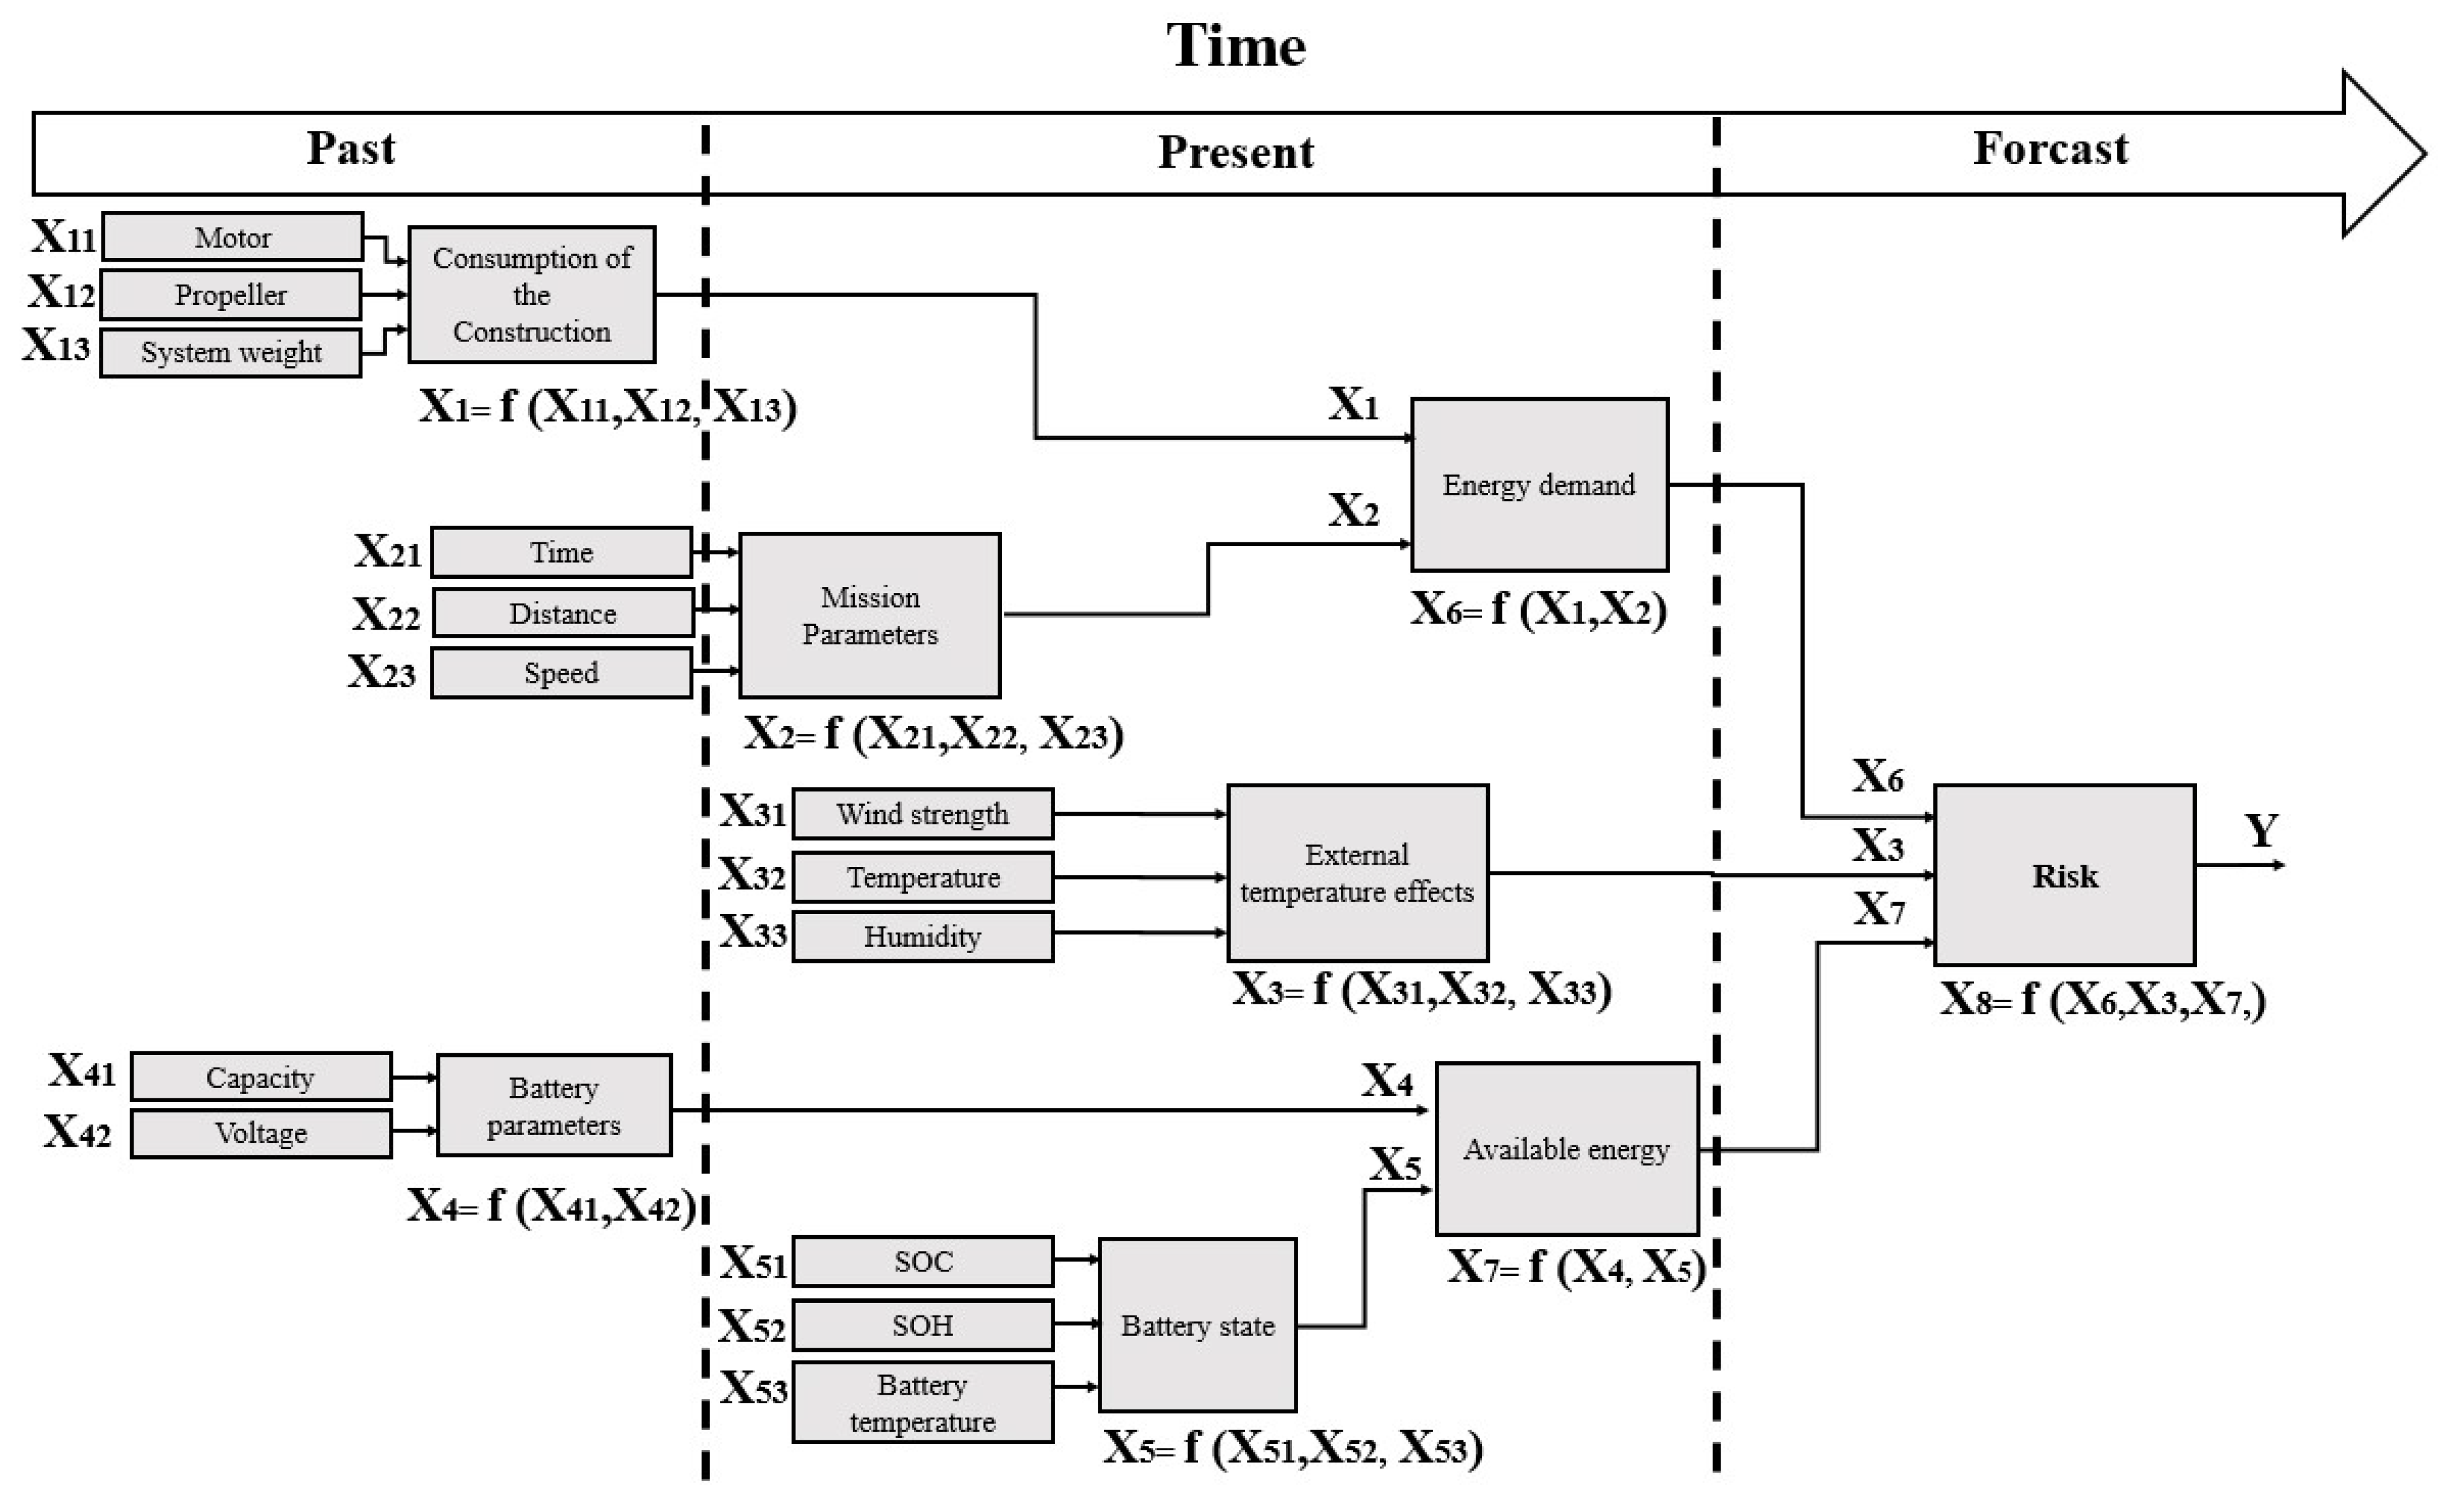
2.2. Concept of Risk Analysis and Parameter Determination
3. Results and Discussion
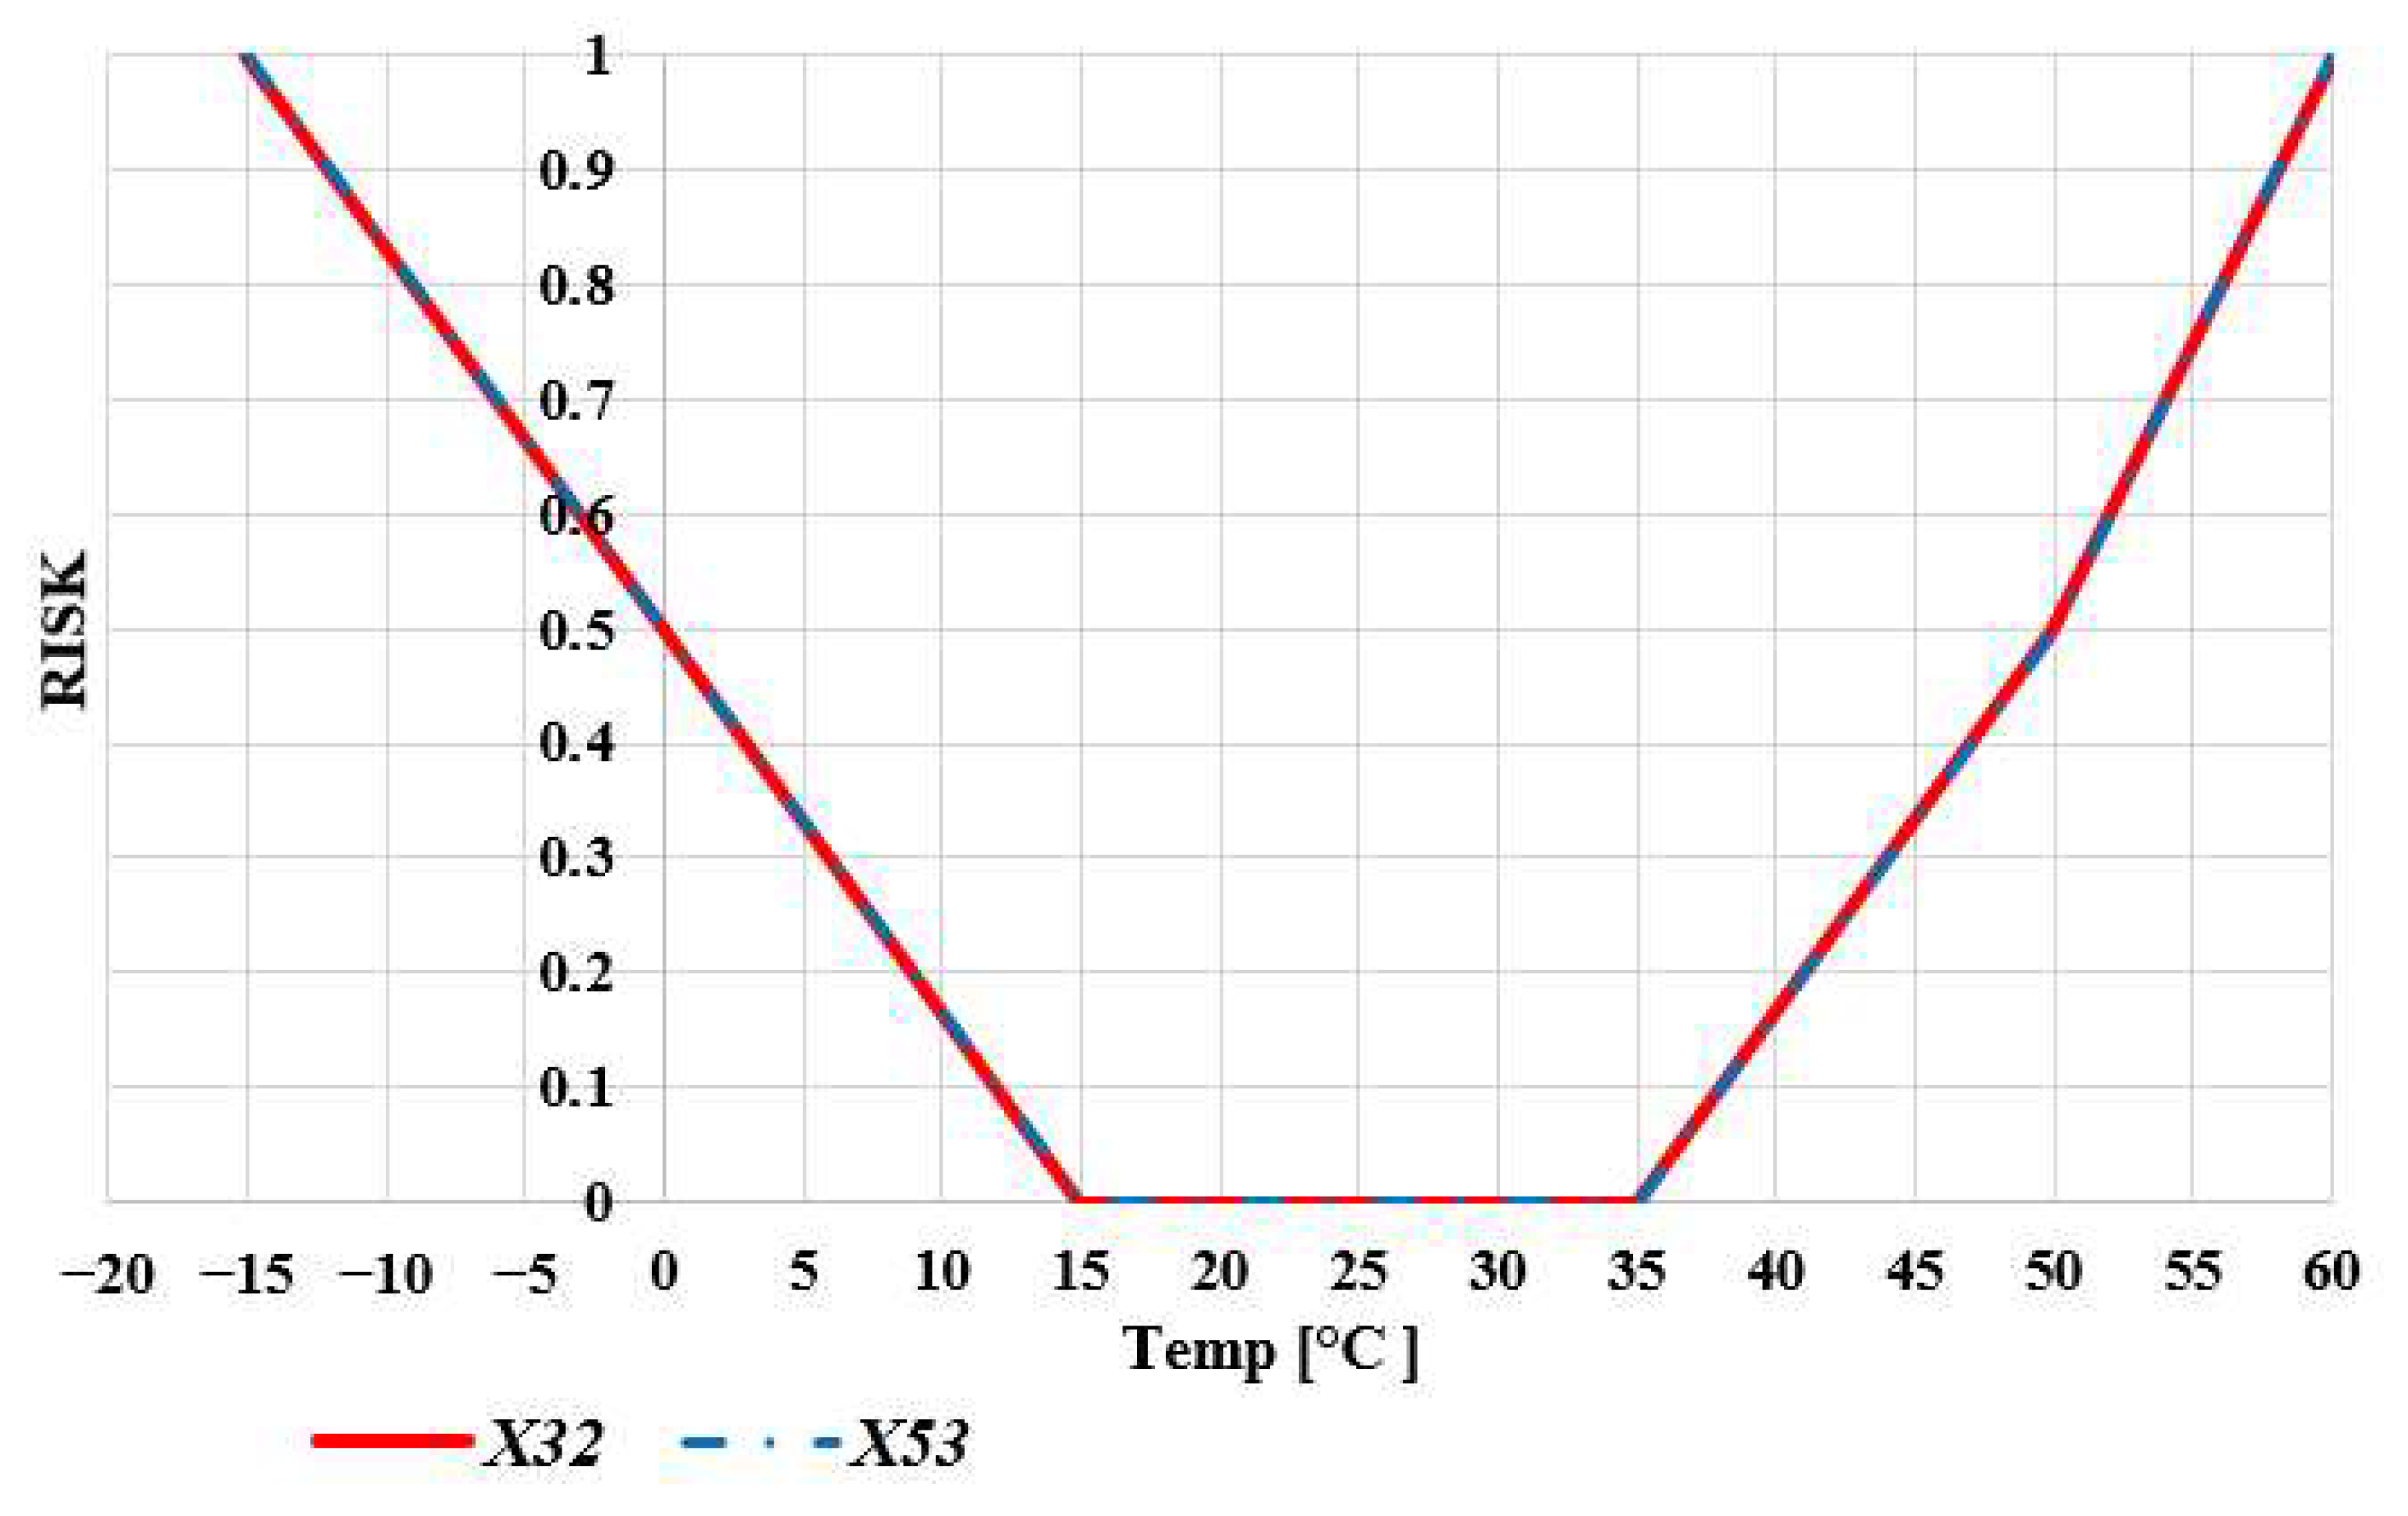
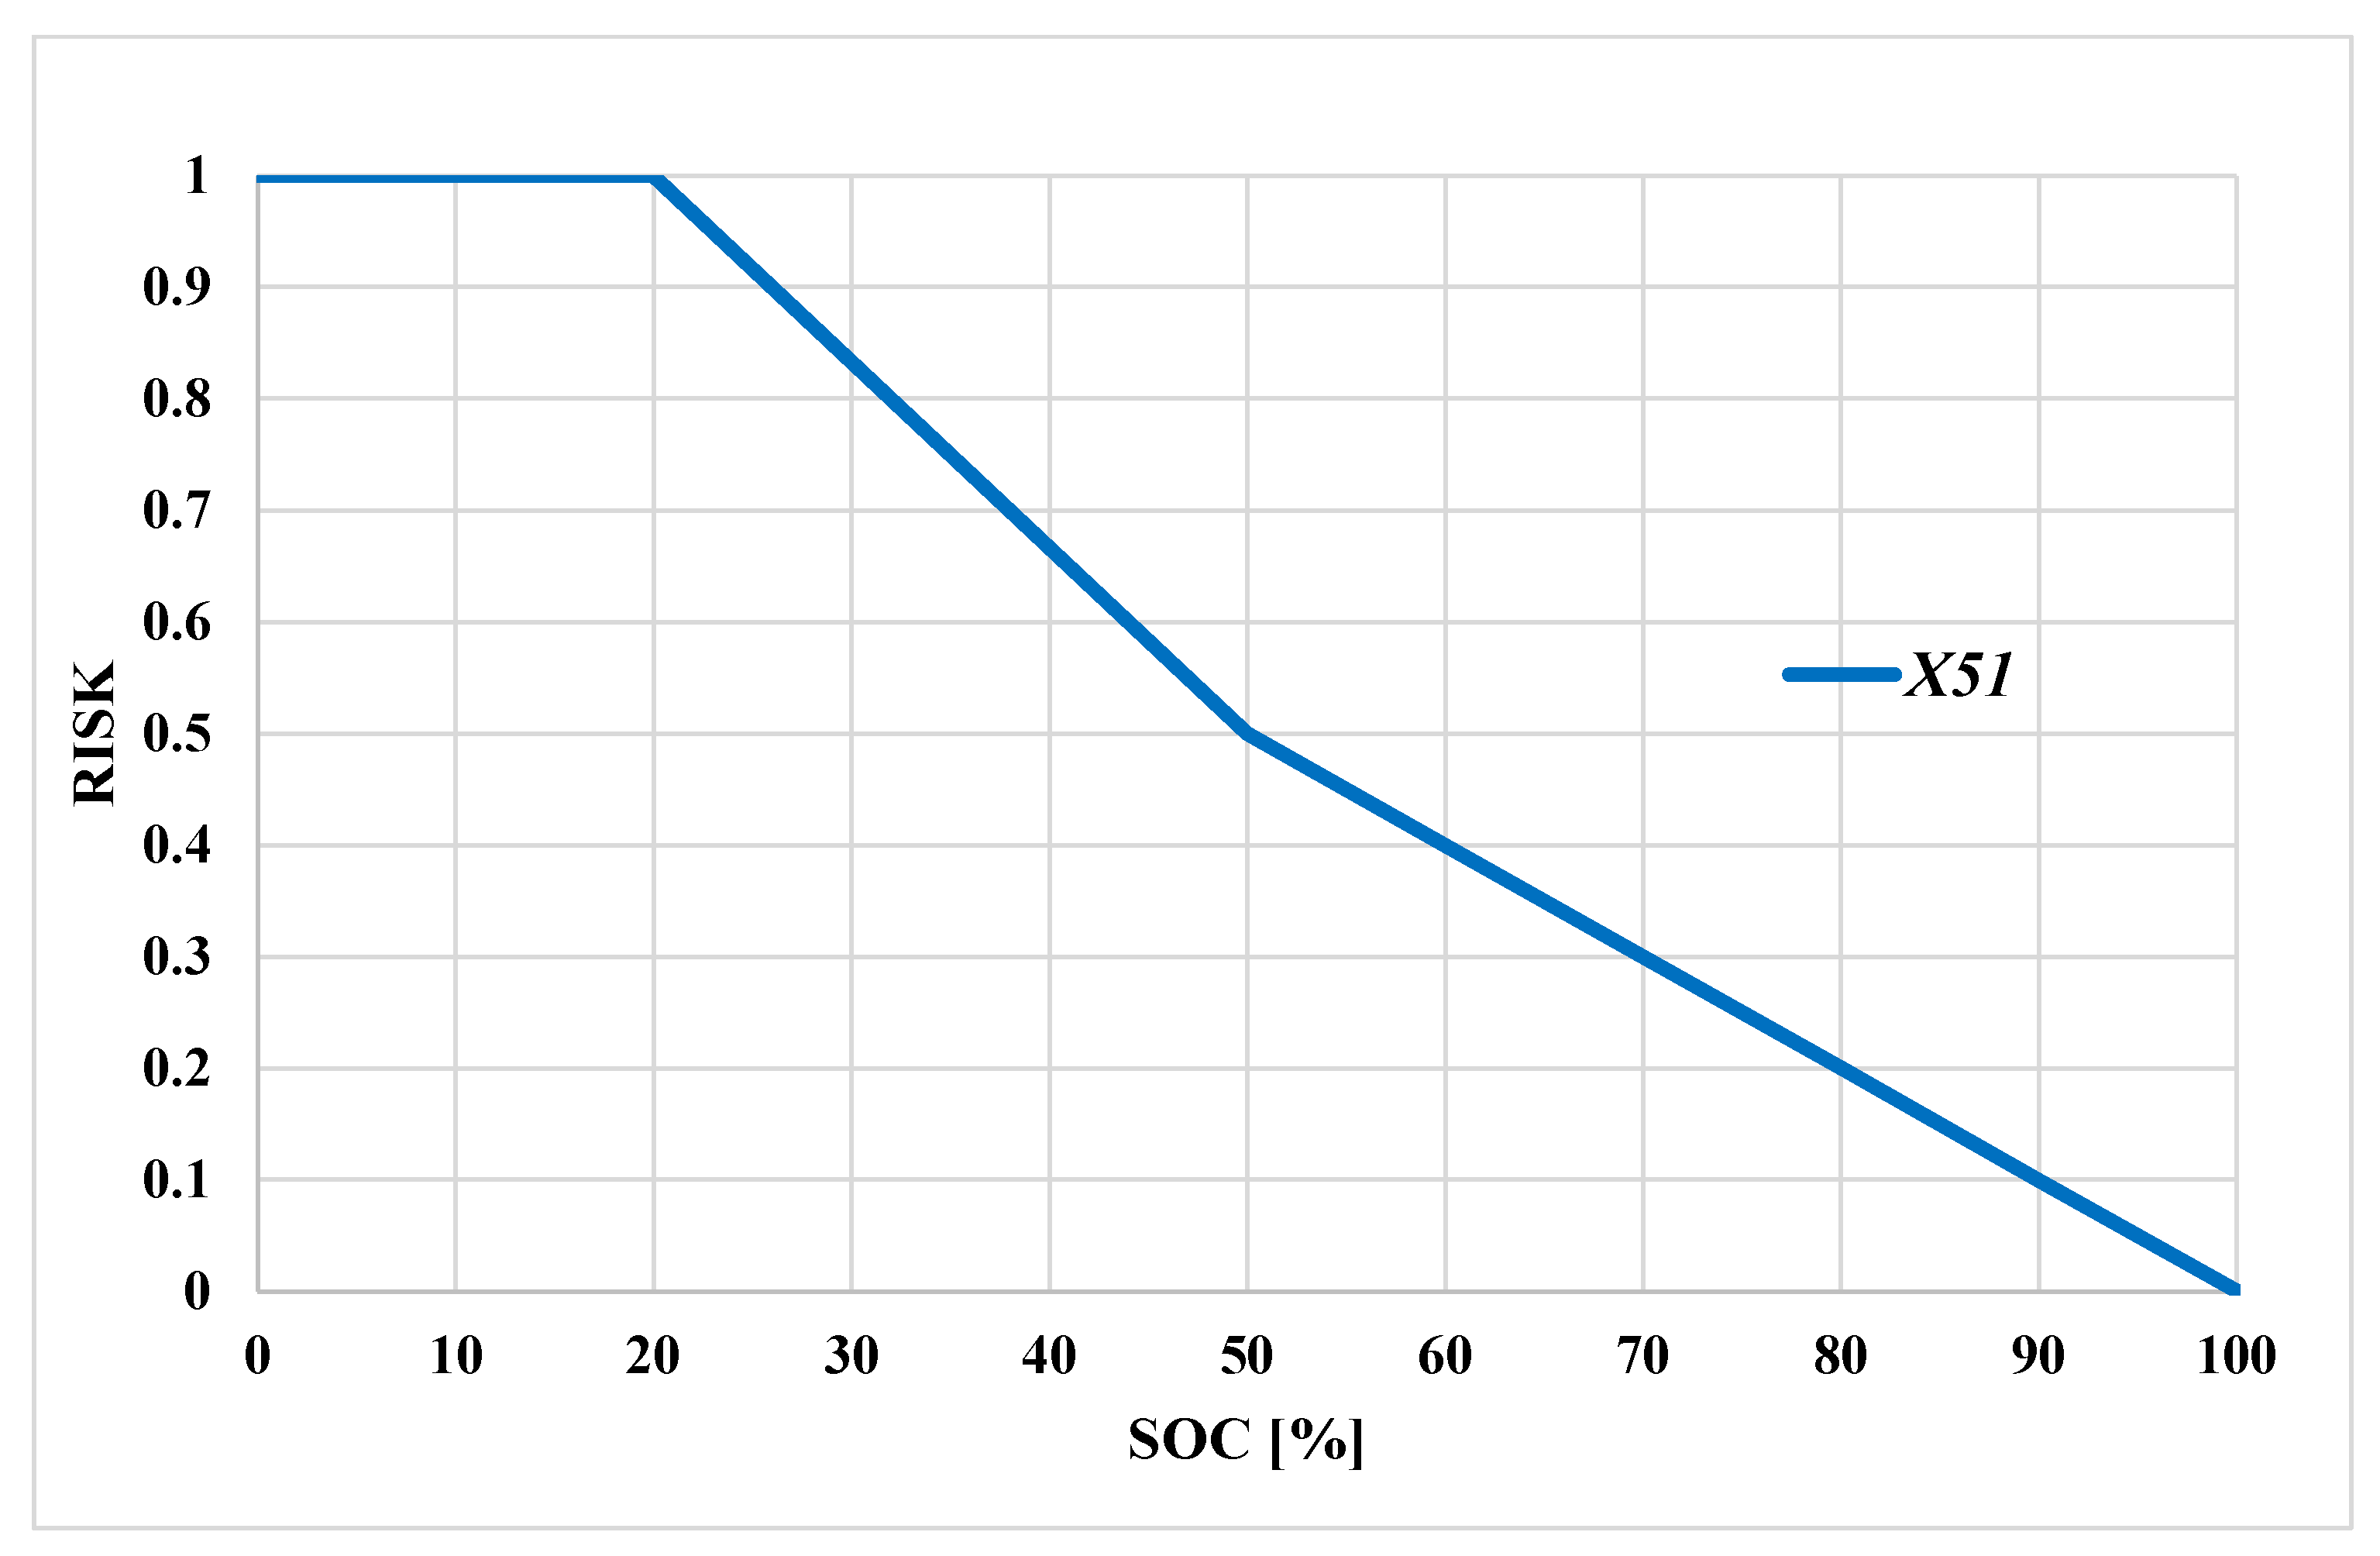
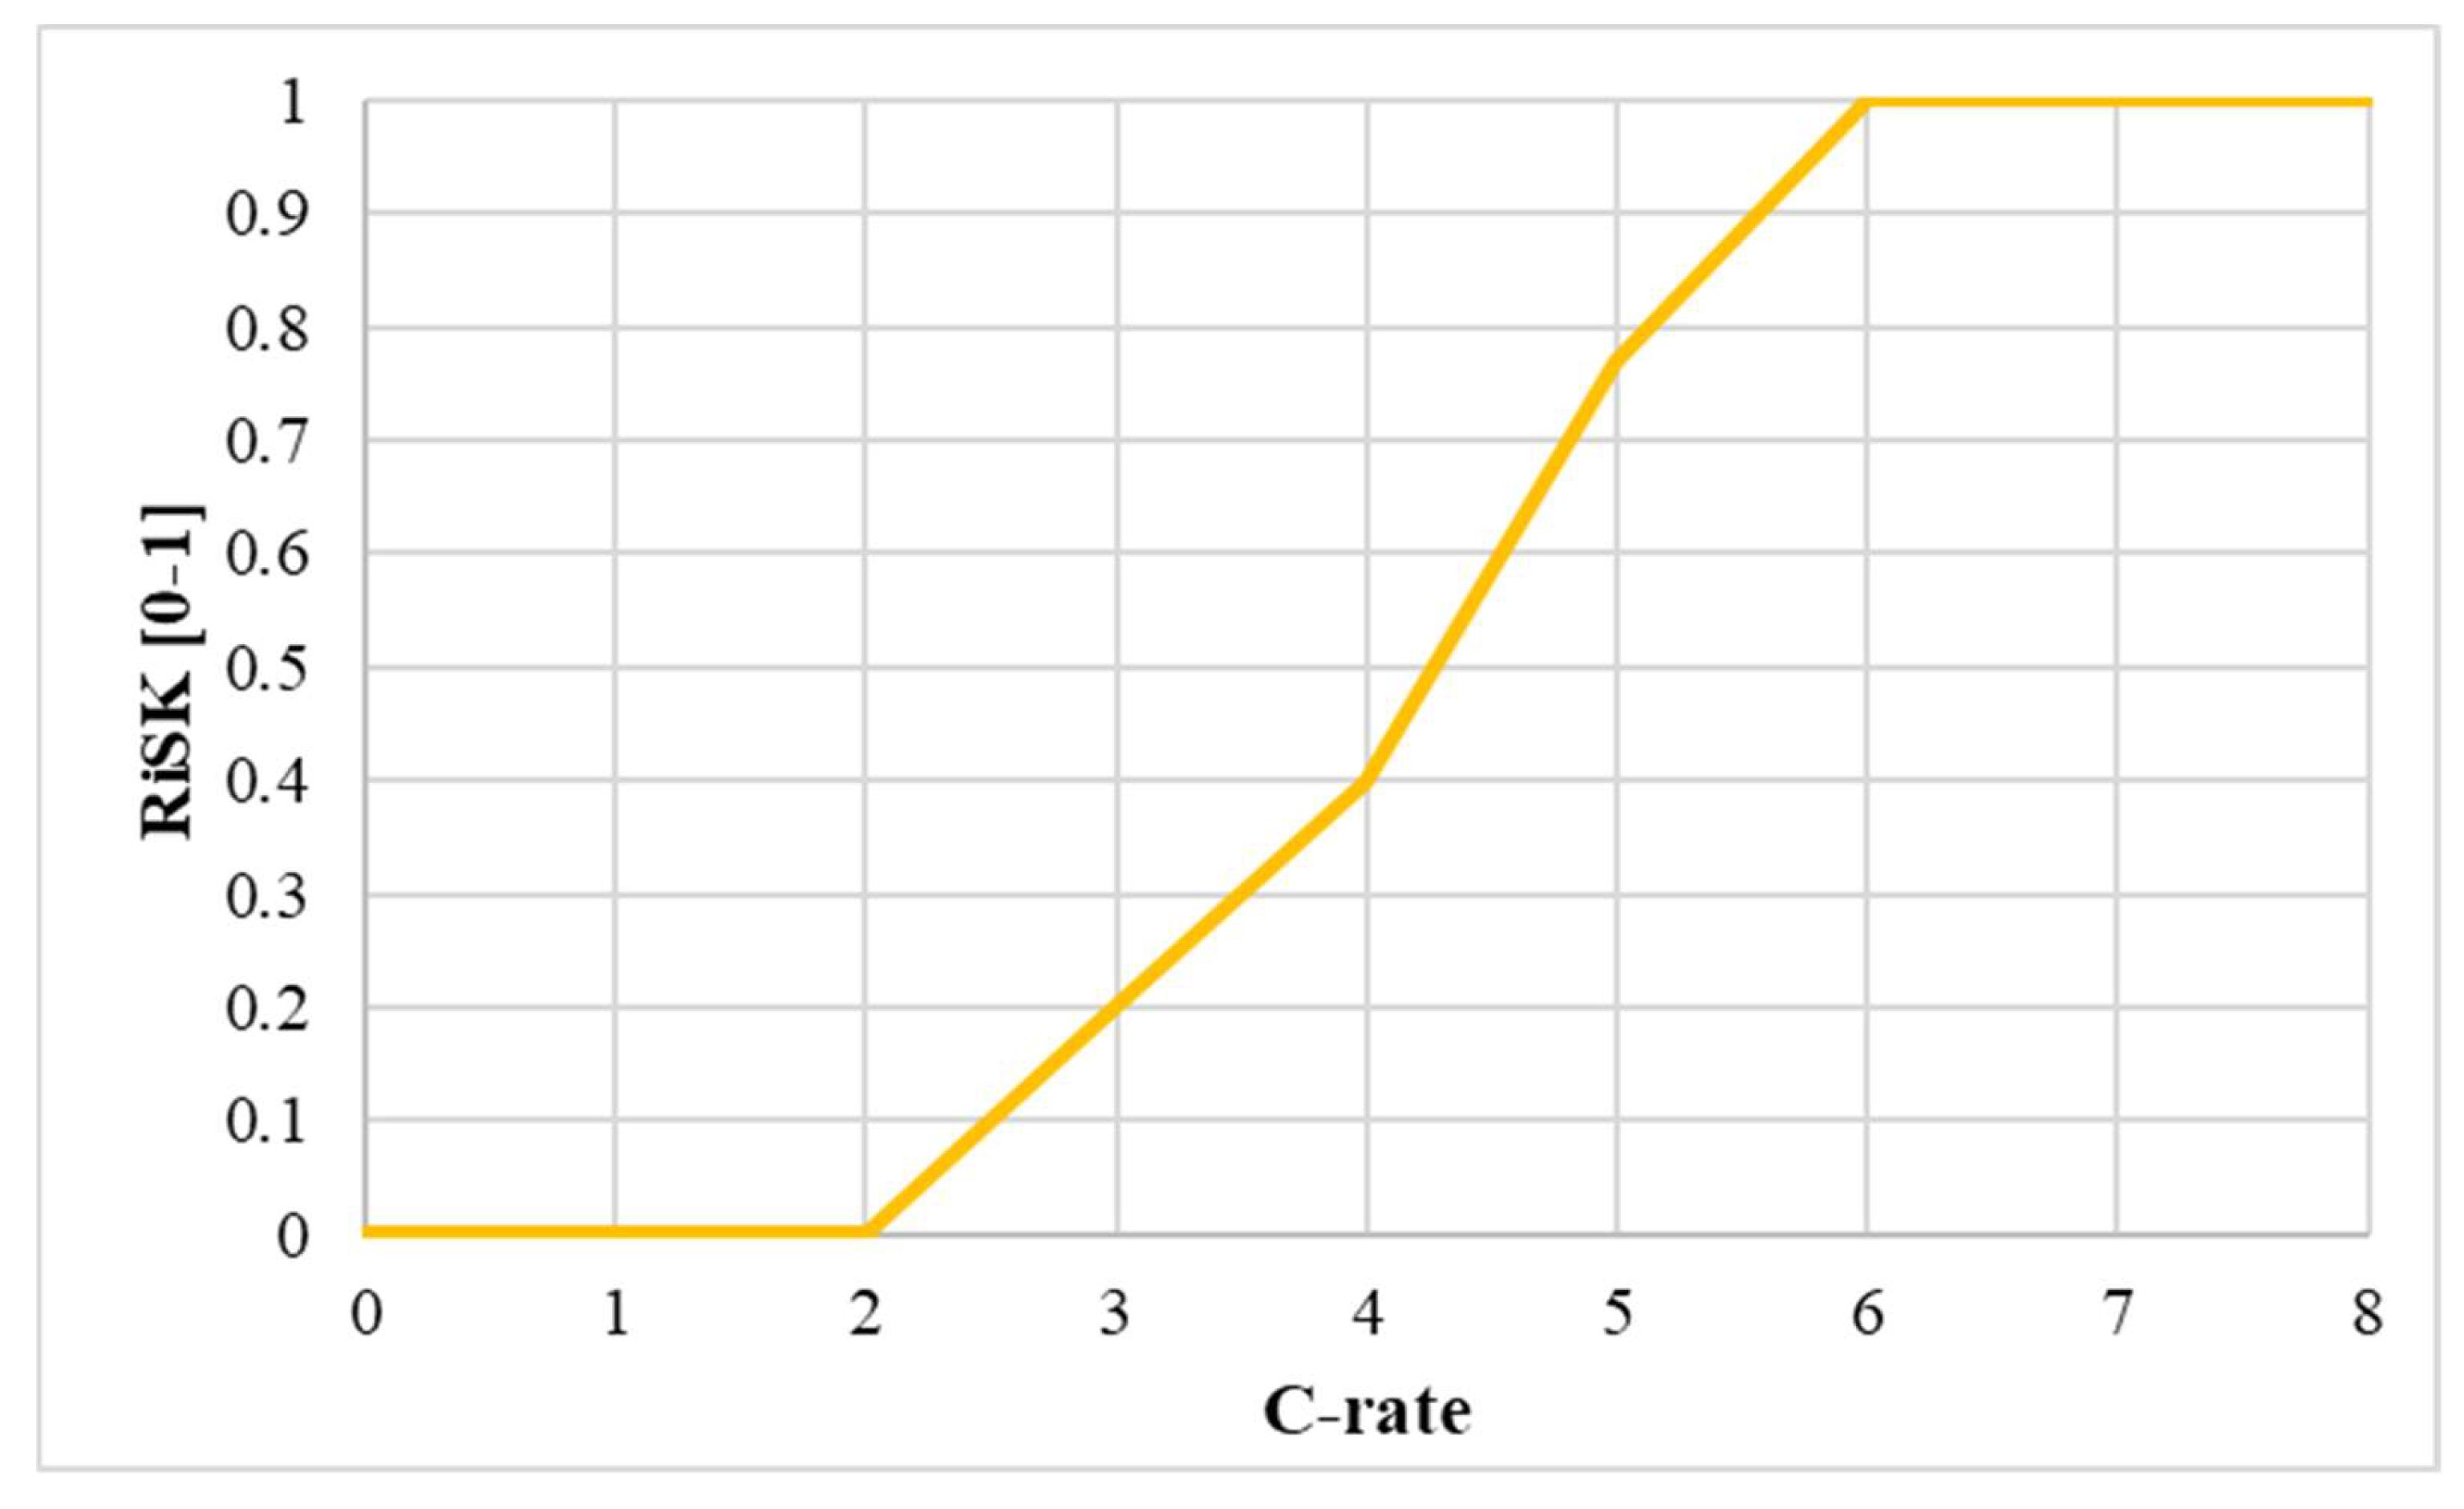
3.1. Risk Calculation
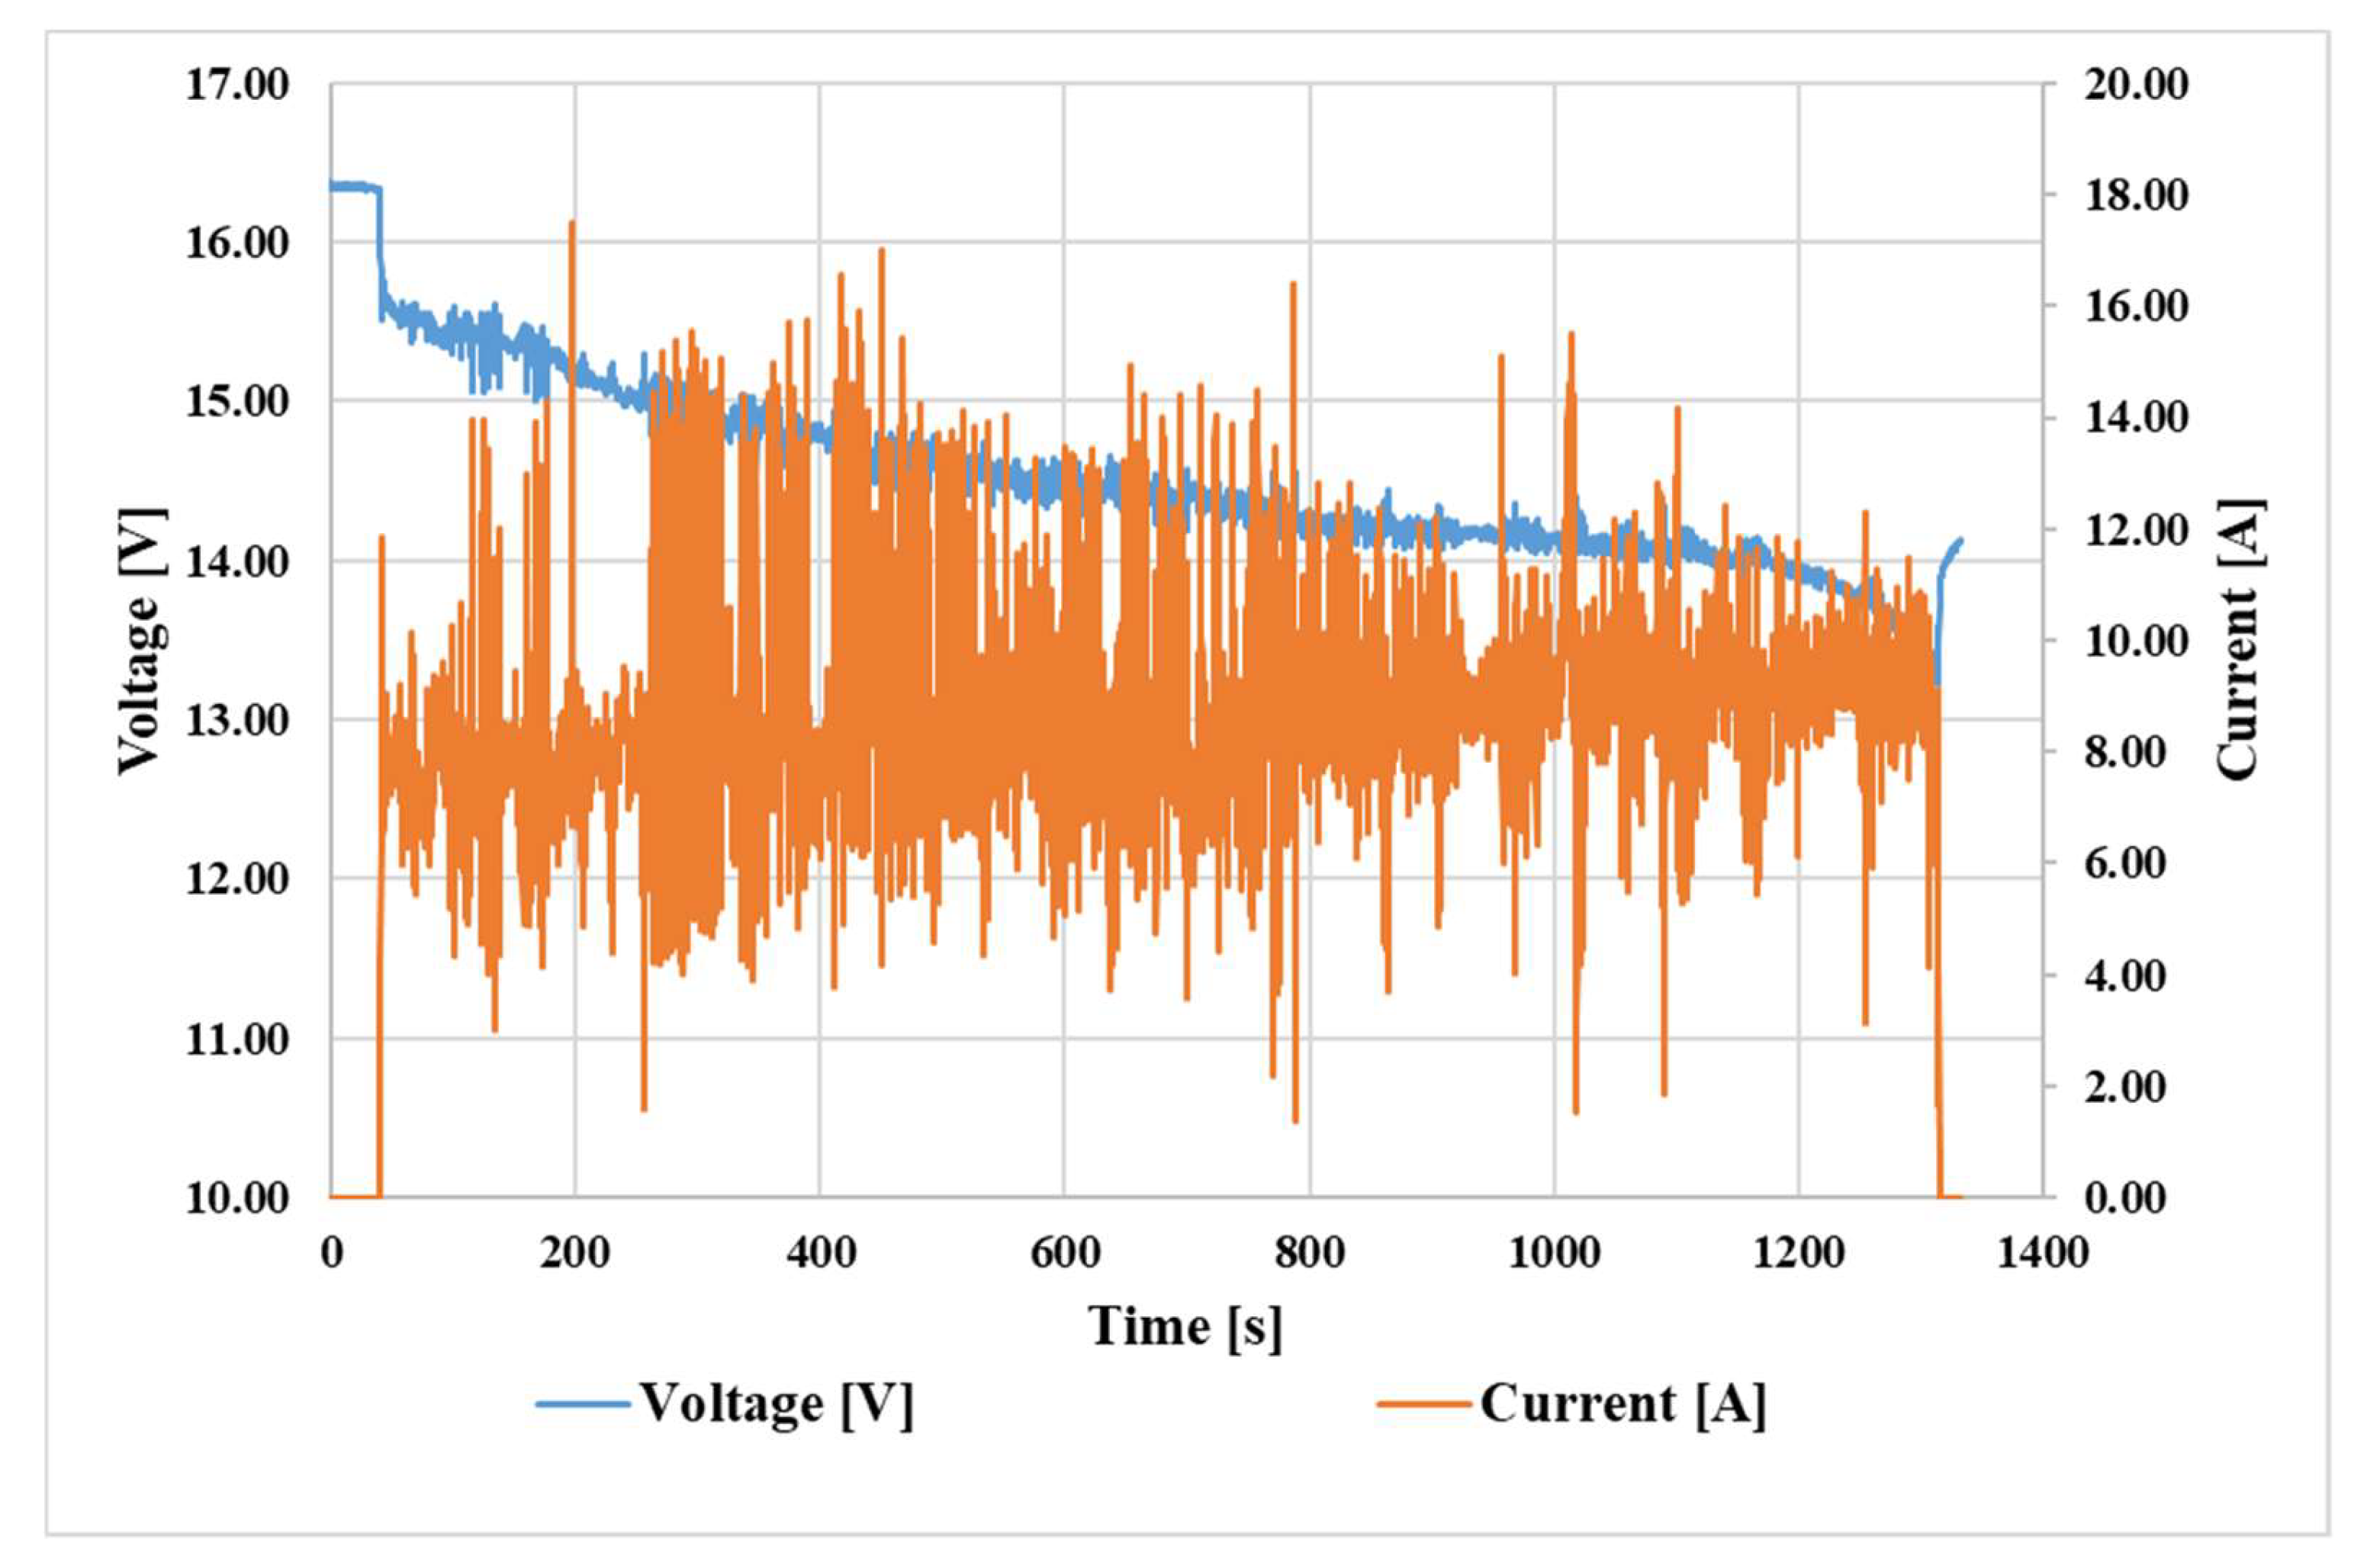
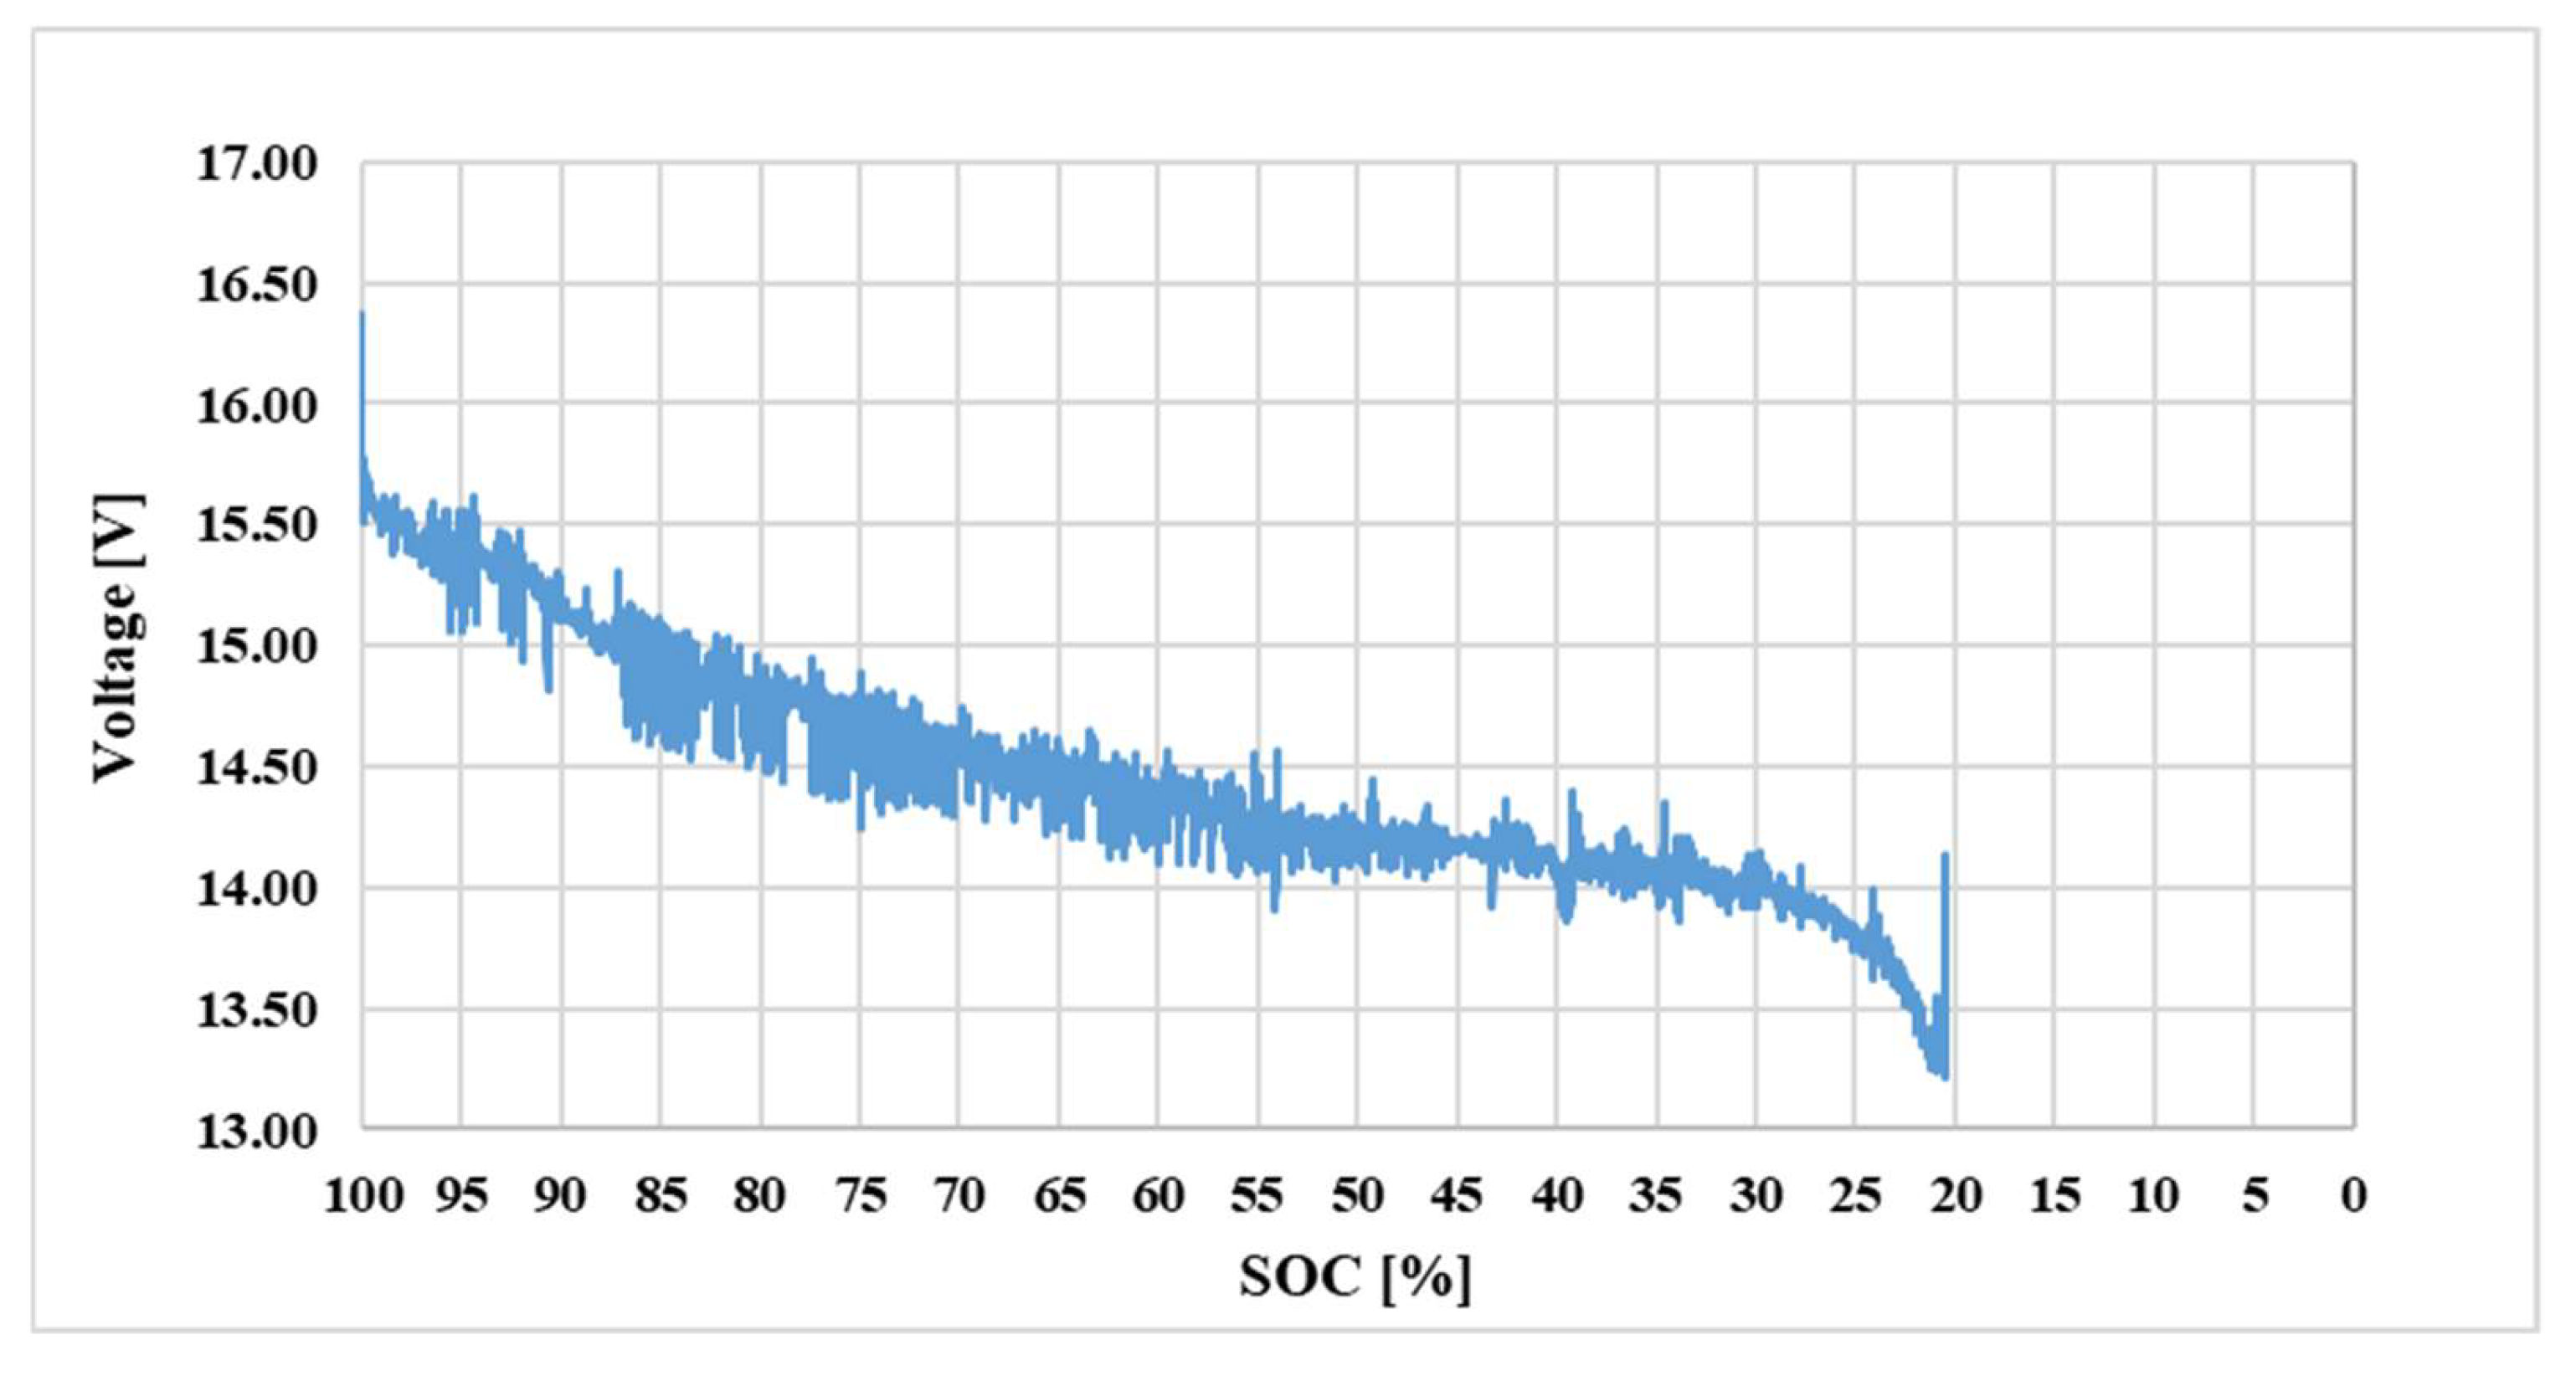
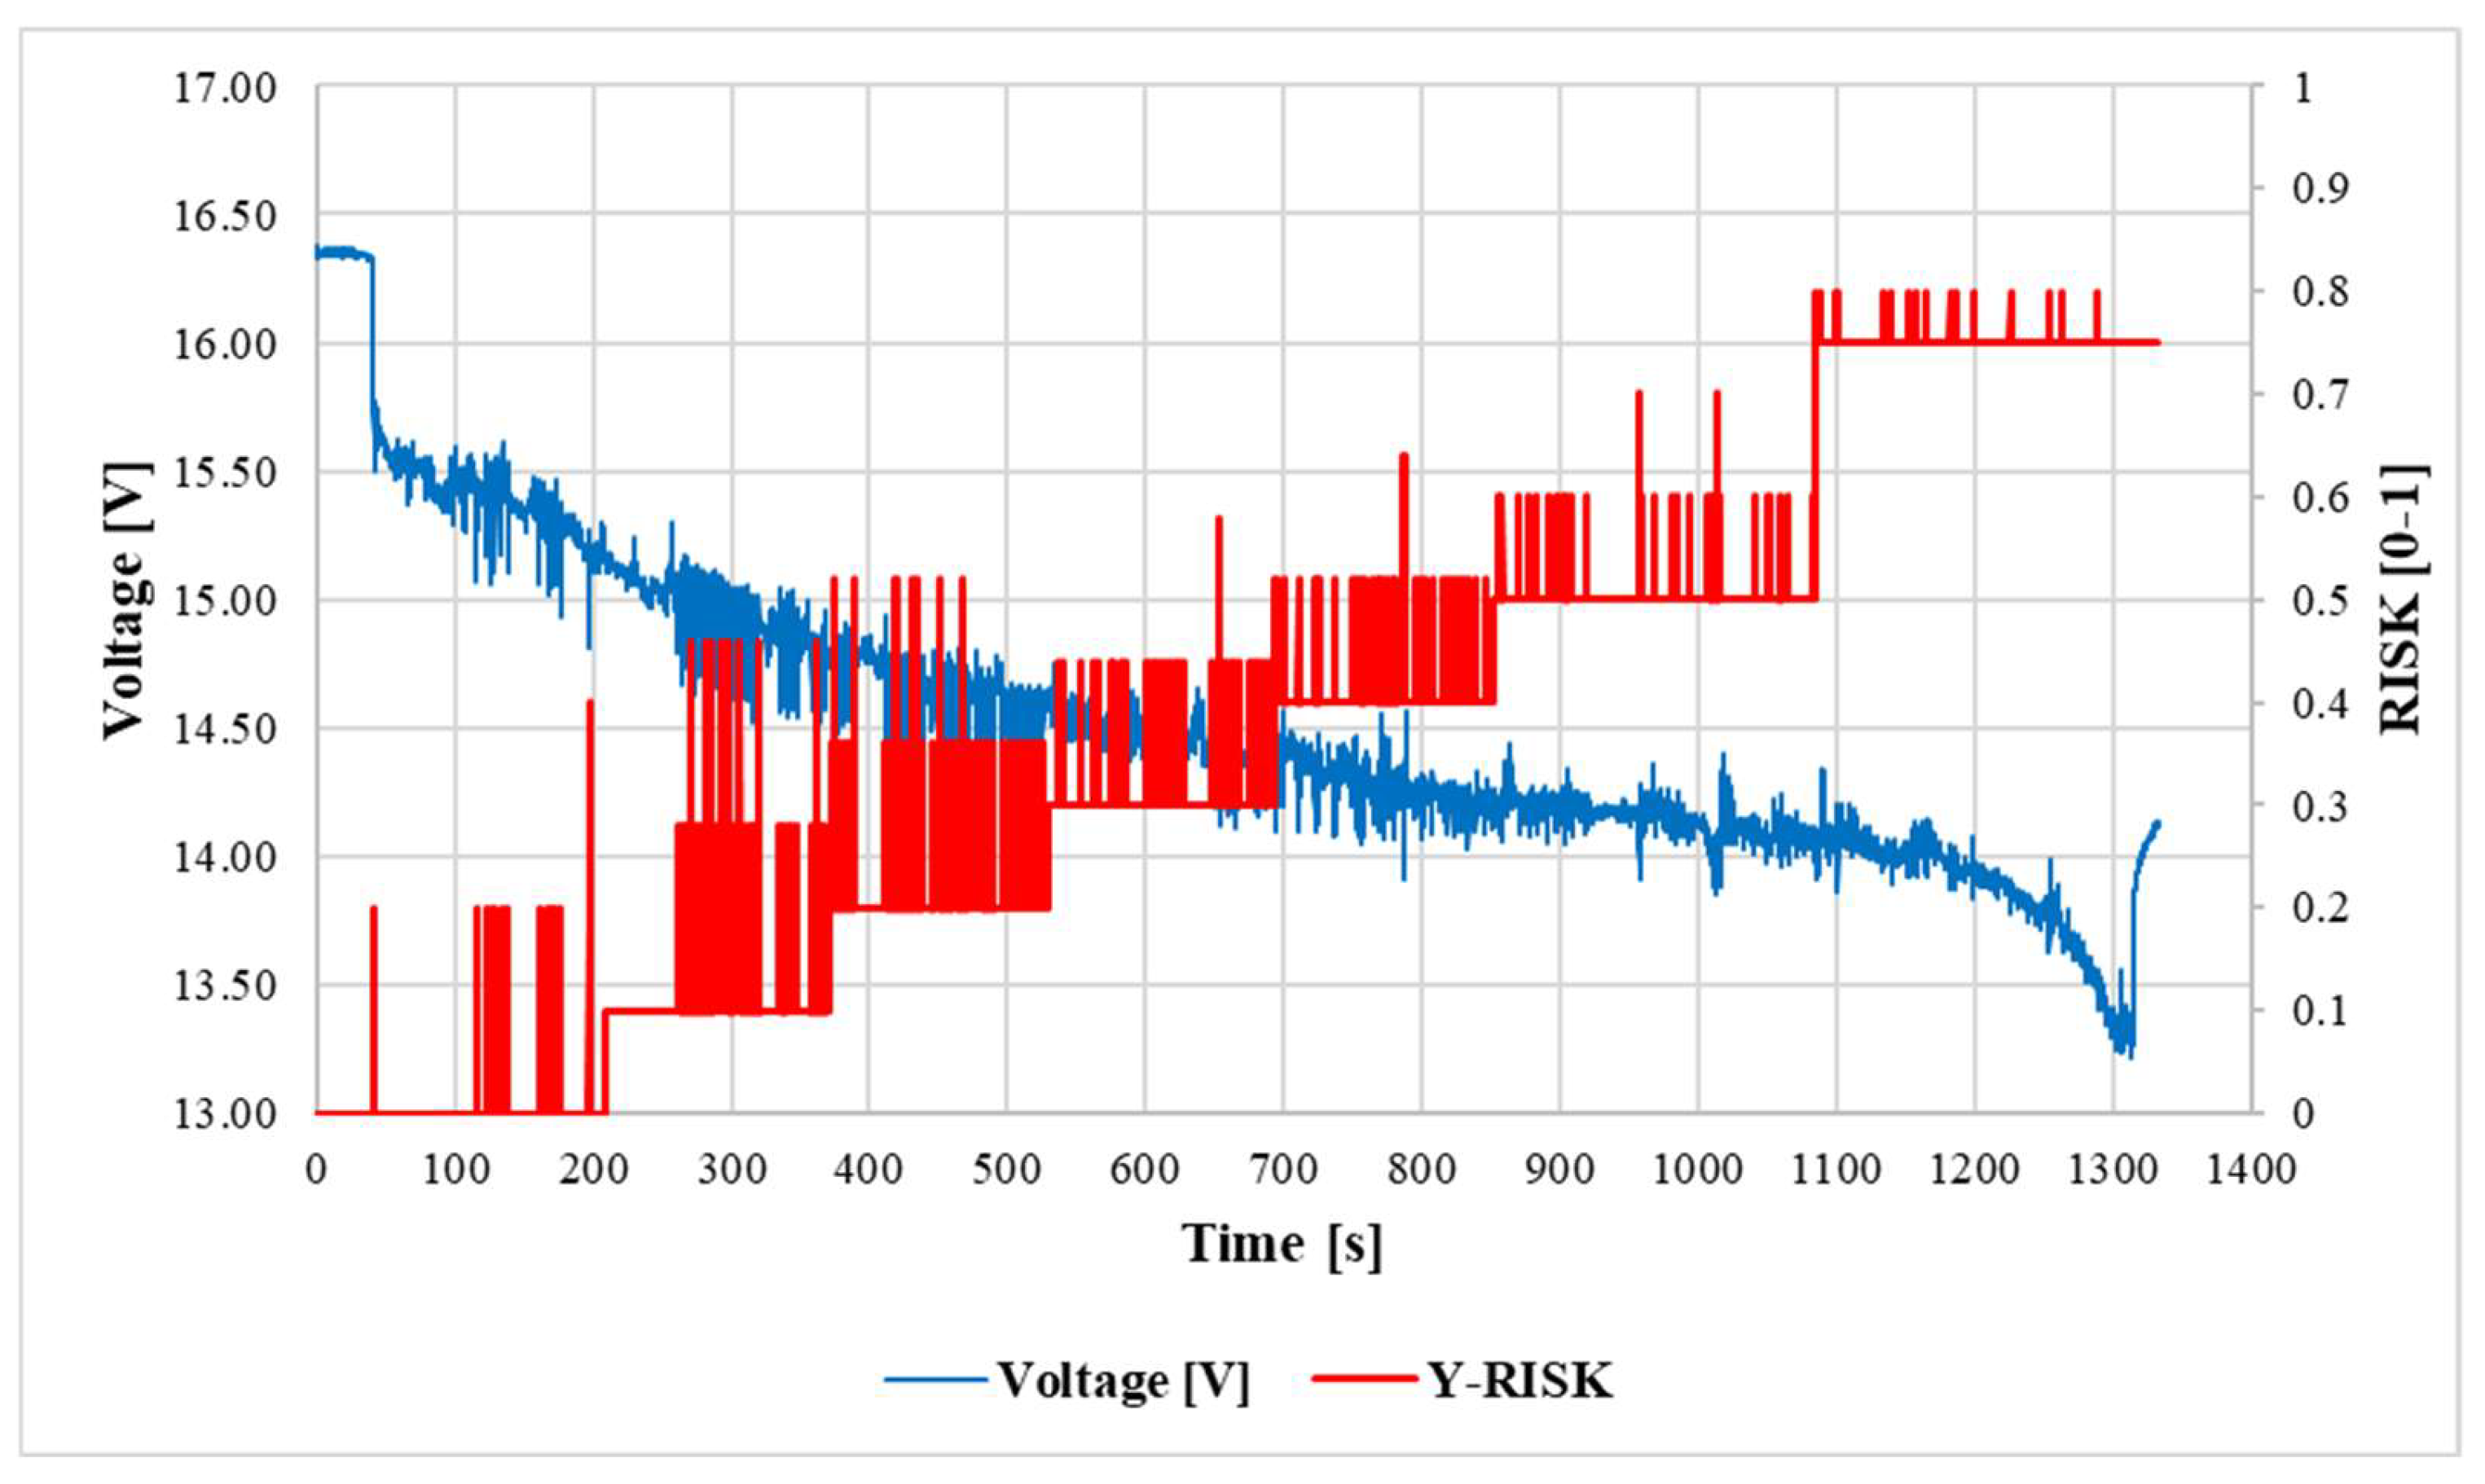
3.2. Measurement Results
4. Conclusions
Author Contributions
Funding
Data Availability Statement
Acknowledgments
Conflicts of Interest
Abbreviations
| AEC | architecture, engineering, and construction | |
| DIC | digital image correlation | |
| ECS | electronic speed controller | |
| ELRS | express long-range system | |
| FC | flight controller | |
| FTC | fault tolerant controller | |
| IMU | inertial measurement unit | |
| IoE | internet of everything | |
| IoT | internet of things | |
| LiDAR | light detection and ranging | |
| LiPo | lithium-polymer | |
| MFP | mission feasibility problem | |
| MTOM | maximum take-off mass | |
| NIR | near infrared | |
| PDB | power distribution board | |
| PI | proportional integral | |
| PID | proportional-integral-derivative (controller) | |
| RC | radio control | |
| SOC | state of charge | |
| SOH | state of health | |
| UAS | unmanned air/aerial systems | |
| UAV | unmanned air/aerial vehicle | |
| UGV | unmanned ground vehicle | |
| Symbols | Description (meaning) | Units |
| X1 | consumption of the construction | W |
| X11 | UAV motor parameters in terms of consumption | W |
| X12 | UAV propeller parameters in terms of consumption | W |
| X13 | UAV system weight | kg |
| VNS | system nominal voltage | V |
| IAVR | average load current | A |
| X2 | expected flight time | S |
| X31 | wind strength risk | – |
| Vw | wind speed | km/h |
| RH | relative humidity | % |
| X32 | temperature risk | – |
| X33 | humidity risk | – |
| X4 | battery factory data | Wh |
| X41 | factory capacity | Ah |
| X42 | nominal voltage | V |
| X5 | battery state | – |
| X51 | SOC (state of charge) | % |
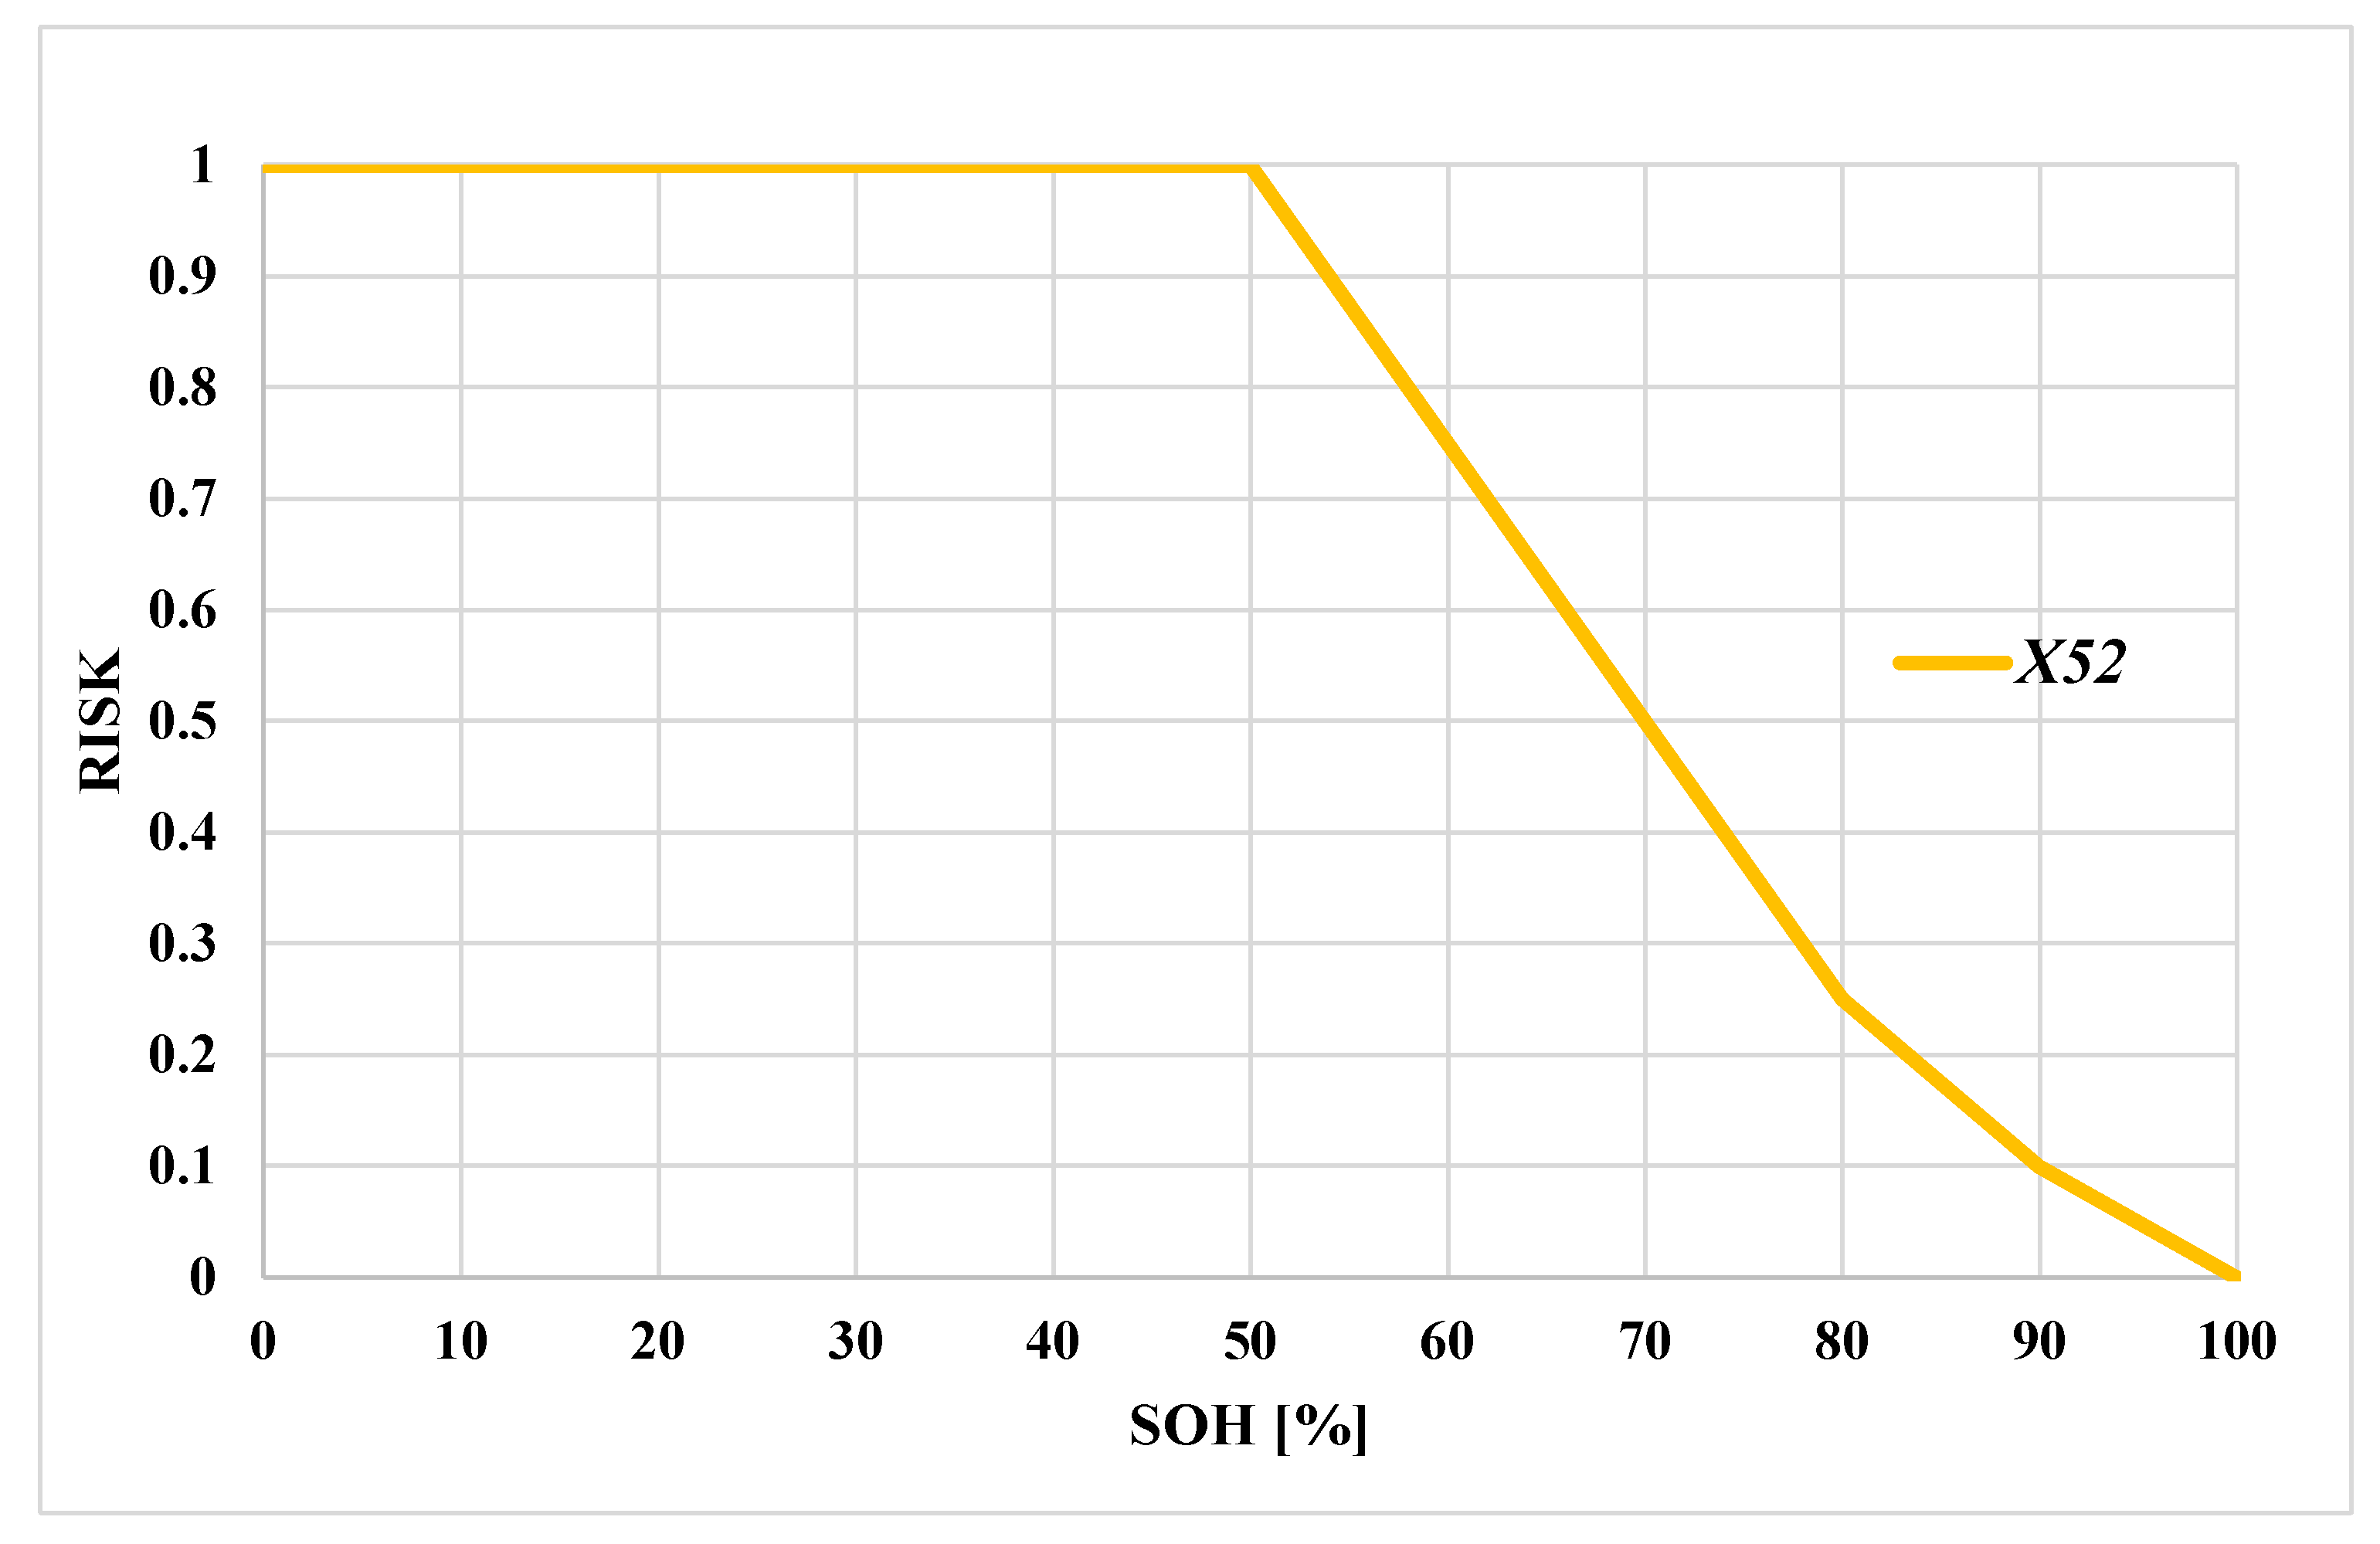
| X52 | SOH (state of health) | % |
| X53 | battery temperature risk | – |
| X6 | energy demand | J |
| X7 | available energy | J |
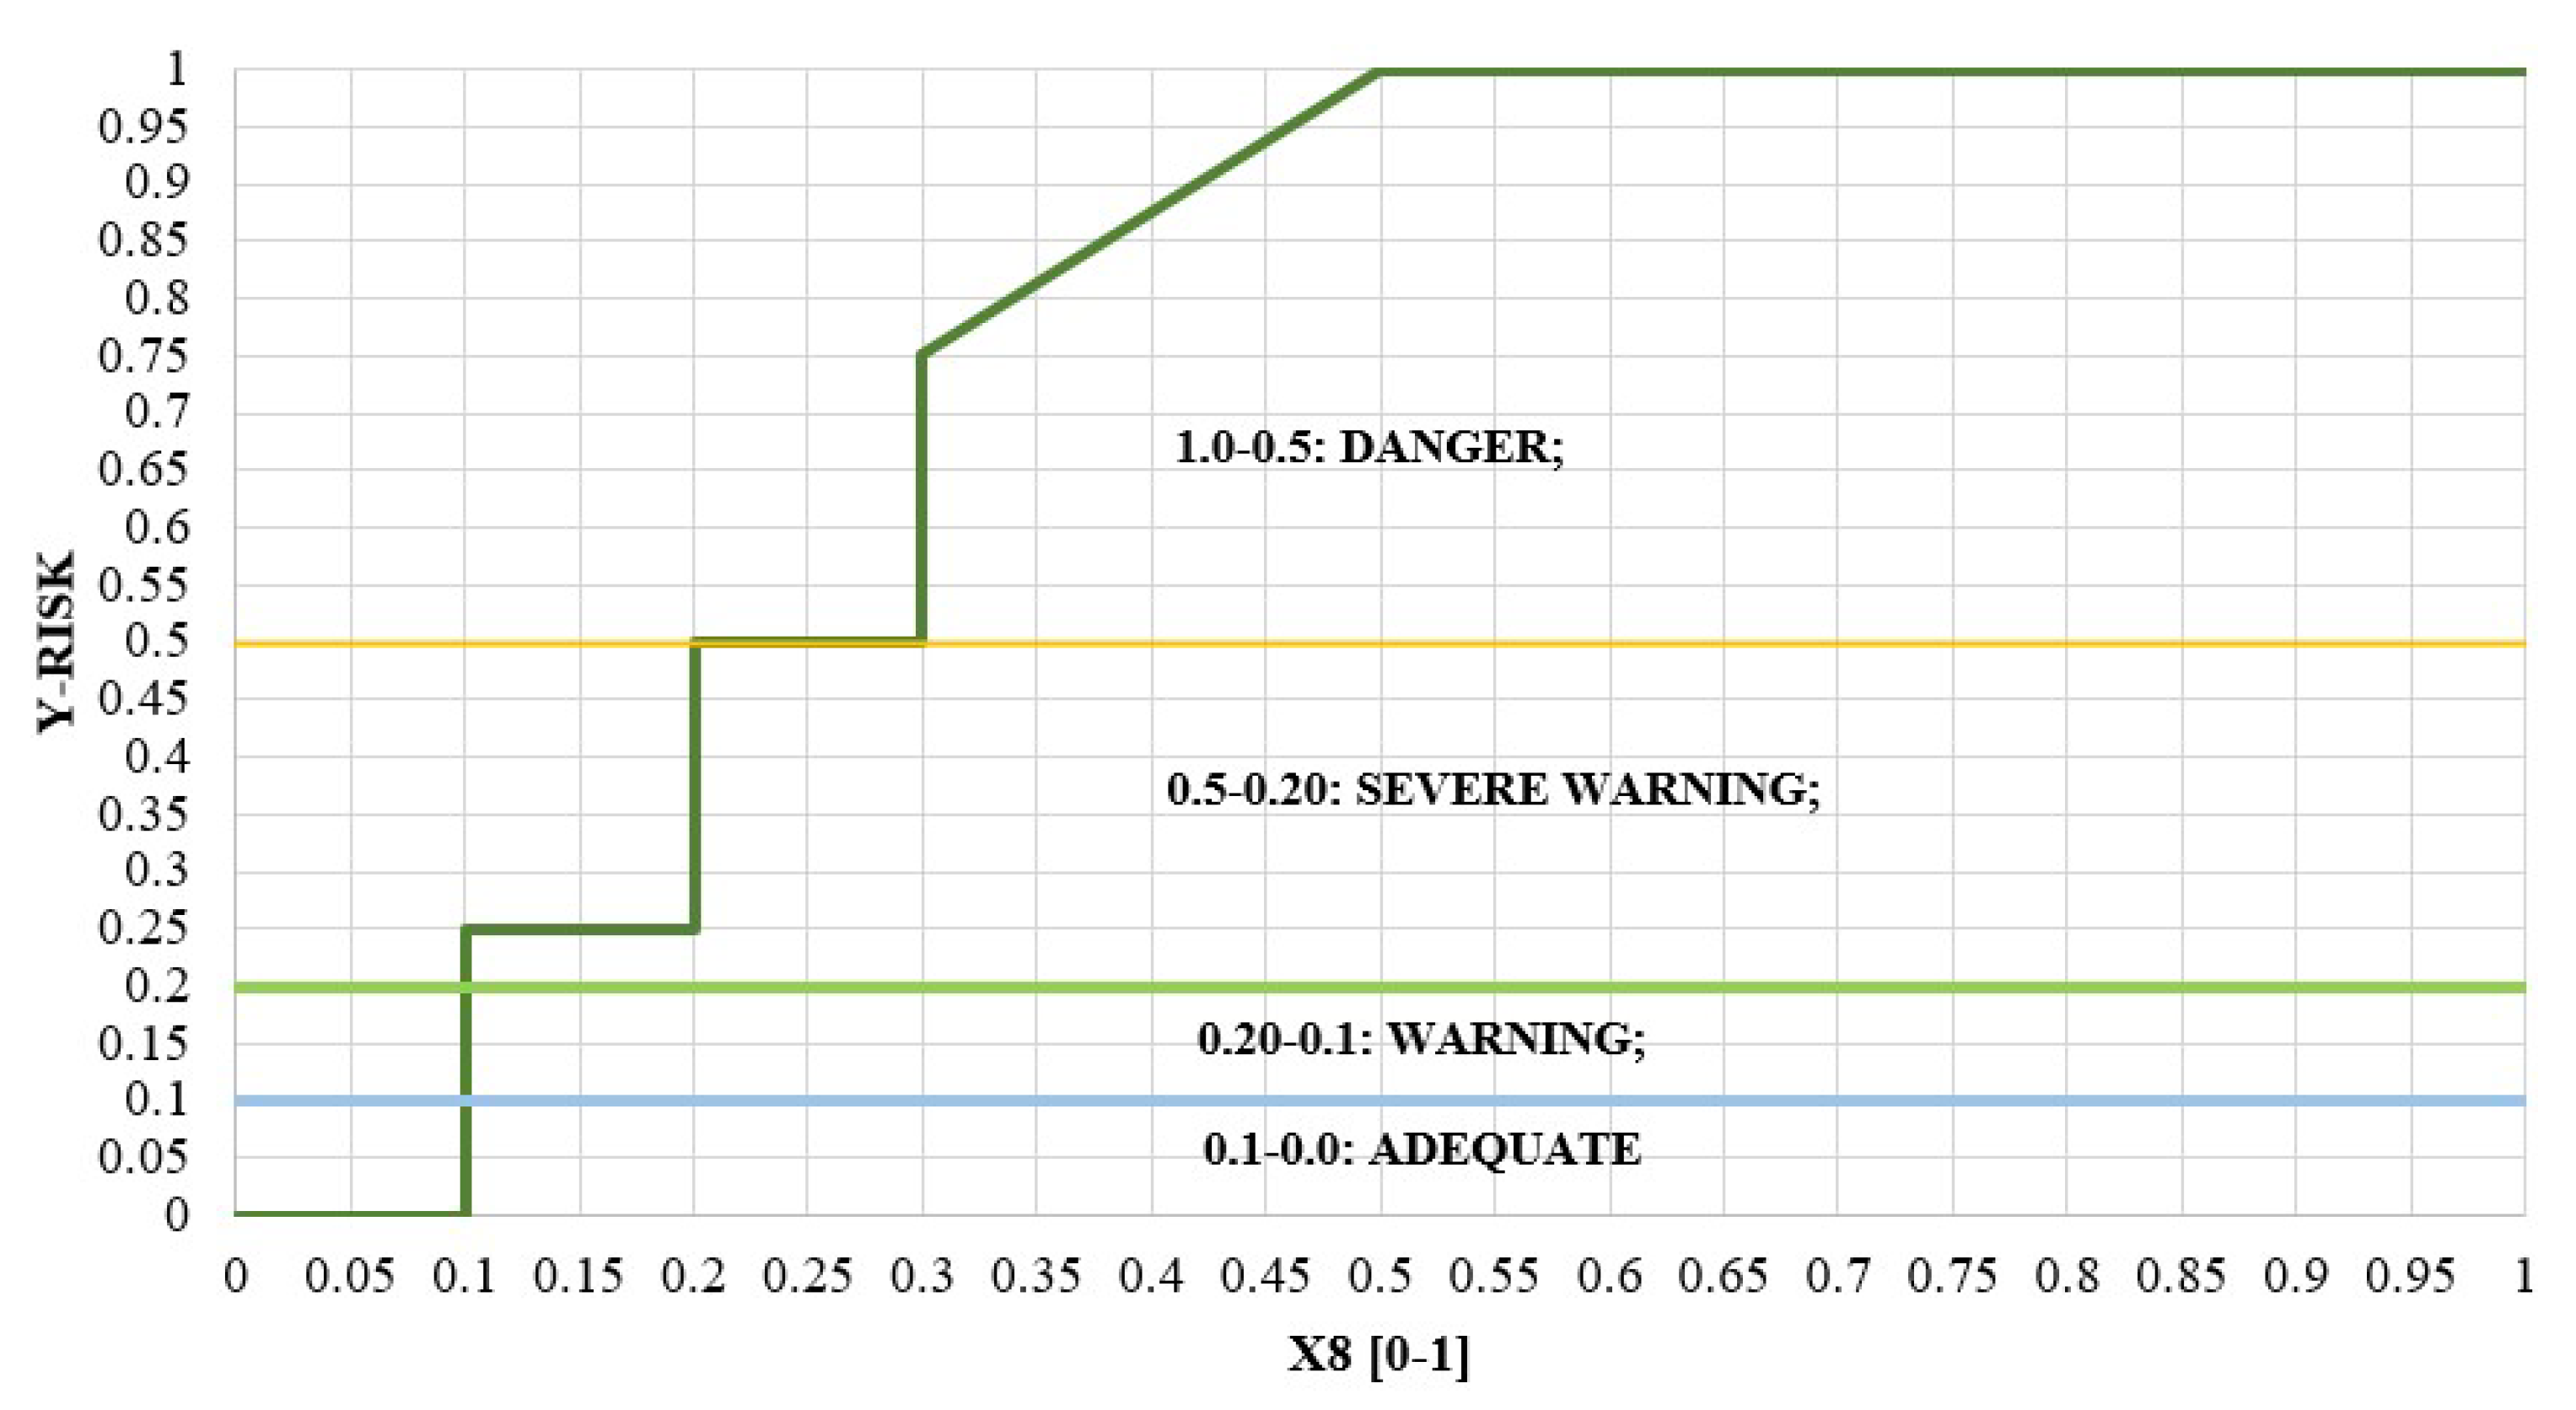
| X8 | risk of the specified flight time | – |
| Y | risk output | – |
| TLIMIT | theoretical flight time | s |
References
- Benatia, D. Ring the alarm! Electricity markets, renewables, and the pandemic. Energy Econ. 2022, 106, 105755. [Google Scholar] [CrossRef]
- Pereira, P.; Bašić, F.; Bogunovic, I.; Barcelo, D. Russian-Ukrainian war impacts the total environment. Sci. Total Environ. 2022, 837, 155865. [Google Scholar] [CrossRef] [PubMed]
- Jagtap, S.; Trollman, H.; Trollman, F.; Garcia-Garcia, G.; Parra-López, C.; Duong, L.; Martindale, W.; Munekata, P.E.S.; Lorenzo, J.M.; Hdaifeh, A.; et al. The Russia-Ukraine Conflict: Its Implications for the Global Food Supply Chains. Foods 2022, 11, 2098. [Google Scholar] [CrossRef] [PubMed]
- Kalaitzaki, A.E.; Tamiolaki, A.; Vintila, M. The Compounding Effect of COVID-19 and War in Ukraine on Mental Health: A Global Time Bomb Soon to Explode? J. Loss Trauma 2022, 28, 270–272. [Google Scholar] [CrossRef]
- Barchielli, B.; Cricenti, C.; Gallè, F.; Sabella, E.A.; Liguori, F.; Da Molin, G.; Liguori, G.; Orsi, G.B.; Giannini, A.M.; Ferracuti, S.; et al. Climate Changes, Natural Resources Depletion, COVID-19 Pandemic, and Russian-Ukrainian War: What Is the Impact on Habits Change and Mental Health? Int. J. Environ. Res. Public Health 2022, 19, 11929. [Google Scholar] [CrossRef] [PubMed]
- Basdekis, C.; Christopoulos, A.; Katsampoxakis, I.; Nastas, V. The Impact of the Ukrainian War on Stock and Energy Markets: A Wavelet Coherence Analysis. Energies 2022, 15, 8174. [Google Scholar] [CrossRef]
- Sharif, A.; Aloui, C.; Yarovaya, L. COVID-19 pandemic, oil prices, stock market, geopolitical risk and policy uncertainty nexus in the US economy: Fresh evidence from the wavelet-based approach. Int. Rev. Financ. Anal. 2020, 70, 101496. [Google Scholar] [CrossRef]
- García-Olivares, A.; Solé, J.; Osychenko, O. Transportation in a 100% renewable energy system. Energy Convers. Manag. 2018, 158, 266–285. [Google Scholar] [CrossRef]
- von Blottnitz, H.; Curran, M.A. A review of assessments conducted on bio-ethanol as a transportation fuel from a net energy, greenhouse gas, and environmental life cycle perspective. J. Clean. Prod. 2007, 15, 607–619. [Google Scholar] [CrossRef]
- Nugymanova, G.; Nurgaliyeva, M.; Zhanbirov, Z.; Naumov, V.; Taran, I. Choosing a servicing company’s strategy while interacting with freight owners at the road transport market. Nauk. Visnyk Natsionalnoho Hirnychoho Universytetu 2021, 204–210. [Google Scholar] [CrossRef]
- Ramazan, B.; Mussaliyeva, R.; Bitileuova, Z.; Naumov, V.; Taran, I. Choosing the logistics chain structure for deliveries of bulk loads: Case study of the Republic Kazakhstan. Nauk. Visnyk Natsionalnoho Hirnychoho Universytetu 2021, 142–147. [Google Scholar] [CrossRef]
- Tóth, C.; Primusz, P. Development of a Road Pavement Structure Diagnostic Procedure Based on the Virtual Inertial Point Method. Coatings 2022, 12, 1944. [Google Scholar] [CrossRef]
- Király, T.; Primusz, P.; Tóth, C. Simulation of Static Tyre–Pavement Interaction Using Two FE Models of Different Complexity. Appl. Sci. 2022, 12, 2388. [Google Scholar] [CrossRef]
- Fischer, S.; Kocsis Szürke, S. Detection Process of Energy Loss in Electric Railway Vehicles. Facta Univ. Ser. Mech. Eng. 2023. [Google Scholar]
- KTI Ltd. Trends—Sustainable Environment. Available online: https://www.kti.hu/trendek/fenntarthato-kornyezet/ (accessed on 21 December 2022).
- Kuchak, A.J.T.; Marinkovic, D.; Zehn, M. Parametric Investigation of a Rail Damper Design Based on a Lab-Scaled Model. J. Vib. Eng. Technol. 2021, 9, 51–60. [Google Scholar] [CrossRef]
- Kuchak, A.T.J.; Marinkovic, D.; Zehn, M. Finite Element Model Updating—Case Study of a Rail Damper. Struct. Eng. Mech. 2020, 73, 27–35. [Google Scholar] [CrossRef]
- Sysyn, M.; Nabochenko, O.; Kovalchuk, V.; Przybyłowicz, M.; Fischer, S. Investigation of interlocking effect of crushed stone ballast during dynamic loading. Rep. Mech. Eng. 2021, 2, 65–76. [Google Scholar] [CrossRef]
- Szalai, S.; Eller, B.; Juhász, E.; Movahedi, M.R.; Németh, A.; Harrach, D.; Baranyai, G.; Fischer, S. Investigation of deformations of ballasted railway track during collapse using the Digital Image Correlation Method (DICM). Rep. Mech. Eng. 2022, 3, 258–282. [Google Scholar] [CrossRef]
- Kurhan, D.; Fischer, S. Modeling of the Dynamic Rail Deflection Using Elastic Wave Propagation. J. Appl. Comput. Mech. 2022, 8, 379–387. [Google Scholar] [CrossRef]
- Fischer, S.; Vass, A.; Szalai, S.; Harangozó, D.; Németh, A.; Major, Z.; Kocsis Szürke, S. Application Possibilities of Recuperated Energy of Modern Railway Hauling Vehicles. In Proceedings of the RAILCON’22, Nis, Serbia, 13–14 October 2022; pp. VII–X. [Google Scholar]
- Fischer, S.; Harangozó, D.; Németh, D.; Kocsis, B.; Sysyn, M.; Kurhan, D.; Brautigam, A. Investigation of Heat-Affected Zones of Thermite Rail Weldings. Facta Univ. Ser. Mech. Eng. 2023. [Google Scholar]
- Fischer, S. Geogrid reinforcement of ballasted railway superstructure for stabilization of the railway track geometry—A case study. Geotext. Geomembr. 2022, 50, 1036–1051. [Google Scholar] [CrossRef]
- Gáspár, L. Lifetime Engineering Principles and Durable Roads. Int. J. Pavement Eng. Asph. Technol. 2016, 17, 58–72. [Google Scholar]
- Gáspár, L.; Bencze, Z. Long-Life Pavements—European and American Perspectives. New Build. Mater. Constr. World 2018, 24, 122–135. [Google Scholar]
- Gáspár, L.; Horvát, F.; Lublóy, L. Közlekedési Létesítmények Élettartama; Universitas-Győr Nonprofit Kft.: Győr, Hungary, 2011; ISBN 9789639819733. [Google Scholar]
- Macura, D.; Laketić, M.; Pamučar, D.; Marinković, D. Risk Analysis Model with Interval Type-2 Fuzzy FMEA—Case Study of Railway Infrastructure Projects in the Republic of Serbia. Acta Polytech. Hung. 2022, 19, 103–118. [Google Scholar] [CrossRef]
- Szalai, S.; Dogossy, G. Speckle pattern optimization for DIC technologies. Acta Tech. Jaurinensis 2021, 14, 228–243. [Google Scholar] [CrossRef]
- Szabó, V.A.; Dogossy, G. Structure and Properties of Closed-Cell Foam Prepared from RPET. In Proceedings of the 11th Hungarian Conference on Materials Science, IOP Conference Series: Materials Science and Engineering, Balatonkenese, Hungary, 15–17 October 2017; Volume 426, p. 012043. [Google Scholar]
- Dogossy, G.; Morauszki, T.; Ronkay, F. Experimental Investigation and Applicability of Multi-Stage Simulations in the Case of a Thick-Walled Injection-Moulded Composite. Appl. Sci. 2022, 12, 8415. [Google Scholar] [CrossRef]
- Szalai, S.; Fehér, V.; Kurhan, D.; Németh, A.; Sysyn, M.; Fischer, S. Optimization of Surface Cleaning and Painting Methods for DIC Measurements on Automotive and Railway Aluminum Materials. Infrastructures 2023, 8, 27. [Google Scholar] [CrossRef]
- Szalai, S.; Csótár, H.; Kurhan, D.; Németh, A.; Sysyn, M.; Fischer, S. Testing of Lubricants for DIC Tests to Measure the Forming Limit Diagrams of Aluminum Thin Sheet Materials. Infrastructures 2023, 8, 32. [Google Scholar] [CrossRef]
- Szalai, S.; Herold, B.; Kurhan, D.; Németh, A.; Sysyn, M.; Fischer, S. Optimization of 3D Printed Rapid Prototype Deep Drawing Tools for Automotive and Railway Sheet Material Testing. Infrastructures 2023, 8, 43. [Google Scholar] [CrossRef]
- Szalai, S.; Szívós, B.F.; Kurhan, D.; Németh, A.; Sysyn, M.; Fischer, S. Optimization of Surface Preparation and Painting Processes for Railway and Automotive Steel Sheets. Infrastructures 2023, 8, 28. [Google Scholar] [CrossRef]
- Lamkanfi, E.; Van Paepegem, W.; Degrieck, J. Shape optimization of a cruciform geometry for biaxial testing of polymers. Polym. Test. 2015, 41, 7–16. [Google Scholar] [CrossRef]
- Harrach, D.; Habashneh, M.; Movehdi Rad, M. Numerical Investigation of Glue Laminated Timber Beams Considering Reliability-Based Design. Acta Polytech. Hung. 2023, 20, 109–122. [Google Scholar]
- Pup, D.; Szakallas, G.; Polák, J. Research of Vehicle Parameter and Sensor Systems Necessary to Control Autonomous Vehicles. In Proceedings of the 2018 14th IEEE/ASME International Conference on Mechatronic and Embedded Systems and Applications (MESA 2018), Oulu, Finland, 2–4 July 2018; p. 8449146. [Google Scholar]
- Polák, J.; Lakatos, I. Efficiency Optimization of Electric Permanent Magnet Motor Driven Vehicle. Mach. Des. 2015, 7, 11–14. [Google Scholar]
- Teichert, O.; Link, S.; Schneider, J.; Wolff, S.; Lienkamp, M. Techno-economic cell selection for battery-electric long-haul trucks. Etransportation 2023, 16, 100225. [Google Scholar] [CrossRef]
- Ragot, P.; Markovic, M.; Perriard, Y. Optimization of Electric Motor for a Solar Airplane Application. In Proceedings of the 2005 IEEE International Conference on Electric Machines and Drives, San Antonio, TX, USA, 15–18 May 2005; IEEE: San Antonio, TX, USA; pp. 1487–1493. [Google Scholar]
- Lefebvre, A.; Zha, G.C. Design of High Wing Loading Compact Electric Airplane Utilizing Co-Flow Jet Flow Control. In Proceedings of the 53rd AIAA Aerospace Sciences Meeting, Kissimmee, FL, USA, 5–9 January 2015; p. AIAA 2015-0772. [Google Scholar]
- Ma, J.; Wang, S.; Wang, Y. Retrospect and Prospect of Electric Airplane in the Propulsion System, Energy Storage and Supply System. In Proceedings of the 2022 IEEE 2nd International Conference on Data Science and Computer Application (ICDSCA 2022), Dalian, China, 28–30 October 2022; IEEE: Dalian, China; pp. 819–825. [Google Scholar]
- Khatami, R.; Chen, B.; Chen, Y.C. Optimal voyage scheduling of all-electric ships considering underwater radiated noise. Transp. Res. Part C Emerg. Technol. 2023, 148, 104024. [Google Scholar] [CrossRef]
- Doerry, N.; Amy, J.; Krolick, C. History and the Status of Electric Ship Propulsion, Integrated Power Systems, and Future Trends in the U.S. Navy. Proc. IEEE 2015, 103, 2243–2251. [Google Scholar] [CrossRef]
- Zahedi, B.; Norum, L.E. Modeling and Simulation of All-Electric Ships with Low-Voltage DC Hybrid Power Systems. IEEE Trans. Power Electron. 2012, 28, 4525–4537. [Google Scholar] [CrossRef]
- The Bureau of Investigative Journalism History of Drone Warfare. Available online: https://www.thebureauinvestigates.com/explainers/history-of-drone-warfare (accessed on 23 December 2022).
- Vyas, K. A Brief History of Drones: The Remote Controlled Unmanned Aerial Vehicles (UAVs). Available online: https://interestingengineering.com/innovation/a-brief-history-of-drones-the-remote-controlled-unmanned-aerial-vehicles-uavs (accessed on 22 March 2023).
- Mohsan, S.A.H.; Khan, M.A.; Noor, F.; Ullah, I.; Alsharif, M.H. Towards the Unmanned Aerial Vehicles (UAVs): A Comprehensive Review. Drones 2022, 6, 147. [Google Scholar] [CrossRef]
- RiseAbove UAV Applications and Uses. Available online: https://riseabove.com.au/pages/uav-applications-and-uses (accessed on 21 December 2022).
- Bristeau, P.J.; Callou, F.; Vissière, D.; Petit, N. The Navigation and Control Technology Inside the AR. Drone Micro UAV; IFAC: Milano, Italy, 2011; Volume 44, ISBN 9783902661937. [Google Scholar]
- Rodríguez, M.V.; Melgar, S.G.; Cordero, A.S.; Márquez, J.M.A. A Critical Review of Unmanned Aerial Vehicles (UAVs) Use in Architecture and Urbanism: Scientometric and Bibliometric Analysis. Appl. Sci. 2021, 11, 9966. [Google Scholar] [CrossRef]
- Shariq, M.H.; Hughes, B.R. Revolutionising building inspection techniques to meet large-scale energy demands: A review of the state-of-the-art. Renew. Sustain. Energy Rev. 2020, 130, 109979. [Google Scholar] [CrossRef]
- Li, X.; Sun, K.; Li, F. General optimal design of solar-powered unmanned aerial vehicle for priority considering propulsion system. Chin. J. Aeronaut. 2020, 33, 2176–2188. [Google Scholar] [CrossRef]
- Mohan, M.; Richardson, G.; Gopan, G.; Aghai, M.M.; Bajaj, S.; Galgamuwa, G.A.P.; Vastaranta, M.; Arachchige, P.S.P.; Amorós, L.; Corte, A.P.D.; et al. UAV-Supported Forest Regeneration: Current Trends, Challenges and Implications. Remote Sens. 2021, 13, 2596. [Google Scholar] [CrossRef]
- Aslan, M.F.; Durdu, A.; Sabanci, K.; Ropelewska, E.; Gültekin, S.S. A Comprehensive Survey of the Recent Studies with UAV for Precision Agriculture in Open Fields and Greenhouses. Appl. Sci. 2022, 12, 1047. [Google Scholar] [CrossRef]
- González-Jorge, H.; Martínez-Sánchez, J.; Bueno, M.; Arias, P. Unmanned Aerial Systems for Civil Applications: A Review. Drones 2017, 1, 2. [Google Scholar] [CrossRef] [Green Version]
- Ausonio, E.; Bagnerini, P.; Ghio, M. Drone Swarms in Fire Suppression Activities: A Conceptual Framework. Drones 2021, 5, 17. [Google Scholar] [CrossRef]
- Qi, D.; Feng, J.F.; Liu, A.; Yang, J.; Li, Y.L. Overview on the Development and Key Technologies of Water. In Proceedings of the 2016 2nd International Conference on Control, Automation and Robotics (ICCAR), Hong Kong, China, 28–30 April 2016; pp. 213–218. [Google Scholar]
- Chamola, V.; Kotesh, P.; Agarwal, A.; Naren; Gupta, N.; Guizani, M. A Comprehensive Review of Unmanned Aerial Vehicle Attacks and Neutralization Techniques. Ad Hoc Netw. 2021, 111, 102324. [Google Scholar] [CrossRef] [PubMed]
- Stek, T.D. Drones over Mediterranean landscapes. The potential of small UAV’s (drones) for site detection and heritage management in archaeological survey projects: A case study from Le Pianelle in the Tappino Valley, Molise (Italy). J. Cult. Herit. 2016, 22, 1066–1071. [Google Scholar] [CrossRef]
- Sorbelli, F.B.; Coro, F.; Das, S.K.; Pinotti, C.M. Energy-Constrained Delivery of Goods with Drones under Varying Wind Conditions. IEEE Trans. Intell. Transp. Syst. 2020, 22, 6048–6060. [Google Scholar] [CrossRef]
- Zhang, J.; Campbell, J.F.; Sweeney, D.C.; Hupman, A.C. Energy consumption models for delivery drones: A comparison and assessment. Transp. Res. Part D Transp. Environ. 2021, 90, 102668. [Google Scholar] [CrossRef]
- Dorling, K.; Heinrichs, J.; Messier, G.G.; Magierowski, S. Vehicle Routing Problems for Drone Delivery. IEEE Trans. Syst. Man Cybern. Syst. 2017, 47, 70–85. [Google Scholar] [CrossRef] [Green Version]
- Reyes-Rubiano, L.; Voegl, J.; Hirsch, P. An Online Algorithm for Routing an Unmanned Aerial Vehicle for Road Network Exploration Operations after Disasters under Different Refueling Strategies. Algorithms 2022, 15, 217. [Google Scholar] [CrossRef]
- Selvaraj, H.; Zydek, D.; Chmaj, G. Distributed Processing Applications for UAV/Drones: A Survey. In Proceedings of the Advances in Intelligent Systems and Computing, Progress in Systems Engineering: Proceedings of the Twenty-Third International Conference on Systems Engineering, ICSEng 2014, Las Vegas, NV, USA, 19–21 August 2014; Springer: Berlin, Germany; Volume 1089, pp. 449–454. [Google Scholar]
- Liu, Y.; Dai, H.-N.; Wang, Q.; Shukla, M.K.; Imran, M. Unmanned aerial vehicle for internet of everything: Opportunities and challenges. Comput. Commun. 2020, 155, 66–83. [Google Scholar] [CrossRef] [Green Version]
- Zeng, Y.; Zhang, R.; Lim, T.J. Wireless communications with unmanned aerial vehicles: Opportunities and challenges. IEEE Commun. Mag. 2016, 54, 36–42. [Google Scholar] [CrossRef] [Green Version]
- Li, L.; Wen, X.; Lu, Z.; Jing, W.; Zhang, H. Energy-Efficient Multi-UAVs Deployment and Movement for Emergency Response. IEEE Commun. Lett. 2021, 25, 1625–1629. [Google Scholar] [CrossRef]
- Miao, Q.; Wei, J.; Wang, J.; Chen, Y. Fault Diagnosis Algorithm Based on Adjustable Nonlinear PI State Observer and Its Application in UAV Fault Diagnosis. Algorithms 2021, 14, 119. [Google Scholar] [CrossRef]
- Yan, H.; Yang, S.-H.; Chen, Y.; Fahmy, S.A. Optimum Battery Weight for Maximizing Available Energy in UAV-Enabled Wireless Communications. IEEE Wirel. Commun. Lett. 2021, 10, 1410–1413. [Google Scholar] [CrossRef]
- Townsend, A.; Jiya, I.N.; Martinson, C.; Bessarabov, D.; Gouws, R. A comprehensive review of energy sources for unmanned aerial vehicles, their shortfalls and opportunities for improvements. Heliyon 2020, 6, e05285. [Google Scholar] [CrossRef] [PubMed]
- Hannan, M.A.; Lipu, M.S.H.; Hussain, A.; Mohamed, A. A review of lithium-ion battery state of charge estimation and management system in electric vehicle applications: Challenges and recommendations. Renew. Sustain. Energy Rev. 2017, 78, 834–854. [Google Scholar] [CrossRef]
- Chen, Y.; Baek, D.; Bocca, A.; Macii, A.; Macii, E.; Poncino, M. A Case for a Battery-Aware Model of Drone Energy Consumption. In Proceedings of the 2018 IEEE International Telecommunications Energy Conference (INTELEC), Torino, Italy, 7–11 October 2018; pp. 1–8. [Google Scholar]
- Costa, E.F.; Souza, D.A.; Pinto, V.P.; Araújo, M.S.; Peixoto, A.M.; de Costa Júnior, E.P. Prediction of Lithium-Ion Battery Capacity in UAVs Erick. In Proceedings of the 2019 6th International Conference on Control, Decision and Information Technologies (CoDIT’19), Paris, France, 23–26 April 2019; pp. 1865–1869. [Google Scholar]
- Costea, I.M.; Pleşca, V. Automatic Battery Charging System for Electric Powered Drones. In Proceedings of the 2018 IEEE 24th International Symposium for Design and Technology in Electronic Packaging (SIITME), Iași, Romania, 25–28 October 2018; pp. 377–381. [Google Scholar]
- Chittoor, P.K.; Chokkalingam, B.; Mihet-Popa, L. A Review on UAV Wireless Charging: Fundamentals, Applications, Charging Techniques and Standards. IEEE Access 2021, 9, 69235–69266. [Google Scholar] [CrossRef]
- Grlj, C.G.; Krznar, N.; Pranjić, M. A Decade of UAV Docking Stations: A Brief Overview of Mobile and Fixed Landing Platforms. Drones 2022, 6, 17. [Google Scholar] [CrossRef]
- Fujii, K.; Higuchi, K.; Rekimoto, J. Endless Flyer: A Continuous Flying Drone with Automatic Battery Replacement. In Proceedings of the Proceedings—IEEE 10th International Conference on Ubiquitous Intelligence and Computing (UIC 2013) and IEEE 10th International Conference on Autonomic and Trusted Computing (ATC 2013), Sorrento Peninsula, Italy, 18–21 December 2013; pp. 216–223. [Google Scholar]
- Lu, M.; Bagheri, M.; James, A.P.; Phung, T. Wireless Charging Techniques for UAVs: A Review, Reconceptualization, and Extension. IEEE Access 2018, 6, 29865–29884. [Google Scholar] [CrossRef]
- Boukoberine, M.N.; Zhou, Z.; Benbouzid, M. A critical review on unmanned aerial vehicles power supply and energy management: Solutions, strategies, and prospects. Appl. Energy 2019, 255, 113823. [Google Scholar] [CrossRef]
- Merheb, A.-R.; Noura, H.; Bateman, F. Emergency Control of AR Drone Quadrotor UAV Suffering a Total Loss of One Rotor. IEEE/ASME Trans. Mechatron. 2017, 22, 961–971. [Google Scholar] [CrossRef]
- Tang, Q.; Yang, K.; Li, P.; Zhang, J.; Luo, Y.; Xiong, B. An energy efficient MCDS construction algorithm for wireless sensor networks. EURASIP J. Wirel. Commun. Netw. 2012, 2012, 83. [Google Scholar] [CrossRef] [Green Version]
- Wang, J.; Jin, C.; Tang, Q.; Xiong, N.N.; Srivastava, G. Intelligent Ubiquitous Network Accessibility for Wireless-Powered MEC in UAV-Assisted B5G. IEEE Trans. Netw. Sci. Eng. 2020, 8, 2801–2813. [Google Scholar] [CrossRef]
- Pu, B.; Li, K.; Li, S.; Zhu, N. Automatic Fetal Ultrasound Standard Plane Recognition Based on Deep Learning and IIoT. IEEE Trans. Ind. Inform. 2021, 17, 7771–7780. [Google Scholar] [CrossRef]
- Wang, J.; Yang, Y.; Wang, T.; Simon Sherratt, R.; Zhang, J. Big Data Service Architecture: A Survey. J. Internet Technol. 2020, 21, 393–405. [Google Scholar]
- Zhang, Q.; Li, Y.; Al-Turjman, F.; Zhou, X.; Yang, X. Transient ischemic attack analysis through non-contact approaches. Hum.-Cent. Comput. Inf. Sci. 2020, 10, 16. [Google Scholar] [CrossRef] [Green Version]
- Zhang, J.; Zhong, S.; Wang, T.; Chao, H.C.; Wang, J. Blockchain-Based Systems and Applications: A Survey. J. Internet Technol. 2020, 21, 1–14. [Google Scholar]
- EASA—European Union Aviation Safety Agency Open Category—Civil Drones. Available online: https://www.easa.europa.eu/en/domains/civil-drones/drones-regulatory-framework-background/open-category-civil-drones (accessed on 23 December 2022).
- Szalai, S.; Szürke, S.K.; Harangozó, D.; Fischer, S. Investigation of deformations of a lithium polymer cell using the Digital Image Correlation Method (DICM). Rep. Mech. Eng. 2022, 3, 206–224. [Google Scholar] [CrossRef]
- Alipour, M.; Ziebert, C.; Conte, F.V.; Kizilel, R. A Review on Temperature-Dependent Electrochemical Properties, Aging, and Performance of Lithium-Ion Cells. Batteries 2020, 6, 35. [Google Scholar] [CrossRef]
- Spitthoff, L.; Shearing, P.; Burheim, O. Temperature, Ageing and Thermal Management of Lithium-Ion Batteries. Energies 2021, 14, 1248. [Google Scholar] [CrossRef]
- Ma, S.; Jiang, M.; Tao, P.; Song, C.; Wu, J.; Wang, J.; Deng, T.; Shang, W. Temperature effect and thermal impact in lithium-ion batteries: A review. Prog. Nat. Sci. Mater. Int. 2018, 28, 653–666. [Google Scholar] [CrossRef]
- Szürke, S.K.; Lakatos, I.; Dineva, A. Testing and Modeling Procedure of the 18650 Lithium Battery at Different Temperatures. In Proceedings of the International Symposium on Electrical Apparatus and Technologies (SIELA), Bourgas, Bulgaria, 1–4 June 2022; p. 21974594. [Google Scholar]
- Szürke, S.K.; Szalai, S.; Lakatos, I. Battery Deformation Measurement with DIC Technique. In Proceedings of the 21st International Symposium on Electrical Apparatus & Technologies (SIELA), Bourgas, Bulgaria, 3–6 June 2020; p. 19890104. [Google Scholar]


| Speed (Vw) (km/h) | |
|---|---|
| Vw ≤ 30 | 0.0 |
| 30 < Vw < 60 | 0.5 |
| Vw ≥ 60 | 1.0 |
| Relative Humidity (RH) (%) | |
|---|---|
| RH ≤ 60 | 0.0 |
| 60 < RH < 80 | 0.5 |
| RH ≥ 80 | 1.0 |
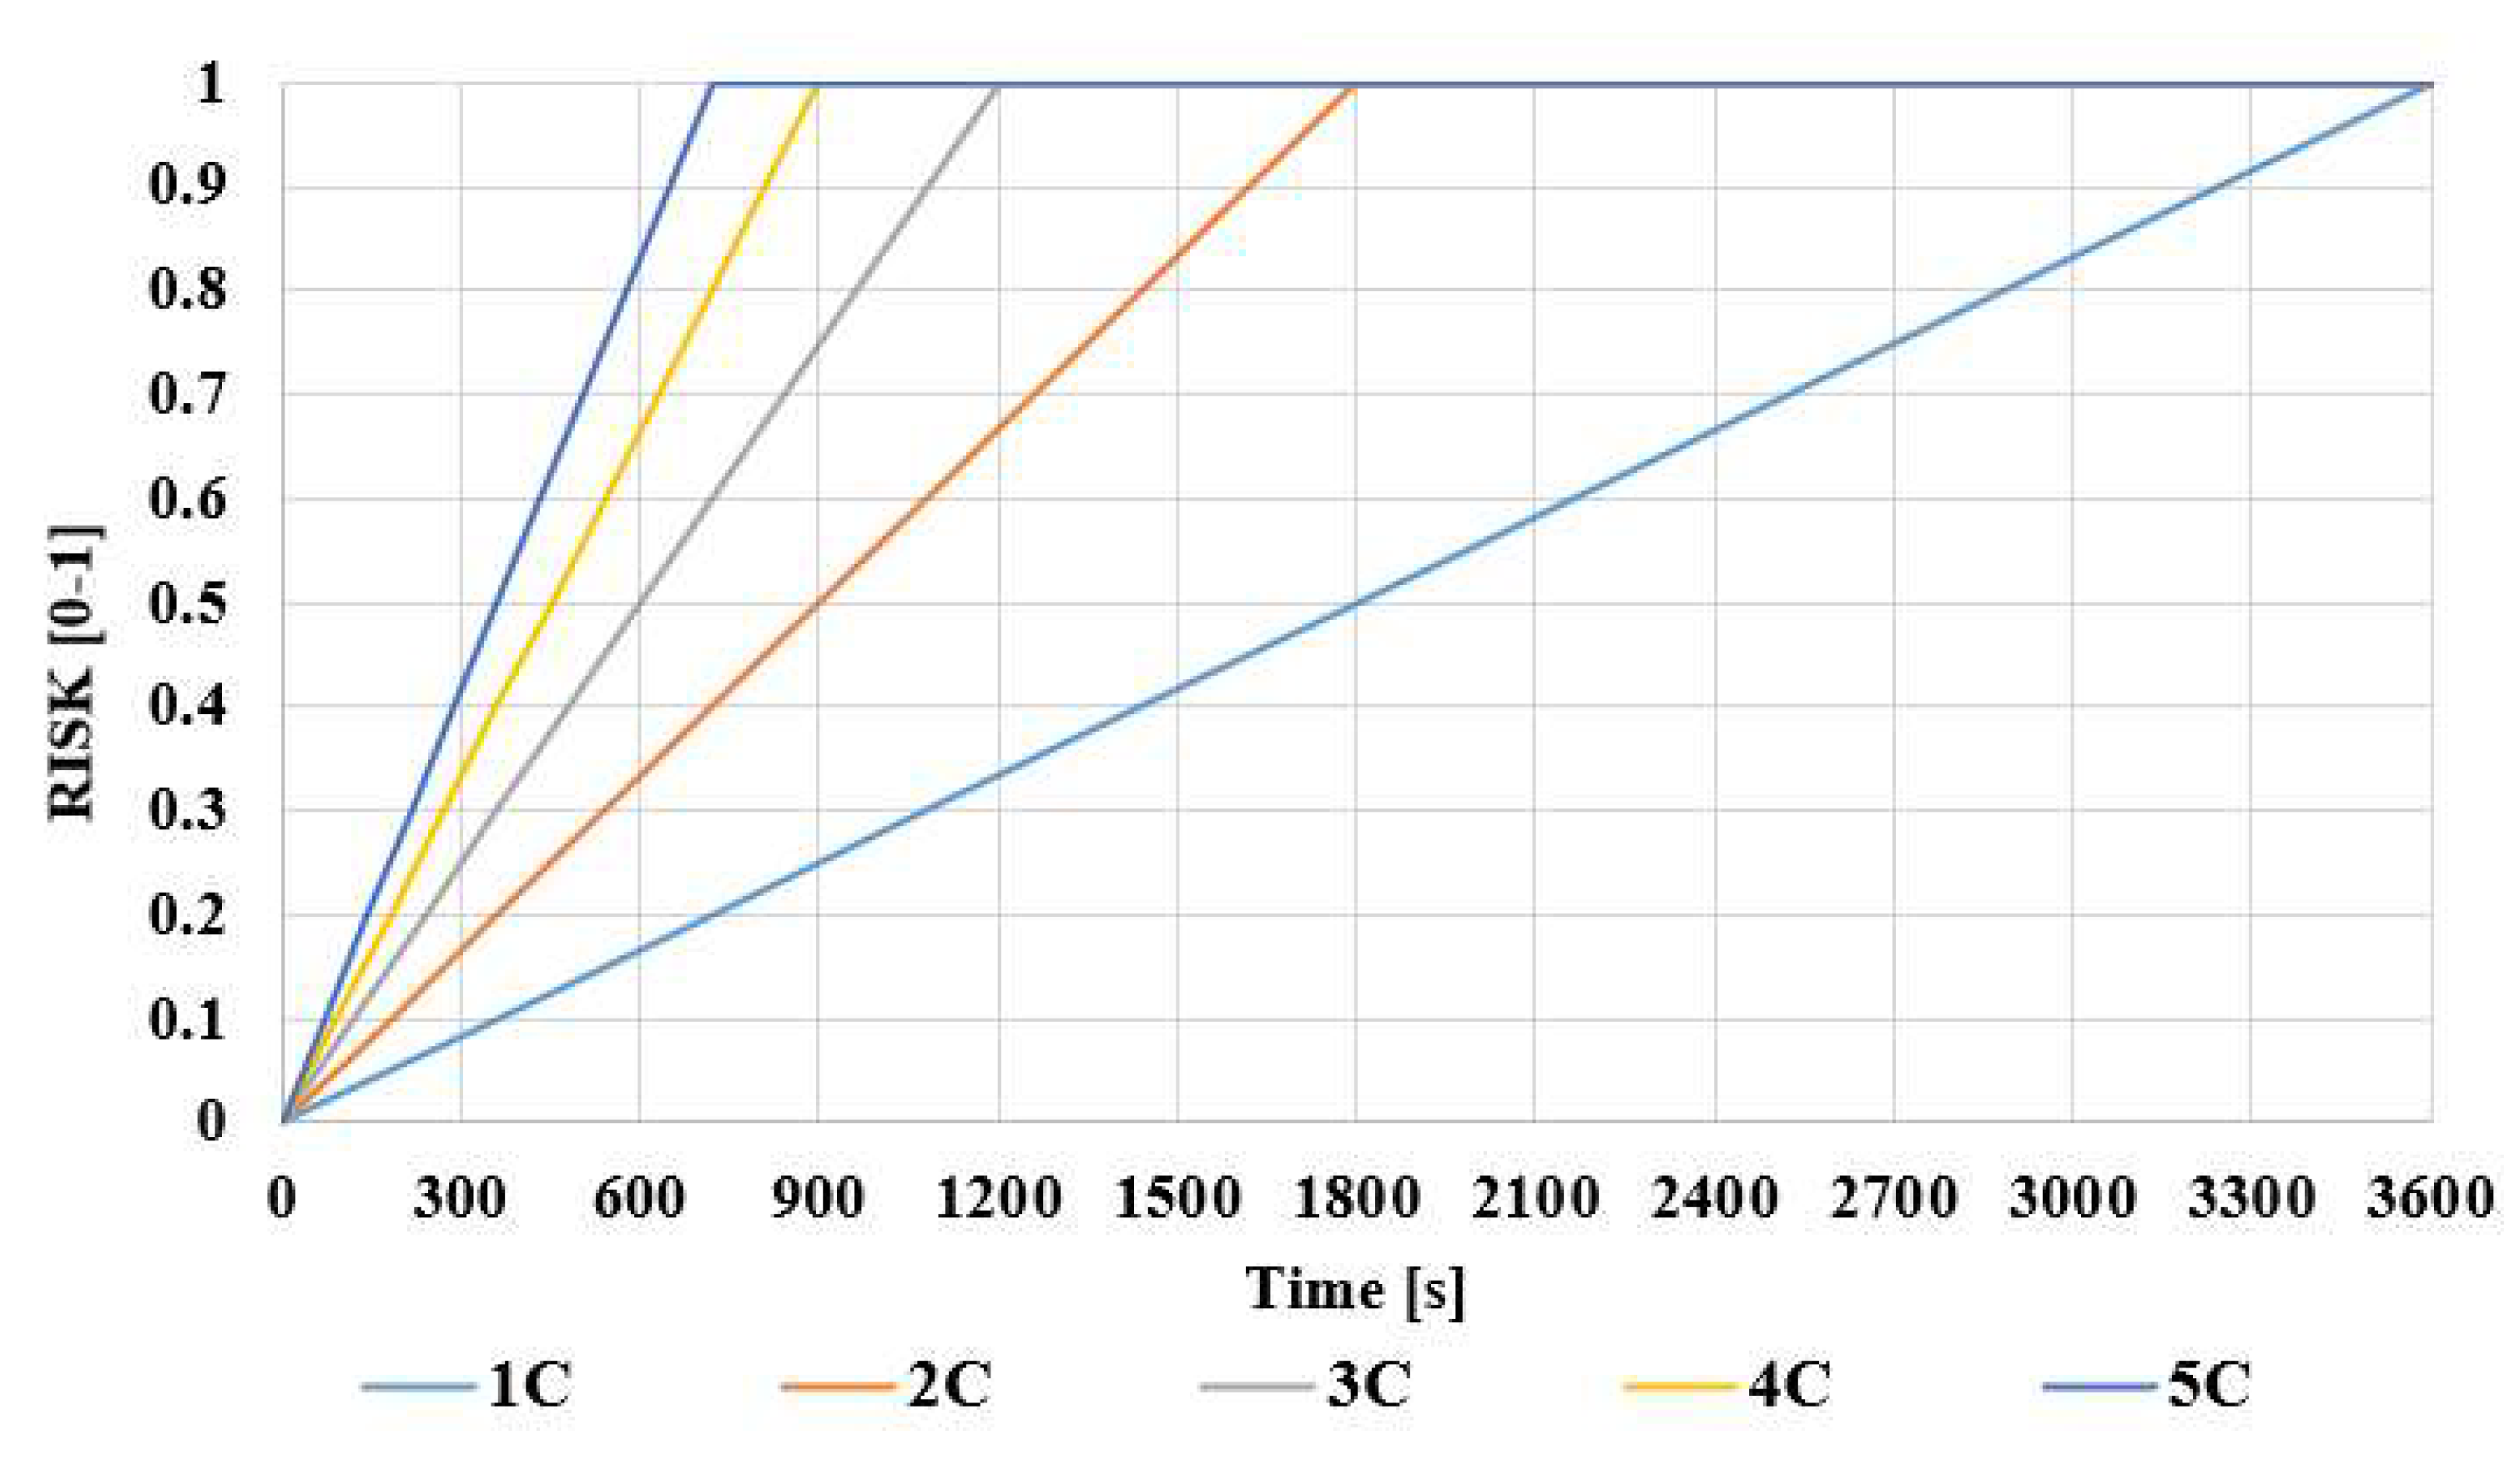
| Loading Cases | 1C | 2C | 3C | 4C | 5C |
|---|---|---|---|---|---|
| Ideal | 3600 | 1800 | 1200 | 900 | 720 |
| Temp 9 °C | 2880 | 1440 | 960 | 720 | 576 |
| Temp 0 °C | 1800 | 900 | 600 | 450 | 360 |
| Temp 0 °C and wind 30 km/h | 1440 | 720 | 480 | 360 | 288 |
| SOC 90% | 3240 | 1620 | 1080 | 810 | 648 |
| SOC 80% and temp 9 °C | 2304 | 1152 | 768 | 576 | 461 |
| SOC 80%, temp 0 °C, and wind 30 km/h | 720 | 480 | 192 | 185 | 144 |
| Cases | 1C | 2C | 3C | 4C | 5C |
|---|---|---|---|---|---|
| Ideal | 0.00 | 0.00 | 0.00 | 0.50 | 0.88 |
| Temp 9 °C | 0.00 | 0.00 | 0.50 | 0.88 | 1.00 |
| Temp 0 °C | 0.00 | 0.50 | 1.00 | 1.00 | 1.00 |
| Temp 0 °C and wind 30 km/h | 0.00 | 0.88 | 1.00 | 1.00 | 1.00 |
| SOC 90% | 0.00 | 0.00 | 0.25 | 0.75 | 0.95 |
| SOC 80% and temp 9 °C | 0.00 | 0.00 | 0.81 | 1.00 | 1.00 |
| SOC 80%, temp 0 °C, and wind 30 km/h | 0.88 | 1.00 | 1.00 | 1.00 | 1.00 |
| Parameters | Ideal | SOC 80% and Temp 9 °C | SOC 80%, Temp 0 °C, and Wind 30 km/h |
|---|---|---|---|
| X1 | 164.28 | 164.28 | 164.28 |
| X21 | 1200.00 | 1200.00 | 1200.00 |
| X2 | 1200.00 | 1200.00 | 1200.00 |
| X31 | 0.00 | 0.00 | 0.50 |
| X32 | 0.00 | 0.20 | 0.50 |
| X33 | 0.00 | 0.00 | 0.00 |
| X3 | 0.00 | 0.20 | 0.75 |
| X4 | 54.76 | 54.76 | 54.76 |
| X51 | 0.00 | 0.00 | 0.00 |
| X52 | 0.00 | 0.20 | 0.20 |
| X53 | 0.00 | 0.00 | 0.00 |
| X5 | 0.00 | 0.20 | 0.20 |
| X6 | 197,136.00 | 197,136.00 | 197,136.00 |
| X7 | 197,136.00 | 157,708.80 | 157,708.80 |
| X8 | 0.00 | 0.36 | 0.80 |
| Y | 0.00 | 0.81 | 1.00 |
| Parameters | Values | |
|---|---|---|
| Consumption of the construction | X1 [W] | 121.36 |
| Mission parameters | X2 [s] | 1300.00 |
| External temperature effects | X3 [0–1] | 0.00 |
| Battery parameters | X4 [Wh] | 54.76 |
| Battery state | X5 [0–1] | 0.20 |
| Energy demand | X6 [J] | 157,768.00 |
| Available energy | X7 [J] | 157,708.80 |
| Risk | X8 [0–1] | 0.00 |
| Estimate flight time | Tlimit [s] | 1300.00 |
Disclaimer/Publisher’s Note: The statements, opinions and data contained in all publications are solely those of the individual author(s) and contributor(s) and not of MDPI and/or the editor(s). MDPI and/or the editor(s) disclaim responsibility for any injury to people or property resulting from any ideas, methods, instructions or products referred to in the content. |
© 2023 by the authors. Licensee MDPI, Basel, Switzerland. This article is an open access article distributed under the terms and conditions of the Creative Commons Attribution (CC BY) license (https://creativecommons.org/licenses/by/4.0/).
Share and Cite
Kocsis Szürke, S.; Perness, N.; Földesi, P.; Kurhan, D.; Sysyn, M.; Fischer, S. A Risk Assessment Technique for Energy-Efficient Drones to Support Pilots and Ensure Safe Flying. Infrastructures 2023, 8, 67. https://doi.org/10.3390/infrastructures8040067
Kocsis Szürke S, Perness N, Földesi P, Kurhan D, Sysyn M, Fischer S. A Risk Assessment Technique for Energy-Efficient Drones to Support Pilots and Ensure Safe Flying. Infrastructures. 2023; 8(4):67. https://doi.org/10.3390/infrastructures8040067
Chicago/Turabian StyleKocsis Szürke, Szabolcs, Norbert Perness, Péter Földesi, Dmytro Kurhan, Mykola Sysyn, and Szabolcs Fischer. 2023. "A Risk Assessment Technique for Energy-Efficient Drones to Support Pilots and Ensure Safe Flying" Infrastructures 8, no. 4: 67. https://doi.org/10.3390/infrastructures8040067