1. Introduction
A flexible pavement is a multi-layer structure whose performance depends on the characteristics of each layer. Pavement deterioration starts immediately after opening the road to traffic. This process begins very slowly and is exacerbated by repeated traffic, climate factors, pavement aging and construction deficiencies [
1]. The structural deformation appears in the underlying pavement layers when the pavement becomes unable to sustain the repeated excessive axial load of vehicles. The structural deformation usually results in the following distress types: depressions, corrugations, potholes, linear and transverse cracks, rutting and shoving. Some other distress may only appear at the surface texture and affect the road’s functionality, such as the skid resistance. These types of distresses include: polishing, bleeding, stripping and ravelling.
In interpreting the pavement distresses, several models have been proposed. Ref. [
2] applied a decision-making regression tree for predicting the present serviceability index for pavement thickness. An Artificial neural network (ANN) model has been developed by Ref. [
3] for pavement serviceability ratio (PSR) determined on the surface of the flexible pavements. The ANN model estimates better results than PSR to the American Association of State Highway Officials (AASHTO) [
4] panel data of PSR. In his research, serviceability was influenced by longitudinal and transverse profiles and the extent of the distress and patch. Refs. [
5,
6] create a pavement condition index (PCI) database for road segments using the Geographic Information System (GIS) software. While some of the modern methods [
7] applied the image processing technique to automatically detect the severity of pavement distresses.
Pavement deterioration refers to several types of pavement distress that occur on the surface of pavements. The main problem with pavement distresses is that they allow moisture to infiltrate the lower layers, giving accelerated deterioration of the pavement structure. This may result in the formation of different types of pavement distresses. The kinds of distress also correlate with the type of climate and traffic. According to Ref. [
8], road pavement deterioration may have resulted from either traffic or environmental influences. Several studies have been made on the effect of the environmental part. The influence of climatic conditions (temperature, moisture, freeze-thaw cycling) accelerates pavement distresses [
9,
10]. Ref. [
11] claimed that moisture is the main cause of deterioration or a contributing cause, giving accelerated failure of the pavement. The United States (US) Department of Transportation [
12] reported that excess moisture reduces the strength and stiffness of pavement materials, being worse for the subgrade material than for the subbase or base. Moreover, temperature variations affect the viscous-elastic plastic characteristic of asphalt pavement [
13,
14].
Few studies have been directed at the second cause of pavement deterioration; traffic. Furthermore, the researchers’ only major concern was the effect of traffic axial load [
15,
16]. Ref. [
8] linked the occurrence of some types of pavement distresses, such as potholes, alligator cracks, and heavy depressions, to excessive axial loads. However, these studies did not link the type and severity of pavement distress with other traffic characteristics. For example, the types of pavement distress may vary between straight road segments, intersections, crossing points, and parking lots. The [
17] research result claimed that low-speed vehicle loading and tire braking aggravates the pavement deterioration at an intersection in terms of rutting or shoving potential by 2.0 to 2.6 times due to the increased shear strains in two directions. Similarly, parking lot surfaces have distinct traffic characteristics, including the cursing behaviour for parking search and the shape and number of parking manoeuvres that need further investigation in pavement management.
Pavement studies have usually focused on common travel roadways, with less attention on parking lots. The US Army Engineering Research Laboratory [
18], developed a maintenance and repair system, MicroPAVER, for roadways, airfields, and parking lots. Although this system is considered a global pavement maintenance and analysis reference, it did not explain the difference in pavement defects between traffic sites. For instance, Ref. [
19] claimed that static loading at aircraft parking lots, ports, terminals, industrial areas, car parks, etc., has a higher impact than common traffic loads. The loading time is also longer and concentrated within small contact areas. Hence, these pavements work differently than road pavements and need to be properly analyzed. However, the static load is not the only distinct factor in the parking area; the slow cruising speed for parking search, the number and type of parking manoeuvres, and other traffic activities should be investigated.
Previous pavement research has focused on studying the causes of pavement distress, with less attention paid to their impact. Drivers’ decisions to deal with different levels of pavement deterioration may affect safety and the economy. A correlation has been found between good pavement surfaces and lower crash rates in roadways [
20]. Ref. [
21] found that crash probability caused by pavement defect is more serious at larger flow arterial roads followed by the local and collector. In contrast, insufficient information is known about the effect of pavement conditions on the parking decision. However, the results of decision studies are crucial in the pavement management system.
According to surveys conducted in Europe before the turn of the century, 25–40% of travel time and distance to central urban areas is attributed to parking searches [
22]. Parking choice behaviour has been widely investigated from several perspectives, including parking type and parking facility choice, parking search duration, joint choice of travel mode, destination and parking facility, and parking stall choice. Most of these studies examine the behavioural decision of drivers while cruising for parking and investigate the main traffic-related explanatory variables [
23]. This paper contributes to the literature by investigating the effect of surface distress on parking choice.
Generally, the previous pavement studies did not give enough attention to parking lots. Also, previous research focused only on studying the impact of environmental causes of distress, or only the axial traffic load of vehicles. The parking choice decision did not focus much on asphalt deterioration or its types. This research aims to address the deficiency in the previous study by giving more attention to the hidden traffic causes and effects of road distress and their types in relation to parking lots.
2. Data Description
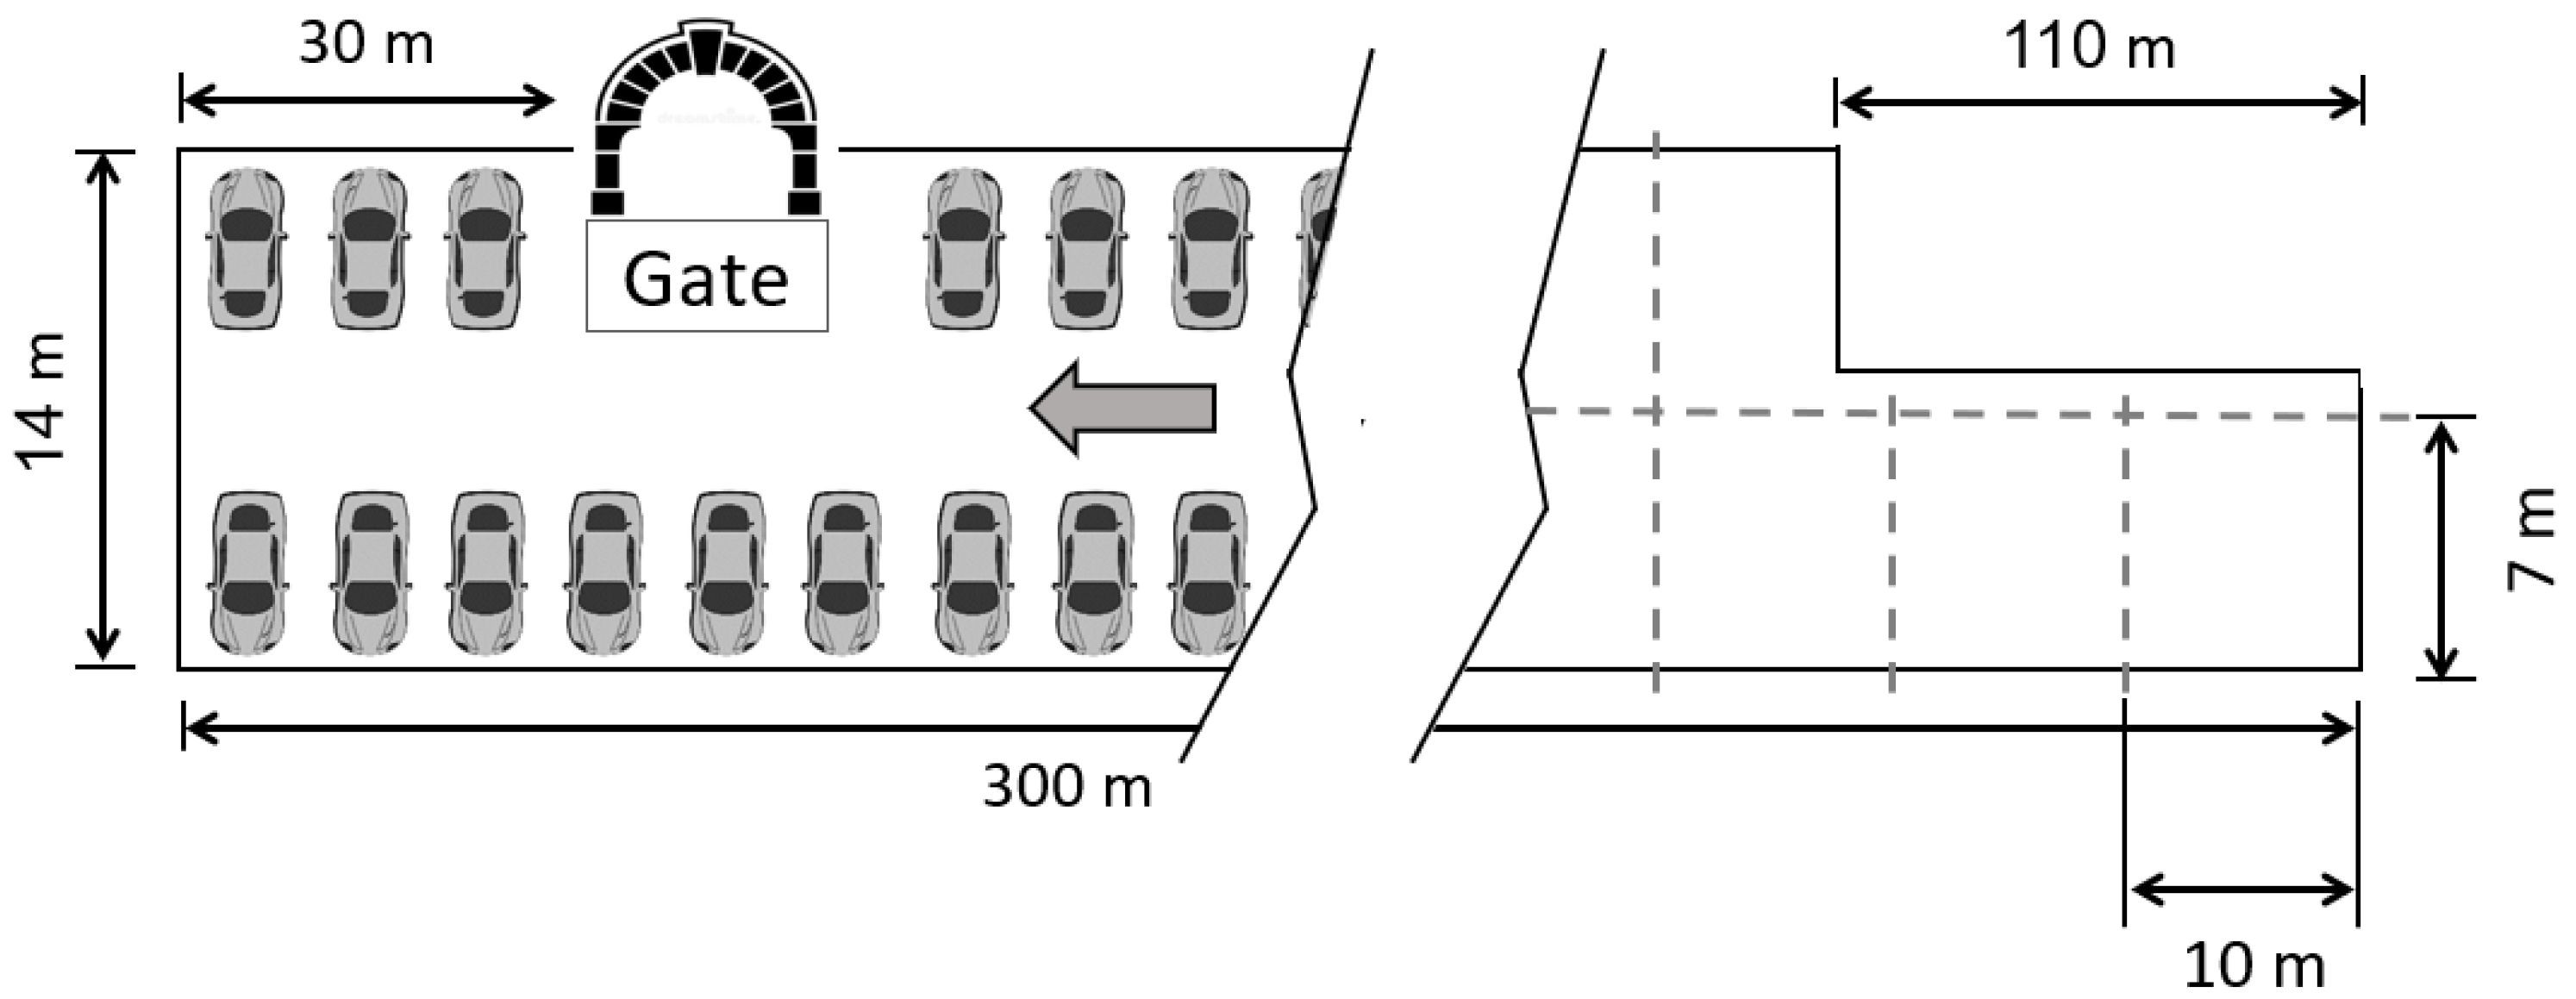
The case study was conducted for a university (i.e., Al-Zaytoonah University of Jordan) off-street parking lot in a rural district. The parking lot is about 300 m long and 14 m wide, as shown in
Figure 1. First, passenger cars move in the middle of the lots to find a free, suitable parking space. Then, the cars parked at the lateral parts of the area on both sides at a 90 degrees angle. The final destination for the passenger of the parked cars is the university entrance gate, which is about 30 m from the west corner of the parking lot (not in the middle), as shown in
Figure 1 and
Figure 2. Students mainly use this parking, so there are continuous parking activities (parking manoeuvres) during the working days. Frequent parking activities magnify the relationship between pavement defects and traffic characteristics; therefore, this type of parking was selected as a case study.
To facilitate the data analysis process and finally obtain accurate models, it is initially important to segment the data into small entities during the preparation step [
24,
25,
26]. Therefore, the selected parking was divided into equal sections; each section is 10 m long and 7 m wide, as shown in the left part of
Figure 1. This resulted in 49 sections. Cars searching for a parking space move either on a portion of a section or the entire section if it is empty. Therefore, each section was given a reference code, and data was collected on all sections. The primary data collection included two main types of surveys: traffic survey and pavement survey.
The traffic survey aims to observe and tabulate the vehicle activities within the parking area. These traffic activities include the number of parking manoeuvres, shape of parking, traffic volume, average speed, percent of heavy vehicles, and parking duration. This data was collected by a specialized team with the assistance of surveillance cameras for each separate section. The process of data recording was done at regular five-minute intervals. The data collection continued for all working days of the week (i.e., Sunday to Thursday) during working hours (7 a.m. to 3 p.m.), and the daily average of the results was finally taken.
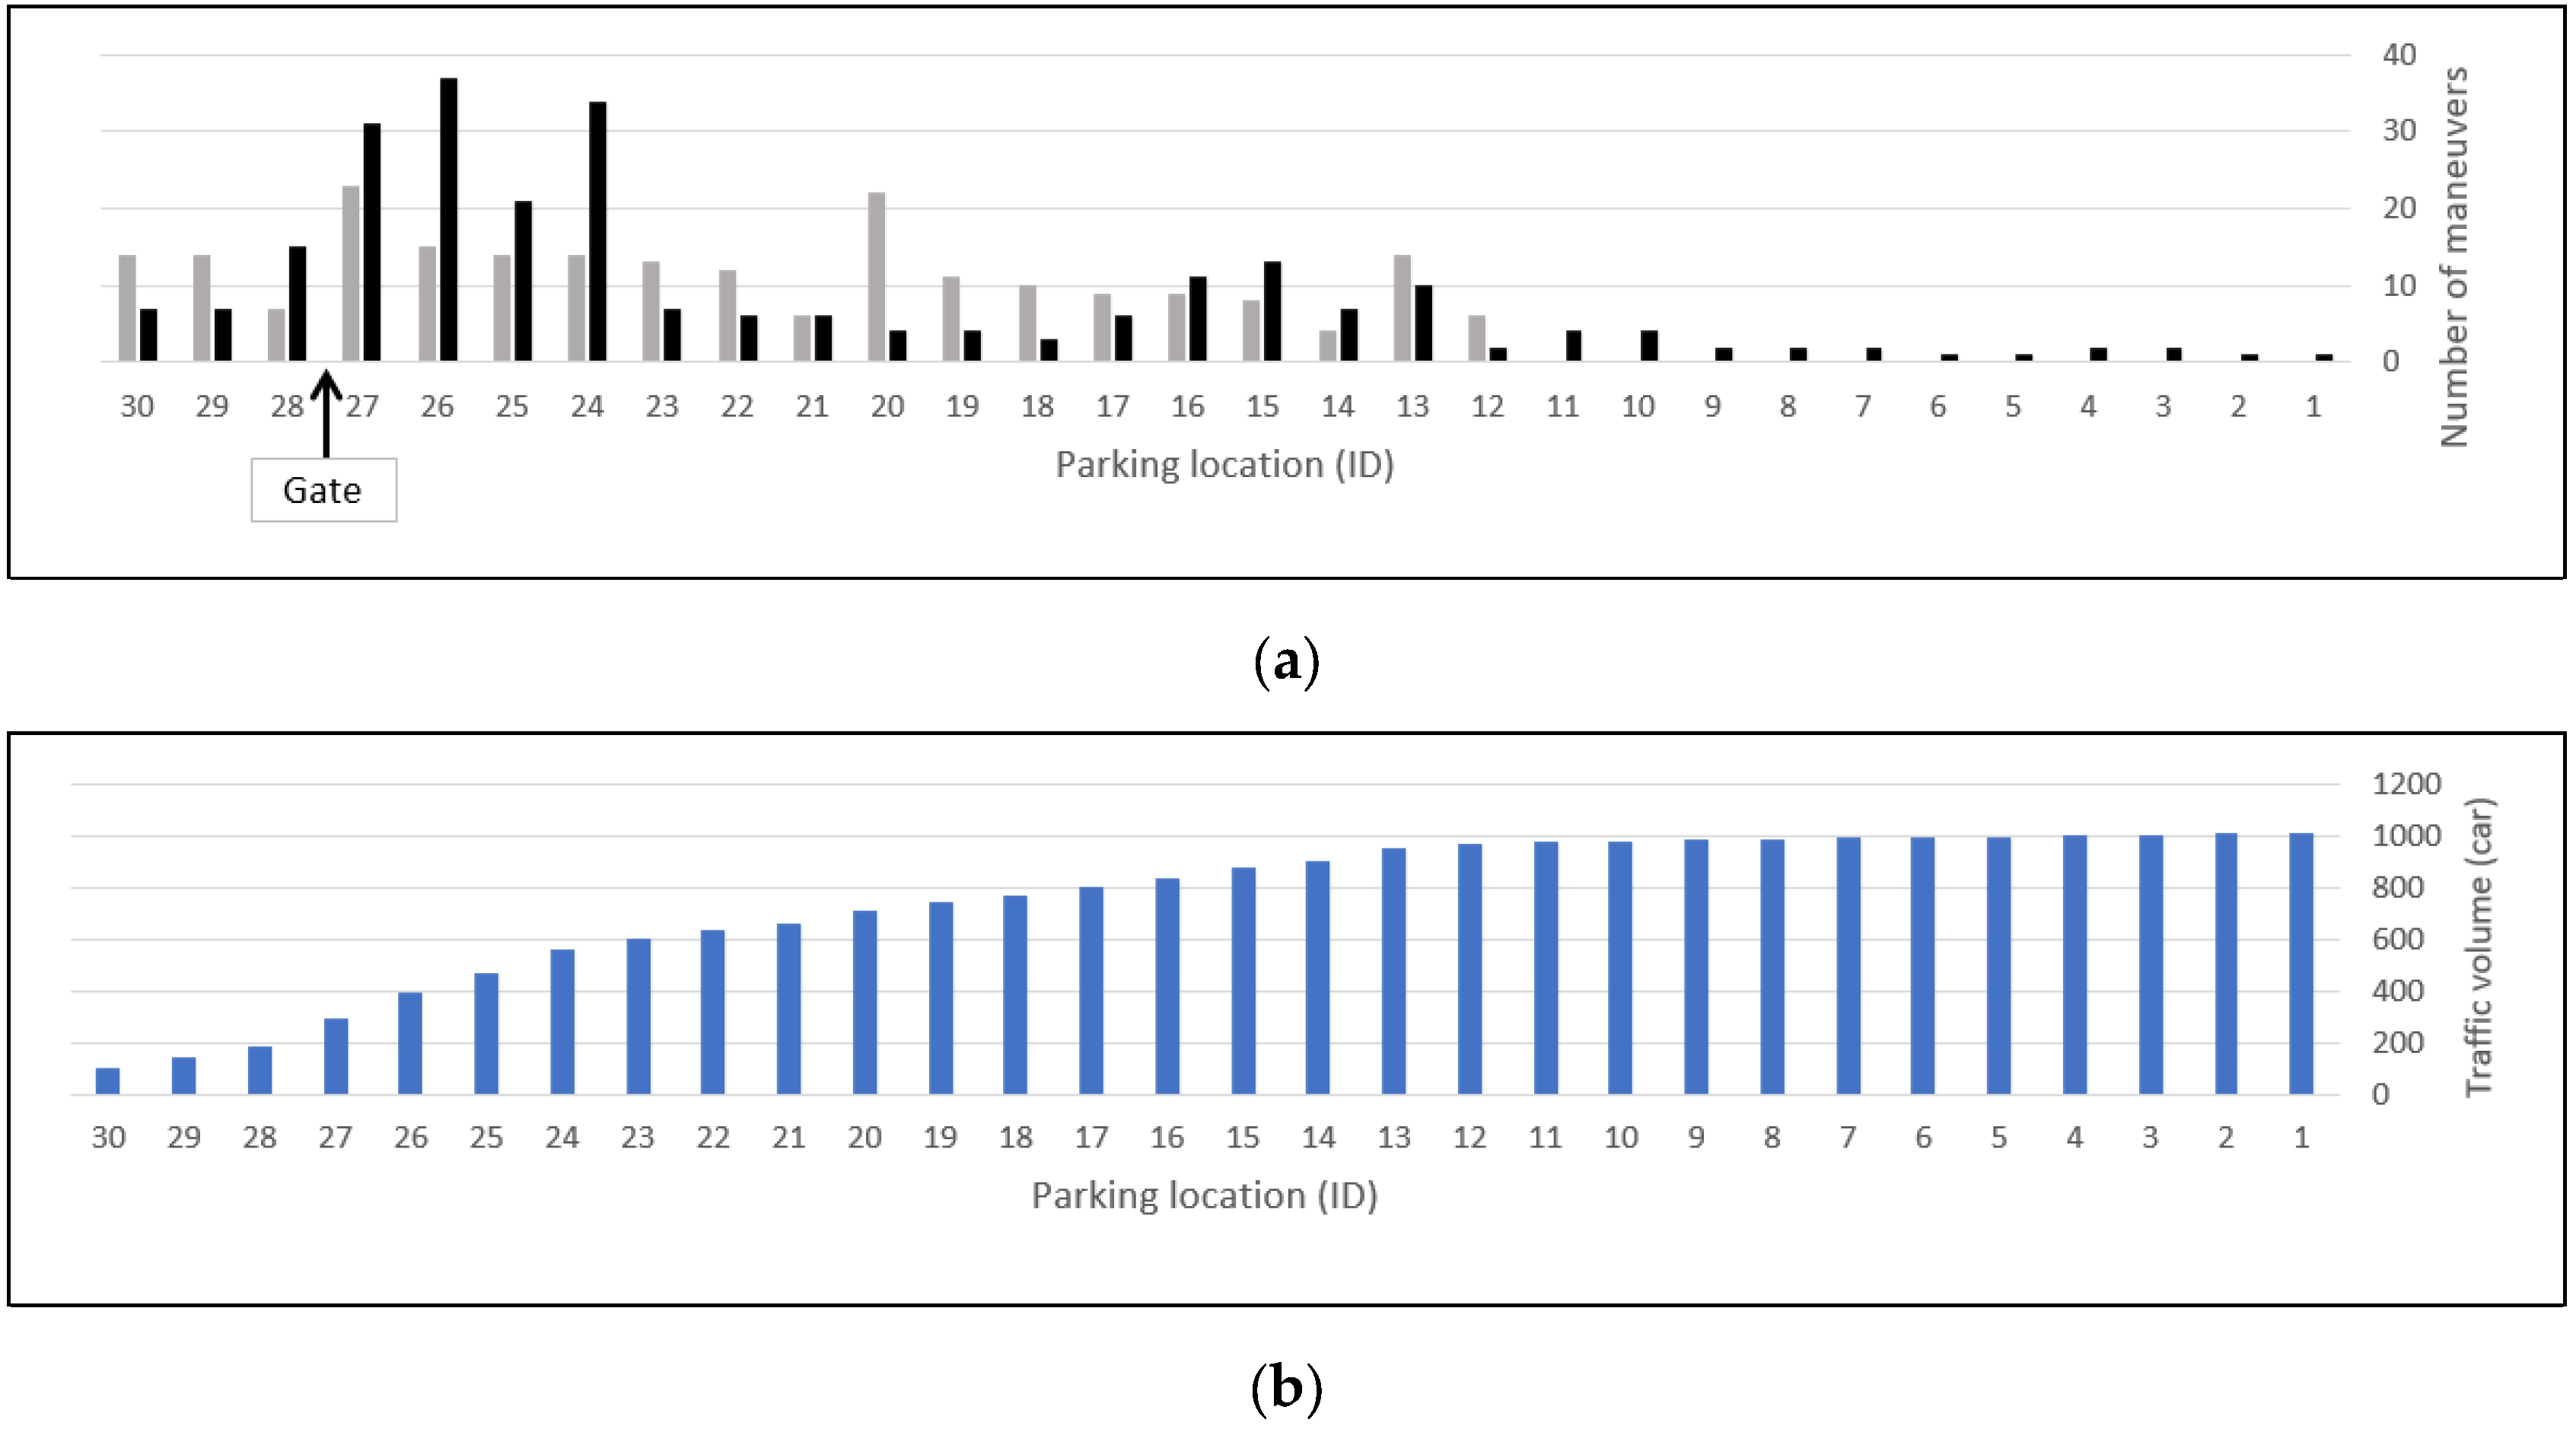
Figure 3 and
Table 1 present the average daily distribution of traffic data per parking section and their descriptive statistics, respectively.
Figure 3a shows the change in the number of maneuvers along the parking lot toward the gate for both sides. It is important to remind the reader here that the data is recorded for every 10-m-wide section that accommodates approximately 5 vehicles. This explains the sometimes-high number of maneuvers during only 8 h of a working day. The number of parking maneuvers shows an approximate increasing pattern in the direction of the gate (i.e., between parking 28 and 27 of the
x-axis in the figure) with sometimes irregular change. The irregular count may be explained by other factors affecting the driver’s parking decision (e.g., safety concerns, walking distance, parking availability, road surface conditions, etc.). This paper will examine some of these factors.
The same traffic volume was recorded per every two opposite sections of the parking lot (
Figure 1) whenever a car traverses them searching for a free parking space. In contrast to the maneuver frequencies, the traffic volume showed a decreasing pattern towards the final destination with a slight variance, as presented in
Figure 3b. It is important to note that traffic volume is not the same for all sections as it depends on the final selected parking space by the car. However, the significance of this factor will be decided by the developed model in later parts of this paper. On the other hand, the speed factor may be more important, as the speed varies according to the extension of the empty parking spaces. Also, the driver begins to reduce the speed and move slowly while searching and approaching a parking space.
During data collection, it was observed that the number of parking maneuvers is relatively large (i.e., 478 maneuvers per day on average) compared to the number of parking spaces. This can be explained by the recurrent parking activities of students with flexible and different study and working times. Moreover, the statistics of the same attribute, presented in
Table 1, indicate the uneven distribution of parking activities among the different spaces. In other words, drivers prefer some parking areas over others. Moreover, the frequent car activities are also reflected in a relatively high average traffic volume (i.e., 753). On the other hand, the recorded speed, parking duration, and walking distance ranged between 17–36 km/h, 16–370 min, and 10–260 m, respectively.
The second part of data collection concerns the performance of the pavement surface. In this survey, a team of expert engineers assisted each section. The assessment includes a tabulation of all present surface distresses, including their type, severity, and quantity. Then the collected data were analyzed using the PCI method [
18].
The PCI is a numerical indicator used to evaluate the condition of pavement surfaces. This indicator has seven rating scales. The ranges of each scale are 85–100 (good), 70–85 (satisfactory), 55–70 (fair), 40–55 (poor), 25–40 (very poor), 10–25 (serious), and 0–10 (failed). PCI also classifies 19 types of road distresses. This research will focus only on the most common and influential distresses. Based on the data of dimension, the severity level of each type of distress can be classified into low (L), moderate (M), and high (H) severity. The process of PCI computing, in a nutshell, is elucidated as follows [
27]:
The data was then prepared for further analysis processes. However, environmental conditions were not included in the analysis as they would affect all sections at the same level.
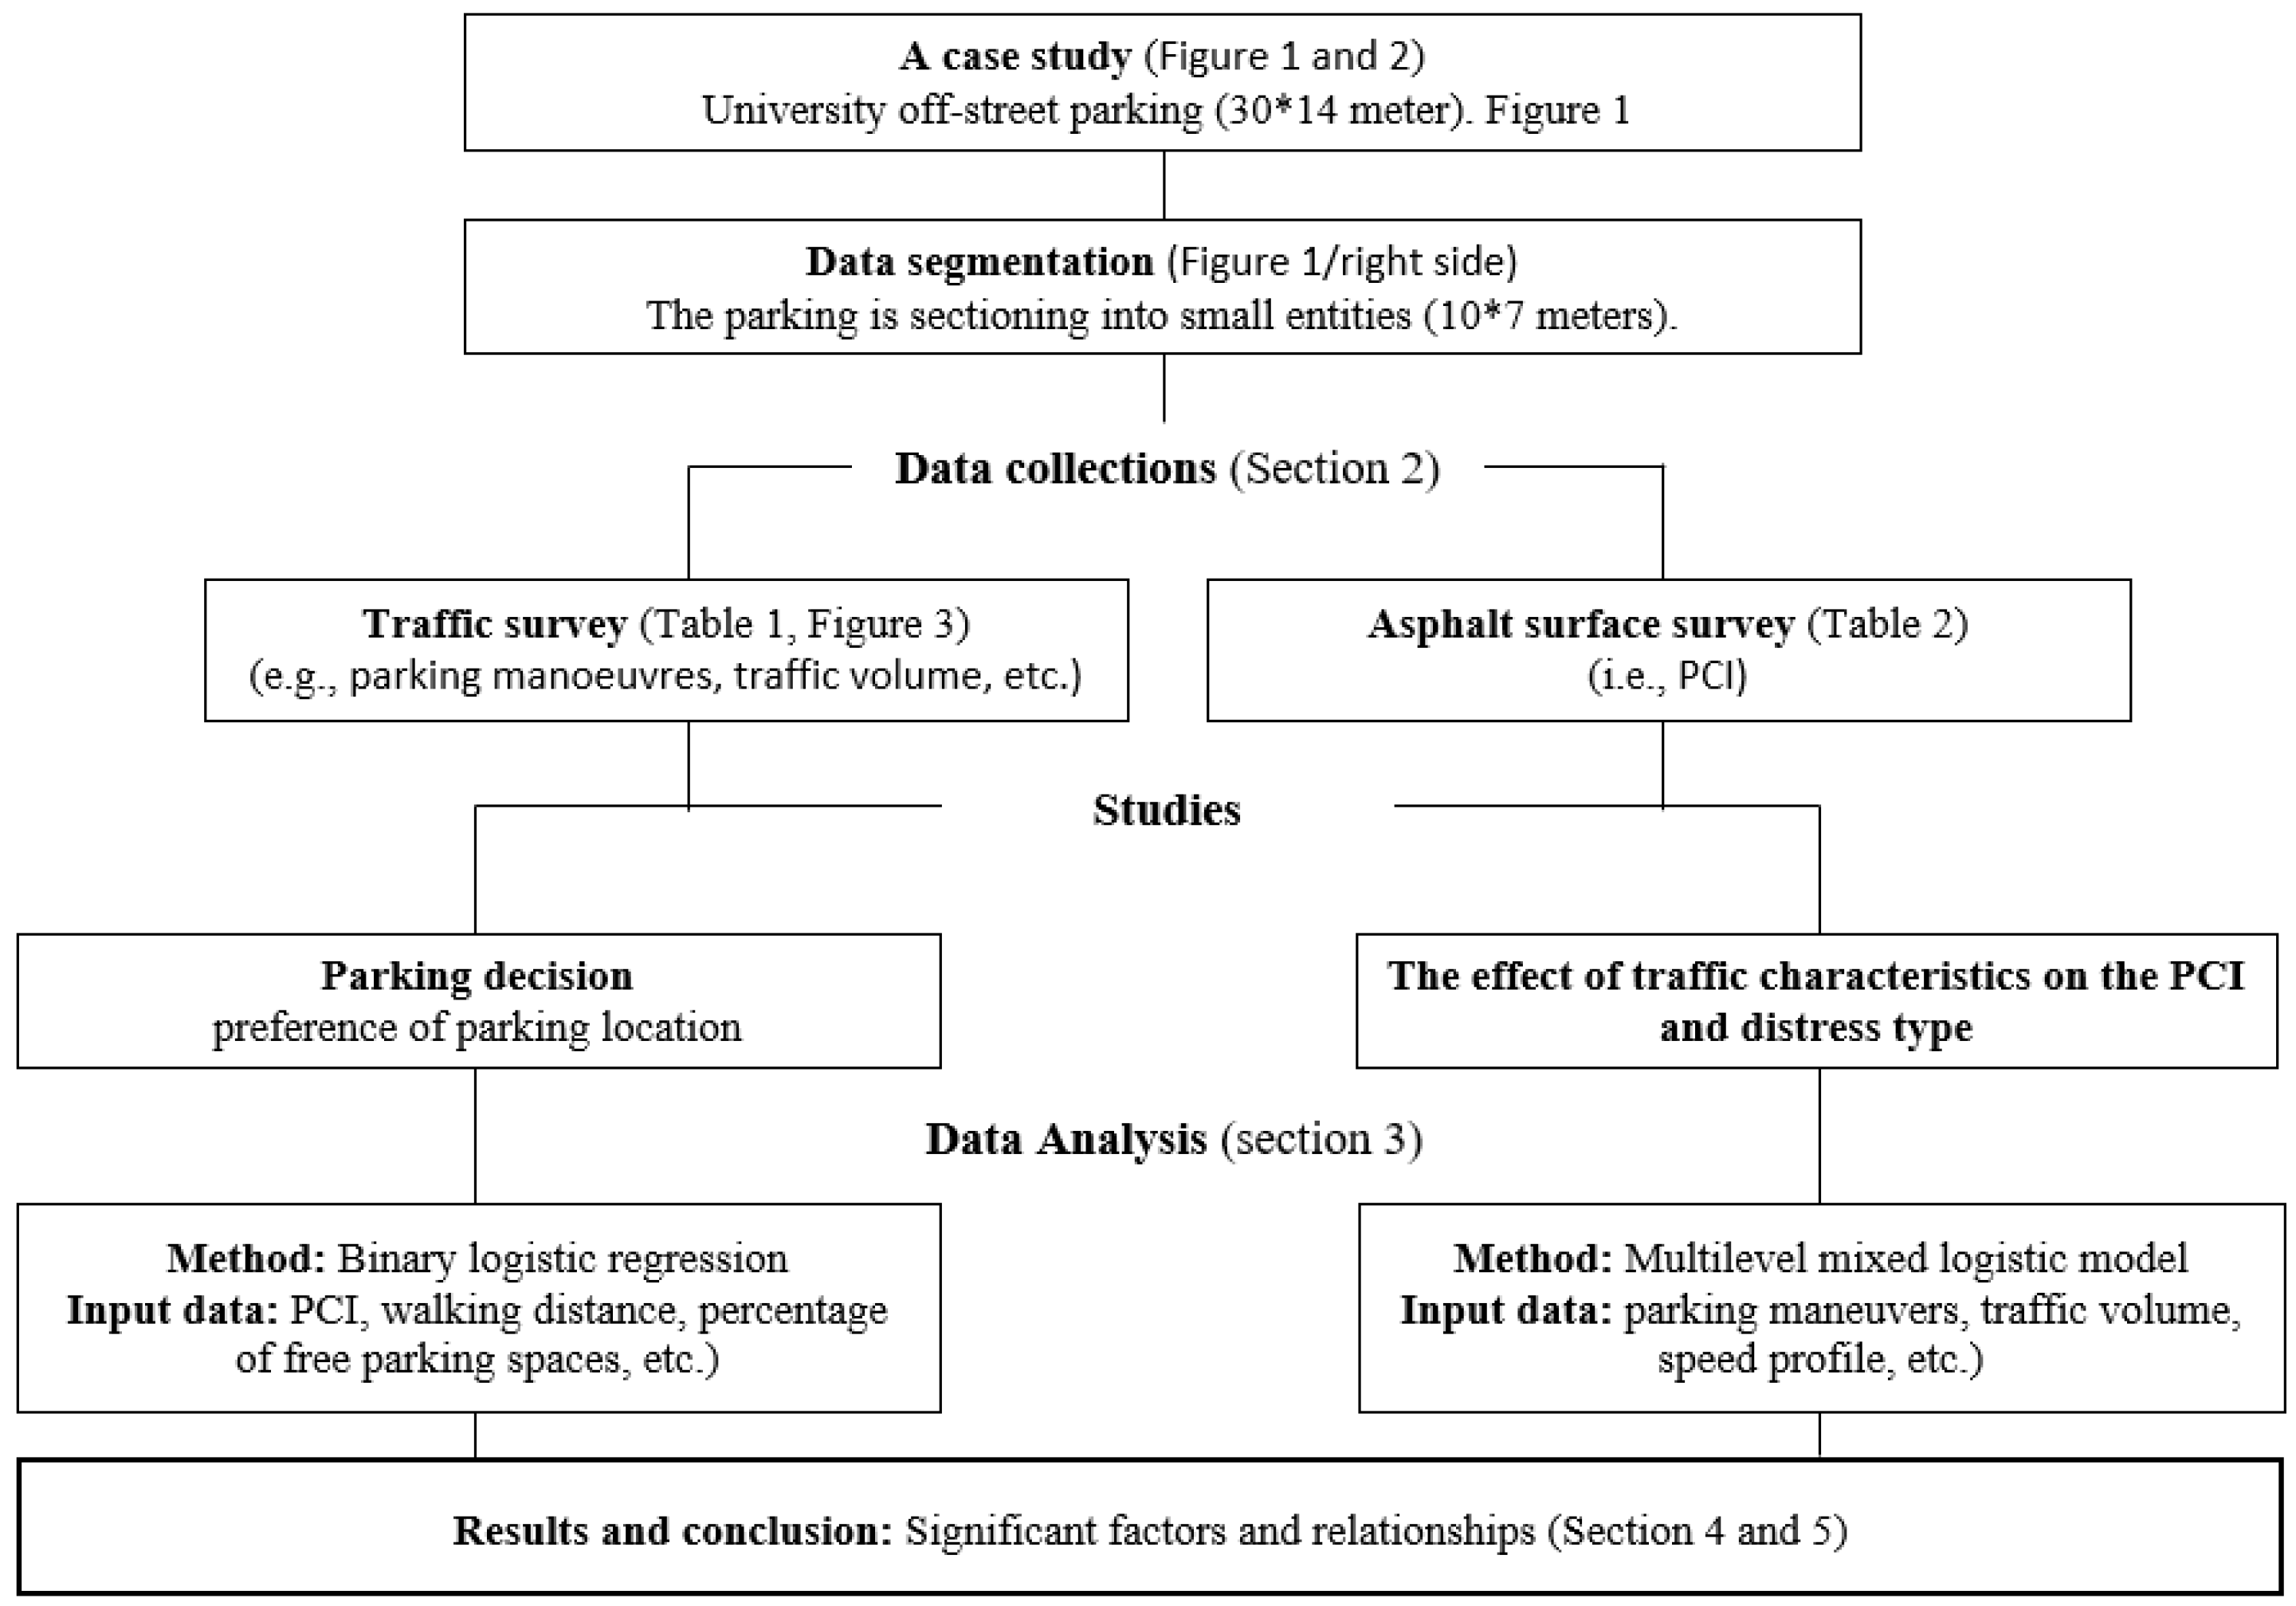
3. Methodology
A schematic diagram of the applied methodology is summarized in
Figure 4 and detailed in the following sections.
3.1. Parking Decision
In the pavement management standards for parking lots, it is important to determine the appropriate time and cost for surface maintenance. In the case of roadways, periodic maintenance is carried out to maintain a comfortable and safe traffic flow, and it is not preferred that the value of the PCI decrease under certain limits. However, the question arises, is this maintenance required for parking lots at the same level as roadways, or can the car park be in worse road surface conditions? Does the type of pavement distress affect the choice of parking point?
The study of the driver’s choice of empty parking space may be based on several factors. The main factors affecting the driver’s decision to choose where to park their car have been studied based on survey data. The data were collected at regular intervals (i.e., every 5 min) during peak hours. The recorded data includes the number of parking manoeuvres, the selected parking identifier, pavement conditions, and the walking distance from the parking point to the destination. To collect real information about the driver’s decision, the data collection started when all the parking spaces were empty, so the driver could freely choose any parking space. Then the selection of successive drivers for the empty parking spaces was observed and recorded until almost all the spaces were filled.
The choice to park a car or not at any of the available spaces was analyzed in a binary regression model. However, selecting any parking space is a conditional probability that depends on the availability of free space, such as: Probability (park—given that—space). Therefore, it is also important to add another factor that represents the percentage of available parking spaces to the model.
3.2. The Effect of Traffic Characteristics on the PCI
Statistical modelling is an effective way to study the relationship between traffic characteristics for parking lots (i.e., speed profile, traffic volume, number of parking manoeuvres) and their effect on pavement surface conditions. However, the difference in traffic characteristics may lead to the formation of different types of pavement distresses by time and location. Therefore, it is important to reveal the hidden relationship between the different explanatory variables and their effect on pavement conditions (i.e., PCI).
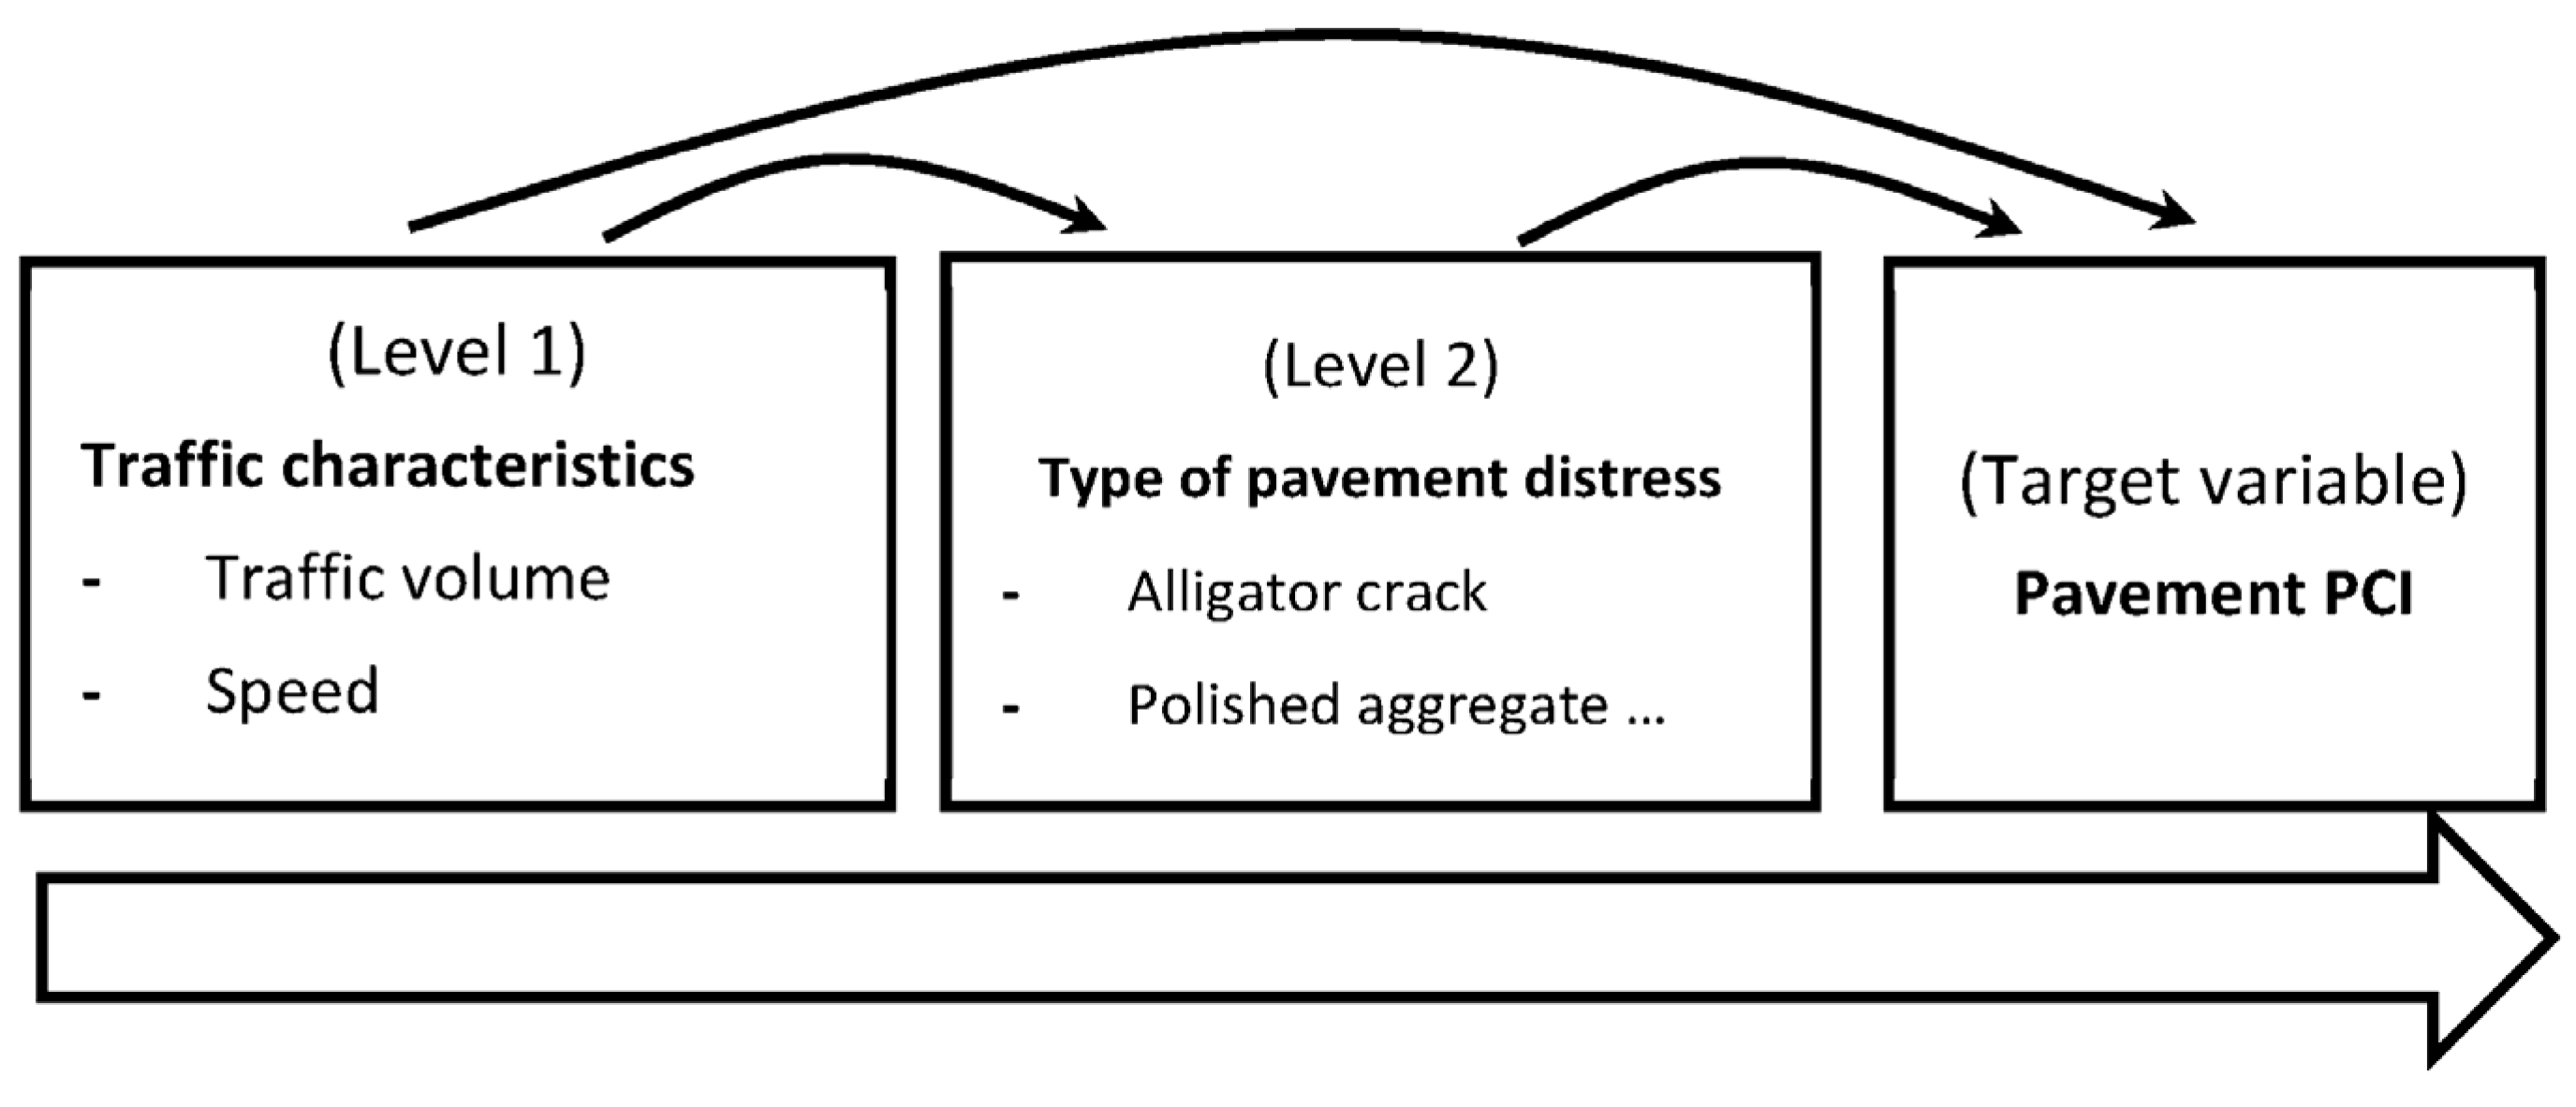
The pavement PCI can be analyzed at different information levels, as described in
Figure 5. The amount of pavement deterioration (i.e., PCI) may be affected by the traffic characteristics at the individual level (level 1). Moreover, the variation of traffic conditions plays an important role in formulating specific types of distress, at the group level (level 2). Therefore, every kind of distress affects a different weight on the calculated PCI.
Accordingly, to reveal the hidden relationship between explanatory variables at the individual and group levels, it is reasonable to investigate the hidden effects of the hierarchical structure. The application of a multilevel mixed model may increase the accuracy of predicting the nested relationship between the different explanatory variables. The multilevel analysis includes modelling the relationship between the lower individual level traffic characteristics (level 1) and the type of distress at the higher group level (level 2) by taking advantage of the clustered dataset.
The methodology of preparing the data for multilevel modelling is based firstly on calculating the PCI for every distress at each section individually. Then, the traffic characteristics data and the PCIs are clustered with respect to distress types.
Table 2 presents a sample of the data prepared for multilevel modelling.
The intraclass correlation (ICC) describes the proportion of variance in the outcome that can be explained by the grouping structure. In other words, ICC is used to depict the applicability of multilevel in the data structure (
Figure 5). The higher the ICC, the more homogeneous the units. In contrast, if the ICC is quite small (i.e., researchers often use 0.05 as a rough point), then there would be little advantage to conducting a multilevel, and a single-level analysis would suffice.
4. Results
In the present study, the data on pavement distresses was collected for each segment of the parking lots by a specialized team. The PAVER software was then used to calculate PCI values for all segments and distresses, as described in
Table 2.
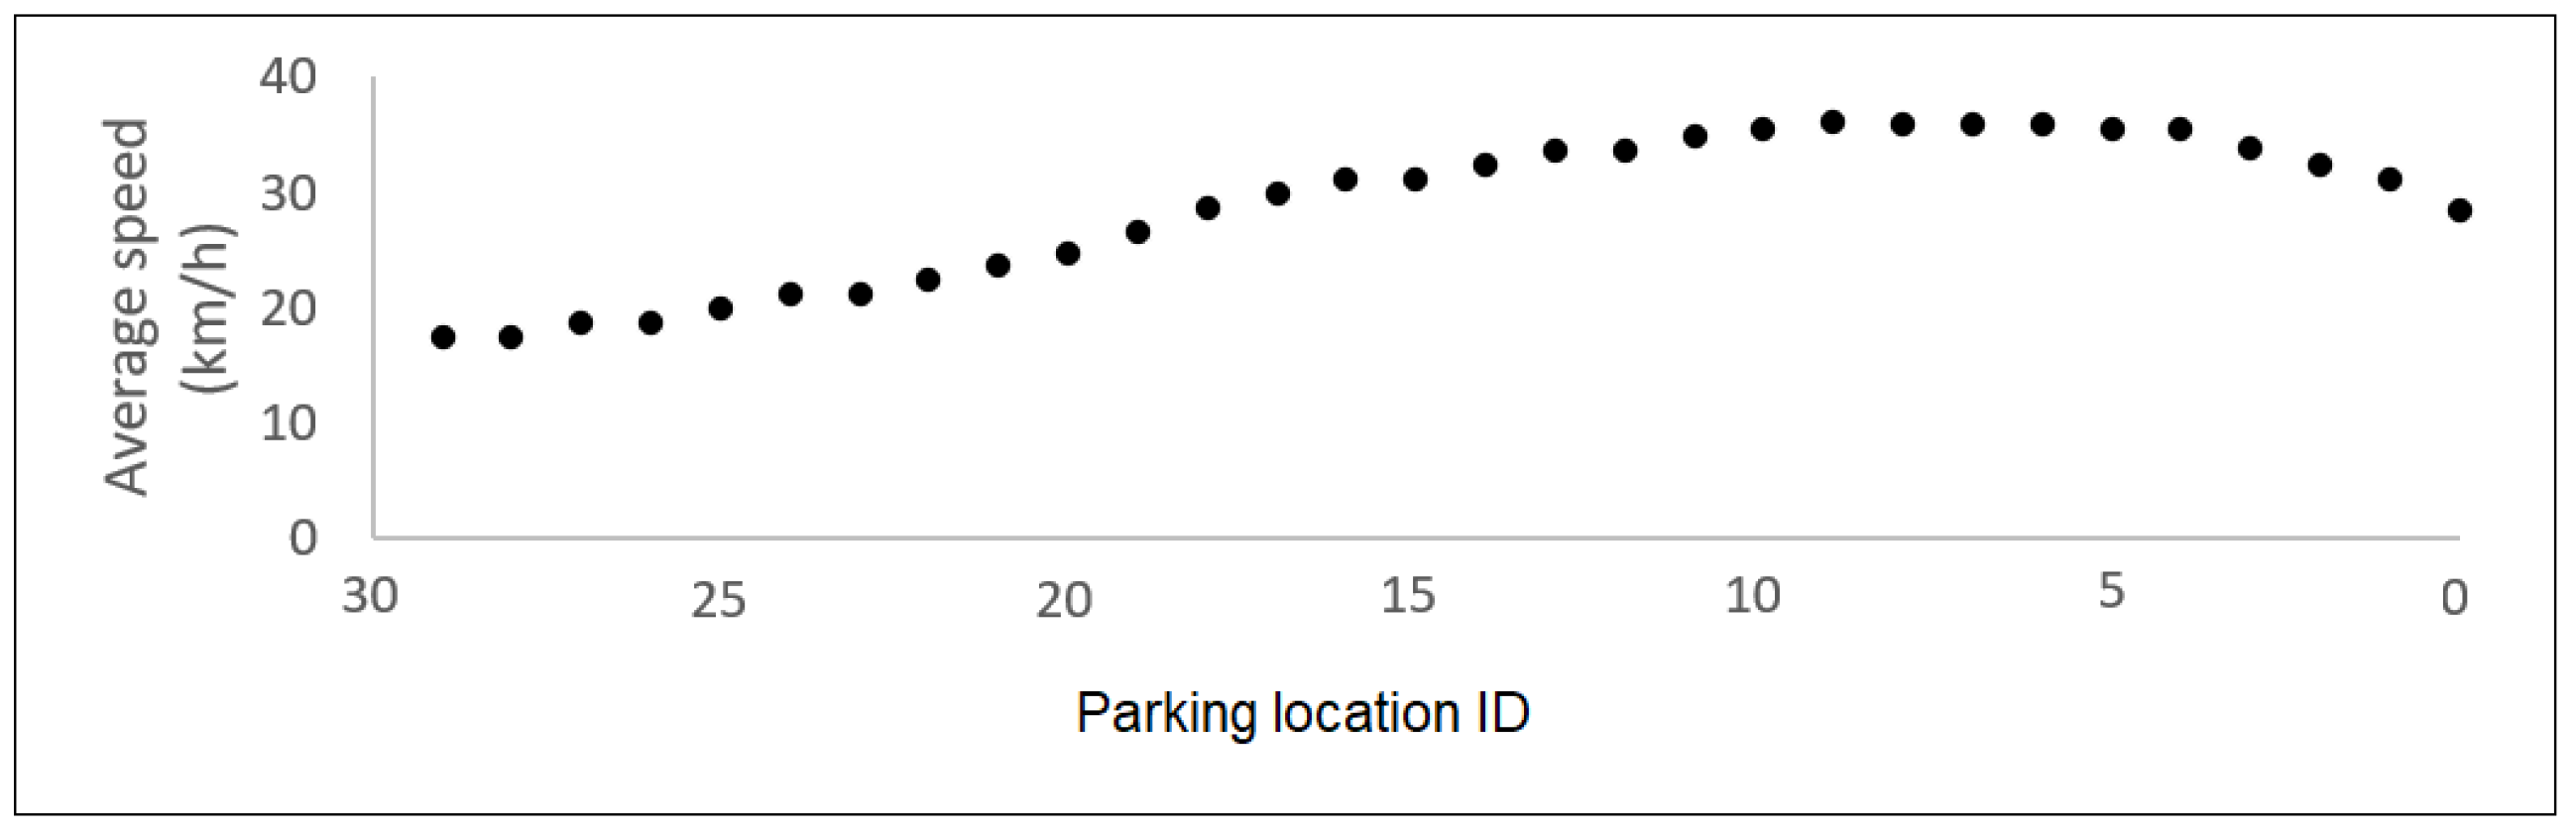
Figure 6 shows the speed profile on average of the moving cars (according to
Figure 1) along the parking span.
It is noted that at the beginning (from the right of
Figure 6), the driver increases their speed to a certain distance, and then the speed gradually decreases when approaching the entrance gate (refer to
Figure 1). The reason is that the parking spaces far from the gate are less occupied most of the time, allowing higher average speed than those near the gate.
The next two sections include two important findings: the effect of pavement surface condition on parking decisions, and the most important parking characteristics affecting PCI.
4.1. Results of Parking Decision
The choice of parking or not at any of the available spaces was analyzed in a binary regression model. The result of the model is presented in
Table 3.
Table 3 contains the variables of the resulting binary logistic regression for parking decisions. The variables include the walking distance (from the parking point to the destination point) and the PCI values for alligator crack, potholes, depression, and polished aggregate, separately. The result of the model shows the following. The intercept, walking distance, and PCI for pavement depression are the only significant variables for the 95% confidence level. The estimated coefficient represents the odd ratio of parking decisions (i.e., yes park or no don’t), with ‘yes’ as a reference group. When the odd ratio is less than 1, the probability of accepting the parking decreases, while it increases if the odd ratio is above 1. The intercept value can be interpreted as the odd ratio of accepting to park in the given section, assuming all predictors to be zeros. The resulting higher odd ratio of the intercept (
Table 3) indicates that if the walking distance is zero and the pavement conditions are perfect (all PCIs are 100), there will be a large chance of accepting the parking.
On the other hand, the slope variables can be interpreted as a reciprocal of the amount required to increase or decrease the odd value of accepting or rejecting the given parking space by one unit, holding the other predictors at their base values. For instance, as the walking distance increases by one unit, the driver’s decision to park their car decreases by about 28% (). This confirms the interpreted result of the intercept and indicates a good relationship between the walking distance and parking decision.
In contrast, although some other PCI variables in
Table 3 are non-significant, their values have some significant indications. Firstly, it is important to remind the reader that as the PCI value increased, the pavement surface became better with fewer defects. The PCI for pavement depression is also significant, with less than a 5 percent error. Drivers seem concerned about parking their cars on depressed surfaces. As the PCI for surface depression decreases by 1 unit, the parking decision seems to decrease by around 10%. The same result can be found with the potholes’ 90% significant PCI value (i.e., for higher potholes, the PCI value will be 6% more attractive for parking). However, the driver’s decision seems unaffected by the presence of the other two distress types: alligator cracks and polished aggregate.
Generally, drivers don’t seem to like walking long distances from the parking point to their final destination, even if the asphalt conditions are poor.
4.2. PCI Modelling Results
To model the pavement condition of a parking surface, several explanatory variables have been tested, including; traffic volume, number of parking manoeuvres, speed profile, and percent of heavy vehicles. At the same time, the types of pavement distress have been measured for all sections of the case study.
To model the PCI and reveal the potentially unobserved correlation effects within groups of pavement distresses and address the influence of individual traffic characteristics, a linear regression mixed model has been developed for the case study. The mixed model was applied several times, and insignificant variables were excluded. The model’s results, including the most important variables, are presented in
Table 4 and
Table 5.
Table 4 presents the variance component of the random intercept. The ratio of the ICC 0.34 (
) justifies the use of the multilevel model (i.e.,
) [
28,
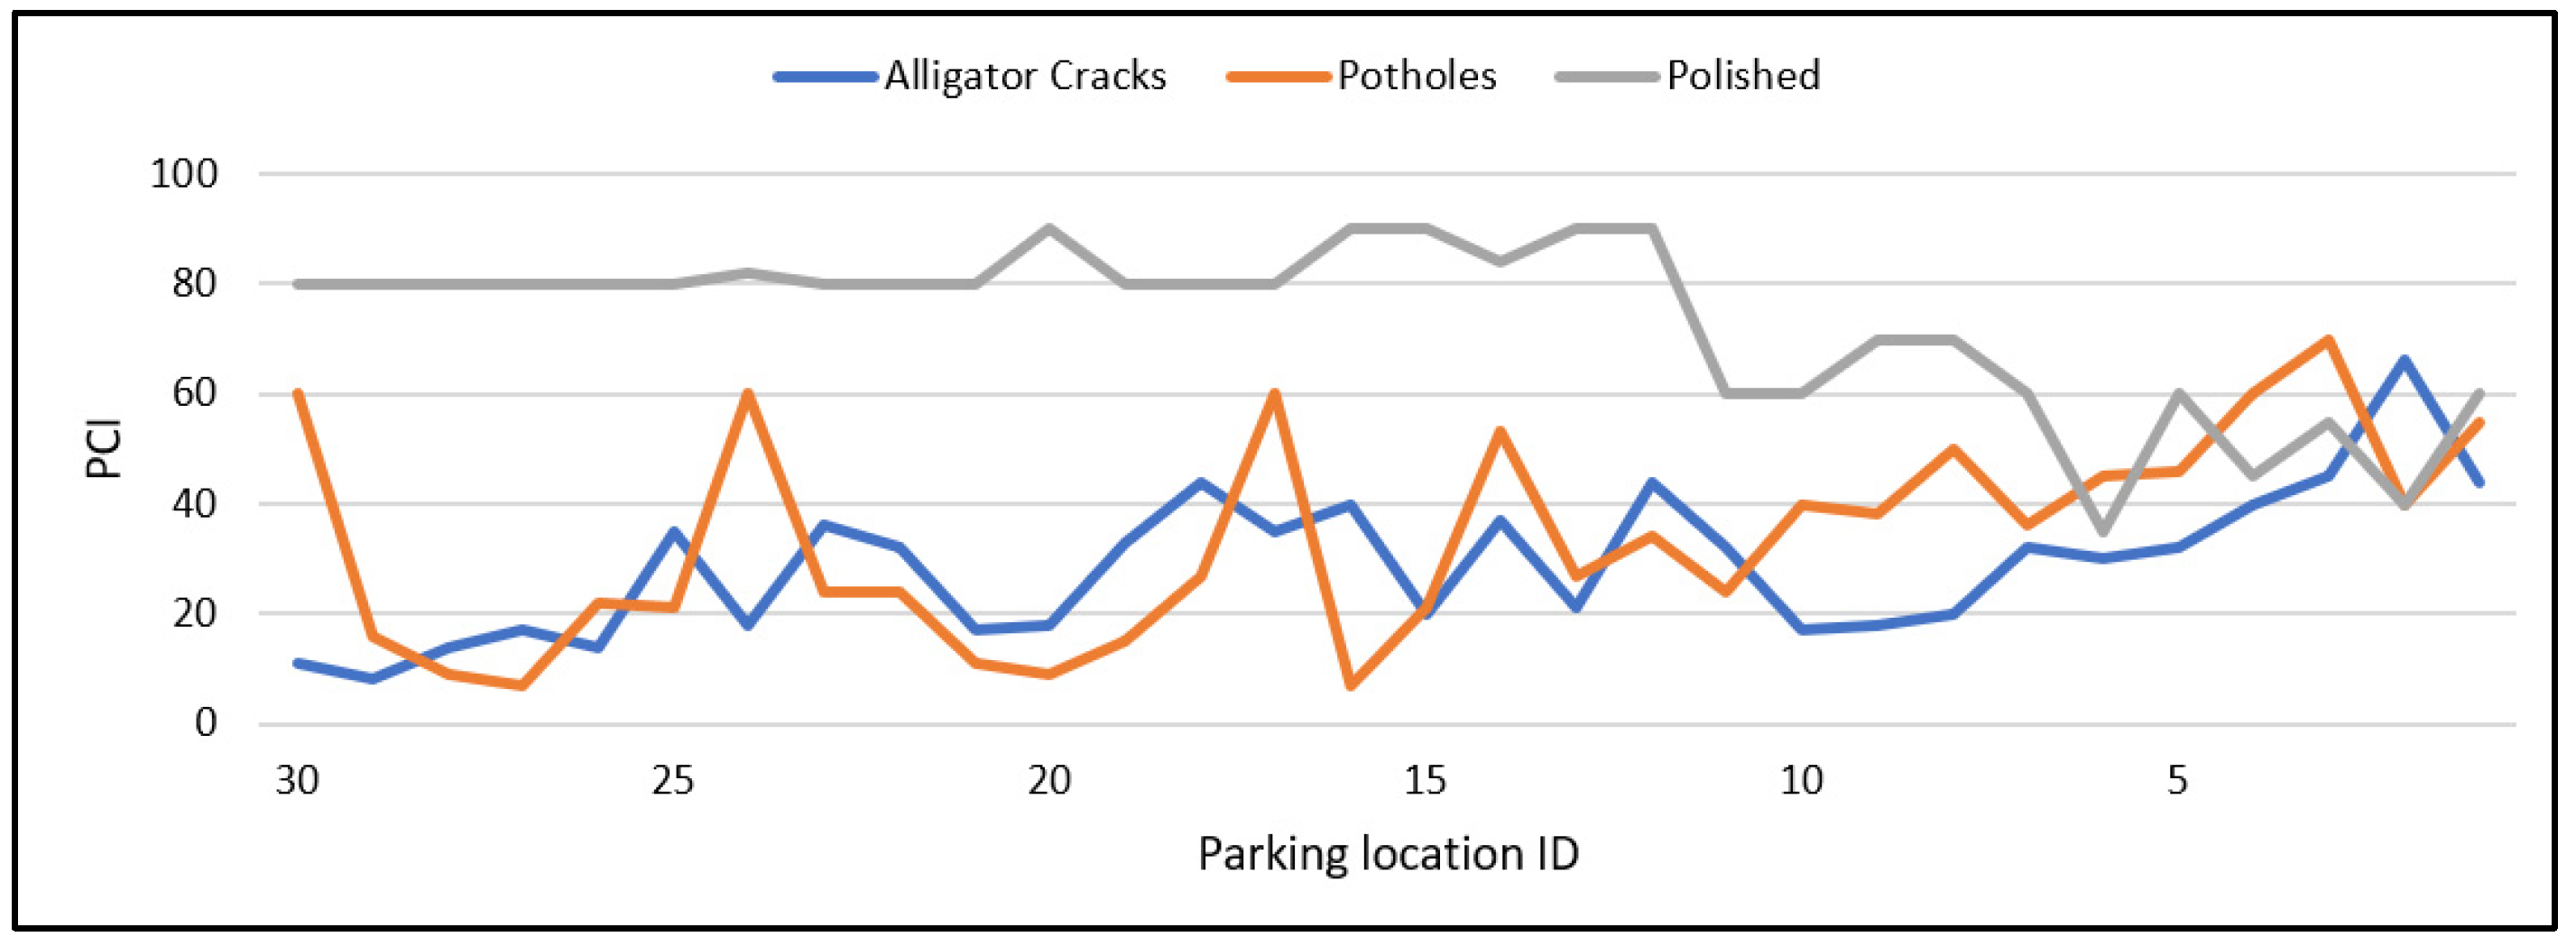
29]. These findings support the applicability of the developed multilevel model in explaining hierarchical interrelationships among the identified variables. Furthermore, the presence of two levels in the explanatory variables reveals a hidden relationship between both the number of parking maneuvers and average vehicle speed from one side and three significant types of distresses, i.e., alligator cracks, polished aggregate, and potholes (i.e., their PCI presented in
Figure 7) from another side, as presented in
Table 5. In other words, there is a possibility that the characteristics of the traffic have an influence on the resulting shape of pavement distress.
Table 5 summarizes the estimated fixed effect coefficients of the resulting mixed model. The level-1 fixed effect parameters all satisfy the 90% confidence level. The level-1 intercept is 66.62 (
p-value < 0.001). This represents the average value of PCI, assuming the other variables are at their base value (average or zero). The other level-1 predictors are the number of parking manoeuvres and the average speed. The negative value of the number of manoeuvres coefficient (−0.40,
p-value < 0.001) indicates an inverse relationship with the PCI. For every unit increase in the number of parking maneuvers, the surface quality (i.e., PCI) gets worse by 40%. In contrast, there is a proportional relationship between average vehicle speed and PCI (0.34,
p-value = 0.10). This tells us that moving at a low speed and seeking parking would increase the probability of pavement damage by 34%.
The only level-two variable is the type of pavement distress. The type of pavement distress is a categorical variable, each number indicating a different kind of distress. Interpretation of its results is affected by a pre-determined base value. The distress type-18 has been chosen as a reference in explaining the other distresses.
Table 5 shows that the alligator crack has a significant negative effect on the pavement conditions, with a probability of decreasing the PCI value by 43 times. These results are logical, as alligator cracks usually result when the load on the road exceeds the design load, which is caused by the repeated impact of low-moving vehicles. Pothole distress has a similar probability with the alligator crack (−48,
p-value < 0.001). In general, potholes are the result of severe alligator cracks. The third significant distress, polished aggregate (12,
p-value = 0.02), does not show a negative impact on pavement conditions. This could be explained by the fact that this type of distresses does not affect the safety of slow-moving vehicles that already move at low speeds.
5. Conclusions and Discussion
Parking lots are different from the highway and other travelling roadways. In parking areas, vehicles move at a lower speed or stand for long periods. In addition, repeated parking manoeuvres, have a different effect on pavement aging and types of resulting distress, as claimed in this research. This research aims to identify and interpret the main traffic factors affecting the pavement condition index (PCI) of asphalt within parking areas. The study also examined the effect of the severity and type of asphalt pavement distress on a parking decision process.
A case study was taken for a parking lot with a 300 m length and a 14 m width. The site was divided into 59 equal parking spaces (10 m length by 7 m width) to facilitate data collection and analysis. The data includes the evaluation of asphalt distresses for all sections. The evaluation was conducted by a specialized team of engineers. The PCI for every noted distress was then calculated at each section separately, which resulted in about 200 rows of data. The second type of data includes observing traffic operations at each section of the parking lot, including the traffic volume, the number of parking manoeuvres, the speed profile, and the walking distance from the parking lot to the final destination.
In the methodology, a binary logistic regression was applied to study the effect of the types and severity of pavement distress on drivers’ parking decisions. This is important in pavement maintenance management and may affect the accepted lower PCI limits for asphalt maintenance of parking lots compared to common roadways. The methodology also includes applying a multilevel mixed regression model to reveal the hidden hierarchical relationship between traffic activities and the different types of pavement distresses and then discovering their effect on asphalt PCI.
The main results and findings can be summarized in the following:
There is a proportional relationship between the PCI value, the average moving speed of parking-seeking vehicles, and the number of parking manoeuvres in parking lots. According to the case study, the lower the speed, the 34% more likely pavement damage. This conclusion can be confirmed by [
19] findings. Ref. [
19] reported that the load values at parking lots are several times higher than common traffic loads. Moreover, the loading time is also longer and more concentrated, affecting the pavement within small contact areas. Thus, it leads to high pressure inside the pavement. Hence, these types of pavements work differently as compared to roadway pavements.
Similarly, there is a relationship between the formed type of pavement distress and observed traffic characteristics (i.e., parking manoeuvre and average speed). The application of the mixed model reveals the presence of two levels of information. The significance hierarchy was found between traffic characteristics at the individual level and the following distress at the group level: alligator crack, polished aggregate, and potholes.
Drivers don’t like walking long distances from their parking point and the final destination, even when the asphalt conditions are poor. In other words, the parking decision shows less relationship with the pavement conditions. However, for constant distances, drivers prefer to park on surfaces with less depression and potholes. This conclusion is consistent with the [
30] findings. Ref. [
30] developed a present serviceability index (PSI) model for asphalt pavement distresses. PSI indicates the driver’s opinion and comfort on the road. Ref. [
30] showed that depression and potholes are the most significant variable for PSI estimation.
Hence, drivers are more acceptable to park on relatively lower PCI surfaces than on highways. Therefore, it is possible to modify the minimum acceptable limits of PCI for pavement maintenance. This conclusion is important in pavement maintenance management.
The large presence of alligator cracks in the parking lot area is explained by the constant and low-speed traffic, which can duplicate the weight of vehicles and thus reduce the pavement design life compared to common roadways. This is proved by [
19], who claimed that pavements affected by static loading need structural rehabilitation or reconstruction much earlier than their projected design life.
Surface depression in the parking area is inescapable. Surface depression is mainly presented in the contact area with standing vehicle tires without an accompanying hump on either side of the depression. Depression also appears when vehicles move in different, undefined paths and are more common than rutting. However, the development of surface depression of asphalt layers (i.e., permanent deformation) is influenced by the characteristics and contents of binder and aggregate, air void, ambient temperature, the magnitude of load and time, and other variables [
31].
However, parking lots are aging faster than the common traveling roads due to the increased impact of axial loads on their surfaces at low and static speeds and some distinctive traffic characteristics. Therefore, it is recommended to consider the traffic characteristics for parking lots in the future pavement design and maintenance management and related decision-making processes. Furthermore, future studies may consider laboratory testing of parking surface layers to obtain more detailed results.


