Article

Testing the Shear Strength of Mass Concrete Lift Lines: A Comparison of Procedures

Civil Engineer, Bureau of Reclamation, Denver, CO 80225, USA
*
Author to whom correspondence should be addressed.
Infrastructures 2023, 8(3), 55; https://doi.org/10.3390/infrastructures8030055
Submission received: 28 December 2022 / Revised: 10 March 2023 / Accepted: 13 March 2023 / Published: 15 March 2023
(This article belongs to the Special Issue Advances in Dam Engineering of the 21st Century)

Abstract

:
Accurately evaluating the break bond and sliding shear strength of mass concrete lift lines is critical for any structural analysis of a dam. Of paramount importance and difficulty is the determination of break bond strength and of realistic peak and residual sliding shear strength parameters, in order to develop the anticipated strength degradation with shear displacement. Traditional multistage direct shear testing repeatedly shears the same specimen surface under increasing normal loads. The first sliding stage post-break bond has the freshest shear surface, which then degrades with each subsequent sliding stage, resulting in an artificially lower sliding friction angle and higher apparent cohesion due to accumulated damage on the shear surface. A novel approach has been proposed that, when a group of specimens are assumed to have similar characteristics, utilizes a matrix-based variable normal loading schedule that develops unique insight into shear strength degradation with sliding displacement. To eliminate the uncertainty as to which approach should be used and when, this paper documents a unique laboratory testing program where two different direct shear procedures were used for two differently sized cores obtained from the Thief Valley Dam. The two procedures were: (1) a state-of-the-art matrix-oriented approach which varies the order of the normal loads applied to develop an understanding of the shear strength degradation with sliding displacement, and (2) the typical direct shear procedure outlined in ASTM D5607, where normal loads are applied in an increasing order. This paper presents the results from: (1) the two different direct shear testing procedures and (2) the obtained strength parameters of the different core sizes.

1. Introduction

The compressive, tensile, and shear strength of mass concrete lift lines are important parameters when determining the static and seismic stability of a dam using a limit equilibrium or advanced numerical modeling. The strength parameters are typically determined through the laboratory testing of core samples obtained by drilling into an existing structure or prepared in the laboratory. The methods used for determining compressive and tensile strength are relatively straightforward and follow industry standards [1,2,3], while determining the shear strength of mass concrete lift lines can be difficult and requires specialized equipment. A particular complication arises when trying to determine the peak strength of a bonded mass concrete lift line and, after breaking, the sliding shear strength as a function of displacement; both of these parameters can be critical for evaluating the stability of a concrete dam when subjected to seismic loading. Other researchers have developed methods of the determining bond strength of concrete from laboratory methods, such as the Brazilian test [4], but these do not address the need to understand the mobilized shear strength of a lift line when subjected to additional shear displacement after breaking.
McLean and Pierce [5] compared direct shear data for parent material with bonded and unbonded lift line specimens of both conventional concrete and roller-compacted concrete (RCC) from the Bureau of Reclamation’s (Reclamation) laboratory test data. The data presented in the paper had a great deal of scatter, likely due to the large variety of materials, sources, and testing methods (i.e., shear rate, loading schedule, etc.). Commonly, the shear strength of parent concrete is assumed, in engineering practice, to have a friction angle (φ) of 45° and cohesion (c) equal to 10% of the uniaxial compressive strength (ƒ’c). McLean and Pierce [5] drew the following conclusions germane to this paper: (a) more data are needed to develop a correlation between shear strength and other strength parameters; (b) bonded lift lines appear to have the same shear strength parameters as parent concrete; (c) unbonded lift lines have lower apparent cohesion than that of parent and bonded joints, while φ is generally similar; (d) for conventional concrete (parent and bonded), φ = 45° and c = 0.1 ƒ’c appear appropriate with respect to φ and slightly unconservative with respect to c, and the use of φ = 45° and c = 0 is appropriate for unbonded joints; and e) for bonded RCC, φ = 45° and c = 0.1 ƒ’c appear unconservative for a broad range of mixes, with the use of φ = 45° and c = 0 for unbonded specimens not always being conservative.
The Electronic Power Research Institute (EPRI) published the results from 69 bonded and 154 unbonded specimens [6], primarily from tests performed at Reclamation, although no references are given for the specific reports. When compiled, the best fit line for the shear strength of the bonded specimens had φ = 57° and c = 2137 kPa. EPRI [4] found that the sliding friction failure envelope had φ = 49° and c = 483 kPa, but observed that the sliding friction data were only slightly above the residual strength envelope as the data were from multistage direct shear tests, where the specimen was slid at increasing normal loads to develop a failure envelope. The paper noted that after the initial test, the shear strength was close to the residual strength. Macdonald et al. [7] echoed this concern as it relates to rock direct shear testing and indicated that multi-stage direct shear testing should not be used to determine peak sliding shear strength.
Dolen [8] analyzed Reclamation’s Aging Concrete Information Service (ACIS) database to look for trends in strength developments over time using the placement method. It was noted that shear strength properties generally increased with a higher-quality placement method, and that the percentage of unbonded lift lines was a critical input parameter. The results presented by Dolen also appear to validate the findings of McLean and Pierce [5], which state that the break bond of the parent concrete and lift lines had similar shear strengths.
Curtis et al. [9] analyzed the shear strength of lift lines and parent concrete from laboratory testing and proposed a method to predict the shear strength envelope from other strength data. The authors suggested that a break bond shear strength envelope could be created using the Griffith criterion [10] coupled with relationships between the tensile and compressive strength of concrete. The proposed relationship was compared with laboratory direct shear data, and the authors concluded that the Griffith criteria accurately predicted the failure envelope. Additionally, Curtis et al. [9] recommends correcting the unbonded shear strength of concrete specimens back to a basic friction angle using a relationship derived from the one proposed by Patton [11], and uses the term “post-peak” to refer to the unbonded or sliding shear strength.
Lindenbach [12] compiled direct shear test results from over 1000 individual test specimens into a database. An attempt was made to correlate shear strength with compressive, splitting tensile, and/or direct tensile strength properties by analyzing the test data from specimens obtained in close proximity; however, no straightforward relationship was observed between those strength parameters and direct shear strength. The author also noted that the break bond failure envelope cohesion intercept can be roughly approximated as 10% of the uniaxial compressive strength of the concrete, or by analyzing the splitting tensile strength, although a great deal of scatter in the data resulted in significant uncertainty. Based on the significant amount of scatter in the shear strength database, Lindenbach [12] found that using assumed or predicted values for concrete direct shear strength could result in conservative or unconservative parameters with no good method of estimating whether the assumed or predicted values would over- or under-estimate the actual direct shear strength.
Lindenbach [13] noted that the Griffith criterion relationship proposed by Curtis et al. [9] does not accurately predict fracture mechanics in a heterogeneous medium such as concrete, and demonstrated that using the Griffith criterion to predict a failure envelope may be either conservative or unconservative. The author suggested that the basic friction angle correction proposed by Curtis et al. [9] had unknown origins and should be used with caution, and that even with an accepted formula [14,15], it is subject to a significant amount of uncertainty caused by dilation suppression at high normal stresses. Similar observations have also been made by McCray [15].
Yathon et al. [16] sought to develop a novel direct shear testing procedure that addressed the uncertainty identified in [6,7], namely that the multistage direct shear test results in unquantifiable accumulated damage and leads to a failure envelope that does not represent peak strength, but also does not represent the residual strength. The testing procedure developed by the authors generally followed the procedure detailed in ASTM D5607 [17] and Muralha et al. [18], with two key differences. The first modification was that instead of testing each specimen with increasing normal loads per ASTM D5607, a matrix-based approach was developed where the loading schedule was varied between similar specimens, and the data were treated as a collective for each group of specimens rather than viewed for each individual specimen. The rationale behind the ASTM D5607 loading schedule is that shearing at higher normal stresses results in more accumulated damage during shearing; therefore, each specimen should be tested under increasing normal loads, starting at the smallest normal load. Hencher and Richards [14] pointed out that this likely causes flattening of the Mohr–Coulomb failure envelope, with higher cohesion and lower φ caused by depressed shear strengths at higher normal loads due to accumulated damage. Yathon et al. [16] demonstrated this loading schedule or “slide order” dependency by showing that when two concrete specimens from the same lift line were tested using ascending and descending normal load schedules, the failure envelope for the descending schedule was “steeper” (higher φ and lower c). The second modification proposed by the authors was to increase the sliding displacement at each normal load to better evaluate the residual strength.
Using the matrix-based approach [16] and increased slide displacement, groups of specimens could be viewed collectively to provide significantly more insight into the actual peak strength (peak mobilized sliding shear strength when displacement first occurs) and the degradation in shear strength with sliding displacement. Yahton et al. [16] also present a proposed method to implement the developed shear strength as a function of normal stress and sliding displacement relationships in modeling. A key principle of this matrix-based technique is that each group of specimens needs to be considered to be the same, an assumption that likely holds true for concrete lift lines from the same block.
Lindenbach and Bearce [19] compared the results from constant normal load (CNL) and constant normal stiffness (CNS) direct shear tests on concrete specimens prepared in a laboratory. The authors postulated that the stress paths from CNS tests may provide reasonable upper- and lower-bound failure envelopes to develop a range of strength parameters, or to define peak and post-peak envelopes, but more testing is required to validate this hypothesis. Revisiting this research topic, Lindenbach and Bearce [20] compared the failure envelopes from CNL and CNS direct shear tests on laboratory concrete to the failure envelopes predicted using a rock mechanics relationship from Barton and Chouby [21]. The authors noted that the Barton and Chouby [21] empirical relationship over-predicted the mobilized shear strength for all specimens for either the CNL or CNS boundary condition, but the linear portion of the Barton and Chouby [21] failure envelopes appeared to have the same slope (φ in a linear Mohr–Coulomb space) as the CNL and CNS test results. The authors also postulated that the estimated Joint Roughness Coefficient (JRC) was likely the cause for the difference between the laboratory measured and empirically predicted shear strength envelopes. While this empirical method may hold promise, significantly more data are required before this empirical approach can be properly evaluated.
ACI [22] references the work by McLean and Pierce [5] and Lindenbach [12], and indicates that other concrete properties (compressive or tensile strength) are not good predictors of concrete shear strength. The guide indicates that given the scatter in the comprehensive database [12], the best practice is to test site-specific concrete for direct shear strength. The guide also echoes the findings in [16], which state that shear strength is a function of sliding displacement, and that the correct laboratory procedure should be used to determine design parameters. The guide suggests that in the absence of testing data, φ can be assumed to be 45° and c = 0.1ƒ’c for bonded concrete, or c = 0 for unbonded concrete; however, it does not discuss how to manage the issue of shear strength degradation with sliding displacement. The guide also suggests that the data presented in [12] can be used to help reduce uncertainty or provide insight into the potential ranges of shear strength parameters.
If a group of specimens can be assumed to have similar properties, the matrix-based method proposed by Yathon et al. [16] can be used to provide significantly more data about peak and residual sliding shear strengths than standard multistage direct shear testing, and can facilitate the development of a relationship between shear strength and sliding displacement. Given that all the historic concrete direct shear testing data available to the public has been obtained using the standard ASTM D5607 single or multistage direct shear testing procedure, there remains a significant gap in understanding how data obtained from the D5607 procedure differs, or is similar to, data from the matrix-based approach, and which type of test is more suitable.
The purpose of this paper is to compare the matrix-based approach (herein referred to as “Matrix”), which varies the order of the normal stresses applied to develop an understanding of the shear strength degradation with sliding displacement, against the typical direct shear procedure outlined in the ASTM D5607 multistage sliding test (herein referred to as D5607). The peak strength data for bonded concrete specimens are also presented, as these data must be understood for any design effort. Unique to this research is the fact that the concrete used for this comparison is from an existing structure, with the data intended to be used for structural modeling as part of an ongoing evaluation.

2. Background

The Thief Valley Dam is a reinforced concrete slab and buttress dam (Figure 1) located about 15 miles north of Baker city, Oregon, on the Powder River. The dam is an Ambursen structure, about 22 m high and 119-m long, with an initial total reservoir capacity of about 2.17 × 10⁷-m3, which has since been reduced by sedimentation. Dam construction began in 1931 and was completed in 1932. The dam impounds the Thief Valley Reservoir, which provides water storage. This study, which is part of an ongoing evaluation of the existing concrete structure, is focused on characterizing the shear strength of intact mass concrete lift lines, and the peak and residual sliding shear strength of the lift lines.

3. Field Sampling and Concrete Evaluation

Coring was performed in the field using a Hilti DD 250-CA diamond core drill attached to the concrete structure using shallow concrete anchors. Holes were drilled parallel to the visually identified lift lines using a drill bit with either a 25.4 cm or 10.2 cm inner diameter; Figure 2 shows one of the lift lines intercepted during the drilling program. Note that with this drilling orientation, the lift lines were obtained in the approximate center of the cores and were parallel to the core axis. Extreme care was taken during the drilling process, and the obtained samples were of high quality and thought to accurately represent the in situ condition of the structure. Field inspection of the samples revealed that the lift lines were of variable quality. In some cases, the obtained lift lines were partially or fully debonded, which is assumed to represent the actual condition of the structure.

3.1. Core Inspection

A total of 34 core samples from four buttresses were delivered to Reclamation’s laboratory in Denver, Colorado. As noted in the field sampling, the lift lines ranged from well-bonded to fully debonded. The concrete was from the original construction and about 90 years old at the time of testing. The concrete was not air-entrained and exhibited minor evidence of an alkali–silica reaction (ASR), although the presence of the ASR is not considered a concern. Minor cracking and microcracking, normal for early-age mechanisms such as plastic deformation and drying shrinkage, were noted.

3.2. Compression and Tension Test Results

Prior to direct shear testing and as part of the overall characterization program, uniaxial compression and direct tension testing were performed on parent concrete specimens 15.2 cm in diameter. Eight of the specimens were tested for compression in accordance with ASTM C39 [1], and seven were tested for direct tension in accordance with USBR 4914 [3]. The modulus of elasticity and Poisson’s ratio were determined for compressive strength specimens, in accordance with ASTM C469 [2], using surface-mounted strain gages to measure lateral and axial deformation.
The specimens tested for compressive strength were sulfur-capped prior to testing. The average compression strength was 31.2 MPa, which was 44 percent higher than the reported design’s compressive strength value of 13.8 MPa. The average modulus of elasticity was 24 GPa and the average Poisson’s ratio was 0.19. The average direct tensile strength was 1.3 MPa, which was about 4 percent of the average compressive strength. This is consistent with historical values for aging concrete [8]. The average modulus of elasticity in tension was 18 GPa.
As the samples tested for compressive and tensile strength were all parent concrete, and the samples tested for direct shear were all lift lines of variable quality, it is not possible to draw a correlation between the compressive and tensile strengths and the direct shear test results. The compression and tensile test results are included to illustrate a typical testing suite and provide context.

4. Direct Shear Testing Equipment

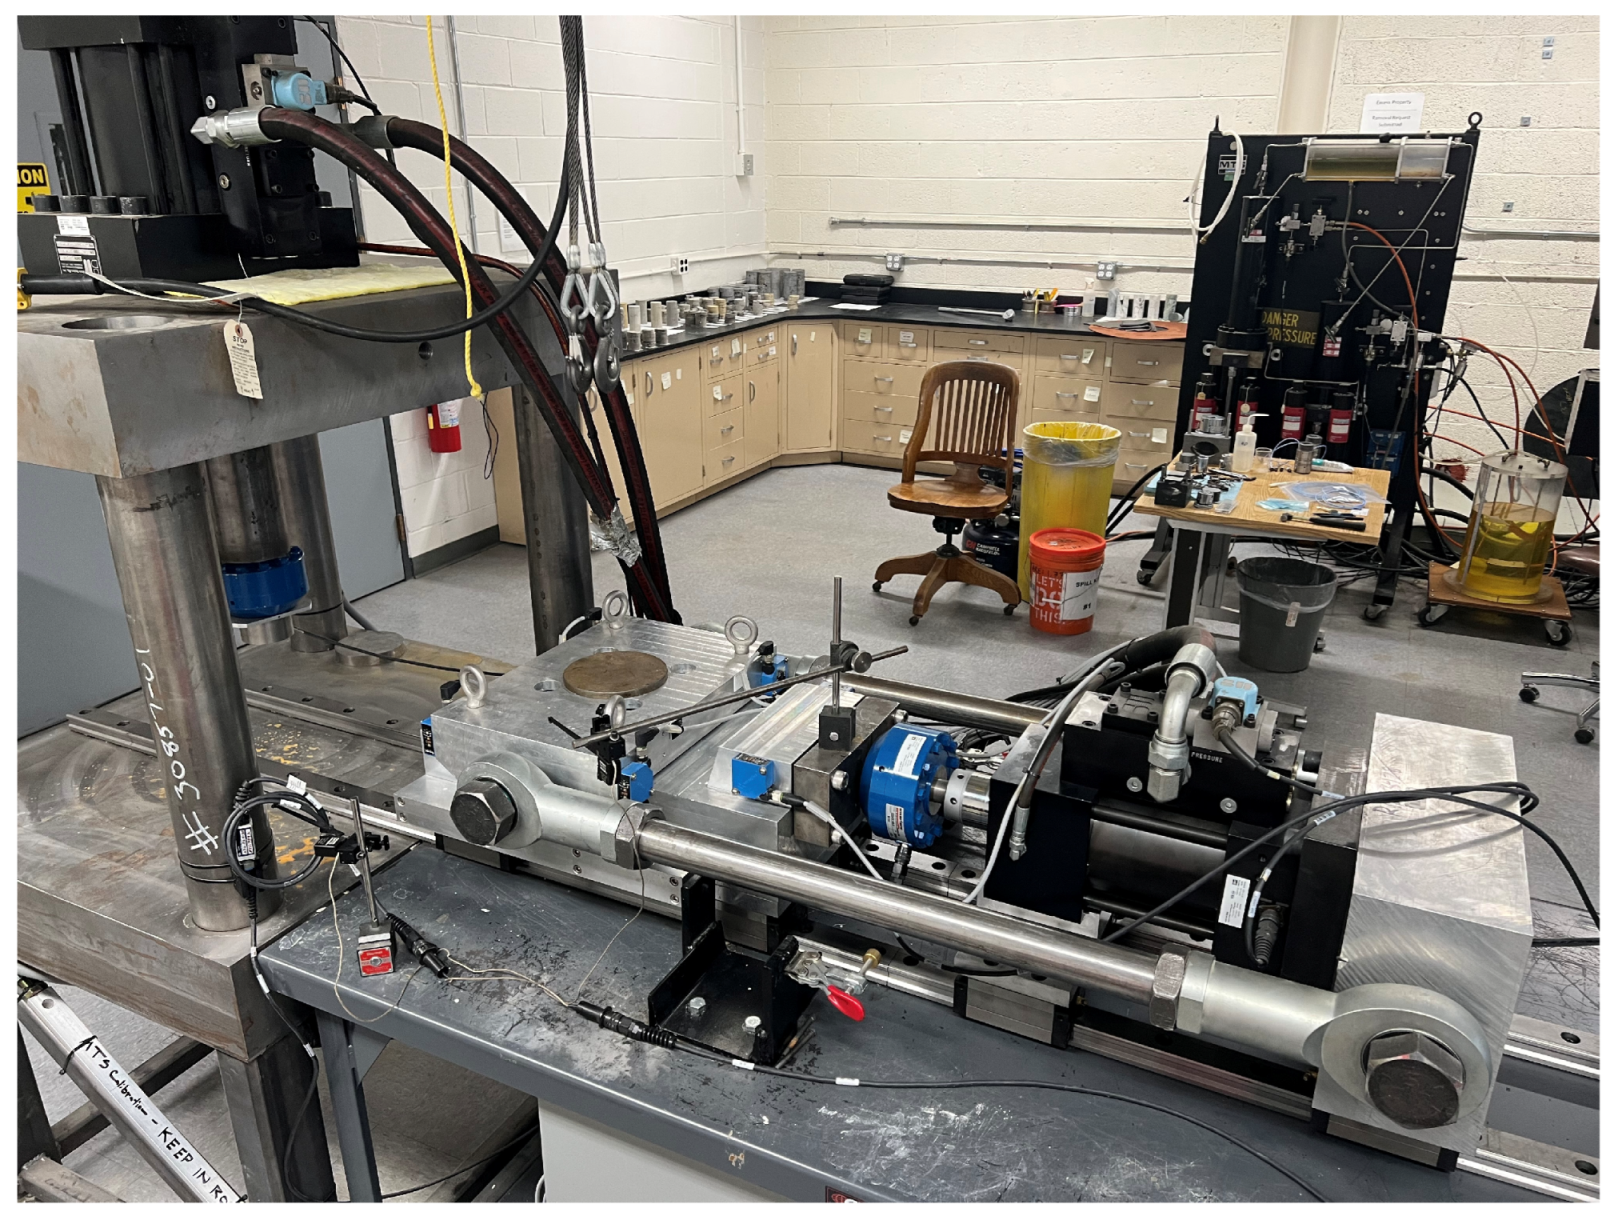
Reclamation’s Denver laboratory has two concrete direct shear machines, both designed and constructed in-house. The large direct shear machine, seen in Figure 3, was constructed in the 1970s and uses a series of manually controlled needle valves to control air and hydraulic pressure in the normal actuator, and hydraulic pressure in the shear actuator. The operator controls are located on the right in Figure 3, with the computer acquiring data just outside of the picture on the right. The shear actuator is on the left of picture and is oriented into the plane of the picture. The normal actuator, located at the back of the machine, is rotated vertically to allow for placement of the specimen.
The system is capable of applying a maximum normal force of +667 kN (compression considered positive) and a maximum shear load of +1557 kN on specimens up to 30.5 cm in diameter. The minimum normal load based on the top cap weight is 9.3 kN. The normal load is applied by means of a spherical platen located at the center of the specimen top, with the normal displacement measured using four linear variable differential transformers (LVDTs) with a range of +/−5.08 cm, located at the corners of the specimen top cap. Shear load is measured by a load cell in series with the hydraulic actuator, with shear displacement measured by two LVDTs with a range of +/−5.08 cm.
Needle valves are manually opened and closed to control the air and hydraulic pressures, with the applied forces measured by load cells and displayed in an Excel macro. As the normal and shear forces are applied by varying the amount of system air or hydraulic pressure, the dilation or contraction of the specimen or changes in the interlocking area can result in changes in the applied forces under the same system pressure, resulting in some variation in the normal force and shear displacement rate during testing. During testing, the targeted normal load is applied at the start of the shear phase, but often varies during shearing due to specimen dilation or contraction; no attempt is made to adjust the normal load during the shear portion of the testing. The shear displacement rate is also affected by the needle-valve manual control system, with the user unable to perform any fine controlling of the rate during testing.
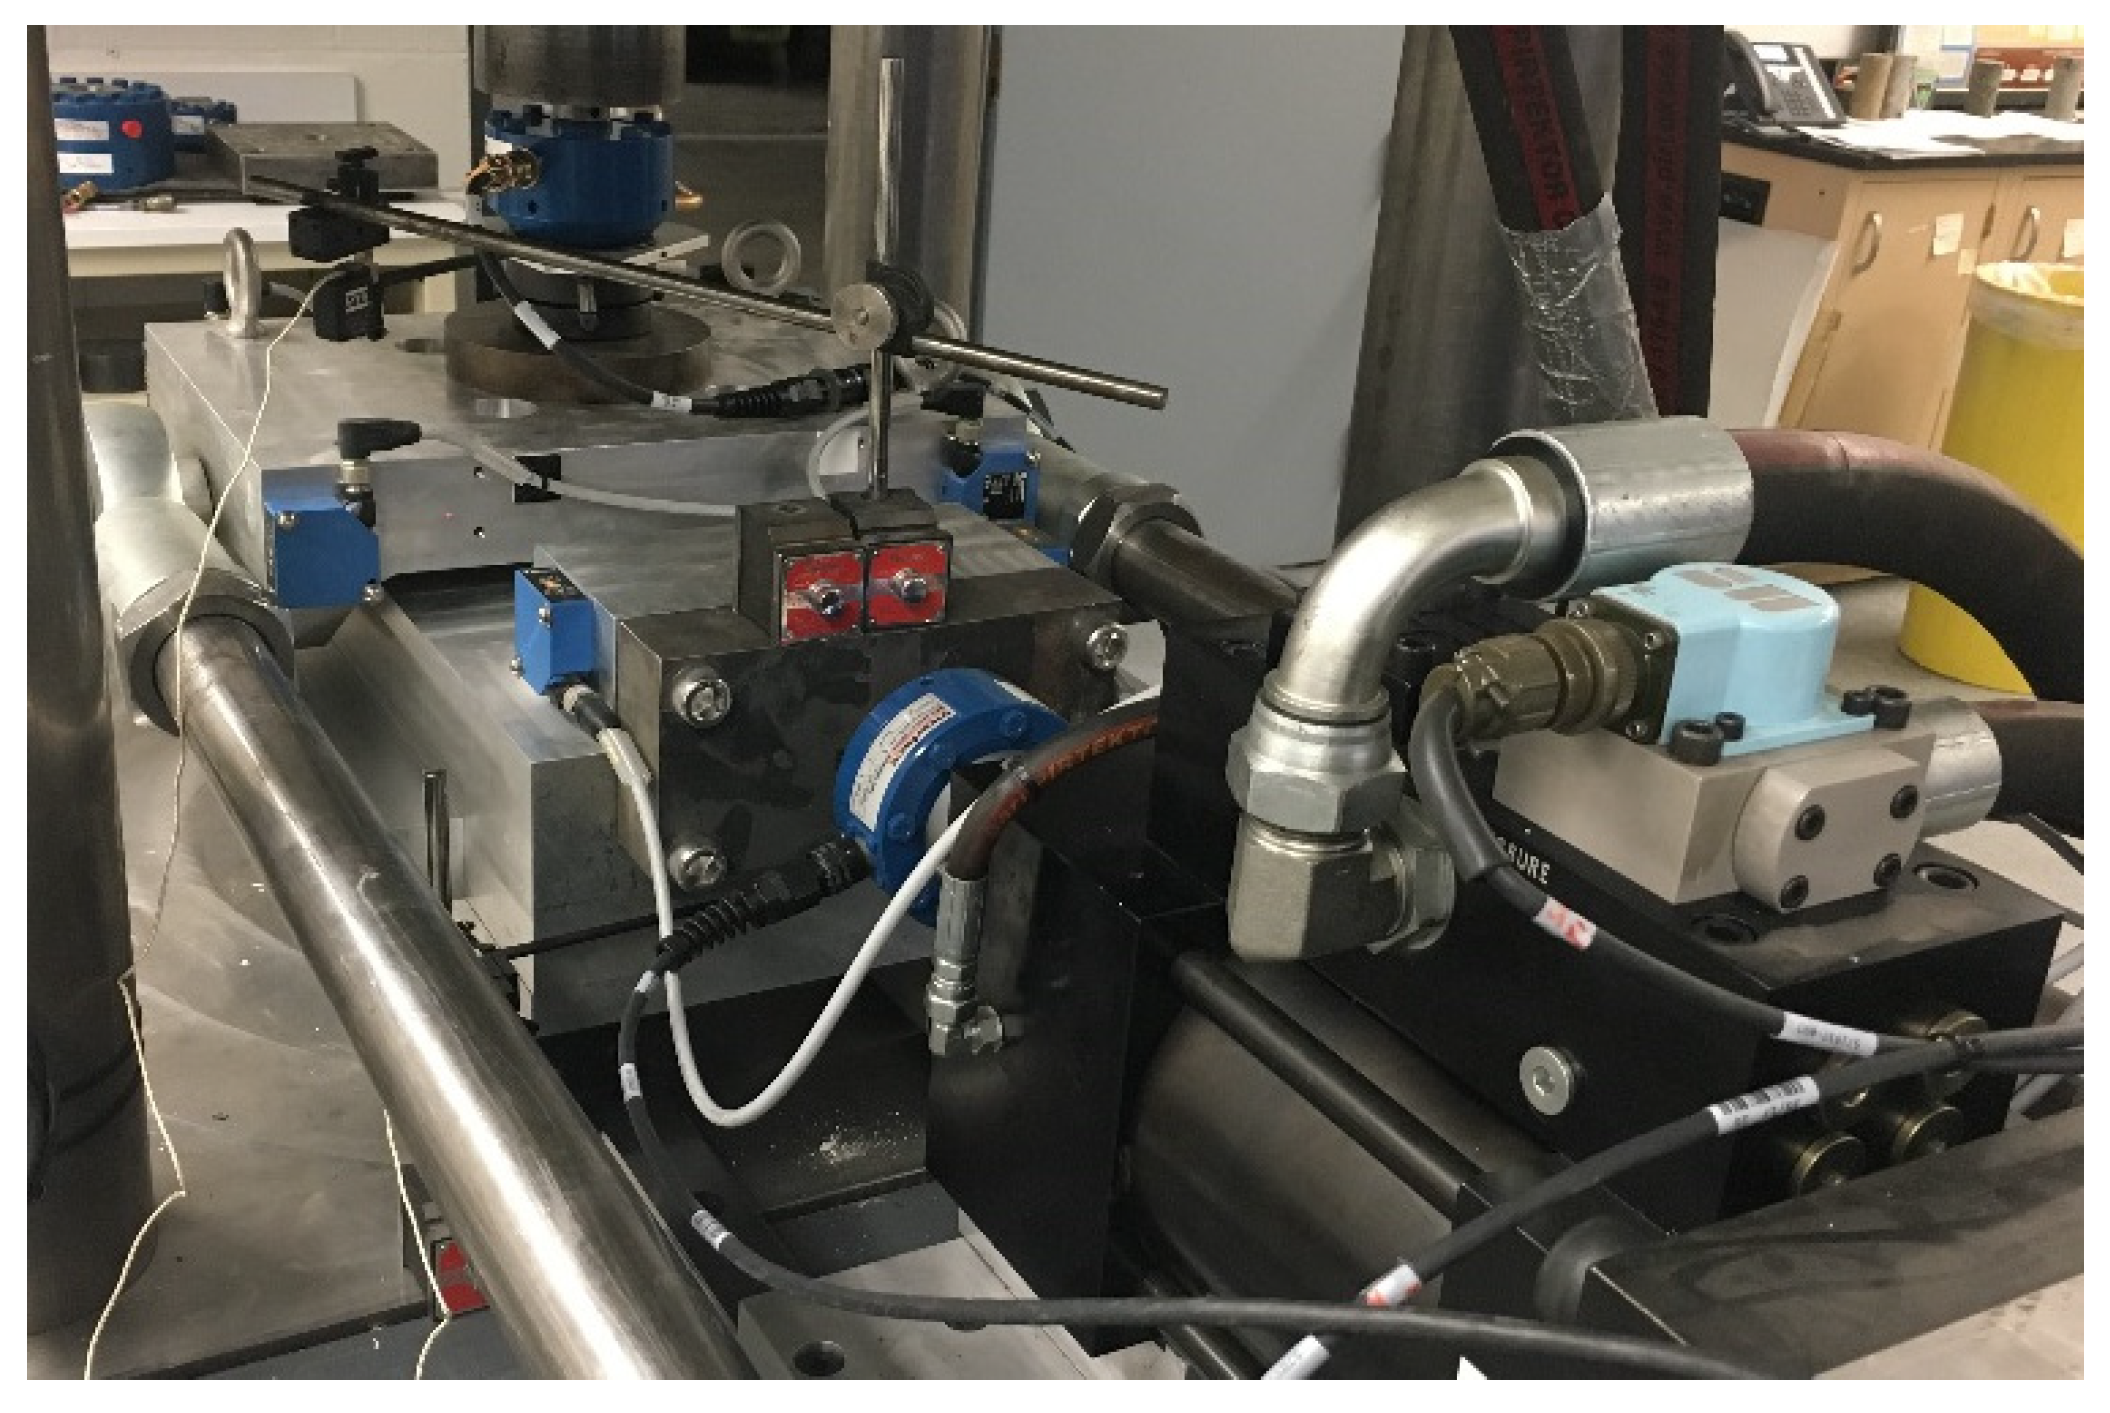
Reclamation’s small direct shear machine was constructed in the late 2010s and can apply a maximum normal force of +444 kN and maximum shear loads of +222 kN and −148 kN on specimens up to 15.2 cm in diameter. The minimum normal load based on the top cap weight is 0.56 kN. The normal load is applied, by means of a spherical platen, to the center of the specimen top; the normal displacement is measured by laser displacement devices at each corner of the top cap, and at the spherical platen by means of a contact displacement gage with a range of +/−12.5 mm. Shear displacement is measured by two laser displacement devices and another contact displacement gage with a range of +/−12.5 mm. Figure 4 and Figure 5 show the test machine constructed by Reclamation.
Figure 5 shows the MTS displacement gages, and normal and shear load cells, for the small direct shear machine. Note that the top of the box remains stationary while the bottom is “pushed” away from the camera; the large direct shear machine has a similar mechanism, with the top fixed in place while the bottom is “pushed”. The top cap of the small system measures about 30.5 cm by 43.2 cm, with the normal load applied to the center of the top cap by a spherical head measuring 7.5 cm diameter.
The specimen rings are 38.1 cm in diameter and 11.4 cm tall for the large direct shear machine, and 21.6 cm in diameter and 5.1 cm tall for the small direct shear machine. The rings are specially manufactured from aluminum or stainless steel. The specimen gap through which shearing is forced varies for the large machine depending on the waviness of the lift line, but is typically about 2 cm; the gap is 0.3 cm for the small direct shear machine. Specimens are loaded using a gantry crane system for the large machine due to the large self-weight; the system operator can load the direct shear specimens manually for the small direct shear machine.
MTS TestSuite software [23] was used to control the servo-hydraulic equipment during the test, with the equipment capable of testing a variety of user-defined boundary conditions; additional details about the equipment and control capabilities can be found in [17]. The equipment is capable of near real-time control of the applied loads and shear displacement rate, enabling a level of control typical for state-of-the-art testing equipment. MATLAB [24] routines were used to post-process the data and present the final results.

Constant Normal Load Boundary Condition

During the direct shear testing of concrete, the specimen typically dilates as the paste and aggregate interact, while the gross contact area (initial planar contact area between two sides) decreases as a function of shear displacement. This gross change in area can be roughly calculated using a function based on specimen geometry and shear displacement, as detailed in [25]. While this type of calculation may be applicable to smooth surfaces, the change in area calculations do not consider the influence of asperity interaction, with the actual interlocking area during shearing likely to be significantly smaller than the gross area. The testing performed in this research targeted the initial normal stress and, using the gross interlocking area when the specimen was cast, used a CNL boundary condition during sliding. This use of a CNL boundary condition is typical for concrete or rock direct shear testing given the uncertainty in the actual contact area. For simplicity and ease of comparison between specimens, the initial stresses are provided throughout this paper.

5. Specimen Preparation

Once the lift lines were identified, the samples were cut down using a diamond-blade saw to create specimens with an approximately square shear surface (with the length about equal to the core width). The actual specimen dimensions varied, with each specimen cut to the largest possible size. A larger shear surface contains more defects and is less influenced by one or two large aggregate particles, which should provide more conservative strength parameters with less uncertainty. All of the testing was performed using target stresses based on the initial interlocking area, as detailed previously, so the variation in the specimen size is taken into consideration.
A total of twelve specimens were cut from the 25.4 cm diameter core, and eleven specimens were cut from the 10.2 cm diameter core. The samples were further trimmed using the diamond-blade saw in preparation for securing the specimen rings. For the 25.4 cm diameter samples, the cutting resulted in cylindrical specimens with approximately 8 to 10 cm of concrete on either side of the lift lines. For the 10.2 cm diameter samples, the cutting resulted in cylindrical specimens with approximately 5 to 8 cm of concrete on either side of the lift lines. Figure 6 shows two specimens that are fully cast in rings for the small direct shear machine.
Once trimmed, the concrete cores were cast in the holding rings using gypsum cement. The result was that each specimen had the lift line isolated in the 2 cm or 0.3 cm gap between the holding rings. All of the specimens were cast and tested in an air-dried state.

6. Testing Methods

Specimens with an intact lift line were tested for break bond and sliding shear strength, while debonded specimens were tested for sliding shear strength only. All specimens were tested at a constant shear displacement rate of 0.02 cm per minute in accordance with ASTM D5607 [17]. Total shearing displacement was limited such that there was no specimen impingement on the rings or in the hydrostrone at large displacements. Each specimen could only provide one instance of break bond shear strength, so data from multiple specimens must be combined to develop break bond Mohr–Coulomb parameters.

6.1. “Matrix” Procedure

The “Matrix” procedure involves performing multistage direct shear tests where the normal stress schedule varies by specimen, such that the influence of accumulated damage can be quantified. Normal stresses may be ascending, descending, or variable, as shown in Table 1. In this way, a specimen is tested at each normal load of interest with varying amounts of accumulated degradation and, when all similar specimens are grouped, additional insight are given into the shear strength degradation with sliding displacement. Additionally, this approach allows for large enough shear displacement for each slide such that a “residual” strength is approached. The obtained “residual” strength may not represent the large strain residual strength; the residual strengths presented herein were obtained at about 2% shear strain in each successive slide.
The testing procedure was as follows:
  • Apply specified normal load to intact specimen, monitor normal displacement.
  • Once normal displacement has stabilized, start shear displacement, and monitor shear load. Stop stage immediately after intact specimen fails.
  • Reduce normal load to minimum based on top cap weight.
  • Hold normal load, reduce shear load by moving specimen in a negative displacement direction until load has diminished significantly.
  • Hold shear displacement, apply Slide 1 normal load using normal actuator, and monitor normal displacement.
  • Once normal displacement has stabilized, start shear displacement, and monitor shear load. Stop stage after about 2% shear strain.
  • Reduce normal load to minimum based on top cap weight.
  • Hold normal load, reduce shear load by moving specimen in a negative displacement direction until load has diminished significantly.
  • Hold shear displacement constant, apply Slide 2 normal load using normal actuator, and monitor normal displacement.
  • Once normal displacement has stabilized, start shear displacement, and monitor shear load. Stop stage after 2% shear strain.
  • Repeat procedure for Slide 3.
  • Remove specimen and take photographs.
The matrix normal stress schedule for the six 25.4 cm diameter specimens tested is provided in Table 1, and the matrix normal stress schedule for the six 10.2 cm diameter specimens is provided in Table 2. The smallest normal stress was defined as the minimum stress possible for the testing apparatus at each core diameter, with the normal stress doubled for each successive stage to cover a large range of stresses, with an emphasis on lower stress behavior. The specimen designation number refers to the first sliding normal stress applied in pounds-force per square-inch, while the letter corresponds to a generally ascending or descending normal stress order.
Table 1. General “Matrix” direct shear test normal stress schedule for 25.4 cm diameter specimens.
Specimen DesignationBreak Bond (kPa)Slide 1 (kPa)Slide 2 (kPa)Slide 3 (kPa)
55A3793797581516
110A7587581516379
220A15161516379758
55B3791516758379
110B7583791516758
220B15167583791516

6.2. “D5607” Procedure

The “D5607” procedure is the typical ASTM D5607-16 test method, where increasing normal stresses are applied at each subsequent stage of a multistage direct shear test [17]. This type of procedure is standard for multistage direct shear testing on concrete or rock.
The “D5607” direct shear procedure was as follows:
  • Apply specified normal load to intact specimen, monitor normal displacement.
  • Once normal displacement has stabilized, start shear displacement, and monitor shear load. Stop stage immediately after specimen is broken.
  • Reduce normal load to minimum based on top cap weight.
  • Hold normal load, reduce shear load by moving specimen in a negative displacement direction until load has diminished significantly.
  • Hold shear displacement, apply Slide 1 normal load with normal actuator, and monitor normal displacement.
  • Once normal displacement has stabilized, start shear displacement, and monitor shear load. Stop stage shortly after reaching well-defined peak shear strength.
  • Reduce normal load to minimum based on top cap weight.
  • Hold normal load, reduce shear load by moving specimen in a negative displacement direction until load has diminished significantly.
  • Hold shear displacement, apply Slide 2 normal load with normal actuator, and monitor normal displacement.
  • Once normal displacement has stabilized, start shear displacement, and monitor shear load. Stop stage shortly after reaching well-defined peak shear strength.
  • Repeat procedure for Slide 3.
  • Remove specimen and take photographs.
The D5607 normal load schedules for six 25.4 cm diameter specimens and five 10.2 cm diameter specimens are provided in Table 3 and Table 4, respectively. Nomenclature for the type of test was assigned to ensure that the range of normal stresses were captured, in order to create a break bond failure envelope. Break bond envelopes were developed by combining data from multiple specimens, as each specimen only yielded one data point.
The target multistage normal stresses for the 25.4 cm diameter specimens were 379, 758, and 1516 kPa. Given the variable area of the 25.4 cm diameter specimens and the lack of servo-hydraulic control of the large direct shear machine, these exact normal load values were not always attainable. The target multistage normal stresses for the 10.2 cm diameter specimens were 103, 207, and 414 kPa.

7. Data Analysis Methods

The break bond testing procedures do not vary between the matrix and D5607 methods. Data are typically grouped by pertinent parameter, and in this case, the data were grouped by core diameter, as the concrete was all of the same age and of similar quality.
Peak shear stress values from a series of sliding friction stages on each specimen were used to define the sliding friction properties. The state-of-practice in the evaluation of rock shear strength data indicated that the strengths should be considered as “cohesion then friction” versus “cohesion and friction”; cohesion is overcome at very small strains, where the larger strain shear strength is primarily controlled by friction [26]. It is not clear if this holds true for concrete, as the apparent cohesion could be the result of specimen breakage through the paste or at the aggregate–paste boundary. The results reported for this research provide only linear failure envelopes fitted through the test data, as the nomenclature is more typical in engineering practice and more readily understood by the practitioner. Non-linear envelopes typically better fit the data set, but can be more difficult to implement in a structural analysis and are less intuitive to contextualize.
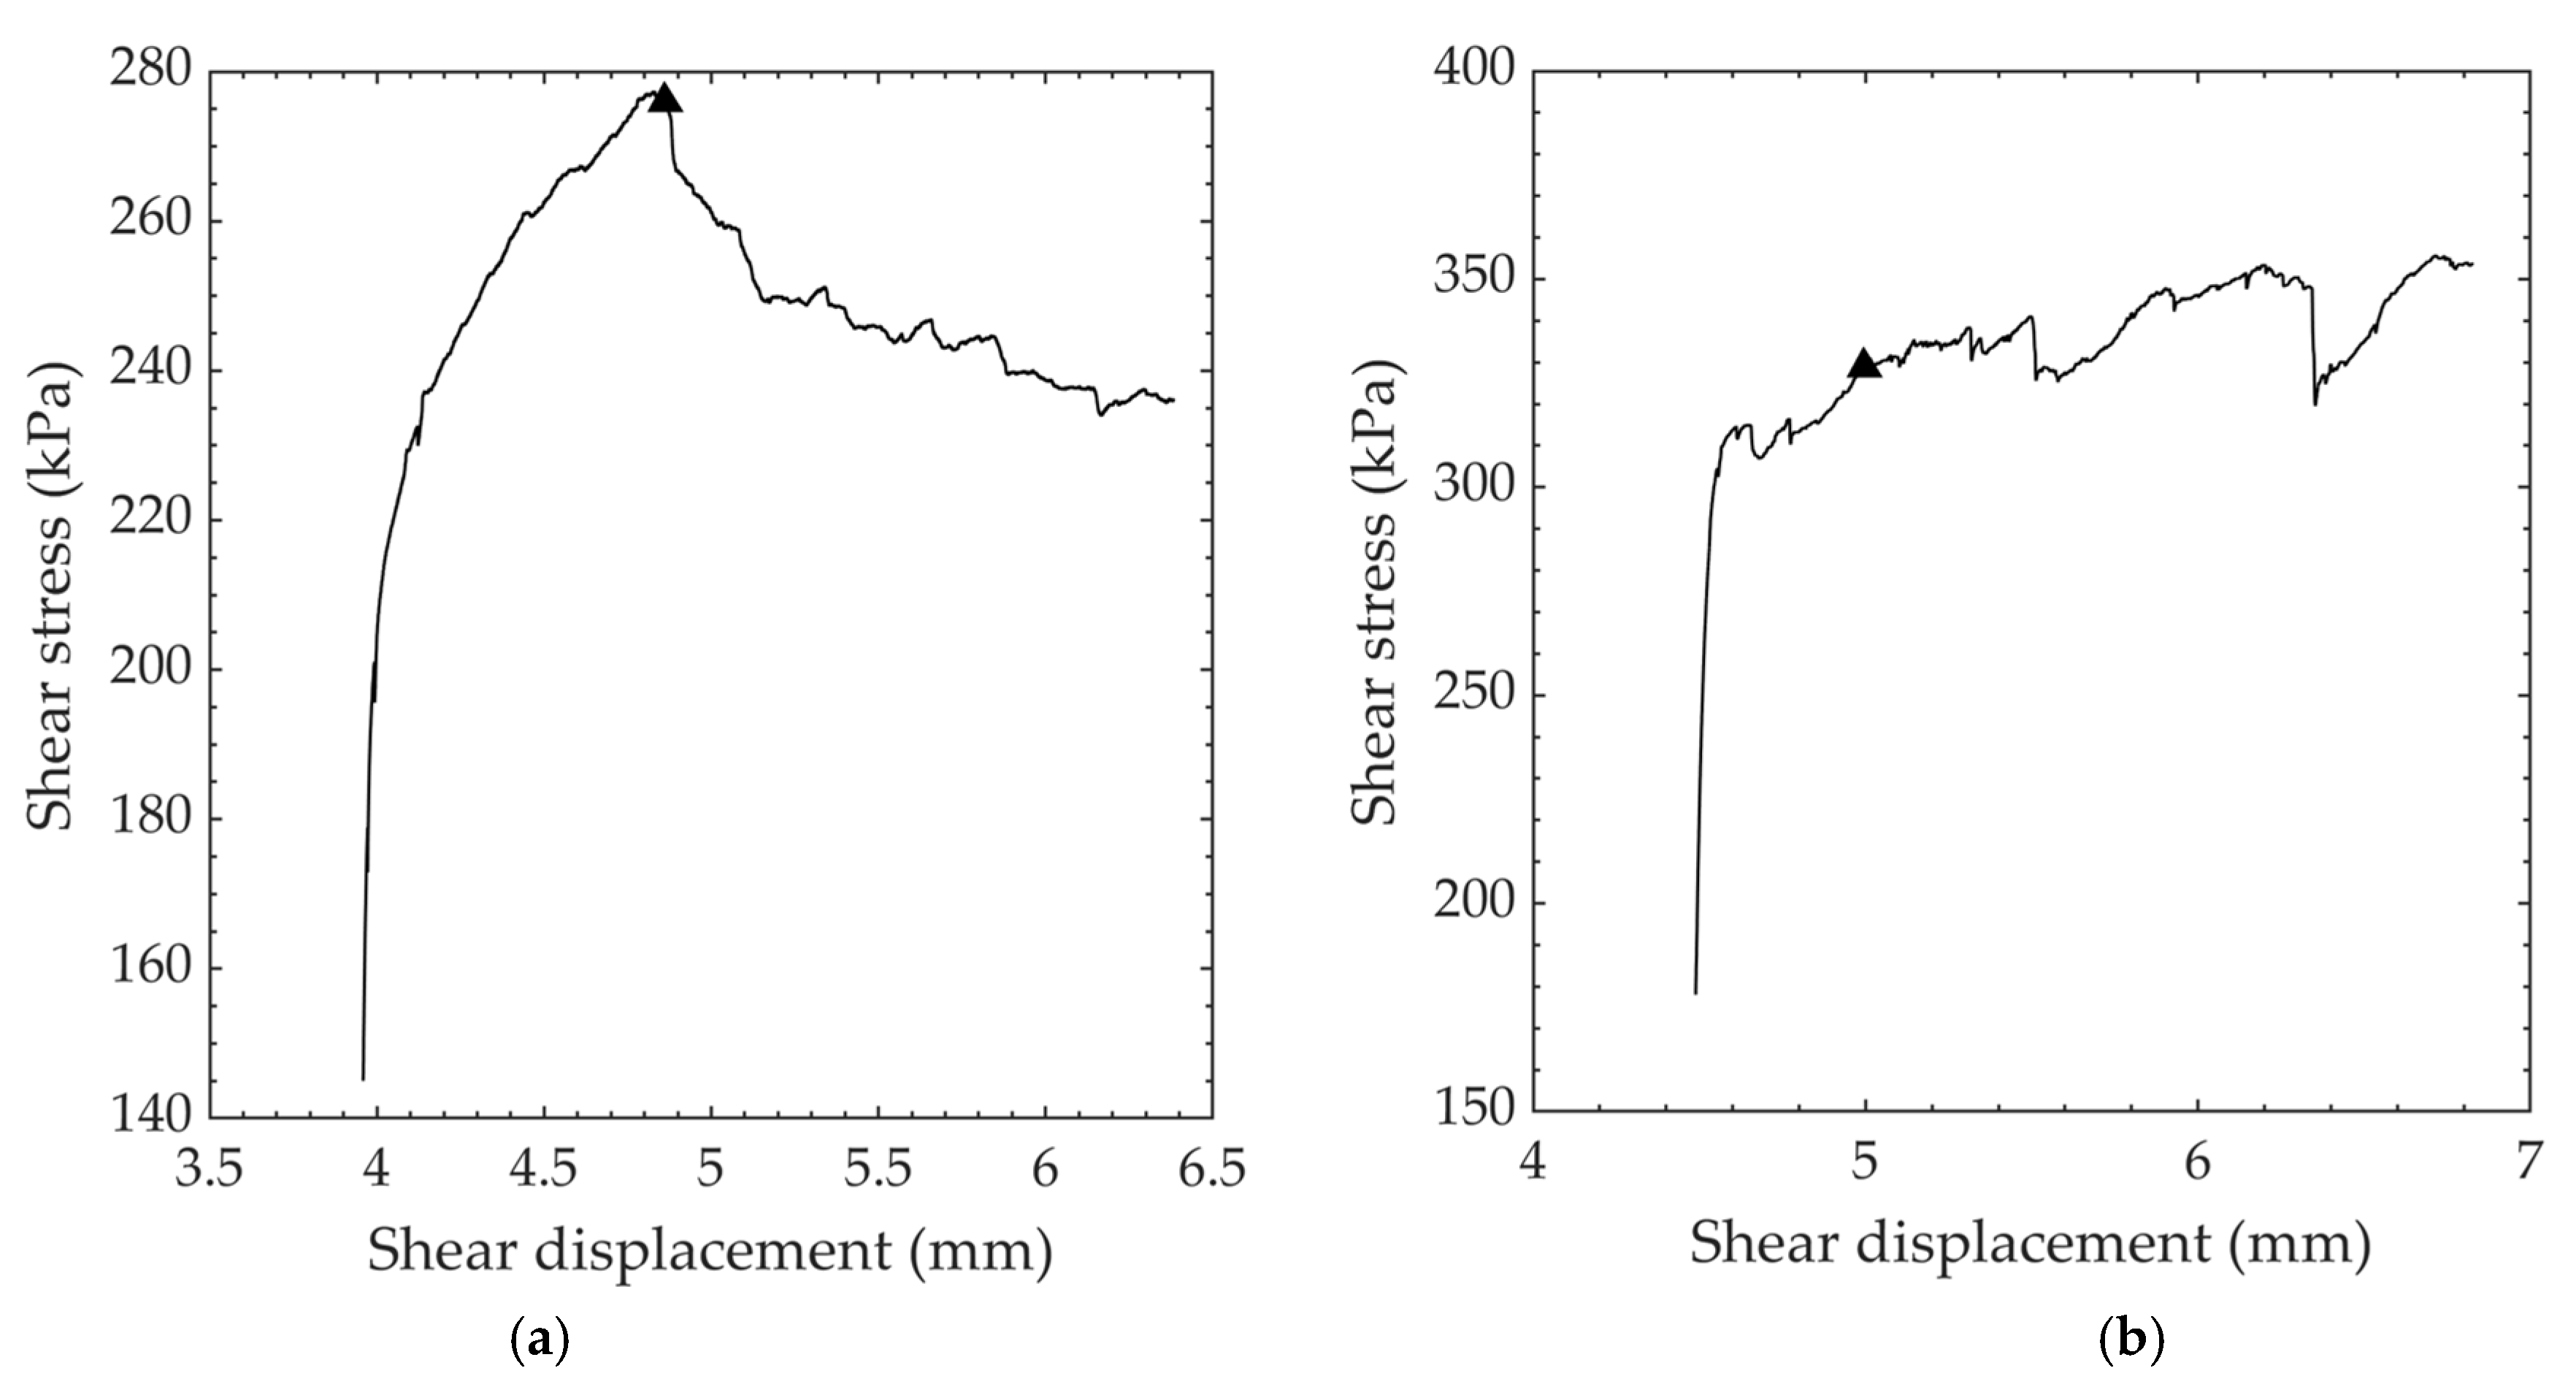
Sliding friction parameters were obtained using the Mohr–Coulomb failure criterion, with peak or residual shear strength selected by the laboratory engineer. Peak shear strength was selected either at a clearly defined peak shear stress, or at a point where the shear stress versus shear displacement curve exhibited a significant reduction in shear stiffness, as shown in Figure 7.
Concrete direct shear specimens can often exhibit a strain-hardening effect due to aggregate interaction, resulting in a gradual increase in shear strength with increasing shear displacement; this behavior is not considered to be representative of first-order asperity-governed field-scale behavior. In cases where the specimens exhibited this strain-hardening effect, the peak shear strength was selected as the point where there was a significant reduction in shear stiffness (Figure 7). Residual shear strength (where performed) was selected as the shear stress at the end of displacement for each stage (about 2% strain).
Many specimens had an inclined break due to the inherent moment generated during shearing, with the “tall” side of the inclined break surfaces moving away from each other during shearing. The inclined break generally did not have a consistent slope along the shear surface, with the ends of the specimen being significantly steeper than its relatively horizontal center. It is not clear how this should be addressed in data post-processing, but one possible solution is to resolve the forces to the actual inclined shear surface; however, the variation in the angle of this surface complicates the resolution of the forces. No attempt was made to correct for the inclined break as part of this analysis, as the surface variation and slope were not uniform.
The apparent slope of the displacement (dilatancy) angle was obtained graphically by evaluating the slope of the normal displacements during each shearing phase. Note that the dilatancy angle is not the same as the inclined break angle, as dilatancy is a function of aggregate–paste interaction along the shear surface. No attempt was made to correct these data back to the basic friction angle using dilatancy during shearing [26]. All data presented are as recorded during testing.

8. Results and Discussion

The post-test specimens exhibited varying amounts of breakage and shear-induced aggregate disaggregation. Figure 8 shows the bottom half of a typical 25.4 cm specimen after testing.
The total specimen displacement for the “Matrix” procedure was typically about 2.3–2.8 cm for the 25.4 cm diameter specimens, and about 1.3 cm for the 10.2 cm diameter specimens. The “D5607” total displacement was typically less than that of the “Matrix” procedure. The extraction of only the peak and residual stresses provides a data set that is more easily implemented in finite element modeling than considering the entire data series at small displacements.

8.1. Break Bond

Seven 25.4 cm and six 10.2 cm specimens were identified as intact and tested for break bond shear strength. The break bond data are summarized in Table 5, while the data are presented graphically in Figure 9. Note that φbb is the break bond Mohr–Coulomb friction angle in degrees, and c is the break bond cohesion in kPa.
The break bond shear strength was slightly higher for the 25.4 cm diameter specimens than the 10.2 cm specimens. The Mohr–Coulomb linear failure envelope for the 10.2 cm specimens did not fit the data well, as evidenced by the poor R2 fit. The shear strength of the bonded lift lines was inconsistent between the tested specimens, likely due to the variable quality of the obtained lift lines. Larger specimens were likely less influenced by minor irregularities in the shear surface and typically provided more consistent results between specimens; the data presented here appear to support this hypothesis, but the “ideal” size is not clear from this limited data set.
The break bond shear strength data obtained during this experiment was in general agreement with data presented in Lindenbach [12] for a similar range of normal stresses. The scatter in the data, as exemplified by the wide 90% confidence interval bands, is typical for break bond testing, as shown in [12].

8.2. Sliding Friction

The term “apparent cohesion” (ca) is used in the following sections to denote the y-intercept of the linear Mohr–Coulomb failure envelope for the sliding friction tests. As the broken specimens have no true cohesion (tensile strength at zero normal stress), and the ca is likely a function of paste–aggregate breakage along the shear surface, specimen interlock, and linearization of a non-linear failure envelope.
Non-linear failure envelopes, such as those utilizing a power-function, tend to provide a better fit with direct shear data, but the curve fit parameters are less tangible for the practitioner. This paper linearizes the envelopes to aid in the test method comparison, but the authors recommend utilizing a non-linear envelope in the modeling if that is a better fit for the data set. One particular complication of concrete direct shear testing is that the shear surface of interest is typically not discrete, with breakage occurring in a fracture process zone. In this zone, it is likely that there are tensile, shear, and mixed-mode failures occurring simultaneously. Extrapolation to higher or lower normal stresses than those tested must be performed with caution, whether a linear or non-linear envelope is used. Zanotti and Randl [27] provide a comparison between a linear Mohr–Coulomb envelope and a non-linear envelope when comparing concrete repair tests; the non-linear approach suggests higher cohesion and a lower friction angle compared to the linear approach.

8.2.1. “Matrix” Data

Test results from the “Matrix” testing procedure for all specimens tested are summarized in Table 6, and the data are presented graphically in Figure 10 and Figure 11, with upper- and lower-bound 90% confidence intervals included for the Slide 1 and Slide 3 data, respectively. Note that the slide number is essentially a proxy for shear displacement. The confidence intervals in Figure 10 and Figure 11 demonstrate that the sliding direct shear data are reasonably well constrained.
The peak φ decreased between each successive slide, indicating that the shear surface experienced degradation and cumulative damage with shear displacement. Peak sliding φ was greater than residual sliding φ for the same slide number, with the peak versus residual ca following the same pattern. The peak and residual φ appear to approach the same value of about 44 degrees after Slide 3.
Table 7 and Table 8 summarize the “Matrix” testing procedure results when grouped by core diameter.
When grouped by core diameter, the 25.4 cm and 10.2 cm specimens tended to follow the trend of decreasing φ and ca with increasing shear displacement (increasing slide number). The 25.4 cm diameter core specimens tended to have a higher ca and lower φ than the 10.2 cm diameter specimens for the same slide number (approximately the same shear strain). Given this relationship between mobilized φ and ca, this could indicate that the mobilized shear strength of the larger specimens under higher loads relies less on the surficial sliding friction angle and more on the particle breakage along and near the sliding surface.
The failure envelopes for a particular specimen appear “steeper” with a higher initial normal load, and “flatter” with a lower initial normal load, particularly when the difference between normal loads is large. This is likely due to the higher initial normal load resulting at a higher shear strength than the shear strength for the same normal load when performed at the end of the test runs, due to accumulated damage. The result of this behavior would be steepening of the failure envelope (high normal stress point pulled “up”), resulting in higher φ and lower ca for tests where the higher normal loads are performed early in the sequence. Conversely, when the lowest normal loads are tested first, the fit becomes less steep, resulting in lower φ and higher ca. These same phenomena were noted in [14].

8.2.2. “D5607” Test Data

Test results from the “D5607” procedure are summarized in Table 9.
The sliding shear strength parameters for the larger specimens had a lower shear strength but greater cohesion than the lower bound presented in [12], while the shear strength parameters for the smaller specimens were between the best fit and upper bound. In general, the All “D5607” shear strength parameters indicate that the Thief Valley concrete tested was weaker than the best fit shear strength parameters, but stronger than the lower bound found in [12]. All data obtained in this testing program were within the envelopes proposed by [12]. The Table 9 data are presented graphically in Figure 12 and Figure 13. The confidence intervals in Figure 12 and Figure 13 demonstrate that the data are reasonably well constrained.
The sliding φ for the 10.2 cm diameter specimens was significantly higher than for the 25.4 cm diameter specimens, with ca being greater for the 25.4 cm diameter specimens. When all the data are combined, φ and ca from the best fit line of the combined data fall between the results for the specimens of different sizes. The linear trend line for all the combined “D5607” data, presented in Figure 12, does not fit the data well, particularly at low normal stresses.
These data appear to fit significantly better with the bi-linear failure envelope in Figure 13.
Patton [11] found that the shear strength of non-smooth rock discontinuities can be approximated using a bi-linear Mohr–Coulomb failure envelope. For the initial steep portion, the shear stresses imparted are not large enough to shear the asperities, and the mobilized shear strength is thus dependent on the friction along the shear surface; therefore, ca = 0 and φpeak = φbasic + i, where φbasic is the friction angle of the smooth surface of that material, and i is the specimen dilation along the asperities during shearing. For the flatter portion of the envelope, shear stresses are large enough to shear through the existing asperities (due to the imparted normal stresses); therefore, ca > 0, and φmobilized = φresidual, where φresidualφbasic.
The “D5607” test data presented in Figure 13 appear to fit a bi-linear shape. Although the overall roughness of the 25.4 cm diameter specimens is approximately the same as that of the 10.2 cm diameter specimens, the roughness relative to the specimen area (relative asperity height) is greater for the smaller specimens. This concept is relevant when describing the contributions of first-order (field scale) and second-order (lab scale) asperities on the mobilized shear strength. Quantifying both scales is important, as the contributions from each are significant factors in applying lab data to anticipated field-scale performance. Additionally, the loading schedule for the smaller specimens has lower normal stresses than the loading schedule for the larger specimens; higher normal stresses result in dilatancy suppression [13], which could reduce the contribution of i to φ. Given that φbasic is constant for a material, it can be assumed that φ for the smaller specimens would be lower at higher normal stress.
Coupling the effects of the roughness:area ratio with the imparted normal stresses, the higher φ and lower ca found for the smaller specimens could be attributed to the concepts proposed by [11]. The higher φ for the smaller specimens could be due to greater dilatancy (i), as the specimens had a greater roughness:area ratio and were sheared at lower normal stresses (less i suppression and asperity shearing). At higher normal stresses and with a lower roughness:area ratio, the mobilized shear strength could approach a basic or residual φ condition, with ca being a function of asperity shearing along the interface.
With increasing scale from the laboratory to the field, the dilatancy will shift from second-order asperities (lab-scale roughness) to first-order asperities (field-scale waviness), which may result in lower or higher mobilized shear strength at larger scales, depending on the roughness of the field-scale lift lines. Given the relatively planar nature of lift lines at the field scale, the lab-scale roughness is likely greater than that of the field-scale, resulting in lower shear strength mobilized on the field-scale joints.

8.2.3. Comparison of “Matrix” versus “D5607”, and 25.4 cm versus 10.2 cm Test Data

The peak slide data from the “Matrix” and “D5607” procedures are presented in Figure 14 and summarized in Table 10.
The “Matrix” data presented for Slide 1 and Slide 2 appear to exhibit bi-linear envelopes when viewed by Slide (i.e., looking at Slide 1 data for the large and small specimens). This behavior is likely explained by the dilatancy and asperity shearing concepts presented earlier.
The “D5607” 25.4 cm test data had a flatter failure envelope (lowest φ and highest ca) than any of the slides in the “Matrix” 25.4 cm data. The higher normal stress portion of the “D5607” failure envelope does appear to intersect with the higher normal stress portion of Slide 2 and Slide 3 curves for the 25.4 cm data; this could suggest that the “D5607” 25.4 cm linear failure envelope was artificially “rotated” up at low normal stresses by anomalously high shear strengths at low normal stresses. As the lowest normal stress is always applied first in the “D5607” procedure, it is expected that the lowest normal stress points would result in the greatest relative shear strength due to limited accumulated damage on the shear surface.
The “D5607” 10.2 cm data exhibited a φ similar to that from Slide 2 of the “Matrix” data, but a higher ca than any of the “Matrix” linear failure envelopes. This could be caused by behavior similar to that of the 25.4 cm specimens, where the lowest normal stress is always applied first in the “D5607” procedure.

9. Conclusions

The testing program presented in this paper analyzed the results from direct shear tests on intact concrete lift lines to compare two direct shear testing procedures on two differently sized specimens. The results were found to vary significantly with respect to specimen size and protocol. The break bond shear strength and resulting sliding friction are often variable when the lift lines are not planar or nearly planar at the scale of the specimens tested. The presence of differently sized aggregates bordering or spanning lift lines further increases this uncertainty.
Based on the data presented in this study, the following conclusions can be drawn. Both the matrix-based and D5607 approaches have advantages and disadvantages, and the best-suited approach for any testing program should be determined on a case-by-case basis. The D5607 approach provides a standalone data set for each specimen, while the matrix-based approach provides data sets that must be considered in the context of other tested specimens to be valid. For testing programs with few and/or highly variable specimens, the D5607 approach is better suited than the matrix-based approach. It is important that engineers who use data developed from the D5607 approach fully understand the limitations of the data.
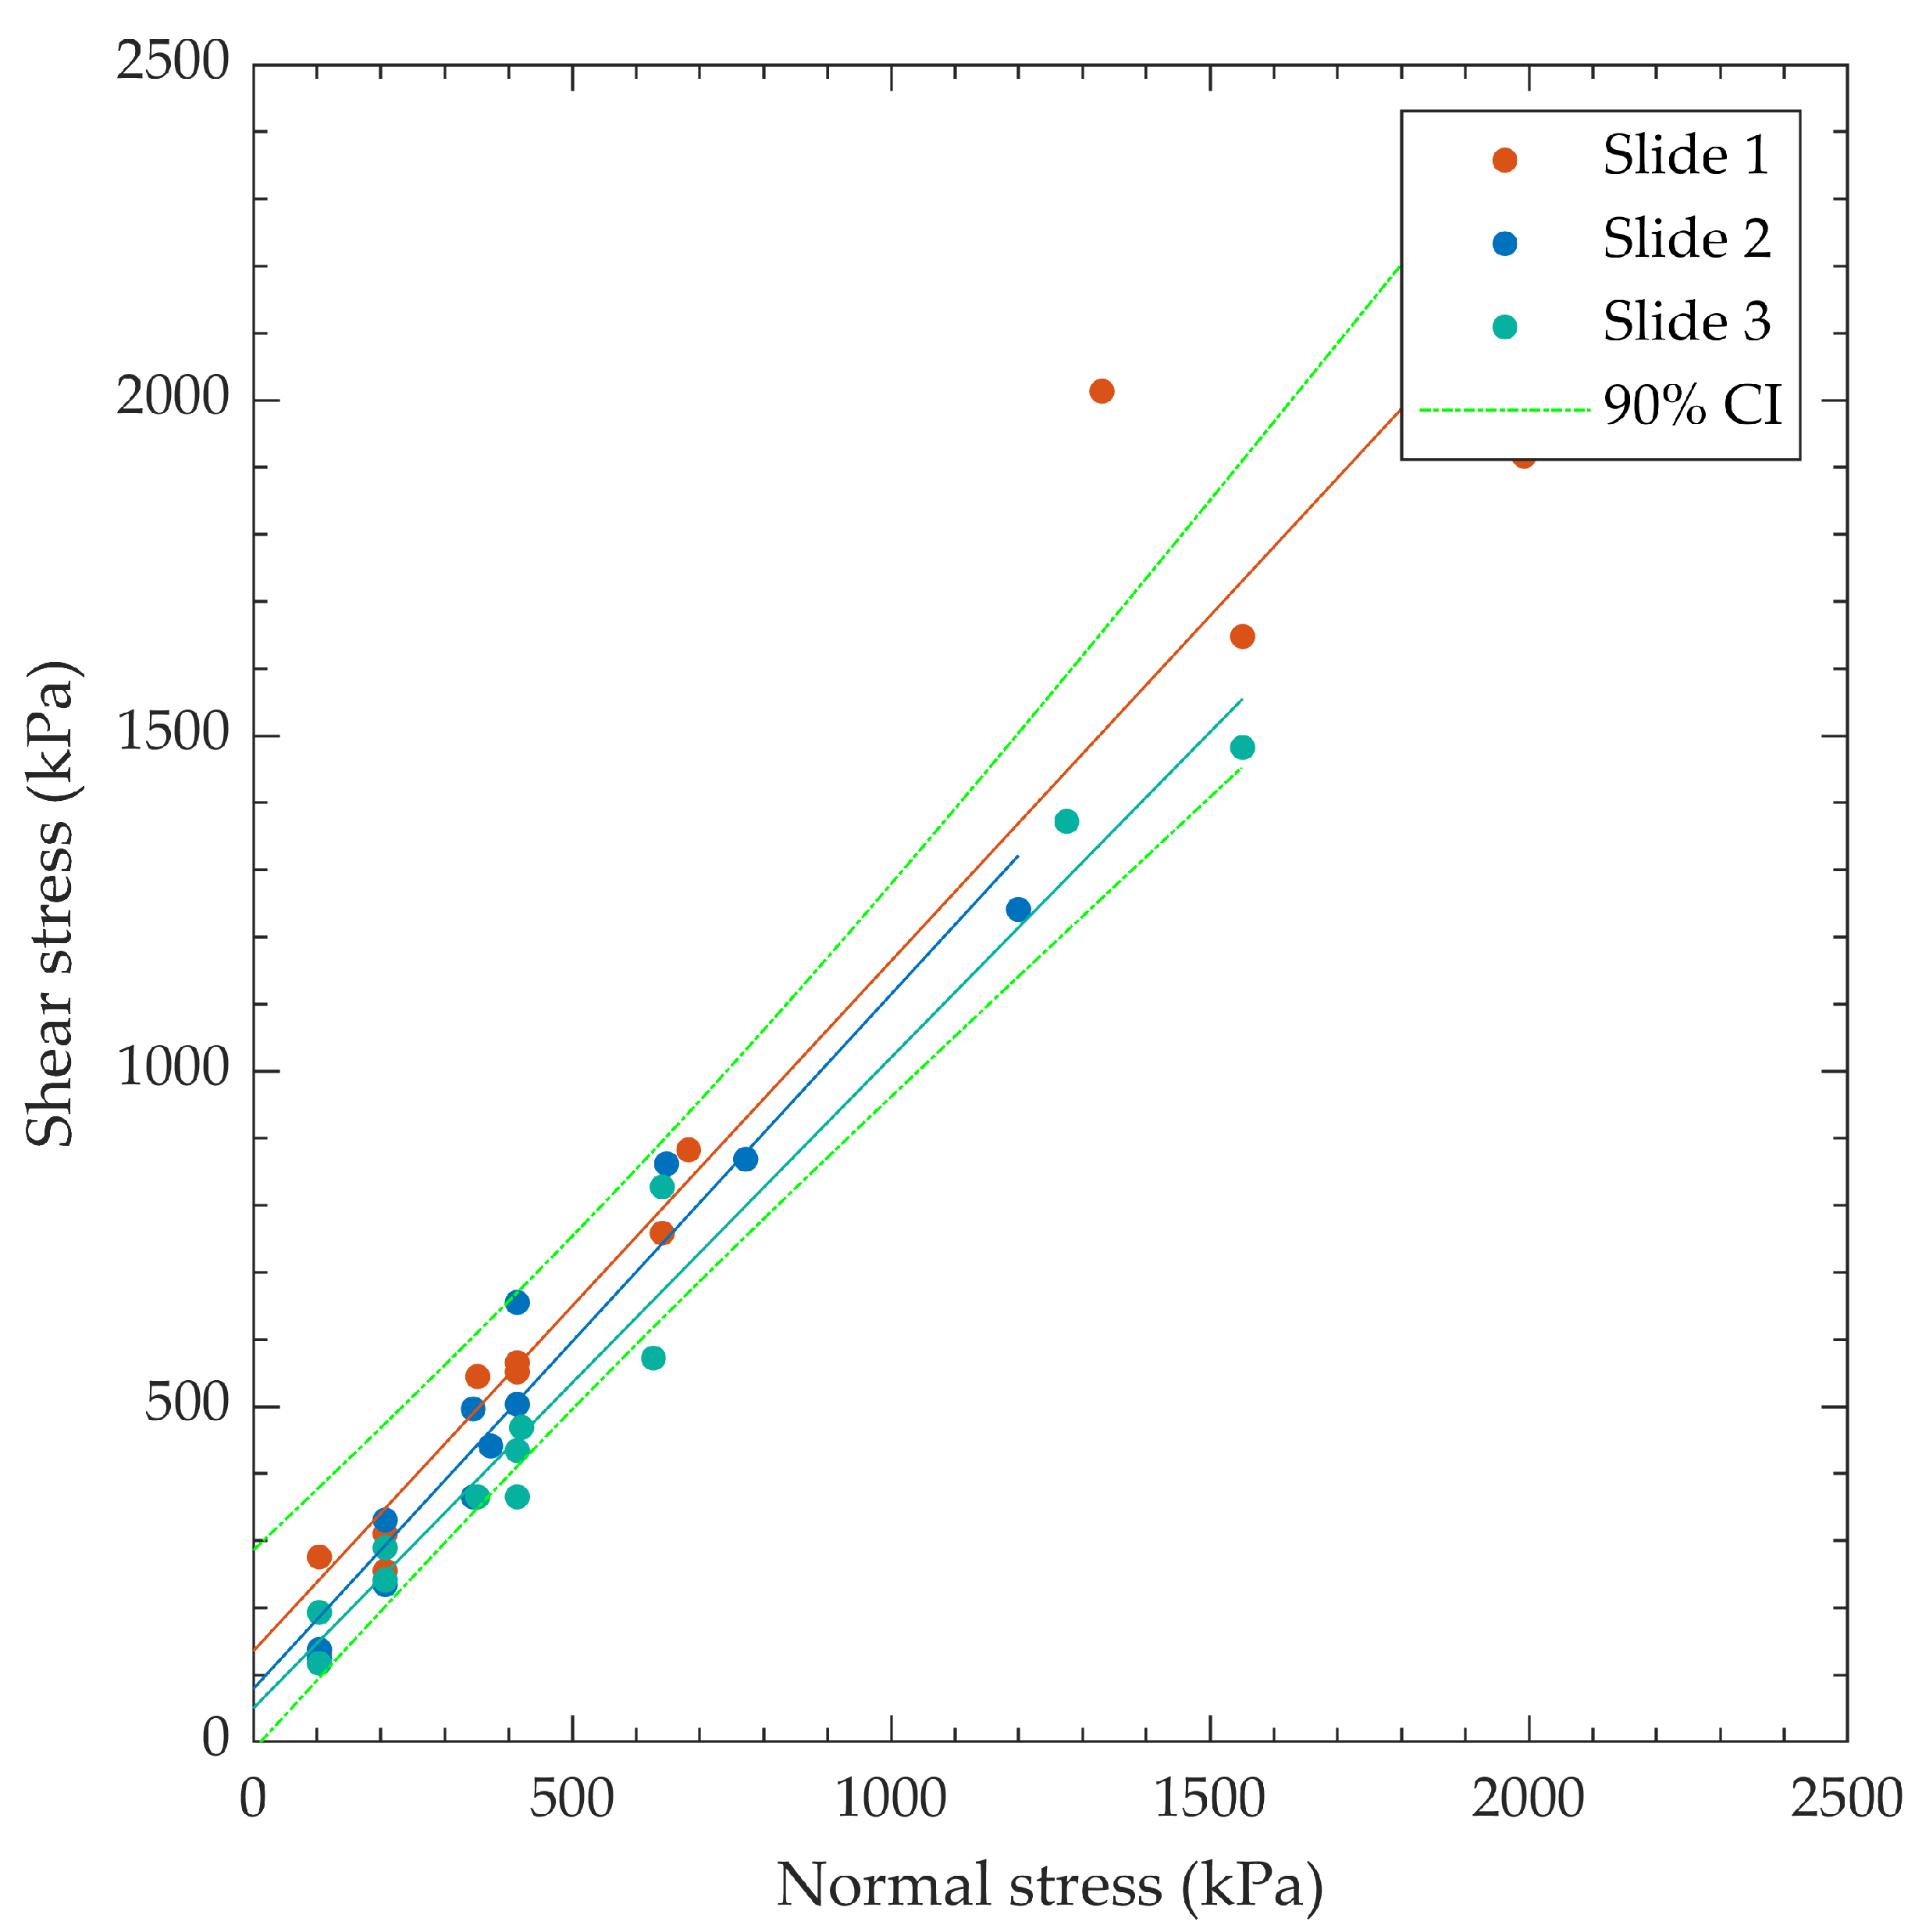
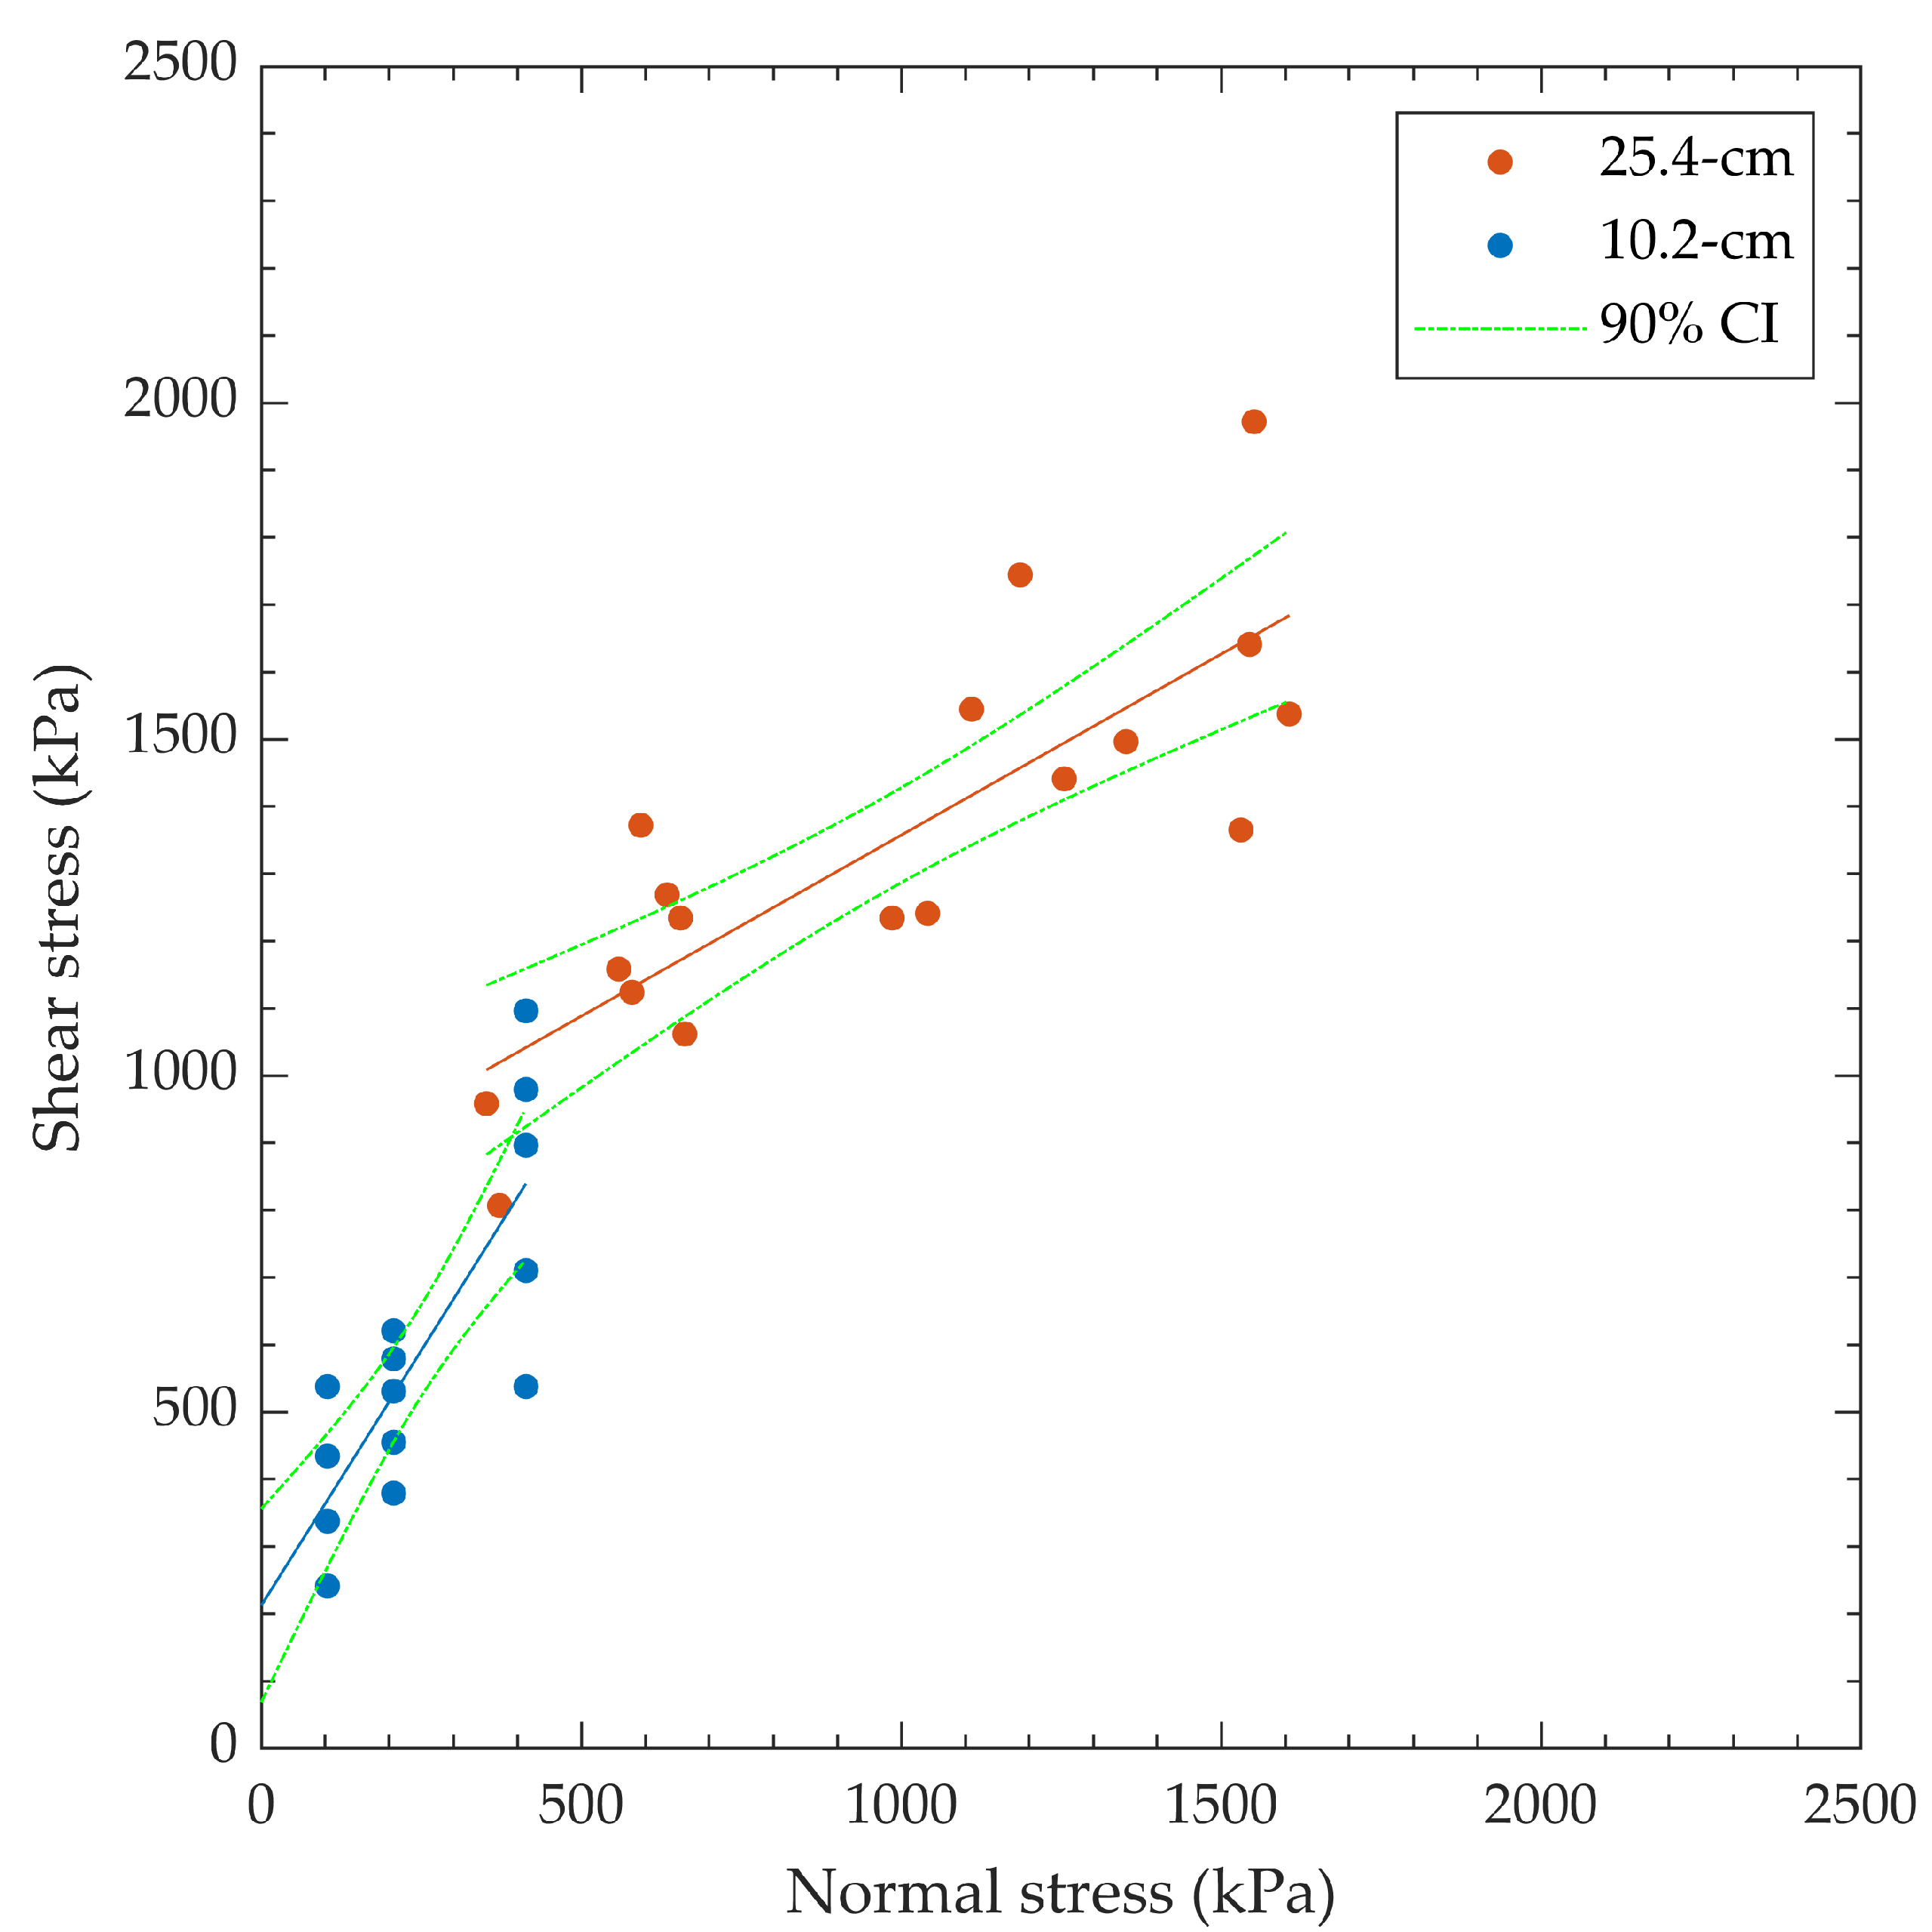
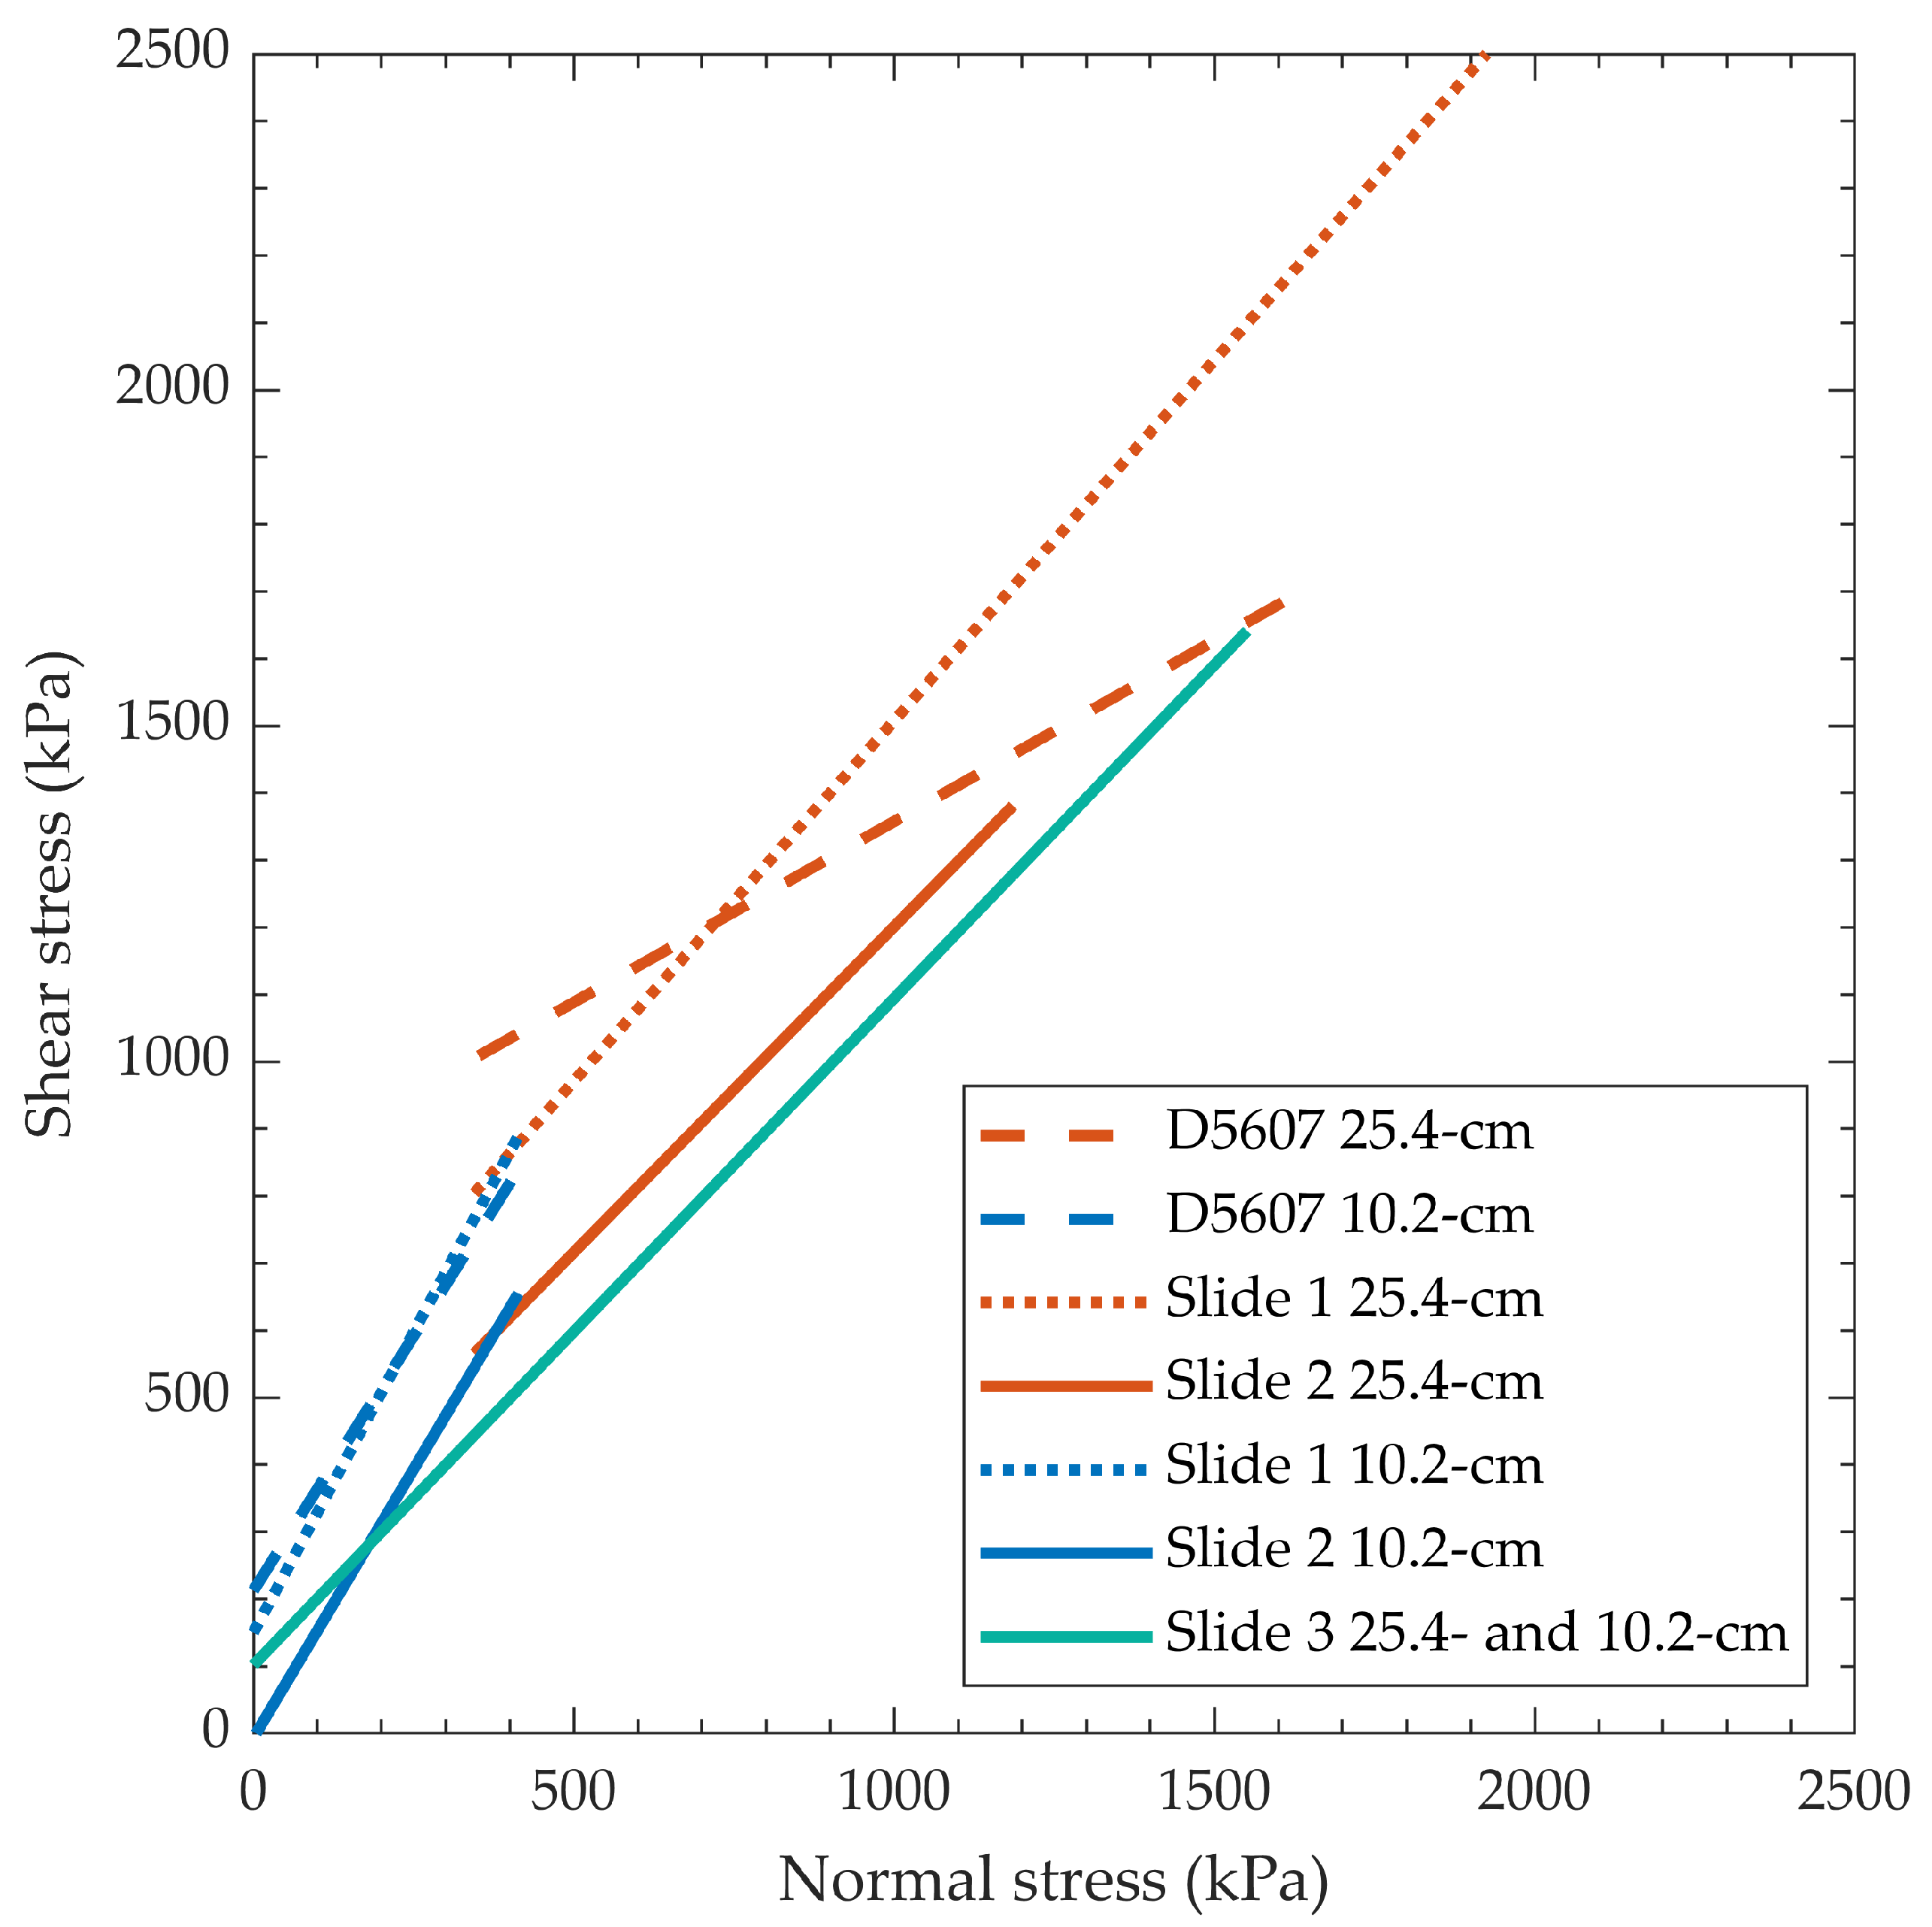
When averaging the results of each test approach across specimen diameters, the average φ from the D5607 tests was 40.5°, while the average matrix-based φ values for Slides 1, 2, and 3 were 57.5°, 50.9°, and 41.9°, respectively. This result suggests that when the ultimate shear displacement is similar between test types, the matrix-based approach provides a more robust data set, in that it can obtain the same φ as the D5607 test while also providing information about the specimen’s strength degradation. Thus, for testing programs where a sufficient number of reasonably uniform specimens are available, the matrix-based approach is superior to the D5607 approach.
The size of the specimen has a significant effect on the shear strength. The shear strength of the smaller specimens is greater, which is likely due to the larger contribution of asperity roughness to the mobilized shear strength. At higher normal loads, the mobilized shear strength of the larger specimens relies less on the surficial sliding φ and more on particle breakage along and near the surface. More research is needed to fully quantify the relative contributions of lower versus higher normal stresses, and larger versus smaller specimen sizes, to the shear strength failure envelope.
The conclusions developed within this paper are based on a relatively discrete number of laboratory-based direct shear tests on existing concrete lift lines, and further testing will be conducted to fully validate them, though the underlying principles are well known and build upon previous work from a variety of sources. This paper provides a framework to facilitate robust discussion about the correct laboratory testing to properly determine the boundary conditions of interest, rather than arbitrarily assuming all tests are created equal. This paper does not seek to develop a failure criterion based on this limited data set, with the focus being on the comparison of methods. Previous work [12] suggests significant variability in concrete direct shear data, and poor correlations between shear strength and other engineering properties.
Future work will seek to characterize: the effects of break bond normal stress on sliding shear strength parameters, strain rate’s effects on sliding shear strength parameters, and determination of the first-order roughness of concrete lift lines to upscale laboratory tests for field-scale models. It could be of interest to break specimens in one direction and rotate them 180 degrees in a sliding testing, to better understand the “uphill/downhill” sliding phenomenon.

Author Contributions

Conceptualization, E.J.L. and R.G.B.; methodology, E.J.L. and R.G.B.; formal analysis, E.J.L., R.G.B. and W.T.J.; data curation, J.R.F.; writing—original draft preparation, E.J.L.; writing—review and editing E.J.L., R.G.B., W.T.J. and J.R.F.; visualization, R.G.B. and J.R.F.; project administration, E.J.L.; funding acquisition, E.J.L. All authors have read and agreed to the published version of the manuscript.

Funding

This work was funded by the Bureau of Reclamation’s Dam Safety Office in support of a specific project.

Data Availability Statement

Data may available if requested through the Freedom of Information Act (FOIA).

Acknowledgments

The authors would like to acknowledge Reclamation’s Dam Safety Office for funding this work, the Pacific Northwest Regional drill crew and geologists who collected and shipped the specimens, Bart Pfeifer for help in the laboratory, and the design team members, Hillery Venturini, Lan Nguyen, and Roman Koltuniuk, for their assistance in developing this program and providing context for this project. Thank you to Jerzy Salamon for his thoughtful reviews and edits.

Conflicts of Interest

The authors declare no conflict of interest.

References

  1. ASTM Standard C39-18; Standard Test Method for Compressive Strength of Cylindrical Concrete Specimens. ASTM International: West Conshohocken, PA, USA, 2018.
  2. ASTM Standard C469-14; Standard Test Method for Static Modulus of Elasticity and Poisson’s Ratio of Concrete in Compression. ASTM International: West Conshohocken, PA, USA, 2014.
  3. USBR Standard 4914-92; Direct Tensile Strength, Static Modulus of Elasticity, and Poisson’s Ratio of Cylindrical Concrete Specimens in Tension, Concrete Manual, 1992, 9th ed, Part 2. Department of Interior, Bureau of Reclamation: Denver, CO, USA, 1992.
  4. Espeche, A.D.; León, J. Estimation of bond strength envelopes for old-to-new concrete interfaces based on a cylinder splitting test. Constr. Build. Mater. 2011, 25, 1222–1235. [Google Scholar] [CrossRef]
  5. McLean, F.G.; Pierce, J.S. Comparison of joint shear strengths for conventional and roller-compacted concrete. In Proceedings of the ASCE Specialty Conference—RCC-88, San Diego, CA, USA, February–March 1988. [Google Scholar]
  6. Electric Power Research Institute (EPRI). Uplift Pressures, Shear Strengths and Tensile Strengths for Stability Analysis of Concrete Gravity Dams; EPRI: Palo Alto, CA, USA, 1992. [Google Scholar]
  7. MacDonald, N.; Day, J.; Diederichs, M. A Critical Review of Laboratory Multi-Stage Direct Shear Testing for Rock Fractures. In Proceedings of the Geo Niagara 2021, 74th Canadian Geotechnical Conference, Niagara Falls, ON, Canada, September 2021; pp. 26–29. [Google Scholar]
  8. Dolen, T. Material Properties Model of Aging Concrete; Department of Interior, Bureau of Reclamation, Dam Safety Technology Development Program: Denver, CO, USA, 2005; Report DSO-05-05. [Google Scholar]
  9. Curtis, D.D.; Hasan, H.; Sooch, G.S. Shear strength of concrete lift joints from extensive laboratory testing compared to theoretical results. In Proceedings of the United States Society on Dams Annual Conference, Anaheim, CA, USA, 3–7 April 2017. [Google Scholar]
  10. Griffith, A.A. The phenomena of flow and rupture in solids. In Philosophical Transactions of the Royal Society of London. Series A, Containing Papers of a Mathematical or Physical Character; Royal Society: London, UK, 1921; Volume 221, pp. 163–198. [Google Scholar]
  11. Patton, F.D. Multiple modes of shear failure in rock. In Proceedings of the 1st Congress International Society of Rock Mechanics, Lisbon, Portugal, 25 September–1 October 1964; pp. 509–513. [Google Scholar]
  12. Lindenbach, E.J. Dam Safety Technology Development Report DSO-2017-09–Concrete Shear Strength Parameters Compared to Other Laboratory Determined Properties. 2017. Available online: https://www.usbr.gov/damsafety/TechDev/DSOTechDev/DSO-2017-09.pdf (accessed on 27 December 2022).
  13. Lindenbach, E. Concrete shear strength parameters compared to other laboratory determined properties. In Proceedings of the 38th Annual United States Society on Dams Conference, Miami, FL, USA, 30 April–4 May 2018. [Google Scholar]
  14. Hencher, S.R.; Richards, L.R. Laboratory direct shear testing of rock discontinuities. Ground Eng. 1989, 22, 24–31. [Google Scholar]
  15. McCray, M.S. (Bureau of Reclamation, Technical Service Center, Denver, CO, USA). Personal communication, 2017.
  16. Yathon, J.; Chakrabarti, S.; Penner, O.; Lindenbach, E.; Bergman, B.; Razavi-Darbar, S. A novel approach for characterizing shear strength of concrete lift joints: Experimental procedure and empirical model. In Proceedings of the 39th Annual United States Society on Dams Conference, Chicago, IL, USA, 8–11 April 2019. [Google Scholar]
  17. ASTM Standard D5607-16; Standard Test Method for Performing Laboratory Direct Shear Strength Tests of Rock Specimens under Constant Normal Force. ASTM International: West Conshohocken, PA, USA, 2016.
  18. Muralha, J.; Grasselli, G.; Tatone, B.; Blümel, M.; Chryssanthakis, P.; Yujing, J. ISRM suggested method for laboratory determination of the shear strength of rock joints: Revised version. In The ISRM Suggested Methods for Rock Characterization; Ulusay, R., Ed.; Springer International Publishing: Cham, Switzerland, 2014; pp. 131–142. [Google Scholar]
  19. Lindenbach, E.J.; Bearce, R.G. Comparison of results from CNS and CNL testing on simulated rock and concrete. In Proceedings of the American Rock Mechanics Association Annual Meeting, Seattle, WA, USA, 17–20 June 2018. [Google Scholar]
  20. Lindenbach, E.J.; Bearce, R.G. Concrete Direct Shear Testing: A Comparison of CNL and CNS Boundary Conditions, and an Empirical Relationship. In Proceedings of the USSD 2021, Virtual, 10–21 May 2021. [Google Scholar]
  21. Barton, N.R.; Choubey, V. The shear strength of rock joints in theory and practice. Rock Mech. Rock Eng. 1977, 10, 1–54. [Google Scholar] [CrossRef]
  22. ACI Committee 207; Mass Concrete—Guide: (ACI 207.1-21). American Concrete Institute: Farmington Hills, MI, USA, 2021.
  23. MTS TestSuite TW, version 4.1.7; MTS Corp.: Eden Prairie, MN, USA, 2016.
  24. MATLAB, version 9.12.0.2009381 (R2022a) update 4; The MathWorks Inc.: Natick, MA, USA, 2022.
  25. Hencher, S.R.; Richards, L.R. Assessing the shear strength of rock discontinuities at laboratory and field scales. Rock Mech. Rock Eng. 2015, 48, 833–905. [Google Scholar] [CrossRef]
  26. Barton, N. Shear strength criteria for rock, rock joints, rockfill and rockmasses: Problems and some solutions. J. Rock Mech. Geotech. Eng. 2013, 5, 249–261. [Google Scholar] [CrossRef] [Green Version]
  27. Zanotti, C.; Randl, N. Are concrete-concrete bond tests comparable? Cem. Concr. Compos. 2019, 99, 80–88. [Google Scholar] [CrossRef]
Figure 1. Aerial view looking upstream at Thief Valley Dam, Oregon.
Infrastructures 08 00055 g001
Figure 2. Coring process using a diamond drill with a 25.4 cm diameter. (a) Drilling horizontally into a lift line; (b) core sample used for direct shear test showing the intercepted lift line.
Infrastructures 08 00055 g002
Figure 3. Large direct shear testing machine at Reclamation laboratory.
Infrastructures 08 00055 g003
Figure 4. Small direct shear testing machine at Reclamation.
Infrastructures 08 00055 g004
Figure 5. Close-up view of the direct shear testing box.
Infrastructures 08 00055 g005
Figure 6. Cast specimens in rings measuring 21.6 cm in diameter and 5.1 cm tall for the small direct shear machine. Note the plexiglass rings measuring 0.3 cm thick isolating the lift line from hydrostone penetration during casting.
Infrastructures 08 00055 g006
Figure 7. Shear stress versus sliding displacement plots demonstrating the failure of two individual sliding friction stages chosen by the laboratory engineer. Note that (a) shows a typical stress–strain curve with defined peak shear stress, while (b) shows a strain-hardening effect, seen in many specimens in this testing program. The point of failure is denoted by a triangle.
Infrastructures 08 00055 g007
Figure 8. Close-up view of a post-test 25.4 cm direct shear specimen.
Infrastructures 08 00055 g008
Figure 9. Break bond test results for all specimens tested, with linear failure envelopes and a 90% confidence interval for the All Data regression. Note: there are overlapping 10.2 cm data points at τ ≈ 1000 kPa.
Infrastructures 08 00055 g009
Figure 10. Peak shear strength for all “Matrix” data with linear best fit curves.
Infrastructures 08 00055 g010
Figure 11. Residual (about 2% shear strain for each slide) shear strength for all “Matrix” data with linear best fit curves.
Infrastructures 08 00055 g011
Figure 12. Peak shear strength for all “D5607” data with linear best fit curve.
Infrastructures 08 00055 g012
Figure 13. Peak shear strength for “D5607” broken down by specimen diameter. Linear best fit curves.
Infrastructures 08 00055 g013
Figure 14. Peak shear strength for “Matrix” and “D5607” broken down by specimen diameter. Slide 3 data combined for one linear best fit line.
Infrastructures 08 00055 g014
Table 2. General “Matrix” direct shear test normal stress schedule for 10.2 cm diameter specimens.
Specimen DesignationBreak Bond (kPa)Slide 1 (kPa)Slide 2 (kPa)Slide 3 (kPa)
15A103103207414
30A207207414103
60A414414103207
15B103414207103
30B207103414207
60B414207103414
Table 3. General “D5607” direct shear test normal stress schedule for 25.4 cm diameter specimens.
Break Bond (kPa)Slide 1 (kPa)Slide 2 (kPa)Slide 3 (kPa)
Type A Test3793797581516
Type B Test7583797581516
Type C Test15163797581516
Table 4. General “D5607” direct shear test normal stress schedule for 10.2 cm diameter.
Break Bond (kPa)Slide 1 (kPa)Slide 2 (kPa)Slide 3 (kPa)
Type A Test103103207414
Type B Test207103207414
Type C Test414103207414
Table 5. Summary of break bond data from linear best fit curves.
Specimen Designationφbb (°)c (kPa)R2
Combined 25.4 and 10.2 cm55.610050.4881
25.4 cm53.511650.3802
10.2 cm50.510000.0628
Table 6. Summary of all “Matrix” sliding friction data from linear best fit curves.
All “Matrix” Dataφ (°)ca (kPa)R2
Slide 1 peak49.23230.8556
Slide 2 peak48.21250.9102
Slide 3 peak44.81020.9601
Slide 1 residual45.81350.9248
Slide 2 residual46.0790.9503
Slide 3 residual44.1500.9739
Table 7. Summary of all “Matrix” procedure data from the 25.4 cm diameter core.
25.4 cm “Matrix” Dataφ (°)ca (kPa)R2
Slide 1 peak47.04340.743
Slide 2 peak44.12310.907
Slide 3 peak43.01760.934
Slide 1 residual42.92780.845
Slide 2 residual44.21160.954
Slide 3 residual43.7730.961
Table 8. Summary of all “Matrix” procedure data from 10.2 cm diameter core.
10.2 cm “Matrix” Dataφ (°)ca (kPa)R2
Slide 1 peak60.81500.786
* Slide 2 peak57.600.938
Slide 3 peak40.71090.909
Slide 1 residual49.5660.781
* Slide 2 residual54.200.956
Slide 3 residual37.6880.853
* Fit forced through origin.
Table 9. Summary of “D5607” frictional sliding data from linear best fit curves.
Specimen Designationφ (°)c (kPa)R2
All “D5607”40.54490.810
25.4 cm “D5607”28.38190.664
10.2 cm “D5607”56.62120.668
Table 10. Summary of “D5607” frictional sliding data from linear best fit curves.
Specimen DesignationSlide Numberφ (°)ca (kPa)R2
Slide 1 Peak47.04340.743
25.4 cm “Matrix” dataSlide 2 Peak44.12310.907
Slide 3 Peak43.01760.934
Slide 1 Peak60.81500.756
10.2 cm “Matrix” data* Slide 2 Peak57.600.866
Slide 3 Peak40.71090.926
25.4 cm “D5607” dataMultistage sliding28.38190.664
10.2 cm “D5607” dataMultistage sliding56.62120.668
* Fit forced through origin.
Disclaimer/Publisher’s Note: The statements, opinions and data contained in all publications are solely those of the individual author(s) and contributor(s) and not of MDPI and/or the editor(s). MDPI and/or the editor(s) disclaim responsibility for any injury to people or property resulting from any ideas, methods, instructions or products referred to in the content.

