1. Introduction
Three-dimensional printing technology is available for different materials, i.e., metals [
1,
2], polymers [
3], concrete [
2,
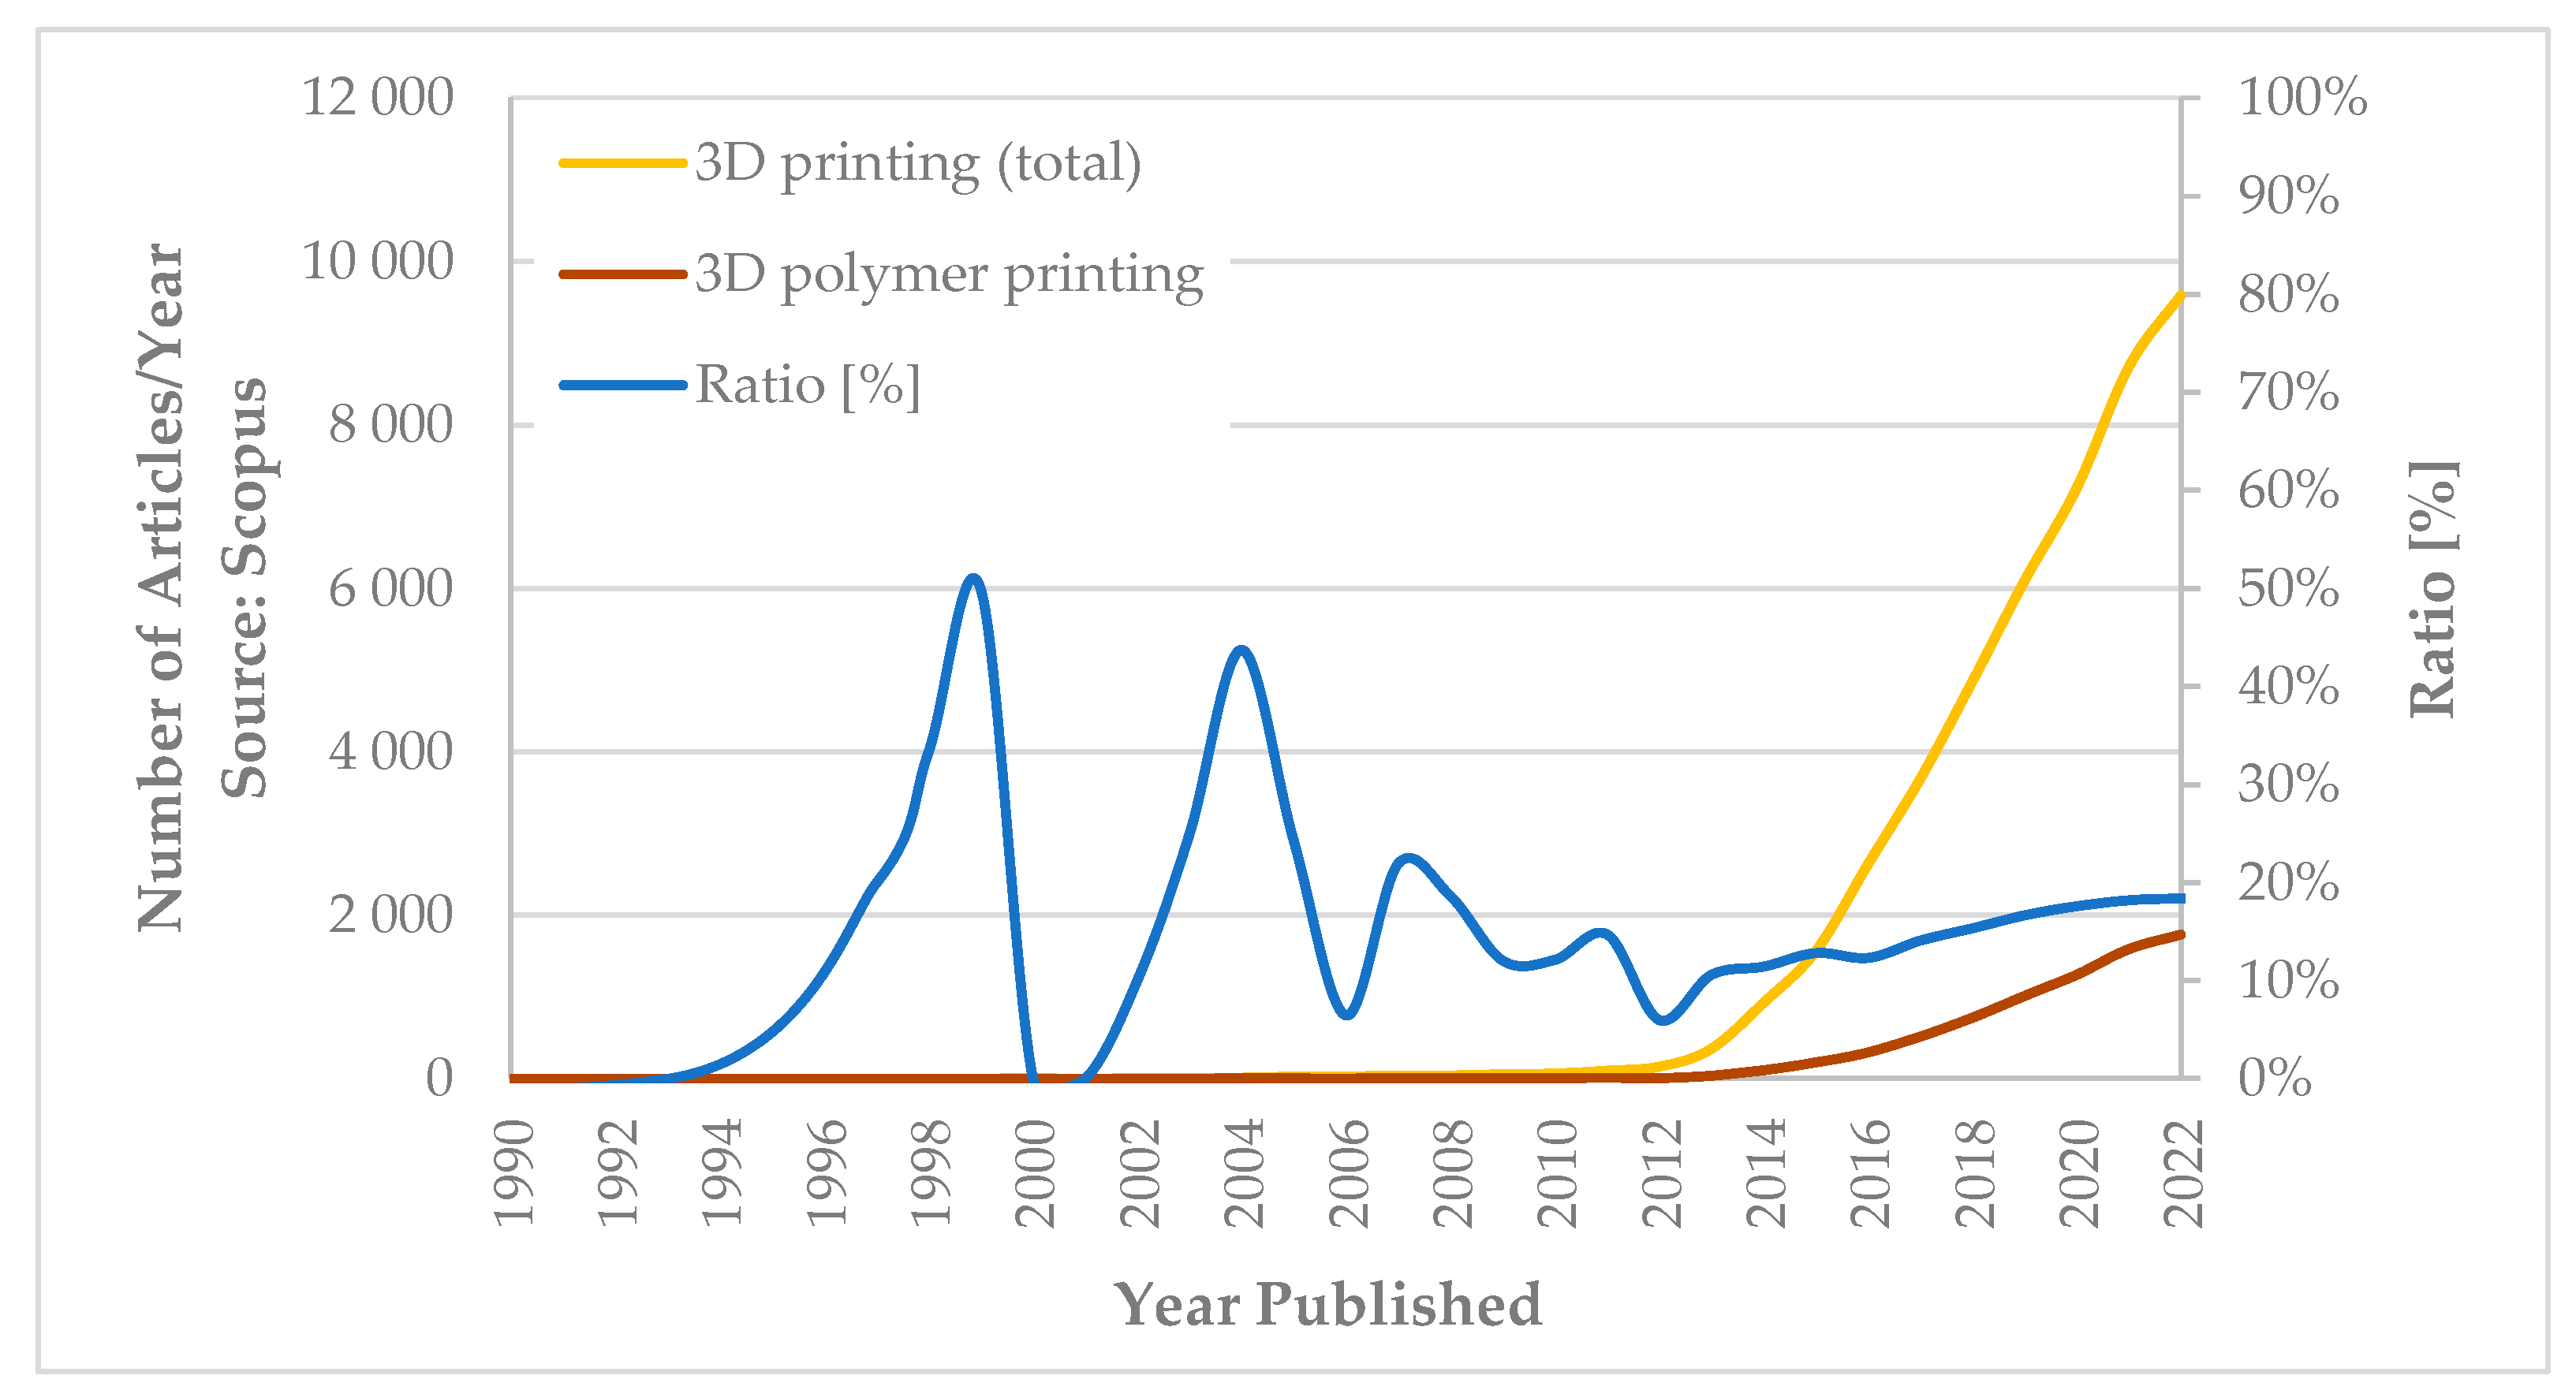
4], etc. The following discusses several application possibilities, recent technologies and developments, and up-to-date scientific results. Of course, the introduced parts are only a short overview because of the wide range of available literature in this field (see
Figure 1, where the Scopus indexed papers are shown with a comparison between 3D polymer printing and 3D printing). In this way, the shown literature review was prepared without the need for exhaustiveness.
Wang et al. [
3] summarize 3D printing techniques for polymer composite materials and the properties of 3D-printed composite parts. They discuss the performance of particle, fiber, and nanomaterial-reinforced polymer composites [
3]. Stansbury and Idacavage [
5] published a peer-reviewed literature review of 3D printing techniques and new versions of polymer-based materials. They found that in monomer/polymer 3D printing, the material can be (i) liquid resin, (ii) polymer powder, (iii) polymer filament, or (iv) polymer film(s). The patterns/fuses are (i) optical, (ii) chemical/mechanical, or (iii) thermal. The optical one corresponds to the liquid resin and the polymer powder. The chemical/mechanical technology relates to polymer powder and polymer film(s). The thermal patterns connect to polymer powder and polymer filament. Finally, the print technologies are the following: (i) SLA/DLP (SLA—stereo-lithography apparatus; DLP—digital light projection), (ii) MultiJet/Polyjet, (iii) SLS (selective laser sintering), (iv) binder jetting, (v) SHS (selective heat sintering), (vi) FFF/FDM (FFF—fused filament fabrication; FDM—fused deposition modeling), as well as (vii) LOM (laminated object manufacturing). The optical patterns/fuses are related to SLA/DLP, MultiJet/Polyjet, and SLS. The chemical/mechanical patterns/fuses correspond to binder jetting and SHS. Finally, the thermal one connects to FFF/FDM and LOM technologies.
Yang et al. [
6] propose a novel three-dimensional (3D) printing process for the low-cost, rapid fabrication of complex composite parts. A three-dimensional printing process with controlled fiber orientation and distribution capabilities has excellent potential for producing load-bearing composites and parts. In another publication, they discuss how temperature-controlled 3D printing is suitable for designing different degrees of crystallinity and mechanical properties [
7]. Wallin et al. [
8] analyze the properties of the basic soft materials for the different components of soft robots, highlighting the most relevant polymer systems. They compare different additive manufacturing processes, including 3D printing. Espalin et al. [
9] report on an automated FDM-based process where, in addition to the possibility of direct writing of electronic circuits, the fabrication uses thermoplastics and copper wires, resulting in improved printing performance and durability. Fu et al. [
10] highlight recent developments in the 3D printing of devices for energy-related applications. Among others, energy storage applications, electronic circuits, and high-temperature thermal energy applications are discussed in the paper. Chia et al. [
11] published on biomedical devices created by 3D printing using computer-aided design, focusing on developing printing techniques in the field of tissue engineering. Ligon et al. [
12] focus on polymer-based AM (AM—additive manufacturing) for metals and ceramics, polymer processing, and developing polymers specifically for AM. This paper focuses on the processing of polymers (thermoplastics, thermosets, elastomers, hydrogels, functional polymers, polymer blends, composites, and biological systems), the development of polymers, and advanced polymer systems specifically for AM. Techniques used include photo-polymerization (stereolithography), powder bed fusion (SLS), material and binder jet (inkjet and aerosol 3D printing), sheet lamination (LOM—laminated object manufacturing), extrusion (FDM, 3D dispensing, 3D fiber deposition, and 3D imaging), and 3D bio-printing.
This paragraph describes the new technological developments. Ngo et al. [
13] summarized 3D printing techniques, presented the advantages and disadvantages of the technologies, and outlined future research and development opportunities. Blok et al. [
14] presented FFF composite 3D printing. These are based on carbon fibers embedded in a thermoplastic matrix to increase strength and stiffness. The embedded short carbon microfiber filaments (~100 μm) improved printability. Bagheri et al. [
15] describe the recent results of photopolymerization-based 3D printing and the characteristics of new 3D printable photopolymers. According to Do et al. [
16], 3DP technologies can be used to produce highly complex ECM-like (ECM—extracellular matrix) scaffolds where details can be incorporated at the micrometer level. The creation of bio-functional scaffolds can help meet patients’ demand for tissues and organs. Patel et al. [
17] present DLP 3D printing technology, a low-cost, high-performance additive manufacturing method. Khoo et al. [
18] review the advances, challenges, and future path of 4D printing (4D printing is the technology in which, after 3D printing, the object reacts to stimuli from the natural environment or human intervention, resulting in a change in physical or chemical state over time). It is worth mentioning the so-called 5D printing [
19]. Sadiq [
19] introduces not only 4D but also 5D printing technology. 5D printing is a new technology in the field of AM in which the print head and the object to be printed rotate together with the 5D print with a total of five degrees of freedom around the x, y, and z axes. Thanks to this design, it can produce exact curved layers or concave shapes, subject to constraints. In this process, the printed part moves while the print head simultaneously produces a so-called print bed with five-axis printing. It moves forward and backward along the x, y, and z axes, ensuring that the object is printed from all five axes rather than printing from a single point. Zarek et al. [
20] present a method based on the 3D printing of methacrylate macromonomers for flexible and sensitive electrical circuits. They analyze the potential utility of polymer-based 4D and 5D techniques for building a more sustainable wastewater treatment system. In their literature, Carrico et al. [
21] focused on creating 3D ionic polymer–metal composite (IPMC) structures for soft robotics. The 3D printing technique would be superior to current manufacturing processes for IPMCs due to some of its limitations, such as limited shapes and dimensions and time-consuming manufacturing steps. Jambhulkar et al. [
22] present a layer-by-layer technique for selective and aligned placement of nanoparticles depending on the 3D printed surface patterns. According to Echalier et al. [
23], the combination of sol–gel chemistry and 3D extrusion printing opens the way to unlimited customization of biomimetic matrices. In the case of 3D and 4D printing, Rahmatabi D.’s following papers are worth mentioning [
24,
25,
26,
27]. He was dealing with, e.g., a new strategy for achieving shape memory effects in 4D-printed two-layer composite structures, as well as the application of PVC (poly-vinyl chloride), PET (polyethylene terephthalate), and PLA-TPU (PLA—polylactic acid; TPU—thermoplastic polyurethane) materials in 3D and 4D printing.
The above brief literature review shows extensive and wide-ranging international literature on 3D printing, covering many topics. Since the 1980s, the potential applications of 3D printing technology have increased significantly, with significant advances in medicine, biology, engineering (mechanical, electrical, civil, etc.), and so on. In this article, the authors deal with optimizing 3D-printed rapid prototype deep drawing tools for automotive and railway sheet material testing. They examine one type of steel and one type of aluminum sheet with an Erichsen cupping machine. The main idea was to consider four types of 3D FDM printers and four types of PLA materials. According to these materials and printers, the study aims to determine the printing and material parameters that can safely produce a minimum batch of 100 punches. Furthermore, GOM ATOS technology was applied to measure the wear of the 3D-printed deep drawing tools.
Section 2 contains the Materials and Methods, and
Section 3 has the Results and Discussion. Furthermore,
Section 4 contains the Conclusions.
The DIC method can be used in other engineering scientific works allied with mechanical engineering. For example, they can be related to railways [
28,
29,
30,
31,
32,
33,
34,
35,
36], highways [
37,
38,
39,
40], air transport [
41,
42], shipping [
43], astronautics [
44,
45], transportation [
46,
47], and so on. In this research, the authors applied an approach regarding railway and automotive vehicles and their car body sheets.
2. Materials and Methods
This section of the research presents the applied 3D FDM printers and the raw materials, the segmentation software, and the different printing strategies. The research first focused on identifying the optimal printing strategies and PLA filament materials that can quickly produce rapid prototype deep drawing tools for producing at least 100 series. PLA filament material was selected for its easy printability, recyclability, and availability. A minimum series of 100 pieces is already beyond the prototype part numbers and can be considered a small series. Therefore, this is the minimum goal of this research. The main criterion for selecting the printers was choosing an efficient and cost-effective available model. As a control, a printer with a higher price range was also considered for the research.
The tests were carried out on four different 3D printers, each with a different printing characteristic. All 4 of these printers were FDM technology printers. Regarding the raw materials tested, four types of PLA and two types of different sheet materials were investigated.
2.1. Three-Dimensional Printers
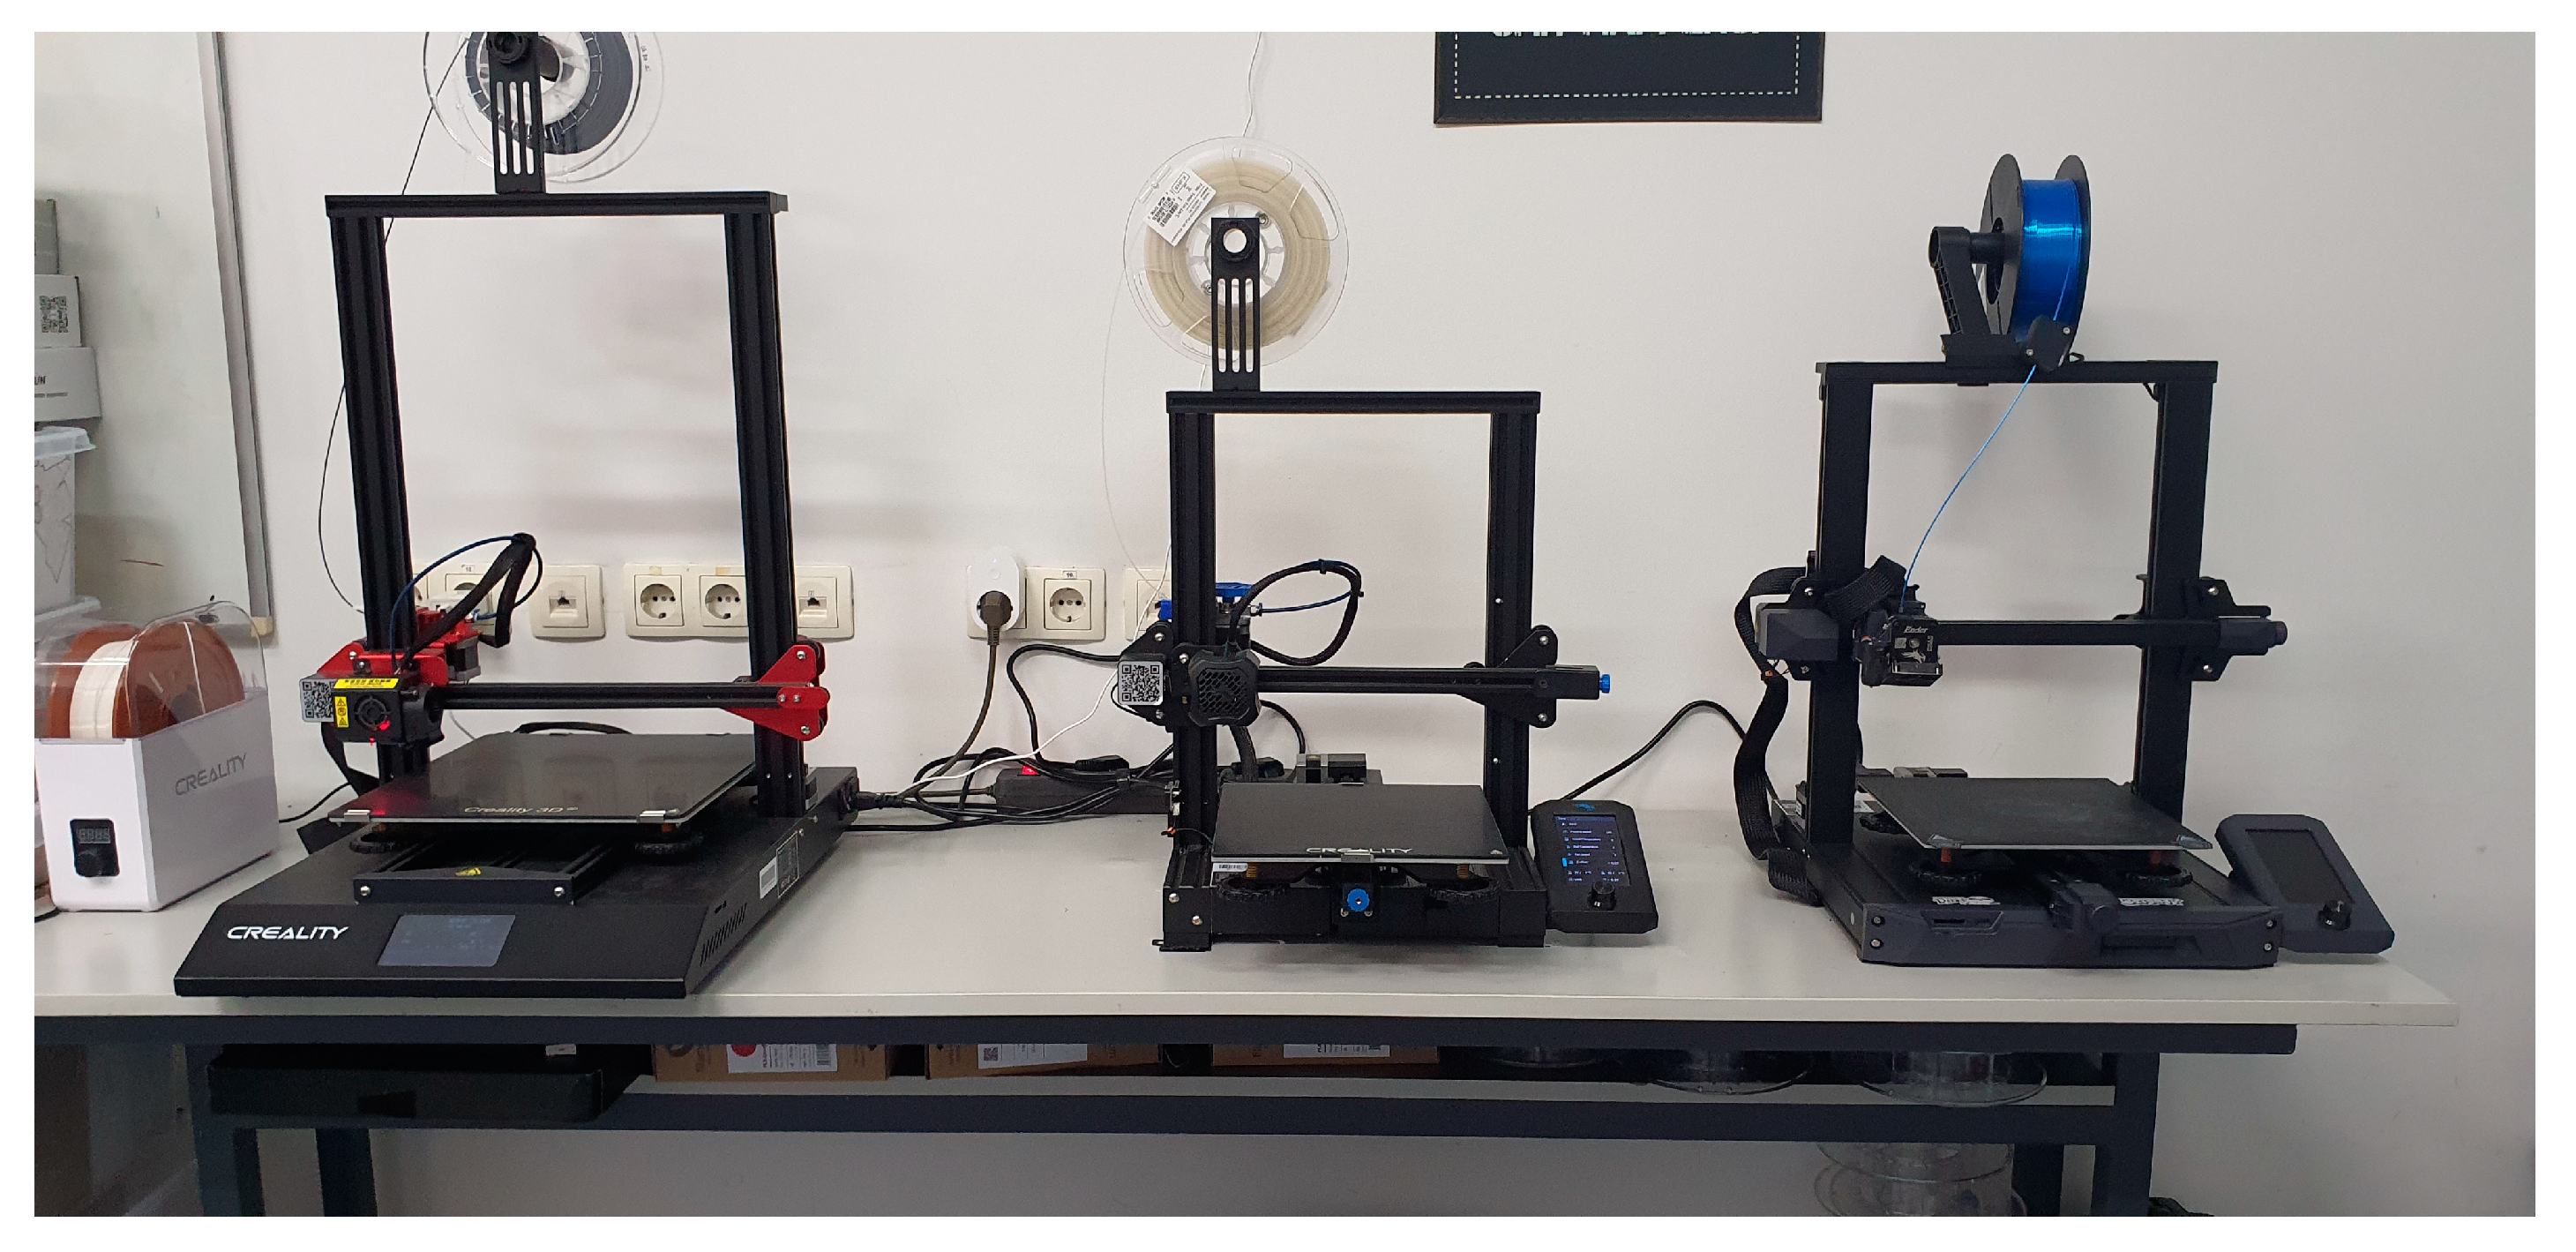
The authors used FDM printers with a standard design (Cartesian machines). In addition to the simple and economical design, the open working space is a characteristic feature of the printers in
Table 1. Therefore, it was a critical test criterion to ensure that, in addition to using different PLA materials, the tools in the research were produced with printers that were available at a reasonable price.
Figure 2 shows the printers utilized.
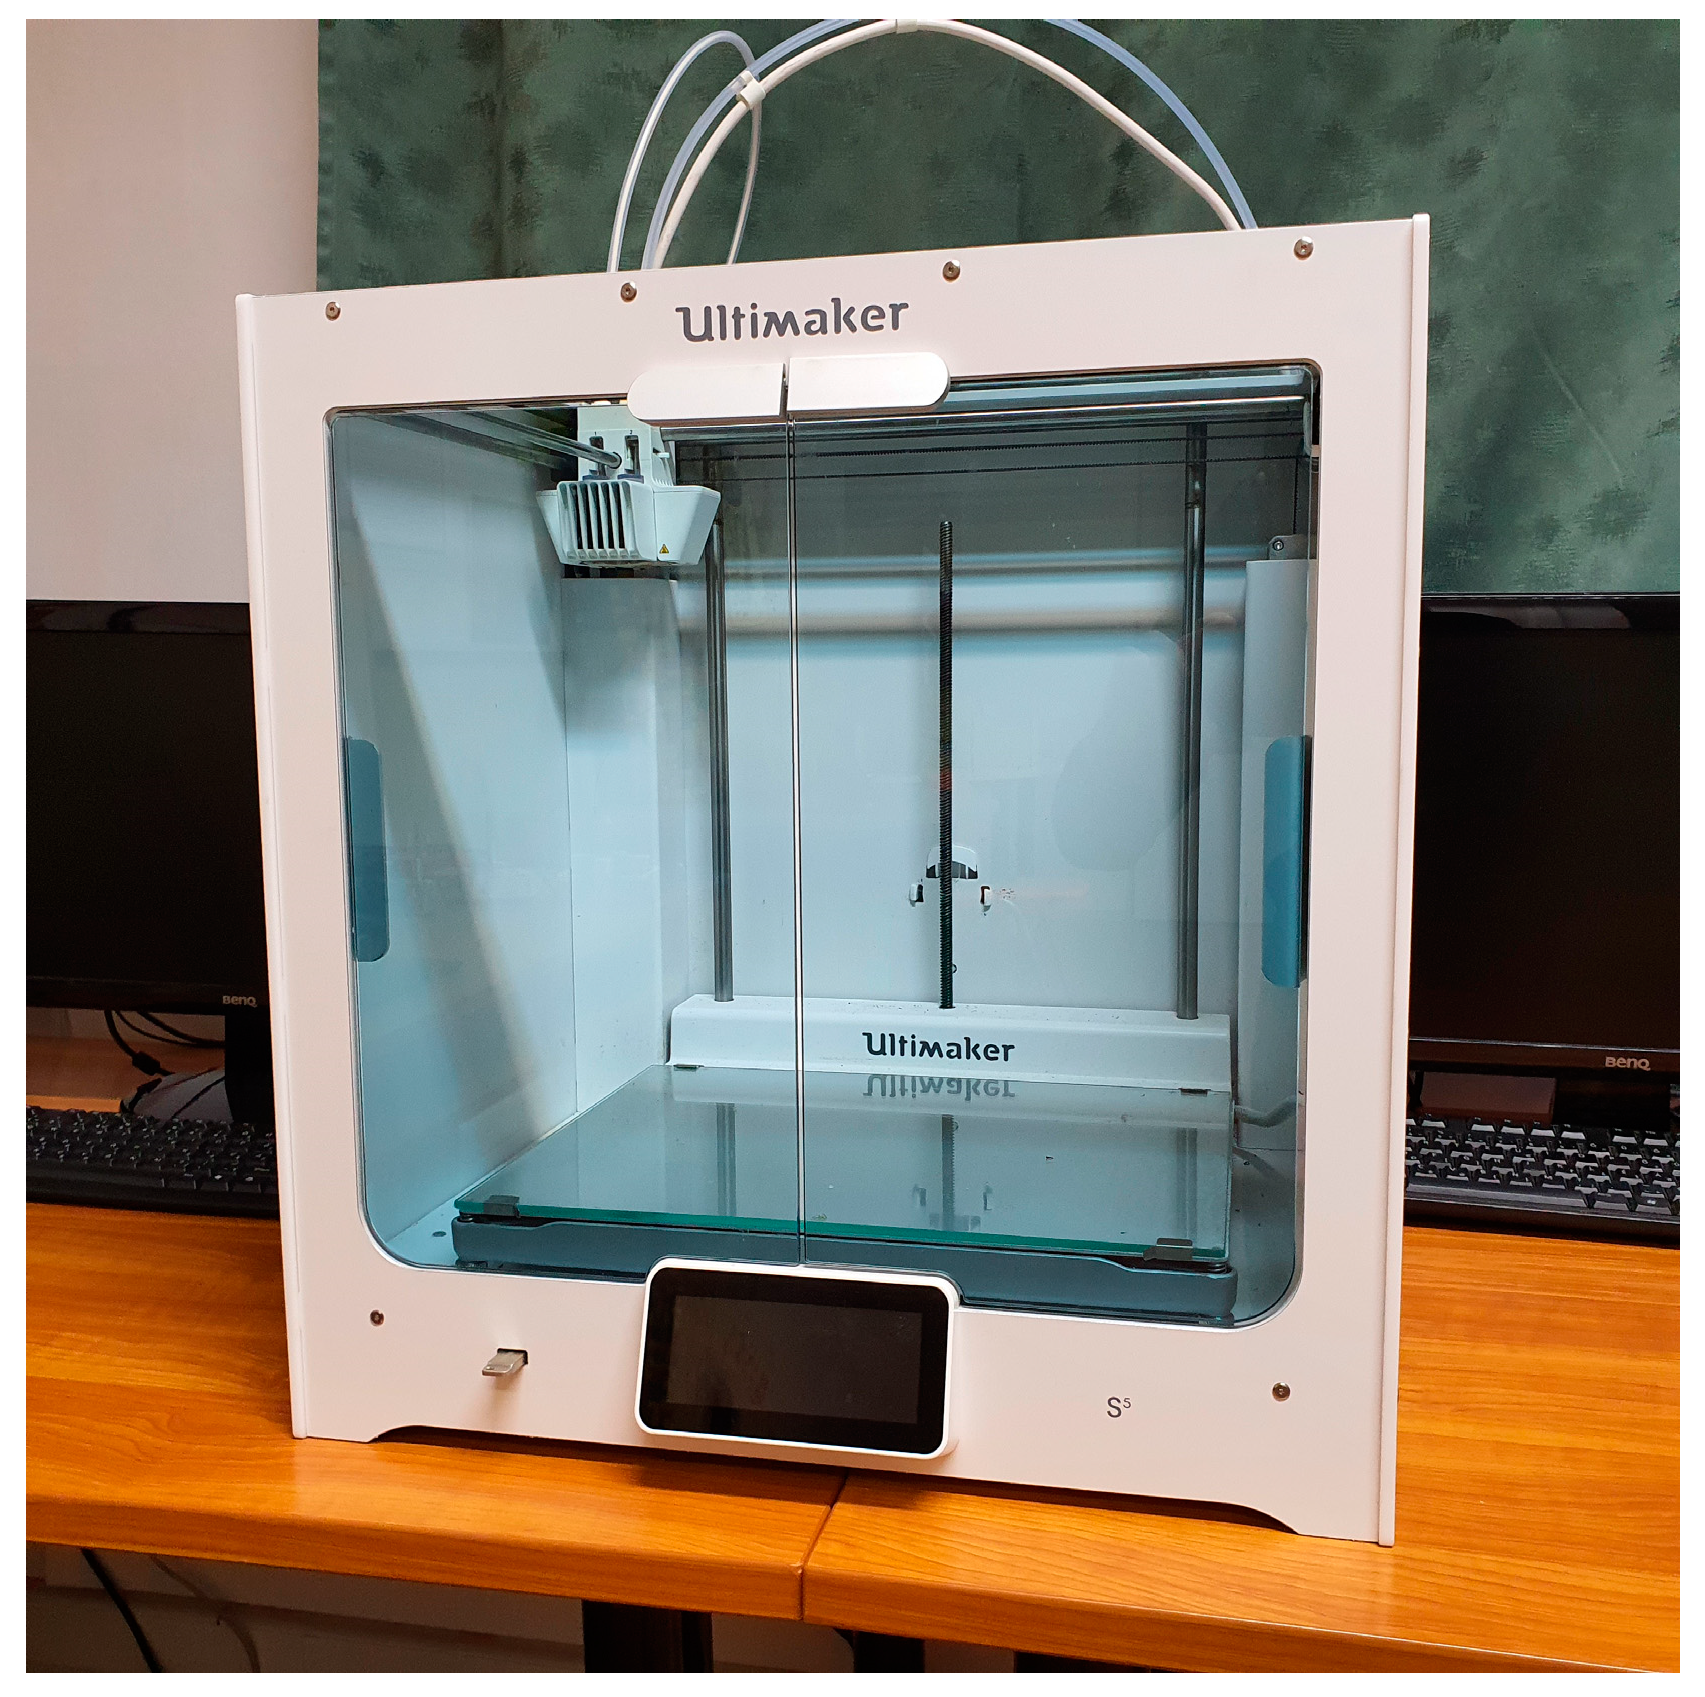
Figure 3 shows a printer with a secure (closed) workspace. This printer has been designed for industrial use and is significantly higher priced than the previous three. The main advantage of a closed print space is the relatively constant temperature around the printed object during printing.
Table 2 contains the relevant characteristics of the Ulti-maker 3D printer.
2.2. Raw (Base) Materials
Due to their favorable printing properties, four different PLA materials were considered for the research. The materials were selected to cover a wide range of applications (see
Table 3). PLA, polylactic acid, is one of the most popular and cheapest materials, produced from high starch cereals by lactic acid fermentation. It has a melting point of around 150–160 °C, is easily processed at 190–260 °C, and is insoluble in water. On the other hand, it is a hard material with a tensile strength of 50–60 MPa. Therefore, it is excellent for printing models, models, and presentation materials but less suitable for producing underwear due to its low glass transition temperature of around 55–58 °C and the fact that it can start to biodegrade in a few months in a humid, polluted environment. However, it can be recycled and broken down into monomers by thermal de-polymerization or hydrolysis. With various additives and increasing the crystallinity fraction, the glass transition temperature can be raised to 90–100 °C, the hardness will be lower, and the tensile strength can be halved down to 25–30 MPa. Filaticum PLA was chosen because it is domestically developed and produced, and is of outstanding and stable quality.
PLA Budget is a conventional PLA characterized by favorable printability at temperatures as low as 190–205 °C.
PLA Advanced PRO is a filament offering higher quality in terms of mechanical properties. Its base material is specially formulated for filament 3D printing and can be used as an alternative to PETG and ABS with additional additives. Objects printed from PRO filament are more flexible and impact resistant. PLA Advanced PRO is a truly user-friendly, easy-to-handle filament. It adheres easily to the table and has excellent layer adhesion, ensuring a smooth surface and more precise printing. Higher printing temperatures (225 °C) are required to achieve better mechanical properties.
Filaticum Engineering filament has been developed for a wide range of industrial applications. The heat resistance of objects printed from Engineering is exceptionally high, withstanding temperatures up to 140 °C. Filaticum Engineering is also much more resistant to other external influences than standard PLA materials: it has a high resistance to impact and fracture, making it an excellent material for objects that are exposed to such influences in, for example, industrial environments.
The PLA Speed base material is characterized by a higher printing speed of 80–90 mm/s, and its favorable mechanical properties are due to the glass bead reinforcement. In addition, the manufacturer promises to print tough and wear-resistant objects.
2.3. Segmentation (Slicer) Software and the Applied Setup (Settings)
In order to 3D print a CAD model or a part, one of the essential requirements is the right STL file, and the other is the right slicer program. Slicer software is a necessary component of 3D printing, as 3D printers alone cannot translate a CAD drawing. The software translates the 3D model into a language (typically G code) that the 3D printer can handle. The slicing software used in this research is CURA. It is a top-rated and easy-to-handle software but allows for many configurations. The software offers a wide range of settings, but only the settings used in this research are described: wall line count, infill density, infill pattern, layer height, top layer, bottom layer, top/bottom pattern, and infill overlap percentage.
Wall line count is used to change the number of inner and outer walls of the part to be printed. The number of walls greatly influences how strong the print will be. In addition, the printed walls are positioned next to each other, reinforcing each other, and contributing to a stable part structure. A CURA′s default number of walls is two, including an inner and an outer wall. Increasing this number increases the number of walls, improving the printed product′s strength and waterproofing properties.
The infill density controls how dense or hollow the model should be. It is a percentage value that indicates how much of the internal structure of the print is occupied by solid infill. The default value of CURA for infill density is 20%, which is adequate for an average model. However, if the model is to perform a functional task, such as, in this case, a deep drawing punch, it is more appropriate to increase this number to 50–80%. The size of this value may vary from infill type to infill type. Some infill forms provide a sufficiently stable structure even at lower infill percentages. Increasing the infill density makes the model more robust and stiffer and improves the waterproofing properties of the component in the same way as increasing the wall number, in addition to improving the surface quality. The disadvantage is that printing takes longer, and the filament will also increase.
Infill pattern is the pattern that the printer uses to build the infill structure of the printed product. The default pattern used by CURA is the so-called Cubic pattern, which creates several 3D cubes by layering them on top of each other and tilting them. In addition, CURA offers many infill patterns, each with unique advantages and disadvantages.
Grid: The grid pattern creates two sets of perpendicular lines. Together they form a pattern of squares. It has the advantage of being the most robust pattern in the vertical direction, and it supports the overlay very well, resulting in an attractive outer surface.
Cubic: A cubic pattern, a fill with print paths that cross within a layer. It creates 3-dimensional cubes with one corner facing down. It has the advantage of having approximately the same strength in all directions, including the vertical direction. In addition, this infill has the lowest incidence of the so-called pillowing effect, as no elongated hot air pockets are created during printing. The pillowing effect occurs when the hot air rises upwards and pushes the top layer of the print, creating pillow-like bumps on the surface.
Gyroid. It is one of the few 3-dimensional structures that provide excellent support in all directions, plus it is relatively quick to print and material efficient. It is equally stable in all directions but not too rigid. Because there are no overlapping lines in this pattern, it allows easier printing of materials with higher surface tension. The disadvantage is that slicing parts set with this fill takes longer due to generating many G-codes.
Layer height controls the height or thickness of the print layer. This setting significantly affects the quality of the finished product and the printing time. A thinner layer height provides more detail and a better surface finish to the printed part, while a thicker layer height increases the strength of the print and reduces printing time. CURA offers many preset profiles for different layer heights, such as Low Quality, Standard Quality, Dynamic Quality, and Super Quality, but printer types can also provide Engineering Quality.
Low Quality (0.28 mm): higher layer height, resulting in higher strength and faster print times, but coarser print quality.
Standard Quality (0.2 mm): this is the default value in the program, which provides a balance between quality and speed.
Dynamic Quality (0.16 mm): a balance between Super and Standard Quality, which provides good quality without sacrificing too much on print time.
Super Quality (0.12 mm): a lower layer height results in a better-quality product but increases print time.
By changing the number of top and bottom layers, the thickness of the layer essentially changes. These layers will affect the final appearance of the print, as some of the layers will form part of the outer visible surface. The thicker the top and bottom layers, the stronger the structure of the model will be, as the inside will be solid in the affected area rather than the infill filling the inside of the print. Another factor that will be affected by these settings is how waterproof the model will be. The more top and bottom layers inside a model, the more waterproof it is. The downside is that the higher the number of layers, the more material the printed product will use; hence, the more extended the printing time.
To be able to choose the pattern for the top layer, there are several options. Three types of patterns are available to the user, each of which has advantages and disadvantages.
The Lines pattern is the default top layer pattern set by CURA. It is a good pattern because it provides excellent surface quality and rigid lines in the extrusion direction. In addition, since this type of pattern adheres firmly to the model wall, a more robust part can be obtained.
The Concentric pattern is recommended when waterproofing the designed part is essential, as this pattern prevents air pockets and various gaps that can form during printing. It also has the advantage of providing the same strength in all directions, but the disadvantage is that the surface quality is not among the best.
The Zig Zag is like the Lines pattern, except that while in the Lines pattern, the drawn lines end in the walls; in the Zig Zag, the same lines continue extrusion as soon as they reach the wall on the opposite side, turning away from it. The surface quality is also excellent with this pattern, and the extrusion rate is more constant. The main disadvantage is that it does not adhere to walls and the Lines pattern.
The final setting parameter is the Infill overlap percentage. Infill overlap percentage is the amount of overlap between infill and walls in millimeters. Essentially, an infill overlap value greater than zero creates an area where the infill and walls overlap. By setting the infill overlap to 0.2 millimeters, the infill will overlap the wall by 0.2 millimeters, creating a region where the wall and infill are on top. On the other hand, the percentage value of the infill overlap also allows the overlap between the infill and walls to be adjusted, like the parametric adjustment of the infill overlap but with a percentage value. For example, if the fill overlap percentage is 50%, the fill will cover 50% of the walls. Higher values will increase the strength of the bond between the infill and the walls, but an improvement in this property will sometimes result in a loss of aesthetic quality. The higher the overlap value, the larger the area where the walls and infill fuse, which is expected to result in a much stronger bond between infill and walls. However, if a large amount of plastic gathers in the same area, excessive extrusion will occur, which can affect the aesthetic quality of the model.
2.4. Metal Plates (Sheets)
In this research, DX53D steel with a thickness of 0.8 mm and aluminum sheet with a thickness of 2.5 mm were used, which are also used in the body construction. Most of the tests were carried out with DX53D.
Table 4 shows the characteristic composition of the steel material.
Table 5 shows the composition of the aluminum content. The 2.5 mm material is supplied in several hardness grades, and the soft H0 condition was used in the research.
The aluminum plate material is relatively thick; it is 2.5 mm. These plates (sheets) were only used for the load tests. The final tool wear test was carried out using only the steel plates (sheets).
2.5. Erichsen Cupping Test
For this research, the printed punches must be plate formed, for which the Erichsen test is used. This method was chosen because it is simple and fast, and the active tool element is of simple construction, making it easy to press. The test and the applied tools comply with ISO 20482:2013 Metallic materials—Sheet and strip—Erichsen cupping test [
52]. The measurement is made on a hydraulic Erichsen cupping machine with a 33 mm diameter test punch (hemispherical end and rounded, 55–65 HRC tool steel according to the standard) with a fixed binder. During the fix binder process, the matrix and fixed binder device must be pressed together so that the specimen plate cannot slip between them and the material can only elongate. The test lasts until the first crack appears. At the end of the process, the crack-induced punch displacement is recorded.
2.6. The Applied DIC System and the GOM ATOS
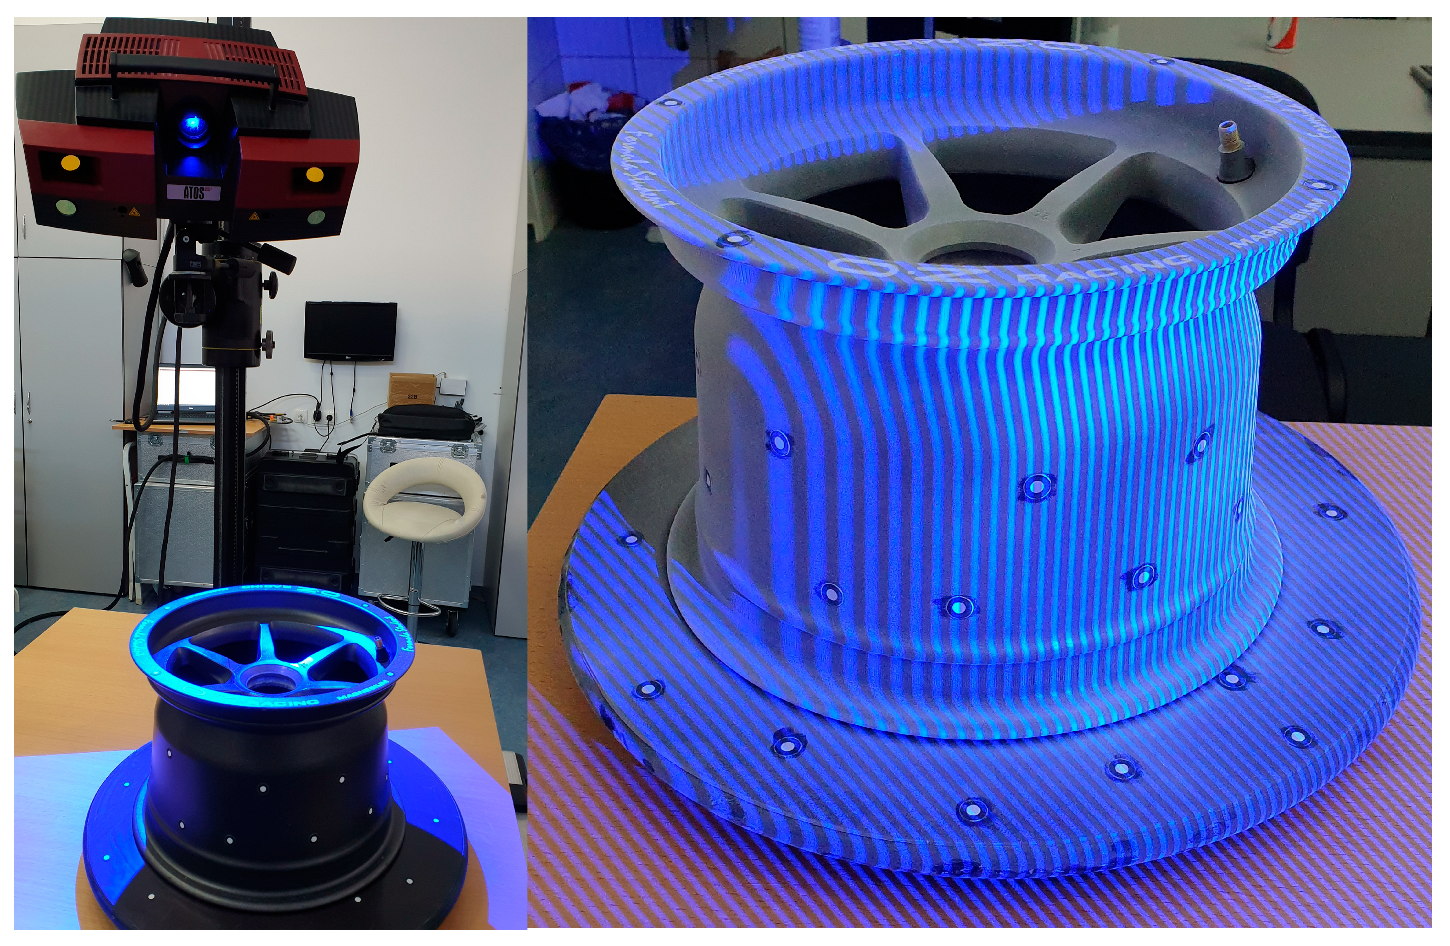
The research was carried out using a GOM ATOS TripleScan II high-accuracy industrial optical 3D scanner (see
Figure 4). ATOS systems are widely employed in various industries, with a wide range of measurement ranges available, allowing measurements to be made on everything from a complete aircraft to small electronic components. Measuring the entire surface of the part, the two-axis sensor captures a dense point cloud or polygon mesh that accurately describes the geometry of the object, indicating invisible defects, making production faster and more efficient. The projector unit projects a pattern of stripes (Gray-code based) of different widths and light intensities onto the object to be immersed, whereby the CCD detects the phase-shifted sinusoidal light intensity variation reflected from the object. These patterns are recorded by two cameras. The instrument uses the heterodyne light interference principle, with multiple phase shifts for maximum sub-pixel accuracy. Based on the transformation equations of optical imaging, the computer automatically calculates the 3D coordinates of each camera pixel with high accuracy in a few seconds. In order to digitize the entire surface of an object, several independent measurements from different views are required. As both the cameras and the projector are calibrated, 3D surface points can be triangulated from any two of the three different views of the three different units. The projection unit uses low-frequency blue light, which helps to eliminate interfering ambient light effects. The system has a resolution of 0.01 mm, and the measurement accuracy depends on the measurement range. The cameras are 5, 8, and 12 megapixels and are industrial-grade measuring lenses. The measuring distance can be varied between 0.49 and 2 m. The size of the area that can be scanned at one time can be varied from 38 × 29 mm to 2000 × 1500 mm, also depending on the measuring range. In general, micron accuracy can be achieved for small products, while the accuracy of a few tenths of a micron can be achieved for large measuring pieces.
3. Results and Discussion
In the results section, the results of the tests described in the measurement procedures are presented. For each test, printing strategies or PLA materials that performed well or poorly in the test are highlighted. DIC measurement results of tool wear processes are also included in this section.
3.1. Printing Strategies
For the measurements, first, the printing strategies, i.e., the print settings, had to be examined. In this phase, the setup parameter set was determined to achieve the optimal forming punches.
The model, called Test 1, is a punch with a radius of 5.5 mm, for which two different filling patterns were selected. In the first step, the filling density of both patterns was left at the default setting and then increased to 60%. Then the Infill Density was reset to the default setting, and the number of walls was increased.
Table 6 shows that the number of top layers was also increased as this will form the surface. It provides a harder outer surface. The height of the layers was set as fine as possible to ensure good surface quality. For these settings, the test criteria were to see how each basic configuration would affect the stability of the punch structure. The settings used for the Test 2 model were the same as in Test 1, except the radius of the punch was 16.5 mm.
Figure 5 shows the settings for the Test 1 punch. The image shows a cross section of the print image arranged in the slicer software.
Figure 6 shows the settings for the Test 2 punch. The punch family differs from the Test 1 family only in the size of the radius.
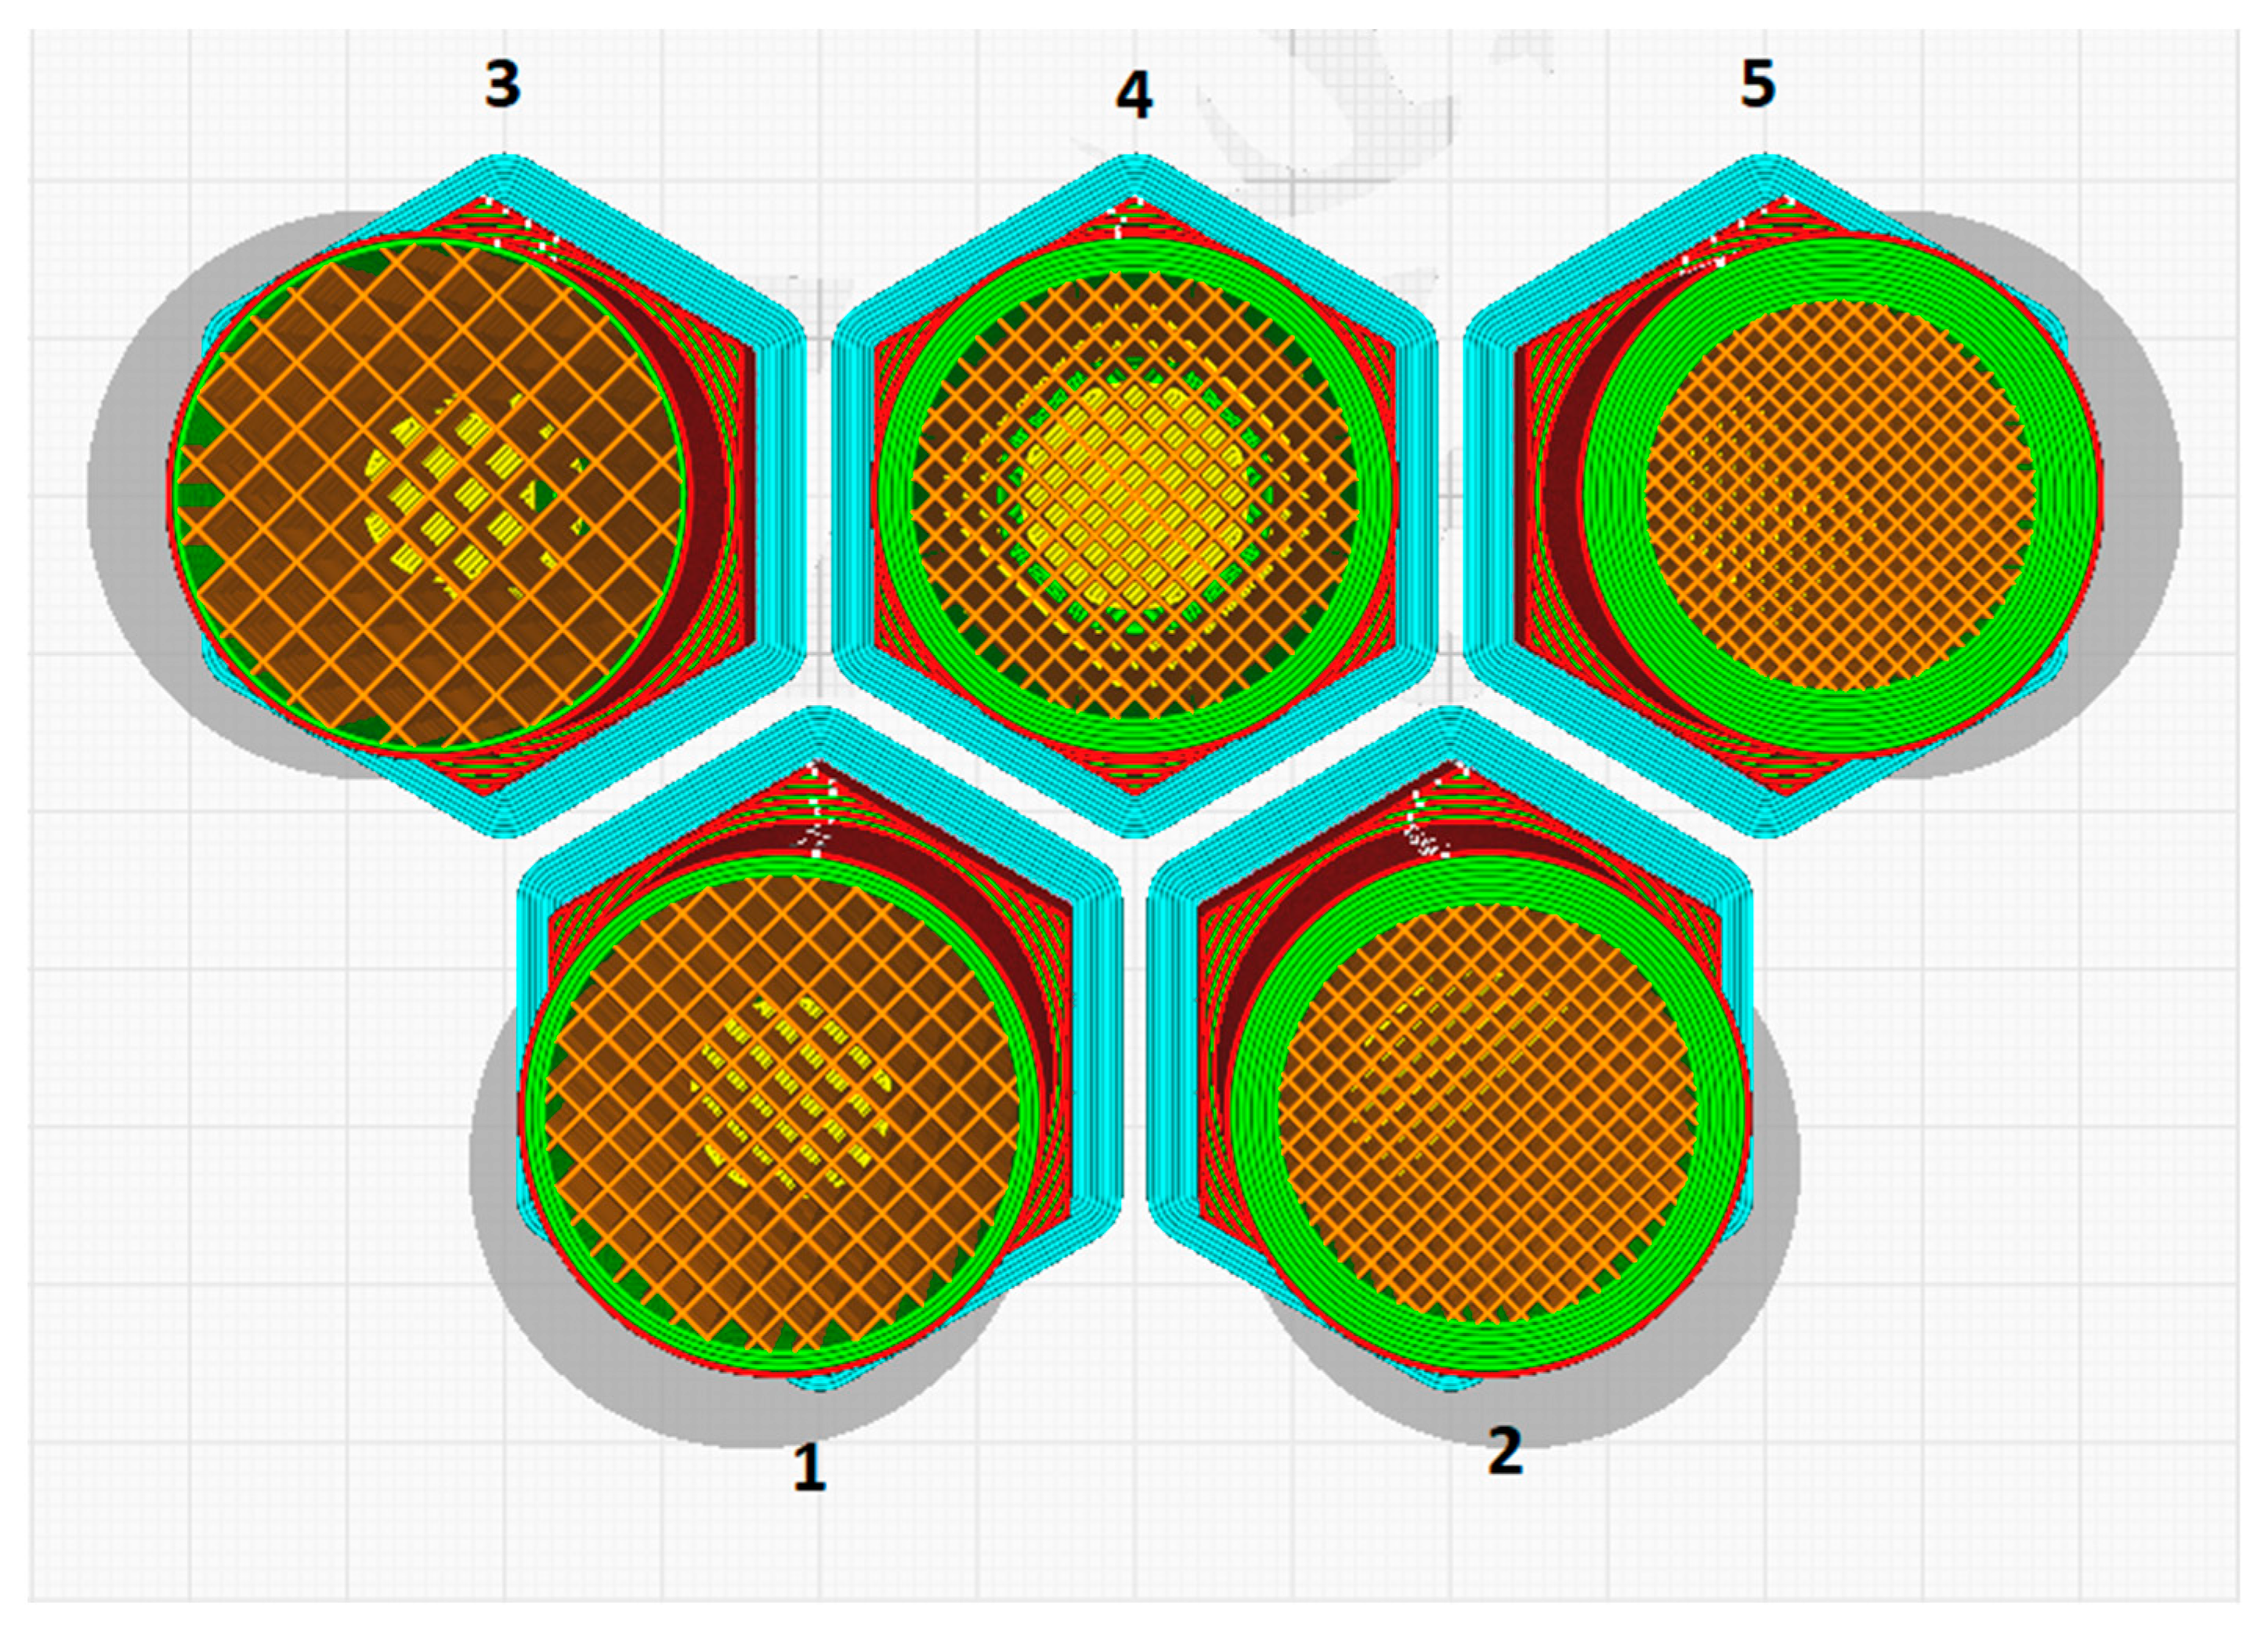
The Test 3 model is a smaller punch with a 15 mm radius, where the main idea was to investigate the effect of increasing the number of walls and the filling density of the tool at the same time. As can be seen in
Table 7, in addition to the continuously increasing Infill Density and Wall Line, the top and bottom layers were also continuously increased. For the first mold, a small number of walls were set at a low percentage infill density and then gradually increased up to a print with the densest infill. The punch settings of Test 3 can be seen in
Figure 7.
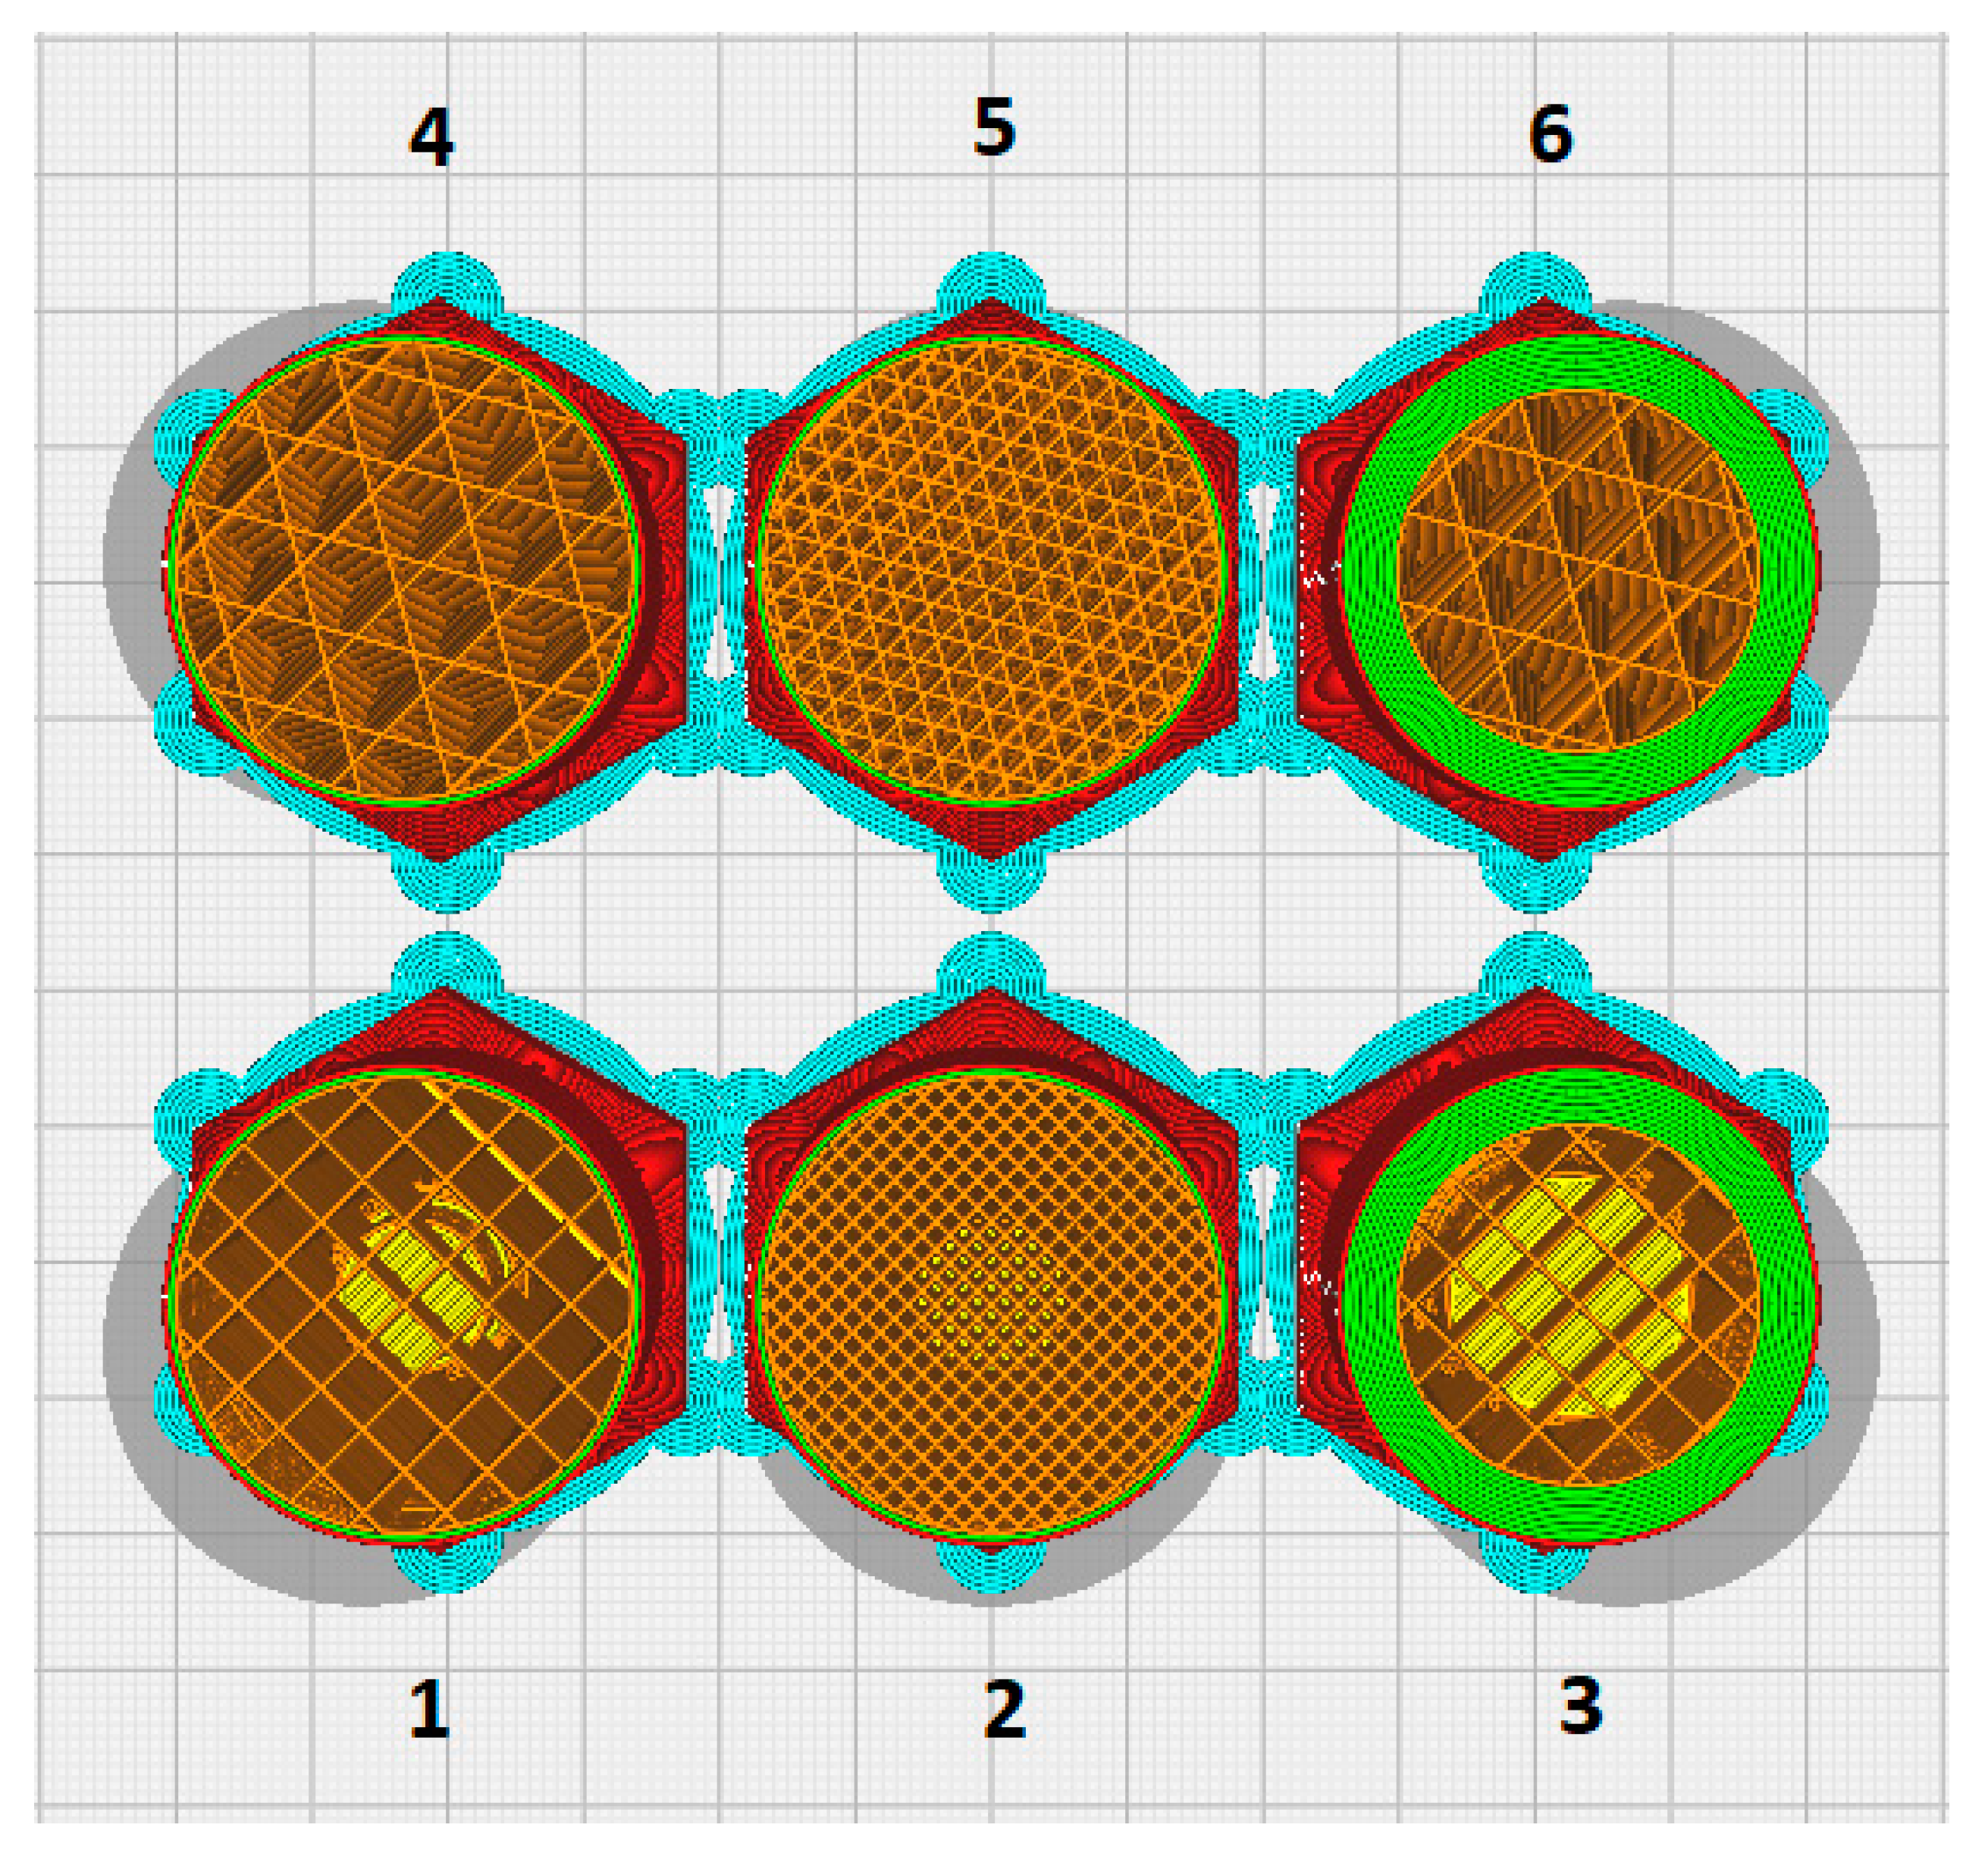
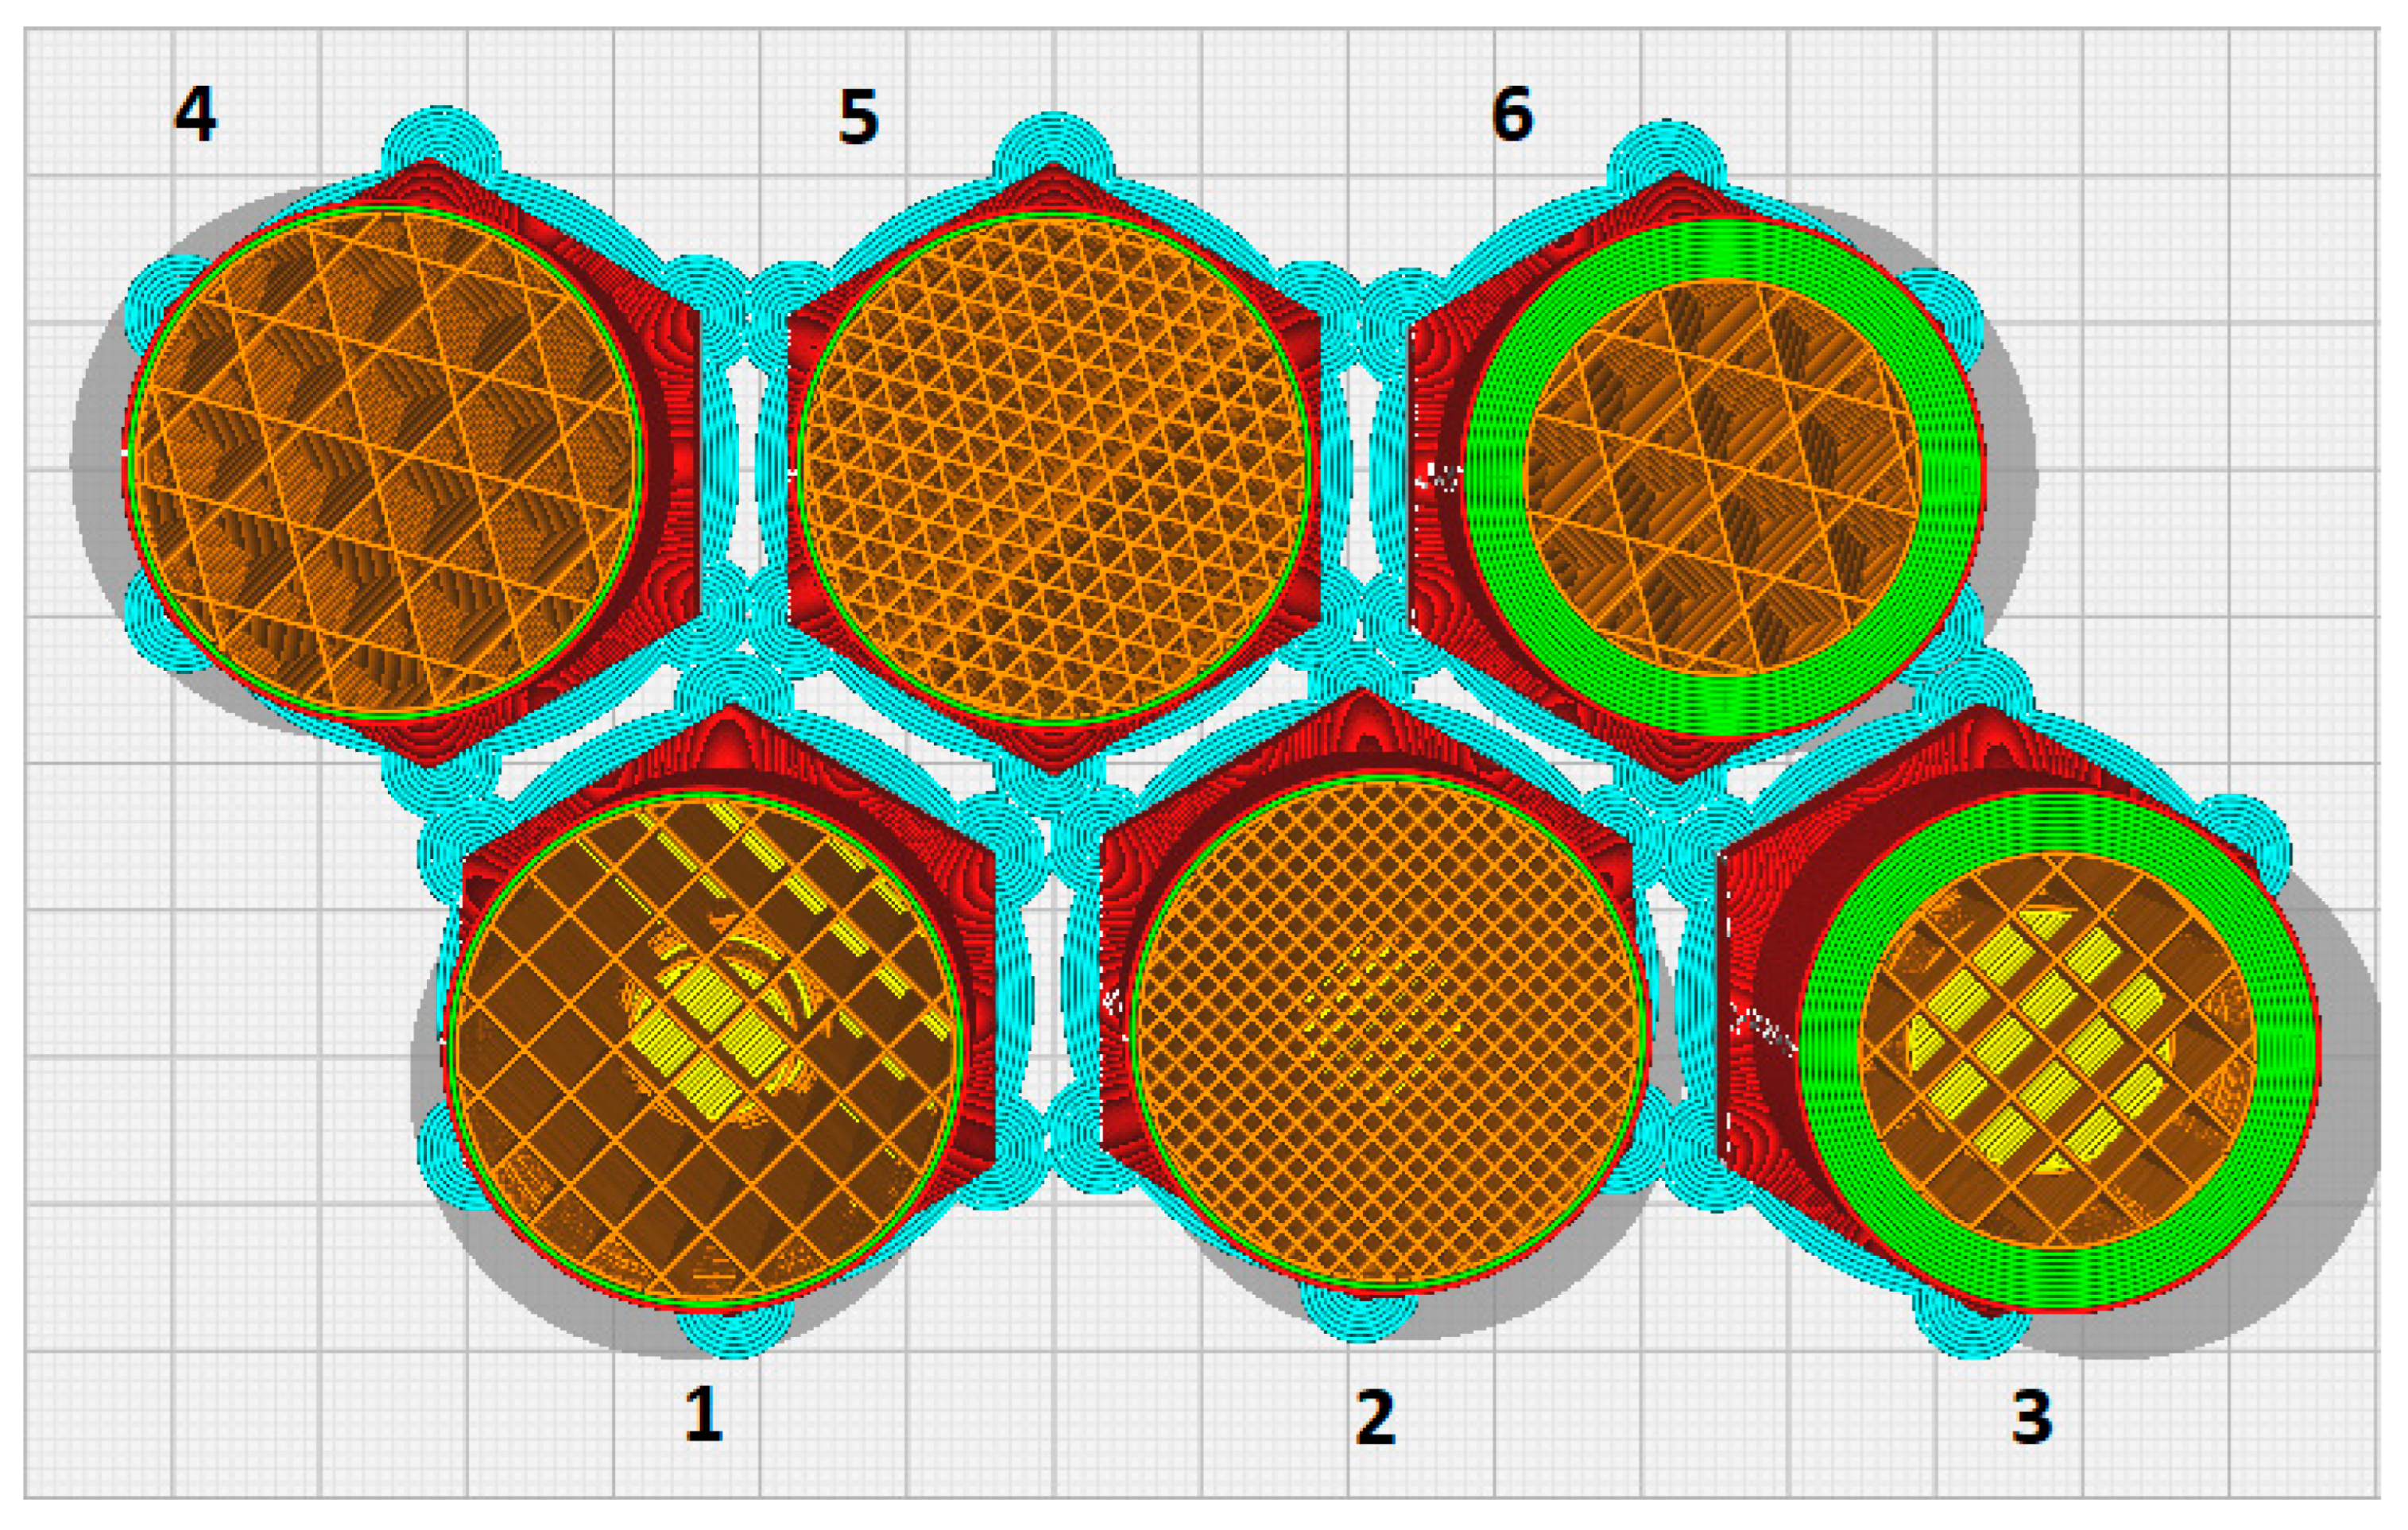
The Test 4 punch printing settings were optimized based on the tests carried out beforehand. Since structural stability is also a key consideration, three filling patterns were selected that had the most stable structure in the vertical direction. In addition to the infill pattern, the infill density and the number of printed walls were also changed. The Top Layer pattern was changed to Zig Zag for a better quality of the finished surface, and the infill overlap was also set to 50% to improve the internal infill adhesion to the walls, thus increasing the punch strength. The number of top layers was increased to 40 to increase the thickness of the surface exposed to abrasion. A total of 5 punches from this series were designed and printed. Four with a radius of 16.5 mm and one with a radius of 5.5 mm. The settings are the same for each model, but here, as can be seen from
Table 8,
Table 9 and
Table 10, the different materials from which these punches were printed were taken into account.
The last Test 4—S punch is made of a special PLA, also made by Filaticum (see
Table 11). The main feature of this filament is that its structure is reinforced with glass beads, which makes it possible to produce a tool that is even more resistant to external forces. Another special feature, apart from its structure, is that this type of filament allows faster than average printing speeds; hence, the name Speed.
However, the disadvantage of the filament used in Test 4—S was that the nature of the test material made it difficult to set up the print accurately, and the resultant surface quality was not as good as expected. There were grooves on the upper part, which will be observed in the pictures in the evaluation section. The settings are the same as the other Test 4 settings, with the difference being that a higher print temperature and higher print speed were applied. In addition, the Top and Bottom Layers were doubled to provide an even stronger and more wear-resistant top layer.
After adjusting the various printing parameters, the 3D-printed deep drawing punches were made, with two sets of each punch being printed. This was necessary because, in order to speed up the measurement and research process, it was first determined which punch printed with which print setting was suitable for deep drawing a minimum of 100 parts. After evaluating the results of this study, the dies that meet the minimum number of pieces will be measured by DIC.
Table 12 summarizes the die variations that either wear below the tolerance or deform or break under pressure after a certain number of parts.
In conclusion, the printed punches that failed to form more than ten steel plates all had less than ten sidewalls. The punches that were printed with ten sidewalls, on the other hand, had a lower filling density value, so this could be the reason for the premature amortization. There were also punches that had both the number of sidewalls and the fill density set higher but still did not reach the 10-piece draw. In this case, the problem is the thickness of the Top layer. In punches with this setting, the punch appears to be deformed where the sidewall meets the last layer of the top segment.
Some punches were printed with the same parameters, but it is noticeable that punches designed with a larger radius achieved a lower number of stripped sheets than their counterparts designed with a smaller radius. Tools with larger radii deformed sooner. The problem here is both the design of the tool and, again, the number of Top layers. While the design of the Test 1 punch, for example, allowed the top layers to lie nicely on the side walls, thus reducing the load on the top, the design of the Test 2 punch did not allow this due to the progressively decreasing top layers, and the top of these punch wrinkled as a result.
When looking at the filling pattern, it is noticeable that the Grid pattern deep draw punches perform slightly better than the Cubic pattern punches, but the difference between the two patterns is minimal. Overall, punches that made it past ten plates, but did not reach 100 plates deep drawn, all had deformation of the forming surface, while tools with less than ten plates had fractures in the punch body.
After printing, no post-treatment was applied because the purpose of the test was for usability and not for friction or formability tests.
3.2. Results of DIC Measurements
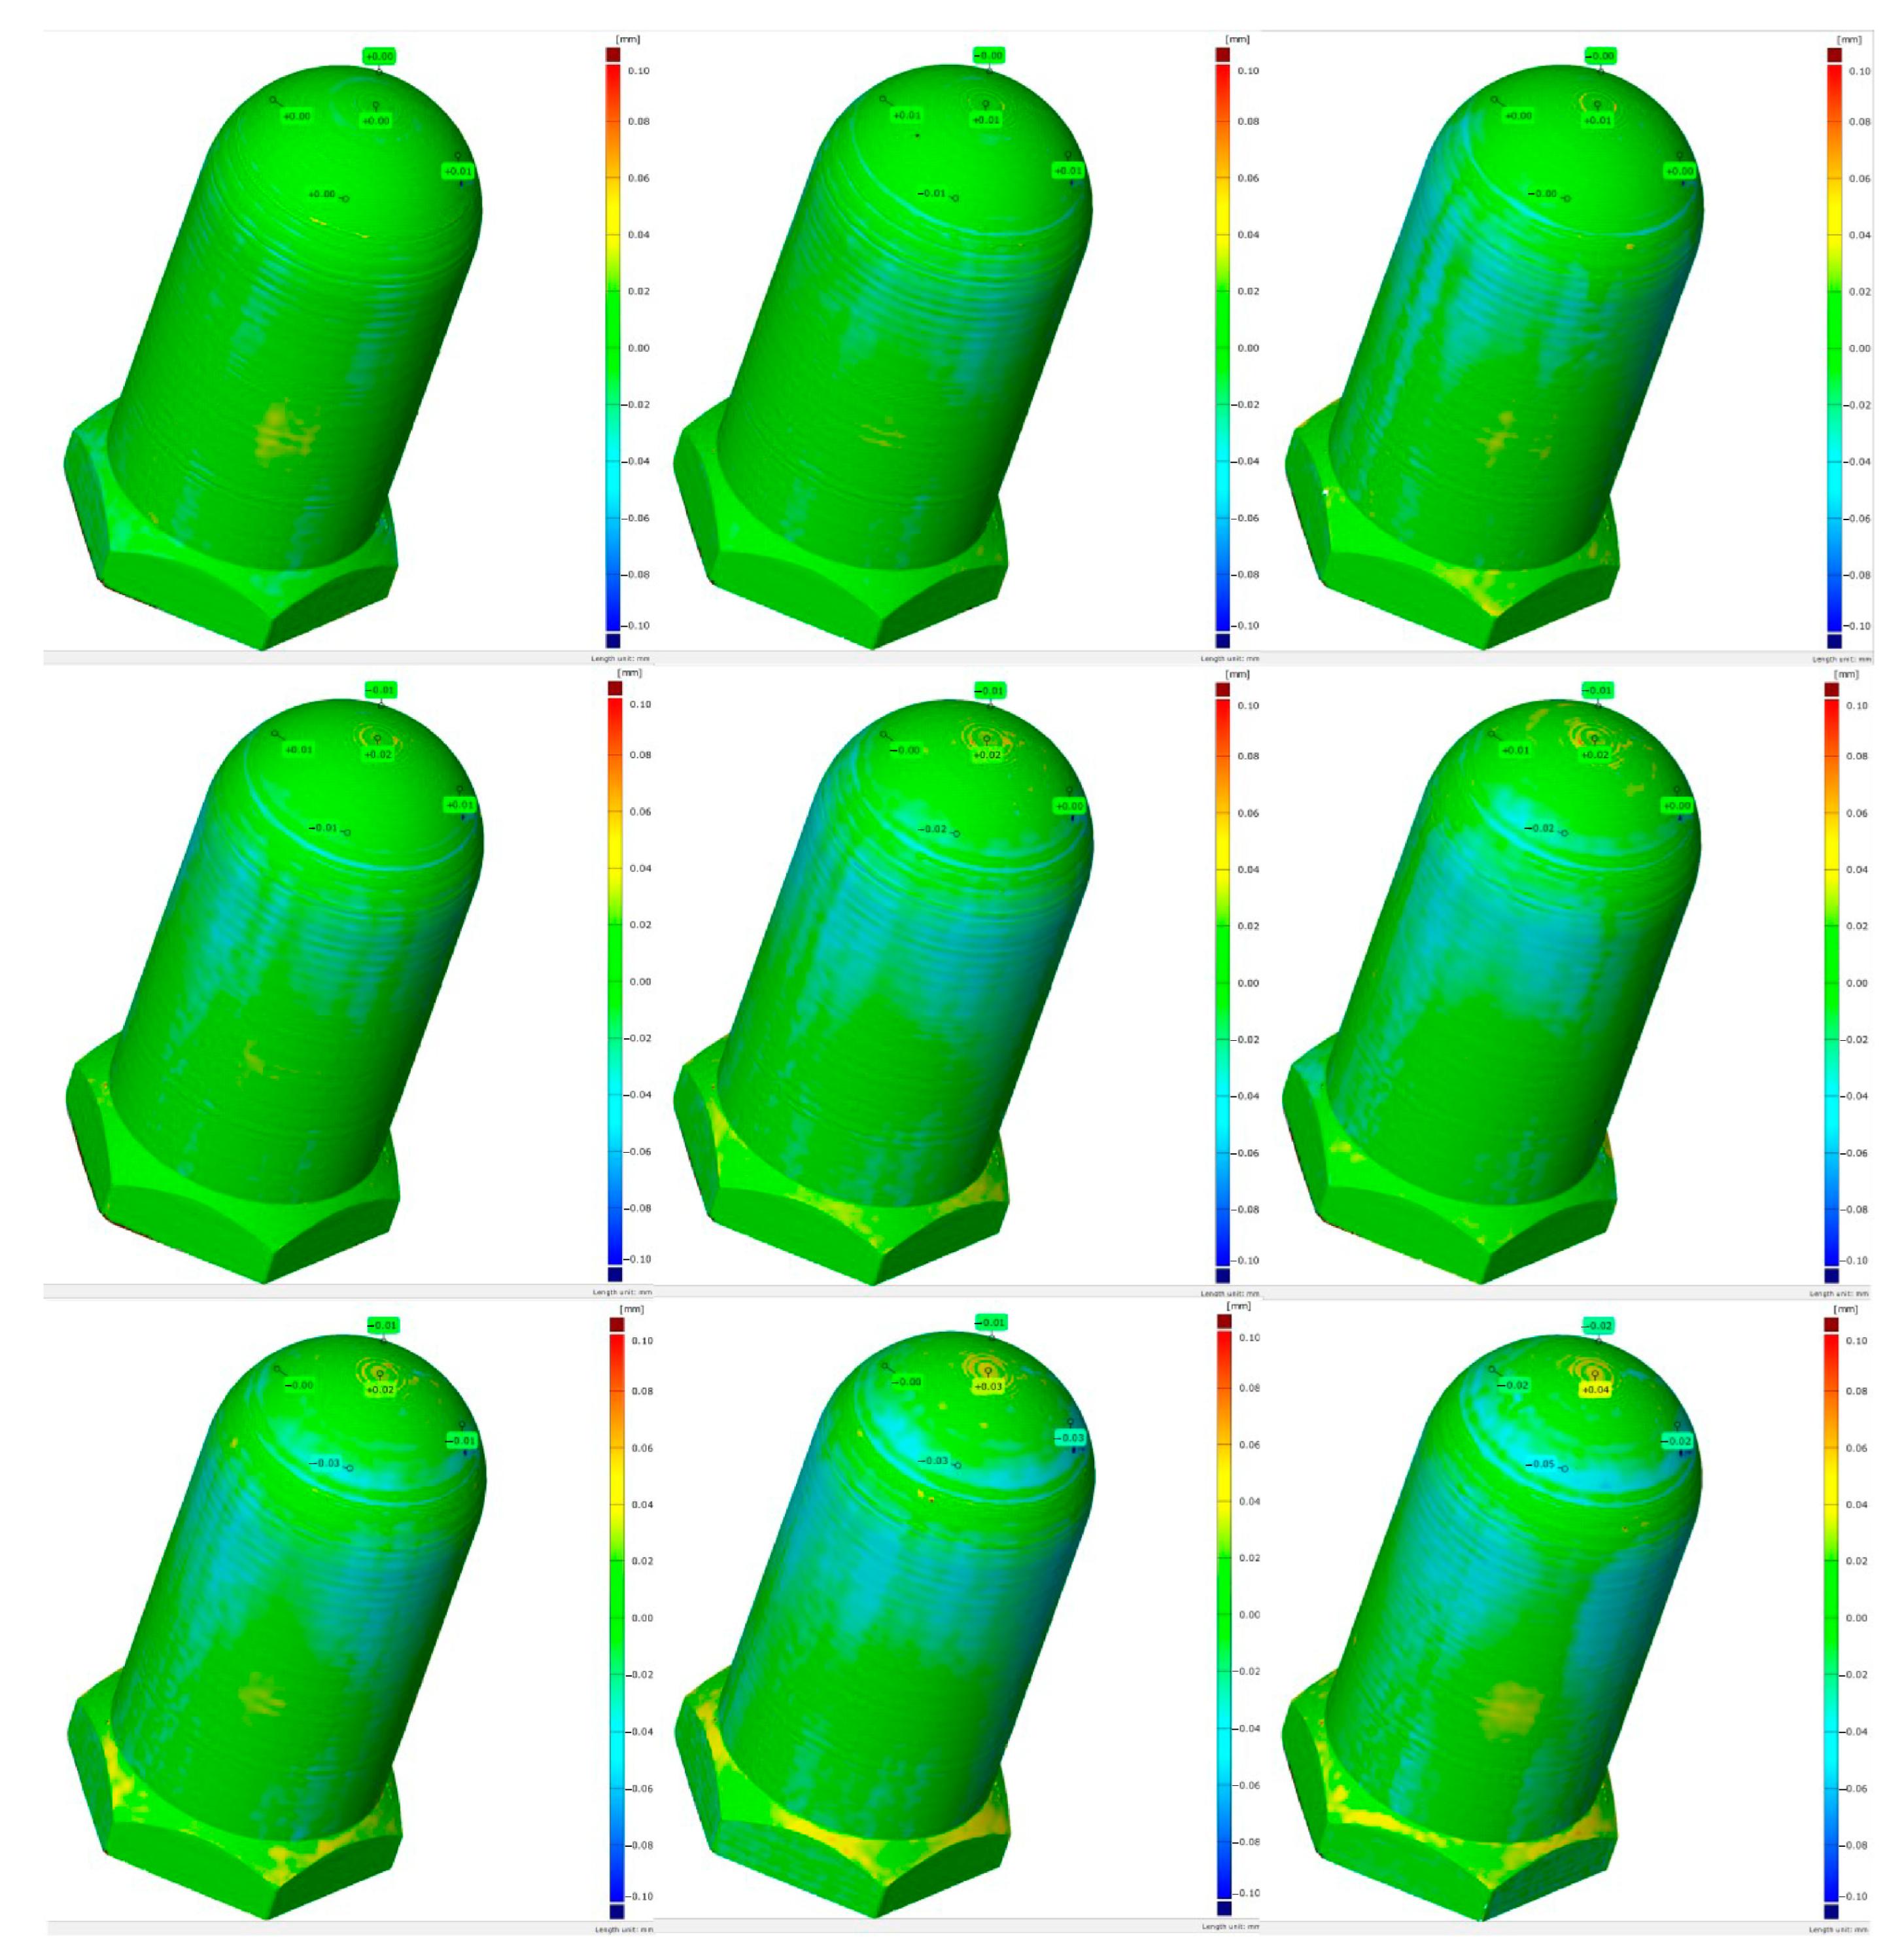
In this section, we will further discuss the punch that passed the test in the previous section, i.e., reached the minimum of 100 punches. For the measurements, the GOM ATOS TripleScan system was used, and the punches were measured after 0, 5, 10, 15, 20, 30, 40, 60, 80, and 100 plates were deep drawn. The measurement events were stitched together, and then the wear was measured at the peak of the stamp at one of four measurement points (MP1, MP2, MP3, MP4, or MP5) evenly distributed over the radius. The pre-established tolerance was +/−0.2 mm; i.e., if the punch reached this, the measurement series should be stopped. A color-coded analysis of the measurement results was also performed (
Figure 8), which, although impressive, is difficult to understand, so the results of the measurements are presented in tabular form in this research.
Research was carried out to determine how much the heat generated by the forming process affected the wear of the punch.
A special feature of the Test 3_4 punches is that they are made with a 30 mm radius (see
Figure 9). As can be seen from
Table 13, significant wear started after the 20 series, from plate 40 onwards. Until then, significant wear was only visible at the tip of the punch. (The DI values are related to the MPs.) From plate 40 onwards, measurements were taken after every 20th plate had been peeled off, and it can be observed that the heat generated by the forming process accelerated the wear. The peak wear visible from the beginning is due to a printing defect, which was pressed into the same level as the other layers by the forming process and was therefore detected as wear by the measuring instrument from the beginning.
The Test 3_5 punch is the other punch designed with a 30 mm radius (see
Figure 10).
Table 14 shows exactly that the tool wear is minimal up to the first 30 formations. Here, too, wear starts after the 40th plate, and then the forming surface of the tool wears gradually until the 100th steel plate. The red spot at the top of the model is a measurement error. On visual inspection of the print, no bulges are visible on the current part. A minor printing defect is also observed at Test 3_5. Printing is set so that the printer always starts the new layers at a specific point. This created a clearly visible band on the side of the stamp, which the meter detected as significant wear after the 100th forming.
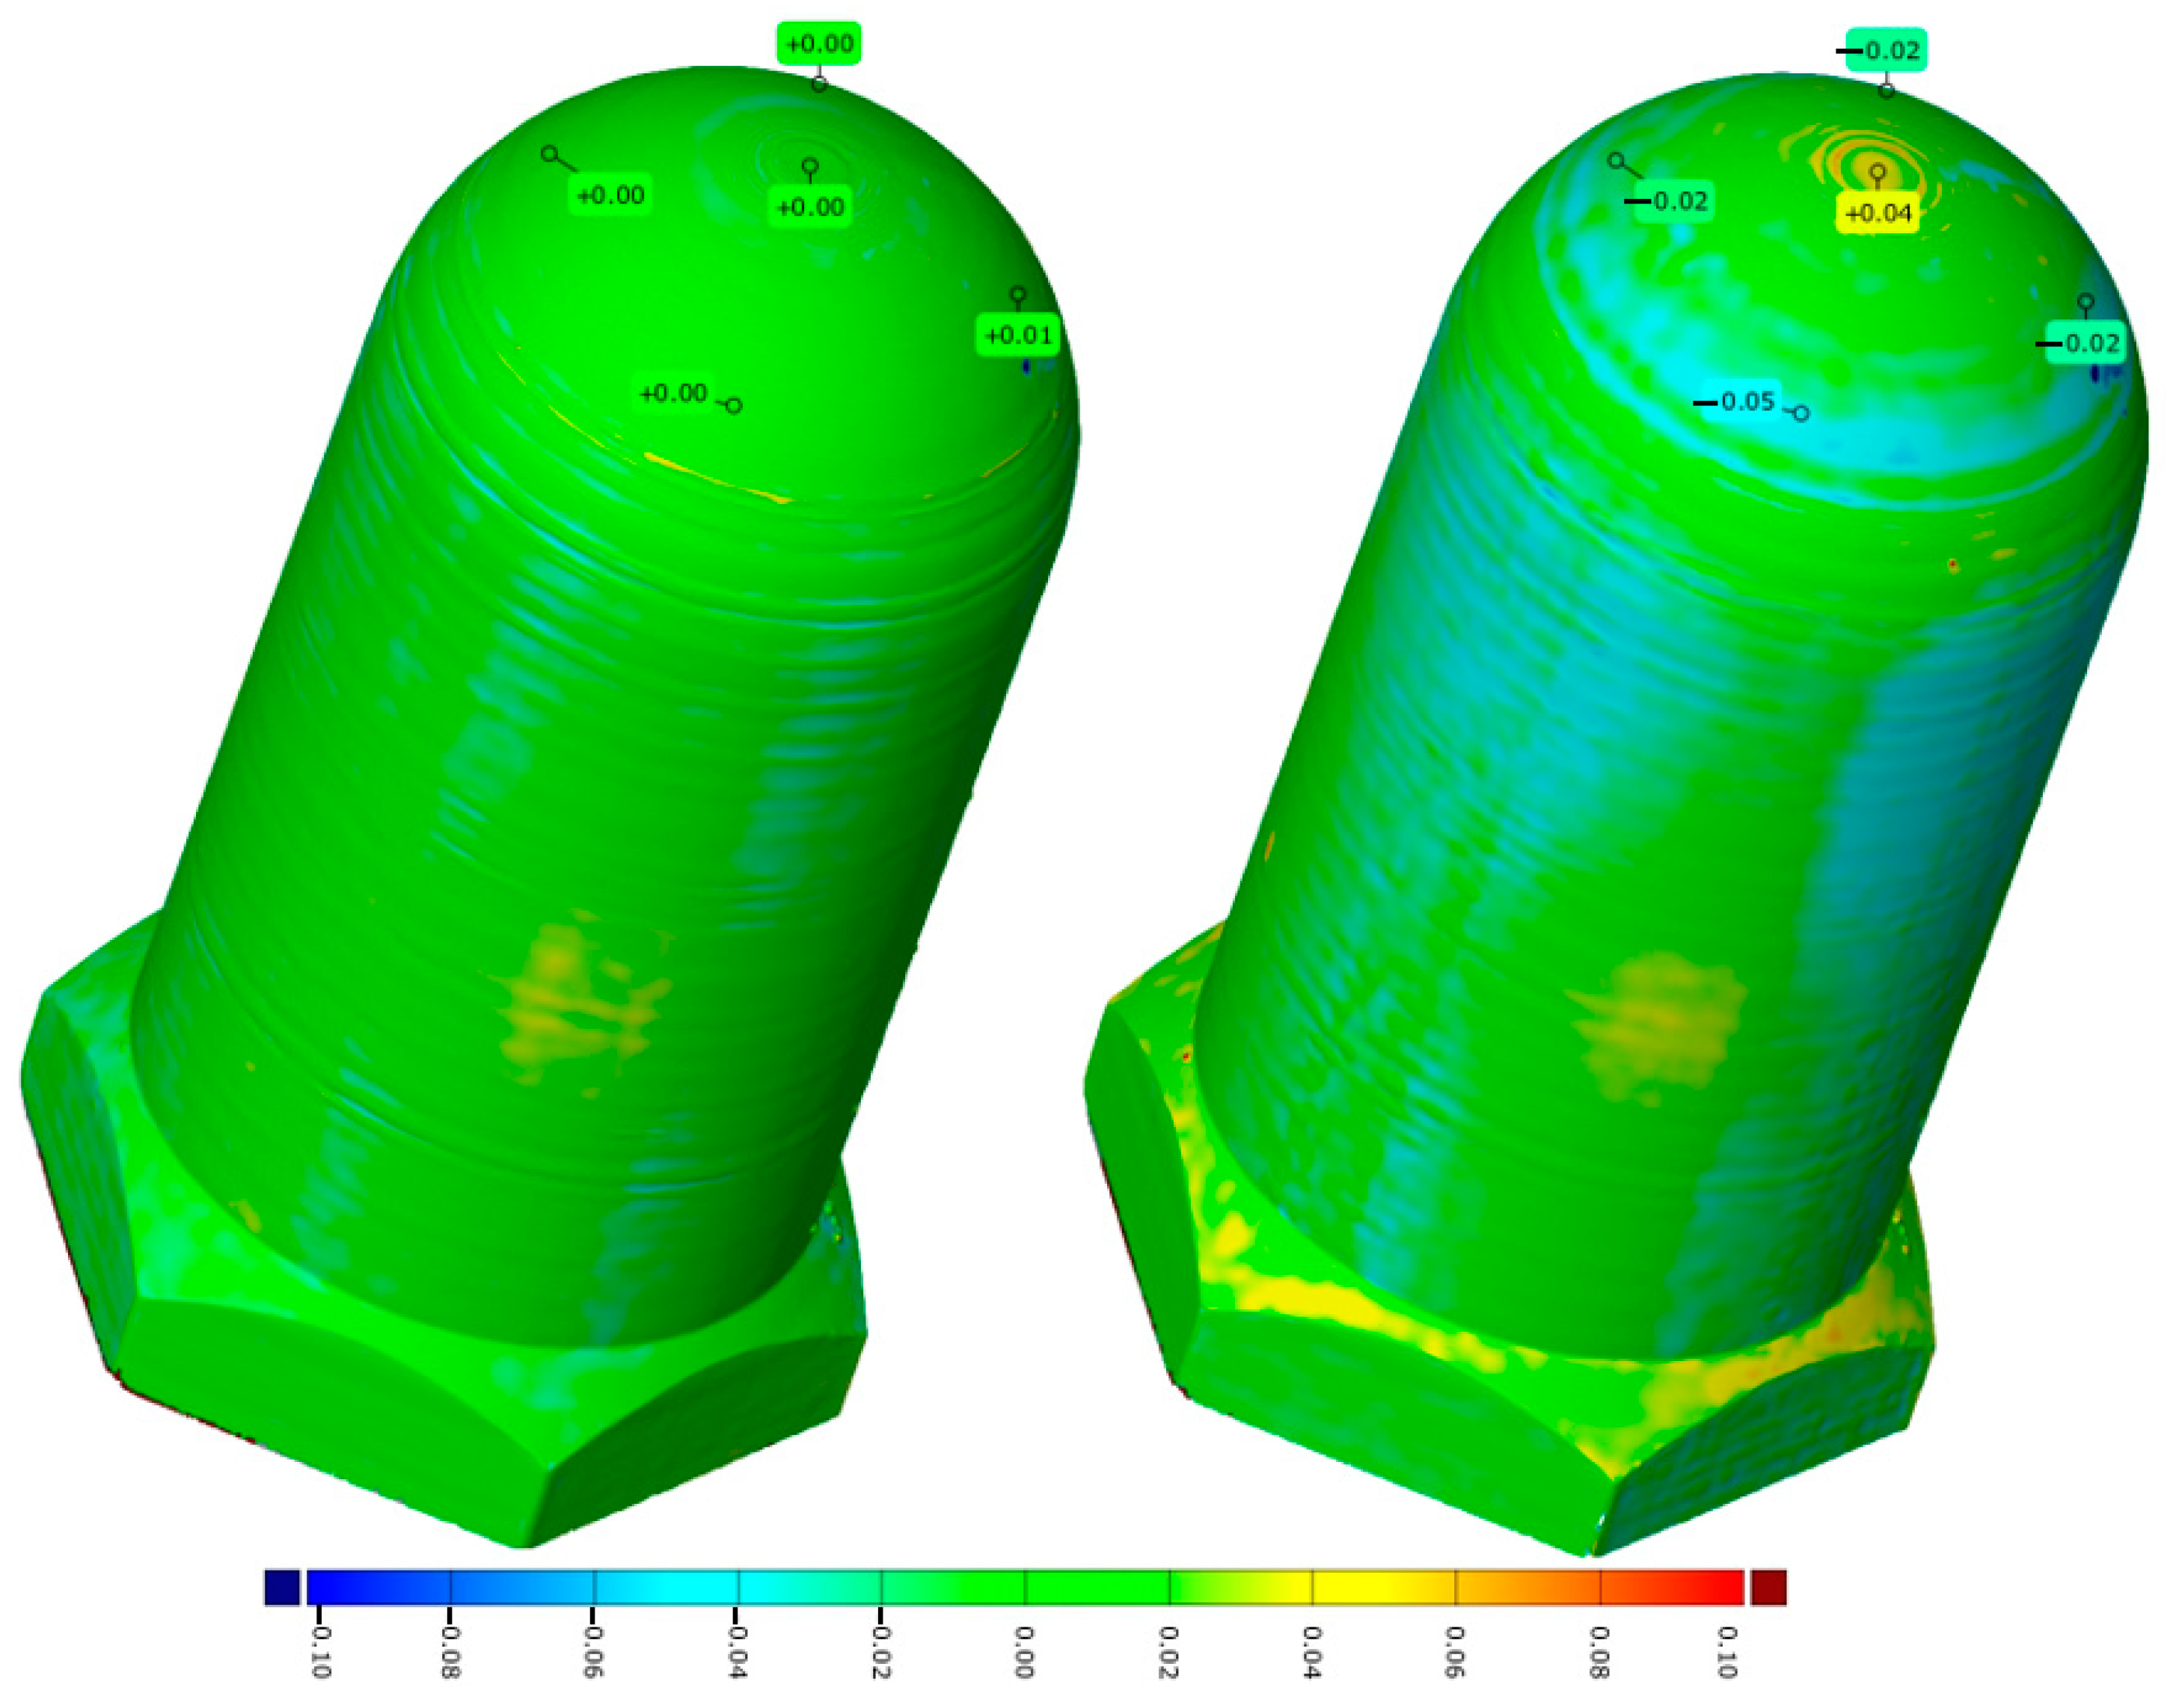
Test 4_AP_1 is one of the punches made of high-strength, heat-resistant PLA filament manufactured by Filaticum (see
Figure 11 and
Table 15). The tool wear here is less drastic than in the case of Test 3_4, or Test 3_5 presented previously. It can be said that the tool wears almost linearly. By the time the 100th forming is reached, wear is only visible in the area where the punch has broken through the plate. Due to the properties of the filament, the outer surface of the model is uniform and beautiful, so no printing errors hindered the accuracy of the measurement, but due to the design of the punch, measurement errors are still visible on the punch body.
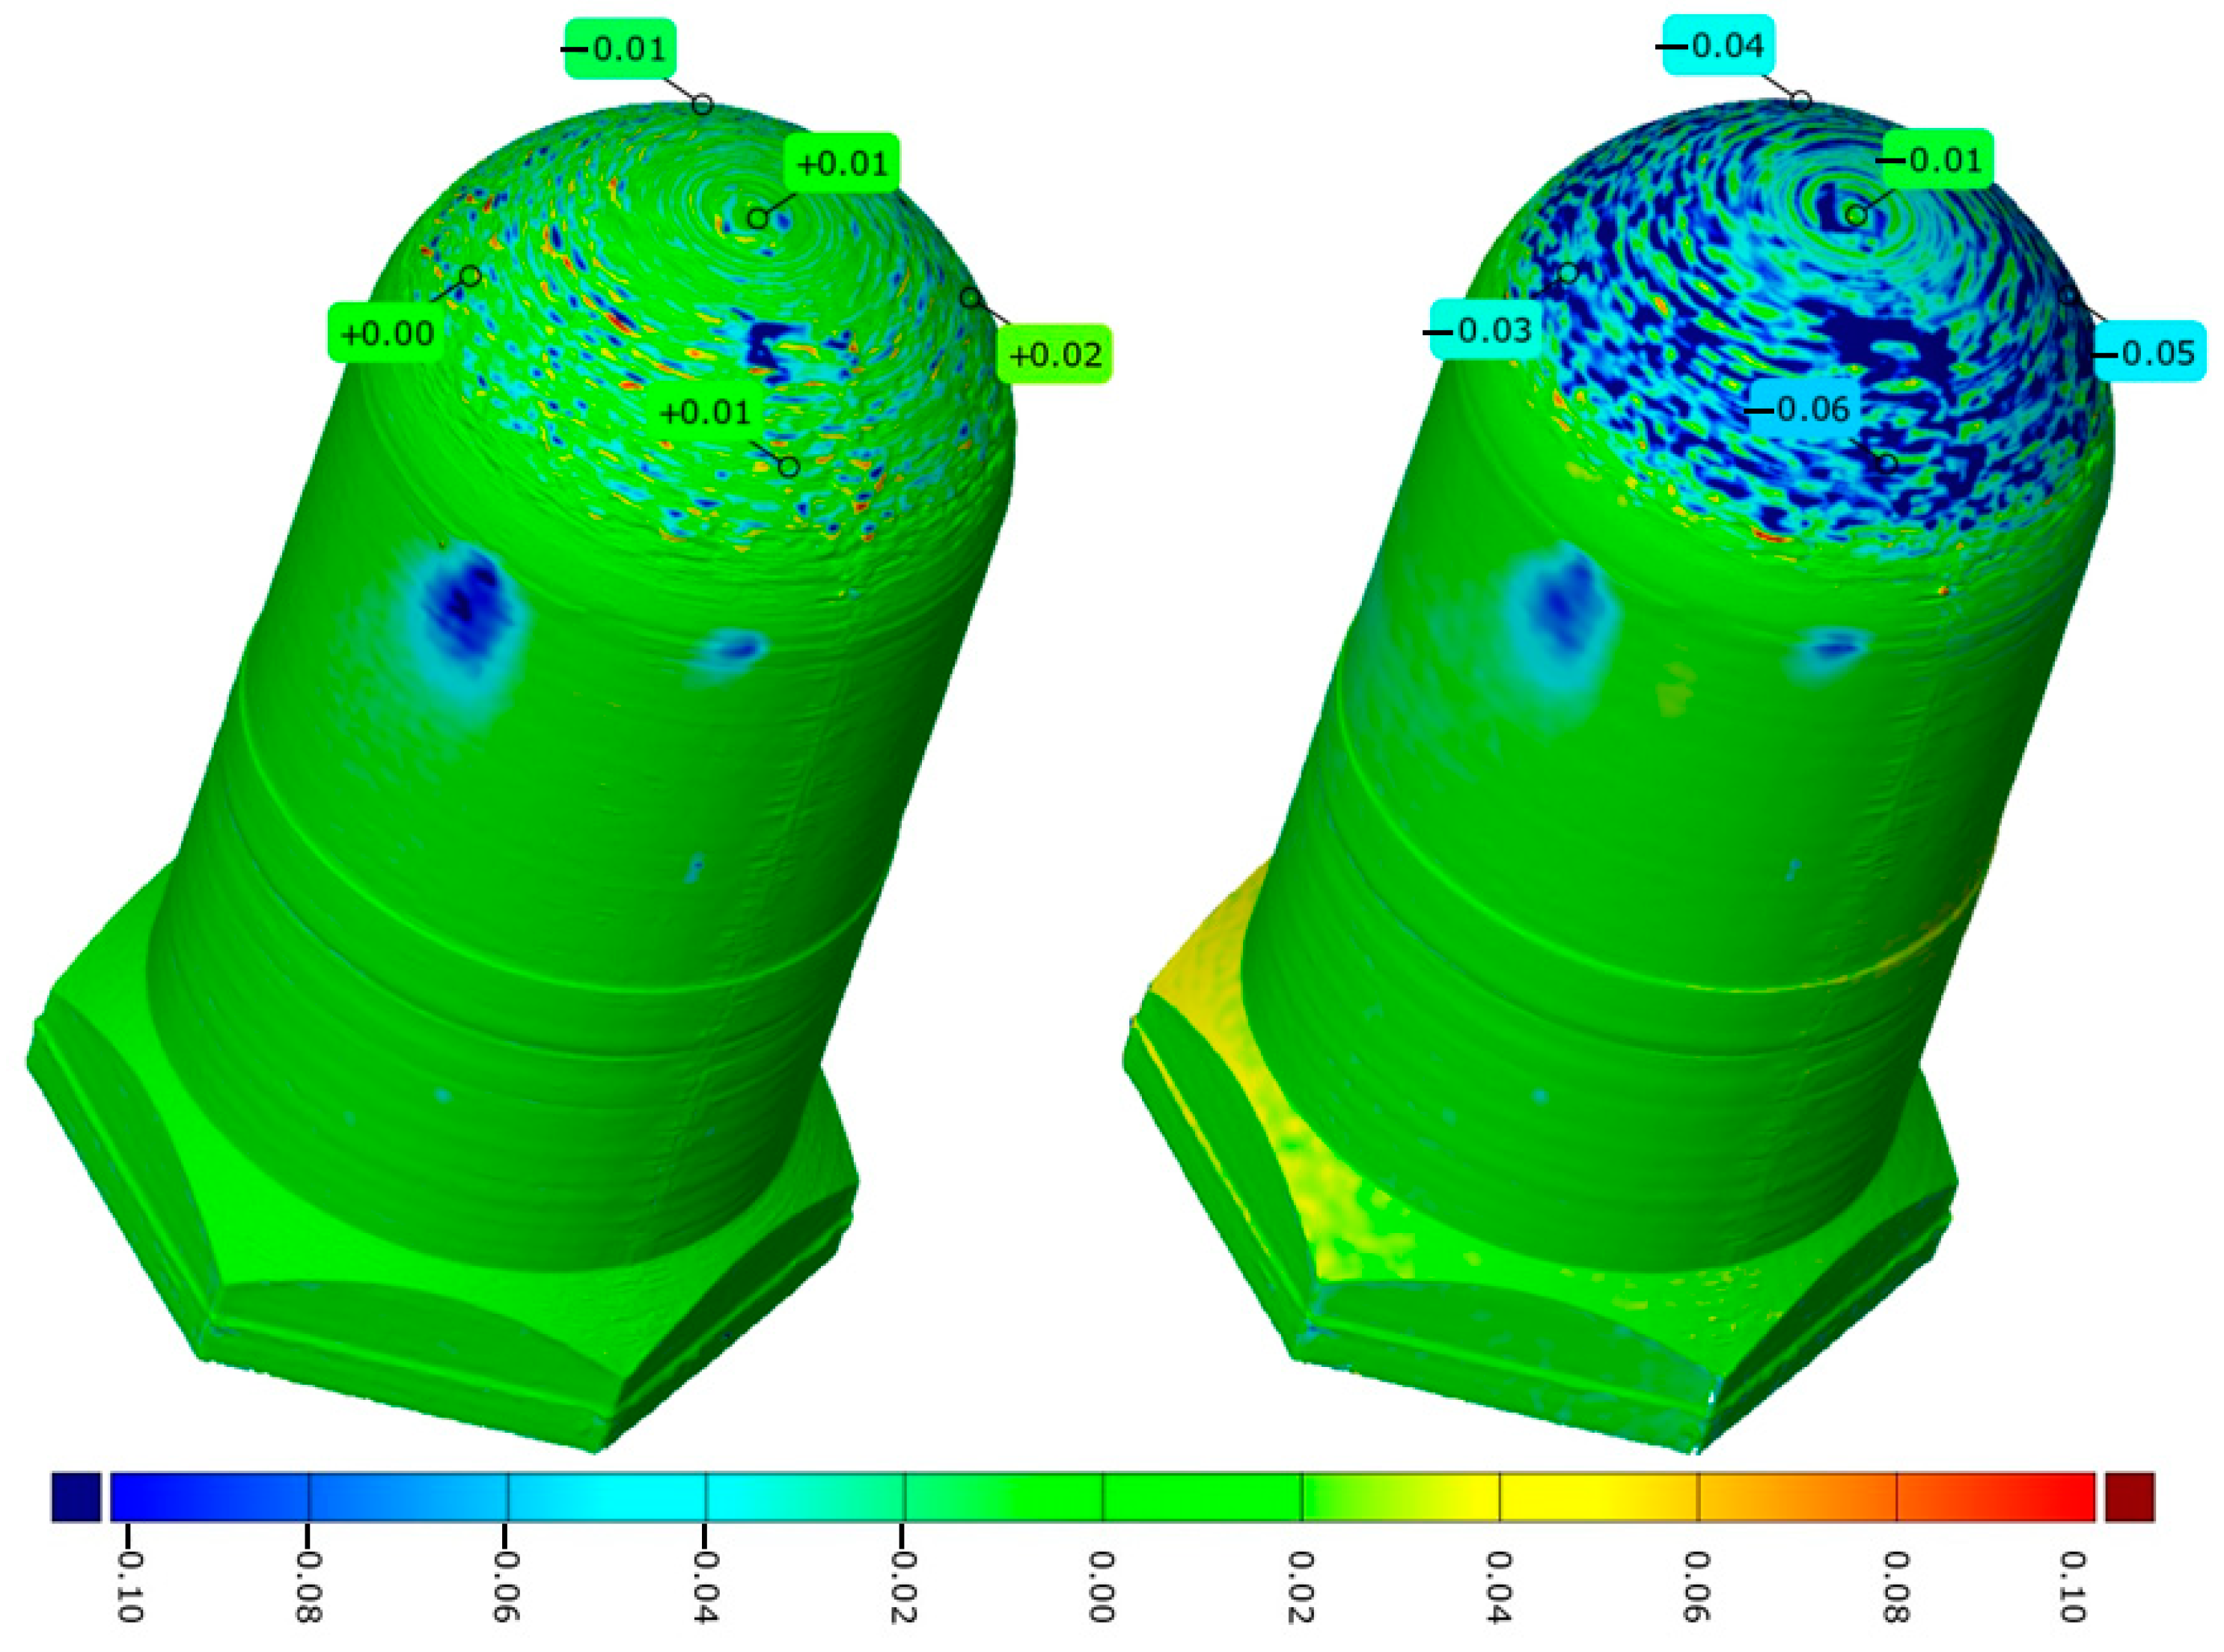
For the Test 4_AP_3 punch (see
Figure 12), the already-known results are shown in
Table 16. Significant wear is also expected to be detected, as before, from punch 40 onwards, from which point the wear increases gradually, one-hundredth of a millimeter at a time, until punch 100. Examining the printing parameters of the Test 4_AP series, it can be seen that although each model was printed with a different filling pattern but with a uniform filling and wall thickness, the results are similar. This suggests that some settings above a certain level no longer affect the structural stability of the part. To use a precise example, this means that further increases in fill density to 70% will not make any significant difference to the punch structure.
The special feature of the Testbull Engineering (Test_4_FE) series is that the PLA type used for printing has been developed specifically for industrial use (see
Figure 13 and
Table 17), which means that it is extremely heat stable. The wear rate on this punch is as expected, but it can be observed that while on previous punches, the wear accelerates after the 40th forming, there is no sign of this on this stamp. Slight shrinkage is noticeable at the die wall, which is about 0.04 mm when read from the color map. This amount of sidewall shrinkage has no effect on the actual height of the forming punch.
Test 4_S is made of test filament not yet commercially available from Filaticum (see
Figure 14 and
Table 18), reinforced with glass beads to achieve a more stable structure. Its advantages and disadvantages are shown in the table and picture above. It can be seen that wear only started on the last 20 pieces. The plates formed before then showed little or no wear on the punch. A closer look at
Figure 14 shows that the print quality is uneven in the forming section. Consequently, it can be seen in
Figure 14 that there appears to be more than a tenth of a millimeter of wear, but these have only worn back to the forming level. From the results, you can see which settings should be used to suppress the following research, and which settings should not be used.


 ,
, 


