Article

Exploiting Surrogate Safety Measures and Road Design Characteristics towards Crash Investigations in Motorway Segments

by
Dimitrios Nikolaou
1,*,
Anastasios Dragomanovits
1,
Apostolos Ziakopoulos
1,
Aikaterini Deliali
1,
Ioannis Handanos
2,
Christos Karadimas
2,
George Kostoulas
3,
Eleni Konstantina Frantzola
3 and
George Yannis
1
1
Department of Transportation Planning and Engineering, National Technical University of Athens, 5 Heroon Polytechniou Str., GR-15773 Athens, Greece
2
Olympia Odos Operation SA, GR-19100 Vlichada, Greece
3
OSeven, 27B Chaimanta Str., GR-15234 Chalandri, Greece
*
Author to whom correspondence should be addressed.
Infrastructures 2023, 8(3), 40; https://doi.org/10.3390/infrastructures8030040
Submission received: 30 January 2023 / Revised: 15 February 2023 / Accepted: 21 February 2023 / Published: 22 February 2023

Abstract

:
High quality data on road crashes, road design characteristics, and traffic are typically required to predict crash frequency. Surrogate Safety Measures (SSMs) are an alternative category of indicators that can be used in road safety analyses in order to quantify various unsafe traffic events. The objective of this research is to exploit road geometry data and SSMs toward various road crash investigations in motorway segments. To that end, for this analysis, a database containing data on injury and property-damage-only crashes, road design characteristics, and SSMs of 668 segments was compiled and utilized. The results of the developed negative binomial regression model revealed that crash frequency is positively correlated with the average annual daily traffic volume, the length of the segment, harsh accelerations, and harsh braking. Moreover, four distinct clusters representing crash risk levels of the examined segments emerged from the hierarchical clustering procedure, ranging from more risk-prone, potentially unsafe locations to more safe locations. These four clusters also formed the response variable classes of a random forest model. This classification model used various road geometry data and SSMs as predictors and achieved high classification performance for all classes, averaging more than 88% correct classification rates.

1. Introduction

Despite significant efforts and relevant progress in the improvement of road safety, road crashes remain a persistent major issue worldwide with enormous economic and social costs. According to the latest global road safety assessment of the World Health Organization, 1.35 million road users lose their lives because of road crashes annually, making them the eighth leading cause of death for citizens of all ages [1]. Substantial inequalities can be observed in road safety performance across the different world regions, with the lowest figures of fatalities per population being recorded in Europe [1]. Significant differences can be also found across the countries of the same regions which could be associated with various socioeconomic factors as well [2].
The European Commission (EC) has committed to improving the safety of the European road network. For that purpose, the EC had previously adopted the Road Safety Programme, which aimed to halve the number of road fatalities by 2020, compared to the 2010 level. However, this collective target was not met as the recorded fatalities reduction was equal to 37% [3]. Among the countries of the European Union (EU), Greece was the only country that achieved this target, with a performance of −54%. This significant decrease in road fatalities in Greece over the last decade could be attributed not only to the fact that Greece was affected by an ongoing economic major recession but also due to a considerable improvement of the main road network from 750 km of motorways in 2007 to 2200 km in 2018 [3]. However, in 2021, Greece was ranked 22nd among the 27 EU countries (57 road fatalities per million inhabitants), which is significantly higher than the EU average (44 road fatalities per million inhabitants) [4]. Consequently, it can be perceived that in order to effectively address this major issue of road crashes, concerted and continuous efforts are required.
However, budgets for road safety policies and actions are finite. Therefore, decision-makers and road safety stakeholders need to determine the optimal possible use of available funds. Regarding improvements in the existing road infrastructure, several quantitative methodologies have been developed over the years, to enhance evidence-based decision-making. These methodologies include crash analyses, inspections, assessment of the “in-built” safety of roads, etc. A frequently used and very detailed approach is offered through the application of Crash Prediction Models (CPMs), a practice well described in the AASHTO Highway Safety Manual (HSM) [5] and referred to as the HSM Predictive Method. Another alternative is a more economic prioritization of road safety interventions driven by estimates and monetization of their effectiveness resulting in cost-benefit ratios (e.g., [6]).
Nonetheless, such methodological approaches require high-quality data in order to predict crash frequency in specific road elements (e.g., segments, intersections, etc.) and produce reliable results. More specifically, the availability of detailed and actionable data on road crashes, infrastructure geometric characteristics (e.g., curve radius, lane width, etc.), and traffic attributes consist a basic prerequisite for this type of modeling [7]. Apart from such characteristics, in recent years increased attention has been given to Surrogate Safety Measures (SSMs). SSMs are parameters that describe attributes of the network and of the vehicle movement on roads that are more easily recordable or collectible and do not stem directly from or rely on crash data. These measures are being used more and more in recent road safety studies as they can become an alternative to road safety analyses or even complement analyses that are based on historical crash records [8,9].
Within this context, the objective of this research is threefold, specifically:
  • Investigate the relationship between road crash frequency in motorway segments and various explanatory variables based on road design characteristics and SSMs;
  • Create risk-level clusters of the motorway segments based on crash and traffic data;
  • Develop a classification model that could predict the class of motorway segments by exploiting road design data and SSMs.
The rest of the paper is organized as follows. Section 2 presents an overview of international scientific literature regarding CPMs and SSMs. Section 3 presents data used for the analyses, and Section 4 provides the main components of the theoretical background of the statistical models that were developed in the framework of this study. The key results of the analyses are presented and discussed in Section 5. Lastly, conclusions are highlighted, and the limitations along with some ideas for future research are clearly stated in Section 6.

2. Literature Review

Over the previous two decades, several researchers have investigated the safety effects of various elements of the road infrastructure in an attempt to quantitatively estimate crash frequency and crash severity. As a result of this research, a large amount of relevant knowledge has been generated, as well as various methodologies and techniques to estimate future crash frequency and severity and to identify and evaluate options to reduce them. These methodologies are commonly known in the research community as CPMs, and they essentially are the empirical statistical models behind road assessment methodology based on the design and operational characteristics of roads.
On one hand, the HSM predictive method [5] estimates the expected average crash frequency of an individual site based on regression models for specific facility types called Safety Performance Functions (SPFs). These functions contain only a few variables, primarily average annual daily traffic (AADT) volumes and segment length. In this approach, various crash modification factors (CMFs) are also used in order to account for differences in geometric design or in traffic control features between the base conditions of the model and the local conditions of the examined site. Besides the HSM predictive method that utilizes the concept of base SPFs used in conjunction with CMFs to account for site specificities, significant research efforts have also concentrated on the development of stand-alone CPMs, based on locally available data concerning road infrastructure design, traffic volumes, road crashes, and other, for example, weather conditions. The key difference between such models and the SPF-CMF approach is that multivariate CPMs usually include more explanatory variables compared to the simple form of HSM SPFs in order to consider site characteristics.
Stand-alone CPMs have been developed for various road types. An early crash prediction attempt was performed by Ivan et al. for rural two-lane highway segments in the state of Connecticut, USA [10]. Specifically, a Poisson generalized linear modeling (GLM) approach was selected for modeling single- and multi-vehicle crashes. For single-vehicle crashes, the following variables were found to be significant: daytime, volume/capacity ratio, percent of the segment with no passing zones, shoulder width, and number of intersections, and driveways. Multi-vehicle CPMs had quite different variables, such as daylight conditions, number of intersections, and driveways. Cafiso et al. attempted to define CPMs for two-lane rural road sections based on a combination of exposure, geometry, consistency, and context variables directly related to safety performance [11]. This study was based on a sample of 168 km of Italian two-lane local rural roads, with a 5-year crash analysis period to compensate for the low traffic flow and crash frequencies anticipated on local roads. The models proposed are also based on the GLM approach, assuming a negative binomial distribution error structure. In more recent research, Yan et al. focused on the issue of unobserved heterogeneity of collected data and experimented with the development of negative binomial and random effects negative binomial models for two-lane rural roads in Washington State [12]. Horizontal alignment type, speed limit, visibility, road surface condition, and AADT were identified to have significant random effects on crash frequency.
Several CPMs have also been developed for rural intersections. Kim et al. developed separate crash prediction models for various crash types for rural intersections in Georgia, USA, as well as a model for all crash types for comparison [13]. The analysis revealed that factors such as AADT, the presence of turning lanes, and the number of driveways have a positive association with each type of crash, whereas median widths and the presence of lighting are negatively associated. Biancardo et al. developed CPMs for three- and four-leg stop-controlled intersections on two-lane rural roads in southern Italy [14]. Explanatory variables were the presence or absence of a left-turn lane, mean lane width including an approach lane and a left-turn lane width on the major road per travel direction, the number of legs, and the total AADT entering the intersection.
As far as urban roads are concerned, an early attempt to develop CPMs in the Greater Vancouver Regional District in Canada is reported by Sawalha and Sayed in 2001 [15]. Data from 392 road segments of 58 arterials, without including intersections, in the cities of Vancouver and Richmond were used, and it was revealed that the variables that had a significant effect on crash occurrence were traffic volume, section length, unsignalized intersection density, driveway density, pedestrian crosswalk density, number of traffic lanes, type of median, and nature of land use. In another research, Greibe reported the development of multivariate CPMs for urban junctions and urban road segments in Denmark [16]. Four models for different types of junctions were developed as well as a model for road links, using the GLM approach and assuming a Poisson distribution for variation in crash numbers. For road link models, a large number of explanatory variables was used, including AADT, speed limits, number of lanes, road width, speed-reducing measures, number of accesses, number of minor side roads, parking conditions, land use, urban road type, median divider, presence of bus stops, etc. However, the model fit was not very satisfactory, possibly due to the strong internal correlation within the selected explanatory variables.
Several models have also been developed for motorways. Caliendo et al. developed a CPM for Italian four-lane median-divided motorways, based on crash and road geometry data from a 46 km long section, which was monitored from 1999 to 2003 [17]. The model, estimating crash frequency as a function of traffic flow, infrastructure characteristics, pavement surface conditions, and sight distance, was developed using a stepwise forward procedure based on the Generalized Likelihood Ratio Test (GLRT). Montella et al. developed separate CPMs for total crashes and severe crashes in Italian rural motorways, using GLM techniques and assuming a negative binomial distribution error structure [18]. The study used a sample of 2245 crashes (728 severe crashes) that occurred from 2001 to 2005 on Motorway A16 between Naples and Canosa in Italy. The developed model for total crashes included as variables: curvature, operating speed reduction, length of the tangent preceding the curve, and traffic effect, all with a positive sign; the difference between the friction demand and supply, deflection, and upgrade, all with a negative sign.
CPMs consist of a reactive modeling approach as they are mainly based on historical crash records that are collected within a long period of time [19]. Consequently, such approaches force road safety experts to wait for the occurrence of road crashes in order to identify the problems and examine measures for their prevention. Therefore, in recent years, researchers have increasingly started using indicators that are not based on historical crash data. In the road safety literature, these indicators have been termed SSMs and can certainly be a proactive approach to road safety analyses [20]. SSMs can also complement analyses that are based on historical road crashes [8]. SSMs can be collected either through traffic simulation models [21,22] or under real driving conditions through smartphones [23], equipped vehicles [24], and video recordings [25]. On one hand, SSMs can be time-based, deceleration-based, and energy-based. Among the most prevalent indicators of this subcategory of SSMs are post encroachment time (PET), time-to-collision (TTC), and deceleration rate to avoid the crash (DRAC) [26]. On the other hand, the recording of driving behavior through sensors in vehicles and mobile phones has made harsh driving behavior events an alternative subcategory of SSMs [9,27].

3. Data Collection

Statistical analyses of this research focus on the Olympia Odos motorway in Southern Greece, a rural motorway from Athens to Patras that comprises 201.5 km of rural motorway in total, with two or three lanes per direction and 29 interchanges. Part of the motorway of 63 km (Elefsina-Korinthos) is in operation since 2010, whereas the rest (Korinthos-Patra) was fully operational since the summer of 2017. Crash data of all severity levels including property-damage-only (PDO) crashes as well as AADT were available for 2015–2020. As the entire motorway (i.e., from Athens to Patras) was finalized and started operating in 2017, AADT and crash data for the entire length were available for the years 2018–2020. Therefore, it was decided to focus on a smaller time period (2018–2020) but for a longer, road network. The motorway is operated by a private road operator firm, Olympia Odos Operation SA, who kindly provided data for the current research.
For the objectives of this study, a road geometry database that focuses on the section from the toll station of Elefsina (CH.26 + 500) to the end of the motorway (CH.223 + 200) was developed through a multi-step process. As a first step, a draft centerline of Olympia Odos Motorway was preliminarily retrieved from Open GIS software, using the Blender application (https://www.blender.org/, accessed on 18 January 2023), as follows: the Open GIS polylines representing the existing road network in the vicinity of the motorway were exported in shapefile format and imported to CAD environment; then, all neighboring road centerlines were removed and centerlines for the motorway, for transverse roads and entrance/exit ramps at interchanges were isolated. At this stage, the CAD drawing of the motorway was developed in the official national coordinate system in Greece (EGSA 87). It is noted that only horizontal alignment information on the road centerlines was retrieved.
Following the zone of the centerline defined in the first step, a series of high-detail satellite images (pixel size approximately 1.2 × 1.7 m) were retrieved using the respective GIS module of the free online software HEC-RAS (https://www.hec.usace.army.mil/software/hec-ras/, accessed on 18 January 2023) and georeferenced as the background of the CAD drawing. Combining information from the Open GIS road centerline and the detailed satellite imagery, the centerline of the motorway was subsequently refined, as follows: the preliminary centerline from Open GIS software is a polyline with dense points. This was manually replaced in the CAD environment by a “road design equivalent” centerline, consisting of tangents, circular curves, and spiral (clothoid) curves. Spiral curves were introduced on the entrance and exit of all curves with a radius of less than R = 1000, assuming a clothoid curve parameter A ranging from R/3 to R (R/3 < A < R), according to Greek road design guidelines. In segments where the two directions of travel follow different paths, the main centerline was the direction from Elefsina to Patras and a secondary centerline was created for the opposite direction.
The refined CAD centerline was then imported into the Google Earth online platform (https://earth.google.com, access on 18 January 2023) and using the satellite views and the Google Street View imagery in conjunction, the location of km posts was determined. This location is of utmost importance for microscopic road safety analyses, as all elements of the analysis (crashes, speed limits, etc.) are recorded according to those locations (GPS use for crash location recording is not performed in Greece). The km posts, as identified in Google Earth, were subsequently imported into the base CAD drawing of the motorway and a road chainage system (stations) was established.
In the next step, all available road infrastructure data were imported into the CAD drawing as well as the Google Earth interface, mostly based on their respective road station (chainage) but also cross-checking their location against the Google Earth satellite imagery and Street View images. An important source of information at this stage was the motorway schematic provided by the road operator (Olympia Odos Operation SA) with the exact locations (road station-chainage) of interchanges (with entrance/exit ramps), toll stations, motorway service stations, parking areas, tunnel and cut-and-cover entrance and exits, and speed limit signs.
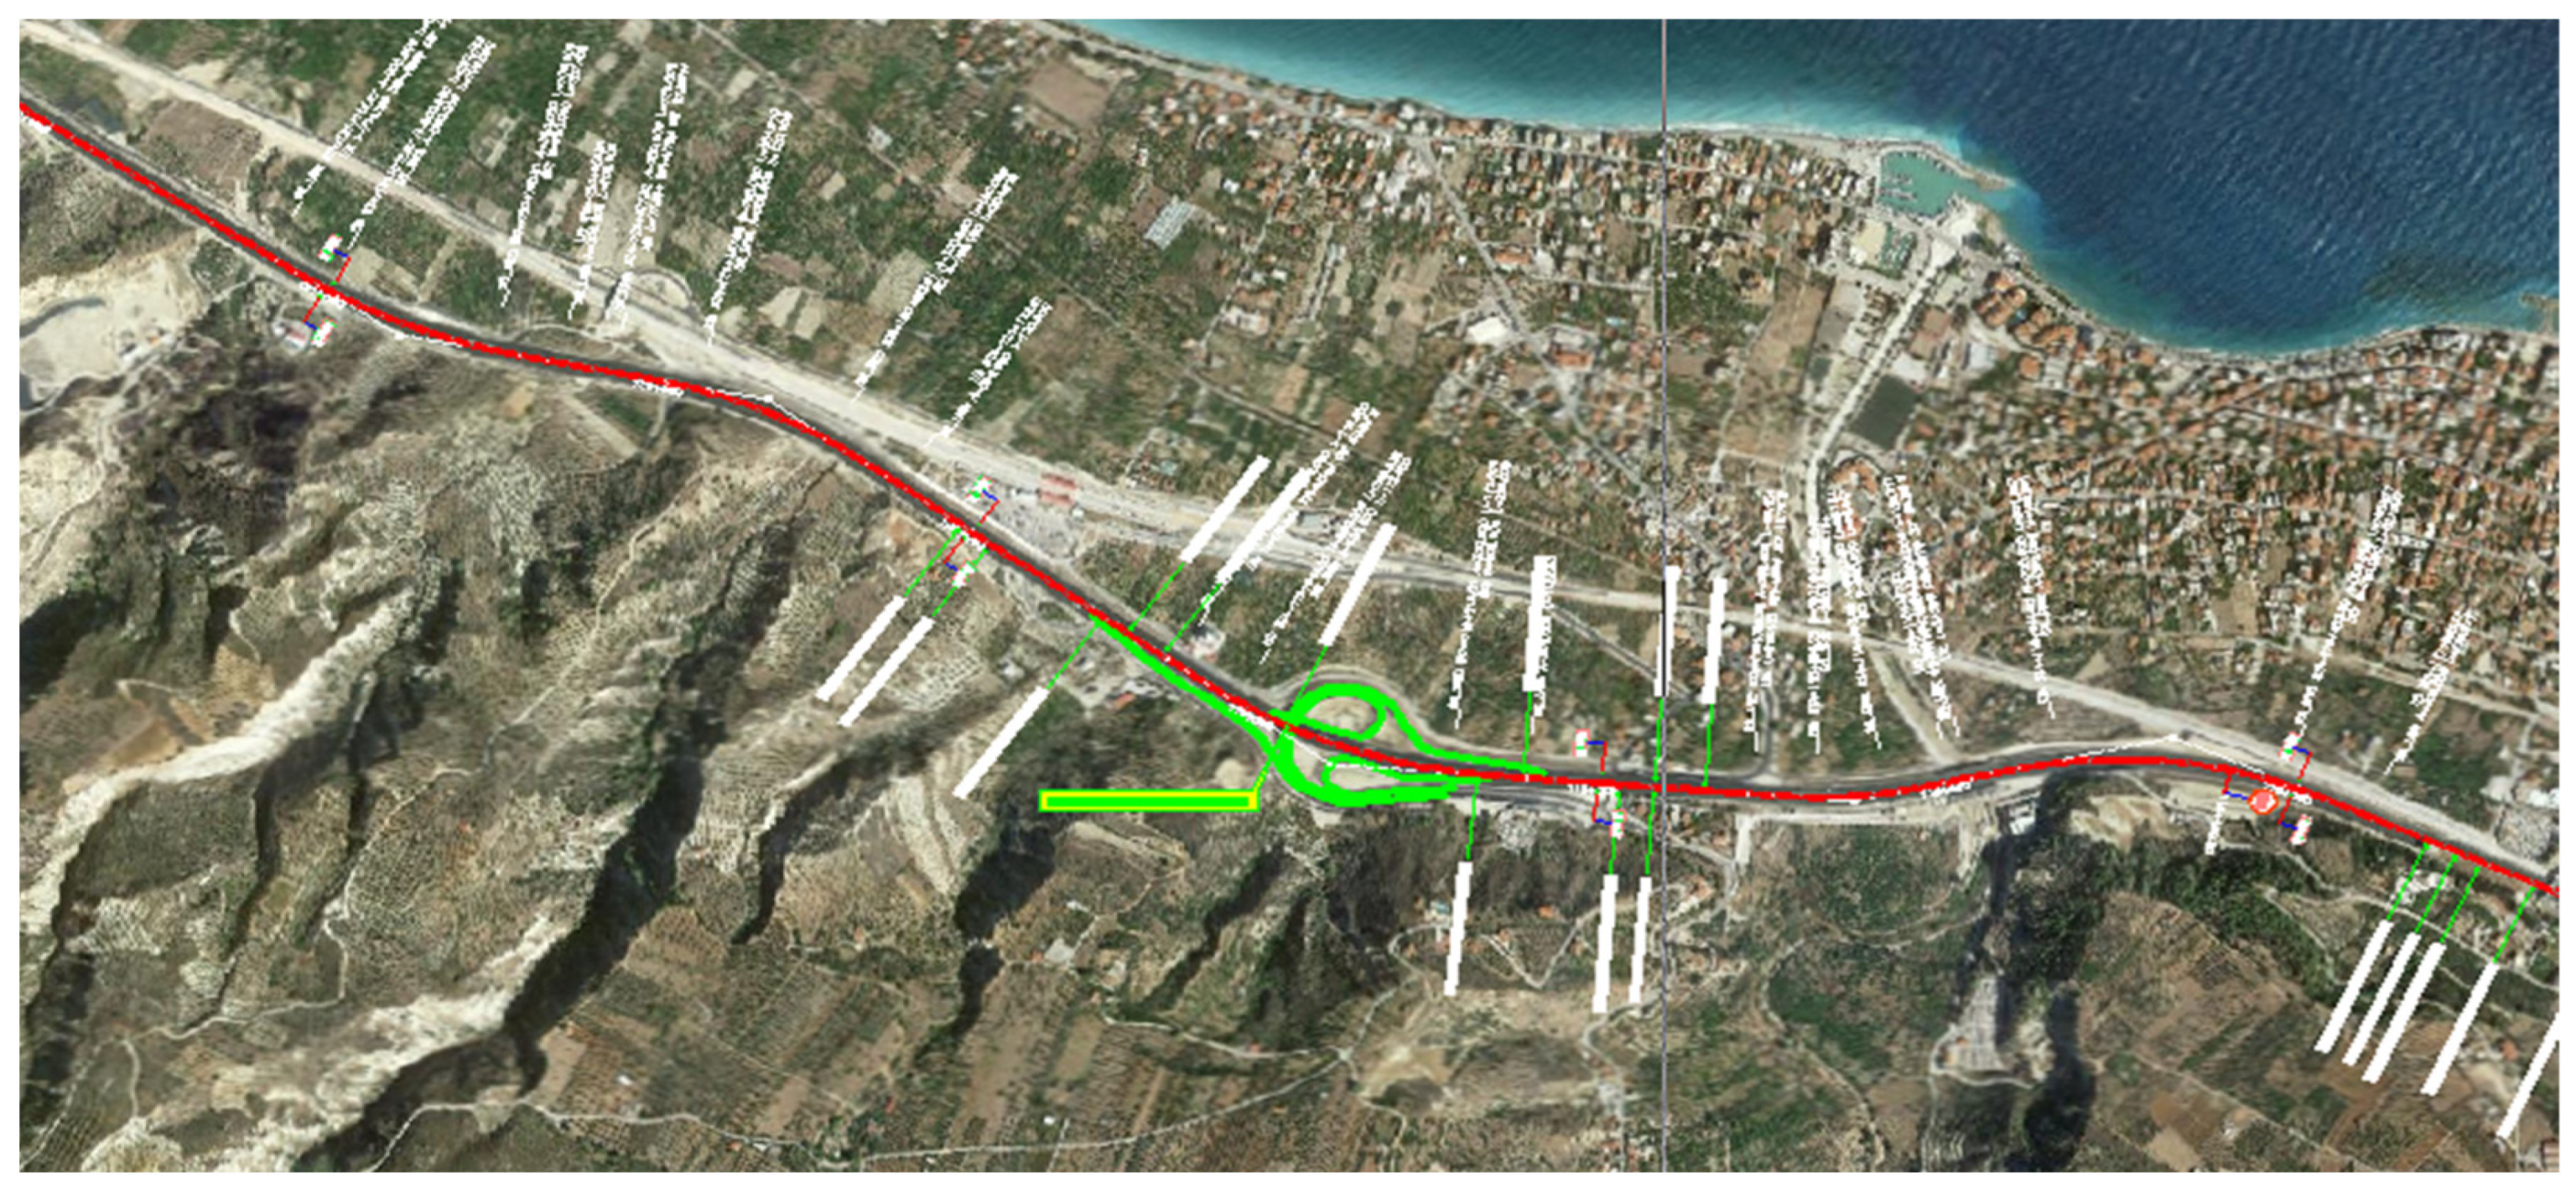
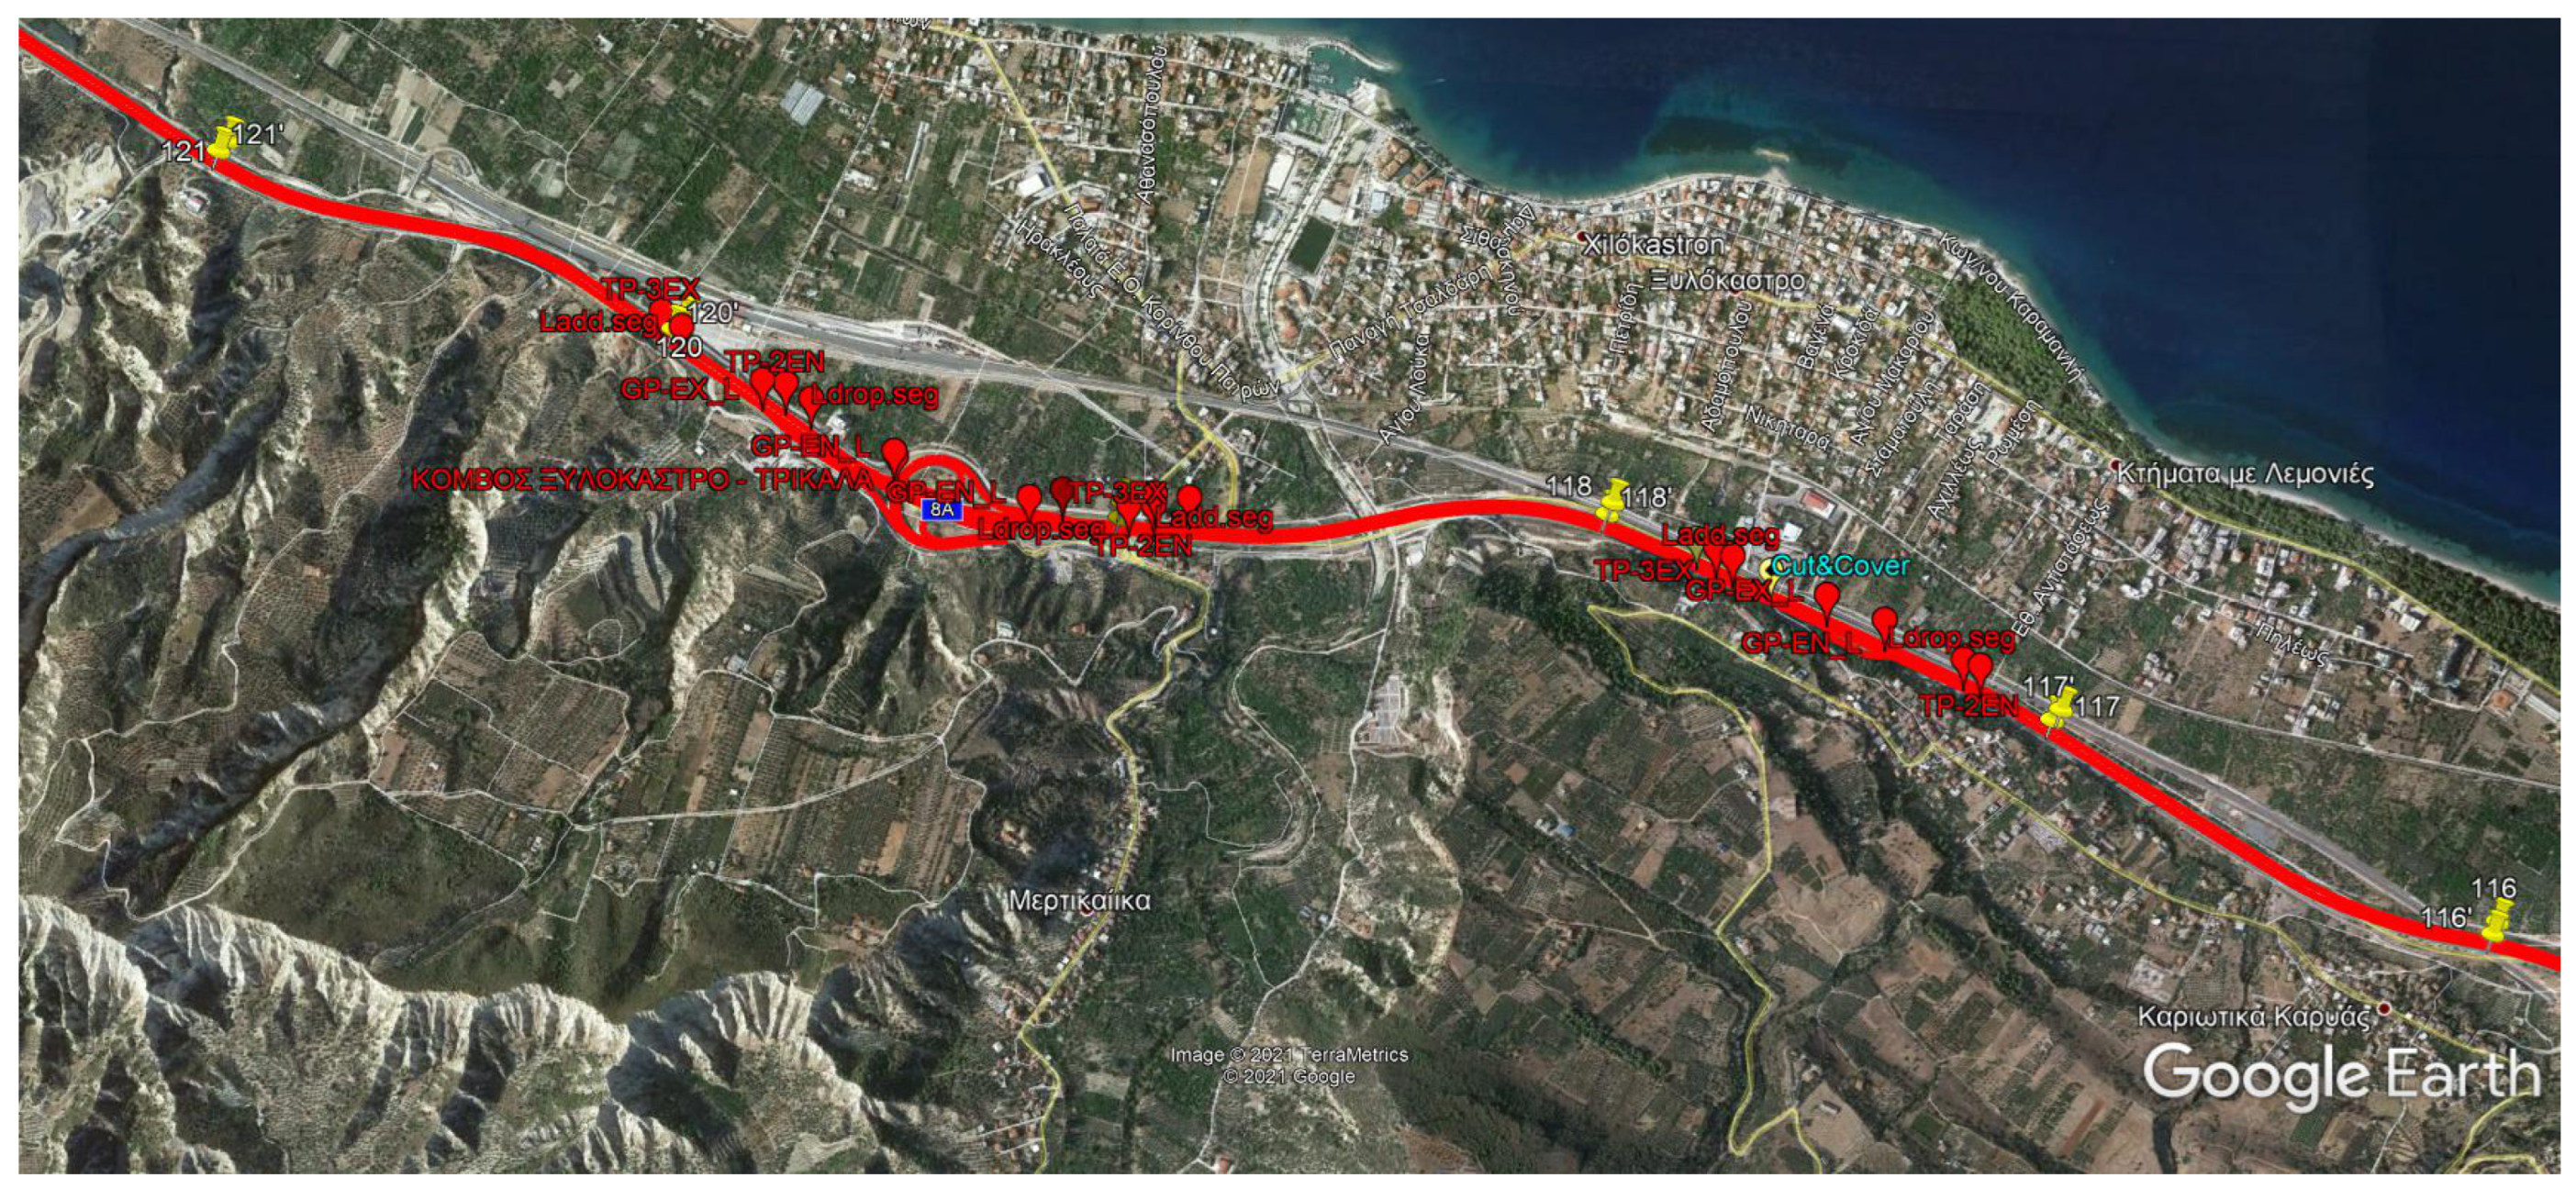
The above procedure produced a CAD drawing, as presented in Figure 1, with georeferenced satellite images as the background, including motorway centerline geometry, chainage, speed limits, and visualization of other important road infrastructure elements: toll stations, interchanges (with transverse roads, entrance and exit ramps), km posts, location of lane addition or lane drop, weaving segments, etc., and a Google Earth Dataset in .kmz file form, presented in Figure 2, with several layers of information: centerline, chainage, tunnels, additional lane points (gore, start, and end), lane drops/additions, etc. These two powerful tools were utilized in order to code road infrastructure data for further analysis and create a database that forms the basis for subsequent analysis.
Another database on road user behavior data on Olympia Odos Motorway was developed, in order to be jointly investigated with the road infrastructure, crash, and traffic data. Naturalistic driver behavior data were recorded via a smartphone application and processed in the platform, both developed by OSeven (https://oseven.io/, accessed on 18 January 2023). Drivers install the application developed by OSeven on their smartphones and subsequently engage in normal driving activities. The application engages automatically when driving is initiated and records different data types such as vehicle location, speed, acceleration, deceleration, duration of engagement with the phone, etc. These data are further processed to develop metrics to describe driver behavior.
For this research, the following metrics for unsafe driver behaviors were used: counts of harsh accelerations and braking behaviors, average speed, average speed over the speed limit, count of trips with speeding, and duration of average speeding. Harsh events are determined by the OSeven algorithms which are private and under intellectual property protection. To provide more context, OSeven uses data from all the axes of the accelerometer as well as GPS for the determination of harsh events. Harsh events are calculated via data fusion and machine learning algorithms and not a rule-based approach using as input the values of the accelerometer as well as values from additional sensors (e.g., orientation, magnetometer, GPS, gyroscope). These algorithms evaluate the processed time series from the smartphone sensors of the complete trip and increase the overall detection accuracy of harsh events. It should be noted that the algorithms do not include specific threshold values but rather exploit ML-based detection of spikes in the sensor data [28].
OSeven has provided a representative dataset from its database in a completely anonymized format that corresponds to the period from 1 June 2019 to 31 December 2020. The data were recorded from a driver sample equal to 327 drivers for 2019 and 330 drivers for 2020. It is possible that some drivers were mindful that their driving behavior was recorded through the application and were even more aware than usual. However, these effects have been reported to decrease over time as drivers gradually forget that they are being recorded [29]. For the total considered time period the average number of recorded trips per motorway segment was 2035 trips. Subsequently, driving behavior metrics from naturalistic data, which are driver-based, needed to be assigned to the examined motorway segments, which are infrastructure-based data. This was achieved via isolating each trip portion to the corresponding segment within the internal recording of trips conducted in GIS by OSeven using ESRI polygons at 200 m intervals.
At this point, it should be noted that the recording of driver behavior through the smartphone app was not feasible within the tunnel road segments due to the loss of GPS signal. Furthermore, toll station segments are not typical motorway segments both in terms of geometric design and driver behavior. Consequently, these two types of road segments were not included in the statistical analyses of the present research. The variables that were included and analyzed within the present study are presented in Table 1, along with their abbreviations and some key descriptive statistics. As also mentioned in Section 2, the variables related to road design characteristics, traffic attributes, and road crashes are widely used in CPMs, whereas harsh driving behavior events are SSMs that can complement road safety analyses.
In total, 668 motorway segments were considered in the analyses of this study with an AADT equal to 10,786 vehicles per day for the period of 2018–2020. The length of the examined segments varies from 200 m to 600 m and among these segments, 435 include two through lanes while the rest 233 include three through lanes. In terms of road safety outcomes for the period 2018–2020, 80 injury road crashes and 1270 PDO crashes were recorded.

4. Statistical Methodology

4.1. Negative Binomial Regression

Average crash frequency can be predicted through the development of regression models as a function of various explanatory variables. Poisson regression is widely used for count data modeling. The Poisson regression makes the assumption that variance and mean are equal, which is not always the case for crash data. In many cases, crash datasets have a mean that is lower than their variance meaning that some road segments concentrate more on crashes than others. To that end, negative binomial regression is another well-known approach that can be considered as a generalization of Poisson regression and is preferred when overdispersion exists in crash count data [30].
Based on a Poisson regression model, the probability of a road segment i having  y i  crashes per some time period is given by:
P ( y i ) = exp ( λ i   ) λ i y i y i !
where λi is the Poisson parameter for segment i, which is equal to the expected number of crashes per period,  E [ y i ]  for segment i. The Poisson parameter λi needs to be defined as a function of independent variables. The most common functional form is:
λ i = e x p ( β X i )
where  X i  is a vector of independent variables and  β  is a vector of estimable parameters. In negative binomial distribution, the variance varies from the mean by adding the term EXP(εi) to the Equation (2):
λ i = e x p ( β X i + ε ι )
This extra term is a gamma-distributed error term with mean 1 and variance a that allows the variance to differ from the mean. Regarding goodness of fit and the process of model selection among models with different combinations of independent variables, the corrected Akaike Information Criterion (AICc) is used. This criterion accounts for and corrects for the number of included explanatory variables, whereas lower scores indicate a better fit. In the case of this study, a negative binomial regression model was developed with total crashes (injury and PDO) in each motorway segment as the dependent variable and various traffic, road geometry, and SSMs as explanatory variables. For additional detailed explanations of the underlying statistical background, the reader can consult Washington et al. [31].

4.2. Hierarchical Clustering

In data mining, hierarchical clustering is a type of clustering analysis that creates a hierarchy of clusters based on two key strategies: the agglomerative and the divisive. In this paper, the agglomerative approach is used. In this approach, each observation starts in its own cluster, and pairs of clusters are merged as one moves up the hierarchy. In order to determine which clusters should be combined, the Euclidean distance between single observations of the dataset and Ward’s minimum variance method as the linkage criterion were used. For more details, the reader is referred to Murtagh and Contreras [32]. In the context of this research, hierarchical clustering was used to categorize the risk level of the examined motorway segments based on the number of total road crashes by segment length and the respective AADT of each segment.

4.3. Random Forest Classifier

The classification technique called Random Forest (RF) was proposed by Ho in 1995 [33] and then enhanced by Breiman in 2001 [34]. It exploits the bagging technique in order to build an uncorrelated forest of trees using feature randomness and the simultaneous building of many independent decision trees during the training phase. Based on the theory that the combination of learning models improves the accuracy of prediction, the RF classifier gathers the classification of each separate decision tree and then combines them exploiting either the majority vote or the confidence vote strategy. The individual trees are informative but not correlated to each other. Unlike the conventional decision trees, RF classifier does not lead to overfitting as there are enough trees in the forest. As a result, trees grow to their maximum without pruning. In essence, RFs set up many uncorrelated classifiers to be combined into a powerful classifier. In this paper, RF was used in order to develop a classification model that would be able to predict the class that reflects the risk level of each motorway segment by exploiting road geometry data and SSMs. For the evaluation of the performance of an RF classification model, a portion of the utilized dataset, which was not fed into the RF model to discover patterns during its training is used, termed test subset. An initial step for this evaluation is the creation of the confusion matrix, which is a matrix that reveals the distribution of the predictions and targets.
A key metric is the overall classification accuracy which is defined as the fraction of instances that are correctly classified. With regard to classification models with more than two classes, some common per-class performance metrics are precision, recall, and the F1 score [35]. Precision is defined as the fraction of correct predictions for a certain class (the number of true positives divided by the number of true positives plus the number of false positives), whereas recall is the fraction of instances of a class that were correctly predicted (the number of true positives divided by the number of true positives plus the number of false negatives). These measures are highly useful when the class labels are not uniformly distributed. In such instances, accuracy could be quite misleading as one could predict the dominant class most of the time and still achieve relatively high overall accuracy but very low precision or recall for the remaining classes. Apart from precision and recall, the F1 score is also commonly estimated. It is defined as the harmonic mean of precision and recall. Lastly, it is noted that the per-class metrics can be also averaged over all the classes resulting in macro-averaged precision, recall, and F1.

5. Results and Discussion

5.1. Crash Frequency Regression Model

As per the aforementioned, the first objective of the current research was to develop a CPM in order to investigate the relationship between road crash frequency in road segments of the Olympia Odos motorway in Greece and various explanatory variables based on road design characteristics and SSMs. Since road crashes are count data, a count data modeling approach was selected. As a first step, the variance and the mean of road crash frequency in the examined motorway segments were calculated in order to choose between Poisson regression and negative binomial regression. In particular, it was estimated that the variance is equal to 3.98 and is higher than the mean which is equal to 2.02. For this reason, negative binomial regression was chosen as the most appropriate modeling approach.
This analysis was conducted in R-studio [36] using the MASS R package [37]. A high number of regression model tests were conducted for different combinations of variables. The optimal combination of variables was the one that had a sufficient number of statistically significant independent variables at a 95% confidence level (p-values ≤ 0.05) and the lowest possible AICc. Moreover, the independent variables were also checked for multicollinearity through the Variance Inflation Factor (VIF). A standard guideline is that VIF values higher than 10 indicate high multicollinearity [38]. However, a threshold equal to 5 is also commonly used [39]. The dependent variable of the developed negative binomial regression was the variable “TotCr18_20” of Table 1 and the results of the model are presented in Table 2.
Based on Table 2, it can be observed that all the explanatory variables are statistically significant at a 95% confidence level; there is no issue of multicollinearity as the VIF values are much lower than 5. With regard to the coefficients, it is revealed that road crash frequency in the examined motorway segments is positively correlated with the average AADT, showing that as traffic volume increases, the number of road crashes increases as well. This finding is also in alignment with the findings of a meta-analysis of 521 CPMs from more than one hundred studies [40].
Furthermore, it is demonstrated that both harsh accelerations and harsh braking have a positive relationship with the dependent variable, indicating that as the number of these two harsh driving behavior events increases, crash frequency also increases. This is a noteworthy finding of the current research as it confirms that harsh driving behavior events present a statistically significant positive correlation with historical crash records. This conclusion means that these indicators can be meaningfully considered reliable SSMs that can be also used in proactive road safety analyses [41,42]. Lastly, crash frequency is higher for motorway segments with higher length, as length serves as an exposure parameter.

5.2. Definition of Crash Risk Levels

The next stage of the statistical analysis carried out within the framework of this research focuses on the creation of crash risk level clusters of the examined motorway segments. For this purpose, agglomerative hierarchical clustering was applied through the “hclust” function of the stats R package [36]. As also mentioned in Section 4.2, the Euclidean distance between single observations of the dataset and Ward’s minimum variance method as the linkage criterion were used. The variables considered for the formation of the risk level clusters of the motorway segments under consideration correspond to the number of total road crashes by segment length and the respective AADT of each segment. The selection of the number of clusters was based on the dendrogram illustrated in Figure 3.
As observed by Figure 3, and also based on the theoretical background of selecting the optimal number of clusters through the dendrogram, an appropriate choice of the number of clusters would be two. However, selecting only two clusters would lead to binary classification and to considerable detail and information loss. Therefore, in order to provide a more detailed description of the crash risk level of the examined road segments, four clusters were chosen as the next most appropriate option. Some basic descriptive statistics of the four crash risk levels are presented in Table 3.
These numbers reveal a clear pattern whereby the first risk level class presents high average numbers of traffic volume and road crashes by segment length, while these figures decrease progressively for each subsequent class. It should be highlighted that these are subsample averages; hierarchical clustering does not readily include theoretical centroid calculations.

5.3. Crash Risk Level Classification Model

After defining the clusters of crash risk level, a classification model was developed with the crash risk level as the response variable. The variables “TotCr18_20_len_seg” and “avg_AADT_18_20” were not included in this classification model, as they were used in the hierarchical clustering procedure. The “randomForest” R package was employed to implement the RF classification model [43].
The examined dataset was subsequently split into training and test subsets with a proportion of 75% and 25%, respectively. It is emphasized that the variable distributions were maintained to be similar during the splitting process. The training subset is used to train the RF model and amounted to 501 motorway segments, whereas the test subset evaluates the performance of the model and included the remaining 167 segments. The key elements of the RF crash risk level classification model’s training are presented in Table 4.
As per the aforementioned, the test dataset is used to assess the performance of the classification model. Figure 4 demonstrates the confusion matrix for the test dataset, which shows the distribution of the predictions and targets. The overall classification accuracy of the model is equal to 89.2% which indicates that the classification model achieves a very good accuracy score. However, in this specific classification model, the response variable consists of four classes. Therefore, it is particularly useful to examine some performance metrics for each specific class, as overall accuracy could be potentially misleading. Table 5 shows the precision, recall, F1 score for each category of crash risk level, and the respective macro-averaged metrics for all the classes. The precision and recall for each class are also depicted in the cells of the diagonal in Figure 4.
Based on both the overall accuracy and the per-class metrics, it can be concluded that the performance of the developed model is very satisfactory for all classes. This finding highlights the significant contribution and usefulness of this model as it can predict the crash risk level of the motorway segments very well by exploiting variables such as road geometry characteristics and SSMs. Thus, this model can be a quite reliable proactive approach that could point out the most hazardous road segments prior to the occurrence of road crashes and assist in the optimal use of available funds for targeted road safety actions and countermeasures.

6. Conclusions

The aim of this research was to exploit various road geometry data and SSMs for various road crash investigations in road segments of the Olympia Odos motorway in Greece. To that end, a unified database containing data on historical injury and PDO road crashes, road design characteristics, and SSMs of 668 motorway segments was utilized.
While the observational area and the data are singular for this study, they are viewed with three different approaches, each with a unique context. In particular, the first approach aimed to provide initial insights into the relationship significance and magnitude between road crash frequency, road geometry and SSM variables. However, since SSMs are still a new concept and their connection with hard road safety metrics such as crashes remains uncertain, it was fruitful to consider how these variables would perform for a clustering approach. To that end, the second model was applied as a first step, to reveal clusters that the segments can formulate based on crash and AADT data. The predictive power of road geometry and SSM variables was then tested on these clusters, having removed the variables used to obtain the clusters. Thus, in the present approach, the developed models contributed to prove that contextually, SSMs can be used to model crashes directly (negative binomial regression model), or indirectly, even without crashes, (RF model) when a type of safety categorization is established (clustering model).
To provide more detail, the negative binomial regression model was first developed to model motorway segment crash frequency. The results of this model pointed out that road crash frequency in the considered motorway segments is positively correlated with the traffic volume, the length of the segment, and the number of harsh accelerations and harsh braking. This analysis contributes to existing road safety literature by demonstrating a positive and statistically significant relationship between crash frequency and harsh driving behavior events. Therefore, it can be concluded that such events can be a valid subcategory of naturalistic SSMs which can be used either to complement CPMs or as dependent variables of various road safety proactive analyses when historical road crash data are not available.
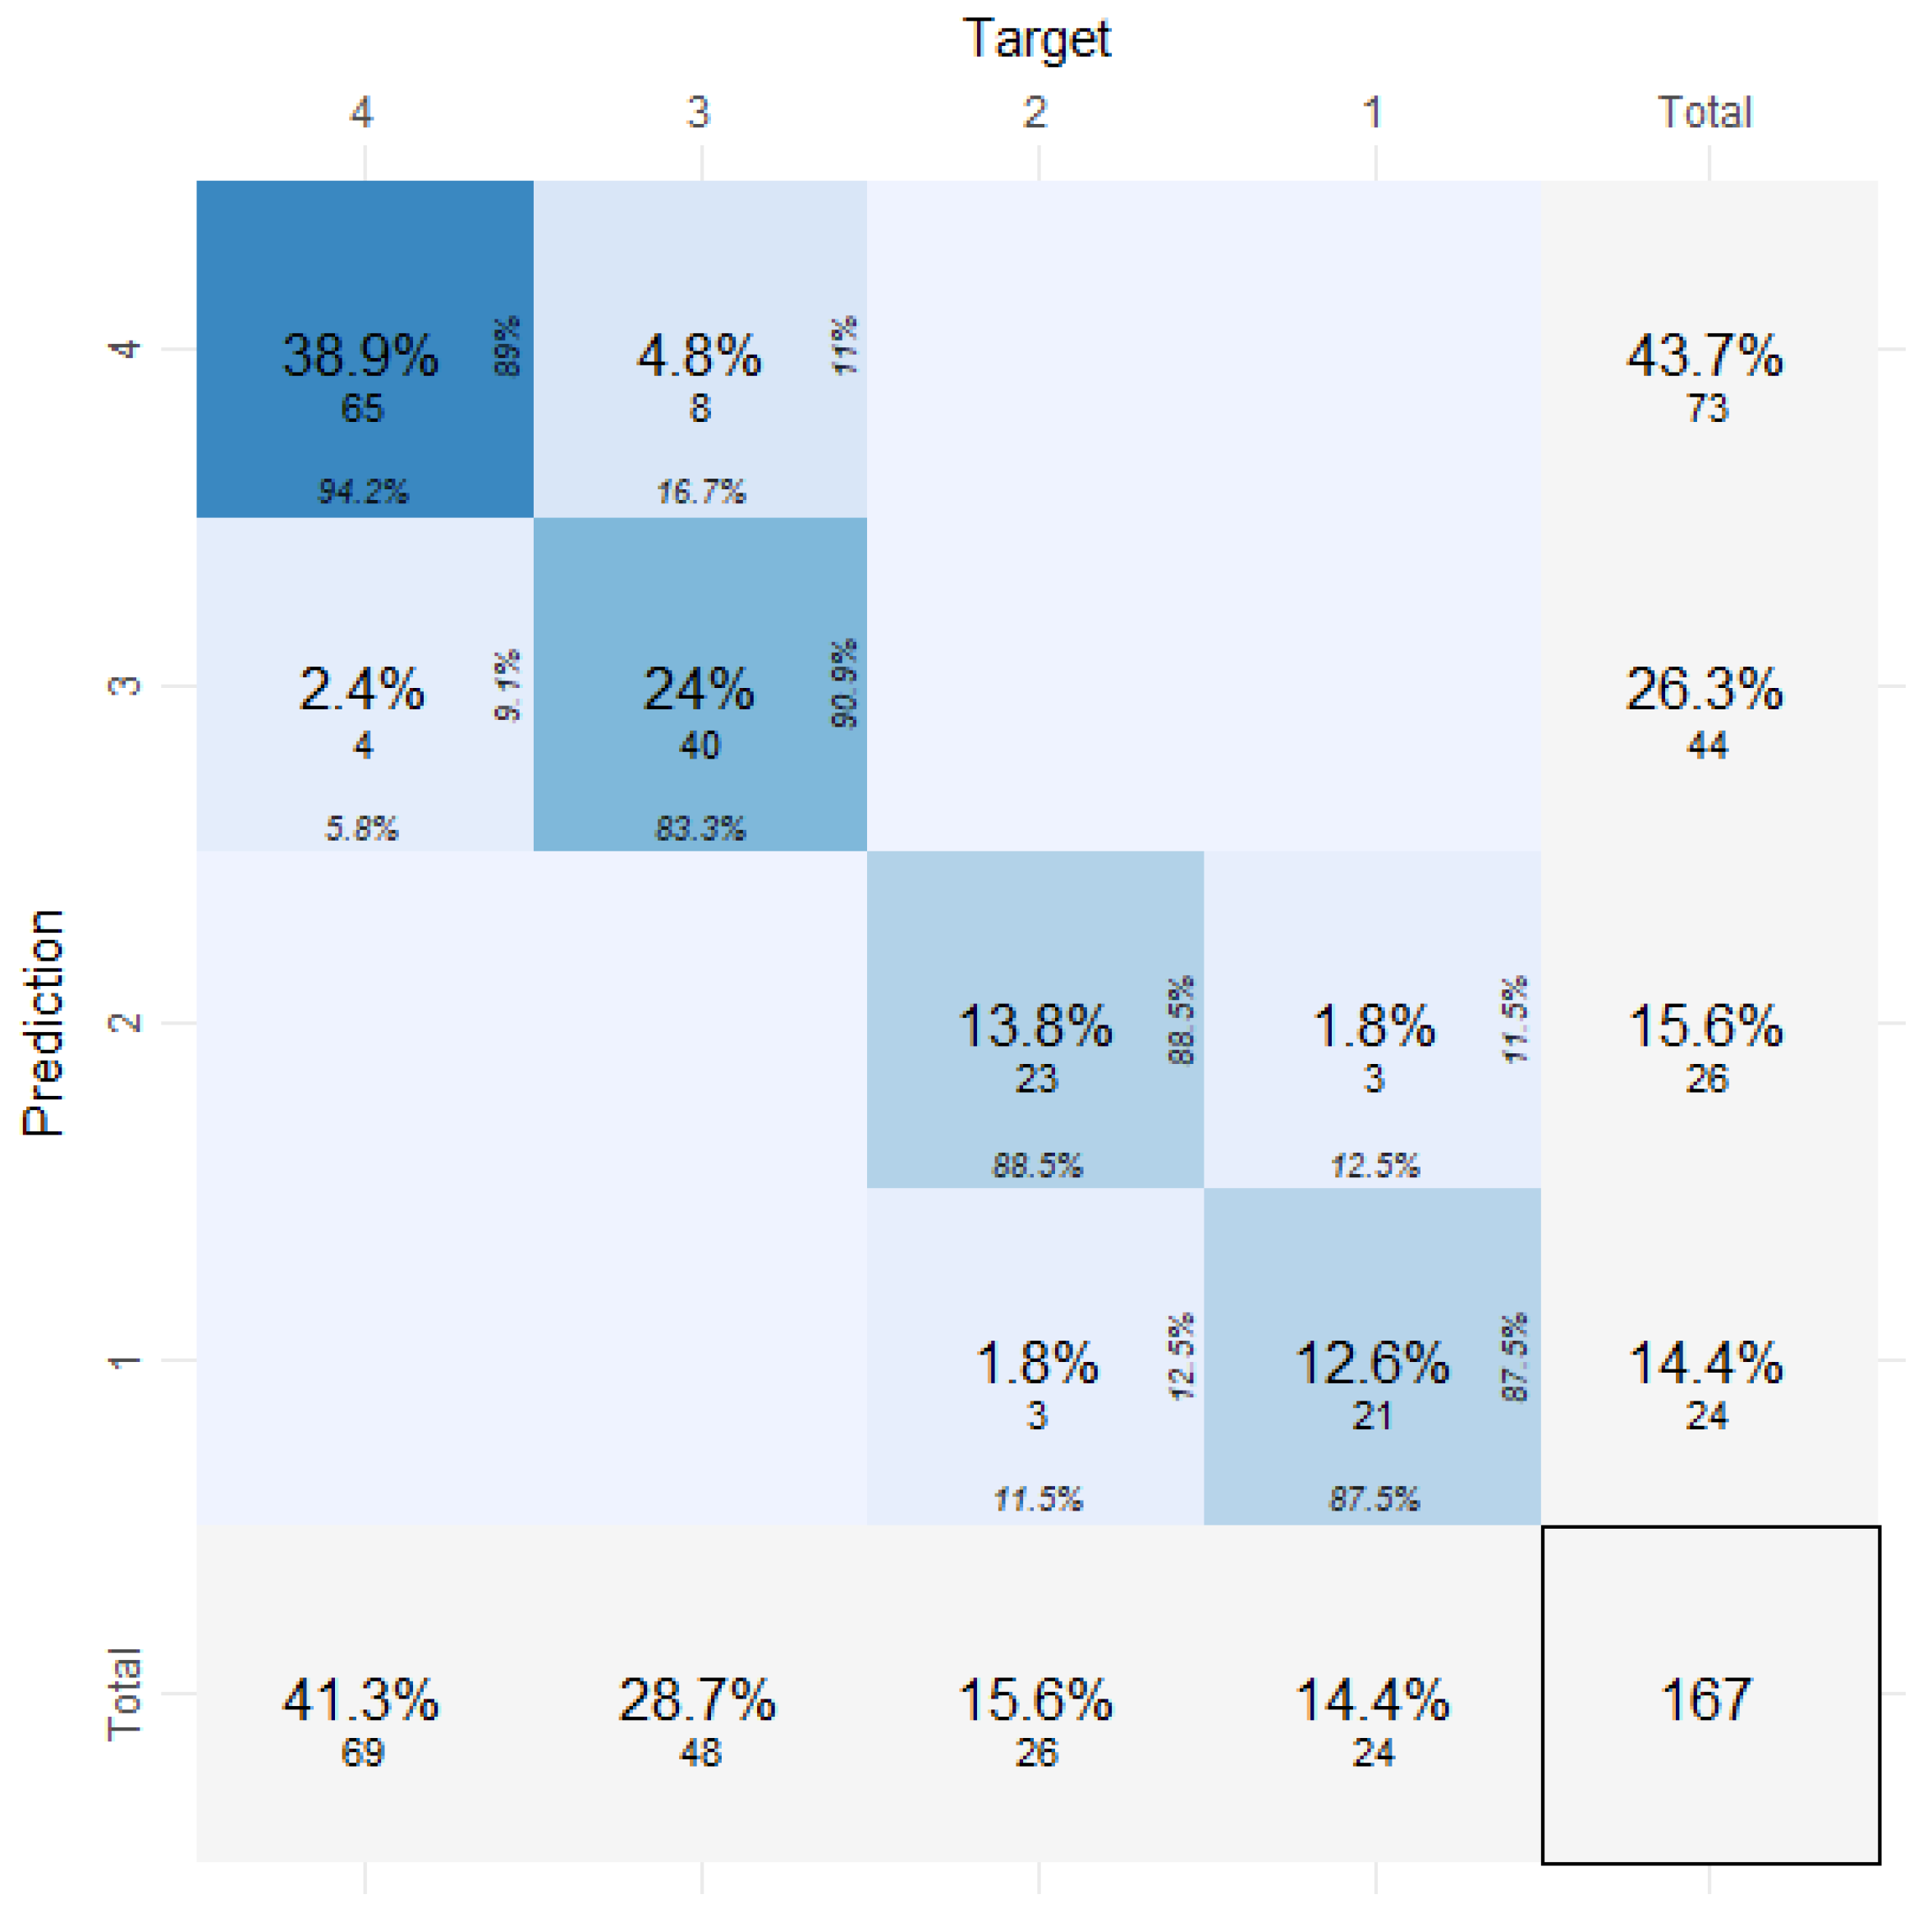
As a further step of the statistical analysis, it was attempted to create crash risk level clusters of the motorway segments considering the number of road crashes by segment length and the traffic volume of each segment through the agglomerative hierarchical clustering technique. Segment length and traffic volume of each segment were taken into account in the clustering analysis, as the results of the negative binomial regression model revealed that these two variables have a statistically significant impact on the crash frequency of motorway segments. Based on the results of this clustering approach, four crash risk levels were defined. Afterward, these four levels formed the response variable of an RF machine-learning classification model which used various road geometry data and SSMs as predictors. This model was developed as a mechanism for predicting and classifying the road safety level of the investigated segments, taking also into consideration SSMs that were found to be statistically significant in predicting crash frequency. The overall and per crash risk level classification performance of the developed RF model was very high, averaging metric performance over 88% consistently. Therefore, it can be concluded that this approach could be utilized as a quite promising proactive approach for the identification of potentially hazardous motorway segments.
Naturally, this research is not without limitations. With regard to the extraction of road geometry data for Olympia Odos motorway, the results are obviously not an exact replication of the actual road design of the motorway and minor differences could be expected if a comparison with the as-built drawings of the project was made. Nevertheless, any differences would be minor and, although important from a designer’s point of view, they are not expected to be able to differentiate the study’s results. The negative binomial regression technique that was used for the development of the crash frequency regression model does not take into account unobserved heterogeneity and the effects of spatial characteristics of various road safety indicators. Another limitation of the current research is that tunnels and toll station segments were not considered in the analyses, leading to discontinuities in the research area.
However, these limitations can provide directions for future research efforts. Specifically, the inclusion of random effects in the crash frequency modeling approach could be considered in order to account for the unobserved heterogeneity. Moreover, spatial modeling approaches could be a promising alternative kind of modeling as it could consider the spatial dependency of road safety indicators. Regarding the RF classification model, different machine-learning methods could be also implemented in order to compare their classification performance and identify the best-performing model. Moreover, regardless of the machine learning classification model utilized, Shapley additive explanations (SHAP) can also be calculated and provided in order to deal with the difficult challenge of interpreting the results of machine learning algorithms. Furthermore, as several traffic restrictions were implemented during the considered time period due to the Covid-19 pandemic, it would be highly interesting to investigate to what extent these measures may affect the results of this study. Lastly, the possibility of applying the analyses presented in this research to other road environments, such as urban areas, could be considered as well.

Author Contributions

Conceptualization, D.N., A.D. (Anastasios Dragomanovits), I.H., C.K. and G.Y.; methodology, D.N., A.D. (Anastasios Dragomanovits), A.Z. and G.Y.; software, D.N., A.D. (Anastasios Dragomanovits), G.K. and E.K.F.; validation, D.N., A.D. (Anastasios Dragomanovits) and A.Z.; formal analysis, D.N., A.D. (Anastasios Dragomanovits) and A.Z.; investigation, D.N. and A.D. (Anastasios Dragomanovits); data curation, D.N., A.D. (Anastasios Dragomanovits), G.K. and E.K.F.; writing—original draft preparation, D.N., A.D. (Anastasios Dragomanovits), A.D. (Aikaterini Deliali) and A.Z.; writing—review and editing, D.N., A.D. (Anastasios Dragomanovits), A.Z., A.D. (Aikaterini Deliali), E.K.F. and G.Y.; visualization, D.N.; supervision, G.Y. All authors have read and agreed to the published version of the manuscript.

Funding

This research was performed within the research project i-safemodels, been co-financed by the European Union and Greek national funds through the Operational Program Competitiveness, Entrepreneurship and Innovation, under the Call “Bilateral and Multilateral R&T Cooperation between Greece and China” (project code: Τ7ΔΚΙ00253).

Data Availability Statement

Not applicable.

Conflicts of Interest

The authors declare no conflict of interest.

References

  1. World Health Organization. Global Status Report on Road Safety 2018; WHO: Geneva, Switzerland, 2018.
  2. Nikolaou, D.; Folla, K.; Yannis, G. Impact of Socioeconomic and Transport Indicators on Road Safety during the Crisis Period in Europe. Int. J. Inj. Contr. Saf. Promot. 2021, 28, 479–485. [Google Scholar] [CrossRef]
  3. European Transport Safety Council. 15th Annual Road Safety Performance Index (PIN) Report; ETSC: Brussels, Belgium, 2021. [Google Scholar]
  4. European Commission. Available online: https://transport.ec.europa.eu/2021-road-safety-statistics-what-behind-figures_en (accessed on 18 January 2023).
  5. American Association of State Transportation Officials. Highway Safety Manual, 1st ed.; AASHTO: Washington, DC, USA, 2010. [Google Scholar]
  6. Daniels, S.; Martensen, H.; Schoeters, A.; van den Berghe, W.; Papadimitriou, E.; Ziakopoulos, A.; Kaiser, S.; Aigner-Breuss, E.; Soteropoulos, A.; Wijnen, W.; et al. A Systematic Cost-Benefit Analysis of 29 Road Safety Measures. Accid. Anal. Prev. 2019, 133, 105292. [Google Scholar] [CrossRef]
  7. Ambros, J.; Jurewicz, C.; Turner, S.; Kieć, M. An International Review of Challenges and Opportunities in Development and Use of Crash Prediction Models. Eur. Transp. Res. Rev. 2018, 10, 35. [Google Scholar] [CrossRef] [Green Version]
  8. Johnsson, C.; Laureshyn, A.; de Ceunynck, T. In Search of Surrogate Safety Indicators for Vulnerable Road Users: A Review of Surrogate Safety Indicators. Transp. Rev. 2018, 38, 765–785. [Google Scholar] [CrossRef]
  9. Ziakopoulos, A.; Vlahogianni, E.; Antoniou, C.; Yannis, G. Spatial Predictions of Harsh Driving Events Using Statistical and Machine Learning Methods. Saf. Sci. 2022, 150, 105722. [Google Scholar] [CrossRef]
  10. Ivan, J.N.; Wang, C.; Bernardo, N.R. Explaining Two-Lane Highway Crash Rates Using Land Use and Hourly Exposure. Accid. Anal. Prev. 2000, 32, 787–795. [Google Scholar] [CrossRef]
  11. Cafiso, S.; di Graziano, A.; di Silvestro, G.; la Cava, G.; Persaud, B. Development of Comprehensive Accident Models for Two-Lane Rural Highways Using Exposure, Geometry, Consistency and Context Variables. Accid. Anal. Prev. 2010, 42, 1072–1079. [Google Scholar] [CrossRef] [PubMed]
  12. Yan, Y.; Zhang, Y.; Yang, X.; Hu, J.; Tang, J.; Guo, Z. Crash Prediction Based on Random Effect Negative Binomial Model Considering Data Heterogeneity. Phys. A Stat. Mech. Its Appl. 2020, 547, 123858. [Google Scholar] [CrossRef]
  13. Kim, D.G.; Washington, S.; Oh, J. Modeling Crash Types: New Insights into the Effects of Covariates on Crashes at Rural Intersections. J. Transp. Eng. 2006, 132, 282–292. [Google Scholar] [CrossRef]
  14. Biancardo, S.A.; Russo, F.; Žilionienė, D.; Zhang, W. Rural Two-Lane Two-Way Three-Leg and Four-Leg Stop-Controlled Intersections: Predicting Road Safety Effects. Balt. J. Road Bridge Eng. 2017, 12, 117–126. [Google Scholar] [CrossRef] [Green Version]
  15. Sawalha, Z.; Sayed, T. Evaluating Safety of Urban Arterial Roadways. J. Transp. Eng. 2001, 127, 151–158. [Google Scholar] [CrossRef]
  16. Greibe, P. Accident Prediction Models for Urban Roads. Accid. Anal. Prev. 2003, 55, 12–21. [Google Scholar] [CrossRef]
  17. Caliendo, C.; Guida, M.; Parisi, A. A Crash-Prediction Model for Multilane Roads. Accid. Anal. Prev. 2007, 39, 657–670. [Google Scholar] [CrossRef]
  18. Montella, A.; Colantuoni, L.; Lamberti, R. Crash Prediction Models for Rural Motorways. Transp. Res. Rec. 2008, 2083, 180–189. [Google Scholar] [CrossRef]
  19. Theofilatos, A.; Yannis, G.; Kopelias, P.; Papadimitriou, F. Impact of Real-Time Traffic Characteristics on Crash Occurrence: Preliminary Results of the Case of Rare Events. Accid. Anal. Prev. 2019, 130, 151–159. [Google Scholar] [CrossRef]
  20. Wang, C.; Xie, Y.; Huang, H.; Liu, P. A Review of Surrogate Safety Measures and Their Applications in Connected and Automated Vehicles Safety Modeling. Accid. Anal. Prev. 2021, 157, 106157. [Google Scholar] [CrossRef]
  21. Gettman, D.; Head, L. Surrogate Safety Measures from Traffic Simulation Models. Transp. Res. Rec. 2003, 1840, 104–115. [Google Scholar] [CrossRef] [Green Version]
  22. Mahmud, S.M.S.; Ferreira, L.; Hoque, M.S.; Tavassoli, A. Micro-Simulation Modelling for Traffic Safety: A Review and Potential Application to Heterogeneous Traffic Environment. IATSS Res. 2019, 43, 27–36. [Google Scholar] [CrossRef]
  23. Paleti, R.; Sahin, O.; Cetin, M. Modeling the Impact of Latent Driving Patterns on Traffic Safety Using Mobile Sensor Data. Accid. Anal. Prev. 2017, 107, 92–101. [Google Scholar] [CrossRef]
  24. Ambros, J.; Altmann, J.; Jurewicz, C.; Chevalier, A. Proactive Assessment of Road Curve Safety Using Floating Car Data: An Exploratory Study. Arch. Transp. 2019, 50, 7–15. [Google Scholar] [CrossRef]
  25. Johnsson, C.; Laureshyn, A.; Dágostino, C. Validation of Surrogate Measures of Safety with a Focus on Bicyclist–Motor Vehicle Interactions. Accid. Anal. Prev. 2021, 153. [Google Scholar] [CrossRef]
  26. Bonela, S.R.; Kadali, B.R. Review of Traffic Safety Evaluation at T-Intersections Using Surrogate Safety Measures in Developing Countries Context. IATSS Res. 2022, 46, 307–321. [Google Scholar] [CrossRef]
  27. Stipancic, J.; Miranda-Moreno, L.; Saunier, N.; Labbe, A. Network Screening for Large Urban Road Networks: Using GPS Data and Surrogate Measures to Model Crash Frequency and Severity. Accid. Anal. Prev. 2019, 125, 290–301. [Google Scholar] [CrossRef]
  28. Kontaxi, A.; Ziakopoulos, A.; Yannis, G. Trip Characteristics Impact on the Frequency of Harsh Events Recorded via Smartphone Sensors. IATSS Res. 2021, 45, 574–583. [Google Scholar] [CrossRef]
  29. Tselentis, D. Benchmarking Driving Efficiency Using Data Science Techniques Applied on Large-Scale Smartphone Data. Ph.D. Dissertation, National Technical University of Athens, Athens, Greece, 2018. [Google Scholar]
  30. Lord, D.; Mannering, F. The Statistical Analysis of Crash-Frequency Data: A Review and Assessment of Methodological Alternatives. Transp. Res. Part A Policy Pract. 2010, 44, 291–305. [Google Scholar] [CrossRef] [Green Version]
  31. Washington, S.; Karlaftis, M.; Mannering, F.; Anastasopoulos, P. Statistical and Econometric Methods for Transportation Data Analysis, 3rd ed.; Chapman and Hall/CRC: London, UK, 2020. [Google Scholar]
  32. Murtagh, F.; Contreras, P. Algorithms for Hierarchical Clustering: An Overview. Wiley Interdiscip. Rev. Data Min. Knowl. Discov. 2012, 2, 86–97. [Google Scholar] [CrossRef]
  33. Ho, T.K. Random Decision Forests. In Proceedings of the 3rd International Conference on Document Analysis and Recognition, Montreal, QC, Canada, 14–16 August 1995. [Google Scholar]
  34. Breiman, L. Random Forests. Mach. Learn. 2001, 45, 5–32. [Google Scholar] [CrossRef] [Green Version]
  35. Grandini, M.; Bagli, E.; Visani, G. Metrics for Multi-Class Classification: An Overview. arXiv 2020, arXiv:2008.05756. [Google Scholar]
  36. R Core Team. R: A Language and Environment for Statistical Computing. 2022. Available online: https://www.r-project.org/ (accessed on 18 January 2023).
  37. Ripley, B.; Venables, B.; Bates, D.M.; Hornik, K.; Gebhardt, A.; Firth, D.; Ripley, M.B. Package ‘mass’. Cran r 2013, 538, 113–120. [Google Scholar]
  38. Kutner, M.H.; Nachtsheim, C.J.; Neter, J.; Wasserman, W. Applied Linear Regression Models, 4th ed.; McGraw-Hill/Irwin: New York, NY, USA, 2004; pp. 563–568. [Google Scholar]
  39. Sheather, S. A Modern Approach to Regression with R; Springer: New York, NY, USA, 2009. [Google Scholar]
  40. Høye, A.K.; Hesjevoll, I.S. Traffic Volume and Crashes and How Crash and Road Characteristics Affect Their Relationship—A Meta-Analysis. Accid. Anal. Prev. 2020, 145, 105668. [Google Scholar] [CrossRef]
  41. Petraki, V.; Ziakopoulos, A.; Yannis, G. Combined Impact of Road and Traffic Characteristic on Driver Behavior Using Smartphone Sensor Data. Accid. Anal. Prev. 2020, 144, 105657. [Google Scholar] [CrossRef]
  42. Ziakopoulos, A. Spatial Analysis of Harsh Driving Behavior Events in Urban Networks Using High-Resolution Smartphone and Geometric Data. Accid. Anal. Prev. 2021, 157, 106189. [Google Scholar] [CrossRef]
  43. Liaw, A.; Wiener, M. Classification and Regression by randomForest. R News 2002, 2, 18–22. [Google Scholar]
Figure 1. Extract of the developed CAD drawing.
Infrastructures 08 00040 g001
Figure 2. Extract of the Google Earth .kmz file.
Infrastructures 08 00040 g002
Figure 3. Hierarchical Clustering Dendrogram.
Infrastructures 08 00040 g003
Figure 4. Confusion Matrix for the test dataset.
Infrastructures 08 00040 g004
Table 1. Road crash, traffic, geometry, and driver behavior variables per segment.
VariableAbbreviationMin.Max.Mean
Number of Segmentno.1668-
DirectionDirection---
Segment Start (Chainage)Seg_Start---
Segment End (Chainage)Seg_End---
Number of through laneslanes23-
Length of motorway segment (km)len_seg0.200.600.53
Average Annual Average Daily Traffic Volume of motorway segment (veh/day) 2018–2020avg_AADT_18_20651122,07910,786
Posted speed limit (km/h)speed_limit90130121.7
Number of Total Road Crashes (Injury & Property Damage Only) 2018–2020TotCr18_200.0013.02.02
Number of Total Road Crashes (Injury & Property Damage Only) by segment length 2018–2020TotCr18_20_len_seg0.0030.03.9
Curve 1—Radius R (m)Curve10.0050,0002129
Curve 1—Length of curve in segment (m)Lcurve1_in_seg0.00600.0218.2
Lane width (m)lane_width3.553.953.92
Paved inside shoulder width (m)pav_ins_sh_width0.501.750.69
Median width (measured from near edges of traveled way in both directions) (m)median_width2.2523.504.96
Distance from edge of inside shoulder to barrier face (m)dist_edginssh_barf0.000.750.04
Paved outside shoulder width (m)pav_out_sh_width0.254.502.77
Distance from edge of outside shoulder to barrier face (m)dist_edgoutsh_barf0.003.250.82
Number of recorded tripsrec_trips17350682035
Average speed (all trips) (km/h)avg_speed77.0153.0115.9
Average number of harsh accelerations per trip (%)avgha_pertrip_perc0.009.830.21
Average number of harsh brakings per trip (%)avghb_pertrip_perc0.003.910.21
Average number of speeding events per trip (%)avg_sp_ev_pertrip_perc1.2888.6125.79
Table 2. Statistical model for crash frequency in motorway segments.
Independent VariablesEstimateStd. Errorz ValuePr(|z|)VIF
(Intercept)−1.236360.199−6.216<0.001-
avg_AADT_18_200.000070.00012.394<0.0011.017
avgha_pertrip_perc14.759344.1923.521<0.0011.071
avghb_pertrip_perc30.009116.7704.433<0.0011.037
len_seg1.934530.3305.856<0.0011.055
AICc2333.837
Table 3. Descriptive statistics of the four crash risk levels of the examined motorway segments.
Crash Risk LevelCount of SegmentsMean “TotCr18_20_len_seg”Mean “avg_AADT_18_20”
1967.5720,876
21044.5517,218
31933.258086
42752.766726
Total6683.8710,786
Table 4. Key elements of the crash risk level classification model’s training.
Type of RFClassification
Number of trees500
Number of variables tried at each split3
Out-Of-Bag estimate of error rate9.38%
Response VariableCrash Risk Level
Predictorsavg_speed, speed_limit, Curve1, Lcurve1_in_seg, lanes, lane_width, pav_ins_sh_width, median_width,
dist_edginssh_barf, pav_out_sh_width, dist_edgoutsh_barf, avgha_pertrip_perc, avghb_pertrip_perc, avg_sp_ev_pertrip_perc
Table 5. Performance evaluation metrics for each crash risk level.
Crash Risk LevelPrecisionRecallF1 Score
187.5%87.5%87.5%
288.5%88.5%88.5%
390.9%83.3%87.0%
489.0%94.2%91.5%
Macro-averaged metrics89.0%88.4%88.6%
Disclaimer/Publisher’s Note: The statements, opinions and data contained in all publications are solely those of the individual author(s) and contributor(s) and not of MDPI and/or the editor(s). MDPI and/or the editor(s) disclaim responsibility for any injury to people or property resulting from any ideas, methods, instructions or products referred to in the content.

