
SDNET2021: Annotated NDE Dataset for Subsurface Structural Defects Detection in Concrete Bridge Decks


Abstract
:1. Introduction
2. Experimental Program
2.1. NDE Data Collection
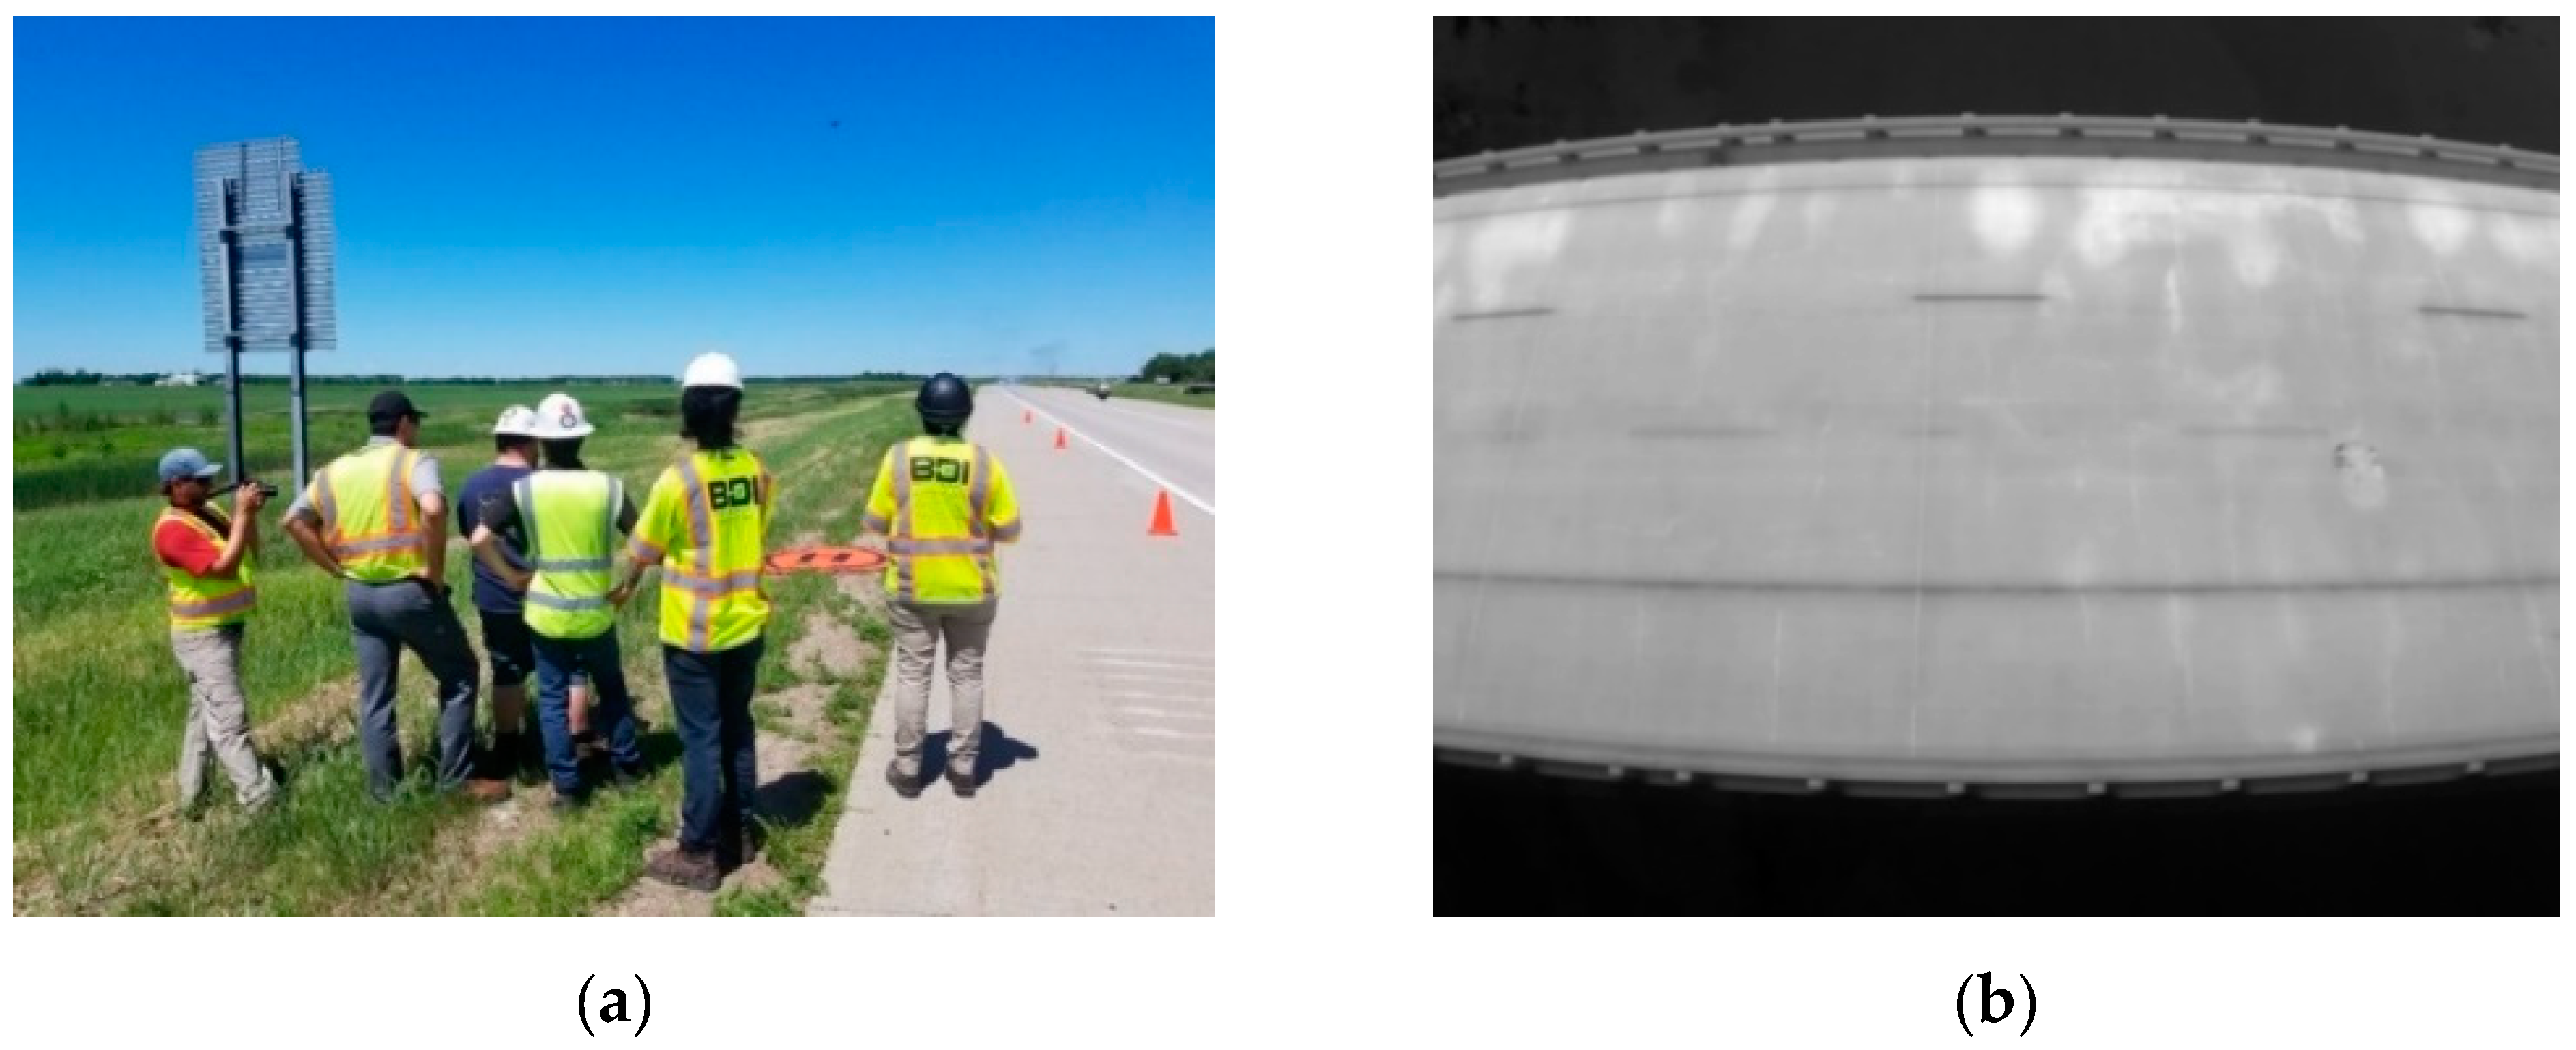
2.1.1. IRT Data Collection
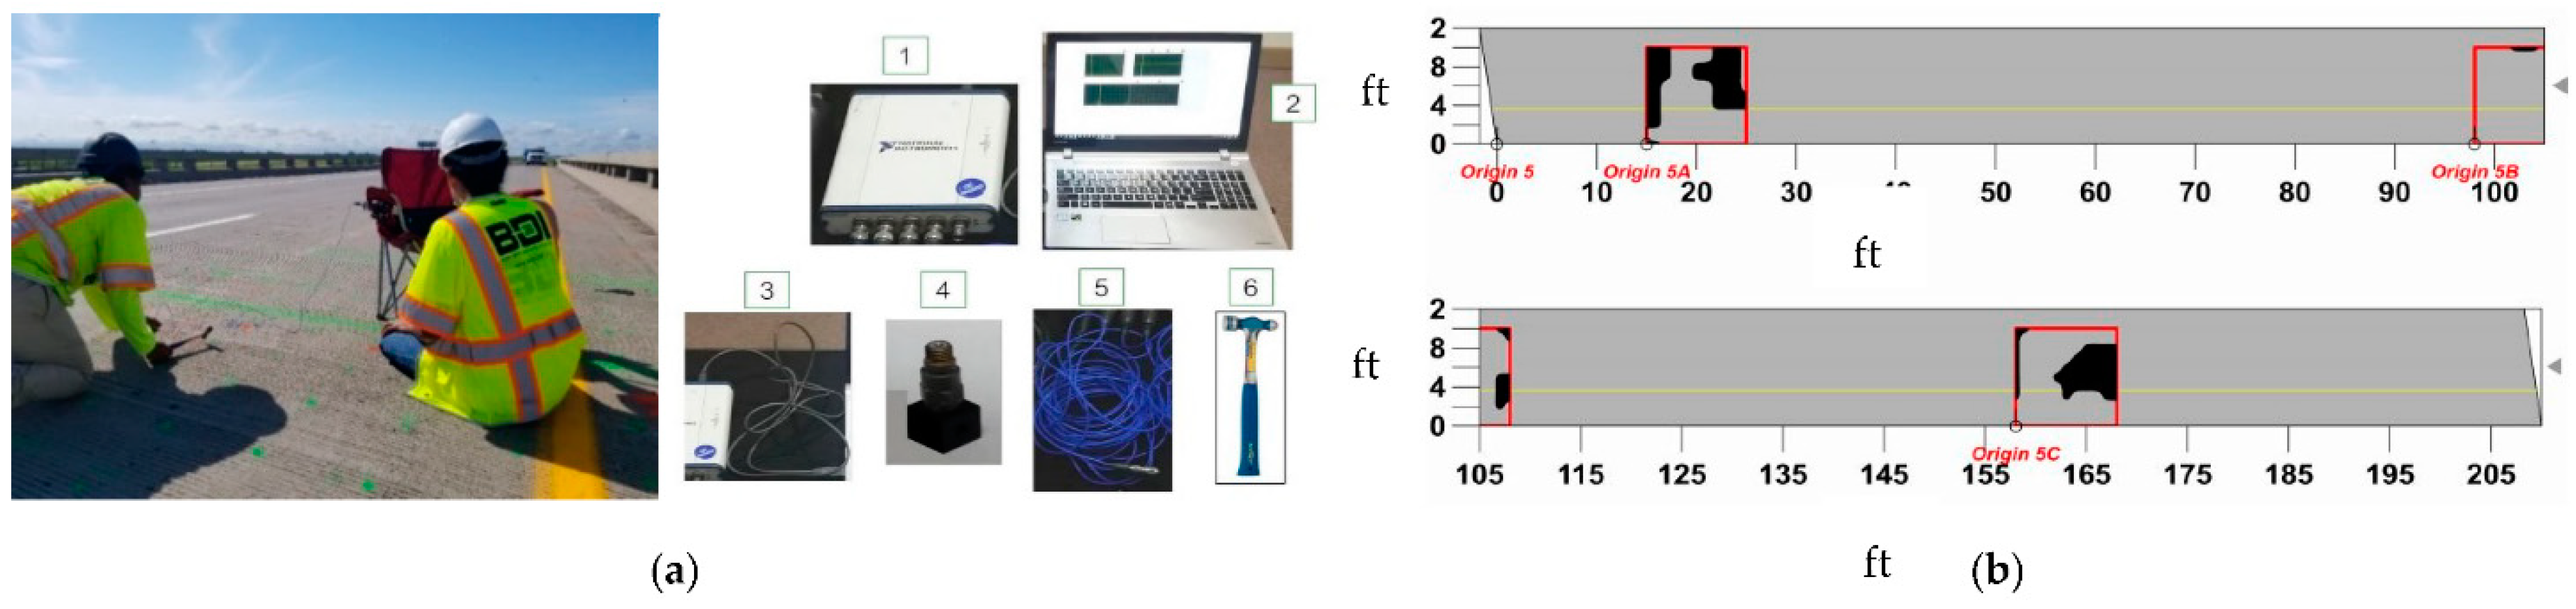
2.1.2. IE Data Collection
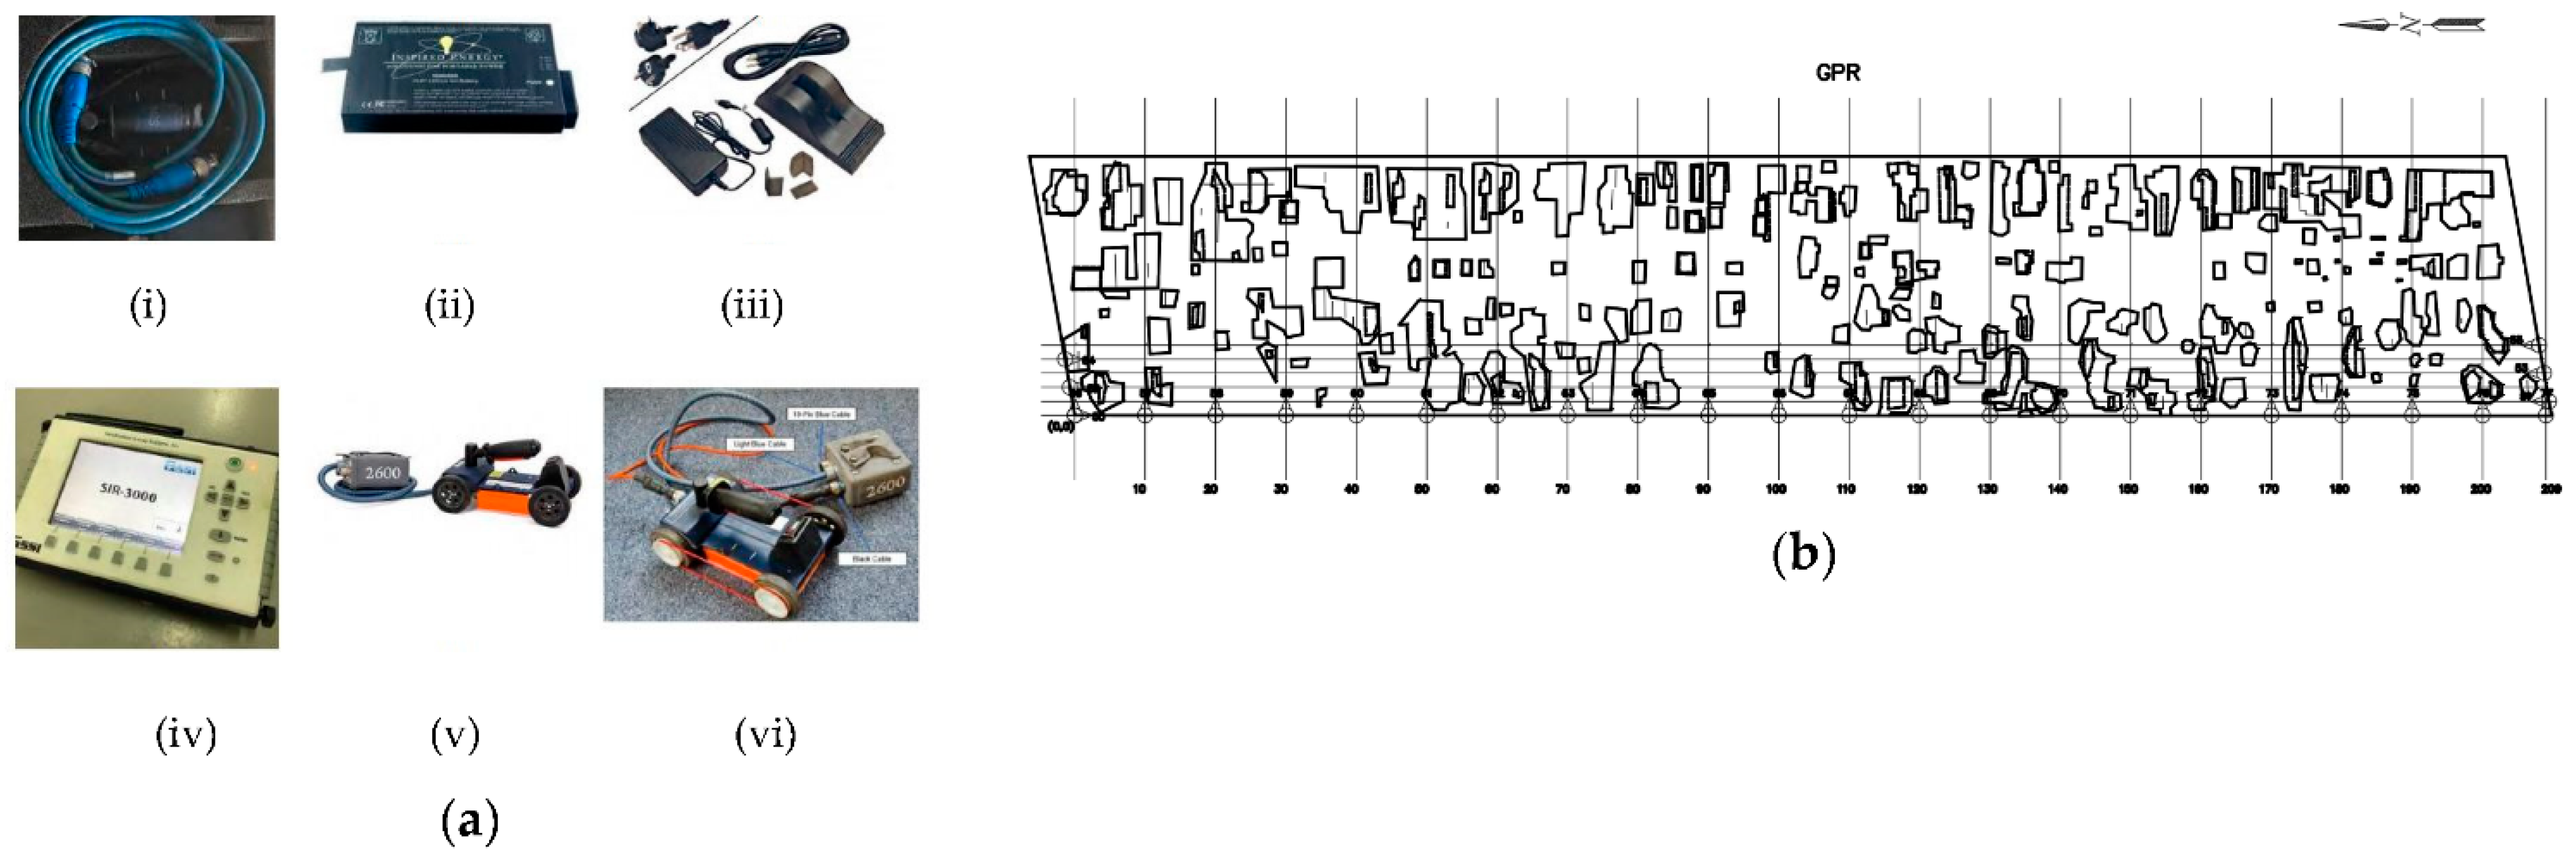
2.1.3. GPR Data Collection
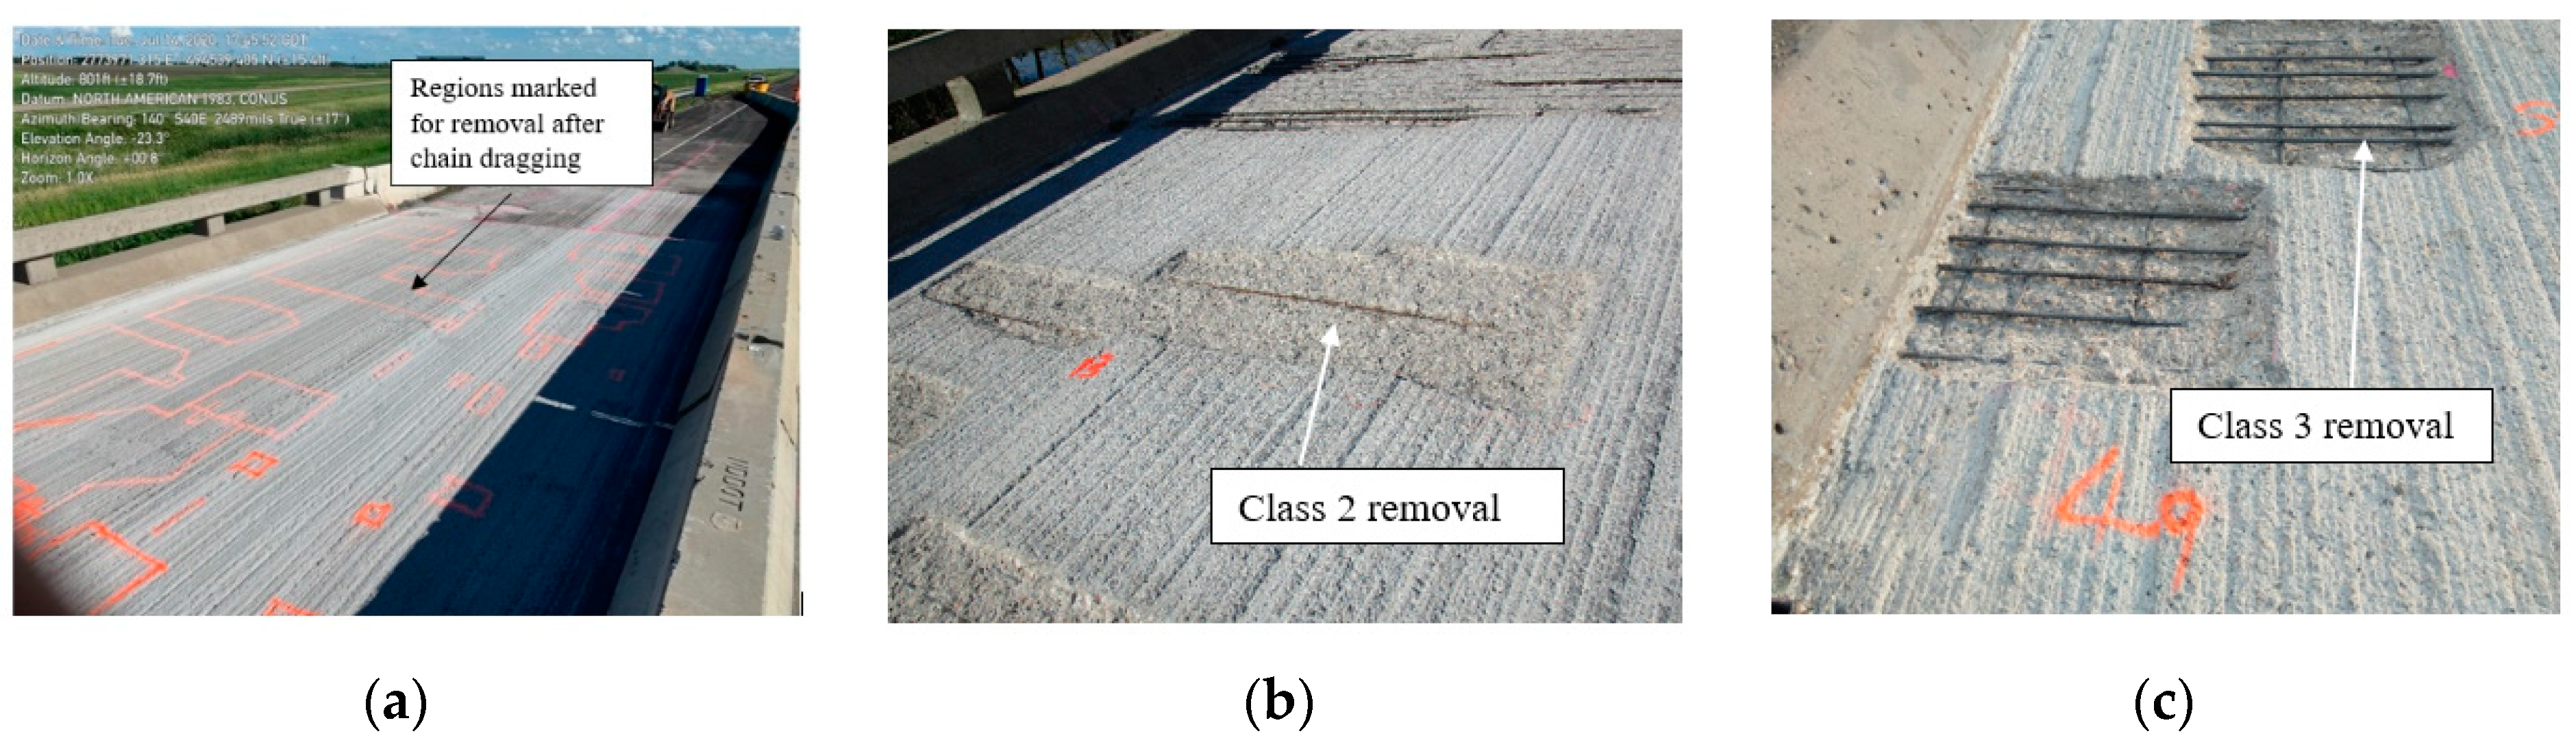
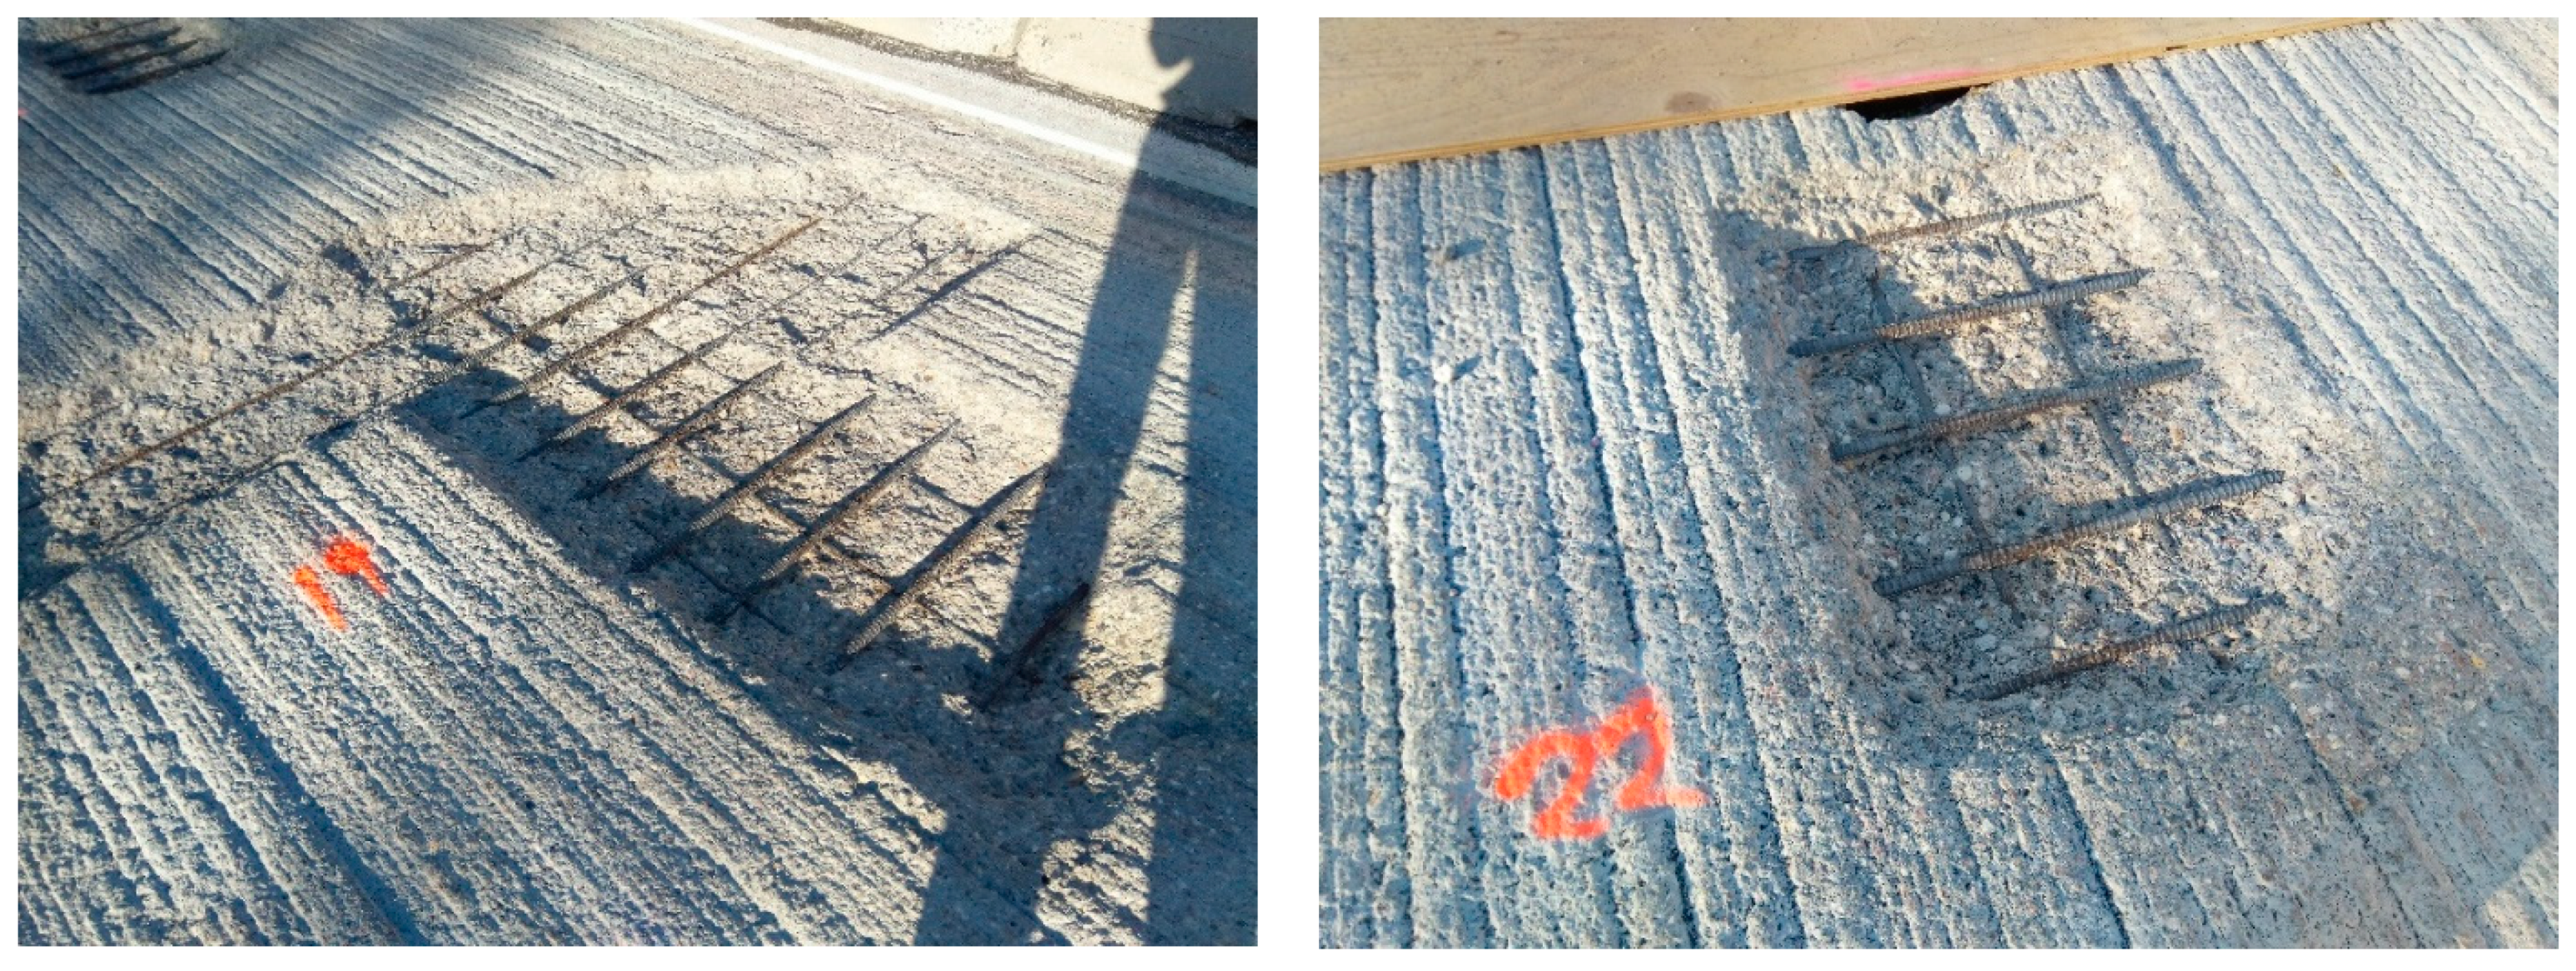
2.2. Ground Truth
2.3. NDE Data Acquisition Conditions
2.4. Quality Assessment of Dataset
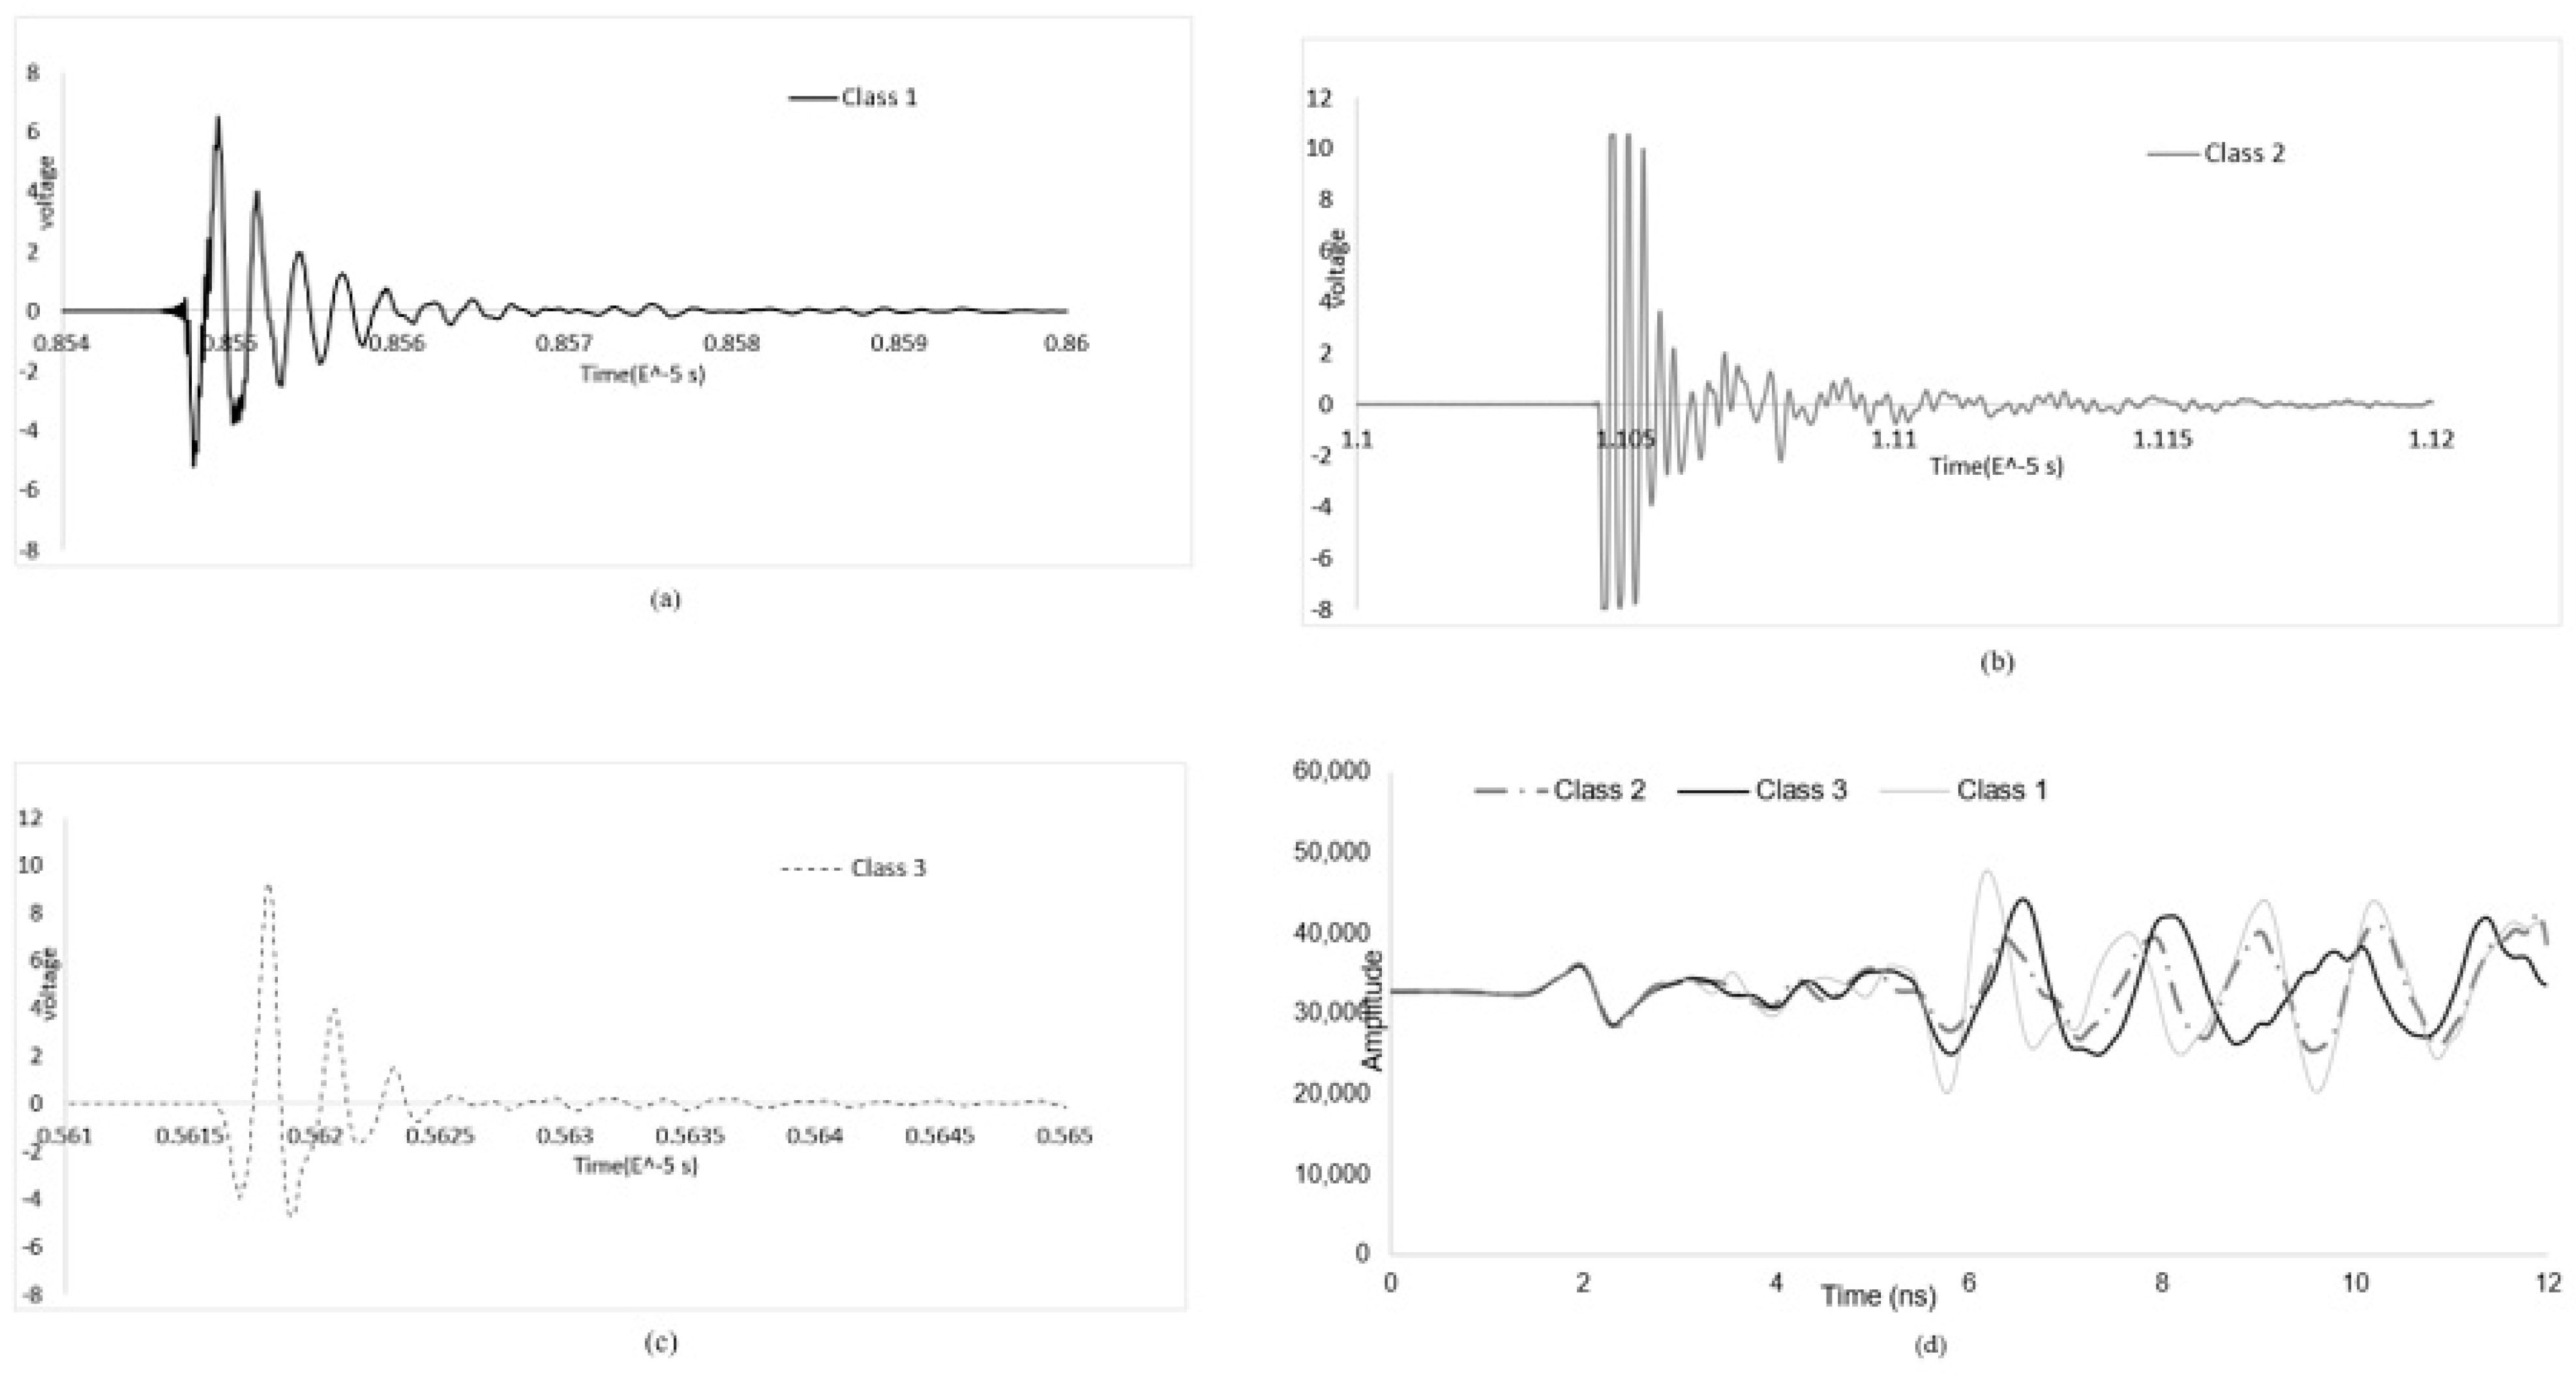
2.4.1. Signals
2.4.2. IRT Quality Assessment
3. Results and Discussion
3.1. Data Annotation
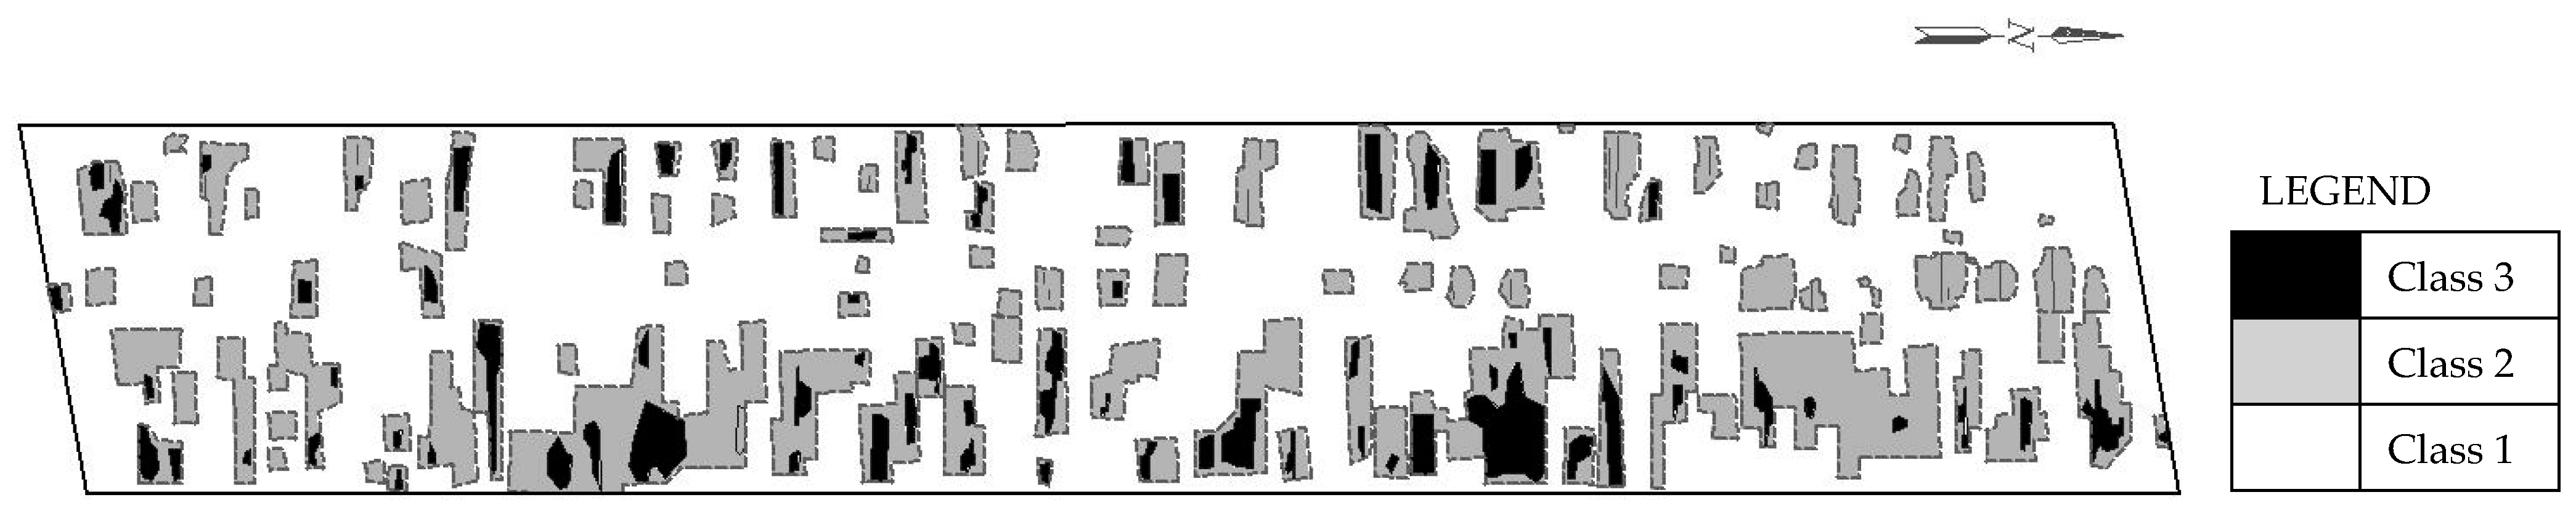
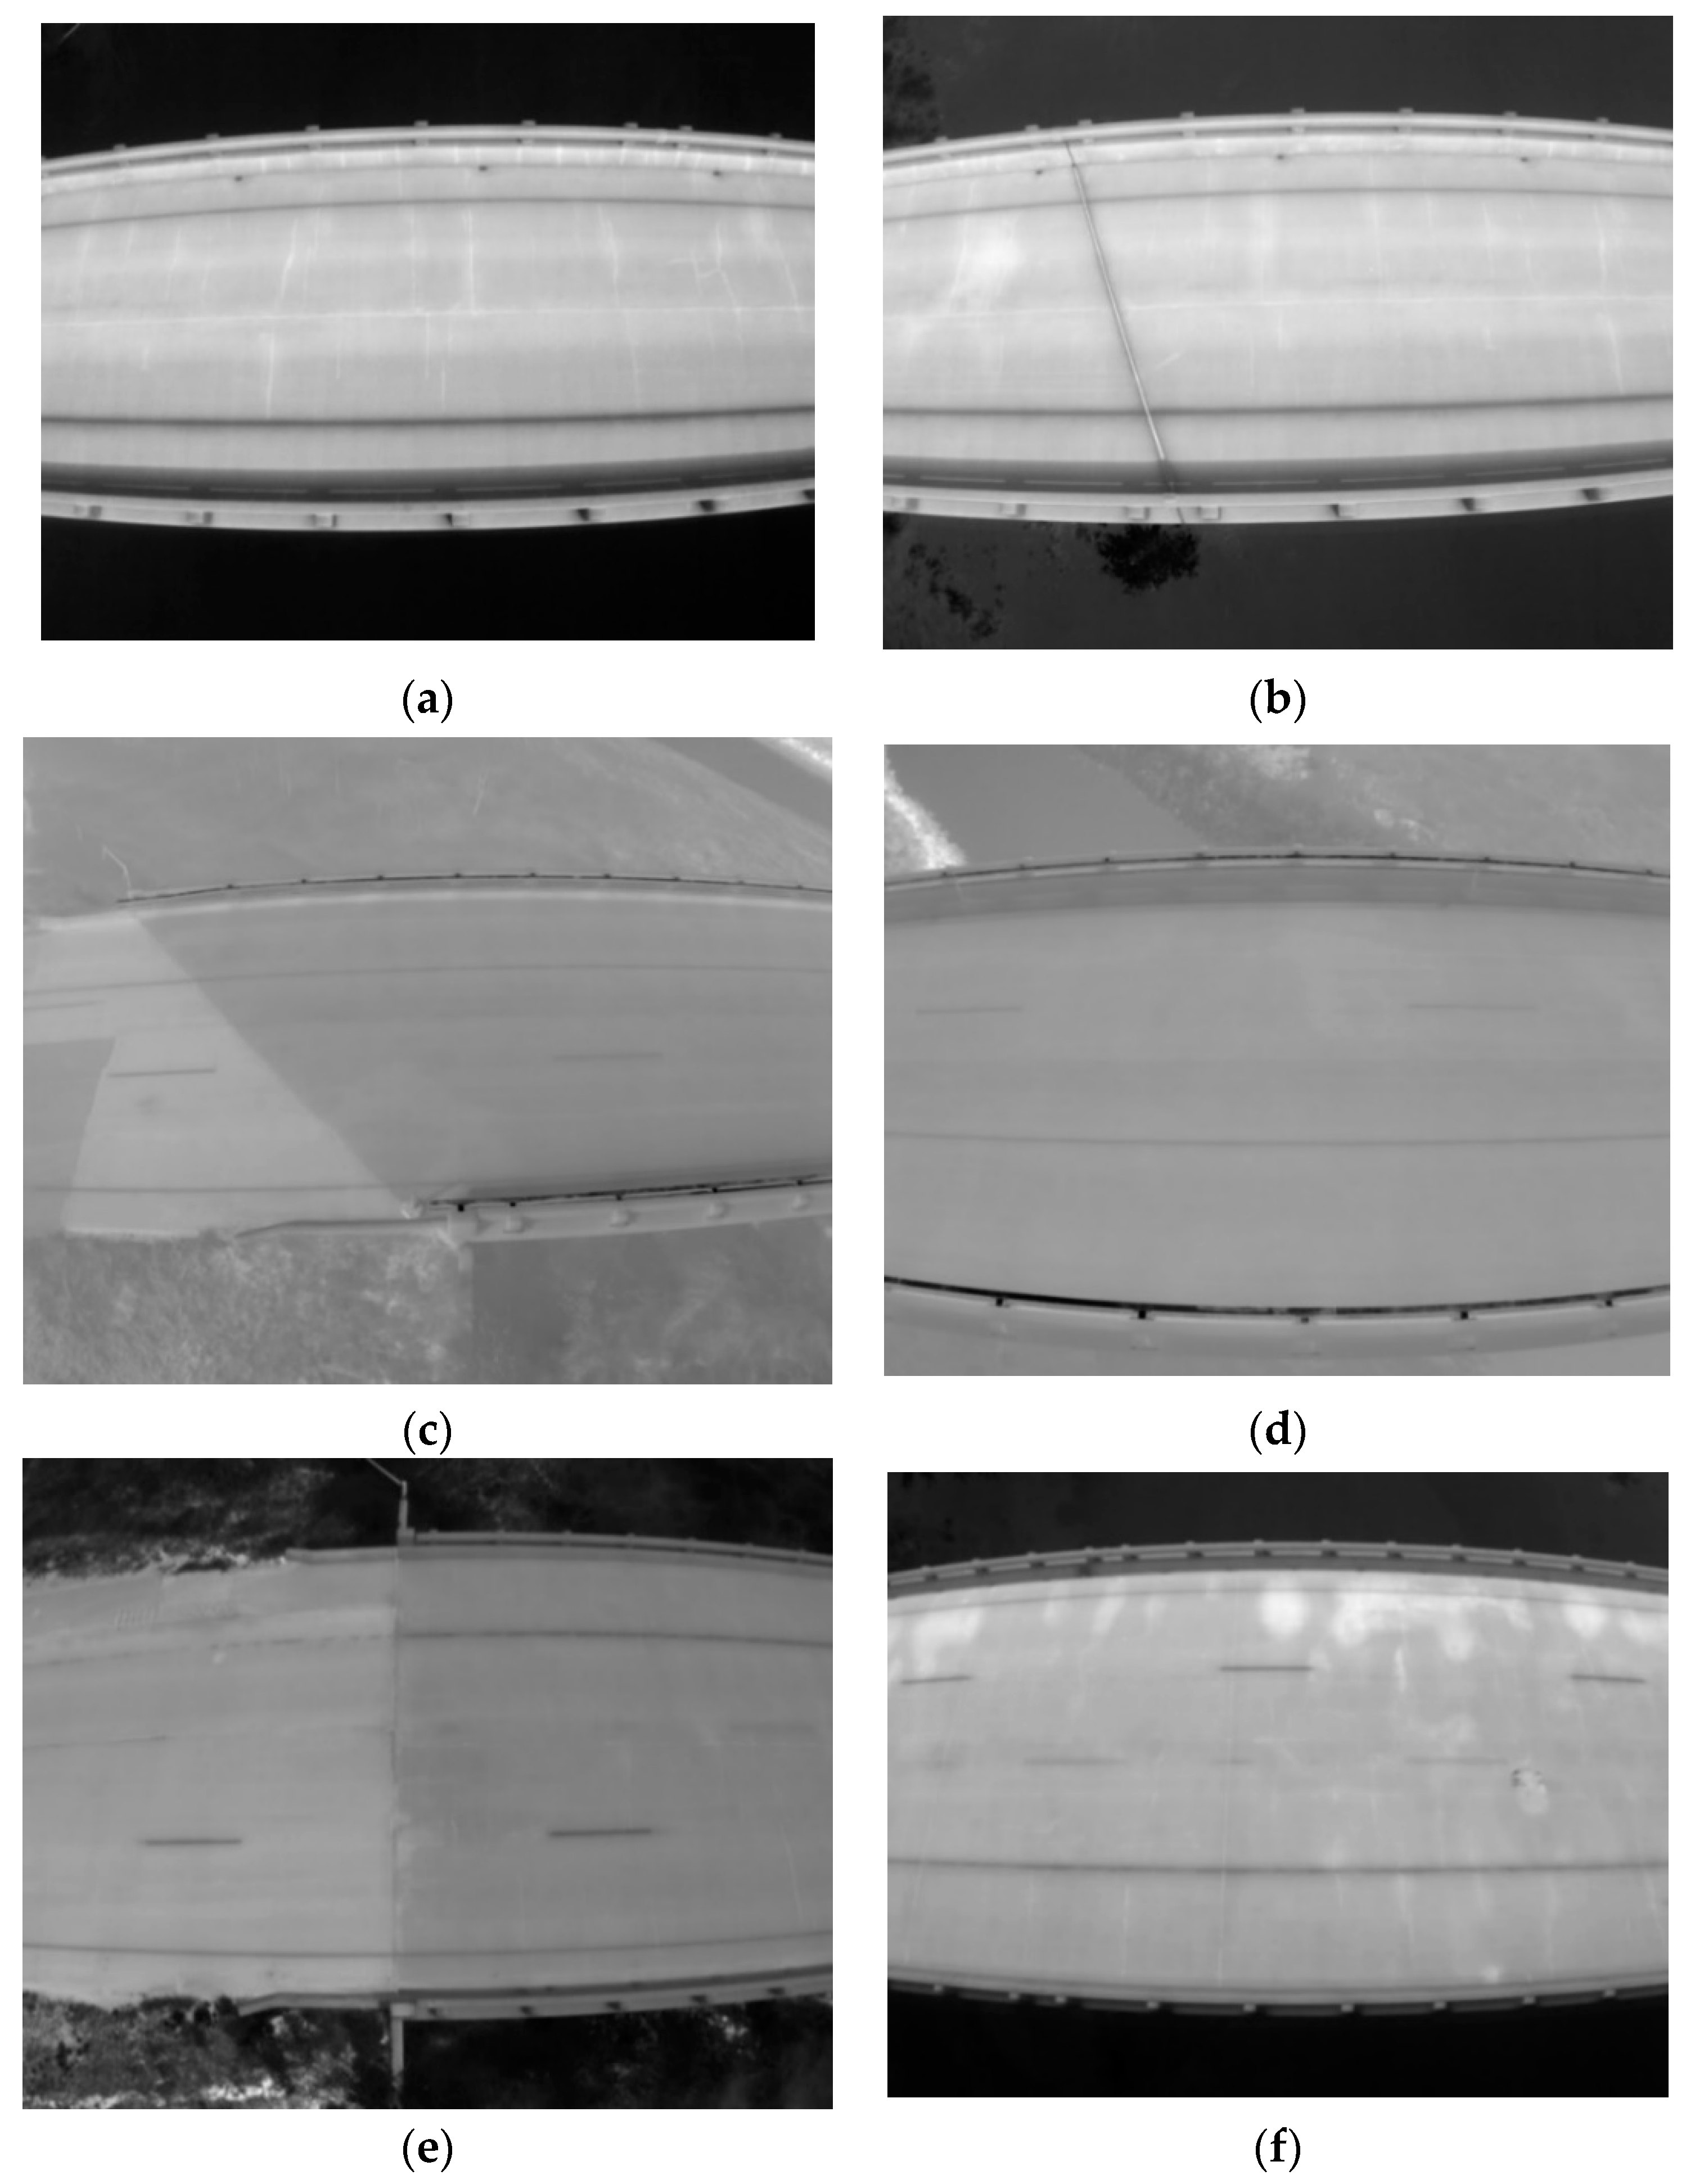
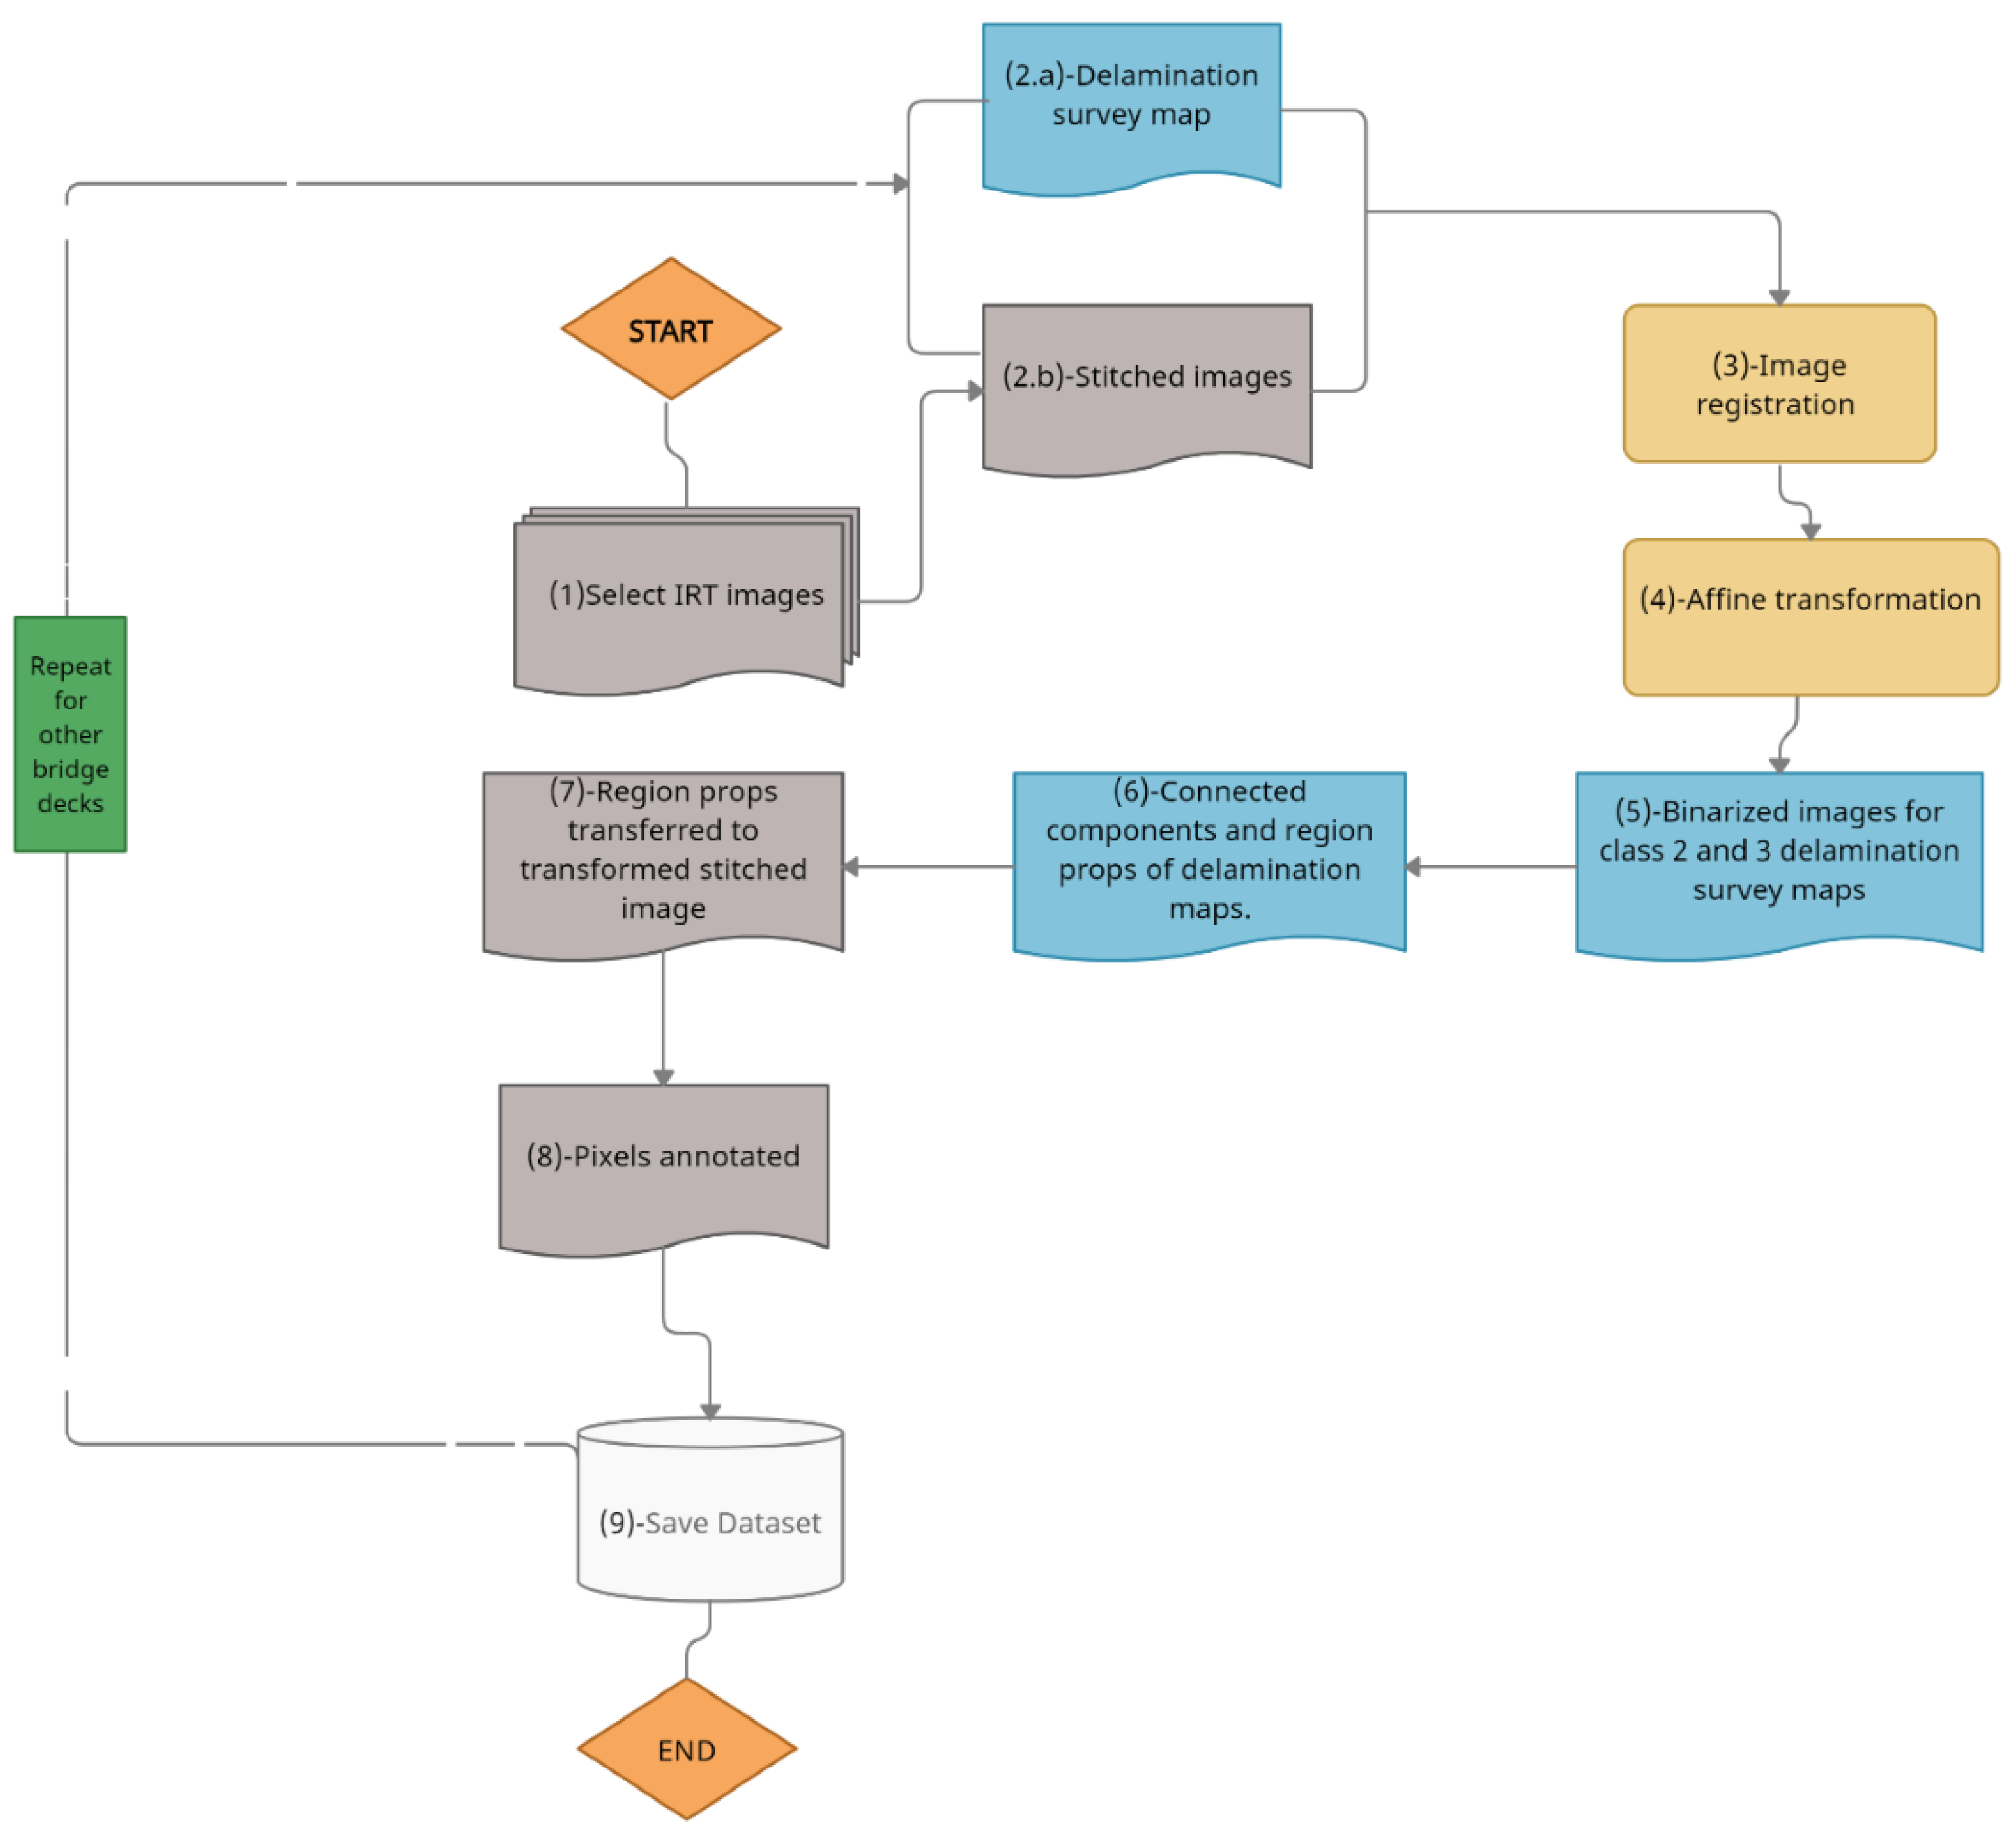
3.2. IRT Image Annotation
3.3. IE Annotation
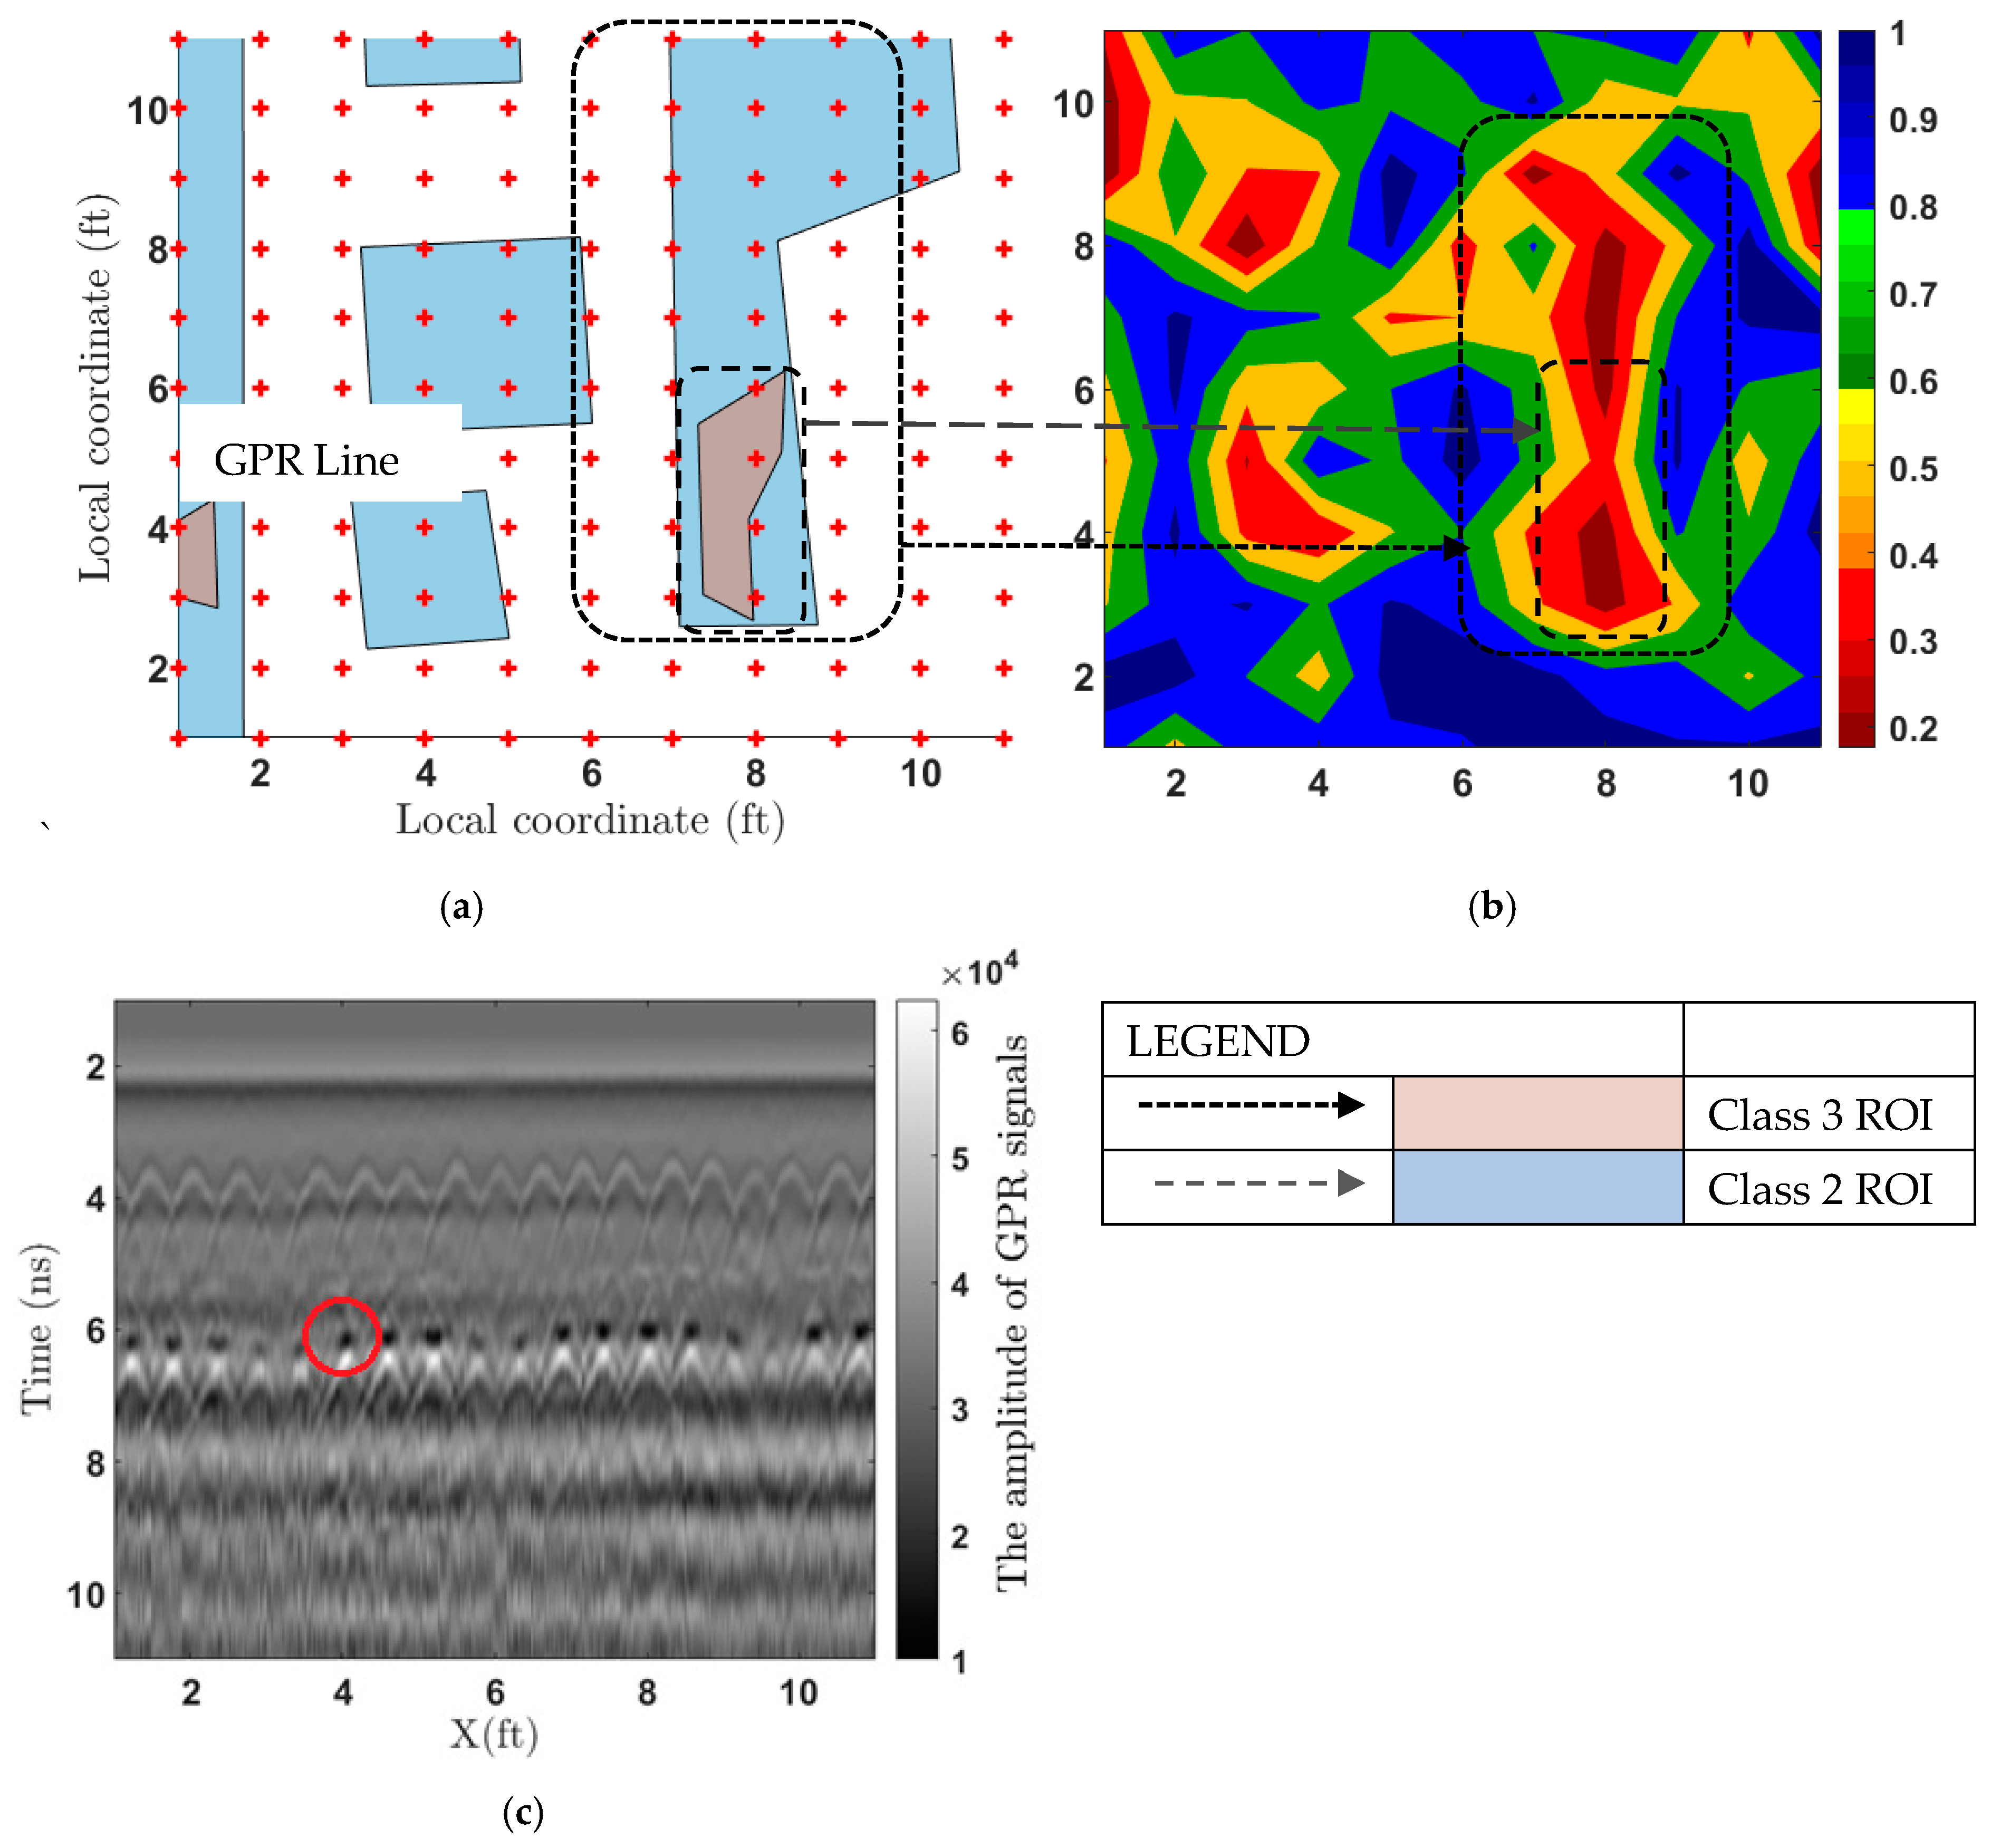
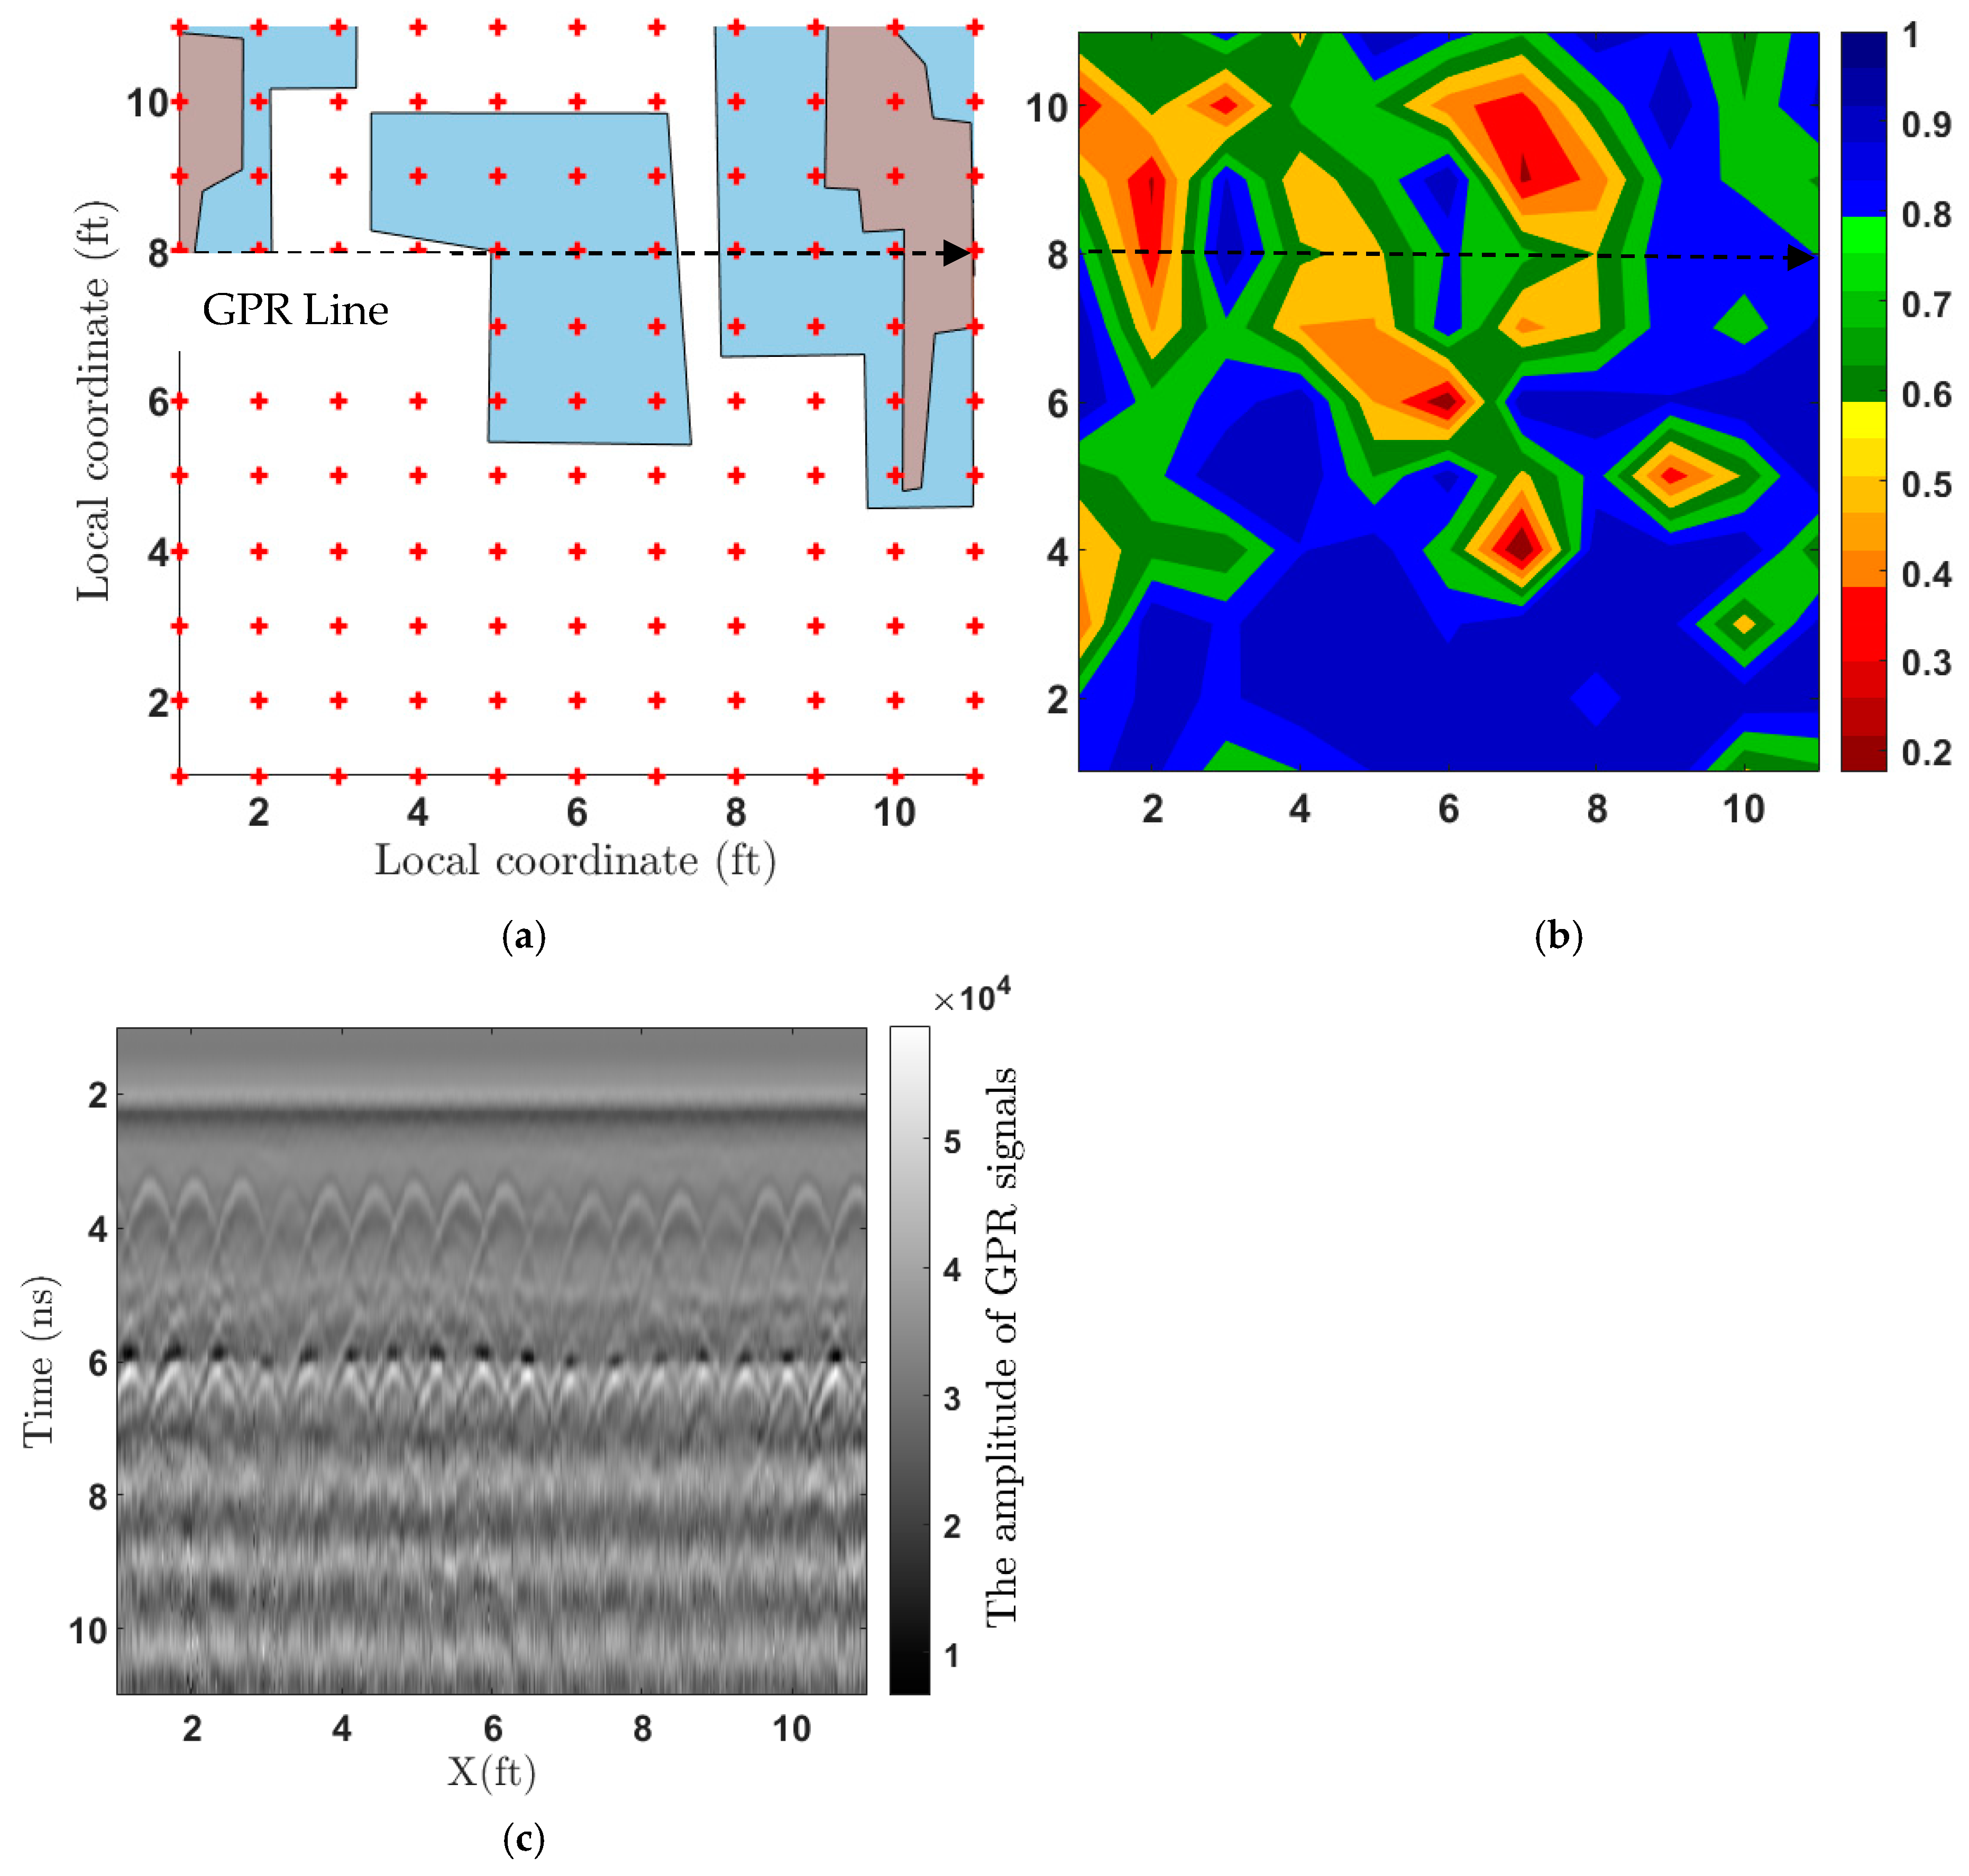
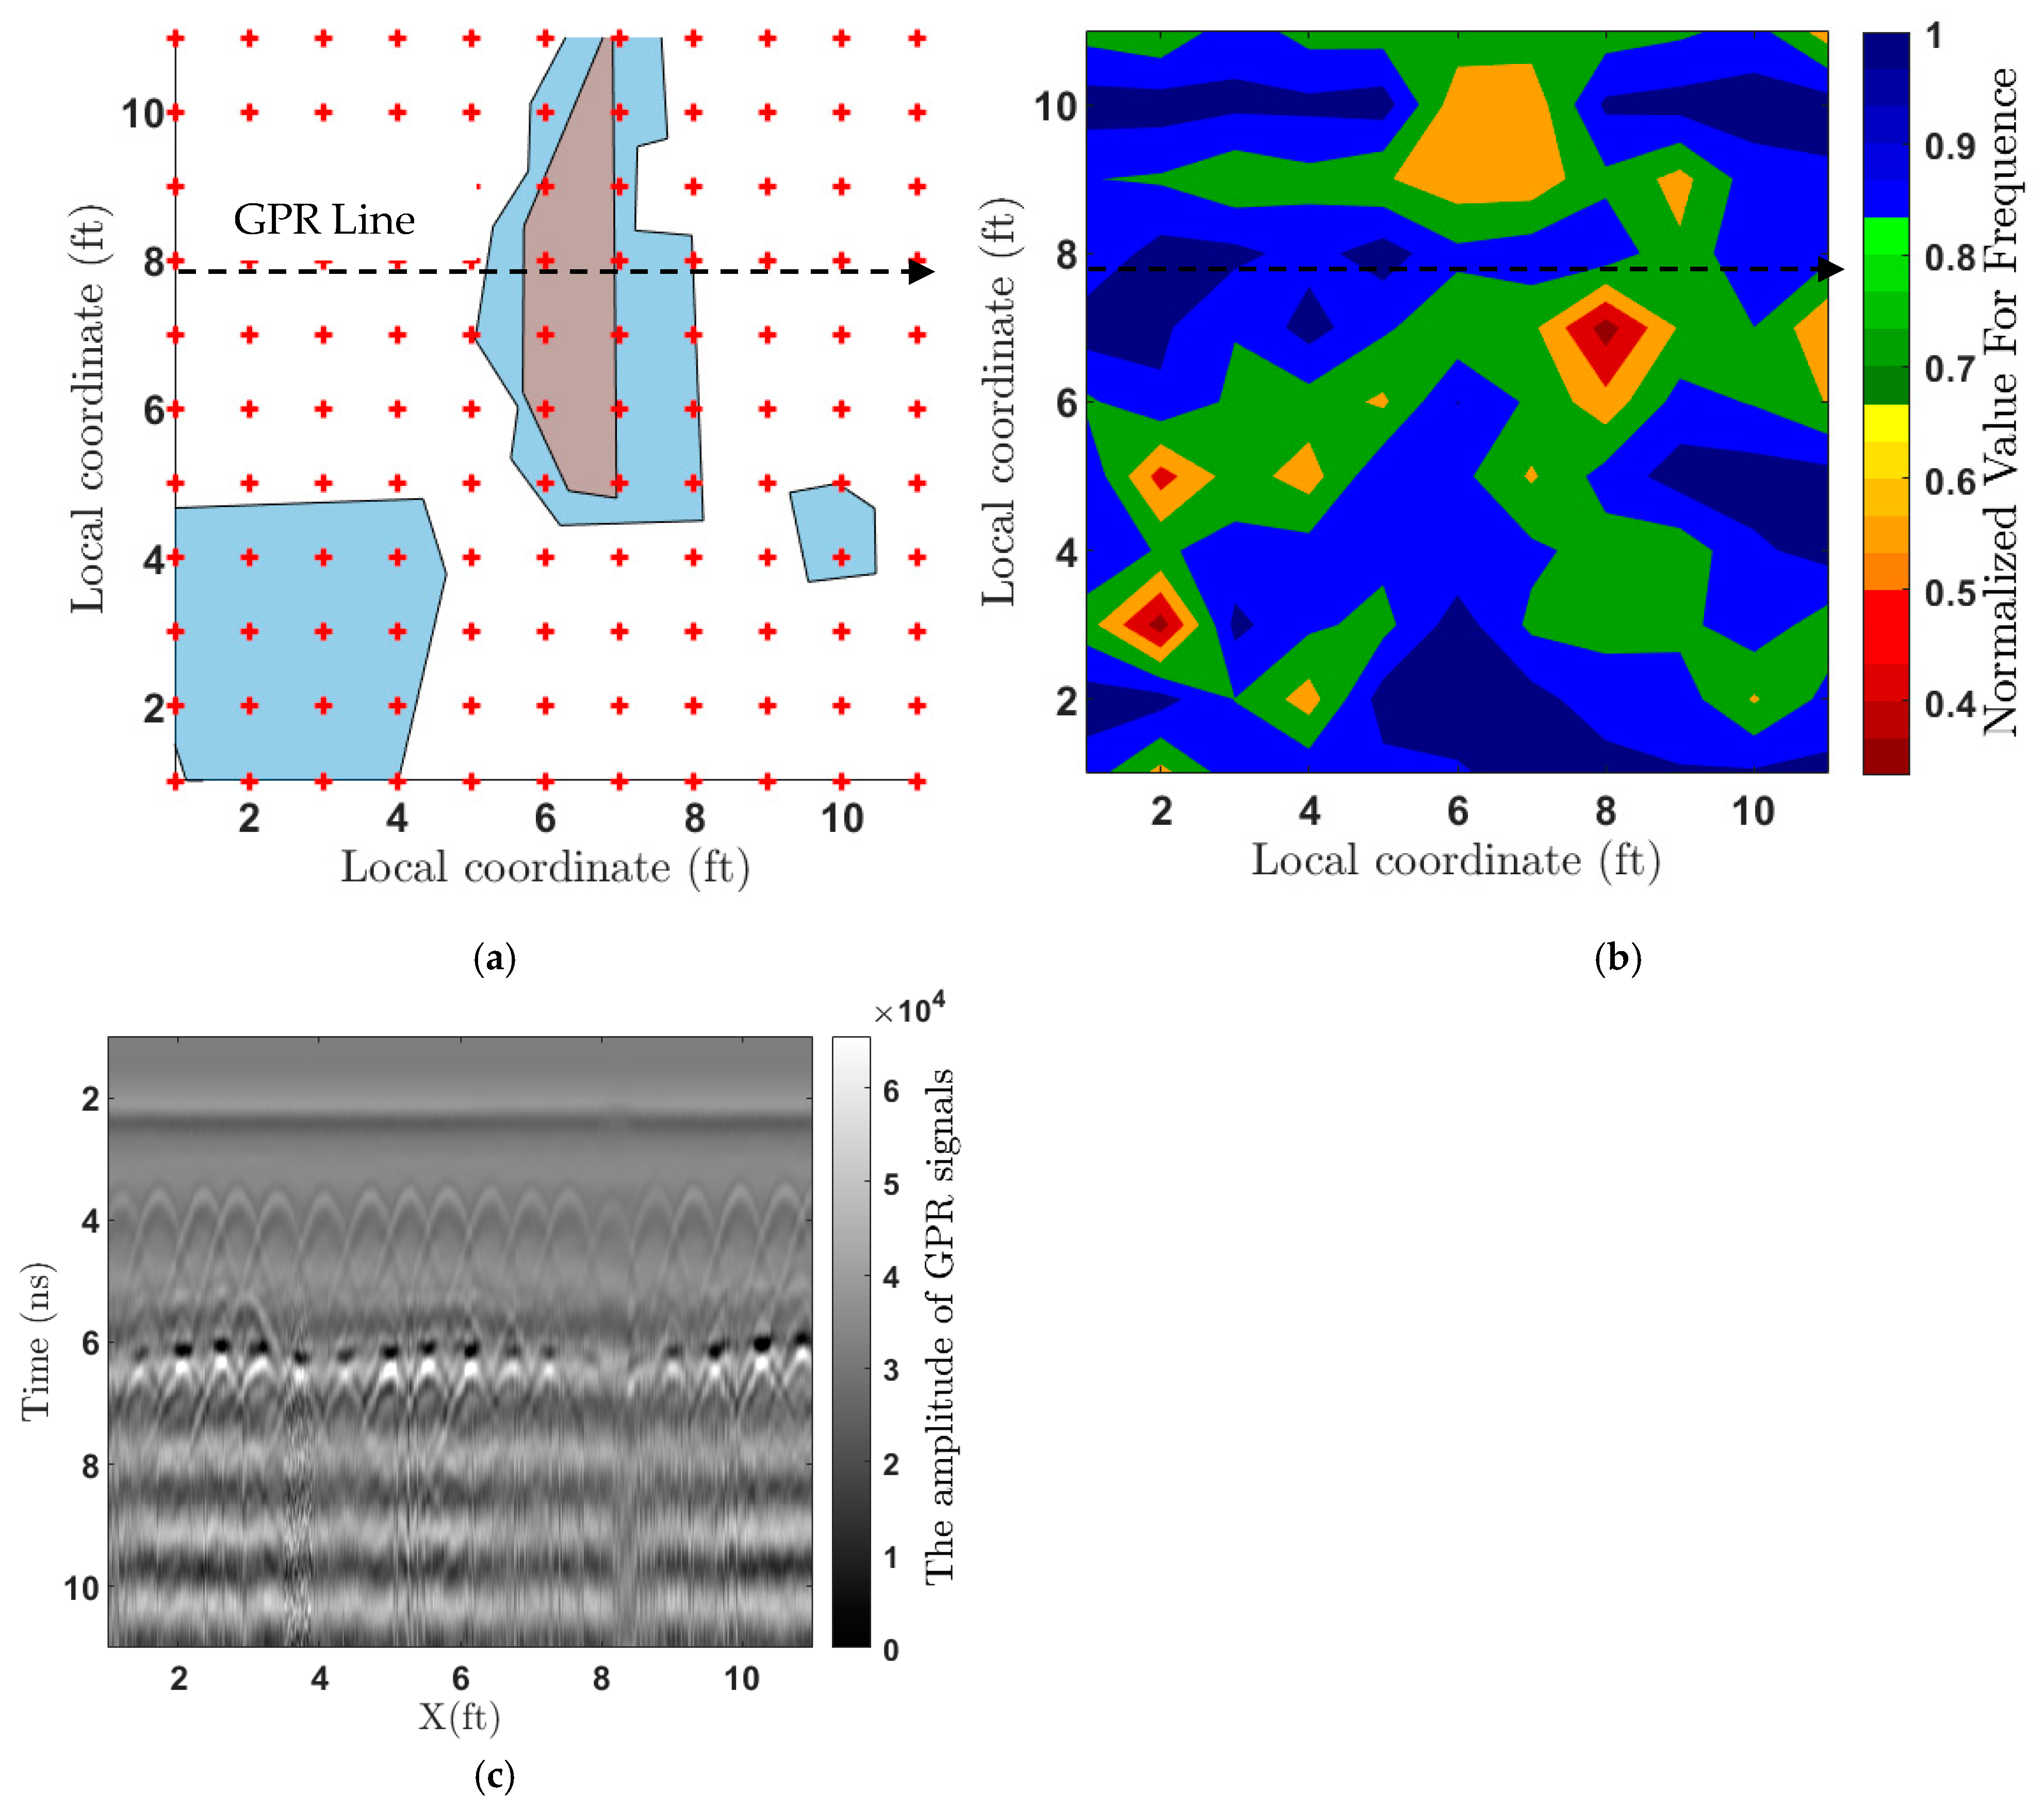
3.4. GPR
- , are the signal discretized sub-divisions for longitudinal and transverse signals respectively,
- , are the length of the signal scans for longitudinal and transverse signals respectively,
- n is the number of signal amplitudes,
- , are the initial coordinate coordinates of the longitudinal and transverse scans, respectively.
- , are the cumulative coordinates of the longitudinal and transverse scans, respectively.
3.5. SDNET2021 Validation, Processing and Evalsuation
3.5.1. IRT Data
3.5.2. IE Data
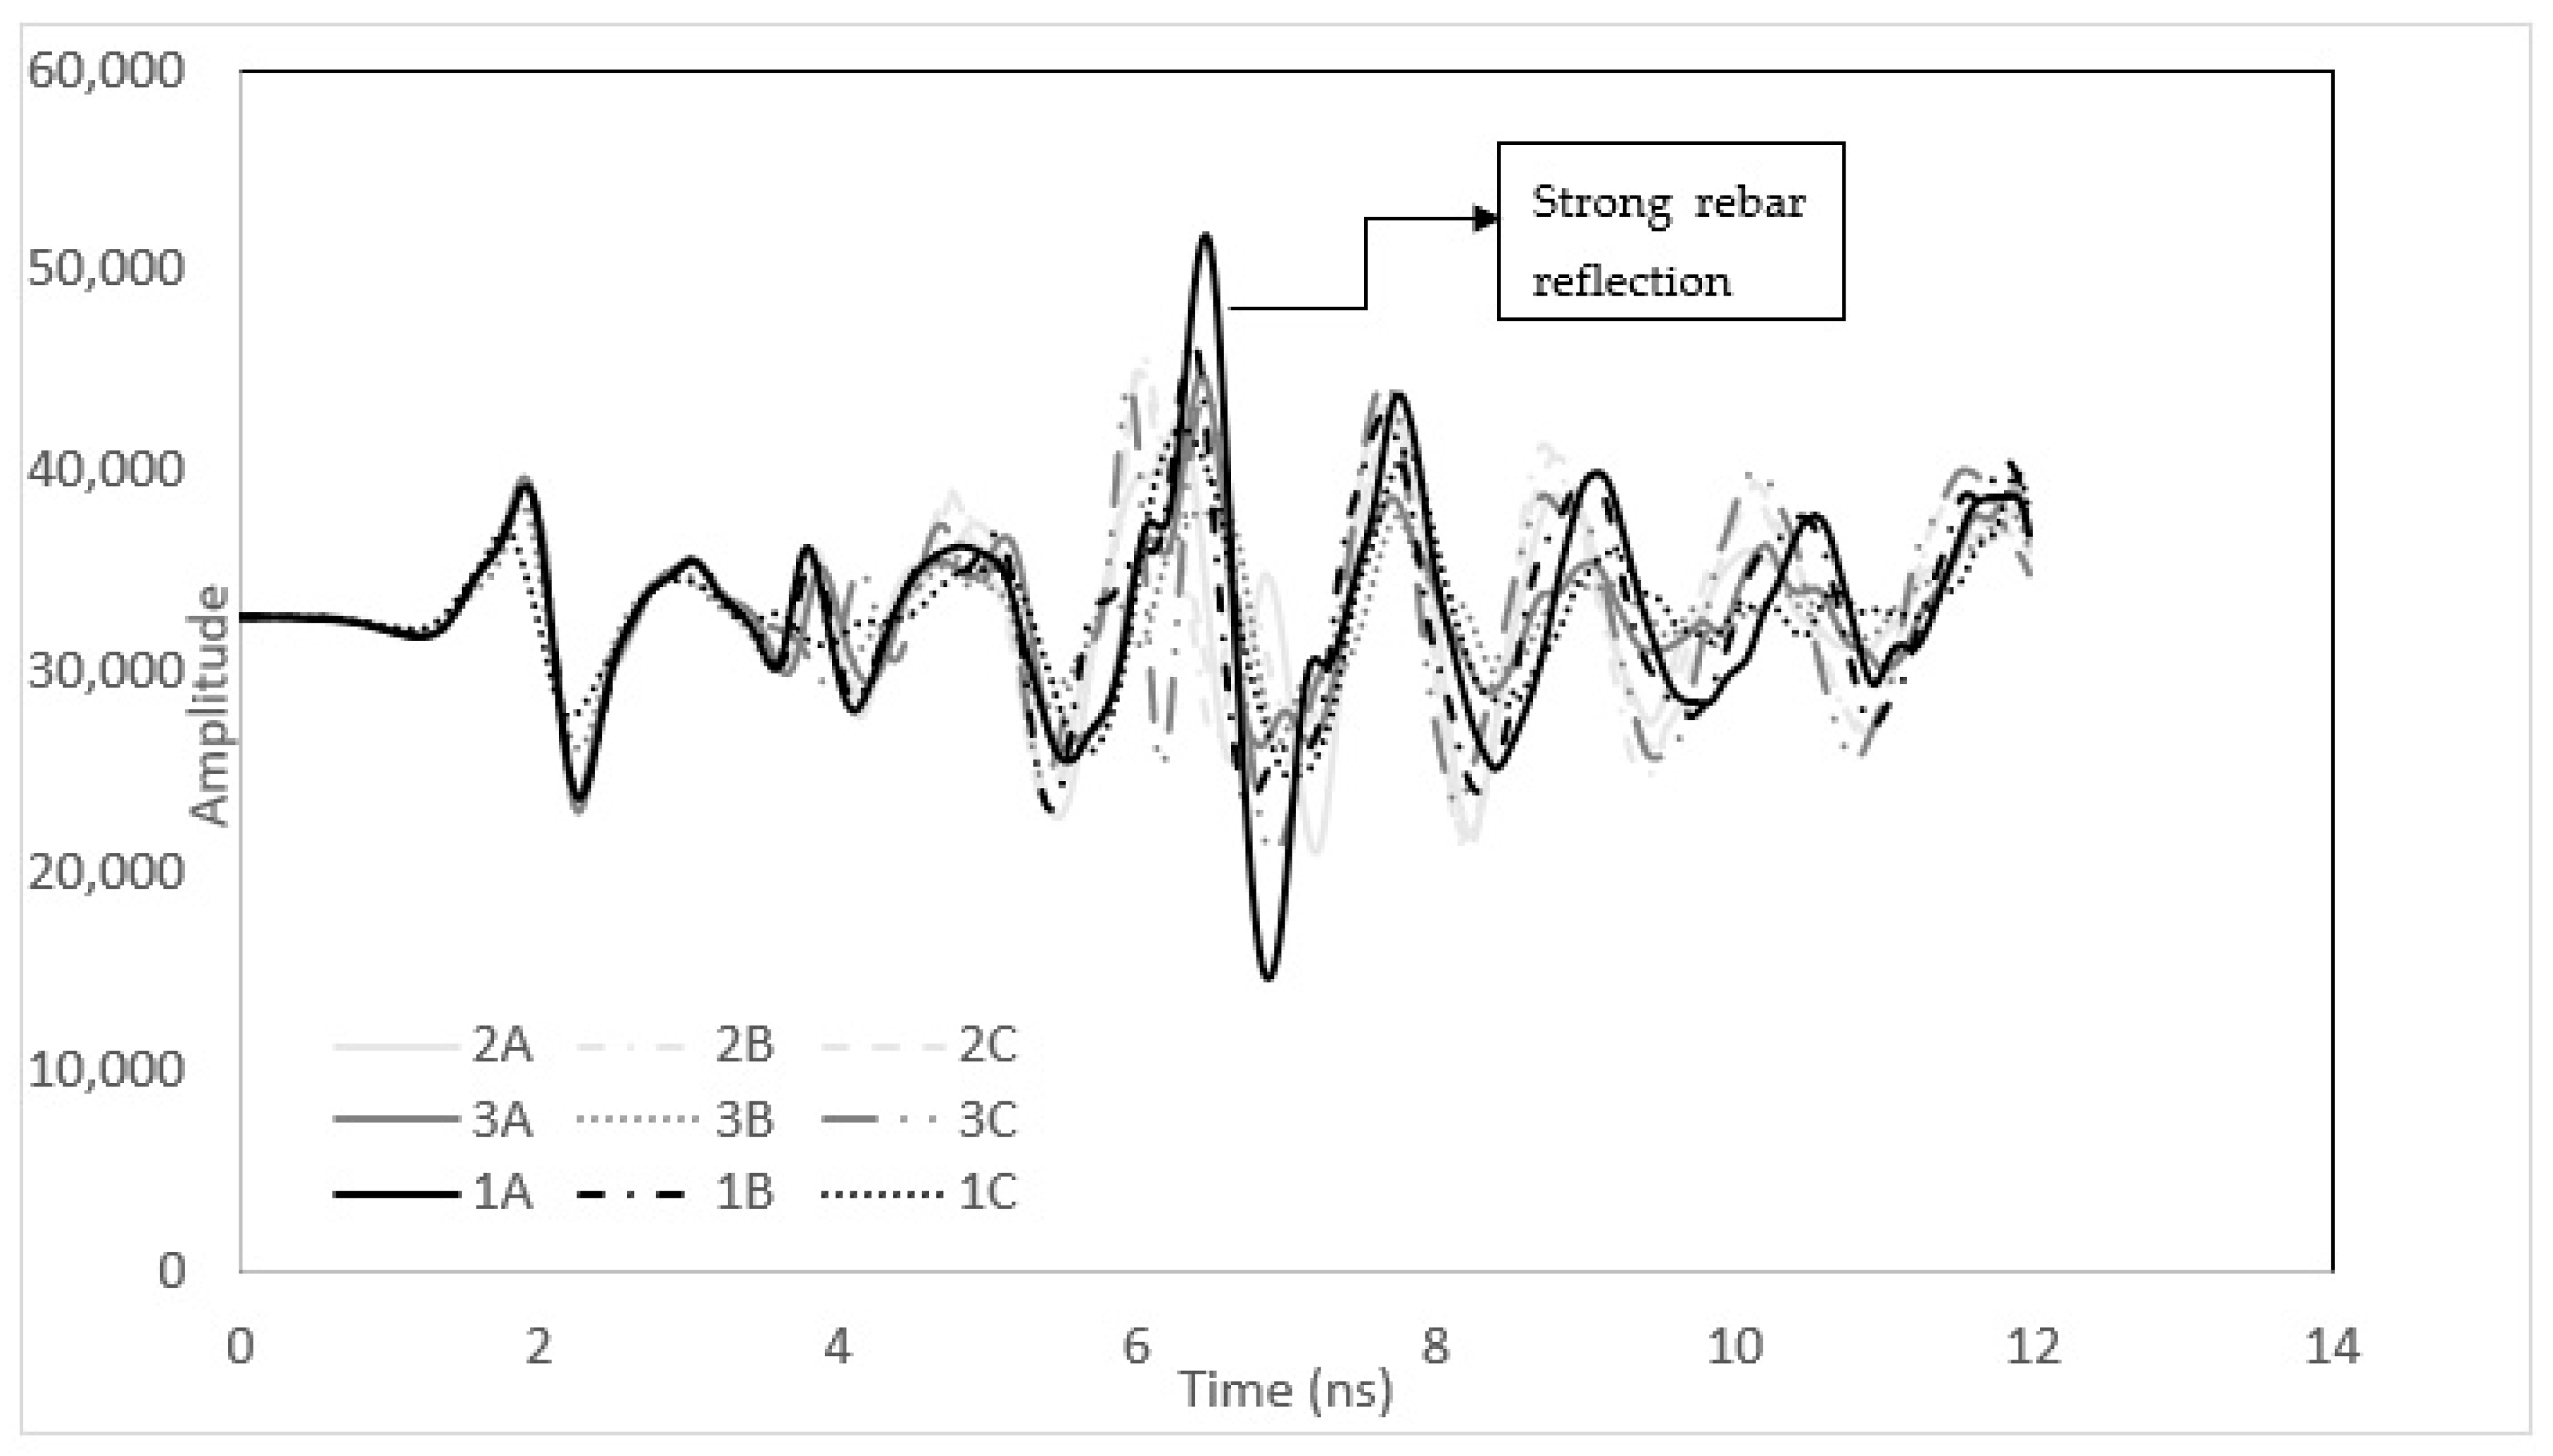
3.5.3. GPR Signal Data
3.6. Significance and Potential Use of Dataset
- Developing a pre-trained model with annotated NDE dataset will be very useful in bridge evaluation. In addition, this dataset will provide a basis for developing pre-trained AI models for IE, GPR, and IRT datasets in classifying and detecting bridge defects.
- SDNET2021 also provides useful data for adopting data fusion in defect detection. Data fusion requires merging two or more NDE data to develop more accurate prediction and detection models. For example, the SDNET2021 dataset, which has been collected for IE, GPR, and IRT, could be fused to improve the detectability of defects compared to when adopted independently.
- IRT, IE, and GPR datasets have been annotated with validated ground truth. This dataset is a benchmark for evaluating bridge deck sub-surface defects.
- The dataset provides a means for continued concrete bridge deck evaluation with the aid of AI models, especially the use of convolutional neural network (CNN) models, which are still being explored. CNN use is promising for providing an unbiased and inexpensive way to analyze and interpret bridge evaluation data without operator input, compared to the conventional method of using expert evaluation.
- This reliable dataset will be available to professionals that need to investigate the relationships between concrete deck surfaces and subsurface defects using AI models.
- The dataset will be an excellent resource for developing data fusion of the different NDE data types, which will help professionals investigate the reliability and precision of one method relative to the other.
- A deep learning model trained on SDNET2021 can be used to investigate the detection of sub-surface delamination of varying sizes and depths.
4. Conclusions
- Providing data for in-service bridge decks,
- Benchmarking dataset for evaluating bridge deck sub-surface defects,
- Developing CNN for defect detection and classification,
- Being available to professionals for investigating the relationships between surfaces and subsurface defects using AI models,
- Developing data fusion of different NDE data types,
- Investigating the detection of sub-surface delamination of varying sizes and depths.
Author Contributions
Funding
Data Availability Statement
Acknowledgments
Conflicts of Interest
References
- Dorafshan, S.; Azari, H. Deep learning models for bridge deck evaluation using impact echo. Constr. Build. Mater. 2020, 263, 120109. [Google Scholar] [CrossRef]
- Dorafshan, S.; Azari, H. Evaluation of bridge decks with overlays using impact echo, a deep learning approach. Autom. Constr. 2020, 113, 103133. [Google Scholar] [CrossRef]
- Dorafshan, S.; Thomas, R.J.; Maguire, M. Comparison of deep convolutional neural networks and edge detectors for image-based crack detection in concrete. Constr. Build. Mater. 2018, 186, 1031–1045. [Google Scholar] [CrossRef]
- Dorafshan, S.; Thomas, R.J.; Maguire, M. SDNET2018: An annotated image dataset for non-contact concrete crack detection using deep convolutional neural networks. Data Brief 2018, 21, 1664–1668. [Google Scholar] [CrossRef] [PubMed]
- McLaughlin, E.; Charron, N.; Narasimhan, S. Combining deep learning and robotics for automated concrete delamination assessment. In ISARC, Proceedings of the International Symposium on Automation and Robotics in Construction, Banff Alberta, AB, Canada, 21–24 May 2019; IAARC: Oulu, Finland, 2019. [Google Scholar] [CrossRef]
- Liu, W.; Huang, Y.; Li, Y.; Chen, Q. FPCNet: Fast pavement crack detection network based on Encoder-Decoder architecture. arXiv 2019, arXiv:1907.02248. Available online: http://arxiv.org/abs/1907.02248 (accessed on 10 June 2022).
- Mei, Q.; Gül, M. A cost effective solution for pavement crack inspection using cameras and deep neural networks. Constr. Build. Mater. 2020, 256, 119397. [Google Scholar] [CrossRef]
- Kalogeropoulos, A.; Van Der Kruk, J.; Hugenschmidt, J.; Bikowski, J.; Brühwiler, E. Full-waveform GPR inversion to assess chloride gradients in concrete. NDT E Int. 2013, 57, 74–84. [Google Scholar] [CrossRef]
- Dinh, K.; Zayed, T.; Romero, F.; Tarussov, A. Method for analyzing time-series GPR data of concrete bridge decks. J. Bridge Eng. 2015, 20, 04014086. [Google Scholar] [CrossRef]
- Liu, H.; Lin, C.; Cui, J.; Fan, L.; Xie, X.; Spencer, B.F. Detection and localization of rebar in concrete by deep learning using ground penetrating radar. Autom. Constr. 2020, 118, 103279. [Google Scholar] [CrossRef]
- Eisenbach, M.; Stricker, R.; Seichter, D.; Amende, K.; Debes, K.; Sesselmann, M.; Gross, H. How to get pavement distress detection ready for deep learning? A systematic approach. In Proceedings of the 2017 International Joint Conference on Neural Networks (IJCNN), Anchorage, AK, USA, 14–19 May 2017; pp. 2039–2047. [Google Scholar] [CrossRef]
- Amhaz, R.; Chambon, S.; Idier, J.; Baltazart, V. Automatic crack detection on two-dimensional pavement images: An algorithm based on minimal path selection. In IEEE Transactions on Intelligent Transportation Systems; IEEE Intelligent Transportation Systems Council: Piscataway, NJ, USA, 2016; Volume 17, pp. 2718–2729. [Google Scholar] [CrossRef]
- Shi, Y.; Cui, L.; Qi, Z.; Meng, F.; Chen, Z. Automatic road crack detection using random structured forests. In IEEE Transactions on Intelligent Transportation Systems; IEEE Intelligent Transportation Systems Council: Piscataway, NJ, USA, 2016; Volume 17, pp. 3434–3445. [Google Scholar] [CrossRef]
- Yang, F.; Zhang, L.; Yu, S.; Prokhorov, D.; Mei, X.; Ling, H. Feature pyramid and hierarchical boosting network for pavement crack detection. In IEEE Transactions on Intelligent Transportation Systems; IEEE Intelligent Transportation Systems Council: Piscataway, NJ, USA, 2020; Volume 21, pp. 1525–1535. [Google Scholar] [CrossRef]
- Chambon, S.; Moliard, J.-M. Automatic Road pavement assessment with image processing: Review and comparison. Int. J. Geophys. 2011, 2011, 989354. [Google Scholar] [CrossRef]
- Özgenel, Ç.F.; Sorguç, A.G. Performance comparison of pretrained convolutional neural networks on crack detection in buildings. In Proceedings of the 35th International Symposium on Automation and Robotics in Construction (ISARC), Berlin, Germany, 20–25 July 2018. [Google Scholar] [CrossRef]
- Fan, Z.; Li, C.; Chen, Y.; Wei, J.; Loprencipe, G.; Chen, X.; Di Mascio, P. Automatic crack detection on road pavements using encoder-decoder architecture. Materials 2020, 13, 2960. [Google Scholar] [CrossRef] [PubMed]
- Mundt, M.; Majumder, S.; Murali, S.; Panetsos, P.; Ramesh, V. Meta-learning convolutional neural architectures for multi-target concrete defect classification with the COncrete DEfect BRidge IMage dataset. In Proceedings of the IEEE/CVF Conference on Computer Vision and Pattern Recognition (CVPR), Long Beach, CA, USA, 15–20 June 2019. [Google Scholar] [CrossRef]
- Zhang, A.; Wang, K.C.P.; Fei, Y.; Liu, Y.; Chen, C.; Yang, G.; Li, J.Q.; Yang, E.; Qiu, S. Automated Pixel-Level Pavement Crack Detection on 3D Asphalt Surfaces with a Recurrent Neural Network: Automated pixel-level pavement crack detection on 3D asphalt surfaces using CrackNet-R. Comput. Aided Civ. Infrastruct. Eng. 2019, 34, 213–229. [Google Scholar] [CrossRef]
- Majidifard, H.; Jin, P.; Adu-Gyamfi, Y.; Buttlar, W.G. Pavement image datasets: A new benchmark dataset to classify and densify pavement distresses. Transp. Res. Rec. 2020, 2674, 328–339. [Google Scholar] [CrossRef]
- Dinh, K.; Gucunski, N.; Kim, J.; Duong, T.H. Understanding depth-amplitude effects in assessment of GPR data from concrete bridge decks. NDT E Int. Indep. Nondestruct. Test. Eval. 2016, 83, 48–58. [Google Scholar] [CrossRef]
- Boyd, R.W. Photon bunching and the photon-noise-limited performance of infrared detectors. Infrared Phys. 1982, 22, 157–162. [Google Scholar] [CrossRef]
- ASTM D4788-03; Standard Test Method for Detecting Delaminations in Bridge Decks Using Infrared Thermography. ASTM International: West Conshohocken, PA, USA, 2013.
- Hiasa, S.; Birgul, R.; Catbas, F.N. Effect of Defect Size on Subsurface Defect Detectability and Defect Depth Estimation for Concrete Structures by Infrared Thermography. J. Nondestruct. Eval. 2017, 36, 57. [Google Scholar] [CrossRef]
- ASTM, C. Test method for measuring the P-wave speed and the thickness of concrete plates using the impact-echo method. Annu. Book ASTM Stand. 2010, 1383. [Google Scholar]
- Gucunski, N.; Slabaugh, G.; Wang, Z.; Fang, T.; Maher, A. Impact Echo Data from Bridge Deck Testing: Visualization and Interpretation. Transp. Res. Rec. 2008, 2050, 111–121. [Google Scholar] [CrossRef]
- Abouhamad, M.; Dawood, T.; Jabri, A.; Alsharqawi, M.; Zayed, T. Corrosiveness mapping of bridge decks using image-based analysis of GPR data. Autom. Constr. 2017, 80, 104–117. [Google Scholar] [CrossRef]
- Diamanti, N.; Annan, A.P.; Redman, J.D. Concrete bridge deck deterioration assessment using ground penetrating radar (GPR). Environ. Eng. Geosci. 2017, 22, 121–132. [Google Scholar] [CrossRef]
- Wang, R.Y.; Strong, D.M. Beyond accuracy: What data quality means to data consumers. J. Manag. Inf. Syst. 1996, 12, 5–33. [Google Scholar] [CrossRef]
- Mittal, A.; Soundararajan, R.; Bovik, A.C. Making a “completely blind” image quality analyzer. IEEE Signal Process. Lett. 2012, 20, 209–212. [Google Scholar] [CrossRef]
- Taylor, T.R.; Chao, C.T.; Chiou, J.S. Novel Image State Ensemble Decomposition Method for M87 Imaging. Appl. Sci. 2020, 10, 1535. [Google Scholar] [CrossRef]
- Zhang, M.; Zhou, Y.; Zhao, J.; Man, Y.; Liu, B.; Yao, R. A survey of semi-and weakly supervised semantic segmentation of images. Artif. Intell. Rev. 2020, 53, 4259–4288. [Google Scholar] [CrossRef]
- Wang, T.; Han, B.; Collomosse, J. TouchCut: Fast image and video segmentation using single-touch interaction. Comput. Vis. Image Underst. 2014, 120, 14–30. [Google Scholar] [CrossRef]
- Qin, X.; He, S.; Zhang, Z.; Dehghan, M.; Jagersand, M. ByLabel: A boundary based semi-automatic image annotation tool. In Proceedings of the 2018 IEEE Winter Conference on Applications of Computer Vision (WACV), Lake Tahoe, NV, USA, 12–15 March 2018. [Google Scholar] [CrossRef]
- Ichi, E.; Dorafshan, S. SDNET2021: Annotated NDE dataset for Structural Defects [Data set]. In UND Datasets; University of North Dakota Press: Grand Forks, ND, USA, 2021; Available online: https://commons.und.edu/data/19 (accessed on 10 June 2022).
- Ichi, E.O. Validating NDE Dataset and Benchmarking Infrared Thermography for Delamination Detection in Bridge Decks. Master’s Thesis, University of North Dakota, Grand Forks, ND, USA, 2021. Available online: https://commons.und.edu/theses/4170 (accessed on 20 June 2022).
- Ichi, E.; Dorafshan, S. Effectiveness of infrared thermography for detection in reinforced concrete bridge decks. Autom. Constr. 2022, 142, 104523. [Google Scholar] [CrossRef]
- Jafari, F.; Dorafshan, S. Bridge inspection and defect recognition with using impact echo data, probability, and Naive Bayes classifiers. Infrastructures 2021, 6, 132. [Google Scholar] [CrossRef]


| Data Type and Description | Defect Types | Material or Structure | Annotation Method | Limitation | References |
|---|---|---|---|---|---|
| RGB Images (Surface Defects) | |||||
| Image-56,000 sub-images (256 × 256 px) | Crack (widths from 0.06 to 25 mm) | Concrete bridge decks, walls, and pavements | Labeling | Limited to crack defects only. Not validated with ground truth. | [3,4] |
| 40,000 images with 227 × 227 pixels generated by a 4032 × 3024 resolution camera | Cracks on buildings | METU campus buildings | Labeling | Dataset is based on buildings only. | [16] |
| CFD contains 118 RGB and AigleRN database contains 38 gray-level images. | Cracks | Asphalt pavements | Labeling | Only surface defects. | CrackForest Dataset and AigleRN [17] |
| 600 RGB images | Cracks | Pavement | Pixel level annotation | Only surface defects. | EdmCrack600 [7] |
| At least 17,754 RGB images | Cracks, spall, exposed bars, corrosion stain | Concrete bridges | Bounding box labeling | Only surface defects. | COncrete DEfect BRidge IMage (CODEBRIM) dataset [18] |
| 6500 3D pavement images | Cracks | Asphalt pavement | Labeling | Not publicly available and limited to asphalt pavement. | [19] |
| 7237 RGB images of pavement sections extracted from Google Map | Structural cracks | Asphalt pavement surface | Bounding box labeling | Not publicly available. Dataset not validated with ground truth. Without delamination defects. | [20] |
| NDE (IRT/IE/GPR) Subsurface Defects | |||||
| Impact Echo- 2016 IE signals. | Debonding and subsurface defects | Laboratory concrete specimens | Signal labeling | Limited to laboratory specimens. Dataset not validated with ground truth. | [1,2] |
| GPR signals | Chloride migration detection | Laboratory concrete decks | Signal labeling | Limited to laboratory specimens and validated with a destructive method (core samples). | [8] |
| GPR signals collected during the FHWA’s LTBP Program | Characterize the corrosive environment | Asphalt and concrete bridge decks | Signal Labeling | Dataset was not validated with ground truth but was validated with other NDE methods and bridge decks. | [21] |
| GPR signals converted into 3992 grayscale images | Rebar Detection and localization | Residential buildings under construction | Bounding box labelling | Dataset not validated with ground truth. | [10] |
| 500 infrared images. | Sub-surface delamination | Reinforced concrete bridges | Semantic pixel-wise image labeling | Dataset is not publicly available. and was not validated. | [5] |
| Bridge ID | Structure Number (Year Built) | Width (m) × Length (m) | Deck Area (sqm) | Delamination % |
|---|---|---|---|---|
| FR SB | 0029168629 L (1971) | 12.7 × 64 | 816 | 18% 40.4% |
| FR NB | 0029168632 R (1971) | 12.7 × 64 | 816 | 23% 31.5% |
| PR NB | 0029179087 L (1973) | 11.3 × 141.7 | 1806 | 24.56% 26.1% |
| PR M | 0029179123 M (1973) | 7.3 × 111.3 | 977 | 21.0% 34.5% |
| PR SB | 0029179147 R (1973) | 14.9 × 120.4 | 1974 | 3.5% 30% |
| Bridge ID | Time | Temperature (°C) | Sun Light Exposure (Hours) | Humidity (%) | Wind Speed (kmph) |
|---|---|---|---|---|---|
| FR SB | 9:55–10:25 a.m. | 26.0 | 3.0 | 47.0 | 10.5 |
| FR NB | 10:26–10:44 a.m. | 26.7 | 3.5 | 44.0 | 12.9 |
| PR NB | 11:36–11:55 a.m. | 27.0 | 4.5 | 47.0 | 12.9 |
| PR MD | 12:09–12:32 p.m. | 27.8 | 5.0 | 44.5 | 14.5 |
| PR SB | 12:34–12:55 p.m. | 27.8 | 5.5 | 45.0 | 16.1 |
| Characteristics | Specifications |
|---|---|
| Thermal Resolution: | 640 × 512 pixels |
| Full Frame Rates: | 30 Hz (NTSC) 25 Hz (PAL). |
| Spectral Band: | 7.5–13.5 μm. |
| Pixel Pitch: | 17 μm. |
| Thermal Imager/Detector type: | Uncooled VOx Microbolometer. |
| Digital Zoom | 2×, 4× |
| Field of View | 24° × 19° |
| Bridge ID | Date Collected | Temperature (°C) | Humidity (%) | Deck Condition |
|---|---|---|---|---|
| FR SB | 6 July 2020 | 18.3 | 67.0 | Dry |
| FR NB | 7 July 2020 | 27.8 | 43.0 | Dry |
| PR NB | 8 July 2020 | 25.6 | 66.5 | Dry |
| PR M | 7 July 2020 | 23.1 | 55.0 | Dry |
| PR SB | 9 July 2020 | 22.8 | 56.0 | Dry |
| Data Collection | Data Types and Formats | FR-NB | FR-SB | PR-NB | PR-SB | PR-MD | Number of Files |
|---|---|---|---|---|---|---|---|
| Images (Round 1) | Thermal Image (JPEG): | 122 | 66 | 76 | 95 | 121 | 480 |
| Images (Round 2) | Thermal Image (JPEG): | 76 | 84 | 48 | 152 | 100 | 460 |
| Images (Round 3) | Thermal Image (JPEG): | 19 | 16 | 24 | 31 | 34 | 124 |
| GPR | Downloaded (csv,DZT,DZX) | 28 | 29 | 50 | 53 | 49 | 209 |
| IE | Downloaded (lvm) | 415 | 415 | 440 | 542 | 466 | 2275 |
| NDE Type | Condition Type | Refences | |
|---|---|---|---|
| IRT | Temperature | 26–27.8 °C | [23,24] |
| Solar exposure | Minimum of 6 h | ||
| Wind speed | 11–16 km/h | ||
| Ambient temperature | No testing when tempt is less than 0 °C | ||
| UAS AGL | 15–18 m AGL | ||
| Image overlap | 65–80% | ||
| IE | Temperature | 18.3–27.8 °C | [25,26] |
| Deck condition | Concrete surface-dried and cleared of debris. | ||
| Grid size | 0.3 m × 0.3 m test grid | ||
| Contact time | |||
| GPR | Temperature | 18.3–27.8 °C | [27,28] |
| Deck condition | Concrete surface-dried and cleared of debris. | ||
| Antenna | 2600 MHz. Equipment: GSSI SIR-3000 Data Acquisition System. GPR Antenna | [21] |
| Metrics % | Excellent/Good % | Fair % | Poor/Bad |
|---|---|---|---|
| Image Data Quality | |||
| Piqe | 97 | 3 | 0 |
| Niqe | 82 | 18 | 0 |
| Brisque | 100 | 0 | 0 |
| GPR and IE signals | |||
| Null Values | 100 | 0 | 0 |
| Missing values | 100 | 0 | 0 |
| Duplicate values | 100 | 0 | 0 |
| Bridge ID | Translation (X, Y) (Pixels) | Rotation (d) (degree) | Scale (a,b) |
|---|---|---|---|
| FR SB | [−474, 220] | −4.5 | 1.33 |
| FR NB | [−200, 105] | −1.9 | 1.12 |
| PR NB | [−105, −5] | −87.4 | 2.6 |
| PR M | [0, 0] | 2.8 | 1 |
| PR SB | [−360, −20] | −2 | 2.88 |
| GPR data | ||||||
| classes of delamination | PR M | FR NB | PR NB | PR SB | FR SB | Total signals |
| class 1 | 171,085 | 66,334 | 94,978 | 61,732 | 54,030 | 448,159 |
| class 2 | 56,528 | 39,577 | 26,590 | 38,510 | 29,885 | 177,483 |
| class 3 | 13,478 | 6945 | 443 | 6674 | 7392 | 37,460 |
| Total | 241,091 | 141,500 | 141,500 | 106,916 | 91,307 | 663,102 |
| IE data | ||||||
| classes of delamination | PR M | FR NB | PR NB | PR SB | FR SB | Total signals |
| class 1 | 291 | 301 | 273 | 257 | 257 | 1379 |
| class 2 | 61 | 49 | 74 | 213 | 96 | 493 |
| class 3 | 12 | 13 | 16 | 13 | 10 | 64 |
| Total | 364 | 363 | 363 | 483 | 363 | 1936 |
| IRT data | ||||||
| classes of delamination | PR M | FR NB | PR NB | PR SB | FR SB | Total pixels |
| class 1 | 898,758 | 344,771 | 802,348 | 572,455 | 244,265 | 2,862,597 |
| class 2 | 298,544 | 189,280 | 215,113 | 411,147 | 138,229 | 1,252,313 |
| class 3 | 79,294 | 80,619 | 49,640 | 200,968 | 55,249 | 465,770 |
| Total Pixels | 1,276,596 | 614,670 | 1,067,101 | 1,184,570 | 437,743 | 4,580,680 |
Publisher’s Note: MDPI stays neutral with regard to jurisdictional claims in published maps and institutional affiliations. |
© 2022 by the authors. Licensee MDPI, Basel, Switzerland. This article is an open access article distributed under the terms and conditions of the Creative Commons Attribution (CC BY) license (https://creativecommons.org/licenses/by/4.0/).
Share and Cite
Ichi, E.; Jafari, F.; Dorafshan, S. SDNET2021: Annotated NDE Dataset for Subsurface Structural Defects Detection in Concrete Bridge Decks. Infrastructures 2022, 7, 107. https://doi.org/10.3390/infrastructures7090107
Ichi E, Jafari F, Dorafshan S. SDNET2021: Annotated NDE Dataset for Subsurface Structural Defects Detection in Concrete Bridge Decks. Infrastructures. 2022; 7(9):107. https://doi.org/10.3390/infrastructures7090107
Chicago/Turabian StyleIchi, Eberechi, Faezeh Jafari, and Sattar Dorafshan. 2022. "SDNET2021: Annotated NDE Dataset for Subsurface Structural Defects Detection in Concrete Bridge Decks" Infrastructures 7, no. 9: 107. https://doi.org/10.3390/infrastructures7090107