1. Introduction
The American lobster (
Homarus americanus) industry relies on various transformation processes to ensure the high quality of its products. Quality assurance is crucial in this sector, as Renaud et al. [
1] reported that quality factors can fluctuate due to inconsistencies in labor practices and non-existent or unenforced procedures. Moreover, the limited American lobster fishing season imposes time constraints on processing, which are not always met, thus affecting the quality of the final product [
1]. Furthermore, the Atlantic Canada Opportunities Agency highlighted a critical labor and skills shortage in Atlantic Canadian businesses, with American lobster processors experiencing production limitations as more workers leave the industry [
2]. As a result, many processing plants in New Brunswick struggle to process the volume of American lobster which is caught. Addressing this issue requires expanding automation and implementing vision-guided robots in processing operations [
2].
In recent years, there has been significant progress in computer-based vision and deep convolutional neural network (CNN) methods for applications in agriculture [
3] and food processing [
4], such as detection, recognition, and segmentation. Various studies have demonstrated the effectiveness of object detection techniques, including YOLO and Faster R-CNN, in tackling challenges across food processing and agriculture sectors. These techniques have been applied to various food items, such as carrots, ham, apples, mutton, fruits, shrimp, Nile tilapia, and Atlantic salmon [
5,
6,
7,
8,
9,
10,
11,
12].
Several other studies have applied deep learning and computer vision techniques to different targets in the food industry, reinforcing the significance of our work. In the poultry industry, Liu et al. [
13] proposed a real-time object detection system using YOLOv4 to identify and track chickens in a poultry house, achieving a precision of 95.24%. A CNN-based detector was used by Zhang et al. [
14] to detect and segment individual pigs in images taken from pig farms, resulting in a 94.72% detection accuracy. In the dairy industry, Salau et al. [
15] utilized Mask R-CNN to detect, segment, and track individual cows with an average precision of 91% and 85% for bounding boxes and segmentation masks, respectively. In addition, Zheng et al. [
16] used the YOLOv3 model to detect various types of vegetables in greenhouse environments, such as tomatoes, cucumbers, and chili peppers; over 99% accuracy was achieved using their approach.
The results of these studies demonstrate the versatility and effectiveness of deep learning and computer vision techniques across a variety of food industries. By adapting these methods for the American lobster processing industry, our research contributes to the growing body of knowledge and further validates the value of such approaches in addressing labor shortages, improving product quality, and automating tasks within the sector.
This work aims to develop an automated method for processing American lobster using a fast and accurate machine vision solution. We propose a lobster orientation estimation algorithm combined with a transfer learning approach to retrain pre-trained object detectors using an American Lobster images dataset. Models are deployed on the embedded platform Nvidia Jetson Xavier NX for real-time lobster part detection. This approach offers the industry an opportunity to utilize vision-guided machines for numerous tasks currently performed manually, including exhausting, repetitive tasks and cutting operations that pose hazards to workers. This study addresses the labor shortage faced by industries in New Brunswick and holds the potential to create new jobs, attracting younger people to the seafood processing industry where, presently, the average employee age is approximately 55 years [
17].
2. Materials and Methods
2.1. Robotics-Integrated Vision Systems
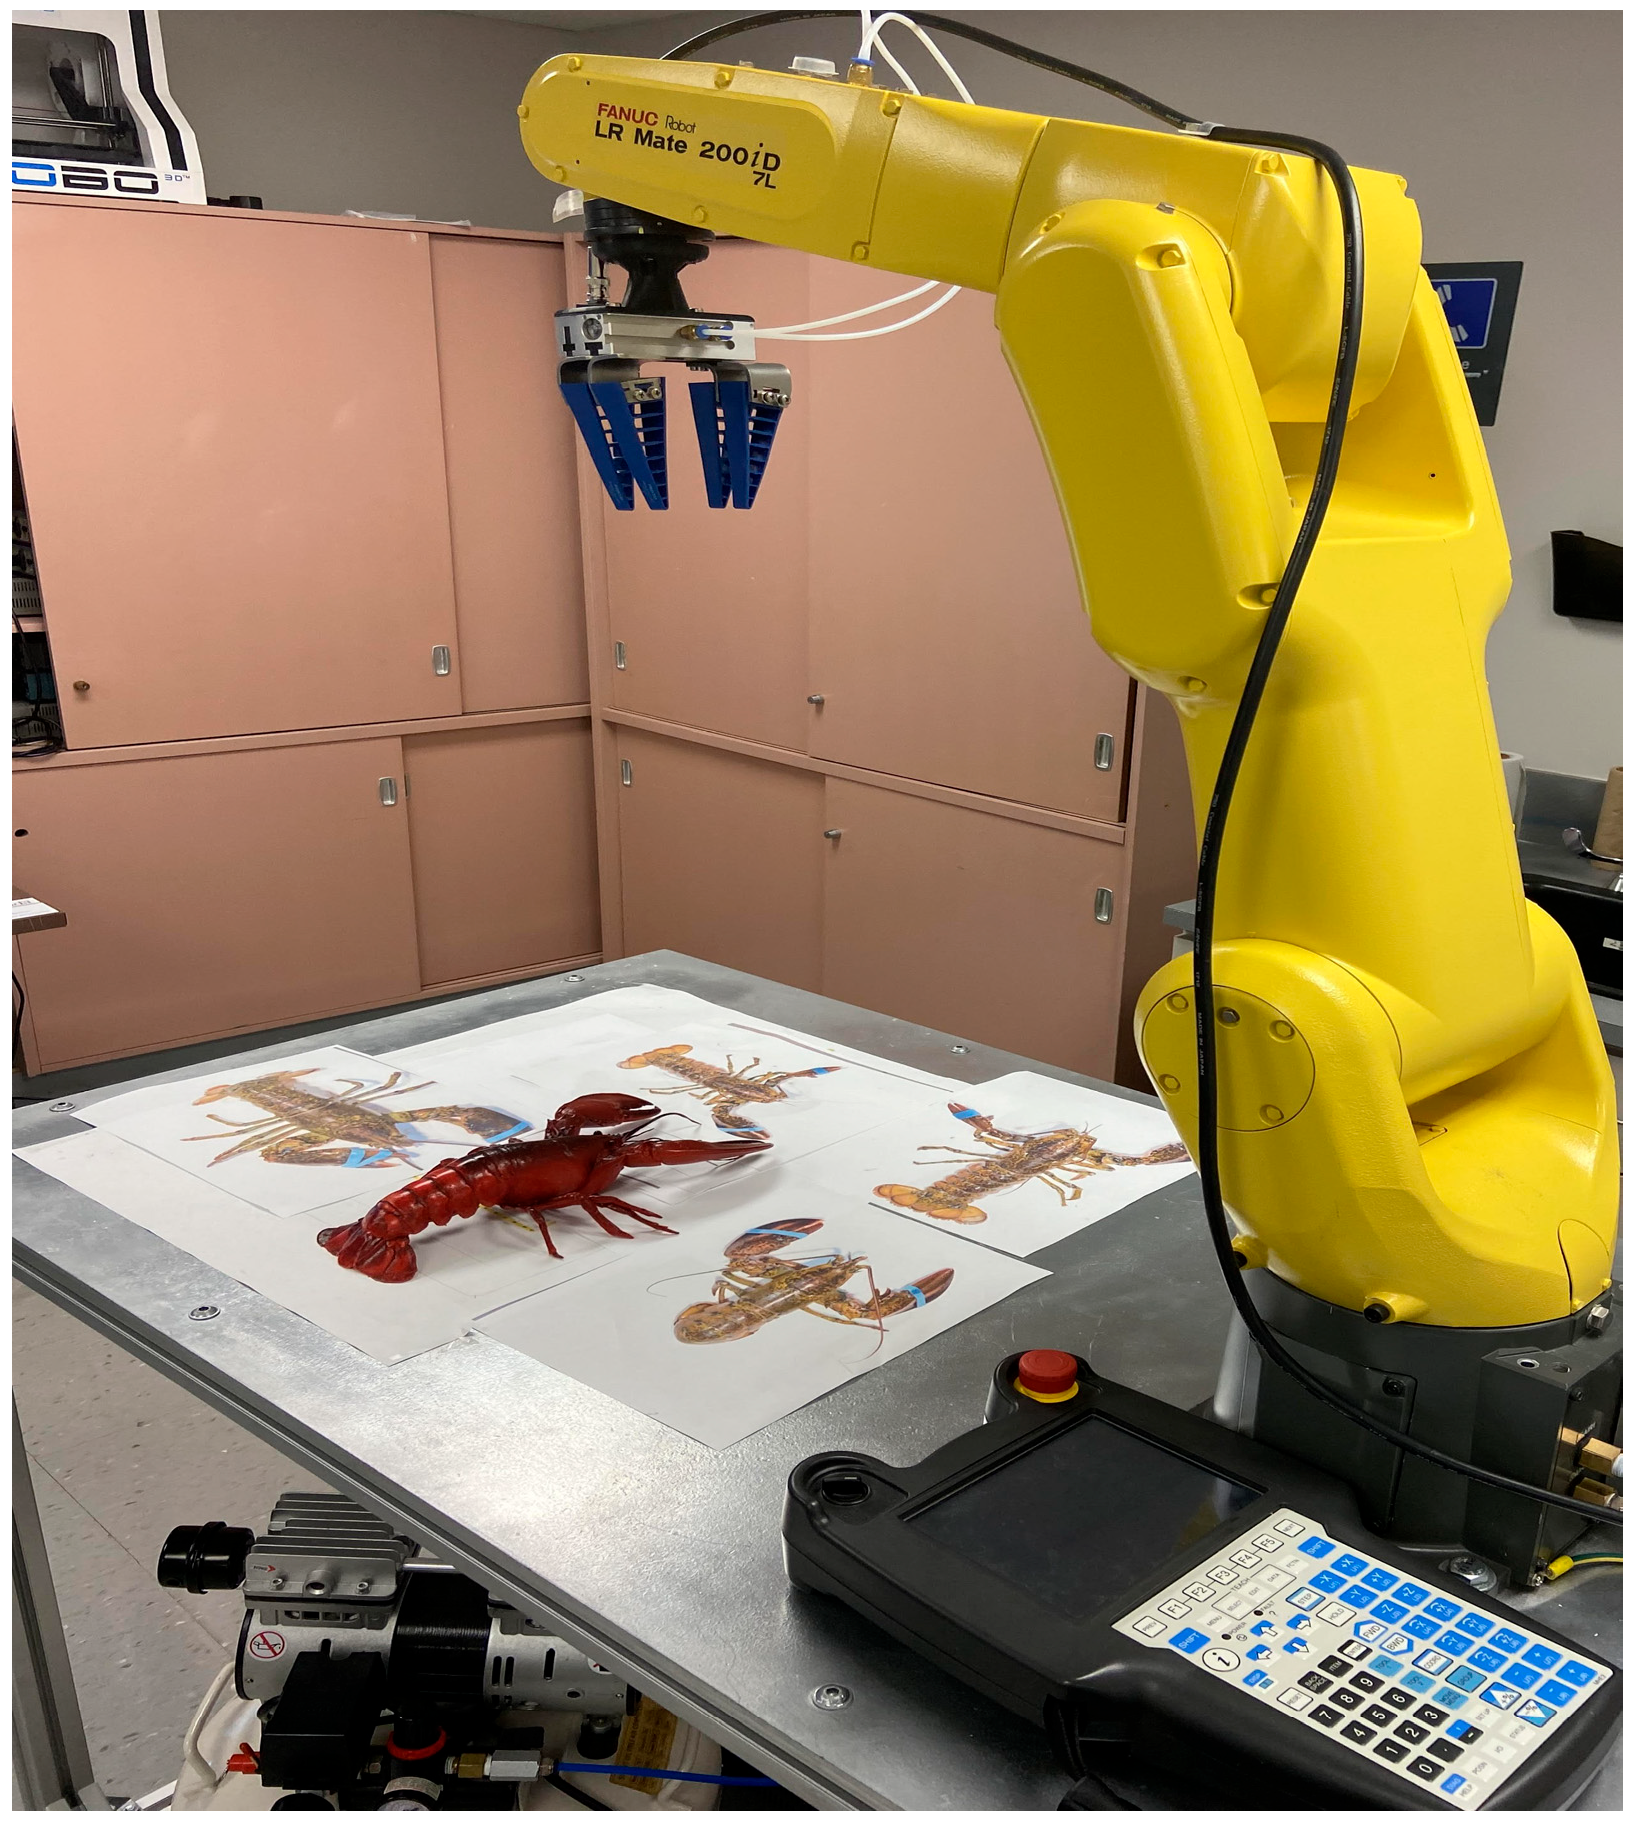
In recent years, there has been a growing interest in developing advanced vision systems for robotic applications. This is particularly useful for automating complex tasks such as identifying and manipulating objects of varying shapes and sizes. In a previous study [
18], we investigated two distinct vision systems for enabling the FANUC robotic arm in
Figure 1 to recognize and locate lobsters. The FANUC vision-based solution, the IRVision system, was assessed using two different tools: the Curved Surface Matching (CSM) Locator and the Geometric Pattern Matching (GPM) Locator.
The GPM Locator is a computer vision technology designed to identify and locate specific geometric shapes or patterns in an image. The CSM Locator is an effective computer vision solution used to identify and locate curved surfaces on an object. These solutions are often used in manufacturing and quality control applications, where it is necessary to precisely locate and inspect components or products on a production line. However, the experiments conducted in the previous study showed that both tools exhibit limitations in the detection of effectiveness and speed. They are not the most effective solutions for more complex shapes or objects that do not have a distinct geometric pattern or feature such as lobsters. In contrast, the object detection model based on the YOLOv4 algorithm showed promising results when implemented on the NVIDIA Jetson Xavier NX.
Building upon this foundation, the present study aims to further explore and enhance the capabilities of the YOLO-based vision system for lobster detection and orientation estimation. In this work, we have combined an object orientation estimation algorithm with the YOLOv7 model to improve the detection and identification of lobster body parts and their spatial orientation, evaluated the performance of this integrated approach, and assessed its effectiveness in accurately detecting lobster body parts while maintaining real-time processing speeds.
2.2. Data Pre-Processing
As far as we are aware, there is no open-source American lobster dataset providing representative samples that can be used for developing automated object detection models for lobster position estimation. Continuing our research from [
18], 1000 images of cooked lobsters of various sizes were added to the dataset. These images consider the variation in lighting conditions and lobster orientation. Furthermore, to avoid the problem of overfitting, the number of images is increased through data augmentation. This paper adopts a data augmentation strategy that includes the following:
Reorienting angles: randomly rotating images within a specified range (−10 to 10 degrees) to create variations in lobster orientation.
Adjusting saturation: modifying the saturation levels in images to simulate different lighting conditions.
Flipping images: creating horizontal and vertical flips of the original images to introduce variations in the dataset.
Translating: shifting the images horizontally and vertically within a defined range to create positional variations.
With the four augmentation techniques applied to each of the 1300 original images, 5200 additional images were generated, resulting in a total dataset size of 6500 images.
As lobsters have one body, one head, one tail (folded or not), and two claws, their proportions are not equal. This uneven distribution could affect training and classification. Data augmentation techniques have helped the model to learn robust features for each class. Furthermore, the pre-trained YOLOv3, YOLOv4, and YOLOv7 models have been trained on the extensive dataset, MS COCO. These pre-trained models have already learned valuable features for detecting objects by leveraging knowledge from larger datasets.
2.3. Real-Time Object Detection
Object detection is a computer-vision task that includes classifying and locating multiple objects in a single image, using bounding boxes that locate objects in the image in order to predict the class of objects, as in image classification, and the coordinates of the bounding box which adapt to the detected object.
There are two categories of object detectors. The first category is single-stage detectors, which use a single convolutional neural network to detect objects in images, such as YOLO (You Only Look Once), a popular object detection algorithm that has seen several versions [
19,
20,
21,
22,
23], with YOLO v7 being the latest version. It includes SSD, Single Shot Multibox Detector [
24], Focal Loss for Dense Object Detection [
25], and DetectoRS, Detecting Objects with Recursive Feature Pyramid and Switchable [
26]. The second category includes two-stage detectors, such as Fast R-CNN [
27], Faster R-CNN [
28], and Mask RCNN [
29]. Through a region proposal network (RPN), this category of models generates regions of interest in the first stage and then sends these region proposals to the second stage for object classification and bounding-box regression. Two-stage models are generally slower than single-stage detectors, which use a single neural network to output classification probabilities and bounding box regression.
2.4. Lobster Orientation Estimation Approach
In a controlled environment, where the workspace is well-defined with a known relationship between the camera’s field of view and the robotic arm’s workspace, the 2D bounding box coordinates and lobster orientation estimation provide precise information on the lobster’s location and orientation, enabling a robotic arm to move quickly and accurately to pick up and manipulate the lobster for processing. This approach can lead to enhanced efficiency and increased productivity.
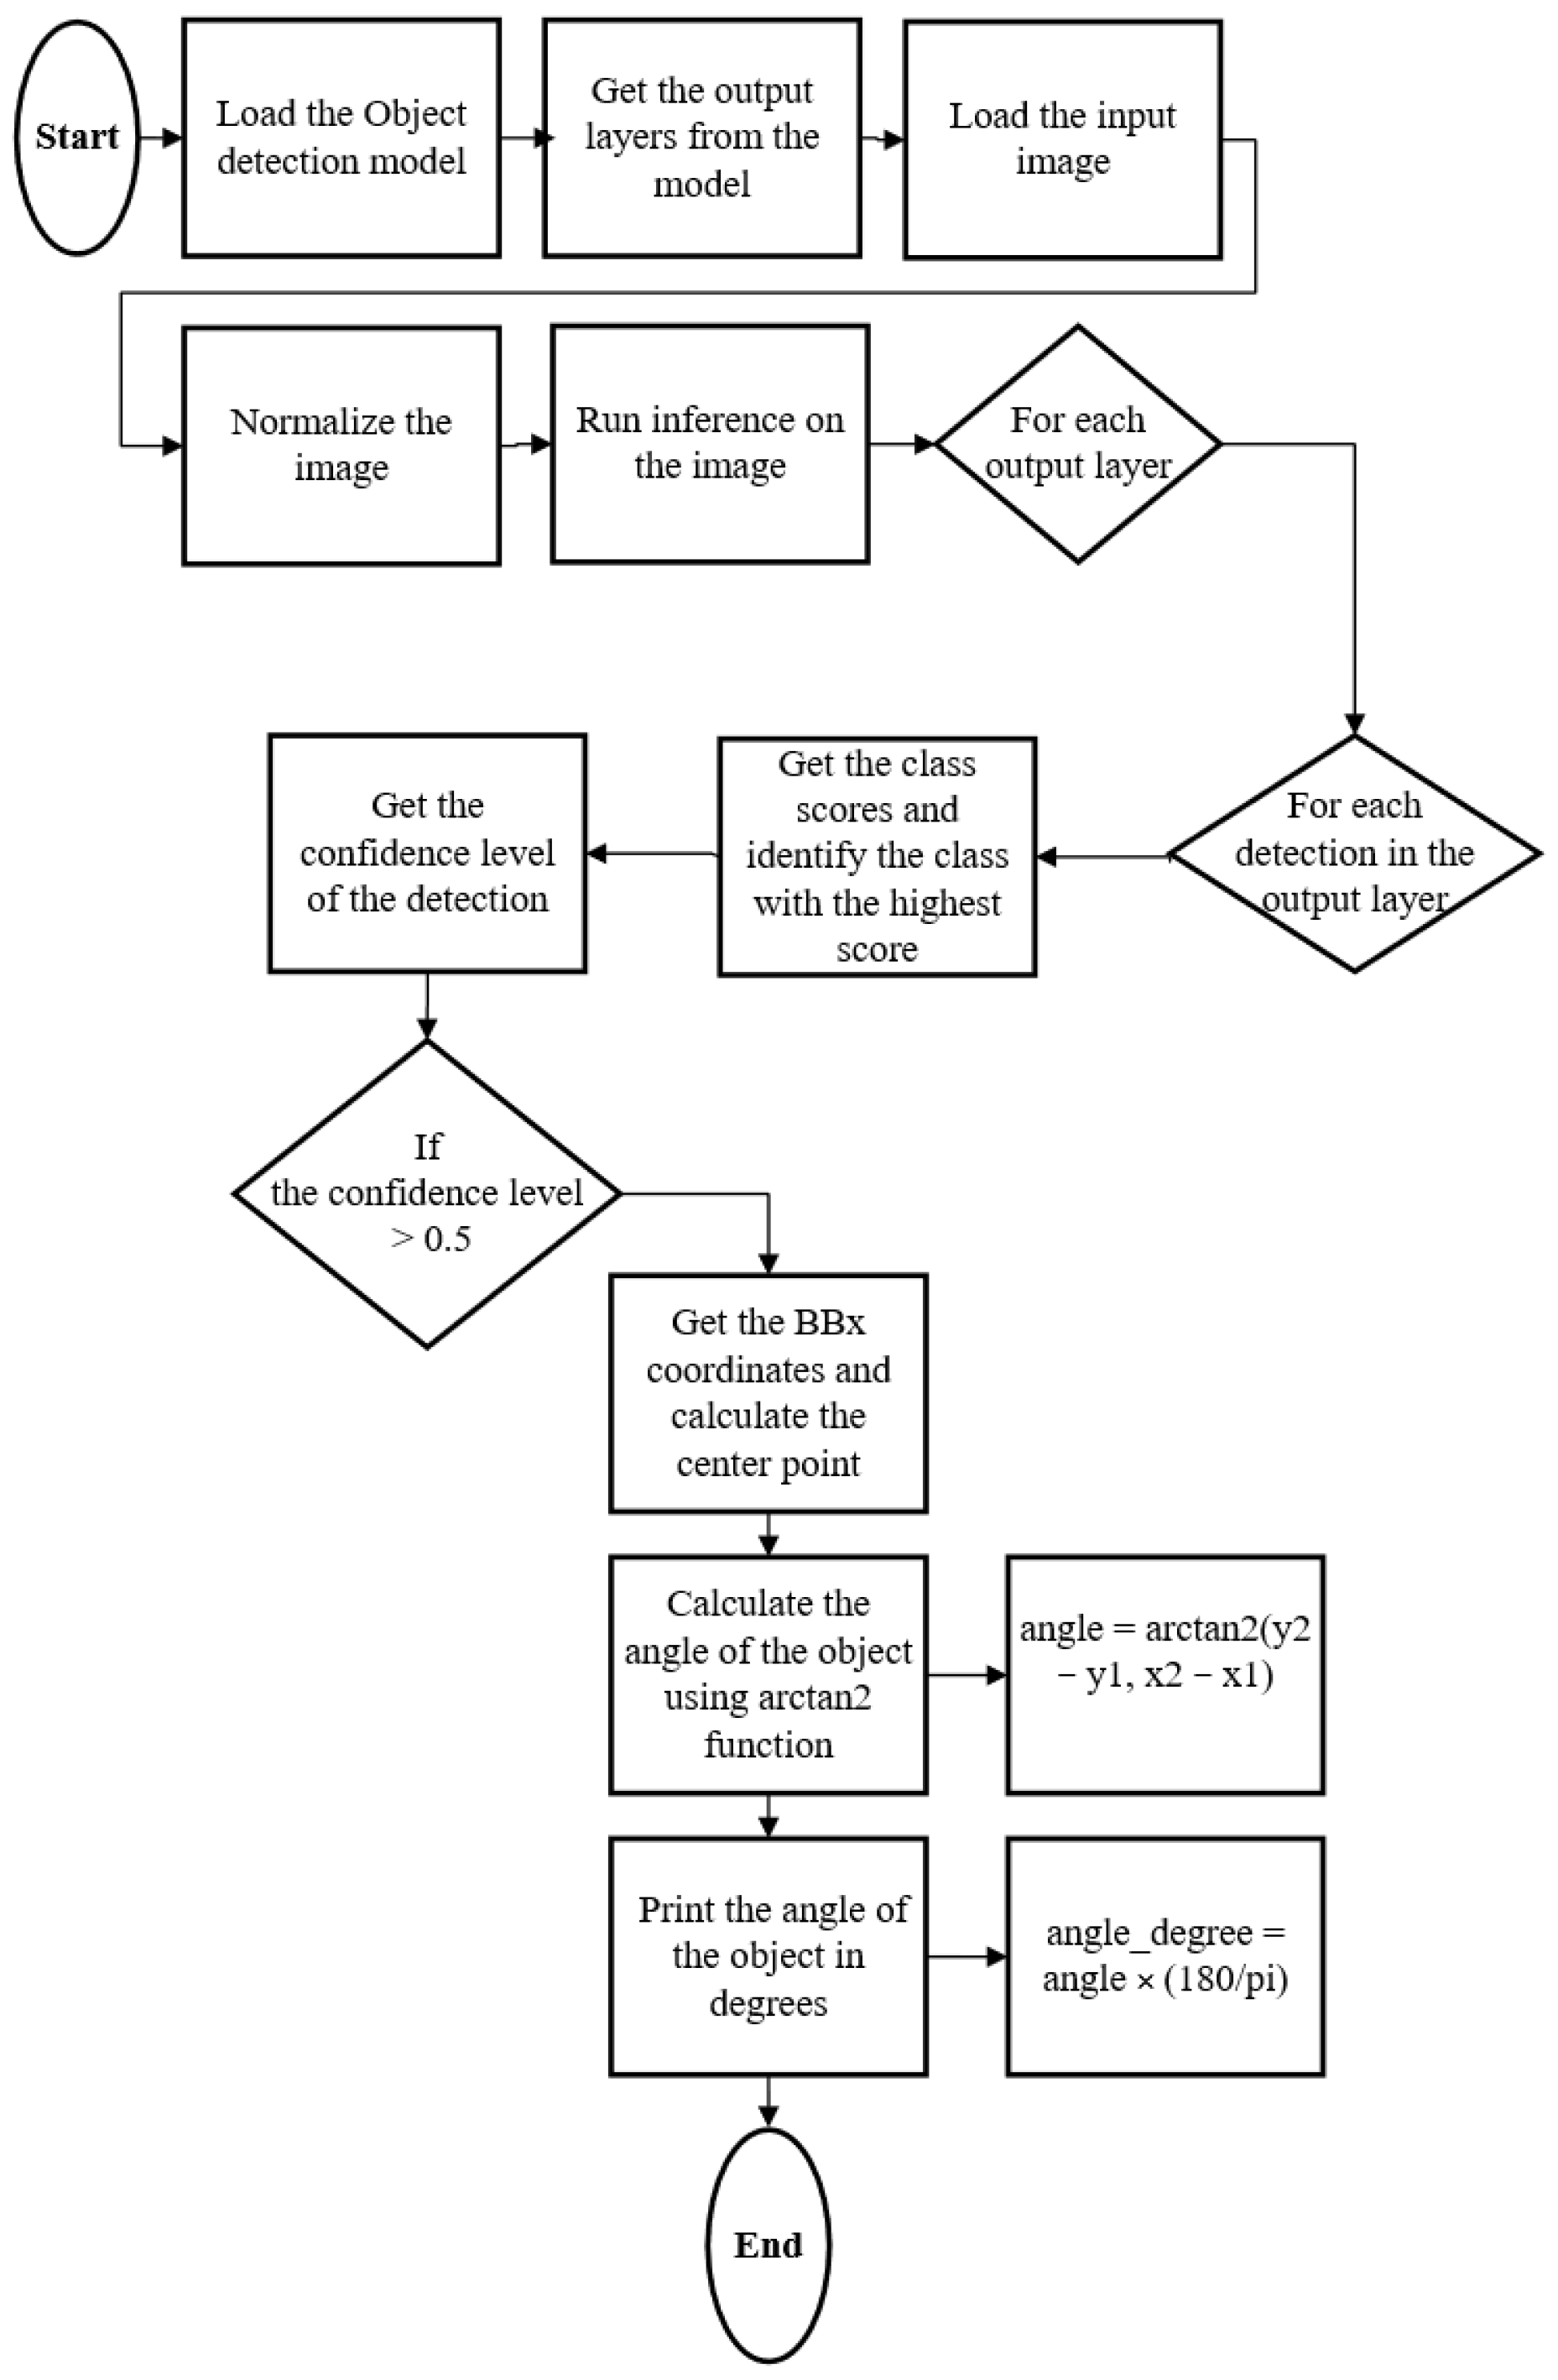
As illustrated in
Figure 2, we developed an orientation estimation algorithm that combines a convolutional neural network model for object detection with angle calculation between the detected parts of the lobster. The algorithm proceeds through the following steps:
Output layers are obtained from the trained neural network model for object detection.
The algorithm iterates through each output layer, examining every detected object within it.
For each object, class scores are computed, and the class with the highest score is identified. This step helps to identify the specific part of the lobster that the bounding box corresponds to.
The detection confidence level is determined. If the confidence level is above a predefined threshold, the bounding box is considered reliable, and its coordinates are extracted.
The center point of each bounding box is calculated by averaging the x and y coordinates of the box’s corners.
Using the center points of the bounding boxes, the angle between the line connecting the centers and the horizontal
x-axis is computed using the arctan2 function, as shown in Equation (1). This angle represents the orientation of the lobster in the image.
The described algorithm efficiently narrows down candidate objects based on their class scores and confidence levels. This ensures that only relevant and reliable detections are considered. This filtering step minimizes false positives and maintains the performance overall. Once the bounding box coordinates are obtained, the center point is calculated and the arctan2 function is employed to determine whether the angle is computationally efficient. It provides a complete range of angles from −π to π. While this approach has its merits, it is important to consider that the accuracy and reliability of the estimated orientation are highly dependent on the quality of the object detection model and the precision of the calculated bounding box coordinates.
In this work, we used YOLOv7. As a member of the YOLO (You Only Look Once) family, YOLOv7 is known for its real-time object detection capabilities, providing both high speed and accuracy in detecting objects within images. This advantage is crucial when working with a robotic arm, as the swift and precise localization of the lobster is required for effective manipulation. Additionally, the features of YOLOv7 are significantly improved compared to its predecessors in terms of performance, resulting in a better detection of small objects and reduced false positives. This enhanced detection quality is essential when estimating the orientation of lobsters as they may vary in size and shape. Furthermore, YOLOv7 handles a wide range of object categories, making it a versatile choice for various applications beyond lobster orientation estimation. By integrating YOLOv7 with the proposed orientation estimation algorithm, we can benefit from its real-time performance, improved accuracy, and versatility, leading to a more reliable and efficient system for guiding a robotic arm to locate and handle lobsters.
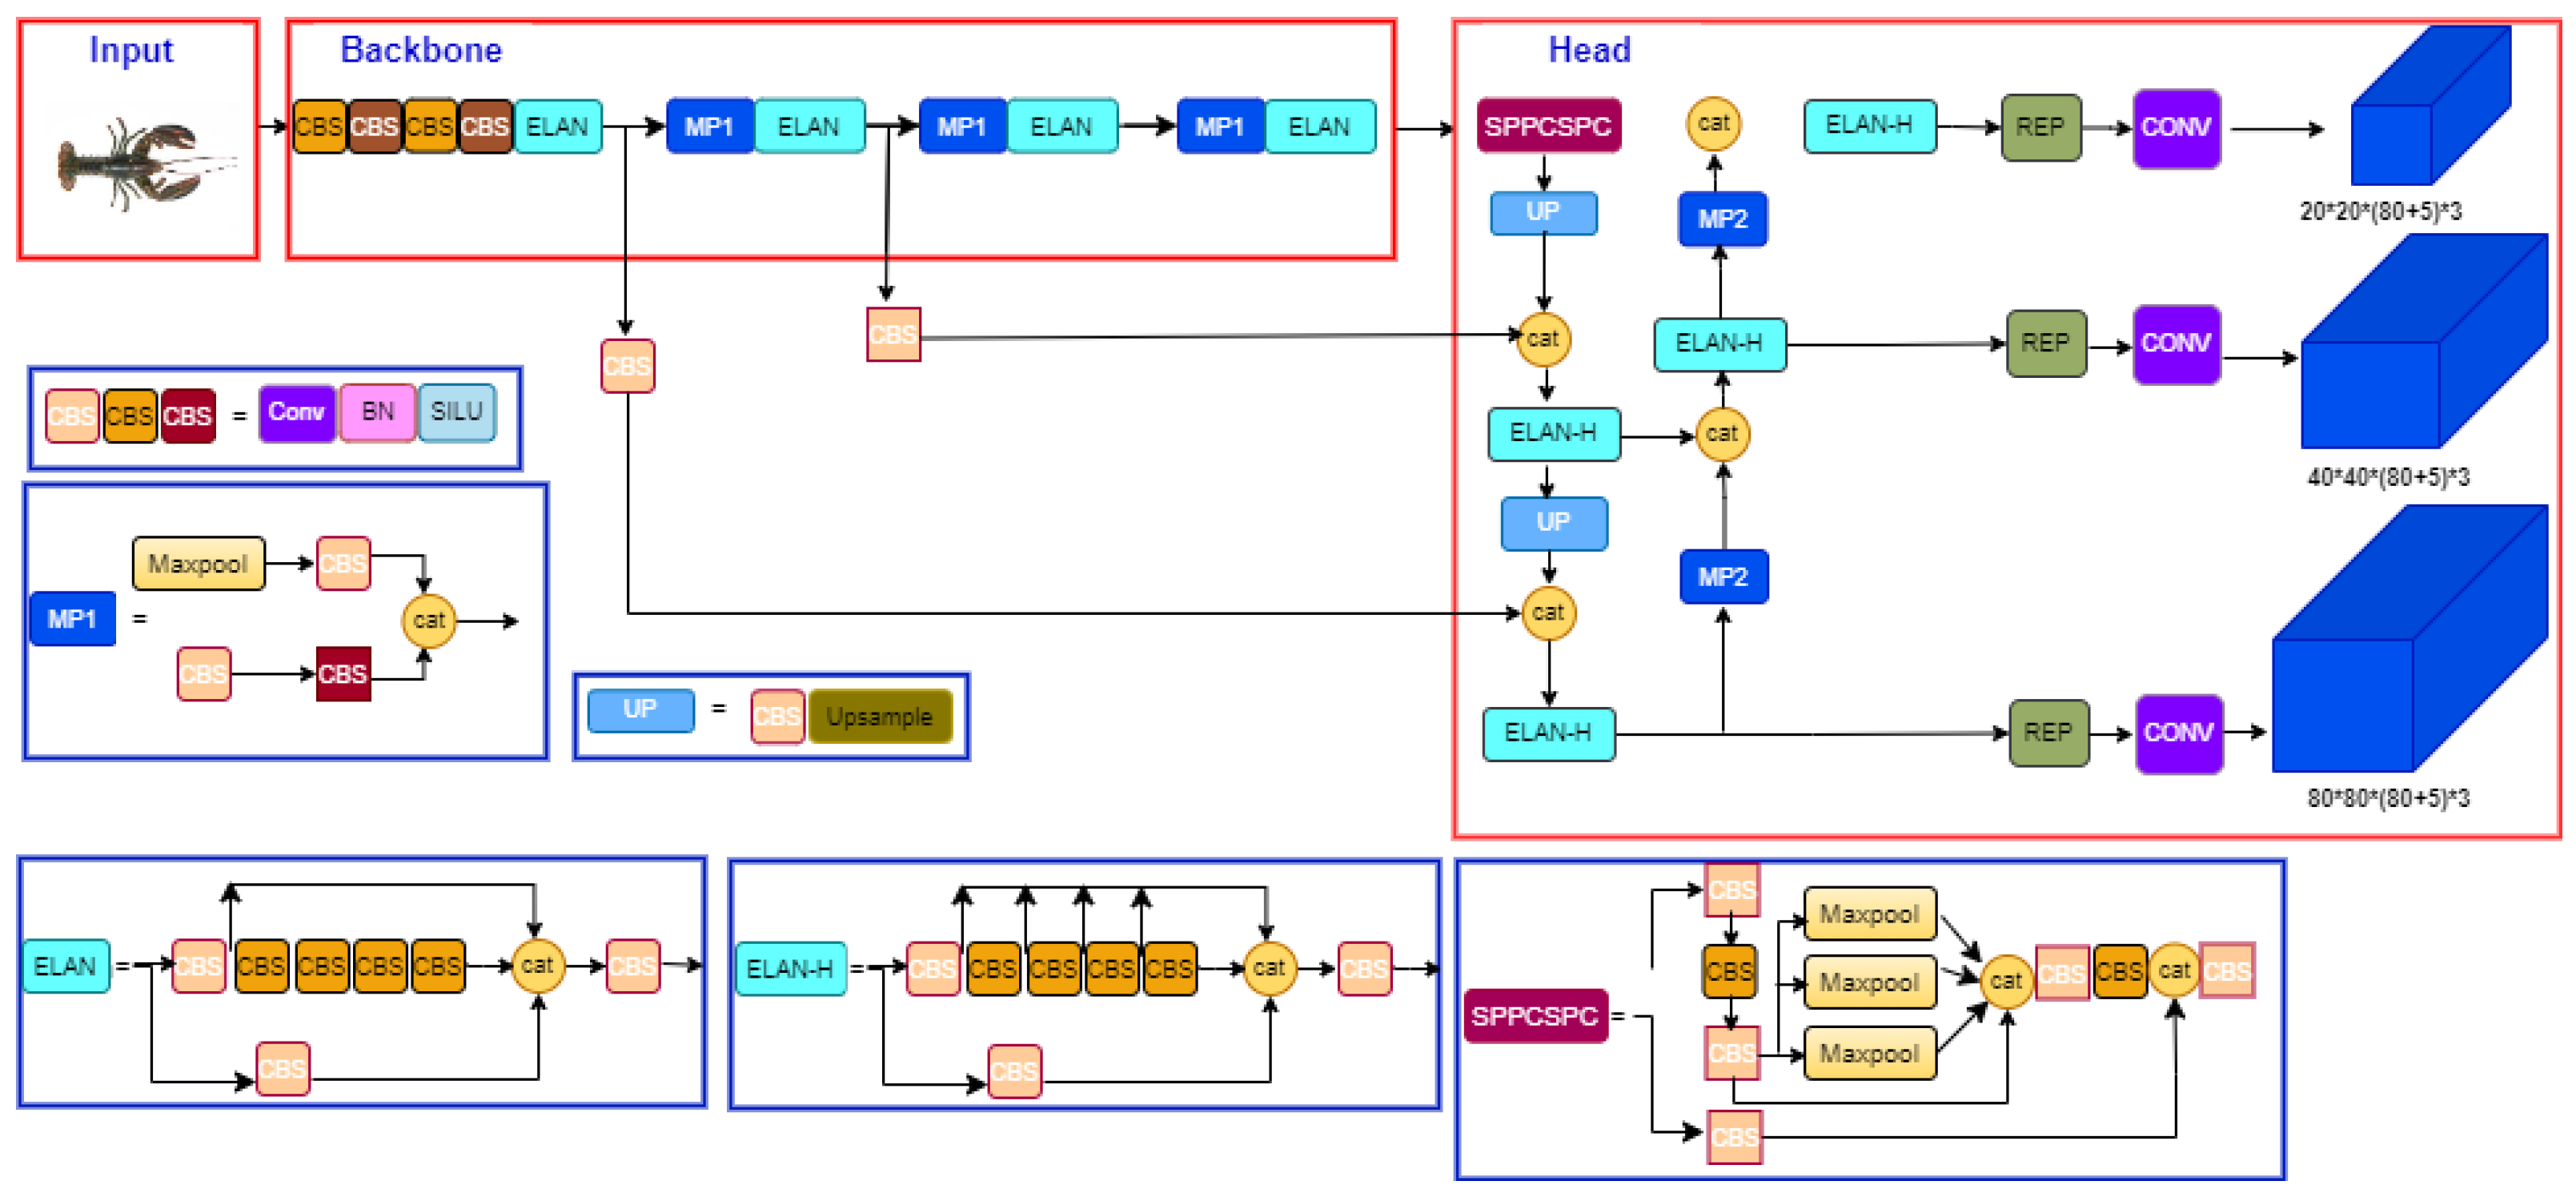
As shown in
Figure 3, YOLOv7 is based on a single CNN, which is divided into three main parts: the backbone, the neck, and the head. The backbone is responsible for extracting features from the input image. In YOLOv7, the backbone is a combination of a lightweight and a deeper CNN, allowing a balance between accuracy and speed. The neck is responsible for fusing the features from the backbone, providing a higher-level representation of the input image. In YOLOv7, the neck comprises several layers of convolutional and upsampling layers. The head is responsible for predicting the bounding boxes and class probabilities of the objects in the image. In YOLOv7, the head consists of several layers of convolutional and fully connected layers. The head takes the features from the neck as an input and produces the final predictions. YOLOv7 also employs anchor boxes, which are predefined bounding boxes with various aspect ratios, to improve detection accuracy. The model uses a prediction module that estimates class probabilities and bounding box coordinates for each anchor box.
2.5. Experimental Setup
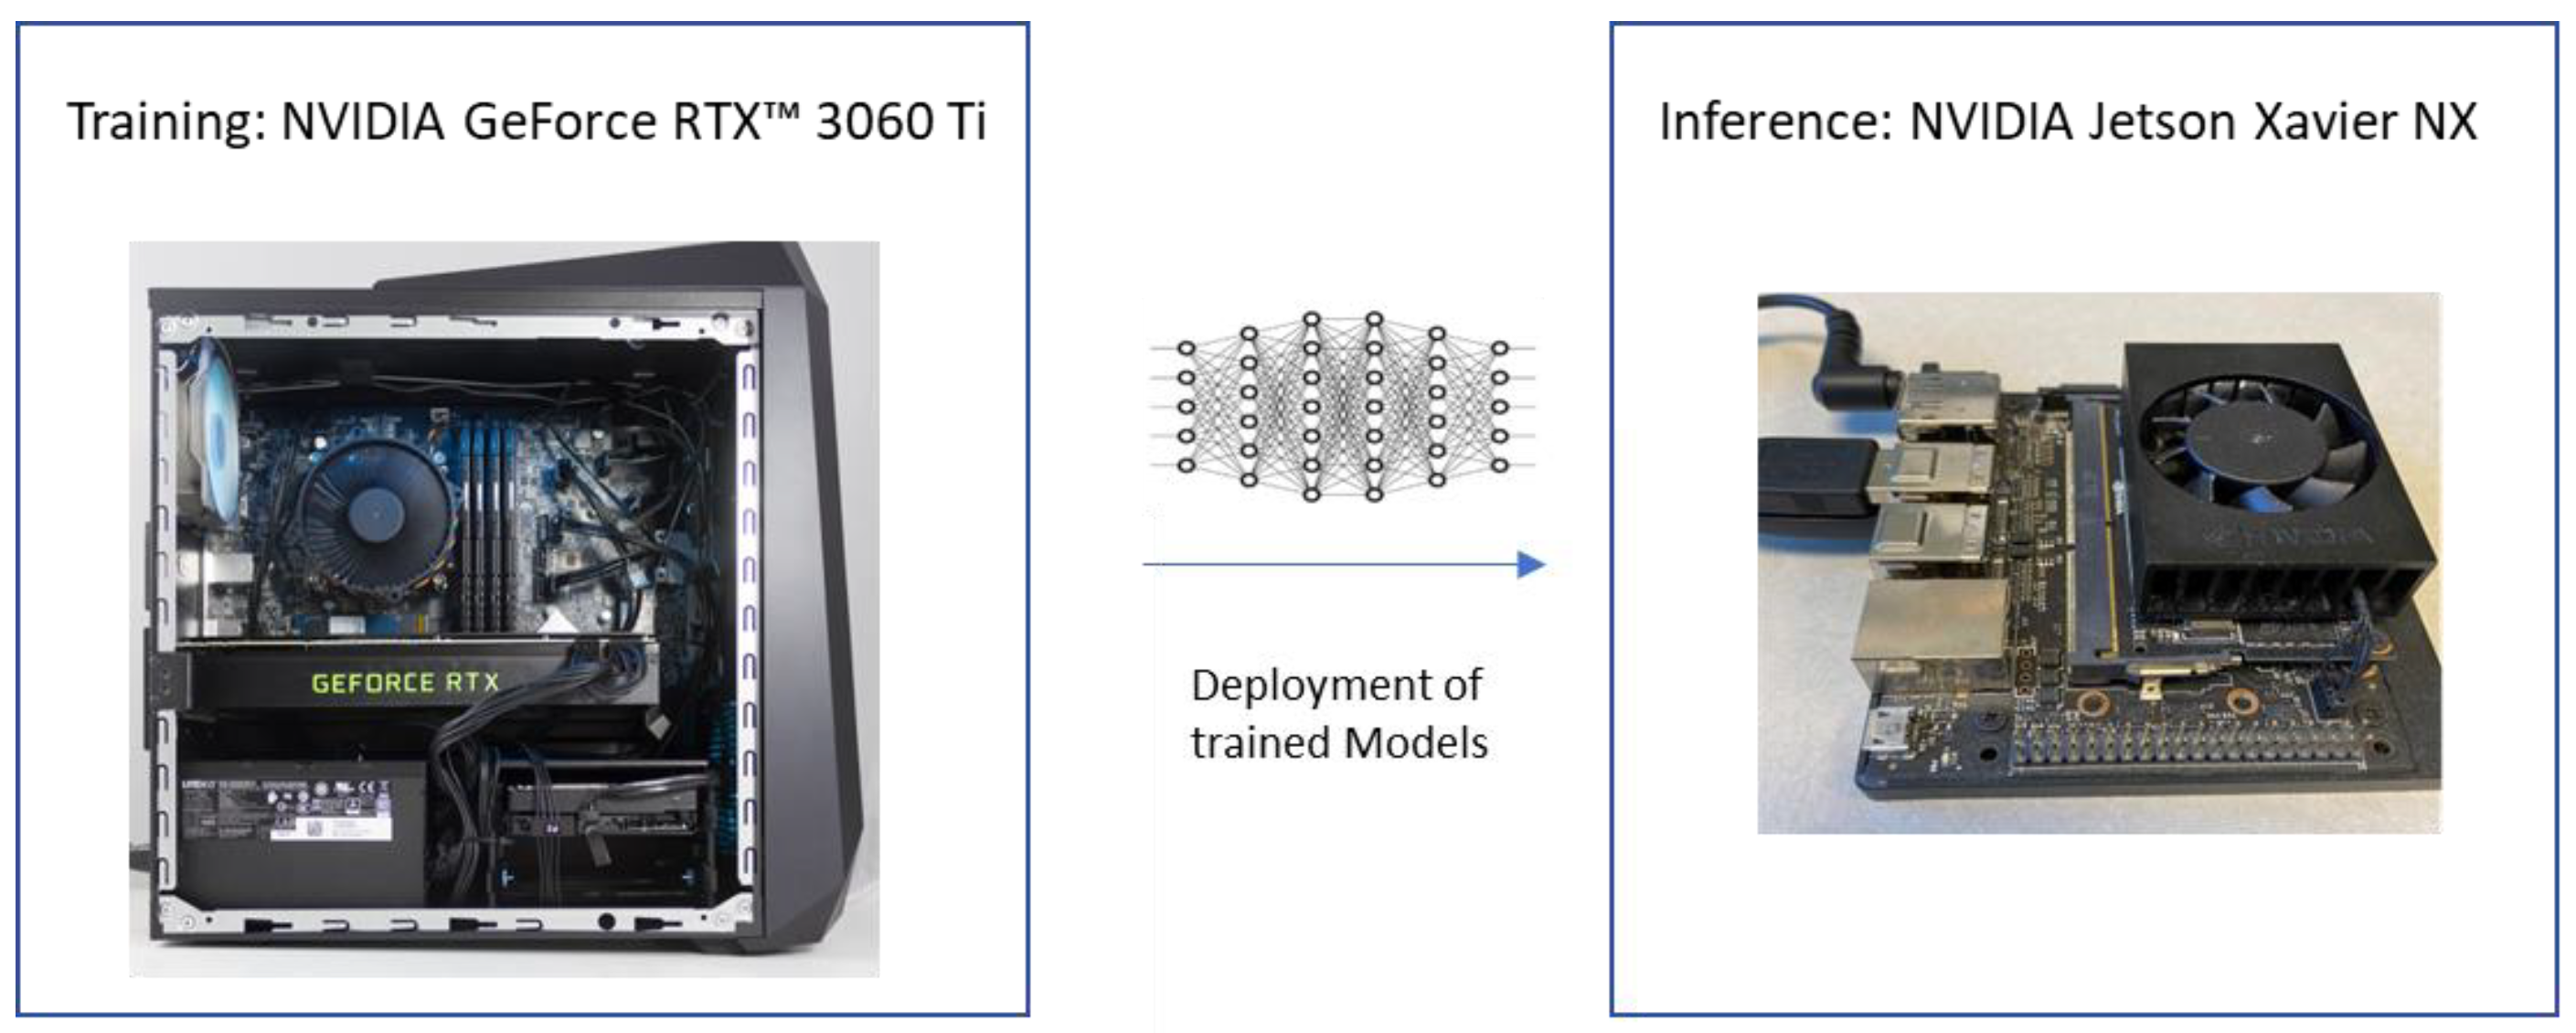
Figure 4 shows the experimental environment for this study. The training was conducted on the Ubuntu operating system using an Acer model computer equipped with Intel Core i7-8750H @ 2.20 GHz, GPU Nvidia GeForce RTX 3060 Ti and 16 GB RAM. Then, the models were deployed and experimented on using the embedded mobile platform, Nvidia Jetson Xavier NX, which provides high artificial intelligence performance, the type of power efficiency needed for all modern AI networks, and the platform is supported by Nvidia software Jet-Pack SDK, which includes CUDA Toolkit, cuDNN, OpenCV, TensorRT, and L4T with the LTS Linux Kernel.
Table 1 shows the hardware specifications of Jetson Xavier NX.
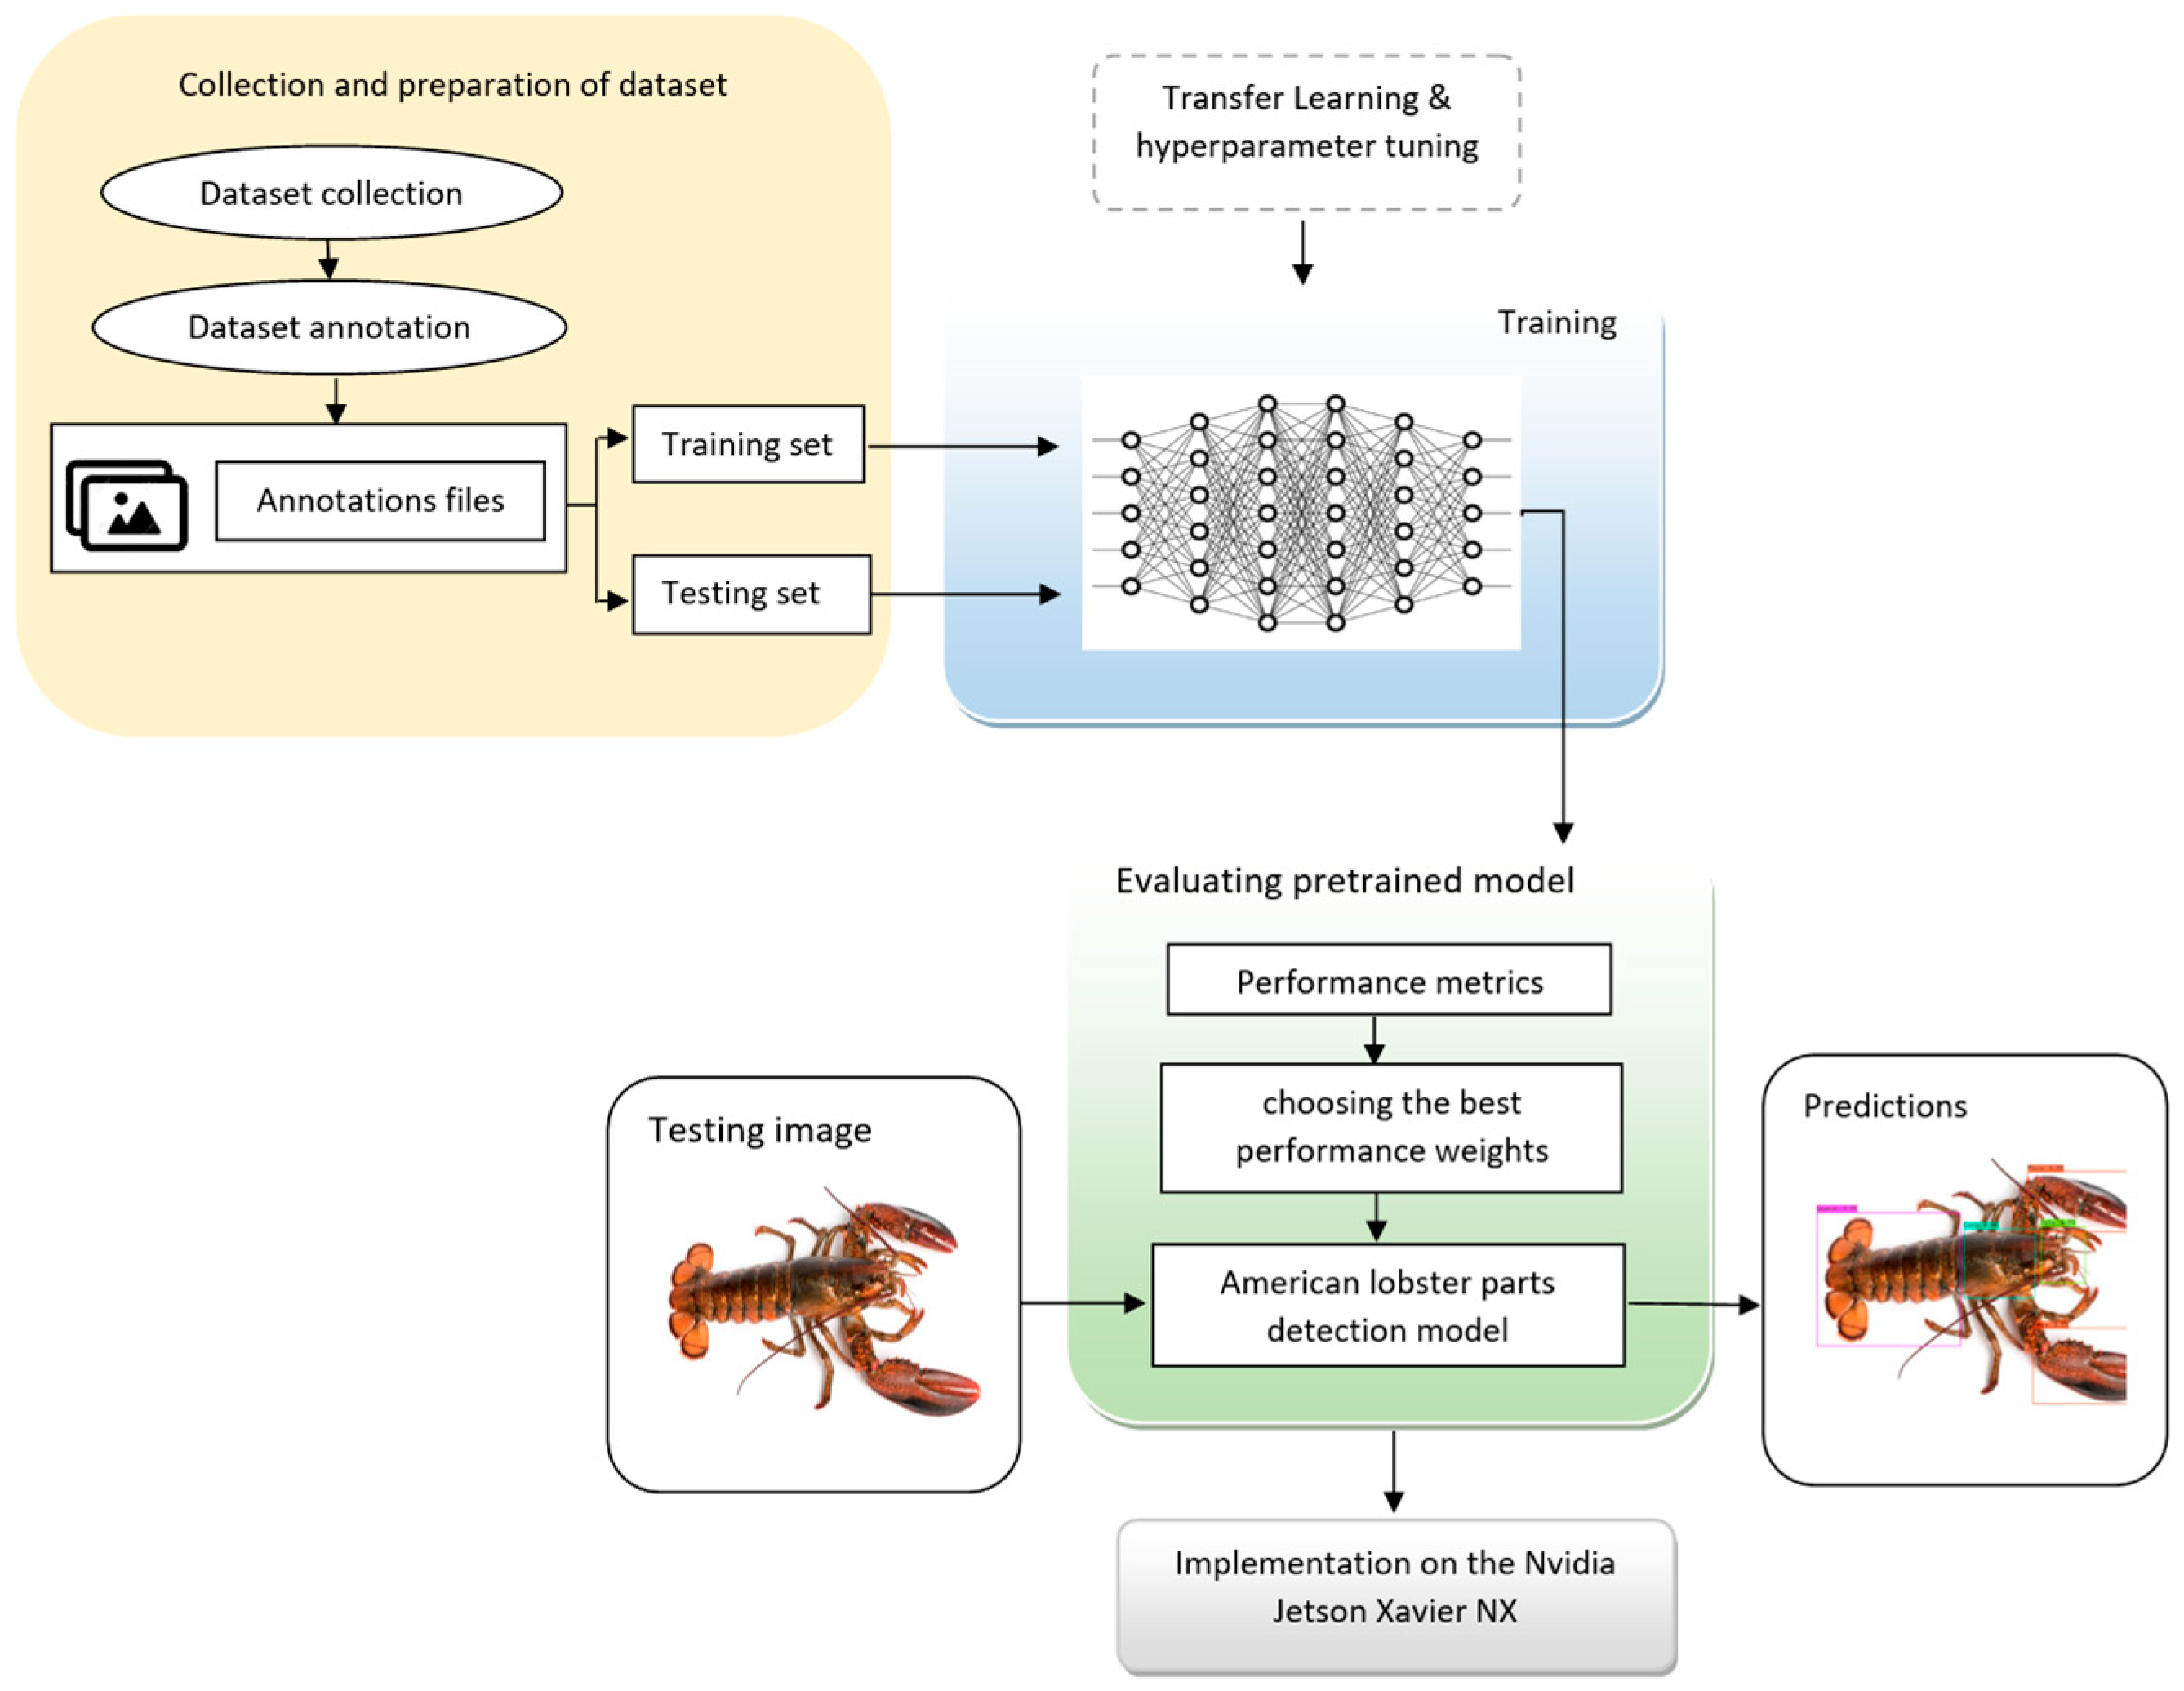
Figure 5 illustrates the steps involved in implementing object detection models for detecting American lobster parts. Initially, images were manually annotated using LabelImg, an open-source graphical image annotation tool, as demonstrated in
Figure 6. The labeling results were saved directly in YOLO format, with a text file accompanying each image, sharing the same name as its corresponding image file. Each line within the text file represents the attributes of a single object (class number, object center in x, object center in y, object width, and object height). Subsequently, the image files were partitioned into two sets: 90% for training and 10% for testing. All text files and image sets were then input into the training process, where transfer learning was employed, and model hyperparameters were fine-tuned. The size of the input images was 640 × 640. The YOLOv7, YOLOv7-Tiny, YOLOv4, and YOLOv3 algorithms, which were previously trained on the MS COCO dataset [
30], were retrained using GPU. Following the training process, performance metrics and visual detection were evaluated to select the best-performing weights. For further testing and evaluation, the trained models were implemented on the Nvidia Jetson Xavier NX platform.
2.6. Model Performance Metrics
The performance of the models was assessed using standard performance metrics commonly employed in object detection tasks [
31]. These metrics are crucial for comparing different models and determining their effectiveness at detecting objects accurately. The following section defines some basic concepts used in the calculation of these performance metrics:
TP (true positive) is the number of objects detected correctly.
FP (false positive) is the number of objects incorrectly detected as positive.
FN (false negative) is the number of objects incorrectly detected as negative (missed ground truth).
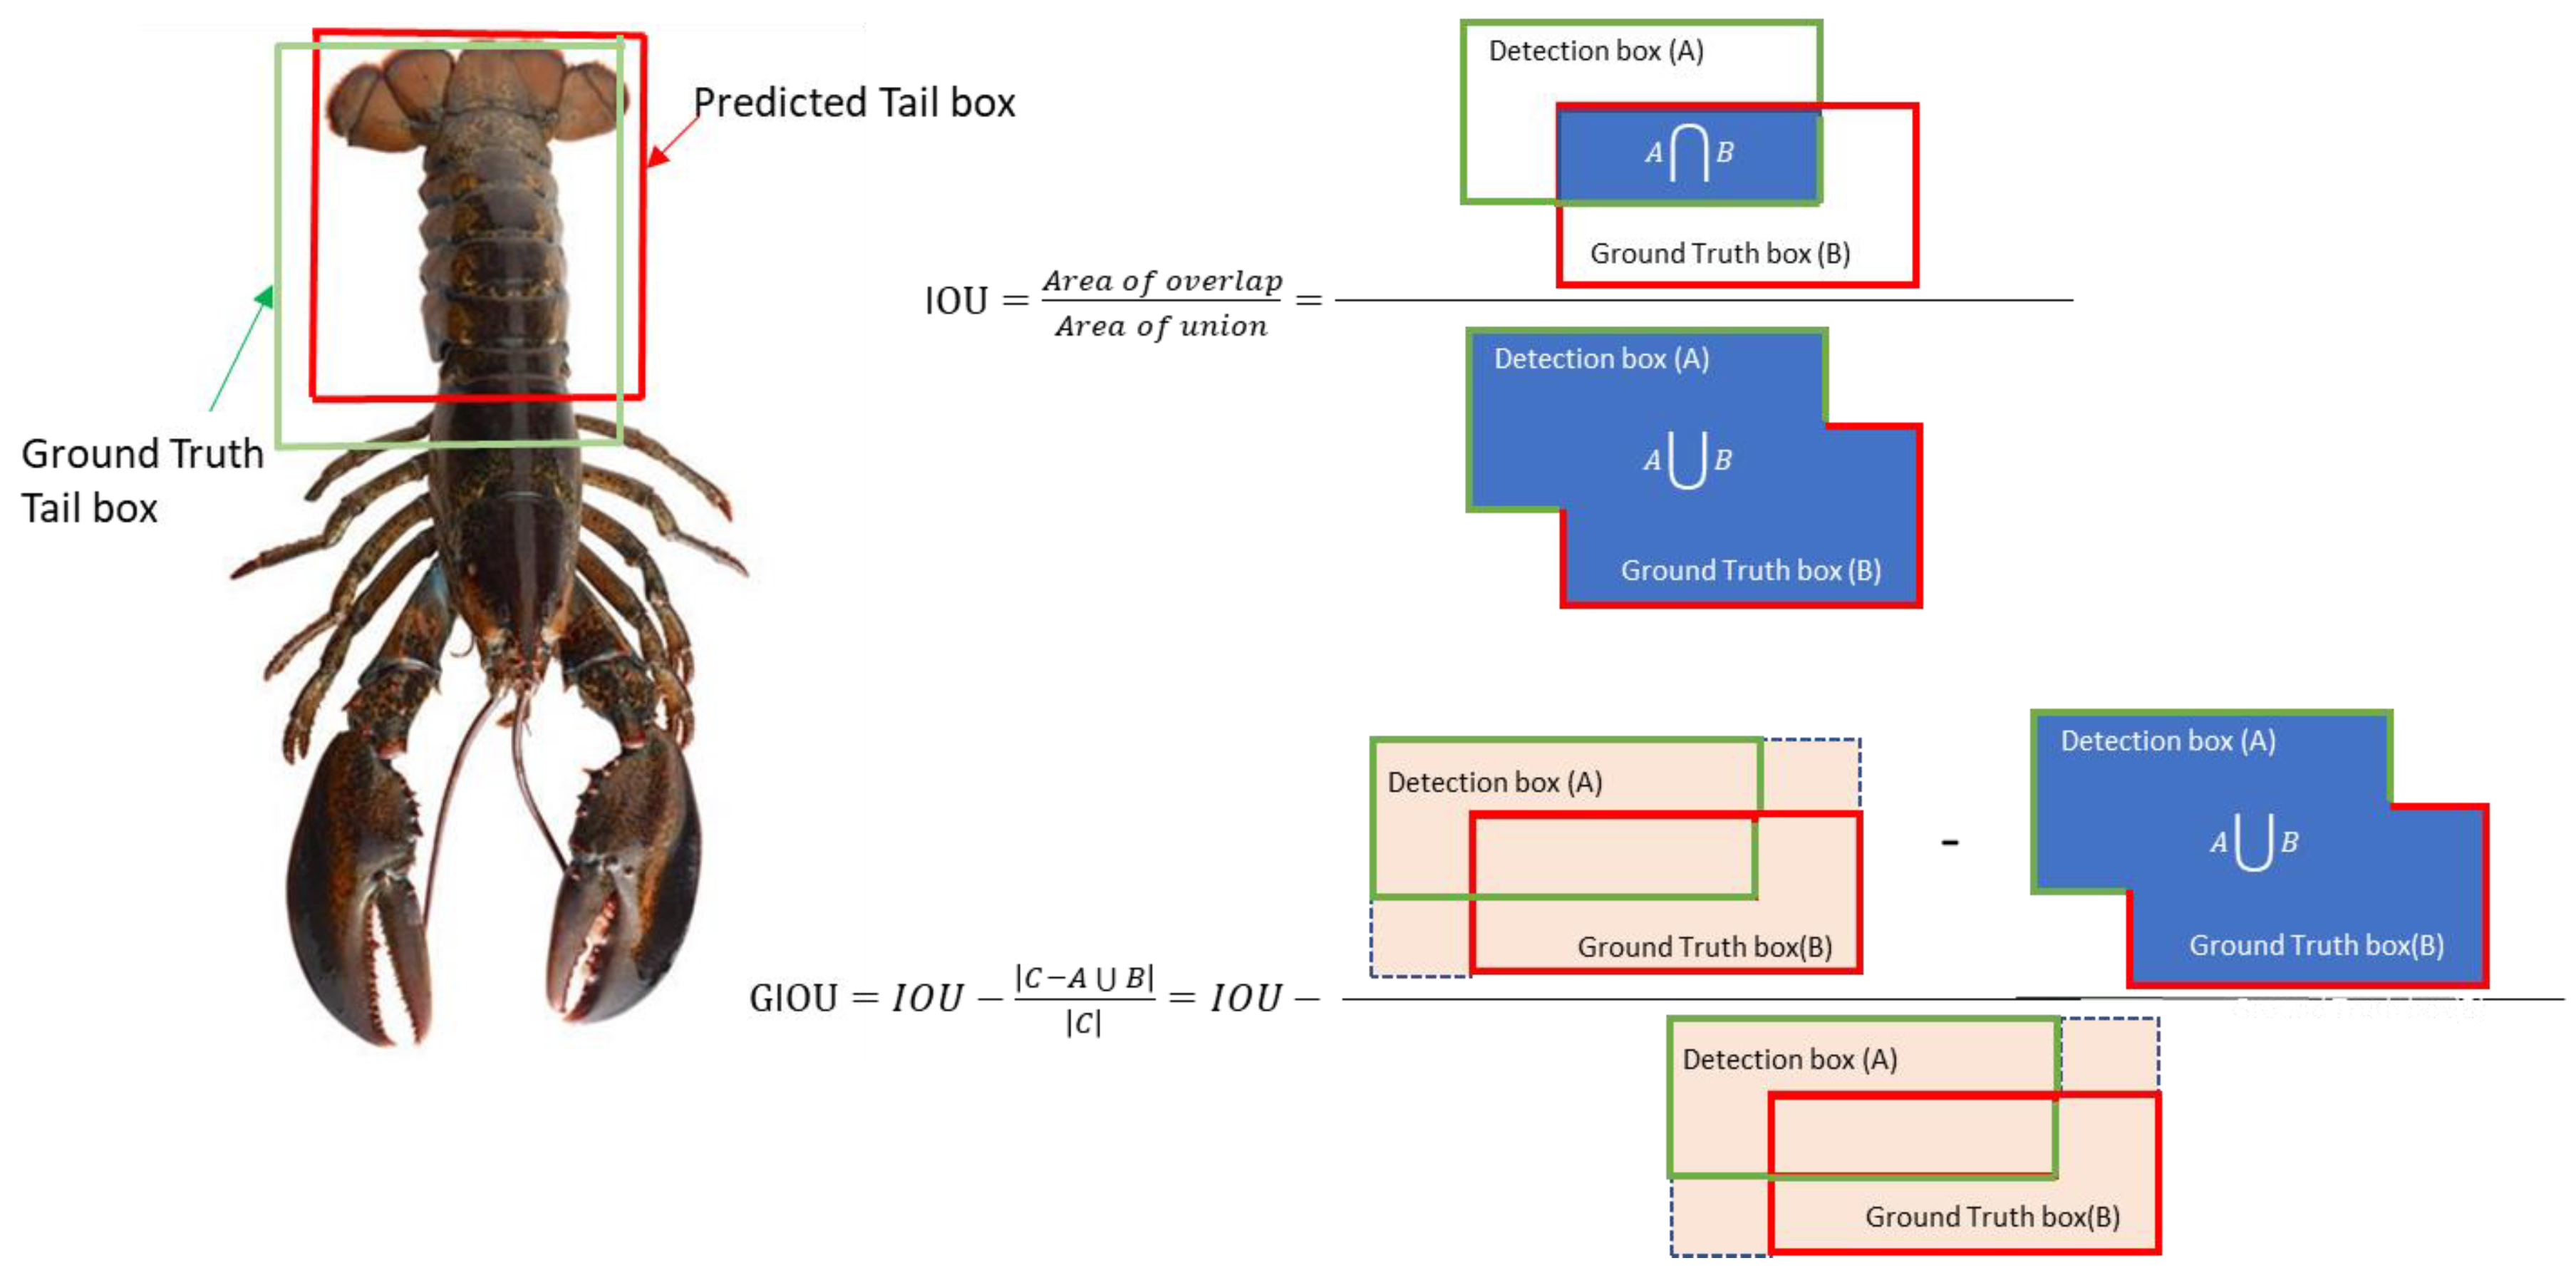
To compute these values, the Generalized Intersection Over Union (GIOU) score is used in order to determine if the detection is correct or not by comparing the GIOU score to a predefined threshold. The GIOU measures how well the predicted bounding box overlaps the ground truth bounding by taking into account the differences in the size and aspect ratio between the predicted and ground truth boxes, in addition to their overlap area and union area, as shown in
Figure 7. GIOU has shown itself to be more robust than Intersection Over Union (IOU), especially when dealing with small or heavily overlapping objects.
IOU is the Intersection Over Union score, A is the area of the predicted bounding box, B is the area of the ground-truth bounding box, C is the area of the smallest box that completely encloses both A and B, and (A U B) is the area of the union of A and B.
The GIOU score ranges from −1 to 1, where 1 indicates a perfect match between the predicted and ground-truth bounding boxes, 0 indicates no match, and −1 indicates a complete mismatch.
Once the GIOU score is calculated for all images, precision, recall, and F1-score metrics can be calculated. Precision, which measures the accuracy of the model to identify a sample as positive, is computed with the following equation:
Recall, which measures the ability of the model to identify all the positive samples as positive, is computed with the following equation:
High precision means a low false-positive prediction rate and high recall means a low false-negative prediction rate. Hence, an accurate object detection model should keep a balance between precision and recall, at a fixed recall interval [0 1.0], with steps of 0.1, according to the 11-point interpolation method proposed by Gerard Salton [
32]. The precision and recall curve is summed with the Average Precision (AP) metric and computed with the following equation:
where
This means that rather than using observed precision at each point R, the AP is calculated by taking the maximum precision at a recall that is greater than or equal to R.
F1 score is the harmonic mean of precision and recall; it maintains the balance between precision and recall [
33], and is computed with the following equation:
The mean Average Precision (mAP) metric measures the object detector’s accuracy over all specific classes. In other words, the mAP is the average AP over all classes [
33], and is computed with the following equation:
where
represents the AP of the class i and N is the number of all evaluated classes.
Frames per second (fps) represents the number of images that can be detected per second and provides an evaluation of the detector speed.
The precision, recall, F1 score, and AP were calculated independently for each class, treating each class as a positive class and the remaining classes as negatives. The overall performance of the model was then calculated by averaging these metrics across all classes.
3. Results and Discussion
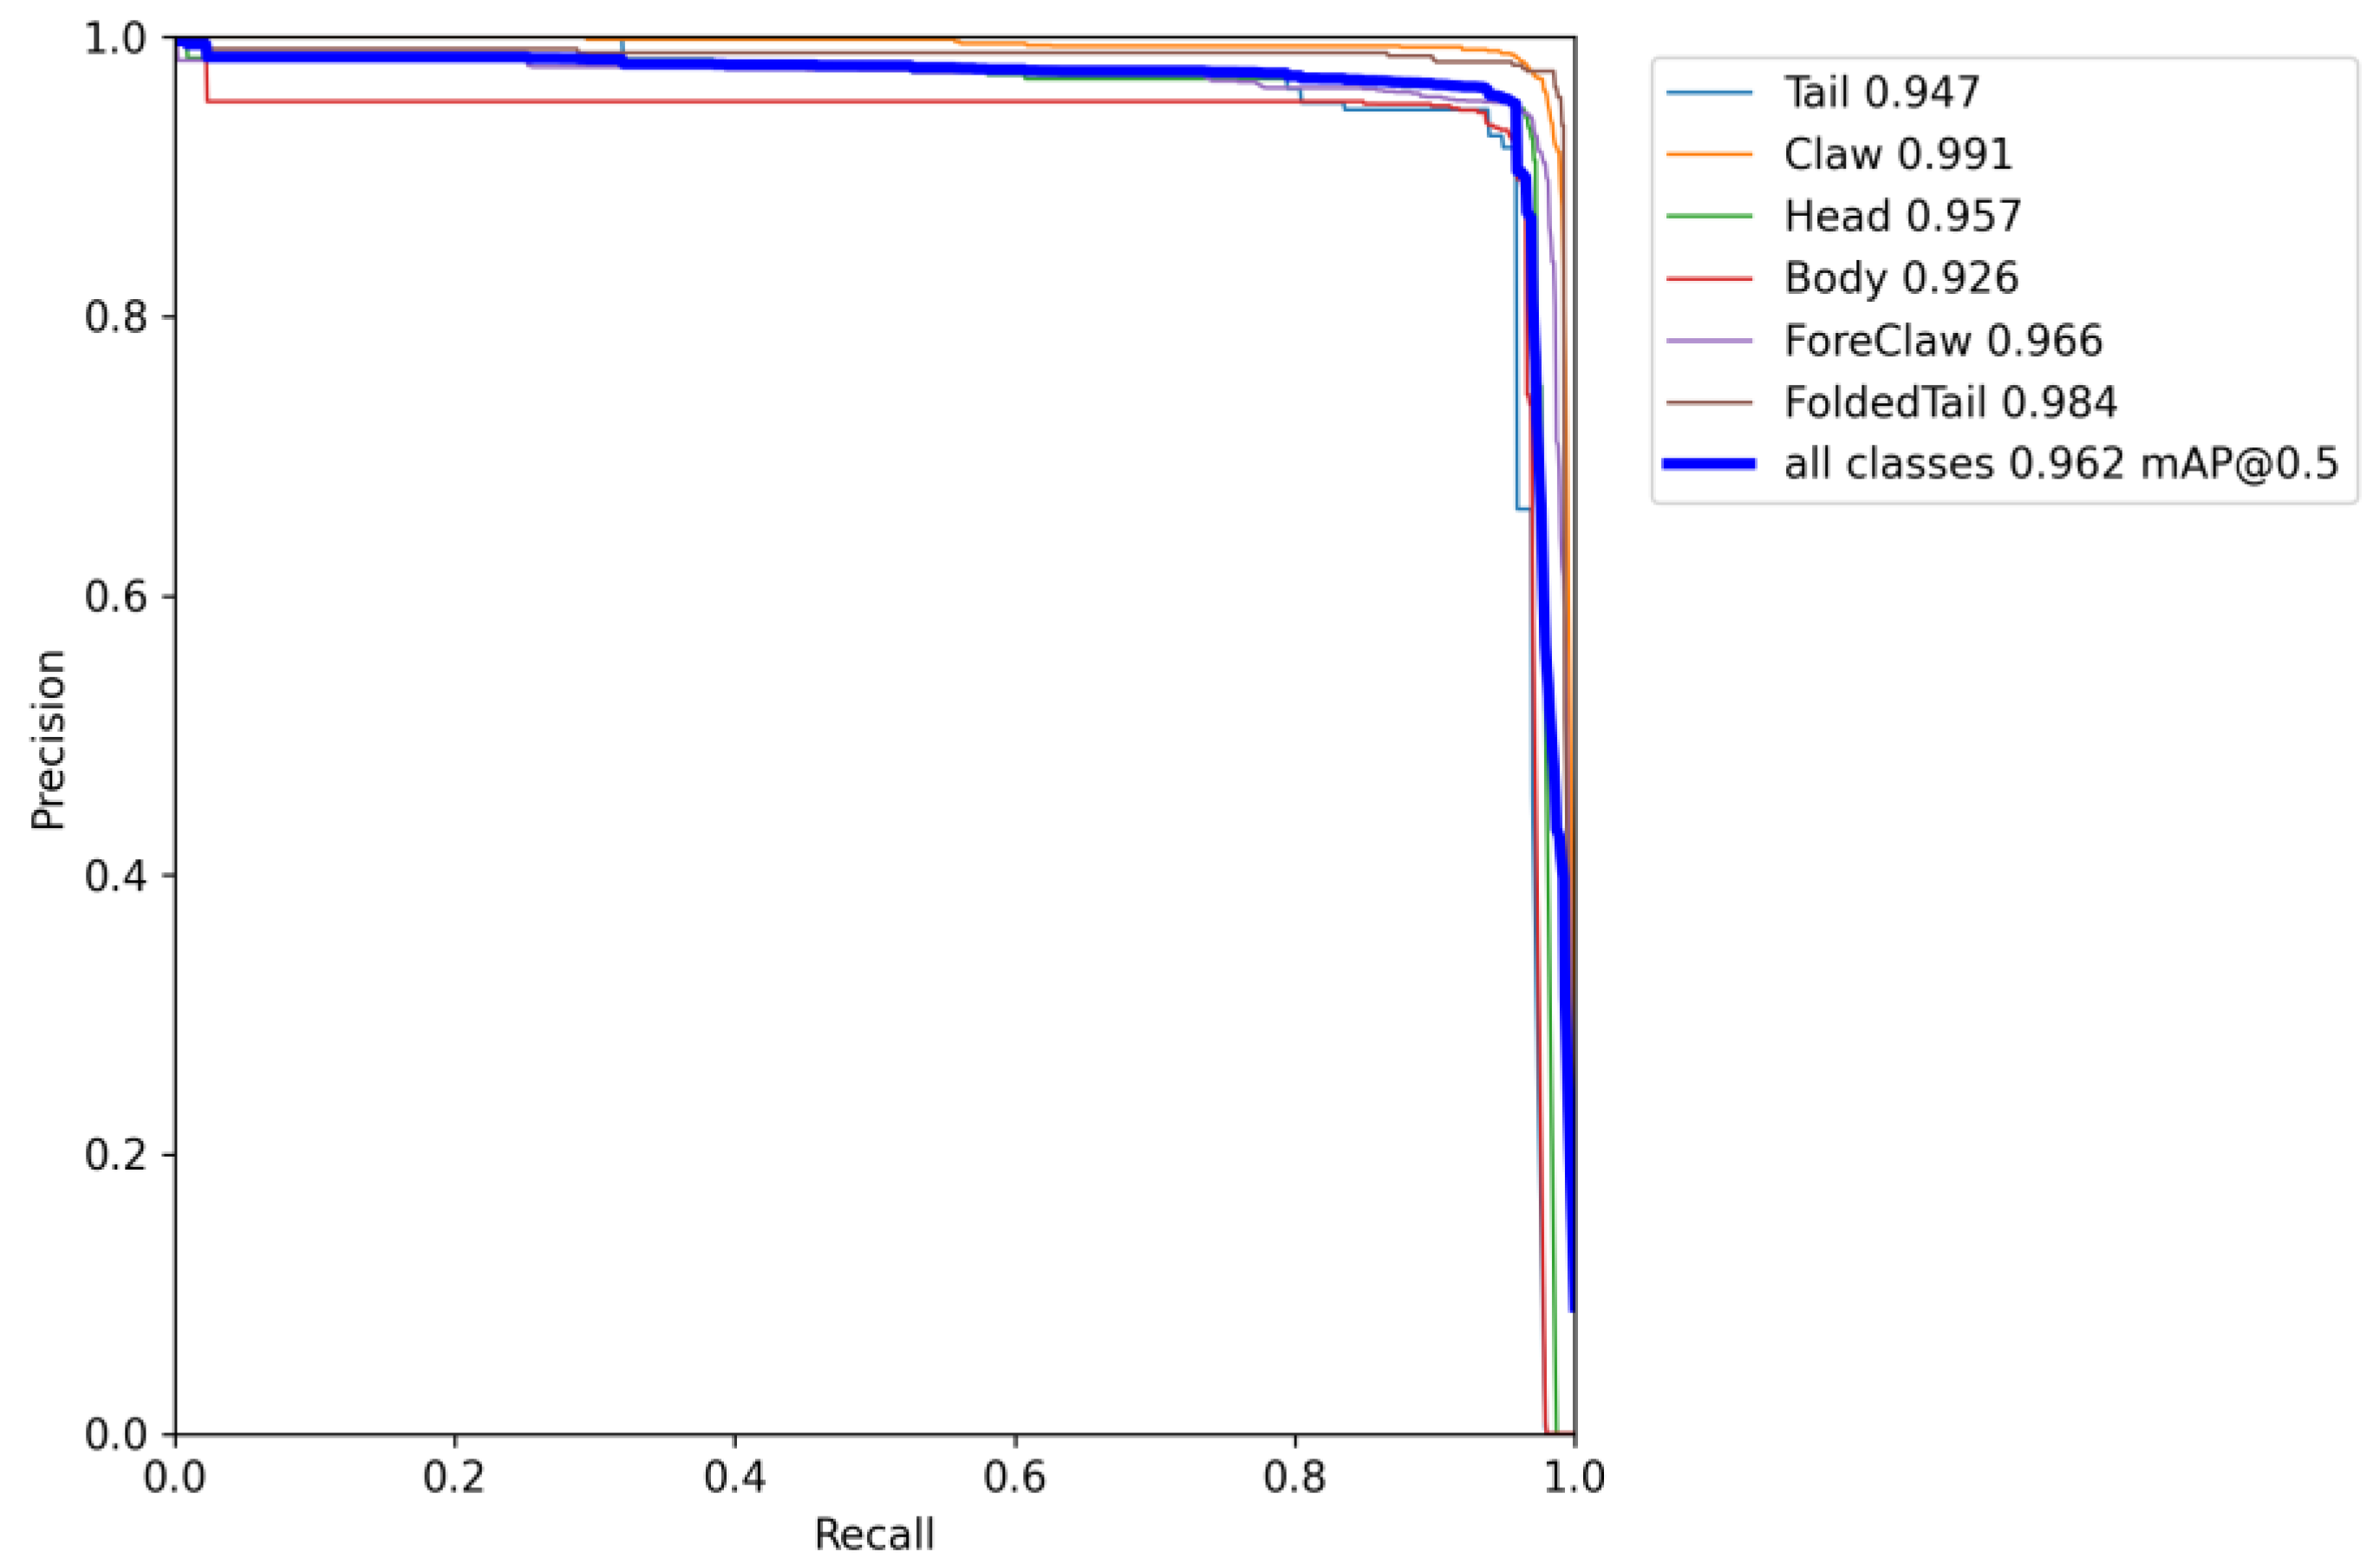
An experimental evaluation of the YOLOv7 model was conducted on the lobster dataset. The results of the model are illustrated in
Figure 8, which shows a high degree of detection efficiency for the various target classes. A value of 96.2% was calculated for the model’s mean average precision (mAP). As a result of this high level of precision, YOLOv7 is capable of identifying and distinguishing lobster body parts with high accuracy. For accurate orientation estimation and manipulation, this is crucial.
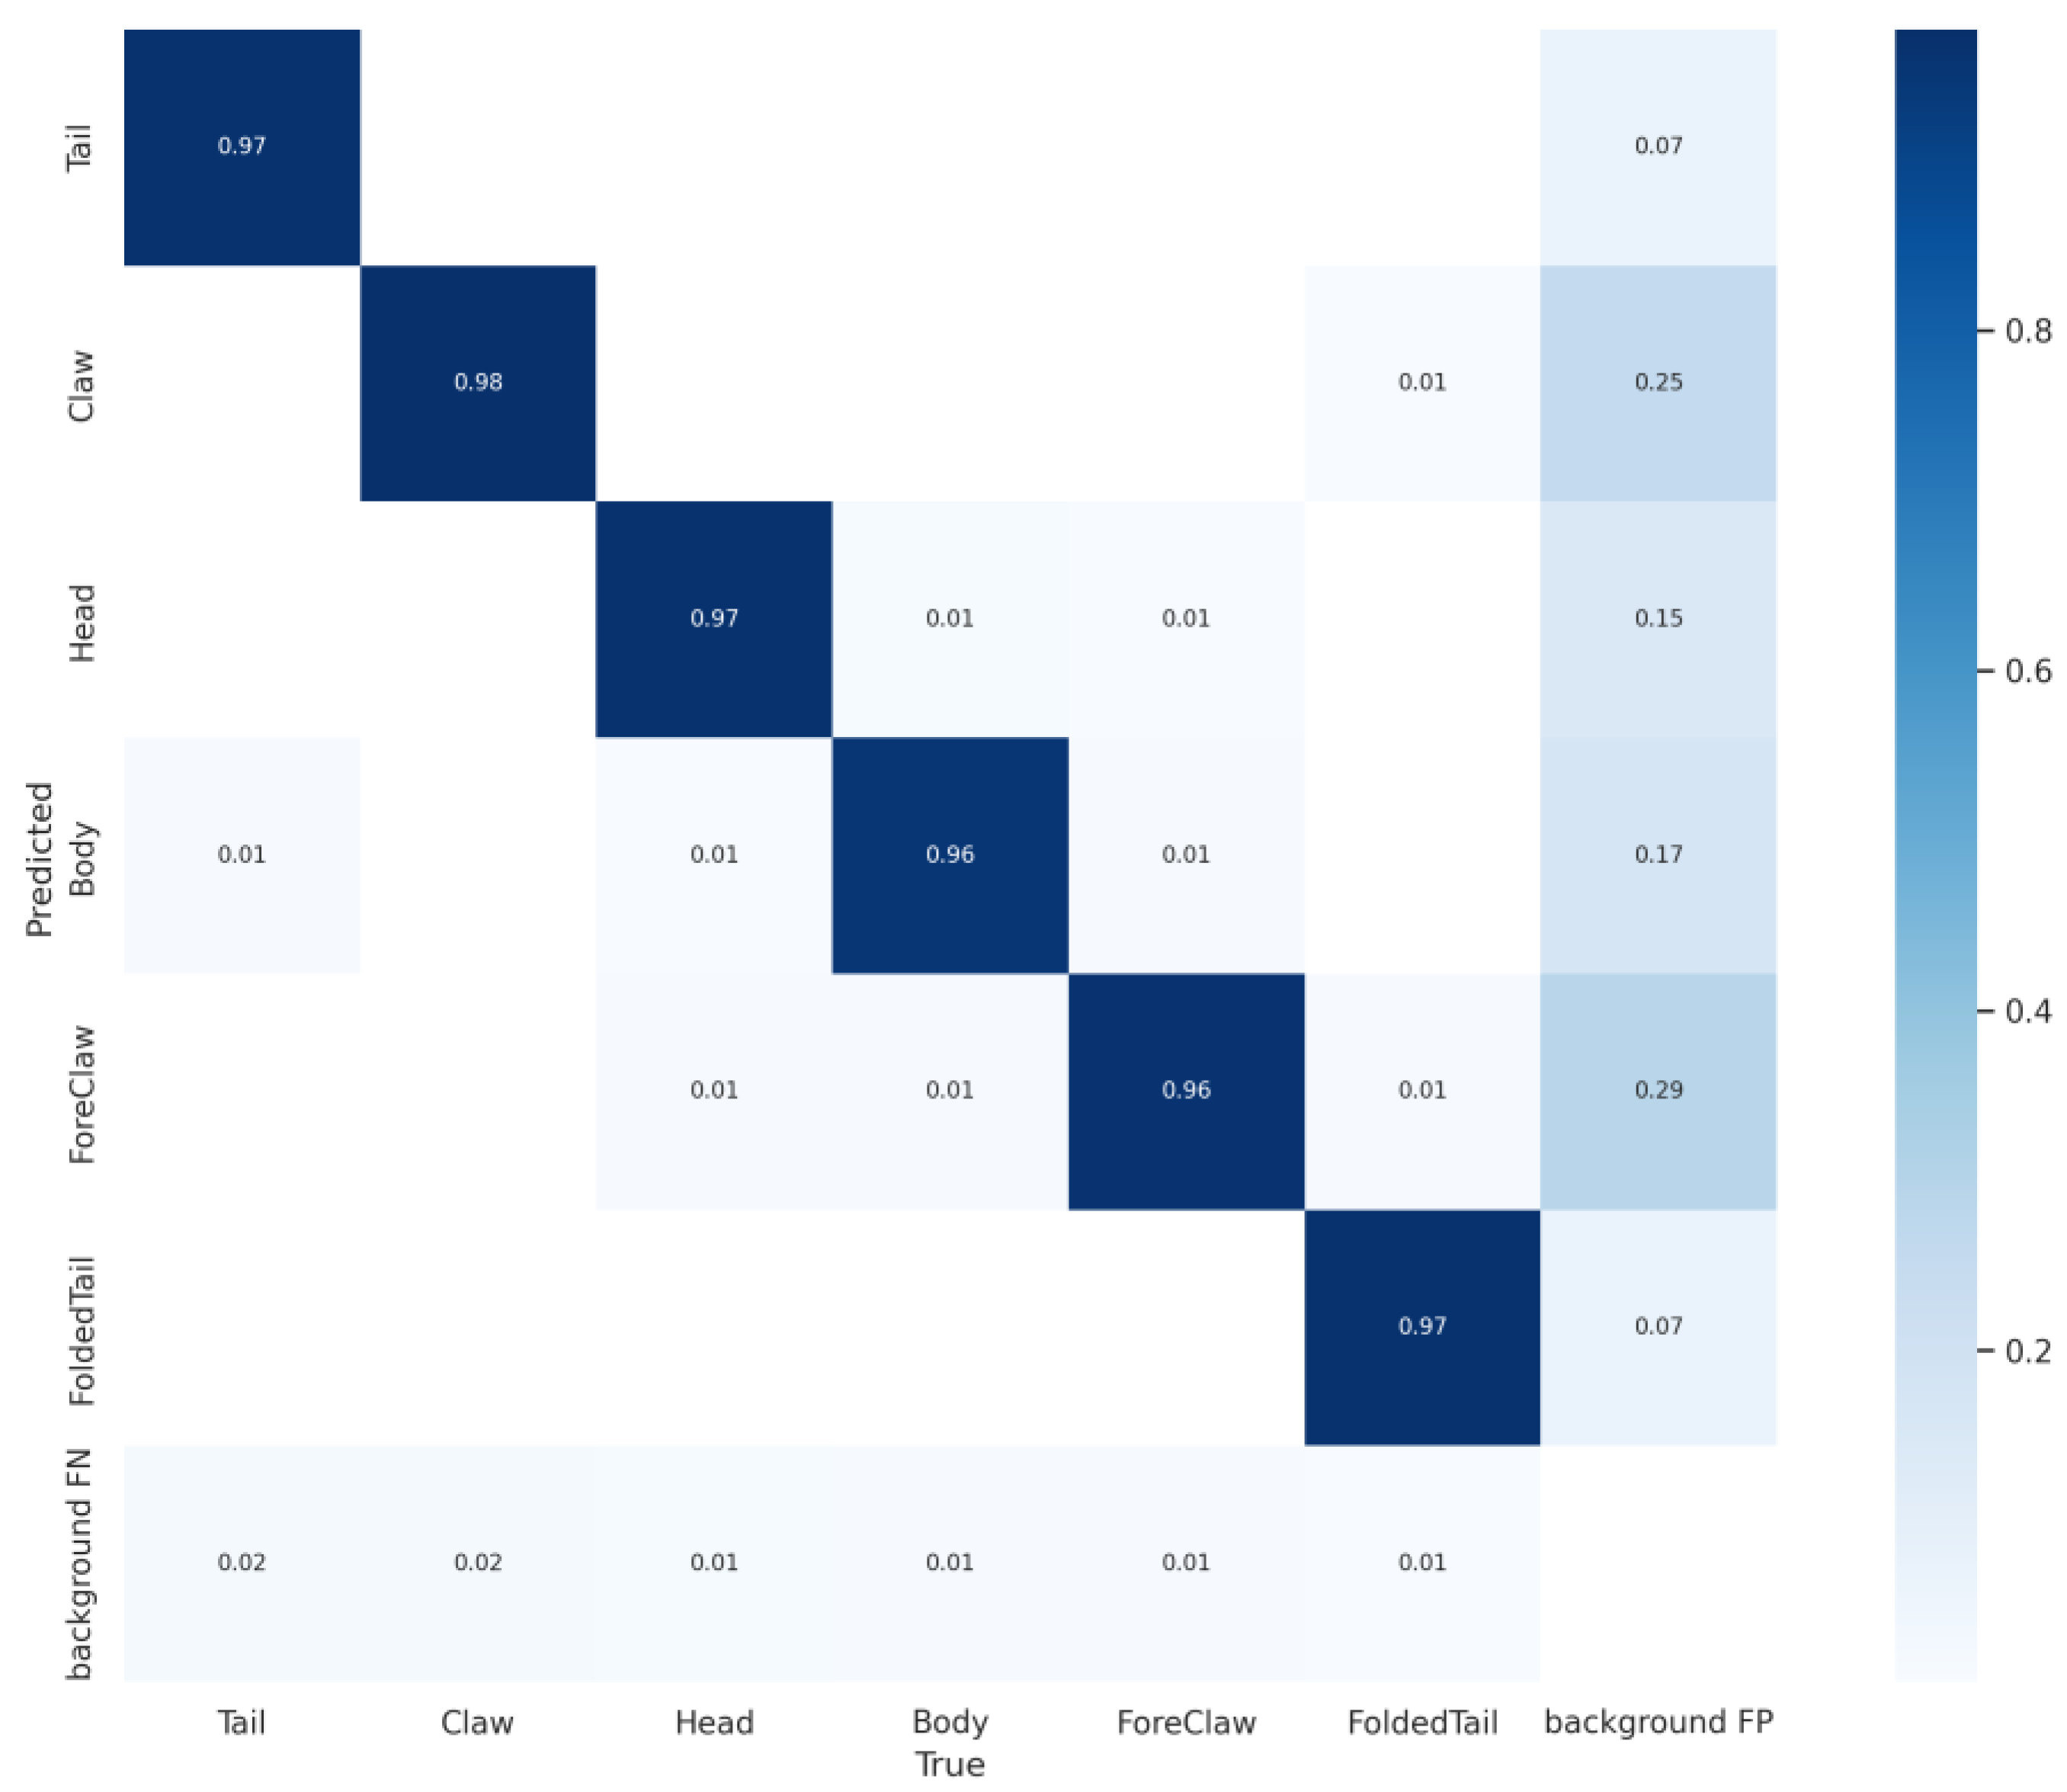
The YOLOv7 model’s accuracy was assessed using a confusion matrix as a performance metric. As depicted in
Figure 9, each column represents the predicted proportions for each class. Each row corresponds to the actual proportions of each class present in the data. As per the data presented in
Figure 9, the model demonstrates a high accuracy in predicting the classes “Tail”, “Claw”, “Head”, “Body”, “Fore-Claw”, and “Folded-Tail”, with correct prediction rates of 97%, 98%, 97%, 96%, 96%, and 97%, respectively. This evidence of the model’s accuracy highlights its effectiveness in classifying and identifying various lobster parts. This suggests that YOLOv7 is well-suited to applications requiring precise detection and distinction of complex object classes.
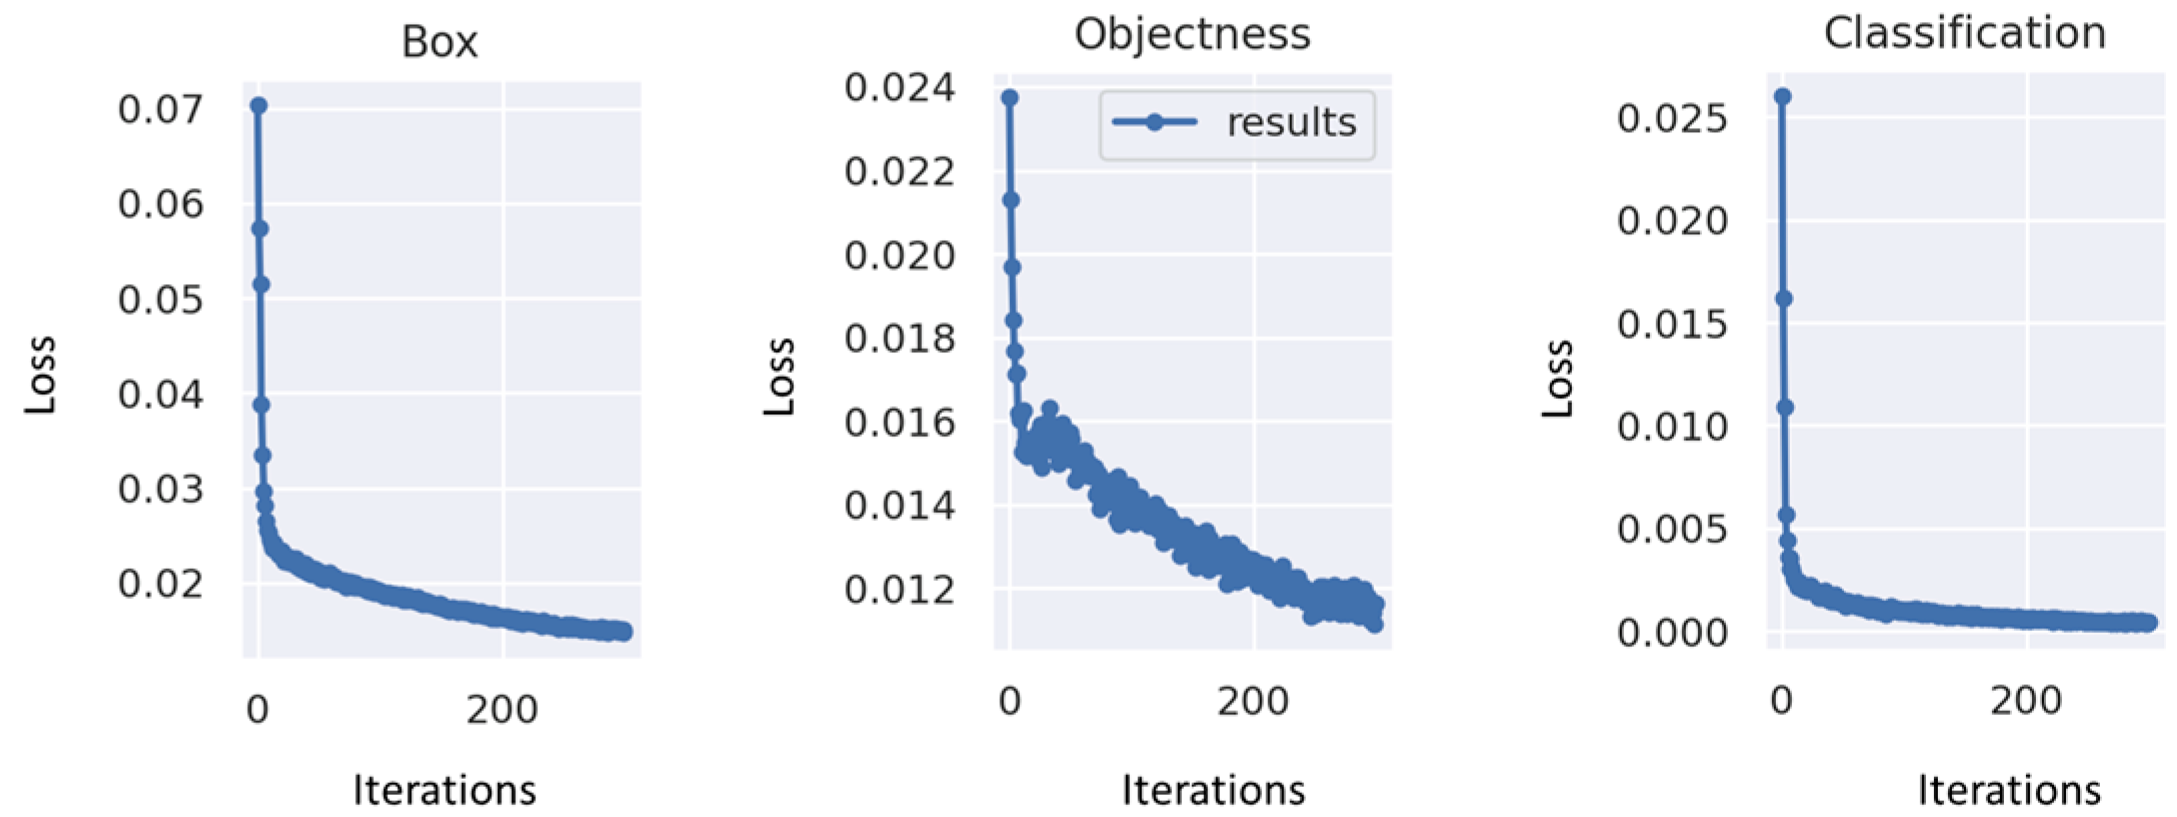
As part of this study, the changes in the loss values, including the Box loss, the objectness loss, and the classification loss are presented in a graphical format. YOLOv7 uses the ‘GIOU Loss’ as the bounding box loss function. Box loss is calculated as the mean of the GIOU loss. A higher accuracy is indicated by a lower box loss value. Objectness loss measures the difference between the predicted and ground truth objectness scores, with a lower value indicating a higher accuracy. The classification loss measures the difference between the predicted and ground truth class probabilities for each object, where a lower value represents a higher accuracy. As shown in
Figure 10, as iterations increase, loss values steadily decrease and eventually stabilize; after 200 iterations, convergence is achieved.
Additionally, YOLOv7 was benchmarked against other well-known object detection models, including YOLOv3, YOLOv4, and YOLOv7-Tiny, to demonstrate its effectiveness in detecting lobster body parts. Training and testing were conducted using the lobster dataset. As part of the evaluation process, performance metrics including precision, recall, F1-score, and mAP@0.5 were evaluated. Based on the performance metrics presented in
Table 2, it is evident that YOLOv7 outperforms the other object detection models by a considerable margin. According to the results, this model achieved scores of 95.5%, 95.1%, 95.2%, and 95.3%, respectively, for precision, recall, F1-score, and mAP@0.5, demonstrating its superior capability when compared with other models in detecting and identifying lobster body parts. In this study, the YOLOv7 object detection model was found to be the top performer and was therefore chosen to be used in further experiments.
On the GeForce RTX 3060 Ti, as shown in
Table 3, the YOLOv7 detector was able to achieve an impressive detection speed of 111 frames per second. This demonstrates its ability to detect objects at high speeds. This speed is slightly slower than YOLOv7-Tiny’s 188.7 fps, but it is important to note that YOLOv7 still delivers a remarkable performance in terms of frame rates. The model is able to handle real-time applications effectively, even when compared to its faster counterpart, the YOLOv7-Tiny.
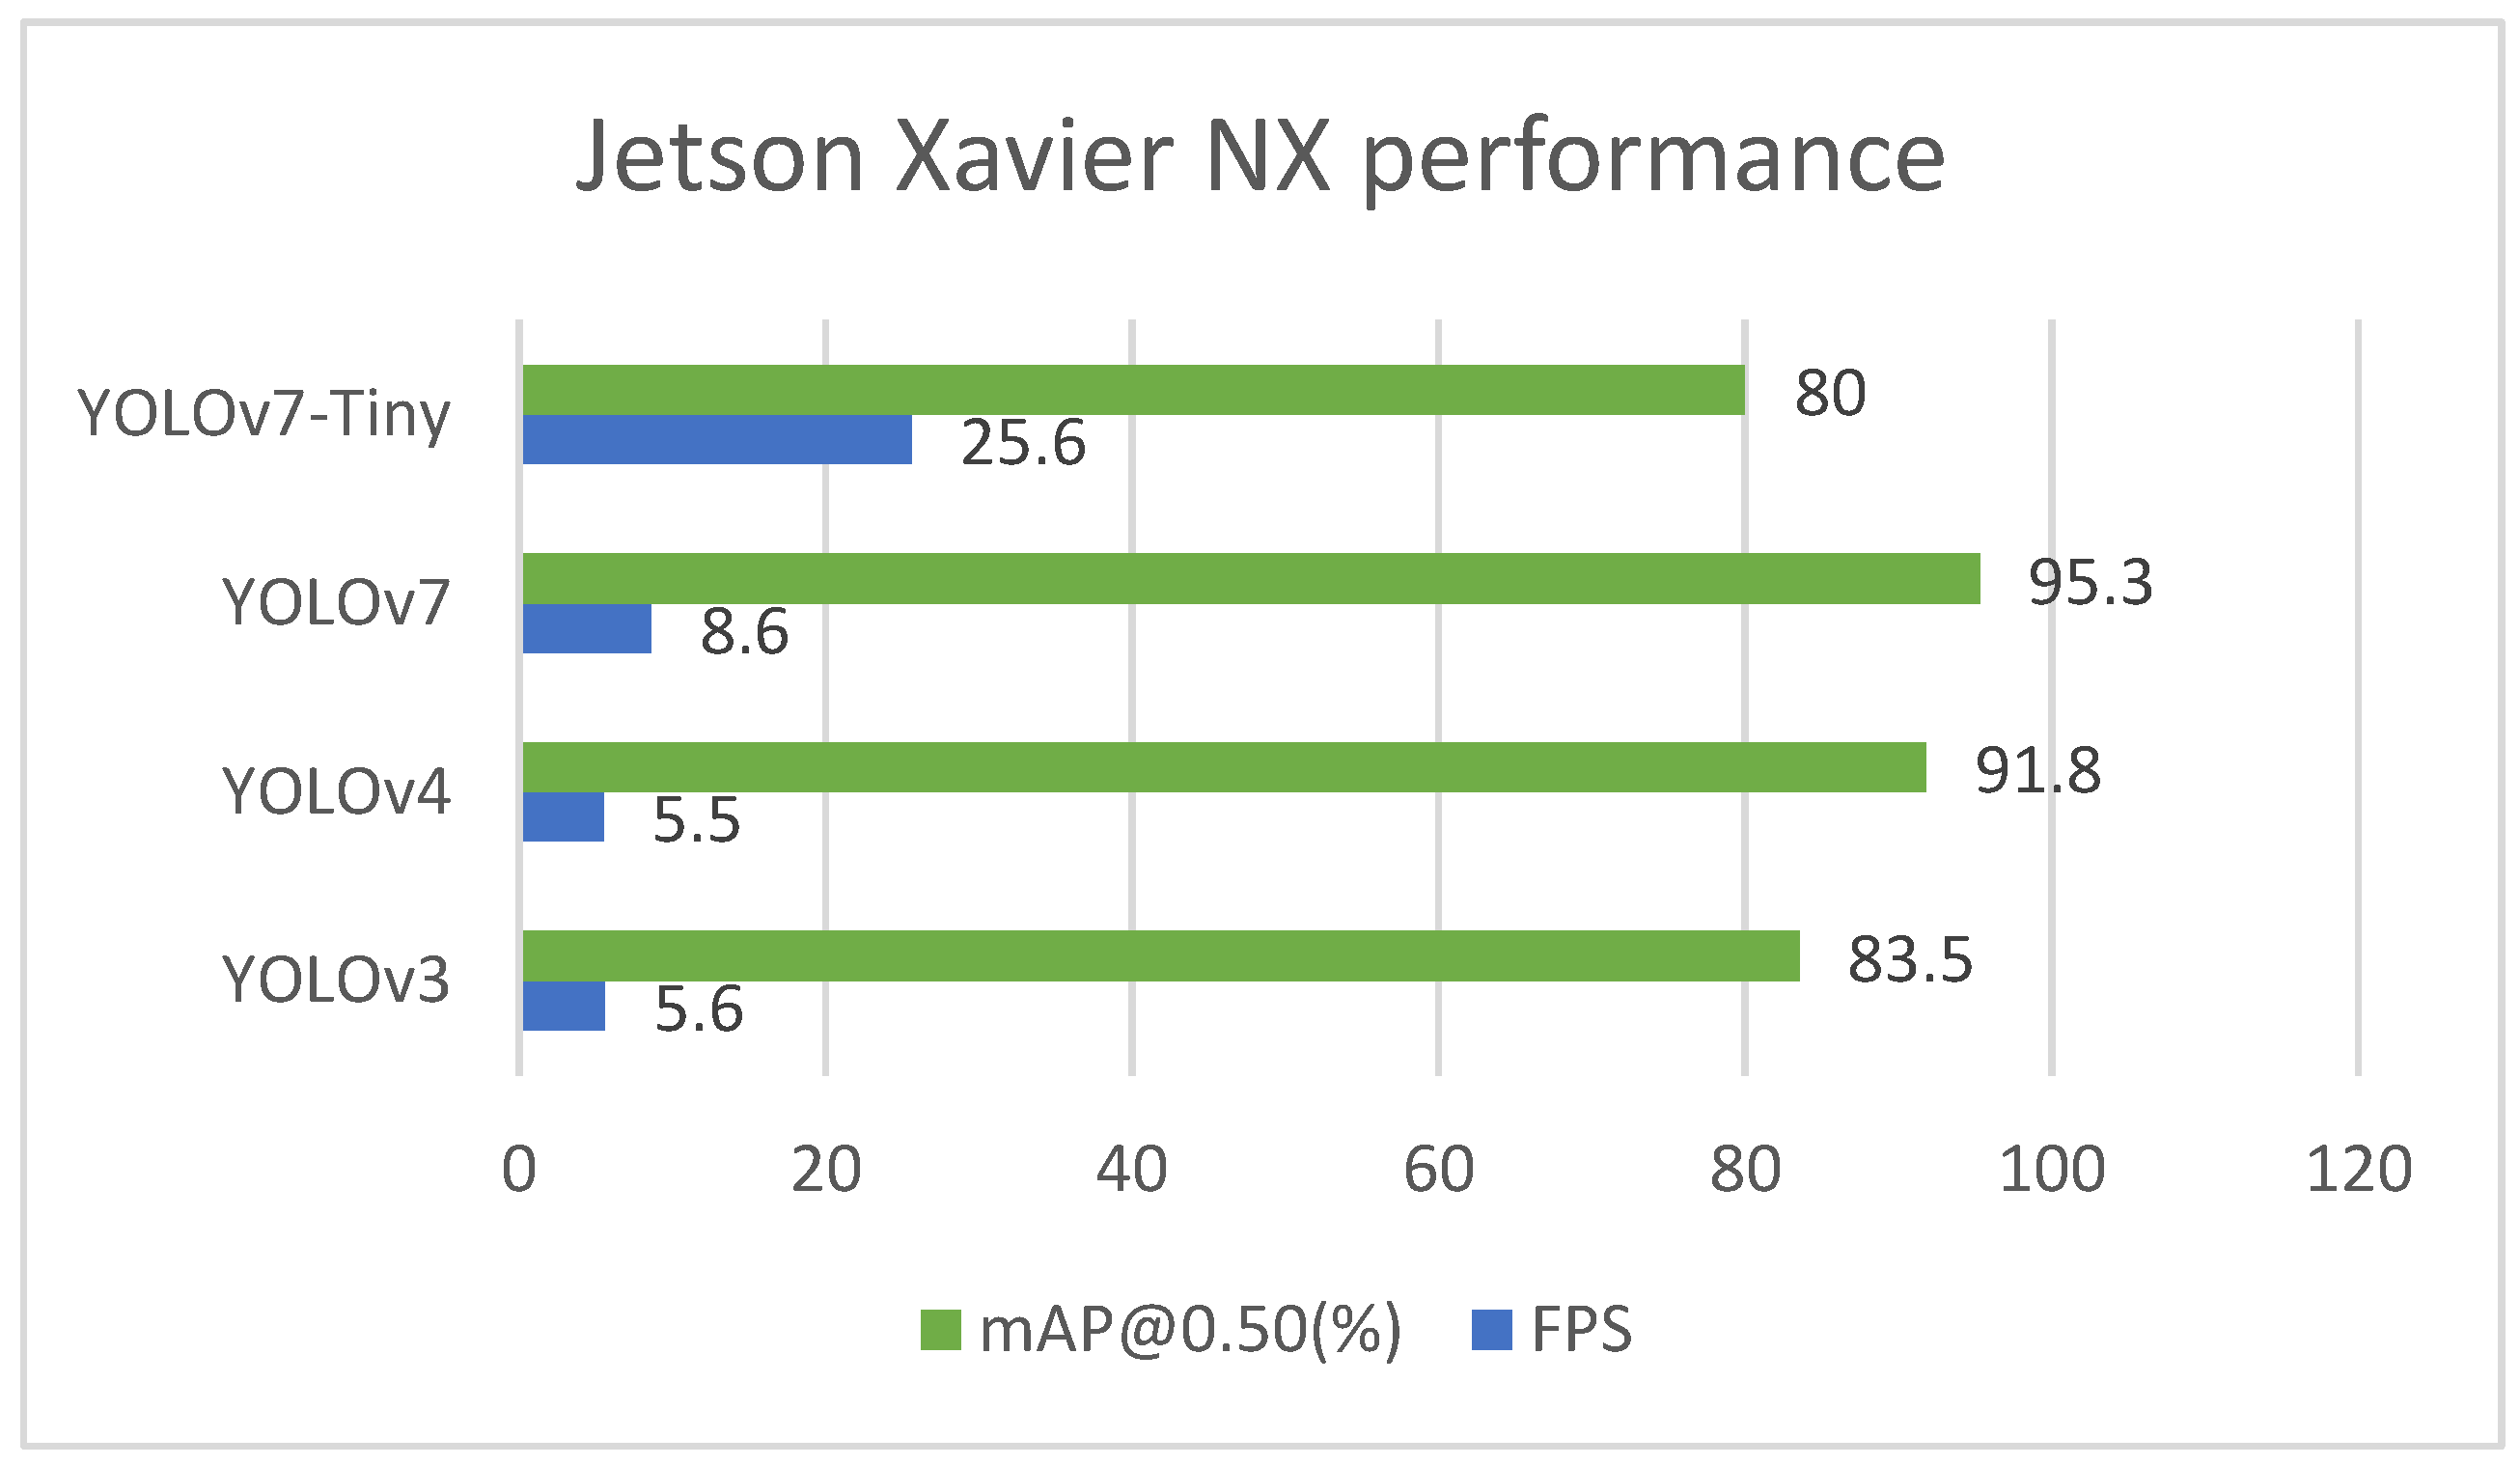
Models were deployed on the NVIDIA Jetson Xavier NX embedded platform. A comparison of the trained models’ inference time detection is presented in
Table 3. To facilitate real-time evaluation, the inference time has been converted from milliseconds to frames per second. A powerful device, the NVIDIA Jetson Xavier NX, allowed YOLOv7-Tiny to achieve 25.6 frames per second in real-time. However, YOLOv7 was deemed unsuitable for deployment on mobile devices due to its high computational requirements. It can be seen from
Table 3 that YOLOv7 was only able to achieve an average frame rate of 8.6, making it infeasible for real-time detectors to operate on the Jetson Xavier NX. In contrast, the real-time performance of YOLOv7-Tiny on the Jetson Xavier NX is quite promising as it achieved a frame rate of 25.6 frames per second. This indicates that YOLOv7-Tiny may be a more suitable choice for real-time applications on resource-constrained platforms such as the Jetson Xavier NX.
Figure 11 demonstrates the performance of the Jetson Xavier NX device in terms of both its accuracy (mAP@0.5) and inference time (fps). The evaluation results clearly indicate that YOLOv7-Tiny emerges with the highest score of 105.6. This is followed closely by YOLOv7 and YOLOv4, which score 103.9 and 97.3 points, respectively. This comparison emphasizes the balance between detection accuracy and speed.
In an industrial context, with a distance between the camera and the processing line of about 50–100 cm, and the processing line normally running at about 30 m per second (m/s), the vision system should have a speed of 30 to 60 fps [
33]. According to the results of the experiments, the Jetson Xavier NX can achieve real-time performance (25.6 fps) with YOLOv7-Tiny, but not with YOLOv7 (8.6 fps), which requires a high computing device for real-time lobster processing applications.
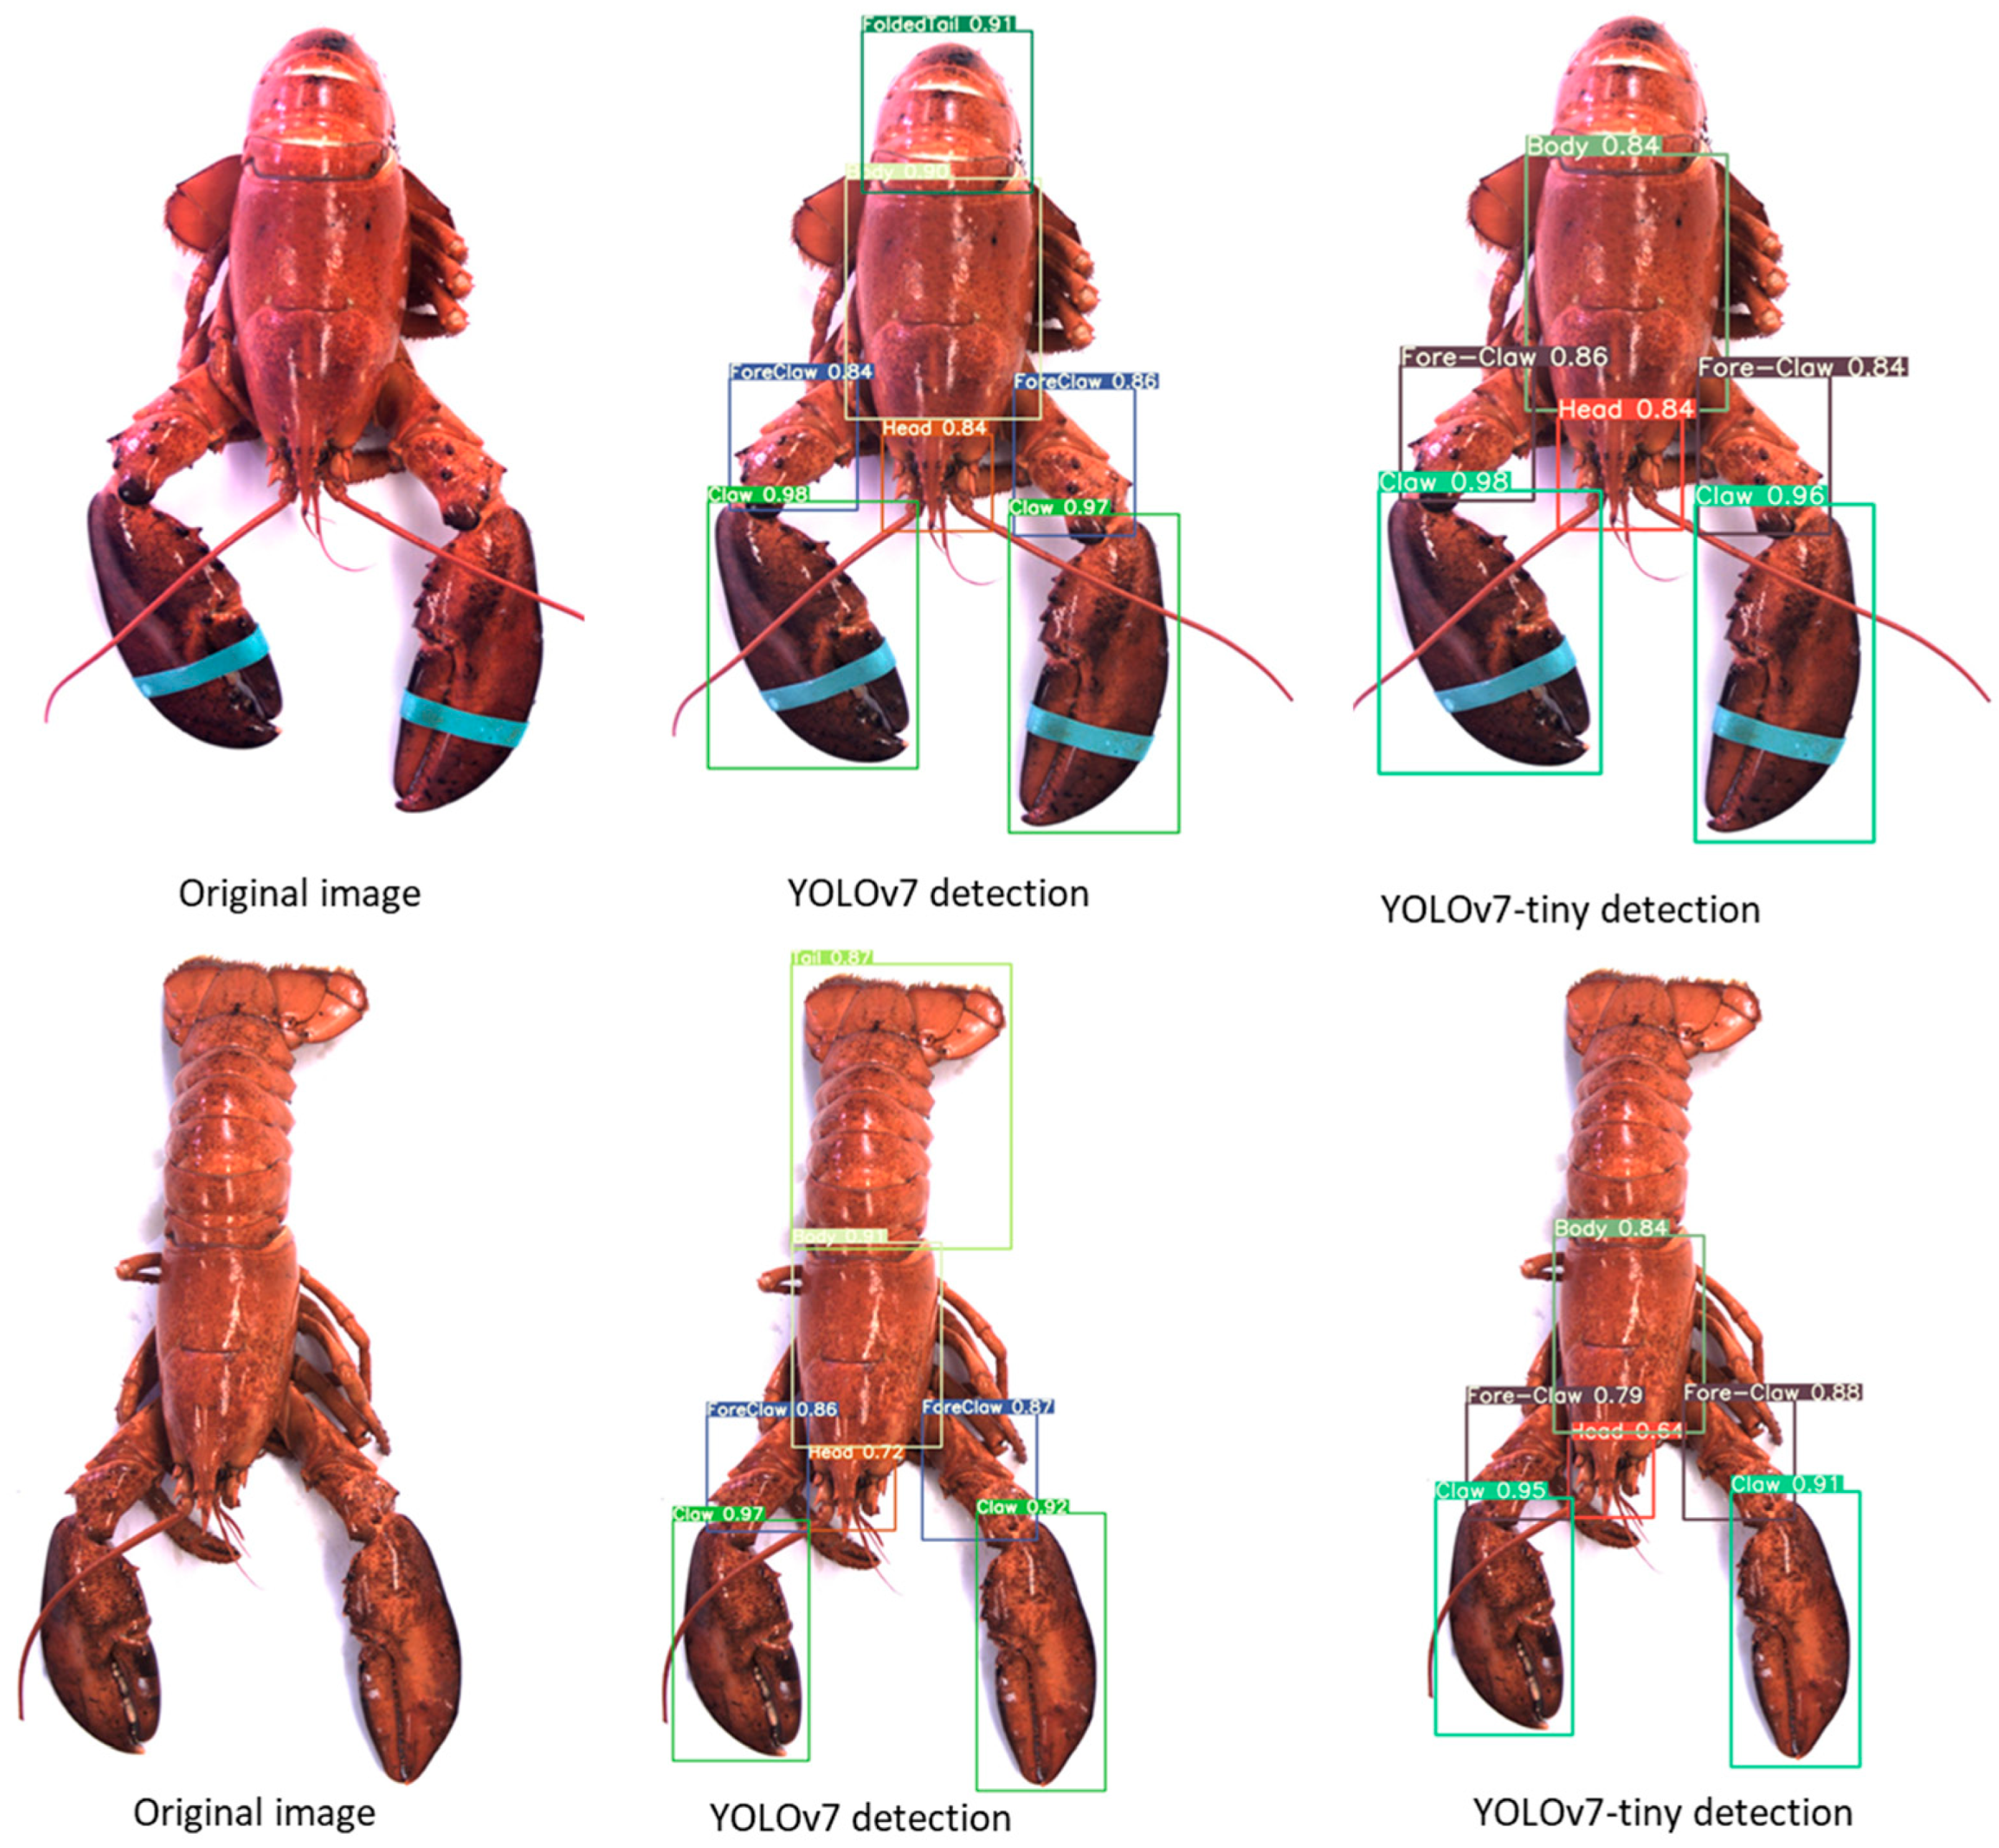
The visual detection results illustrated in
Figure 12 for both YOLOv7 and YOLOv7-tiny algorithms that were trained on American lobster images demonstrate that YOLOv7 was highly successful in identifying all lobster body parts with high scores, showcasing the effectiveness of the full model for this specific task. On the other hand, YOLOv7-tiny, a smaller and more compact version of the model, failed to detect some parts of the lobster. This discrepancy can be attributed to the reduced complexity and computational capacity of the YOLOv7-tiny model, which sacrifices some accuracy for the sake of increased speed and reduced resource consumption.
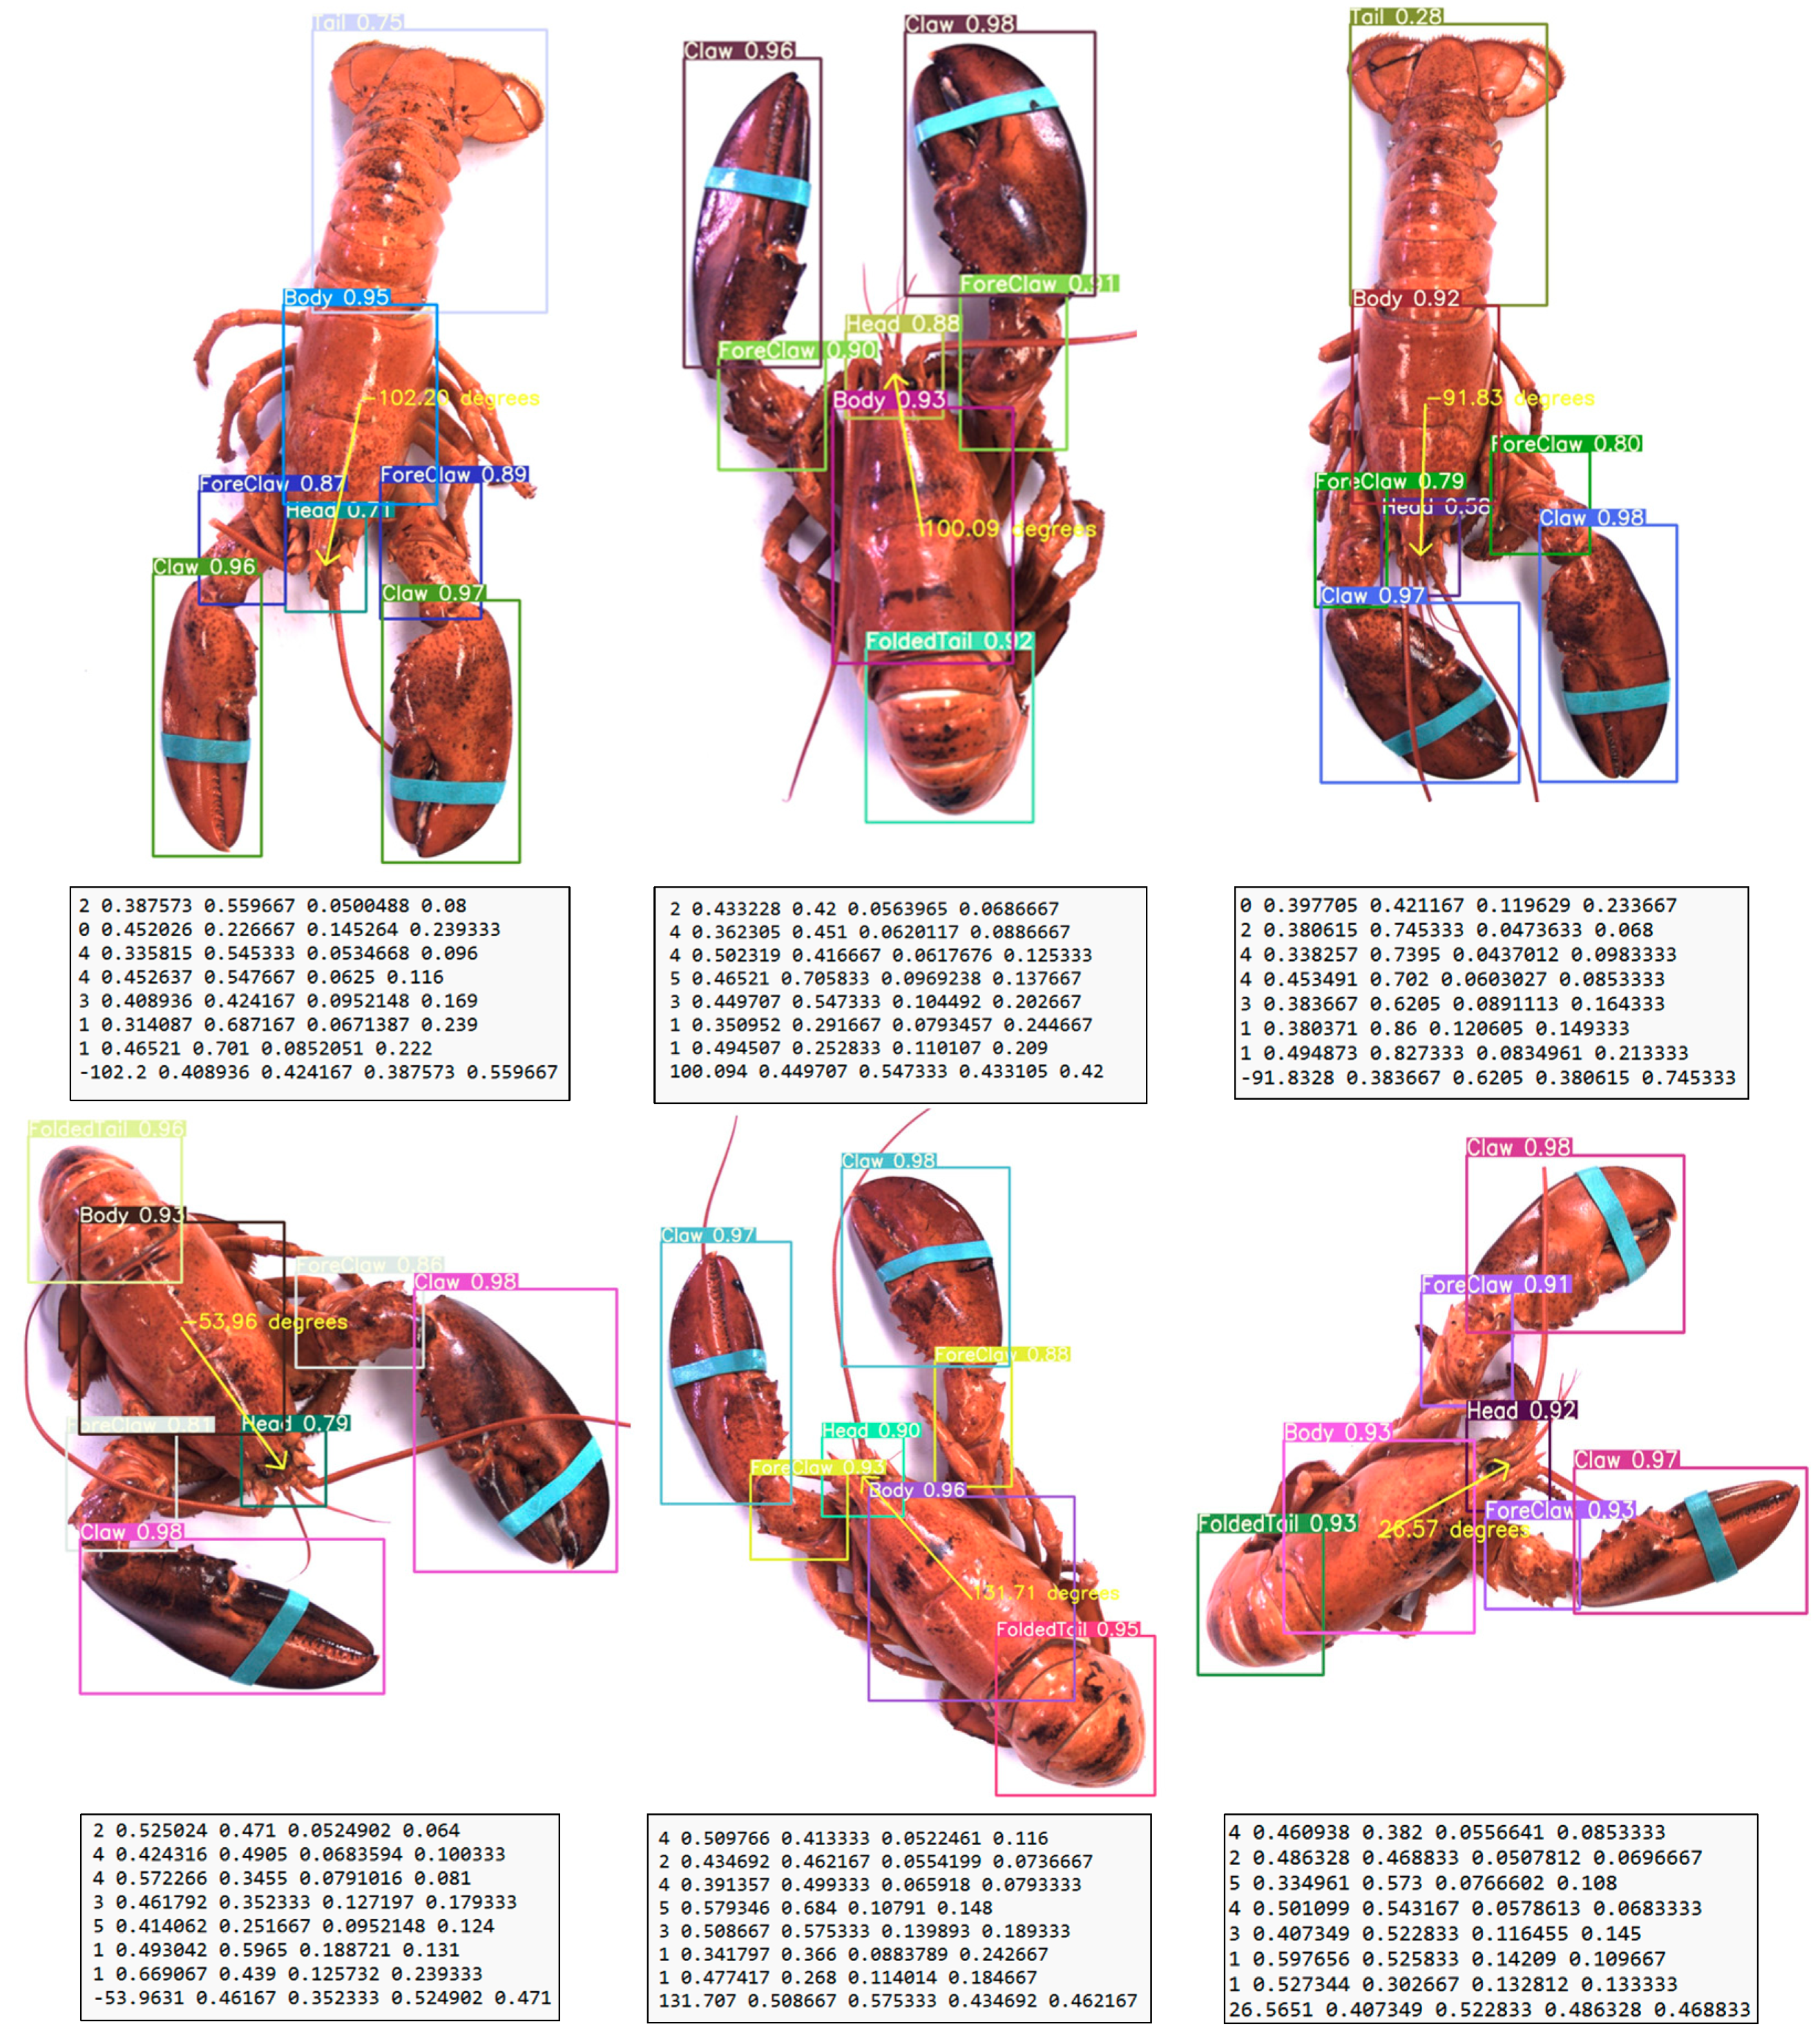
YOLOv7 was ultimately chosen for estimating lobster orientation, leveraging its proven ability to accurately detect lobster body parts. This approach utilized the center coordinates of the head and body bounding boxes to estimate the orientation. By calculating the relative positions and angles between these two points, the model was able to infer the overall direction in which the lobster was facing. The successful implementation of YOLOv7 in this task can be seen in the results, with the lobster orientation estimation and corresponding output vectors clearly illustrated in
Figure 13. These findings demonstrate the efficacy of YOLOv7 in not only detecting lobster body parts but also in extracting valuable information about their spatial orientation. In addition, this model’s capability to process and analyze lobster structural details highlights its adaptability to handle similar challenges in other species or objects with complex morphologies.
4. Conclusions
This study demonstrated the integration of an orientation estimation algorithm with a convolutional neural network model, specifically YOLOv7, to estimate lobster orientation in images. Through rigorous comparison with other models, including YOLOv7-tiny, YOLOv4, and YOLOv3, YOLOv7 emerged as the top performer in terms of accuracy and inference time, boasting a mean average precision (mAP) of 95.3 and 111 FPS on the GeForce RTX 3060 Ti. However, when deployed on the NVIDIA Jetson Xavier NX, YOLOv7′s performance dropped to 8 FPS, rendering it unsuitable for real-time applications on this platform. Nevertheless, the study adopted YOLOv7 for lobster orientation estimation due to its superior performance, with the aim of guiding the FANUC LR Mate 200 iD robotic arm in lobster manipulation tasks within the robot’s workspace. This novel approach has the potential to overcome the limitations of FANUC’s IRVision system, which previously struggled to detect complex lobster body parts, and paves the way for more efficient and accurate lobster processing in the food industry.
Future work should aim to explore several areas to build upon these findings, including experimenting with the FANUC LR Mate 200 iD robotic arm for lobster manipulation using a YOLOv7-based orientation estimation. Optimizing YOLOv7 for deployment on platforms with limited computational resources, such as the NVIDIA Jetson Xavier NX, will help towards achieving high-quality real-time performance without sacrificing accuracy.


