
Influence of Microclimate on Older Peoples’ Outdoor Thermal Comfort and Health during Autumn in Two European Cities

Escuela Técnica Superior de Arquitectura, Universidad Politécnica de Madrid, Av. Juan de Herrera, 2, 28040 Madrid, Spain
*
Author to whom correspondence should be addressed.
Designs 2023, 7(1), 27; https://doi.org/10.3390/designs7010027
Submission received: 23 December 2022
/
Revised: 13 January 2023
/
Accepted: 18 January 2023
/
Published: 1 February 2023
(This article belongs to the Special Issue Sustainable Design in Building and Urban Environment)
Abstract
:Public spaces and green areas have been proven to influence people’s mental and physical health, thermal comfort being one of the main indicators. The growing trend of an ageing population globally led this research to analyse the outdoor thermal comfort of older adults in public spaces from two cities in Europe: Madrid in Spain and Newcastle upon Tyne in the United Kingdom during autumn. A mixed methodology through environmental measurements and surveys was performed in situ. In addition, the UTCI (Universal Thermal Climate Index) and PET (Physiological Equivalent Temperature) outdoor thermal comfort indices were applied. The results highlighted the risk of thermal stress and the vulnerability of this group of the population to the effects of climate on their health. Although most older people had ‘neutral’ thermal sensation, 86.3% of them would be at risk of cold stress in Newcastle, whilst in Madrid 31.5% would be at risk of cold stress and 35.7% of heat stress. Those results could be a starting point for the design of more comfortable and healthy public spaces that improve the quality of life of all citizens within the guidelines of active ageing and healthy cities.
1. Introduction
The Intergovernmental Panel on Climate Change (IPCC) forecasts an increase in the intensity, number, and duration of extreme weather events, so it is expected that the extreme temperature will increase [1]. This affects normal temperatures in autumn and spring; in some cases, the change in season is imperceptible [2]. Parallel to this, according to the World Health Organization (WHO), the ageing population in 2050 will triple. In addition, more than half of the world’s population lives in urban habitats. By 2030, six out of ten people in the world will live in a city, of which 900 million would be older adults [3].
One of the characteristics of ageing is its diversity among people over 65 years old. Thus, health depends on various factors such as genetic predisposition, lifestyle and quality of life, and at the same time is influenced by the physical and social environment. However, statistics indicate that a large percentage of older people tend to present multimorbidity and are also more sensitive to environmental effects on health (noise pollution, heat waves, cold waves, etc.) [4]. Some physiological changes that occur with ageing affect the thermal sensitivity, perception, adaptation and preferences of older adults [5]. For instance, muscle strength, work capacity, activity level, metabolic rate, vascular reactivation, thermoregulation capacity, sweating and hydration levels decrease and affect their ability to detect and respond to temperature changes, making them vulnerable to thermal extremes [6].
Public spaces are determinants for people’s health [7]. Thermal comfort depends on several factors including: geographical (latitude, altitude); microclimatic (temperature, humidity, wind, radiation); personal (activity, clothing, age, gender, state of health, among others); psychological factors (aptitude, experience, expectation, memory, etc.) and built environment factors (vegetation, shade, surface material, SVF, microclimate, etc.) [8]. Therefore, a good urban design based on bioclimatic criteria influences the quality of these spaces and the well-being of their users and the environment [9].
Most studies on thermal comfort are based on the physical and physiological characteristics of the ‘type person’ (a man, 35 years, 1.70 m in height, 75 kg in weight, level of shelter and standard metabolic rate [10,11,12], without taking into account the physiological conditions of older people or other vulnerable groups [13]. Novieto and Zhang [6] applied the IESD-Fiala model to represent the ageing human body considering the metabolic rate, heart rate and weight. They found that these factors differ between 10 and 19.2% of the characteristics of an average young person. Additionally, through sensitivity tests and simulations to establish the impact of these factors on the thermal comfort of older people, they discovered that the most influential factor was the basal metabolic rate. In a literature review of the existing literature on the thermal comfort of older adults [5], it was found that there are differences between 0.2 °C to 4 °C between the comfort ranges of the elderly and the rest of the age groups, the latter groups being more tolerant of the outside environment [5]. However, most of these studies refer to indoors and are heterogeneous in terms of methodologies, sample sizes and climatic zones, evidencing the need for more research in this area [13].
Until the early years of the twenty-first century, not much attention had been paid to the study of exterior thermal comfort and most evaluation systems had been developed for interiors, in stable conditions, that is, without considering the multiple factors that affect the urban microclimate [14,15]. Some authors have tried to adapt the interior thermal comfort indices such as PMV [16], SET [17] and ET [18]. Subsequently, other methods have been developed to establish the sensation of thermal comfort for open spaces, such as the case of PET (Physiological Equivalent Temperature) [19] and UTCI (Universal Thermal Climate Index) [20]. These are the most used in outdoor assessment [21].
Different climatic zones have specific characteristics that influence thermal comfort conditions and thermal adaptation among diverse seasons [22,23]. Thermal adaptation refers to the ability to adapt to the microclimate conditions, and this could be physical, physiological or psychological [24]. For instance, some aspects are related to cultural and social factors specific to each locality and context that affect thermal adaptation, including physiological conditions (health status, gender, age and metabolic rate), psychological issues (origin, expectation, personal experience, attitude, etc.) and clothing insulation levels [25,26].
In this context, the objectives of the present study are as follows:
- To evaluate how microclimate variables (air temperature, wind speed, mean radiant temperature, relative humidity and sky view factor) affect the thermal comfort of older people in public spaces during autumn in different climatic zones (Csa—Mediterranean Climate and Cfb—oceanic climate).
- To identify thermal comfort ranges for older adults in outdoor public spaces during autumn.
- To identify health risk via thermal stress (due to extrem cold or heat) for older adults in different climates during autumn according to PET and UTCI indexes.
2. Materials and Methods
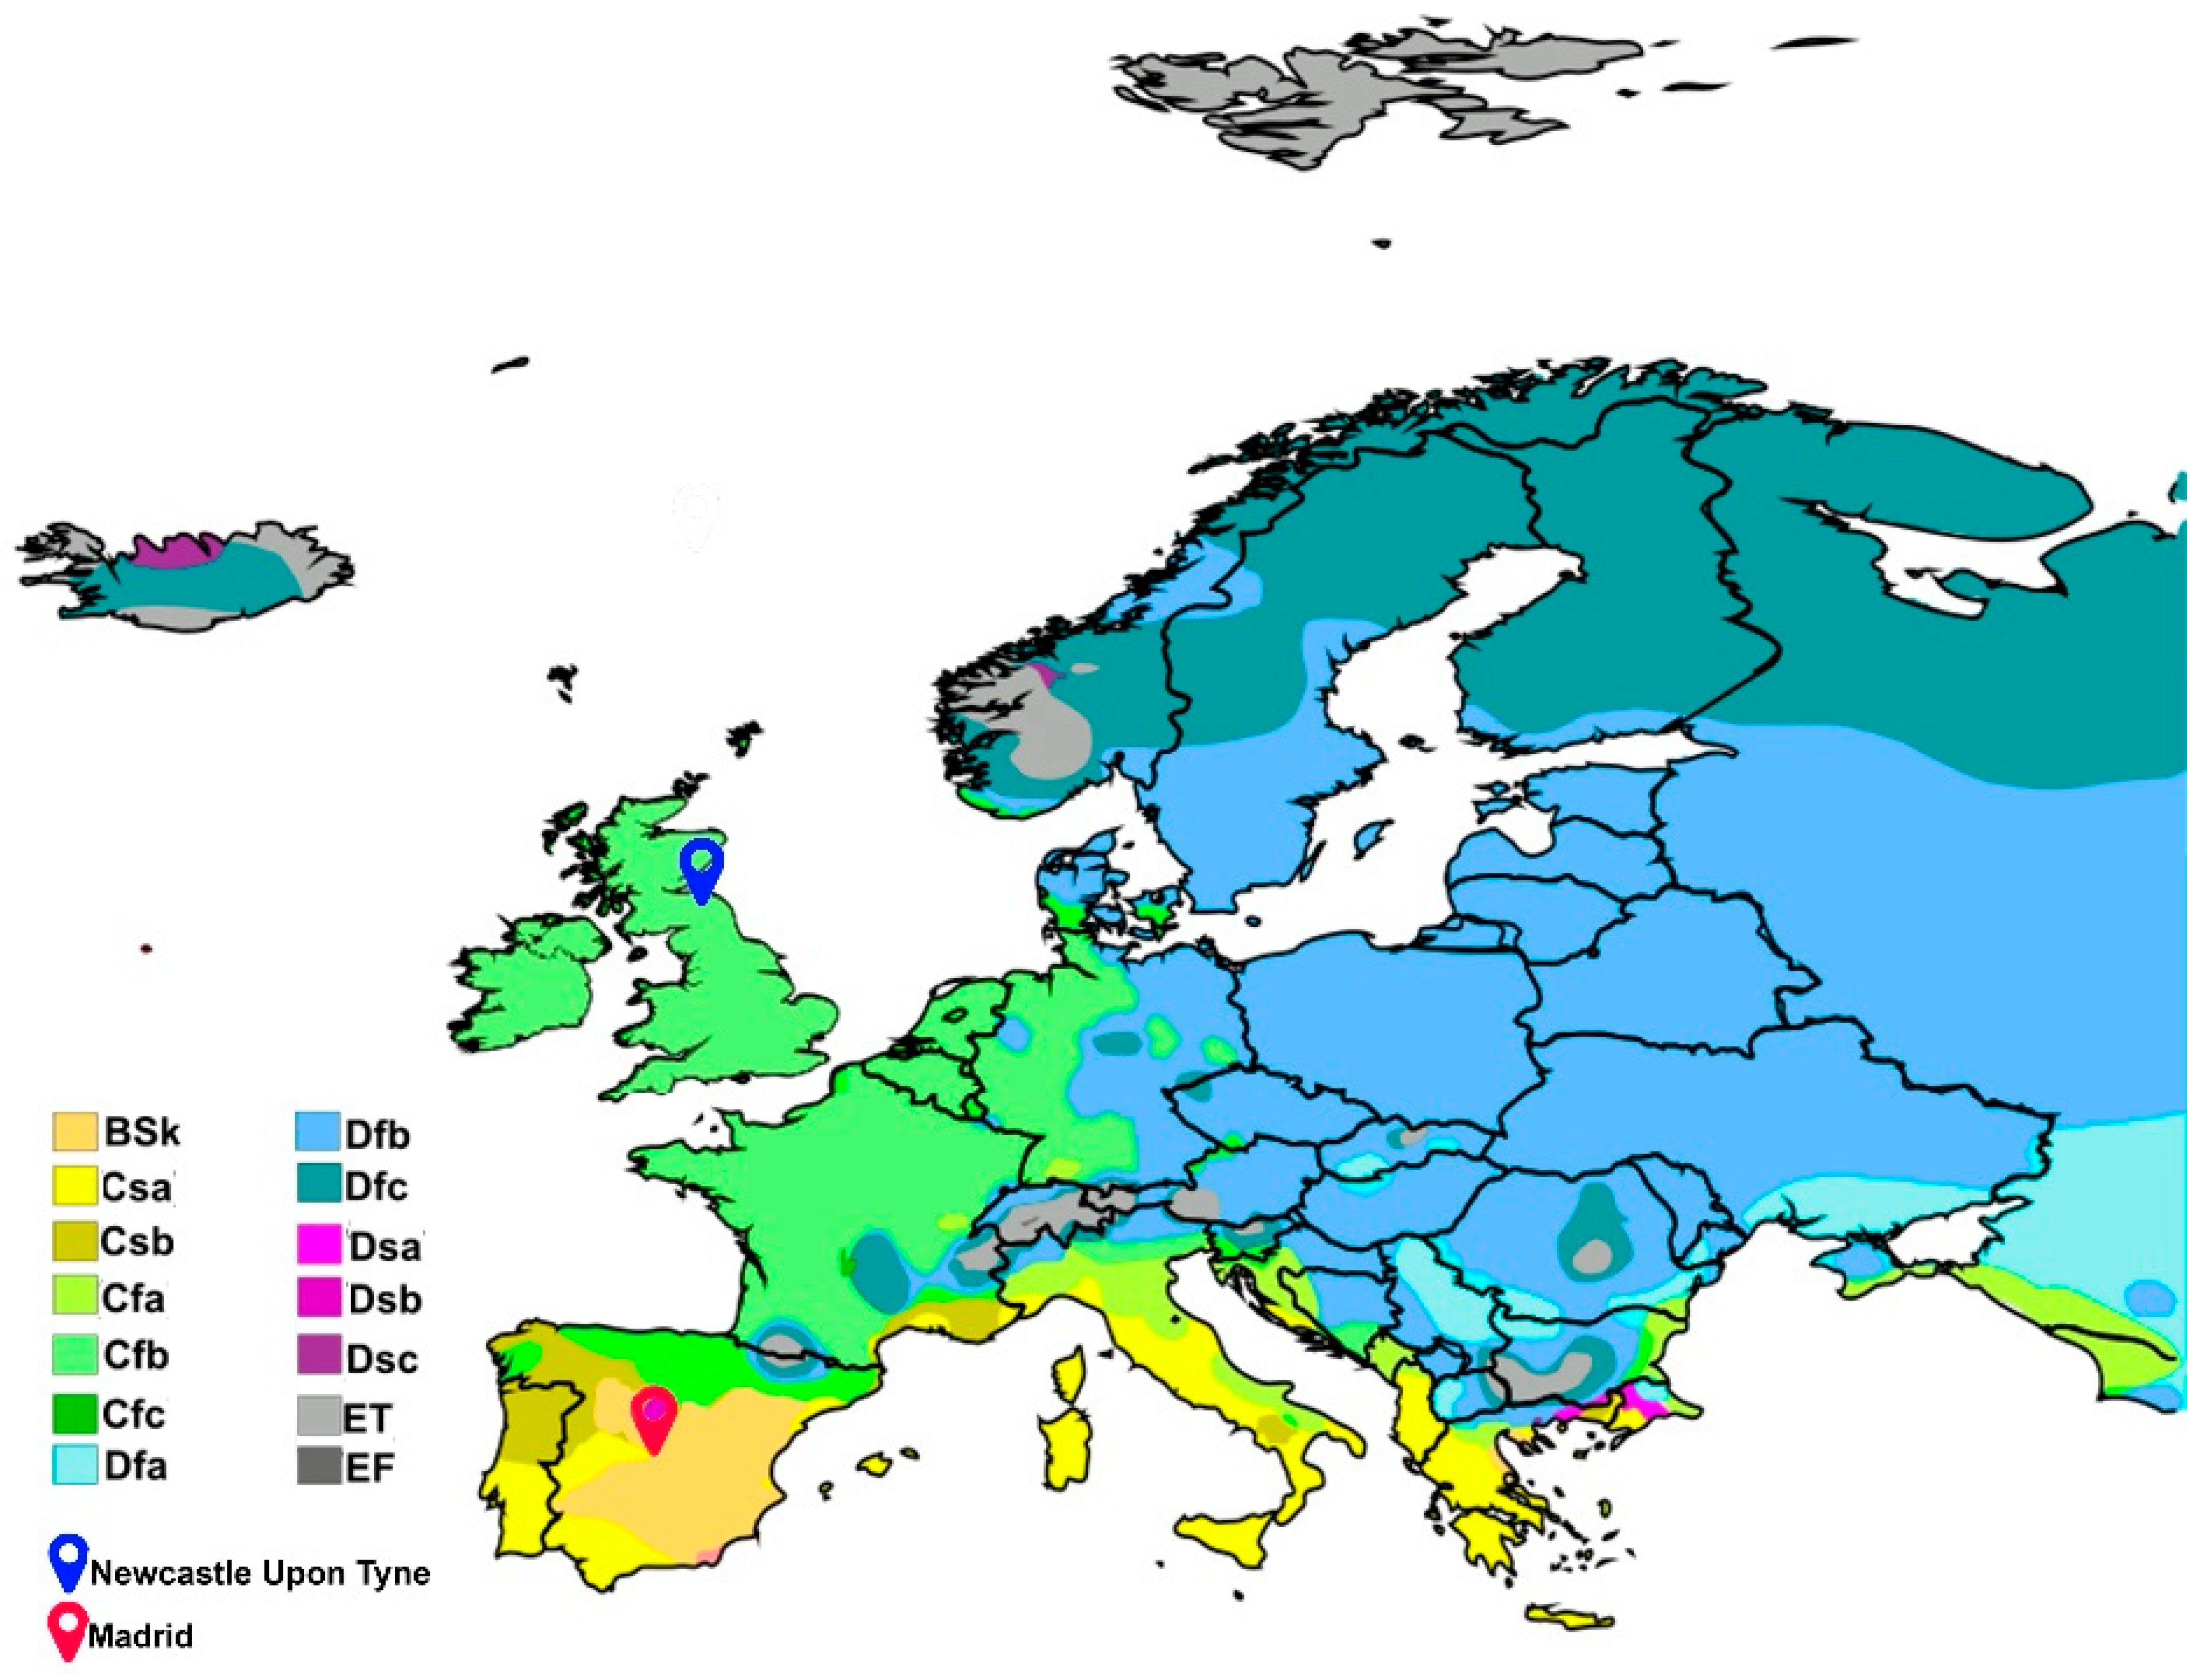
To evaluate the influence of outdoor microclimate on the thermal comfort of older people, five public spaces were selected within two different cities corresponding to different climatic zones in Europe, Madrid (continental Mediterranean climate) and Newcastle upon Tyne (humid temperate oceanic) (Figure 1). Fieldwork was performed in the months of autumn 2018 in Madrid and autumn 2019 in Newcastle upon Tyne (September, October, and November 2019).
2.1. Description of Case Studies
2.1.1. Madrid, Spain
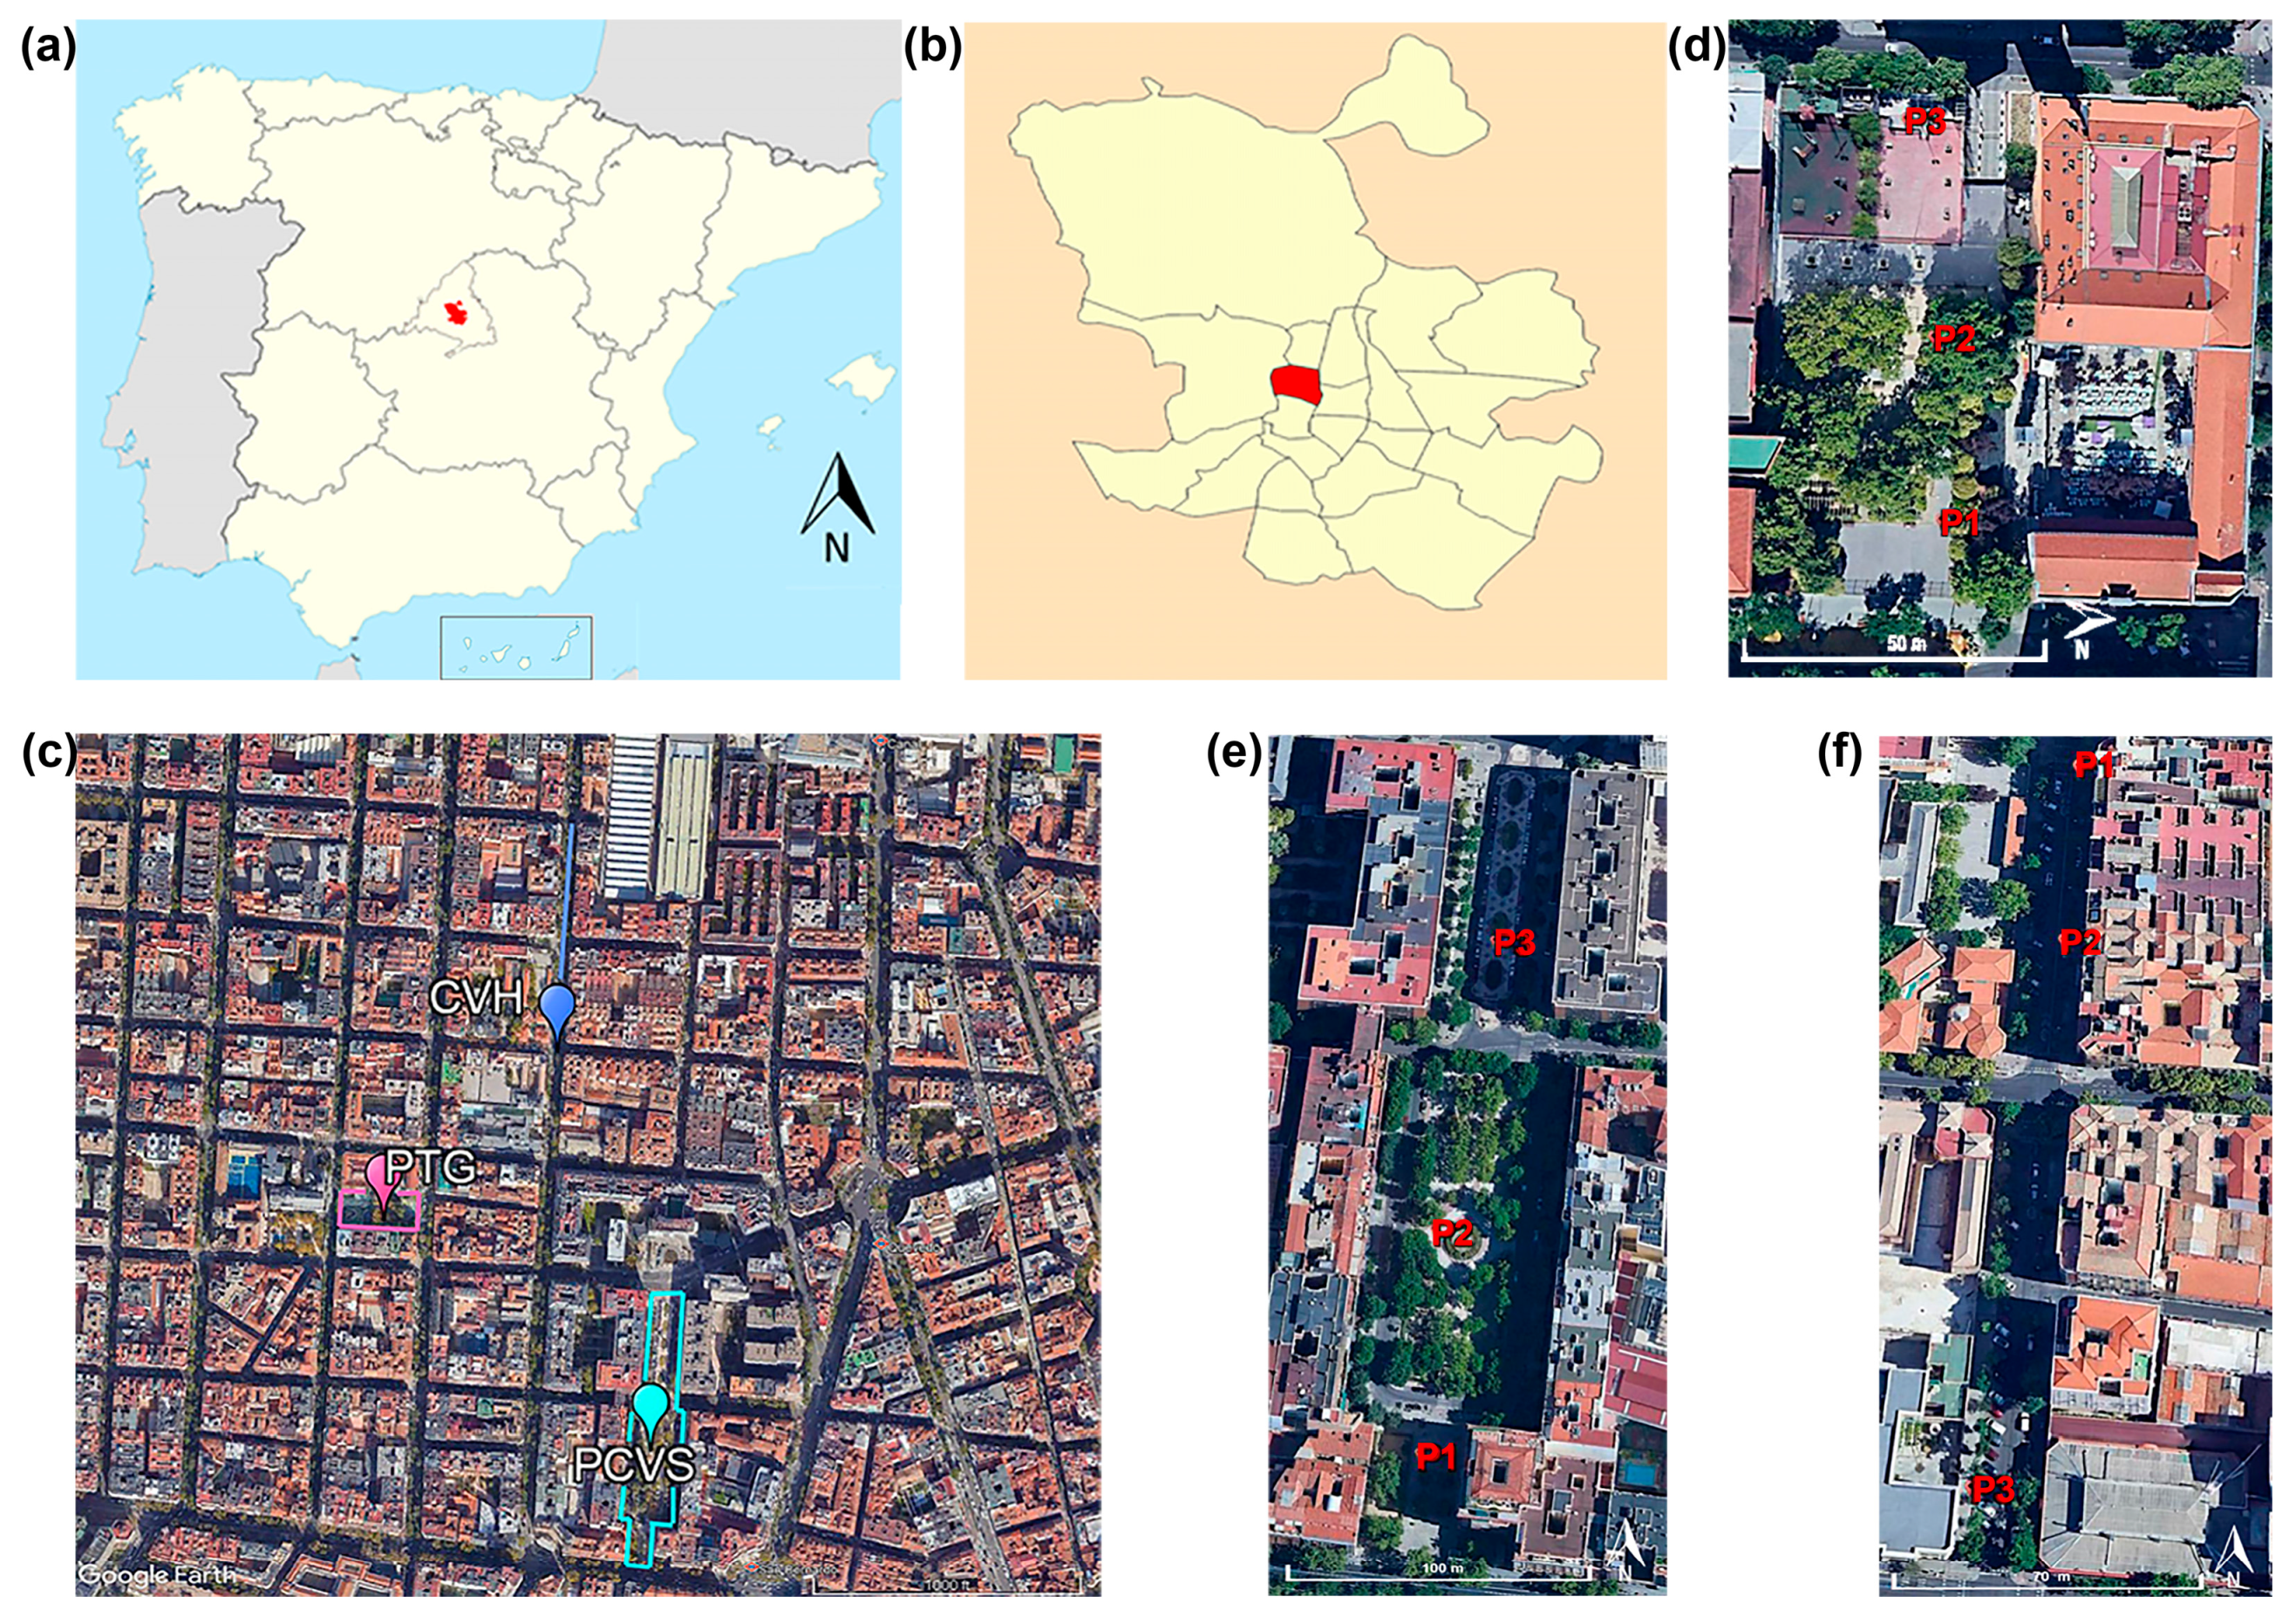
The city of Madrid is in central Spain, at latitude 40°26′ N and longitude 3°41′ W at an altitude of 667 metres above sea level (Figure 2). According to the Köppen–Geiger climate classification, its climate corresponds to ‘Csa’ Mediterranean (temperate climate with dry and hot summers). In summer, it is characterised by its low average relative humidity of 37% and an average temperature of 25–32 °C. In winter, it presents a moderate–high humidity of around 71% and average temperatures of 2–11°C. The average annual temperature is around 14.1 °C [27,28].
A park (PTG), a square (PCVS) and a street (CVH) in a high-density, mainly residential neighbourhood (Arapiles, Chamberi) were selected as case studies due to their diverse characteristics. Figure 2 shows the location of these case studies.
2.1.2. Newcastle upon Tyne, United Kingdom
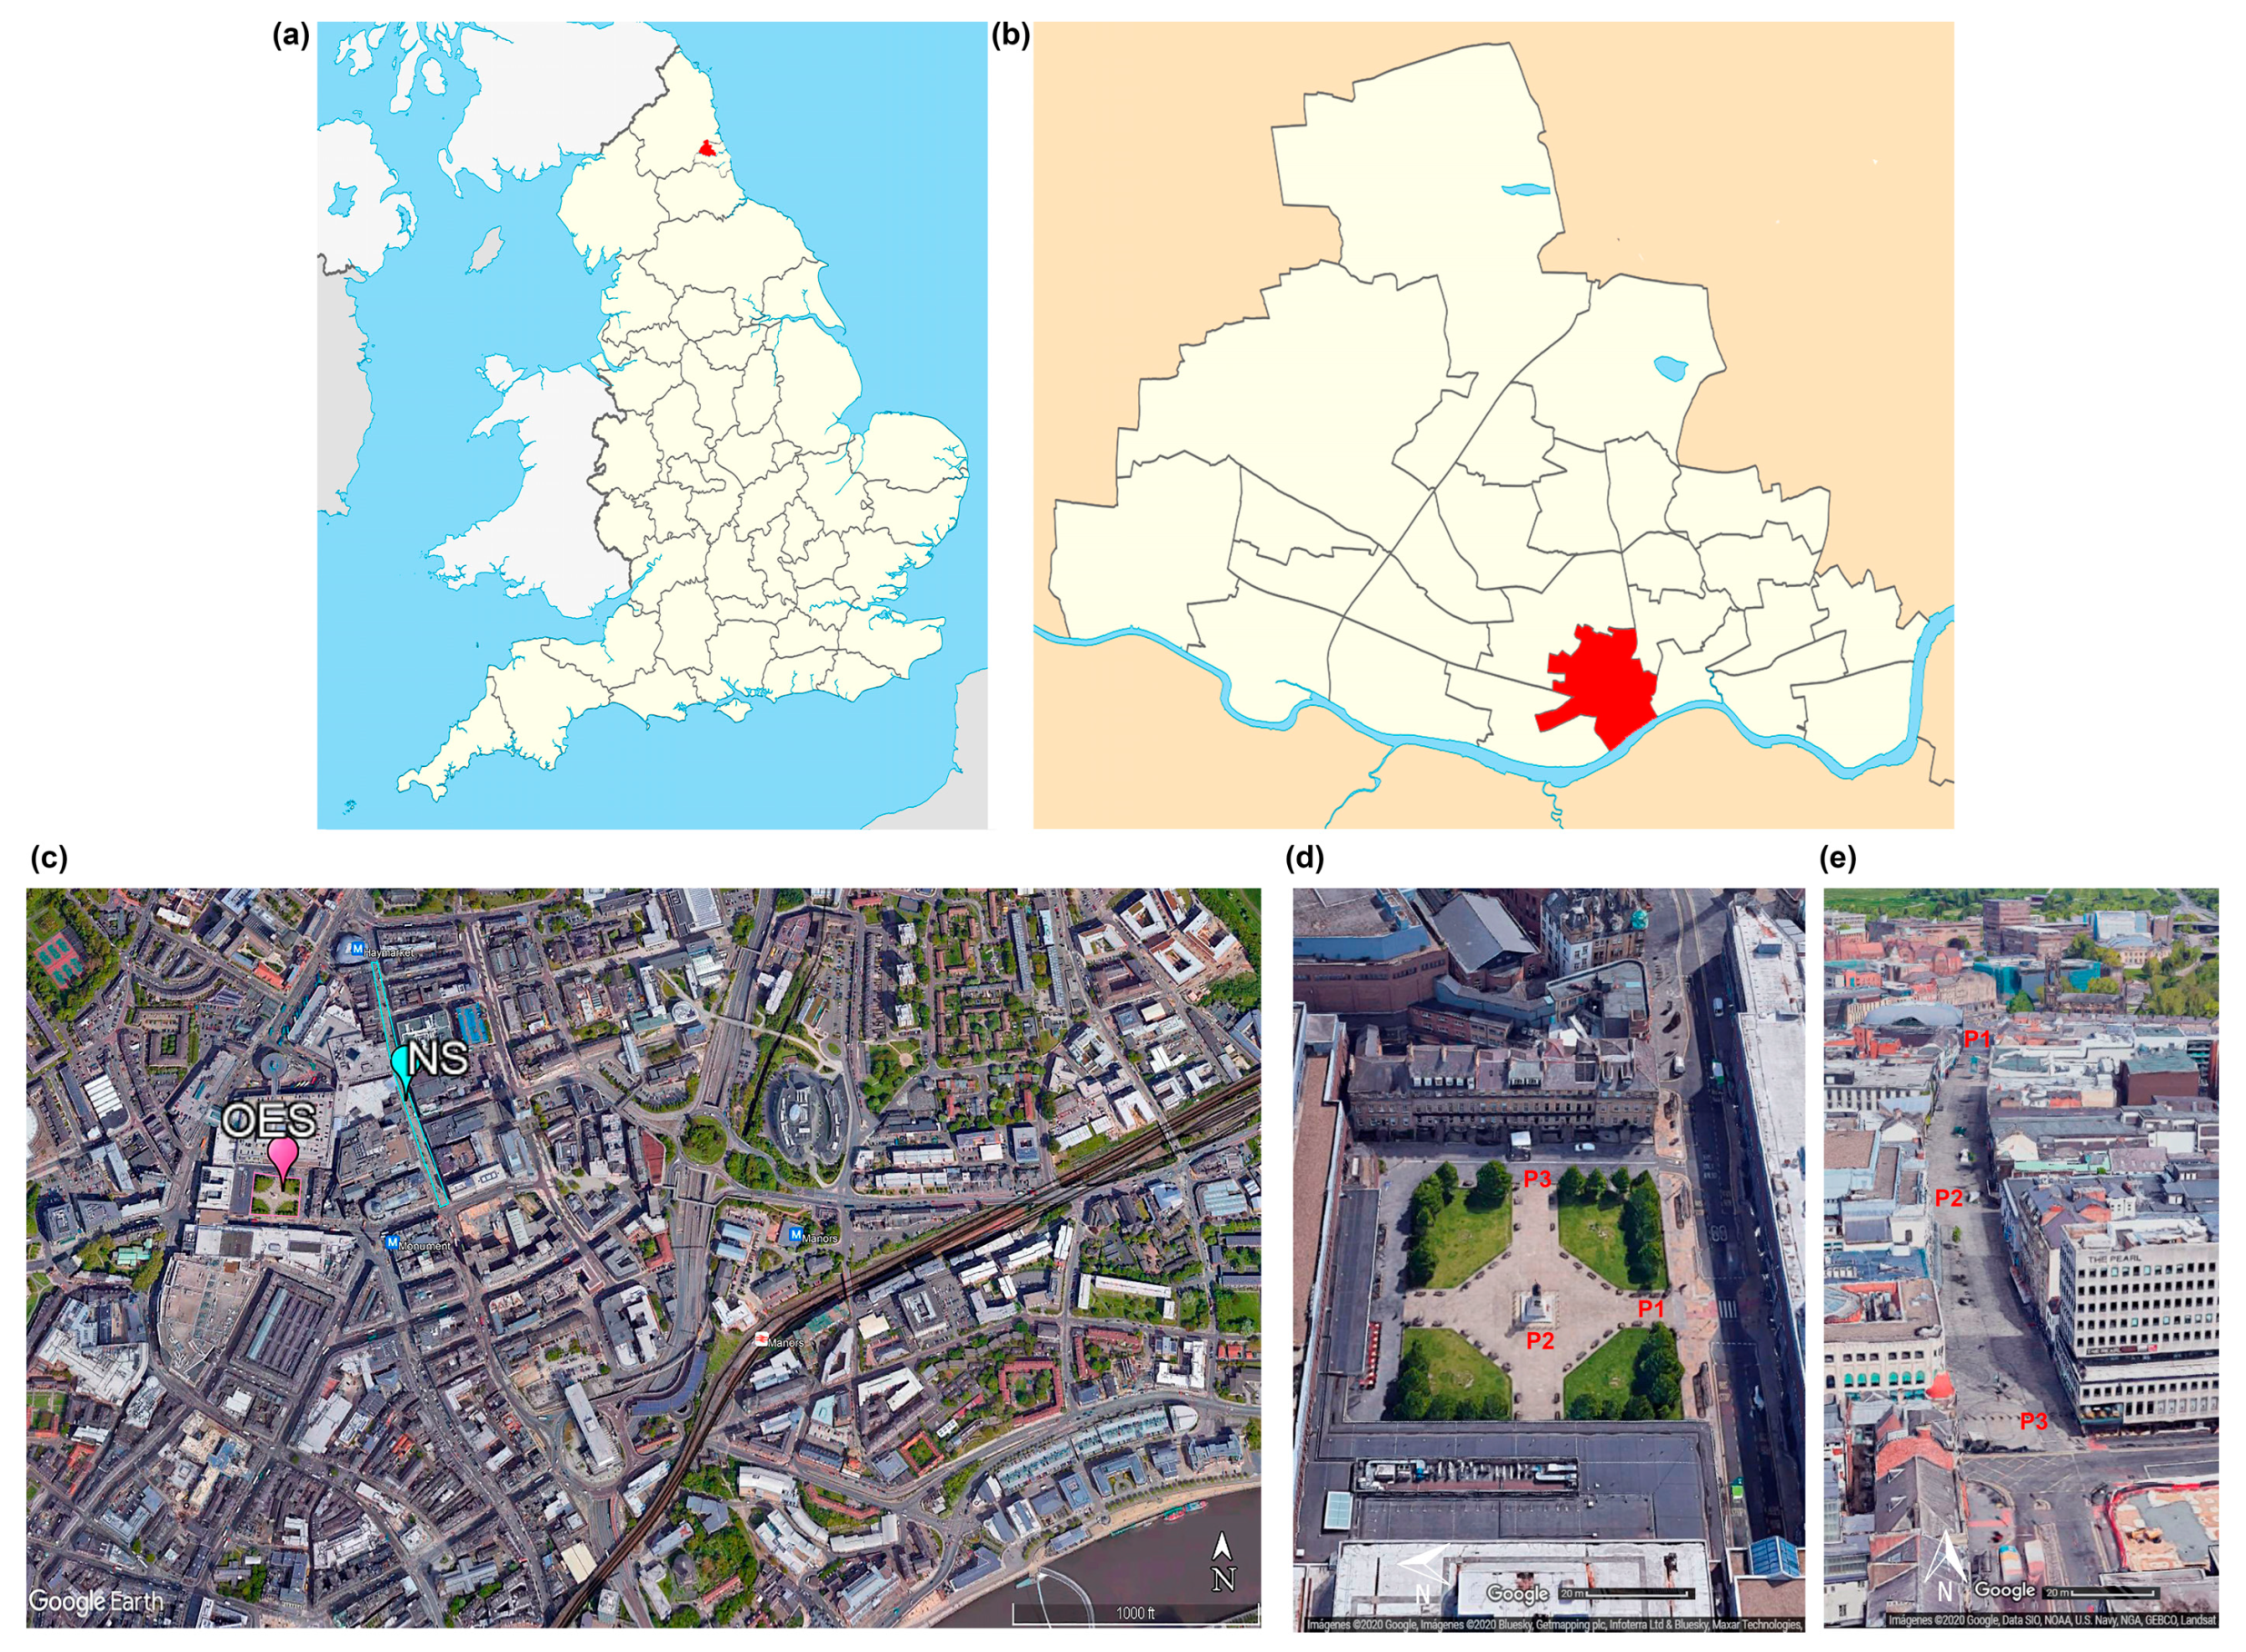
Newcastle upon Tyne is in the northeast of England, in the metropolitan borough of Tyne and Wear, situated at an altitude of 30 m above sea level, at latitude 54°58′40″ N and longitude 1°36′48″ W. Its climate corresponds to ‘Cfb’ humid temperate oceanic, characterised by cool summers, with abundant and well-distributed rainfall throughout the year (Figure 1). The mean temperature in summer is 15 °C and the mean in winter is 4 °C. The average annual temperature is 8.5 °C, with an average annual precipitation of 655 mm [29].
In the city of Newcastle, two public spaces are located in the centre of the city in an area of mainly commercial use (Westgate), a square (OES) and a pedestrian street (NS), and were taken as case studies because of observations of the concentration of older people. Figure 3 shows the location of those case studies.
2.2. Environmental Measurements
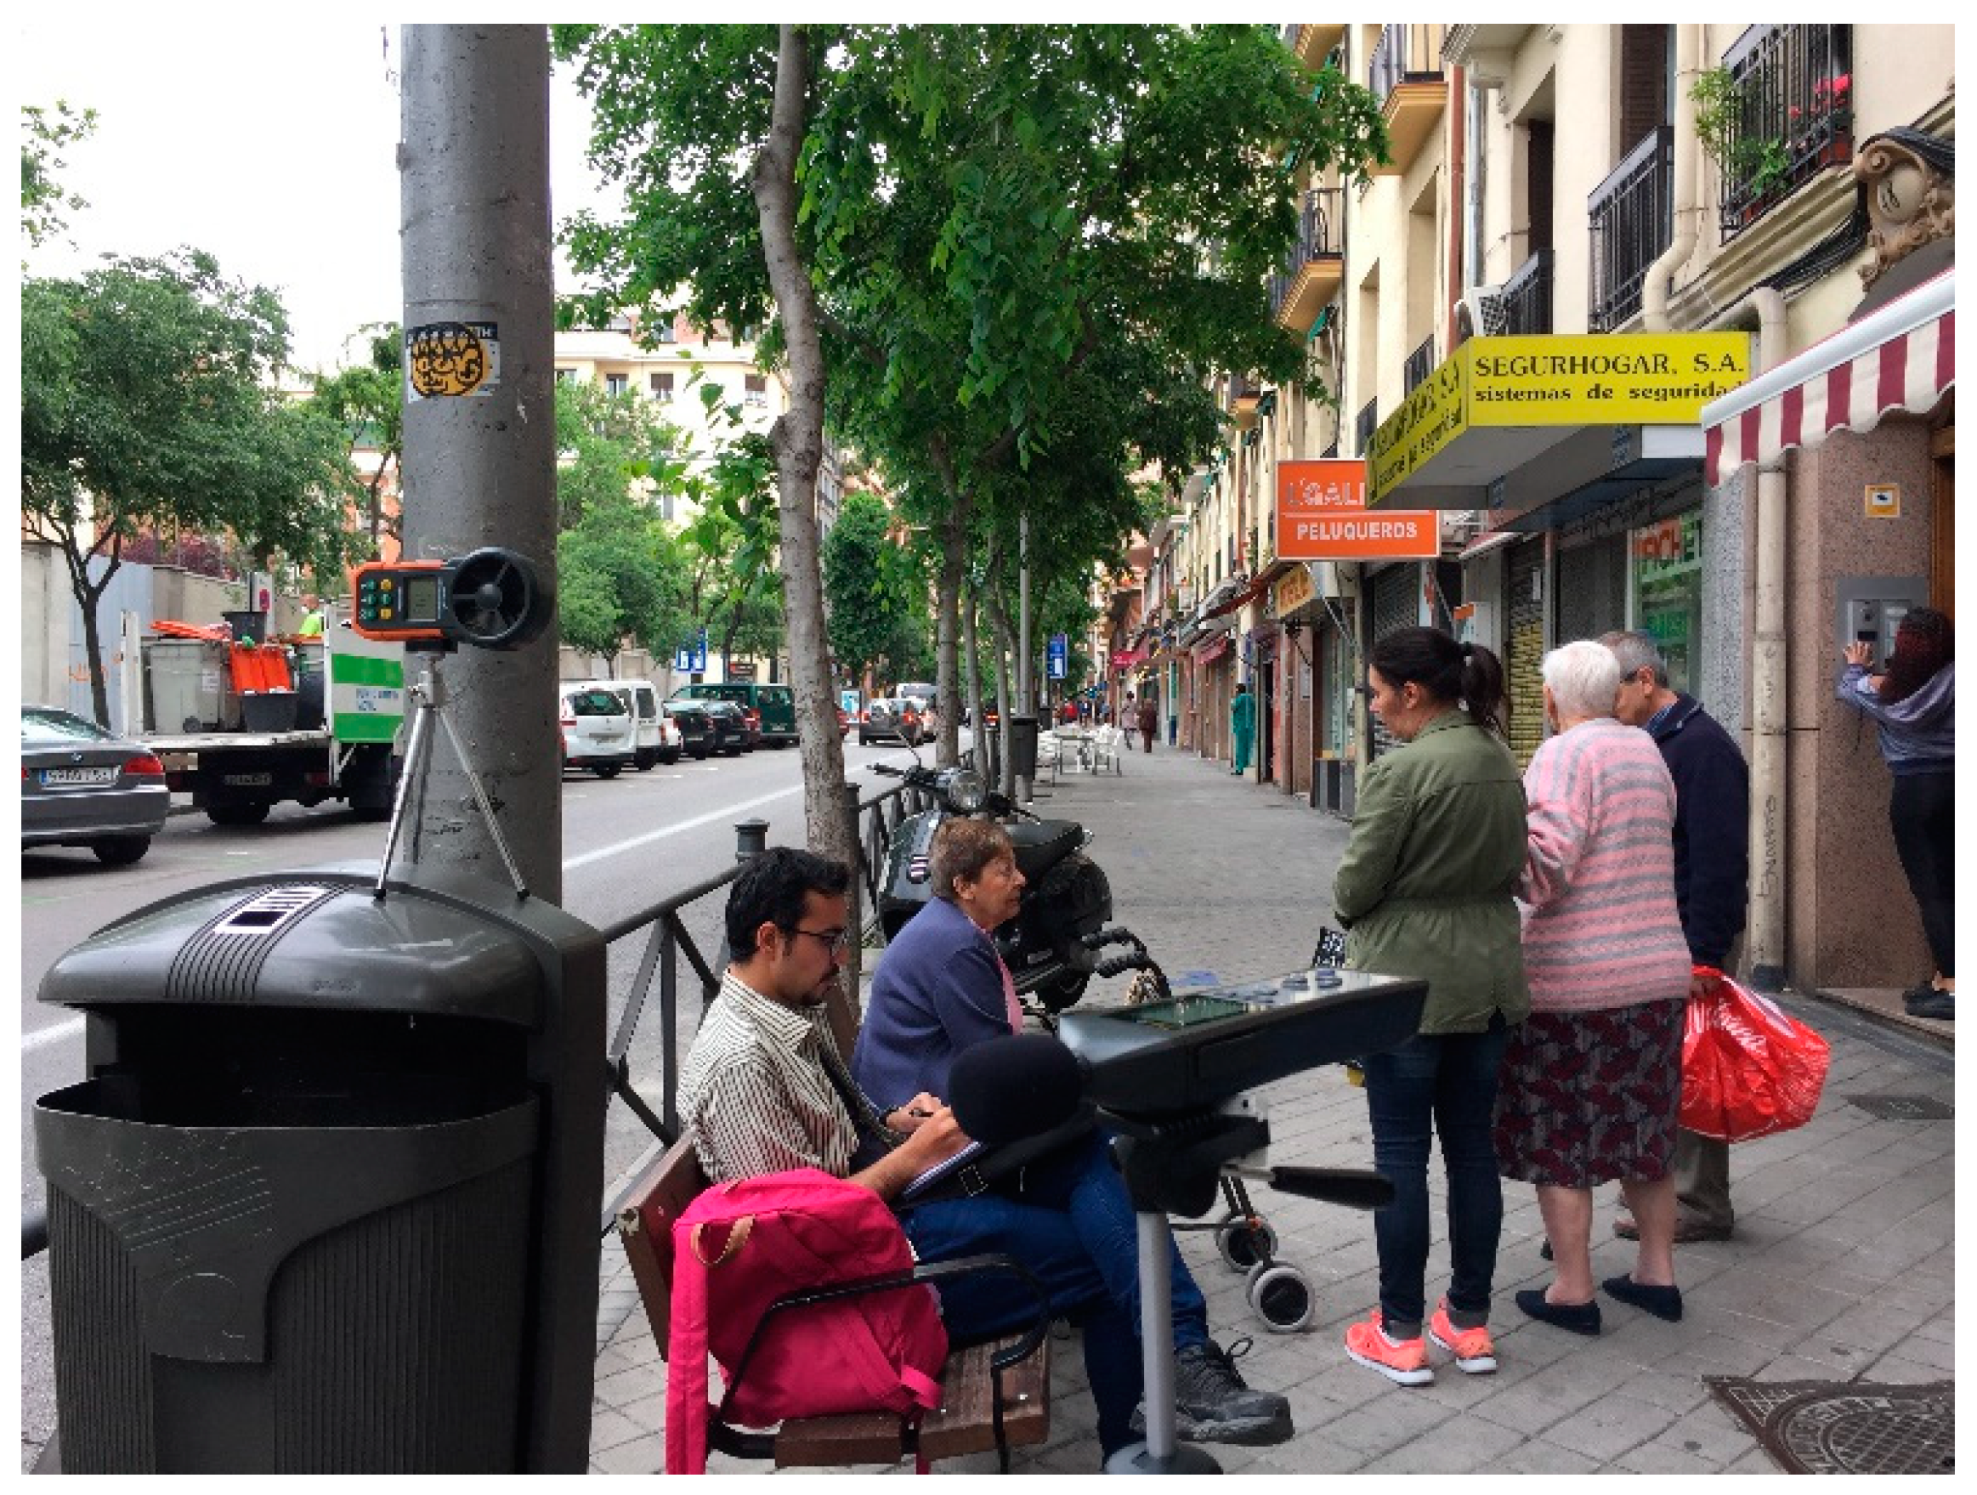
The fieldwork was conducted one day per month, between 10:00 and 18:00, the hours for the concentration of older people in those public spaces during September, October and November (2018 and 2019) on calm weather days. Three sample points were selected for environmental measurements in each public space, where equipment was located and fixed for 15 min (i.e., it remained stationary), whilst at the same time surveys were performed for people who were around those sample points. Figure 4 presents an example of the measurement process.
The environmental variables including the relative humidity (RH), air temperature (Ta), wind speed (Ws) and sky view factor (SVF) were measured at 15-min intervals at each point at 1.1 m above floor level corresponding to the centre of gravity of the human body as recommended in ISO 7726 [30]. Characterisation of the measurement equipment can be found in Table 1.
The mean radiant temperature (Trm) that represents the combination of air temperature and short- and long-wave radiation fluxes has been calculated using Rayman 1.2 software, in which environmental variables measured in situ, such as the air temperature, relative humidity and wind speed, in addition to the geographic data of the site, date and time, are entered. This method has been used by several authors [31,32,33]. Similarly, for the sky-view factor (SVF) fisheye lens (180°) pictures were taken during each measurement with a Sigma 8 mm circular lens in the north direction and then calculated in Rayman 1.2 software [31,33,34].
2.3. Thermal Perception Assessment and Sample Selection
The sample was selected using simple random methods. Simultaneously with the urban environmental measurements, older people (who visually appeared to be older than 65 years of age) present (people who passed by and people who stayed) at each measured point in the assessed public spaces were asked about their willingness to answer the survey, which consisted of a two-part questionnaire.
The first part was related to personal demographics and behavioural characteristics (age, sex, level of clothing insulation, time and frequency of the visit). The second part was focused on their thermal perception through a seven-point scale of (−3. cold; −2. cool; −1. slightly cold; 0. neutral; 1. slightly warm; 2. warm; 3. hot) for thermal sensation (TSV) assessment [35] and the McIntyre three-point scale (1. warmer; 2. would not change; 3. colder) [36] for thermal preference (TP) assessment. For humidity and wind perception, a four-point scale was used (1. Very pleasant—4. Very unpleasant) [37].
2.4. Thermal Comfort Indices
Whilst the UTCI index was computed using the official program version 0. 002 [20], the PET index was derived using Rayman. The features of a ‘typical adult’, as used in most research, were used in the PET standard calculation (a man, 35 years old, weight 75 kg, 1.75 m tall, 0.9 clo and 80 W). In this study, the data on the average older person in the UK and in Spain has included separating men from women, as well as the appropriate degree of activity (W) and clothing (clo) corresponding to each interviewed person.
2.5. Statistical Analysis
All the collected data were processed in IBM SPSS statistics software and analysed with a significance of 5%. As the decision of which statistical test to use depends on the distribution of the data and the type of variable, a prior normality test (Kolmogoroy–Smirnov) was applied, if data were normally distributed, a parametric test such as a Pearson correlation was performed, otherwise, non-parametric tests were employed (Mann–Whitney, Kruskal–Wallis, Spearman correlation, chi-squared). The thermal sensation and thermal preference (qualitative/ordinal) were considered dependent variables for this study, whilst environmental, personal and others were independent. Additionally, linear regression was applied between thermal-sensation vote and air temperature to identify the neutral temperature at which more older people felt comfortable.
3. Results and Discussion
3.1. Outdoor Environmental Conditions
Outdoor microclimatic conditions varied across both climates. Table 2 presents the environmental measurement data from autumn 2018 in Madrid and autumn 2019 in Newcastle. As regards the average air temperature, there is a difference of 4.8 °C, with Newcastle being colder. However, Madrid presented lower minimum and higher maximum temperatures, with a greater daily thermal amplitude, and the average radiant temperature was higher in Madrid, whilst relative humidity and wind speed were higher in Newcastle.
3.2. Sample Description
The sample size in both cases was similar, seventy people in Madrid and seventy-three in Newcastle upon Tyne.
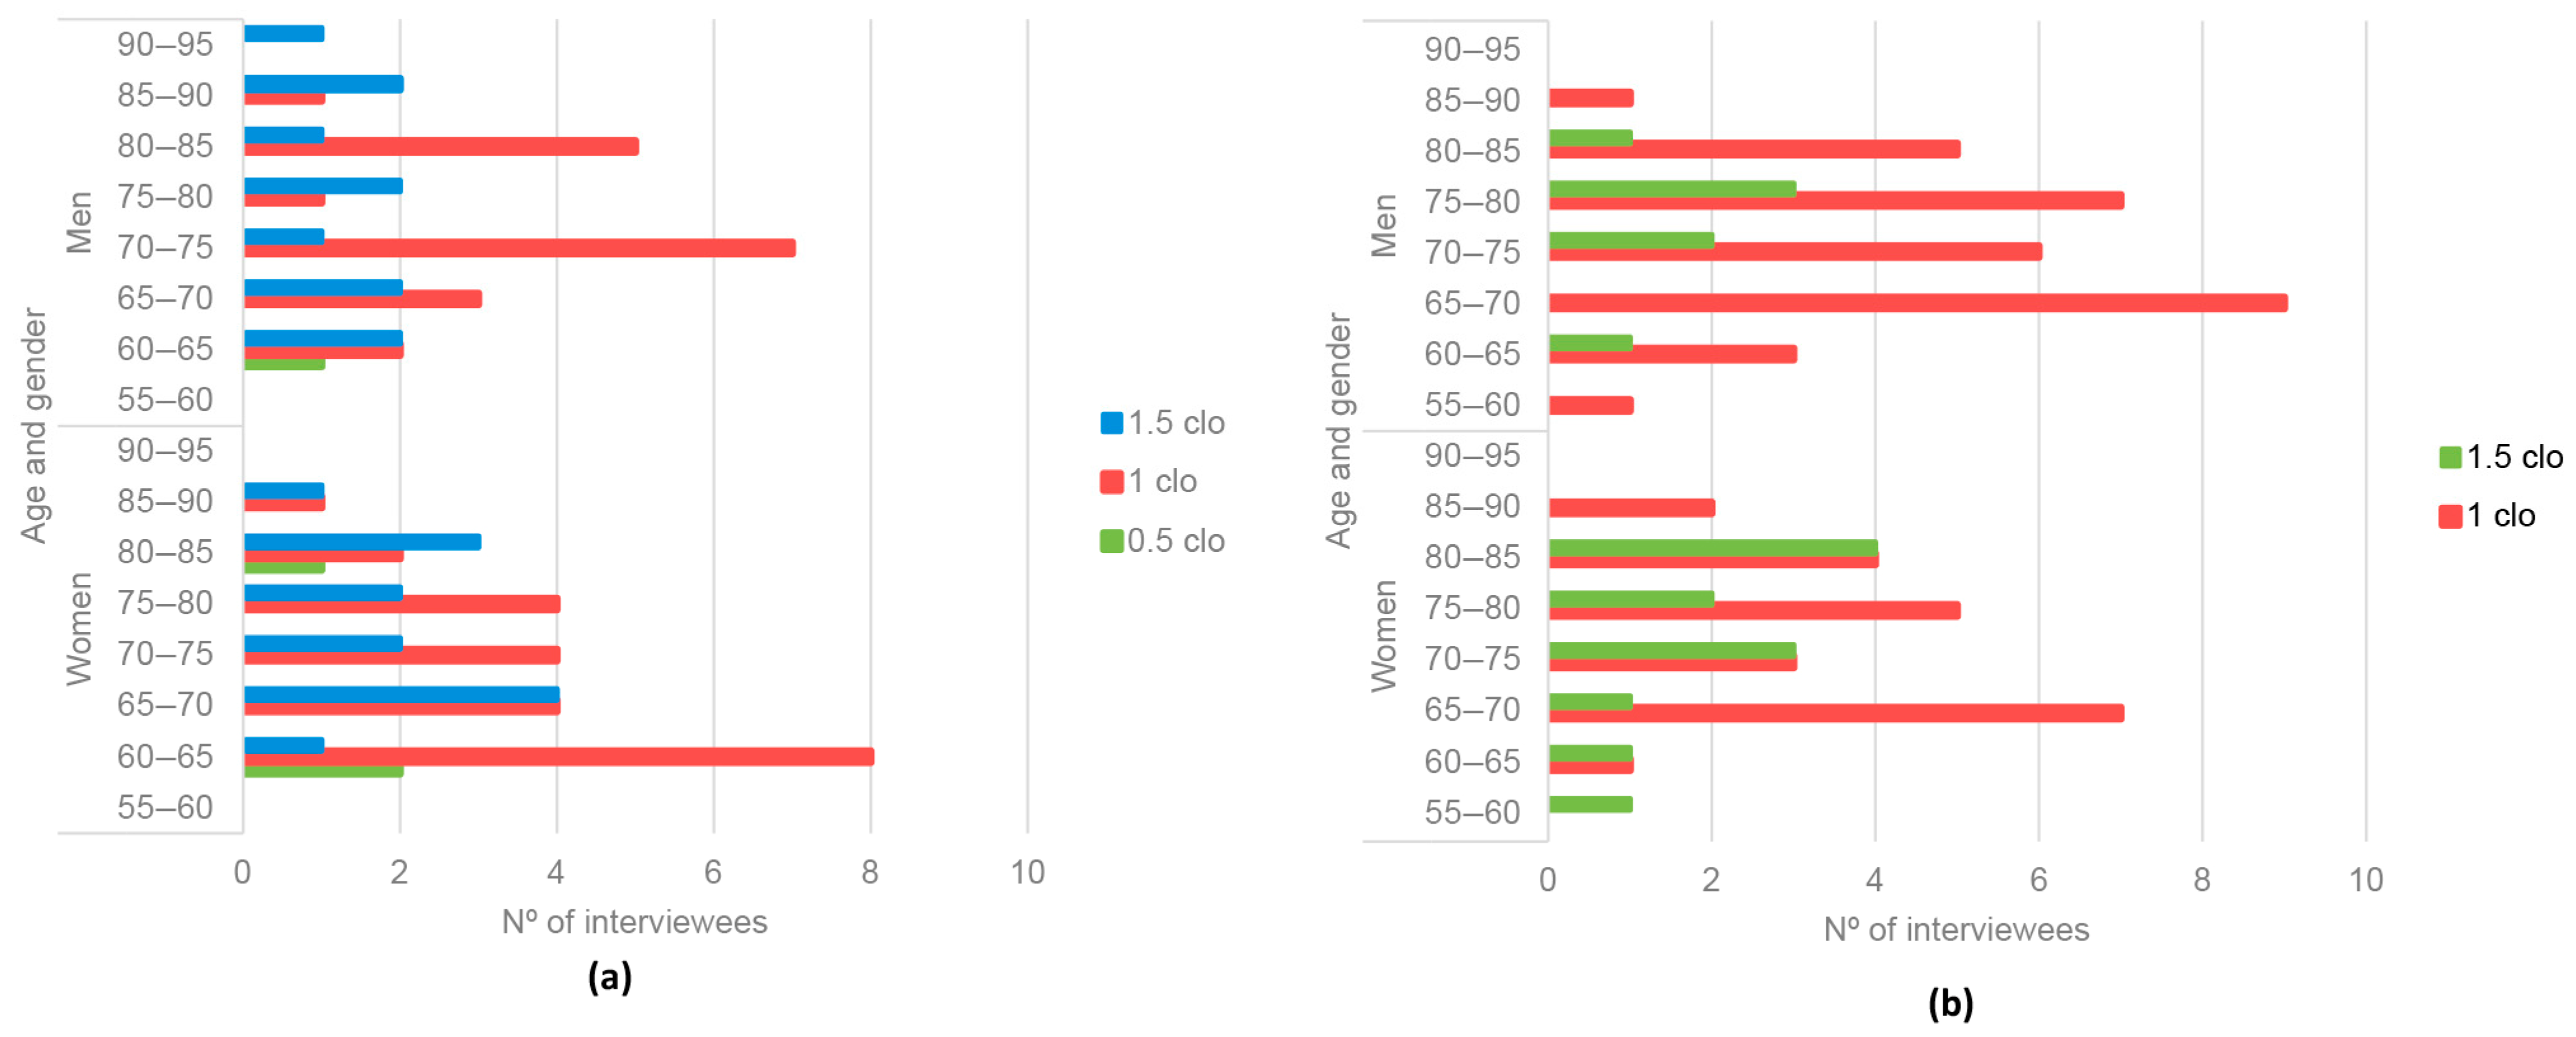
In Madrid, 56% were women. Regarding the level of clothing insulation (clo), 60% corresponds to 1 clo and 34.3% to 1.5 clo, as this is considered normal for autumn (about 1 clo) [10]. The rest (5.7%) had worn around 0.5 clo, whilst in Newcastle, 47% were women, and 74% of the interviewees wore around 1 clo of clothing insulation.
No statistical relationship was found between gender or age and the level of clothing (p > 0.05) using the Kruskal–Wallis test. However, the older they were, the higher the level of clothing they wore, especially in the case of Madrid, with men wearing the most clothing. Figure 5 presents the sample distribution regarding gender, age and city.
3.3. Thermal Sensation of Older Adults in Outdoor Public Spaces
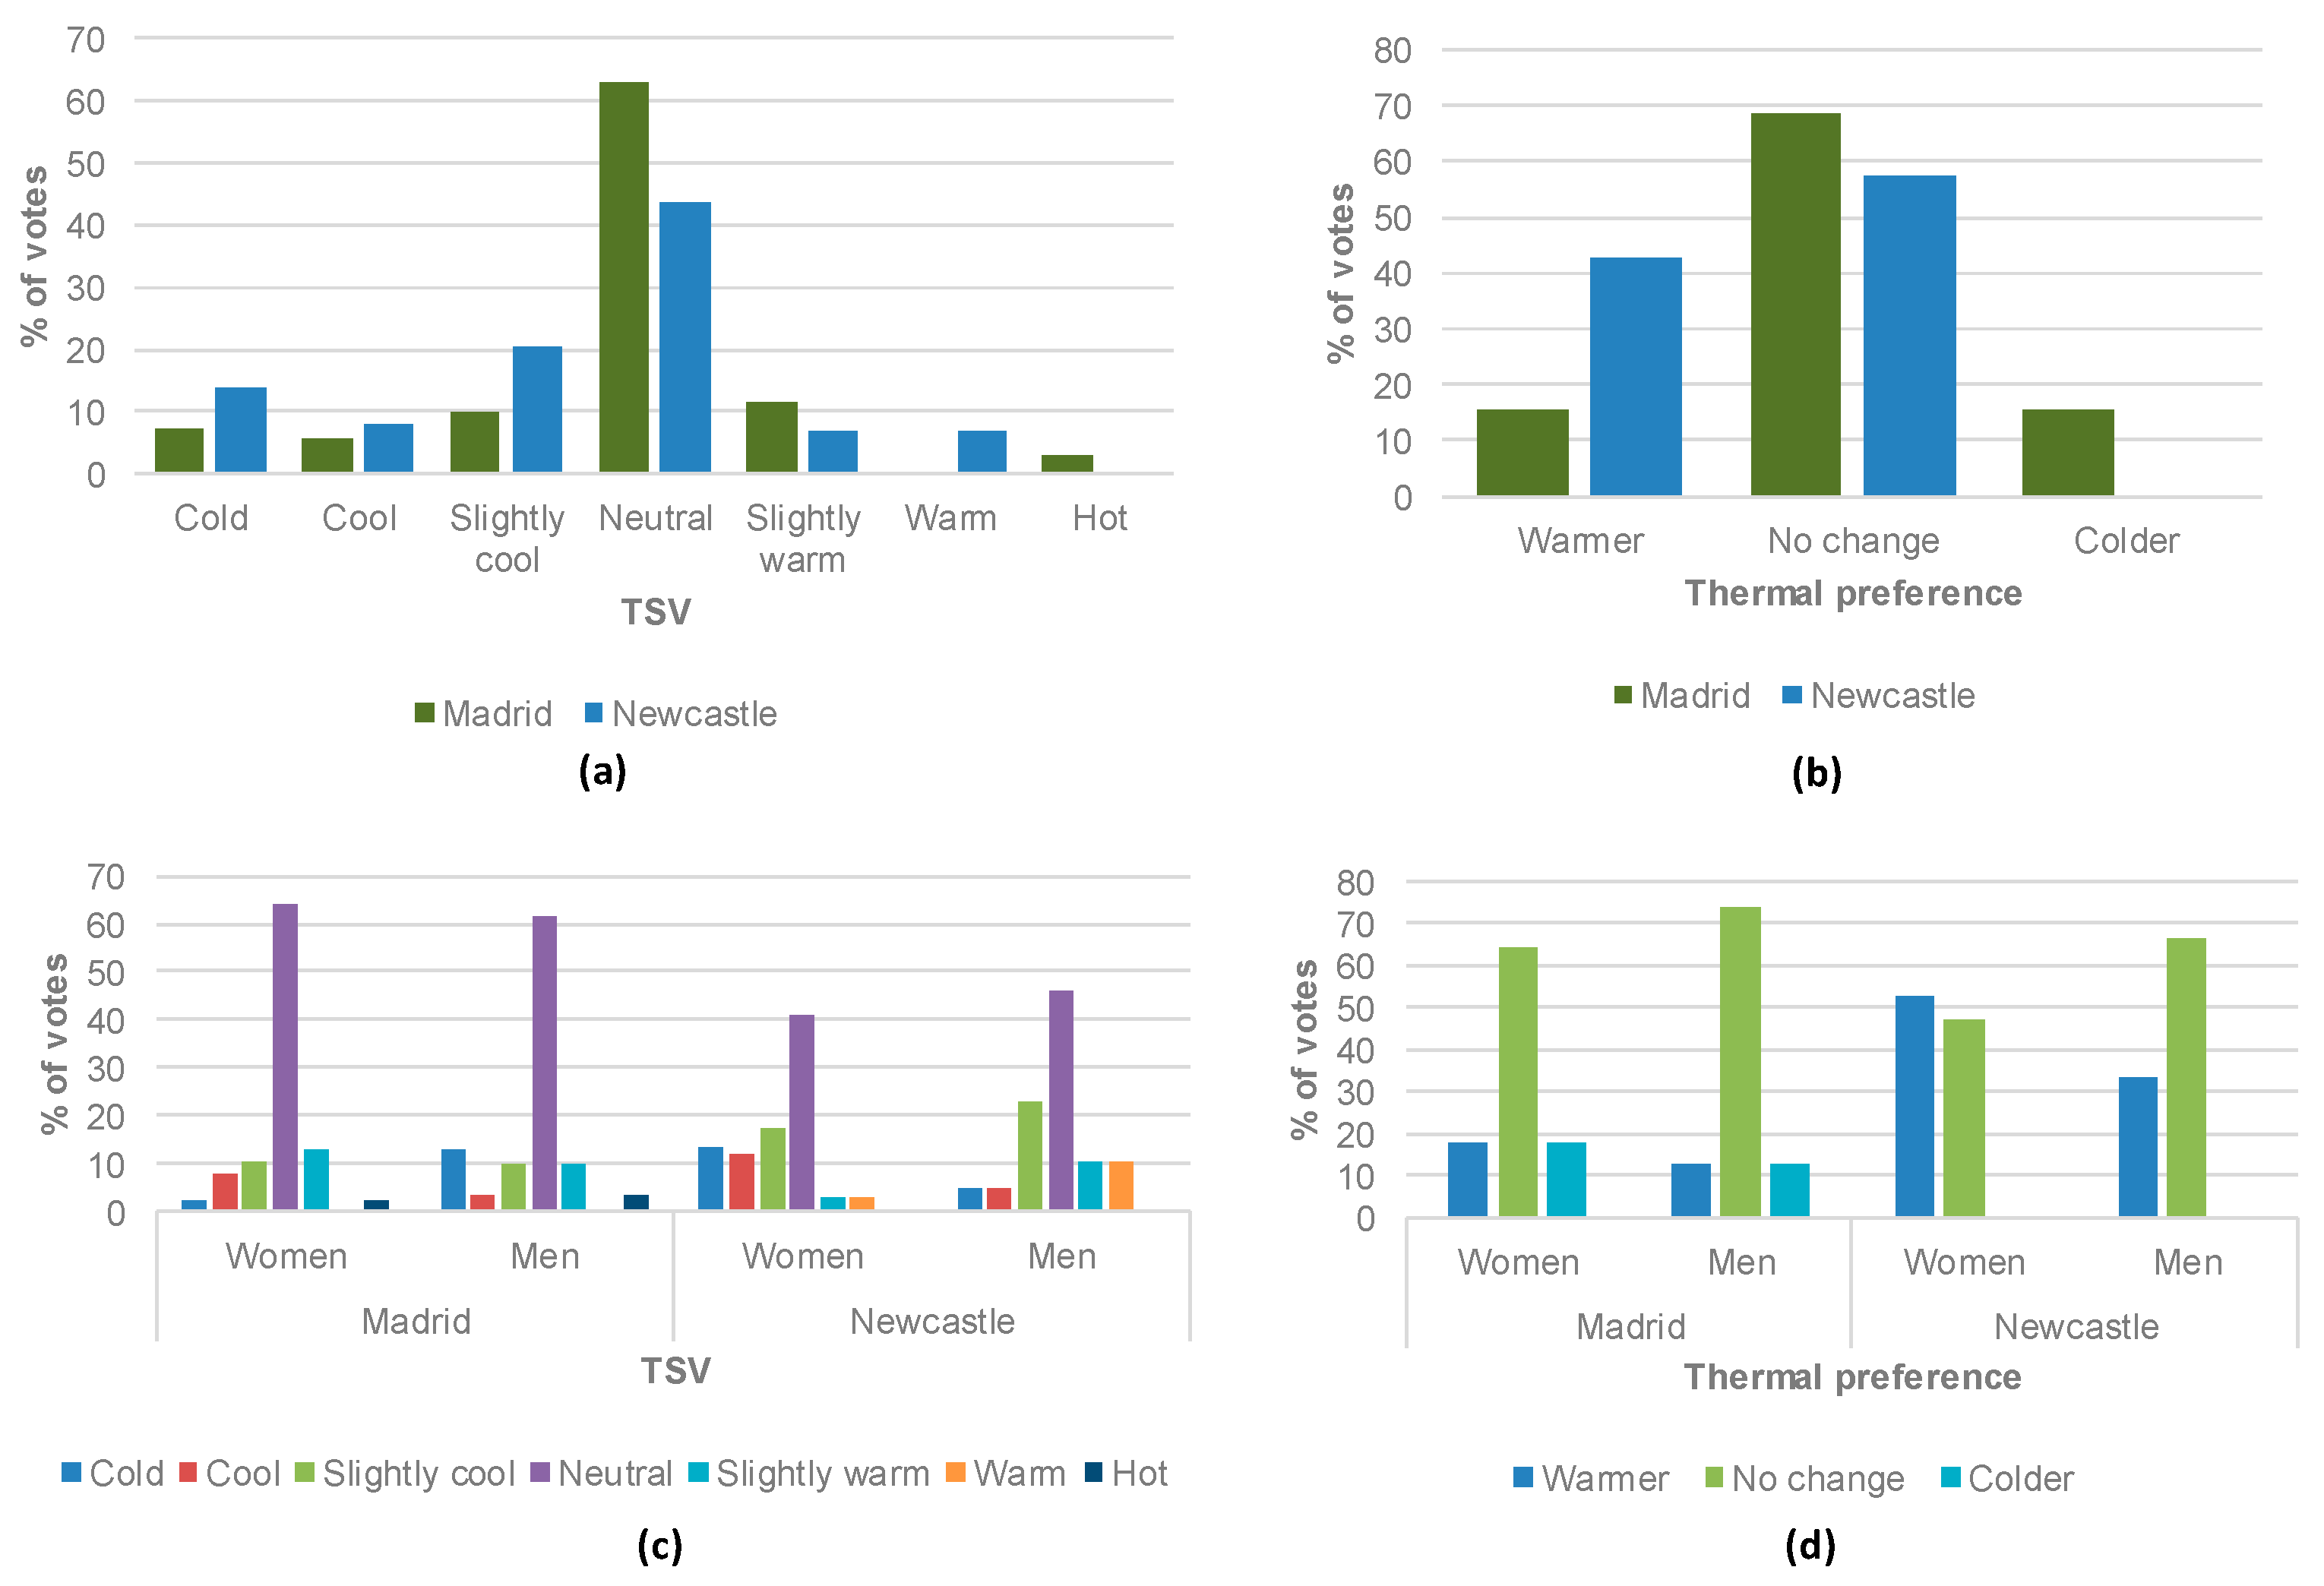
The thermal sensation of the people is a result of the extrinsic conditions of the place in addition to the subjective ones of the people. In this case, in Madrid, 63% of older people stated to have a ‘neutral’ thermal sensation, whilst 14.3% of the interviewees perceived it between ‘slightly hot and hot’, 22.8% between ‘slightly cold and cold’. About 69% selected ‘no change’ as the thermal preference.
Regarding the humidity, 87% of the interviewees perceived this, whilst the perception of the wind speed was between ‘pleasant’ and ‘very pleasant’ for 83% of them.
In Newcastle, just 32% of older people had a ‘neutral’ thermal sensation whilst 31% of the interviewees perceived it as between ‘slightly cool and cold’ and just 10% between ‘slightly hot and hot’.
Regarding preference, 42% preferred ‘no change’ and 31% would like it to be ‘warmer’.
The humidity was perceived as between ‘pleasant’ and ‘very pleasant’ for 57% of older people, whilst the wind speed was pleasant for 53% of them.
A chi-squared test was performed to identify the association between gender, thermal comfort and thermal preference for both cities, and results showed that there was no statistical relation. Figure 6 shows that thermal comfort votes were similar between both genders, even though in the case of Madrid a greater percentage of men felt colder, whilst in Newcastle men felt warmer than women. In the case of thermal preference, in both cities women were more dissatisfied with the thermal environment. In the case of Madrid, more women would have liked to be warmer and the same amount colder, whilst in Newcastle more women would have liked it to be warmer. These findings are in line with some studies that have found statistical differences between thermal comfort for men and women, where men were more satisfied with the thermal environment and women were more sensitive, especially in cooler conditions [38,39,40].
3.4. Influence of the Microclimate on Thermal Perception
To identify statistical differences between the two case studies, the t-Student test for environmental variables, the Kruskal–Wallis test for the level of clothing (clo), age and visit time, and the chi-squared test for gender and thermal comfort (TSV = 0), were applied. A summary of these tests is presented in Table 3. Significant differences between all the environmental variables were measured except for the sky view factor. Additionally, there is a distinction between activity, time and frequency of visits. Regarding thermal perception and thermal sensation, those varied among both cities, but the thermal preference and thermal acceptability did not differ.
Although clothing insulation was not statistically different between both cities, it was higher in Madrid, and this could be attributed to the behavioural and adaptative cultural differences between both cities [25].
Additionally, the Pearson’s correlation test was performed to identify the main environmental variables that influence thermal comfort for both cities (Table 4). In the case of Madrid, all the environmental variables were correlated to thermal comfort (p ≤ 0.00) less than the SVF. Whist in the case of Newcastle, just the wind speed (≤0.01) was related to thermal comfort, similar to other study findings [40]. Madrid presented a higher percentage of people in comfort (Figure 6) and the perception of ventilation was also more pleasant there.
Older people there might be better adapted to the microclimatic conditions of their place of residence. Furthermore, in dense cities with heavy traffic and uneven distribution of green areas, there are differences in the microclimate between the public spaces that are worth considering (Table 2), with temperature differences of 3.4 °C, 11.7% in relative humidity and 0.4 m/s in wind conditions among the public spaces in Madrid. On the other hand, we found differences of 2.6 °C in temperature, 6.1% in relative humidity and 0.3 m/s in wind among the public spaces in Newcastle. This confirms the existence of differentiated microclimates in the city [9] which influence the thermal comfort for older people.
3.5. Neutral Temperature and Comfort Zone
Linear regressions to represent older people’s mean thermal sensation (MTSV) as a function of the mean air temperature (Ta) were obtained to identify the ‘neutral temperature’ (Tn) (MTSV = 0) and thermal sensitivity. The two regression equations passed the goodness-of-fit (R2 > 0.5). Both variables were different among both cities; in Madrid, the neutral temperature was 20.4 °C, whilst in Newcastle it was 17 °C; a difference of 3.4 °C between both climates. Figure 7 presents these equations for both climates. The slopes represent thermal sensitivity to temperature changes; it was found to be higher in Newcastle. This could be understood, as older people in Madrid were found to be more tolerant than in Newcastle and this could be attributed to their adaptative behaviour, thus people in Madrid wore higher levels of clothing insulation [25].
There are no outdoor thermal comfort studies for older people in Madrid and Newcastle to compare our results. As a reference from the literature review, this range would be between 23.9–28.1 °C for the average adult’s outdoor thermal comfort in Madrid (Csa climate). Whilst no thermal comfort zone was found in previous studies for Newcastle or similar climates [41], as a reference, we considered Nikolopoulou and Lykoudis [42], who assessed outdoor thermal comfort for different climatic zones in Europe for the average adult. They found a great variation of 10°C for neutral temperature across Europe. In Cambridge and Sheffield (Cfb climate), it was found that neutral temperatures in autumn were 23.2 °C and 16.7 °C, respectively. The one found in Newcastle was similar to Sheffield’s, whilst in Athens (Csa climate) it was 19.4 °C, one degree lower compared to our findings for Madrid.
The thermal comfort zone is defined by ASHRAE as the range of air temperature where at least 80% of the space occupants are satisfied with the thermal environment. Some authors suggest that comfort zones should be considered within the TSV interval of −1 and +1 [34,43,44,45,46,47,48]. By applying these values to the linear regression equations (Figure 7), the thermal comfort zone for Madrid in autumn would be between 9.8–31.1 °C, whilst in Newcastle it would be between 12.9–21 °C.
The thermal comfort zone range was wider in Madrid. This could be explained because the thermal amplitude was greater during the experimental campaign in this city in autumn, with temperatures ranging from 8–31 °C. It would be necessary for people to adapt to these sudden changes in a few hours, which is even worse for the older population where adaptation is slower due to their metabolism and other physiological changes [5]. It is necessary to consider the differences between older adults in the perception of both cold and heat events during the autumn season that are becoming more usual with climate change [2], where it is necessary to know the comfort zone of these groups that are more vulnerable to both thermal extremes.
3.6. Thermal Comfort Indices (Physiological Equivalent Temperature) PET and Universal Thermal Index (UTC) vs. Thermal Sensation (TSV)
According to the PET index, it was found that in Madrid, 32.9% of older people would be in thermal comfort and 21.4% would be in ‘lightly warm, light heat stress’, whilst in Newcastle, only 13.70% would be in thermal comfort and 86.3% would be between ‘light cold stress’ (34.25%), ‘moderate cold stress’ (31.5%) and ‘strong cold stress’ (20.55%).
Regarding UTCI, in Madrid, 75.7% of the older adults interviewed were within the wellness zone (9–26 °C) whilst 17.1% were within the ‘moderate heat’ zone (26–32 °C). In the case of Newcastle, 68.49% were within the wellness zone (9–26 °C) and 32.51% were within the ‘light cold’ zone where the physiological response would be the reduction of one degree of the temperature of the skin on the hands after 120 min of exposure [49].
Furthermore, the thermal sensation and thermal preference of older people interviewed were significantly correlated with the UTCI and PET indices (p < 0.01). In Madrid, 60.4% of people who were in ‘well-being’ according to the UTCI index had ‘neutral’ thermal sensations. Similarly, when analyzing the PET with the thermal sensation, it was found that the highest percentages of ‘neutral’ responses occurred within the ‘comfort: no thermal stress’ zone (65.2%).
In the case of Newcastle, it was found that the ‘well-being’ of the UTCI index corresponded to 84.4% of the ‘neutral’ responses, whilst regarding the PET index, the comfort zone corresponded to just 6.3% of the ‘neutral’ answers and 21.4% of ‘no change’ answers. It is important to note that the highest percentage of neutral TSV in older people would be within ‘light stress due to cold’ according to the PET index (Figure 8). Although most of them claimed to perceive the thermal environment as comfortable, they could be at risk of thermal stress due to cold that could affect their health. This may be due to the loss of thermal sensitivity in both cities, especially in the case of Newcastle [37].
The PET range for well-being (without thermal stress) was similar in both cities, being between 17.86–22.08 °C in Madrid and between 17.94–19.93 °C in Newcastle with a difference between ±0.8 ± 2.15 °C. Just one previous study assessed the thermal comfort zone with the PET index in Madrid for the average adult in autumn [50], and it was found to be between 15.6–25.5 °C, whilst there is no evidence of similar studies for Newcastle. Figure 8 presents the PET and UTCI indices for each city and a comparison with TSV and TP.
4. Conclusions
The global trend of ageing populations and other challenges such as climate change that affect microclimate conditions for all the seasons led this research to analyse the outdoor thermal comfort of older adults in public spaces from two cities in Europe: Madrid in Spain and Newcastle upon Tyne in the United Kingdom, during autumn. As we have seen throughout this research, these are two very different cities in terms of size, density, climate, culture, etc.
The statistical influence of microclimatic variables on thermal comfort is evident in older people in both cities. Some differences in cultural behaviour and adaptation were identified. Older adults in Madrid wore higher levels of clothing insulation, were more tolerant and presented higher thermal comfort, and their thermal comfort range was wider due to the greater thermal amplitude (numerical difference between the minimum and maximum values observed during the day).
A difference of 3.4 °C was found in the neutral temperature between the cities; older people in Newcastle were shown to be more sensitive to climate changes.
In both cases, the risk of cold and heat stress was identified according to the PET index, although most of the older people perceived the environment as comfortable. The vulnerability of this population group to the effects of climate on their health is evident, making further research on the subject necessary to establish mitigation and adaptation strategies for future extreme weather and climate change scenarios across Europe.
Additionally, some final considerations can be highlighted which are important for further research:
- A dense city has significant microclimatic differences in the variables of temperature, relative humidity, and wind, which must be assessed at the pedestrian level to be able to establish the appropriate bioclimatic recommendations for healthier urban spaces.
- Older people, the majority in most European cities, have intrinsic differences in their perception of both cold and heat. For this reason, both the definition of the comfort zone and the strategies must be qualified by considering age groups over 65 and over 80 years of age.
- The final thermal comfort of a group must always combine external data with the real perception of the people in situ due to the wide number of variables that affect perception.
Therefore, considering that the European population is very old, it is necessary to establish spatial recommendations to improve the microclimatic conditions of public spaces, which should include sunny areas in winter and shaded areas in summer; green areas with deciduous trees and shrubs; areas protected from the winter wind thanks to walls, furniture or small windbreaks; and areas with fountains and clear paving. But at the same time, areas that are active but not noisy should be established. Older adults constitute a significant group in many urban neighbourhoods, which need to be considered so that they have spaces appropriate to their uniqueness and are not exposed to the risks of extreme heat or cold that they are not aware of, as has been reflected in this research.
Some limitations of this study are:
- Due to the small sample size, these results can only be taken as a reference.
- There was a wide climatic variability in both cities.
- The exposure time to microclimate conditions was not considered for the acclimatisation of older people. Future research should consider this to obtain more accurate results and to avoid biases, as some authors has suggested.
However, these results could be a starting point for the design of more comfortable and healthy public spaces that improve the quality of life of all citizens within the guidelines of active ageing and healthy cities.
Author Contributions
Conceptualisation, M.T.B.L. and E.H.G.; methodology, M.T.B.L.; software, M.T.B.L.; validation, M.T.B.L.; formal analysis, M.T.B.L.; investigation, M.T.B.L. and E.H.G.; resources, M.T.B.L.; data curation, M.T.B.L.; writing—original draft preparation, M.T.B.L.; writing—review and editing, M.T.B.L. and E.H.G.; visualisation, M.T.B.L.; supervision, E.H.G.; project administration, M.T.B.L.; funding acquisition, M.T.B.L. All authors have read and agreed to the published version of the manuscript.
Funding
This work was supported by Secretaría de Educación Superior, Ciencia, Tecnología e Innovación del Ecuador. SENESCYT under Grant [109-2017 (SENESCYT-SDFC-DSEFC-2017-4040-O)].
Data Availability Statement
The data presented in this study are available on request from the corresponding author. The data are not publicly available due to [privacy].
Conflicts of Interest
The authors declare no conflict of interest.
References
- IPCC. Climate Change 2014; Synthesis Report; Cambridge University Press: Cambridge, UK, 2014. [Google Scholar] [CrossRef]
- Wang, J.; Guan, Y.; Wu, L.; Guan, X.; Cai, W.; Huang, J.; Dong, W.; Zhang, B. Changing Lengths of the Four Seasons by Global Warming. Geophys. Res. Lett. 2021, 48, e2020GL091753. [Google Scholar] [CrossRef]
- Organización Iberoamericana de Seguridad Social. Boletín del Programa Iberoamericano de Cooperación Sobre Adultos Mayores. 2016. Available online: https://oiss.org/boletin-no-10-del-programa/ (accessed on 1 September 2022).
- Comission on Social Determinants of Health. Closing the Gap in a Generation: Health Equity through Action on the Social Determinants of Health. Final Report of the Commission on Social Determinants of Health, Geneva. 2008. Available online: http://www.who.int/social_determinants/final_report/csdh_finalreport_2008.pdf (accessed on 1 September 2022).
- Baquero Larriva, M.T.; Higueras García, E. Thermal comfort for the elderly: A systematic review of the scientific literature. Rev. Esp. Geriatr. Gerontol. 2019, 54, 280–295. [Google Scholar] [CrossRef]
- Novieto, D.; Zhang, Y. Thermal comfort implications of the aging effect on metabolism, cardiac output and body weight. Adapt. Chang. New Think. Comf. 2010, 1–9. Available online: https://acortar.link/UQQr7C (accessed on 1 September 2022).
- Fariña, J.; Higueras, E.; Román, E. Ciudad, Urbanismo y Salud. Criterios Generales de Diseño Urbano para Alcanzar los Objetivos de una Ciudad Saludable; Envejecimiento Activo, Instituto Juan de Herrera: Madrid, España, 2019. [Google Scholar]
- Erell, E.; Pearlmutter, D.; Williamson, T. Urban Microclimate: Designing the Spaces between Buildings, 1st ed.; Routledge: London, UK, 2011. [Google Scholar] [CrossRef]
- Higueras, E. Urbanismo Bioclimático, GG, Barcelona. 2006. Available online: https://editorialgg.com/urbanismo-bioclimatico-libro.html (accessed on 1 September 2022).
- Neila, J. Arquitectura Bioclimática en un Entorno Construido; Munilla-Lería: Madrid, Spain, 2004; ISBN 84-89150-64-8. [Google Scholar]
- Kalmár, F. An indoor environment evaluation by gender and age using an advanced personalized ventilation system. Build. Serv. Eng. Res. Technol. 2017, 38, 505–521. [Google Scholar] [CrossRef]
- Havenith, G.; Holmér, I.; Parsons, K. Personal factors in thermal comfort assessment: Clothing properties and metabolic heat production. Energy Build. 2002, 34, 581–591. [Google Scholar] [CrossRef]
- Aghamolaei, R.; Lak, A. Outdoor Thermal Comfort for Active Ageing in Urban Open Spaces: Reviewing the Concepts and Parameters. Ageing Int. 2022, 1–14. [Google Scholar] [CrossRef]
- Oke, T.R. Street Design and Urban Canopy Layer Climate. Energy Build. 1988, 11, 103–113. [Google Scholar] [CrossRef]
- Fernández, F.J.; Allende, F.; Rasilia, D.; Martilli, A. Alcaide, Estudio de Detalle del Clima Urbano de Madrid; Departamento de Geografía, Universidad Autónoma de Madrid: Madrid, Spain, 2016; Available online: https://acortar.link/tgKL6C (accessed on 1 September 2022).
- Gagge, A.; Fobelets, A.; Berglund, L. A standar predictive index of human response of thermal environment. ASHRAE Trans. 1986, 92, 709–731. [Google Scholar]
- Spagnolo, J.; de Dear, R. A field study of thermal comfort in outdoor and semi-outdoor environments in subtropical Sydney Australia. Build. Environ. 2003, 38, 721–738. [Google Scholar] [CrossRef]
- Blazejczyk, K.; Epstein, Y.; Jendritzky, G.; Staiger, H.; Tinz, B. Comparison of UTCI to selected thermal indices. Int. J. Biometeorol. 2012, 56, 515–535. [Google Scholar] [CrossRef] [Green Version]
- Mayer, H.; Höppe, P. Thermal comfort of man in different urban environments. Theor. Appl. Climatol. 1987, 38, 43–49. [Google Scholar] [CrossRef]
- Innternational Sciety of Biometeorology. UTCI Universal Thermal Climate Index. 2004. Available online: http://www.utci.org/ (accessed on 12 July 2019).
- Potchter, O.; Cohen, P.; Lin, T.; Matzarakis, A. Outdoor human thermal perception in various climates: A comprehensive review of approaches, methods and quantification. Sci. Total Environ. 2018, 631–632, 390–406. [Google Scholar] [CrossRef]
- Manu, S.; Shukla, Y.; Rawal, R.; Thomas, L.; de Dear, R. Field studies of thermal comfort across multiple climate zones for the subcontinent: India Model for Adaptive Comfort (IMAC). Build. Environ. 2016, 98, 55–70. [Google Scholar] [CrossRef]
- Frontczak, M.; Wargocki, P. Literature survey on how different factors influence human comfort in indoor environments. Build. Environ. 2011, 46, 922–937. [Google Scholar] [CrossRef]
- Yang, W.; Wong, N.; Jusuf, S. Thermal comfort in outdoor urban spaces in Singapore. Build. Environ. 2013, 2, 426–435. [Google Scholar] [CrossRef]
- Knez, I.; Thorsson, S. Thermal, emotional and perceptual evaluations of a park: Cross-cultural and environmental attitude comparisons. Build. Environ. 2008, 43, 1483–1490. [Google Scholar] [CrossRef]
- Fong, C.; Aghamohammadi, N.; Ramakreshnan, L.; Sulaiman, N.; Mohammadi, P. Holistic recommendations for future outdoor thermal comfort assessment in tropical Southeast Asia: A critical appraisal. Sustain. Cities Soc. 2019, 46, 101428. [Google Scholar] [CrossRef]
- Departamento de Producción de la Agencia Estatal de Meteorología de España y Departamento de Meteorología e Clima de Portugal, Atlas Climático Ibérico. Temperatura del Aire y Precipitación (1971–2000), Closas-Orc. 2011. Available online: http://www.aemet.es/documentos/es/conocermas/publicaciones/Atlas-climatologico/Atlas.pdf (accessed on 2 June 2020).
- AEMET. Temperaturas Medias y su Comparación con las de los Últimos 30 Años. (Observatorio de Retiro), Banco Datos. Ayunt. Madrid Territ. y Medio Ambient. 2019. Available online: http://www-2.munimadrid.es/CSE6/control/seleccionDatos?numSerie=14020000020 (accessed on 22 March 2019).
- Time and Date, Climate & Weather Averages in Newcastle upon Tyne, England, United Kingdom. Annual Weather Avergages Near Newcastle upon Tyne. 2015. Available online: https://www.timeanddate.com/weather/uk/newcastle-upon-tyne/climate (accessed on 29 June 2020).
- International Standard Organization. ISO 7726: Ergonomics of the Thermal Environment. Instruments and Methods for Measuring Physical Quantities; International Standard Organization: Geneva, Switzerland, 1998. [Google Scholar]
- Andrade, H.; Alcoforado, M. Microclimatic variation of thermal comfort in a district of Lisbon (Telheiras) at night. Theor. Appl. Climatol. 2008, 92, 225–237. [Google Scholar] [CrossRef]
- Hwang, R.; Lin, T.; Matzarakis, A. Seasonal effects of urban street shading on long-term outdoor thermal comfort. Build. Environ. 2011, 46, 863–870. [Google Scholar] [CrossRef]
- Martinelli, L.; Lin, T.; Matzarakis, A. Assessment of the influence of daily shadings pattern on human thermal comfort and attendance in Rome during summer period. Build. Environ. 2015, 92, 30–38. [Google Scholar] [CrossRef]
- Hwang, R.; Chen, C. Field study on behaviors and adaptation of elderly people and their thermal comfort requirements in residential environments. Indoor Air 2010, 20, 235–245. [Google Scholar] [CrossRef]
- ASHRAE. STANDARD 55—Thermal Enviornmental Conditions for Human Occupancy. 2020. Available online: https://www.ashrae.org/technical-resources/bookstore/standard-55-thermal-environmental-conditions-for-human-occupancy (accessed on 1 December 2017).
- Mclntyre, D. A Guide to Thermal Comfort. Appl. Ergon. 1973, 4, 66–72. [Google Scholar] [CrossRef] [PubMed]
- Larriva, M.B.; Higueras, E. Health risk for older adults in Madrid, by outdoor thermal and acoustic comfort. Urban Clim. 2020, 34, 100724. [Google Scholar] [CrossRef]
- Karjalainen, S. Thermal comfort and gender: A literature review. Indoor Air 2012, 22, 96–109. [Google Scholar] [CrossRef] [PubMed]
- Indraganti, M.; Rao, K. Effect of age, gender, economic group and tenure on thermal comfort: A field study in residential buildings in hot and dry climate with seasonal variations. Energy Build. 2010, 42, 273–281. [Google Scholar] [CrossRef]
- Yao, F.; Fang, H.; Han, J.; Zhang, Y. Study on the outdoor thermal comfort evaluation of the elderly in the Tibetan plateau. Sustain. Cities Soc. 2022, 77, 103582. [Google Scholar] [CrossRef]
- Larriva, M.B. Confort Térmico y Acústico para la Tercera edad en Espacios Públicos de la Ciudad Consolidada del Clima Mediterráneo Continental: Caso de Estudio Barrio Arapiles. Ph.D. Thesis, Universidad Politécnica de Madrid, Madrid, Spain, 2021. [Google Scholar] [CrossRef]
- Nikolopoulou, M.; Lykoudis, S. Thermal comfort in outdoor urban spaces: Analysis across different European countries. Build. Environ. 2006, 41, 1455–1470. [Google Scholar] [CrossRef]
- Wong, L.; Fong, K.; Mui, K.; Wong, W.; Lee, L. A field survey of the expected desirable thermal environment for older people. Indoor Built Environ. 2009, 18, 336–345. [Google Scholar] [CrossRef]
- Bills, R.; Soebarto, V.; Williamson, T. Thermal experiences of older people during hot conditions in Adelaide. In Proceedings of the Revisiting the Role of Architectural Science in Design and Practice: 50th International Conference of the Architectural Science Association, Adelaide, Australia, 7–9 December 2016; pp. 657–664. [Google Scholar]
- Fan, G.; Xie, J.; Yoshino, H.; Yanagi, U.; Hasegawa, K. Investigation of indoor thermal environment in the homes with elderly people during heating season in Beijing, China. Build. Environ. 2017, 126, 288–303. [Google Scholar] [CrossRef]
- Ji, X.; Lou, W.; Dai, Z.; Wang, B.; Liu, S. Predicting thermal comfort in Shanghai’s non-air-conditioned buildings. Build. Res. Inf. 2006, 34, 507–514. [Google Scholar] [CrossRef]
- ASHRAE Standar 55-1966; Thermal Comfort Conditions. ASHRAE: Atlanta, GA, USA, 1966.
- Feriadi, H.; Wong, N.; Chandra, S.; Cheong, K. Adaptive behaviour and thermal comfort in Singapore’s naturally ventilated housing. Build. Res. Inf. 2010, 31, 37–41. [Google Scholar] [CrossRef]
- Błazejczyk, K.; Broede, P.; Fiala, D.; Havenith, G.; Holmér, I.; Jendritzky, G.; Kampmann, B.; Kunert, A. Principles of the new Universal Thermal Climate Index (UTCI) and its application to bioclimatic research in European scale. Misc. Geogr. 2010, 14, 91–102. [Google Scholar] [CrossRef] [Green Version]
- García, F.F.; Galán, E.; Cañada, R. Caracterización del régimen bioclimático medio del área metropolitana de Madrid, mediante la aplicación de la temperatura fisiológica (PET). Territoris 2012, 8, 83–101. Available online: https://raco.cat/index.php/Territoris/article/view/259755. (accessed on 5 February 2021).
Figure 1.
Case studies location in the Köppen–Geiger’s climate classification map of Europe. (BSk, cold semi-arid; Csa, hot summer Mediterranean; Csb, warm-summer Mediterranean; Cfa, humid subtropical; Cfb, oceanic climate west coast; Cfc, oceanic climate subpolar; Dfa, hot summer humid continental; Dfb, warm summer humid continental; Dfc, regular subarctic; Dsa, dry and hot summer humid continental; Dsb, dry and warm summer humid continental; Dsc, dry summer, regular subarctic; ET, tundra; EF, ice cap climate).

Figure 2.
Case study of Madrid. (a) Location of Madrid in Spain; (b) location of Chamberi district in Madrid; (c) location of Park Galileo Theatre (PTG), Conde del Valle de Schill Square (PCVS) and Vallehermoso street (CVH); (d) aerial view of PTG and location of measurement points; (e) aerial view of PCVS and location of measurement points, (f) aerial view of CVH and location of measurement points.

Figure 3.
Case study of Newcastle upon Tyne. (a) Location of Newcastle in the UK; (b) location of Westgate in Newcastle upon Tyne; (c) location of Old Eldon Square (OES) and Northumberland Street (NS); (d) aerial view of OES and location of measurement points; (e) aerial view of NS and location of measurement points.

Figure 4.
Measurement and survey at point 2 in CVH Street, Madrid.

Figure 5.
Sample characteristics. (a) Madrid; (b) Newcastle upon Tyne.

Figure 6.
Thermal perception. (a) Thermal sensation (TSV) by city; (b) thermal preference by city; (c) thermal sensation by gender and city; (d) thermal preference by gender and city.
Figure 6.
Thermal perception. (a) Thermal sensation (TSV) by city; (b) thermal preference by city; (c) thermal sensation by gender and city; (d) thermal preference by gender and city.

Figure 7.
Linear regression air temperature vs. mean thermal sensation votes (MTSV) for Madrid and Newcastle.
Figure 7.
Linear regression air temperature vs. mean thermal sensation votes (MTSV) for Madrid and Newcastle.

Figure 8.
PET and UTCI and comparison with MTSV for (a) Newcastle upon Tyne and (b) Madrid.


Table 1.
Environmental measuring equipment specifications.
| Variable | Equipment | Measurement Range | Accuracy |
|---|---|---|---|
| Ta (°C) | Thermohydrometer data logger HOBO UX100 (HOBO, MA USA) | −20–70 °C | ±0.2 °C |
| RH (%) | 1–95% | ±2.5% | |
| Ws (m/s) | Anemometer Proster Digital MS6252a (Proster, Hong Kong) | 0.4–30 m/s | ±2% |
| SVF | Rayman 1.2 software | ||
| Tmrt (°C) |
Ta = air temperature; RH = relative humidity; WS = wind speed; Tmrt = mean radiant temperature; SVF = sky view factor.
Table 2.
Summary of environmental data measured in situ in public spaces in Madrid and Newcastle upon Tyne.
Table 2.
Summary of environmental data measured in situ in public spaces in Madrid and Newcastle upon Tyne.
| City | Public Space | Ta °C | RH % | Ws m/s | Mrt °C | SVF |
|---|---|---|---|---|---|---|
| Mean | Mean | Mean | Mean | Mean | ||
| Madrid | PCVS | 20.9 | 38.3 | 1.5 | 35.0 | 0.04 |
| CVH | 17.5 | 50.0 | 1.1 | 28.3 | 0.02 | |
| PTG | 19.4 | 50.5 | 1.2 | 30.5 | 0.03 | |
| Mean | 19.3 | 46.2 | 1.3 | 31.2 | 0.03 | |
| Newcastle upon Tyne | OES | 13.3 | 60.8 | 1.6 | 22.7 | 0.01 |
| NS | 15.9 | 54.7 | 1.9 | 20.3 | 0.02 | |
| Mean | 14.6 | 57.8 | 1.7 | 21.5 | 0.01 |
Ta = air temperature; RH = relative humidity; Ws = wind speed; Mrt = mean radiant temperature; SVF = sky view factor.
Table 3.
Statistical differences between Madrid climate (Csa) and Newcastle upon Tyne climate (Cfb).
Table 3.
Statistical differences between Madrid climate (Csa) and Newcastle upon Tyne climate (Cfb).
| Statistical Test | ||||
|---|---|---|---|---|
| Variable | Chi-Squared | Kruskal-Wallis | Student’s-t | |
| Sig (Bilateral) | Sig (Bilateral) | Sig (Bilateral) | ||
| Microclimatic | Ta (°C) | 0.000 ** | ||
| HR (%) | 0.000 ** | |||
| Ws (m/s) | 0.000 ** | |||
| SVF | 0.080 | |||
| Trm (°C) | 0.000 ** | |||
| Personal | clo | 0.611 | ||
| Age | 0.415 | |||
| Gender | 0.274 | |||
| Visit time | 0.001 ** | |||
| Activity | 0.000 ** | |||
| Frequency of visit | 0.000 ** | |||
| Perception | Humidity perception | 0.239 | ||
| Wind perception | 0.000 ** | |||
| TSV | 0.023 * | |||
| PT | 0.172 | |||
| Thermal index | UTCI ‘Wellbeing’ | 0.0246 * | ||
| PET ‘no thermal stress’ | 0.007 ** | |||
Ta = air temperature; RH = relative humidity; Ws = wind speed; Mrt = mean radiant temperature; SVF = sky view factor. * The correlation is significant at level 0.05 (2 tails); ** The correlation is significant at level 0.01 (2 queues).
Table 4.
Correlation between thermal comfort and environmental variables for Madrid and Newcastle.
| Variable | Pearson Correlation | |
|---|---|---|
| Madrid | Newcastle | |
| Coef. Correlation | ||
| Ta (°C) | 0.14 ** | 0.128 |
| HR (%) | −0.13 ** | 0.177 |
| Ws (m/s) | 0.10 * | −0.252 * |
| SVF | −0.03 | −0.06 |
| Trm (°C) | 0.24 ** | 0.176 |
* The correlation is significant at level 0.05 (2 tails); ** the correlation is significant at level 0.01 (2 tails). Ta = air temperature; RH = relative humidity; SVF = sky view factor; Trmt = mean radiant temperature.
Disclaimer/Publisher’s Note: The statements, opinions and data contained in all publications are solely those of the individual author(s) and contributor(s) and not of MDPI and/or the editor(s). MDPI and/or the editor(s) disclaim responsibility for any injury to people or property resulting from any ideas, methods, instructions or products referred to in the content. |
© 2023 by the authors. Licensee MDPI, Basel, Switzerland. This article is an open access article distributed under the terms and conditions of the Creative Commons Attribution (CC BY) license (https://creativecommons.org/licenses/by/4.0/).
Share and Cite
MDPI and ACS Style
Baquero Larriva, M.T.; Higueras García, E. Influence of Microclimate on Older Peoples’ Outdoor Thermal Comfort and Health during Autumn in Two European Cities. Designs 2023, 7, 27. https://doi.org/10.3390/designs7010027
AMA Style
Baquero Larriva MT, Higueras García E. Influence of Microclimate on Older Peoples’ Outdoor Thermal Comfort and Health during Autumn in Two European Cities. Designs. 2023; 7(1):27. https://doi.org/10.3390/designs7010027
Chicago/Turabian StyleBaquero Larriva, María Teresa, and Ester Higueras García. 2023. "Influence of Microclimate on Older Peoples’ Outdoor Thermal Comfort and Health during Autumn in Two European Cities" Designs 7, no. 1: 27. https://doi.org/10.3390/designs7010027