Coenzyme Q10 and Fish Oil Supplementation for Reducing Retinal Oxidative Stress in a Rat Model


Abstract
:1. Introduction
2. Materials and Methods
2.1. Animals
2.2. Experimental Design
2.3. Neonatal Intermittent Hypoxia (IH) Profiles
2.4. Supplementation
2.5. Sample Collection and Processing
2.6. Assay of Oxidants
2.7. Assay of Antioxidants
2.8. Total Cellular Protein Levels
2.9. Immunofluorescence
2.10. Real-Time PCR
2.11. Statistical Analysis
3. Results
3.1. Histopathology
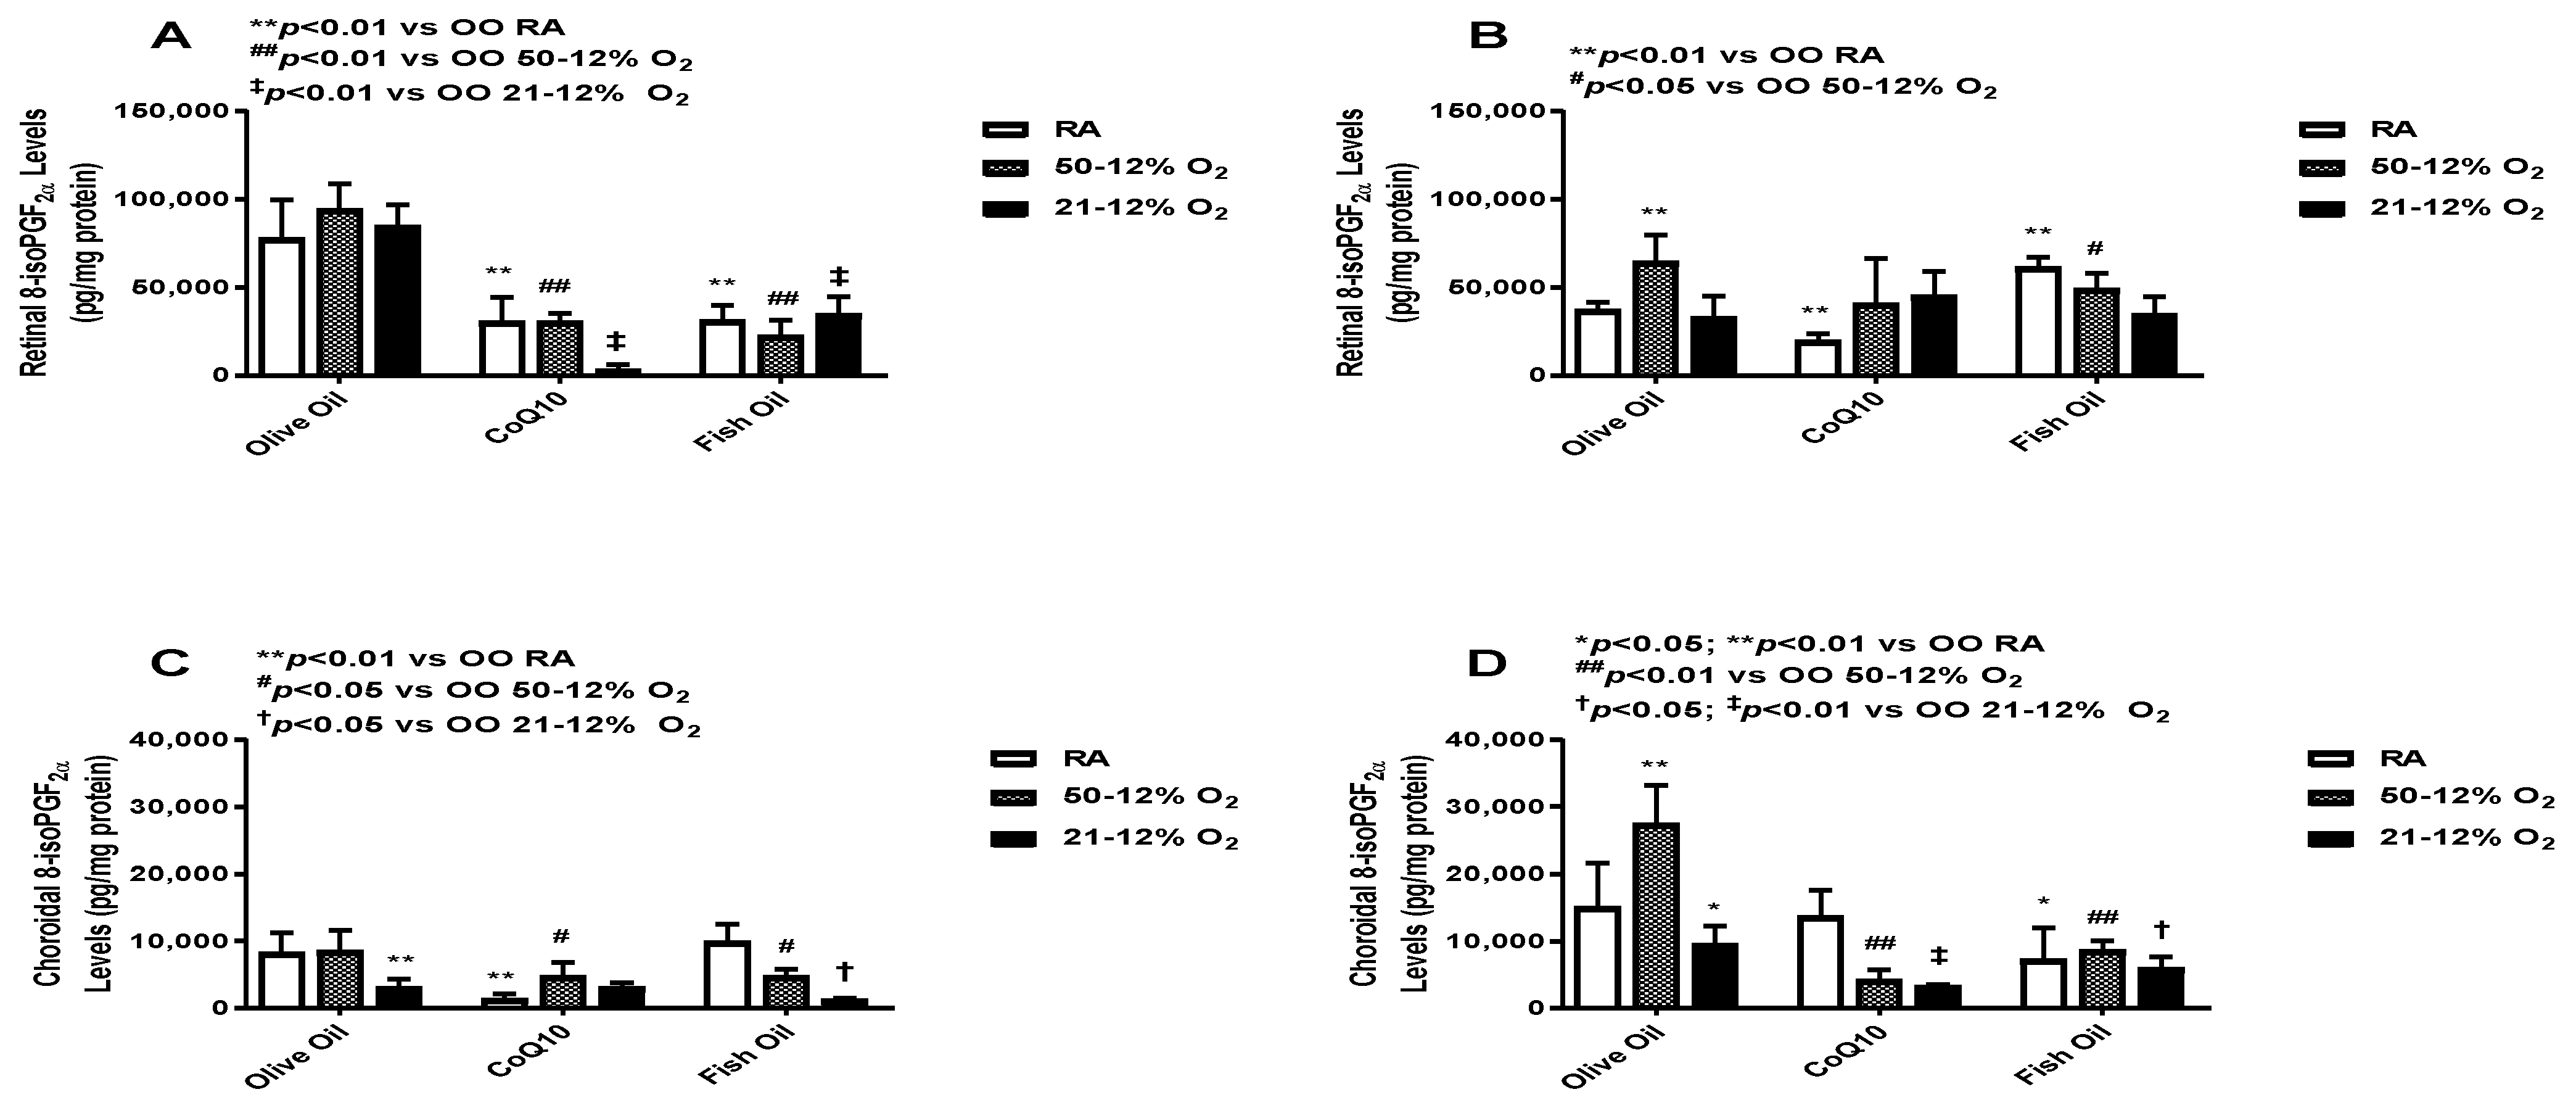
3.2. Oxidative Stress
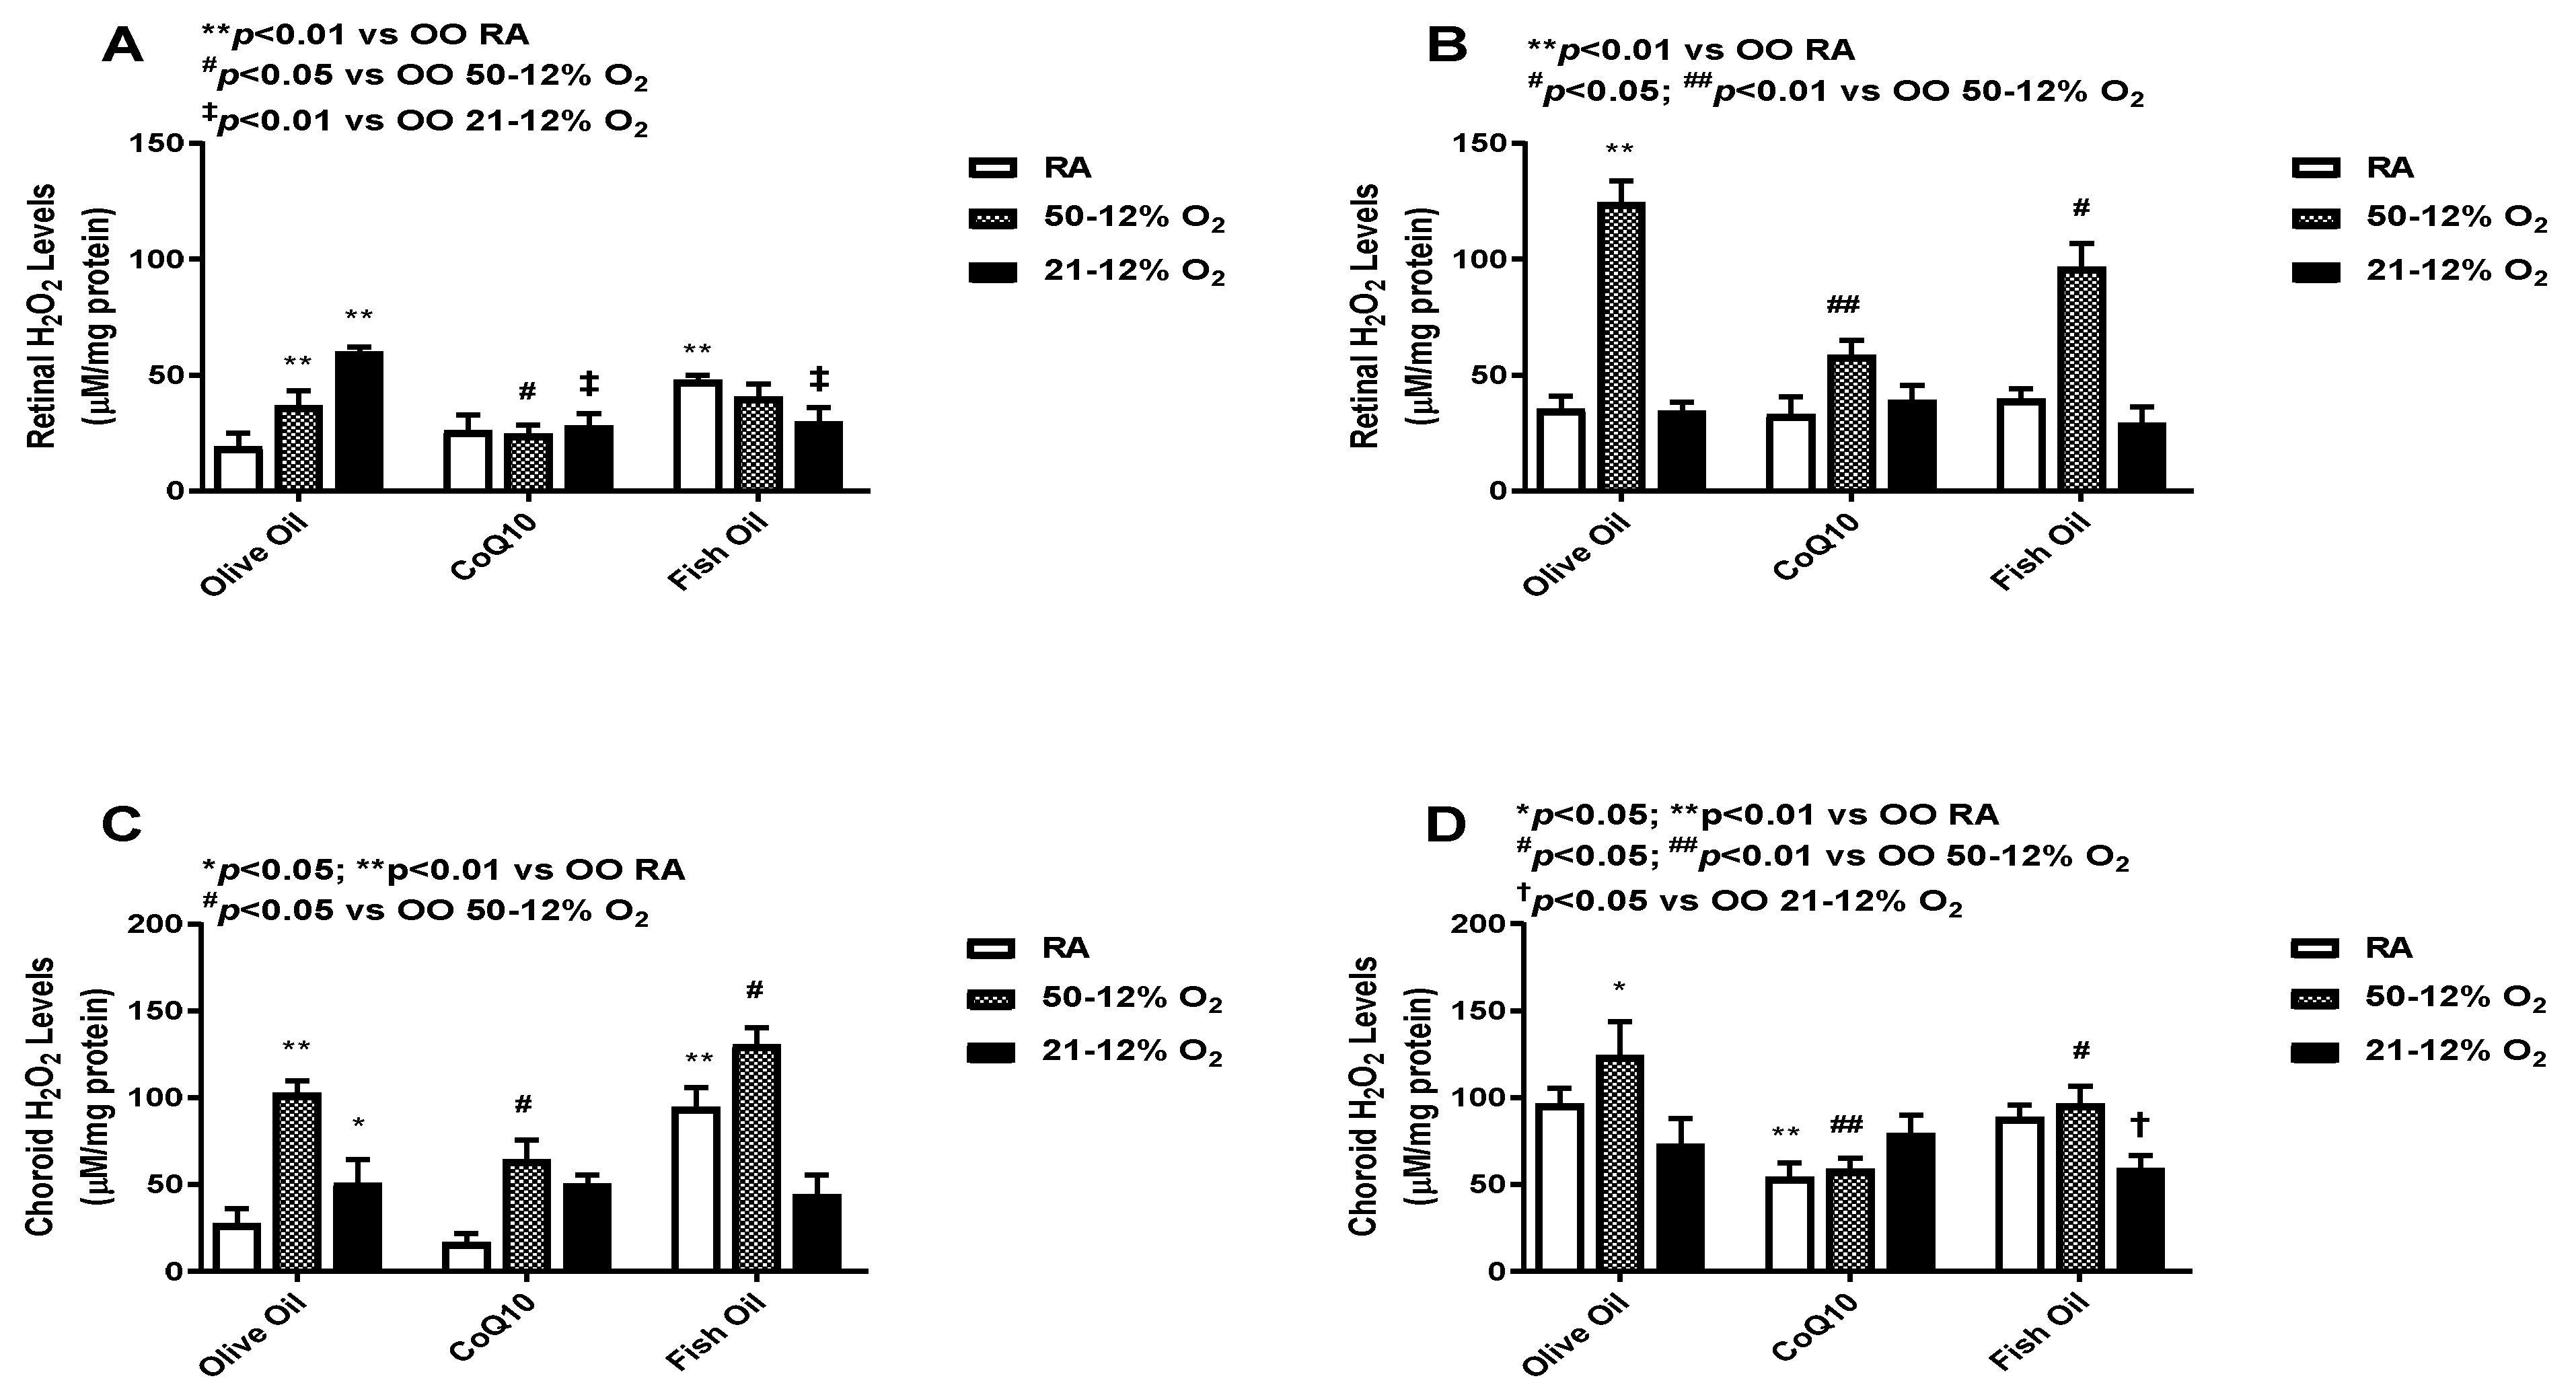
3.3. Hydrogen Peroxide (H2O2)
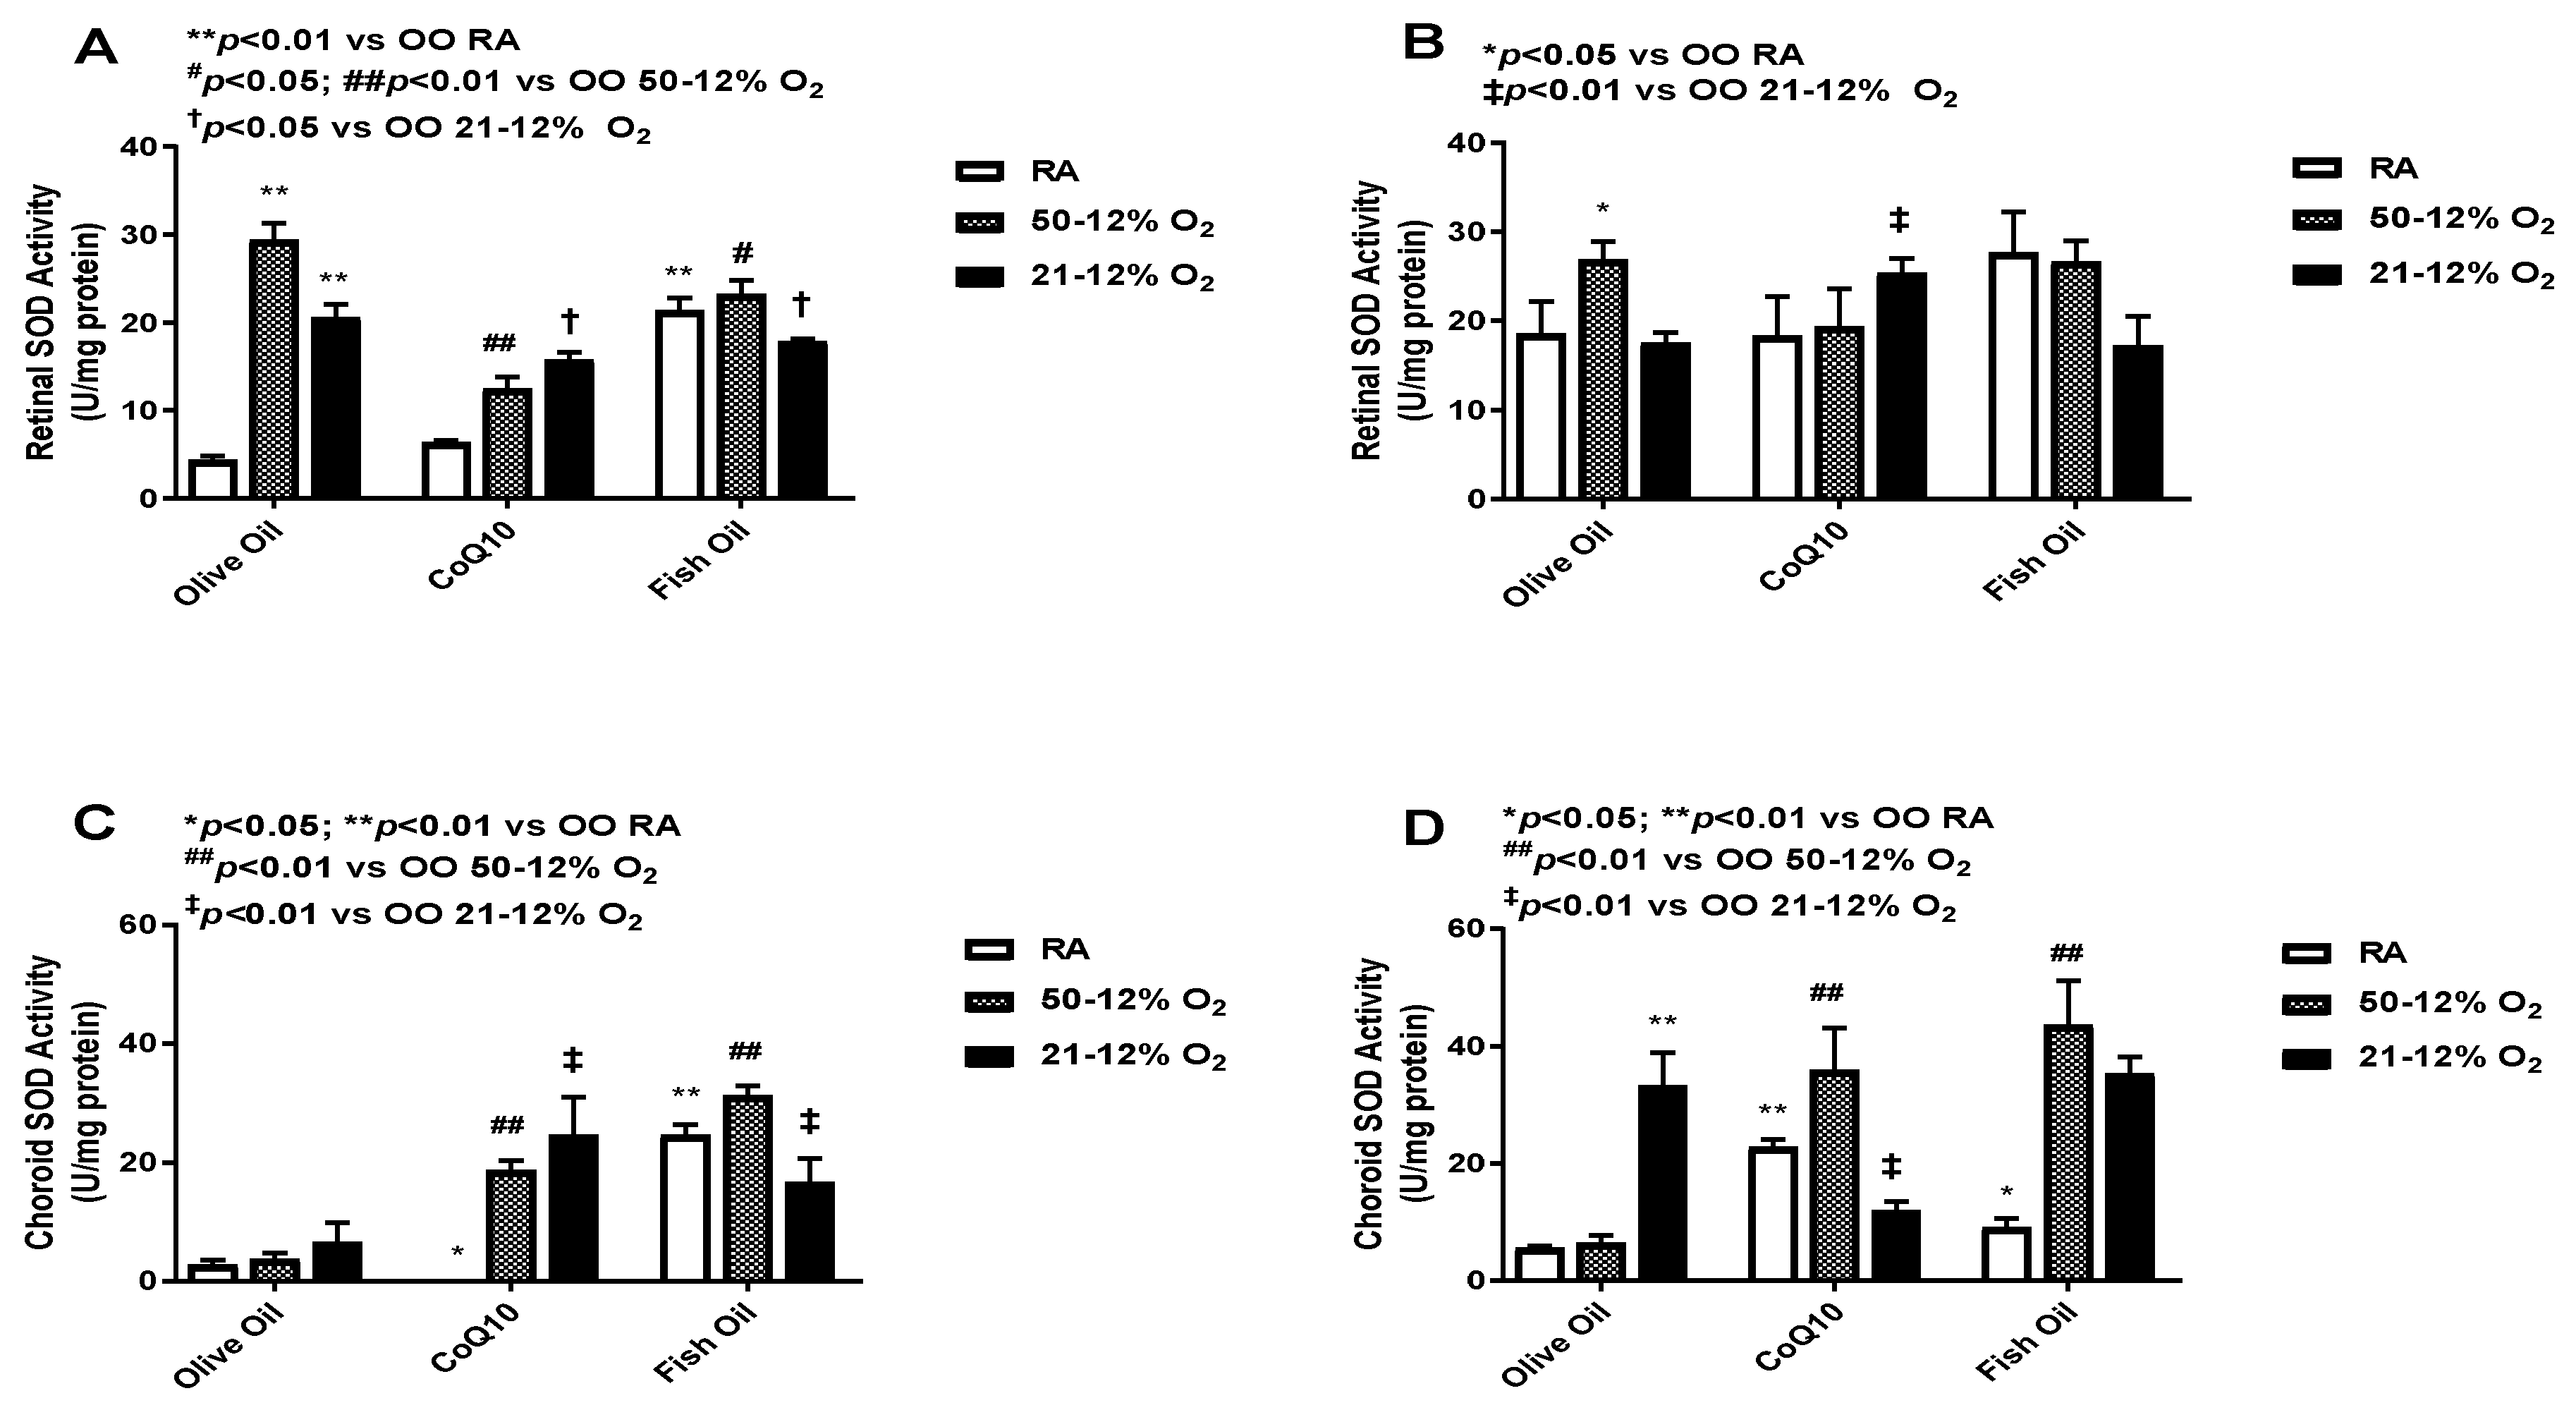
3.4. Superoxide Dismutase (SOD)
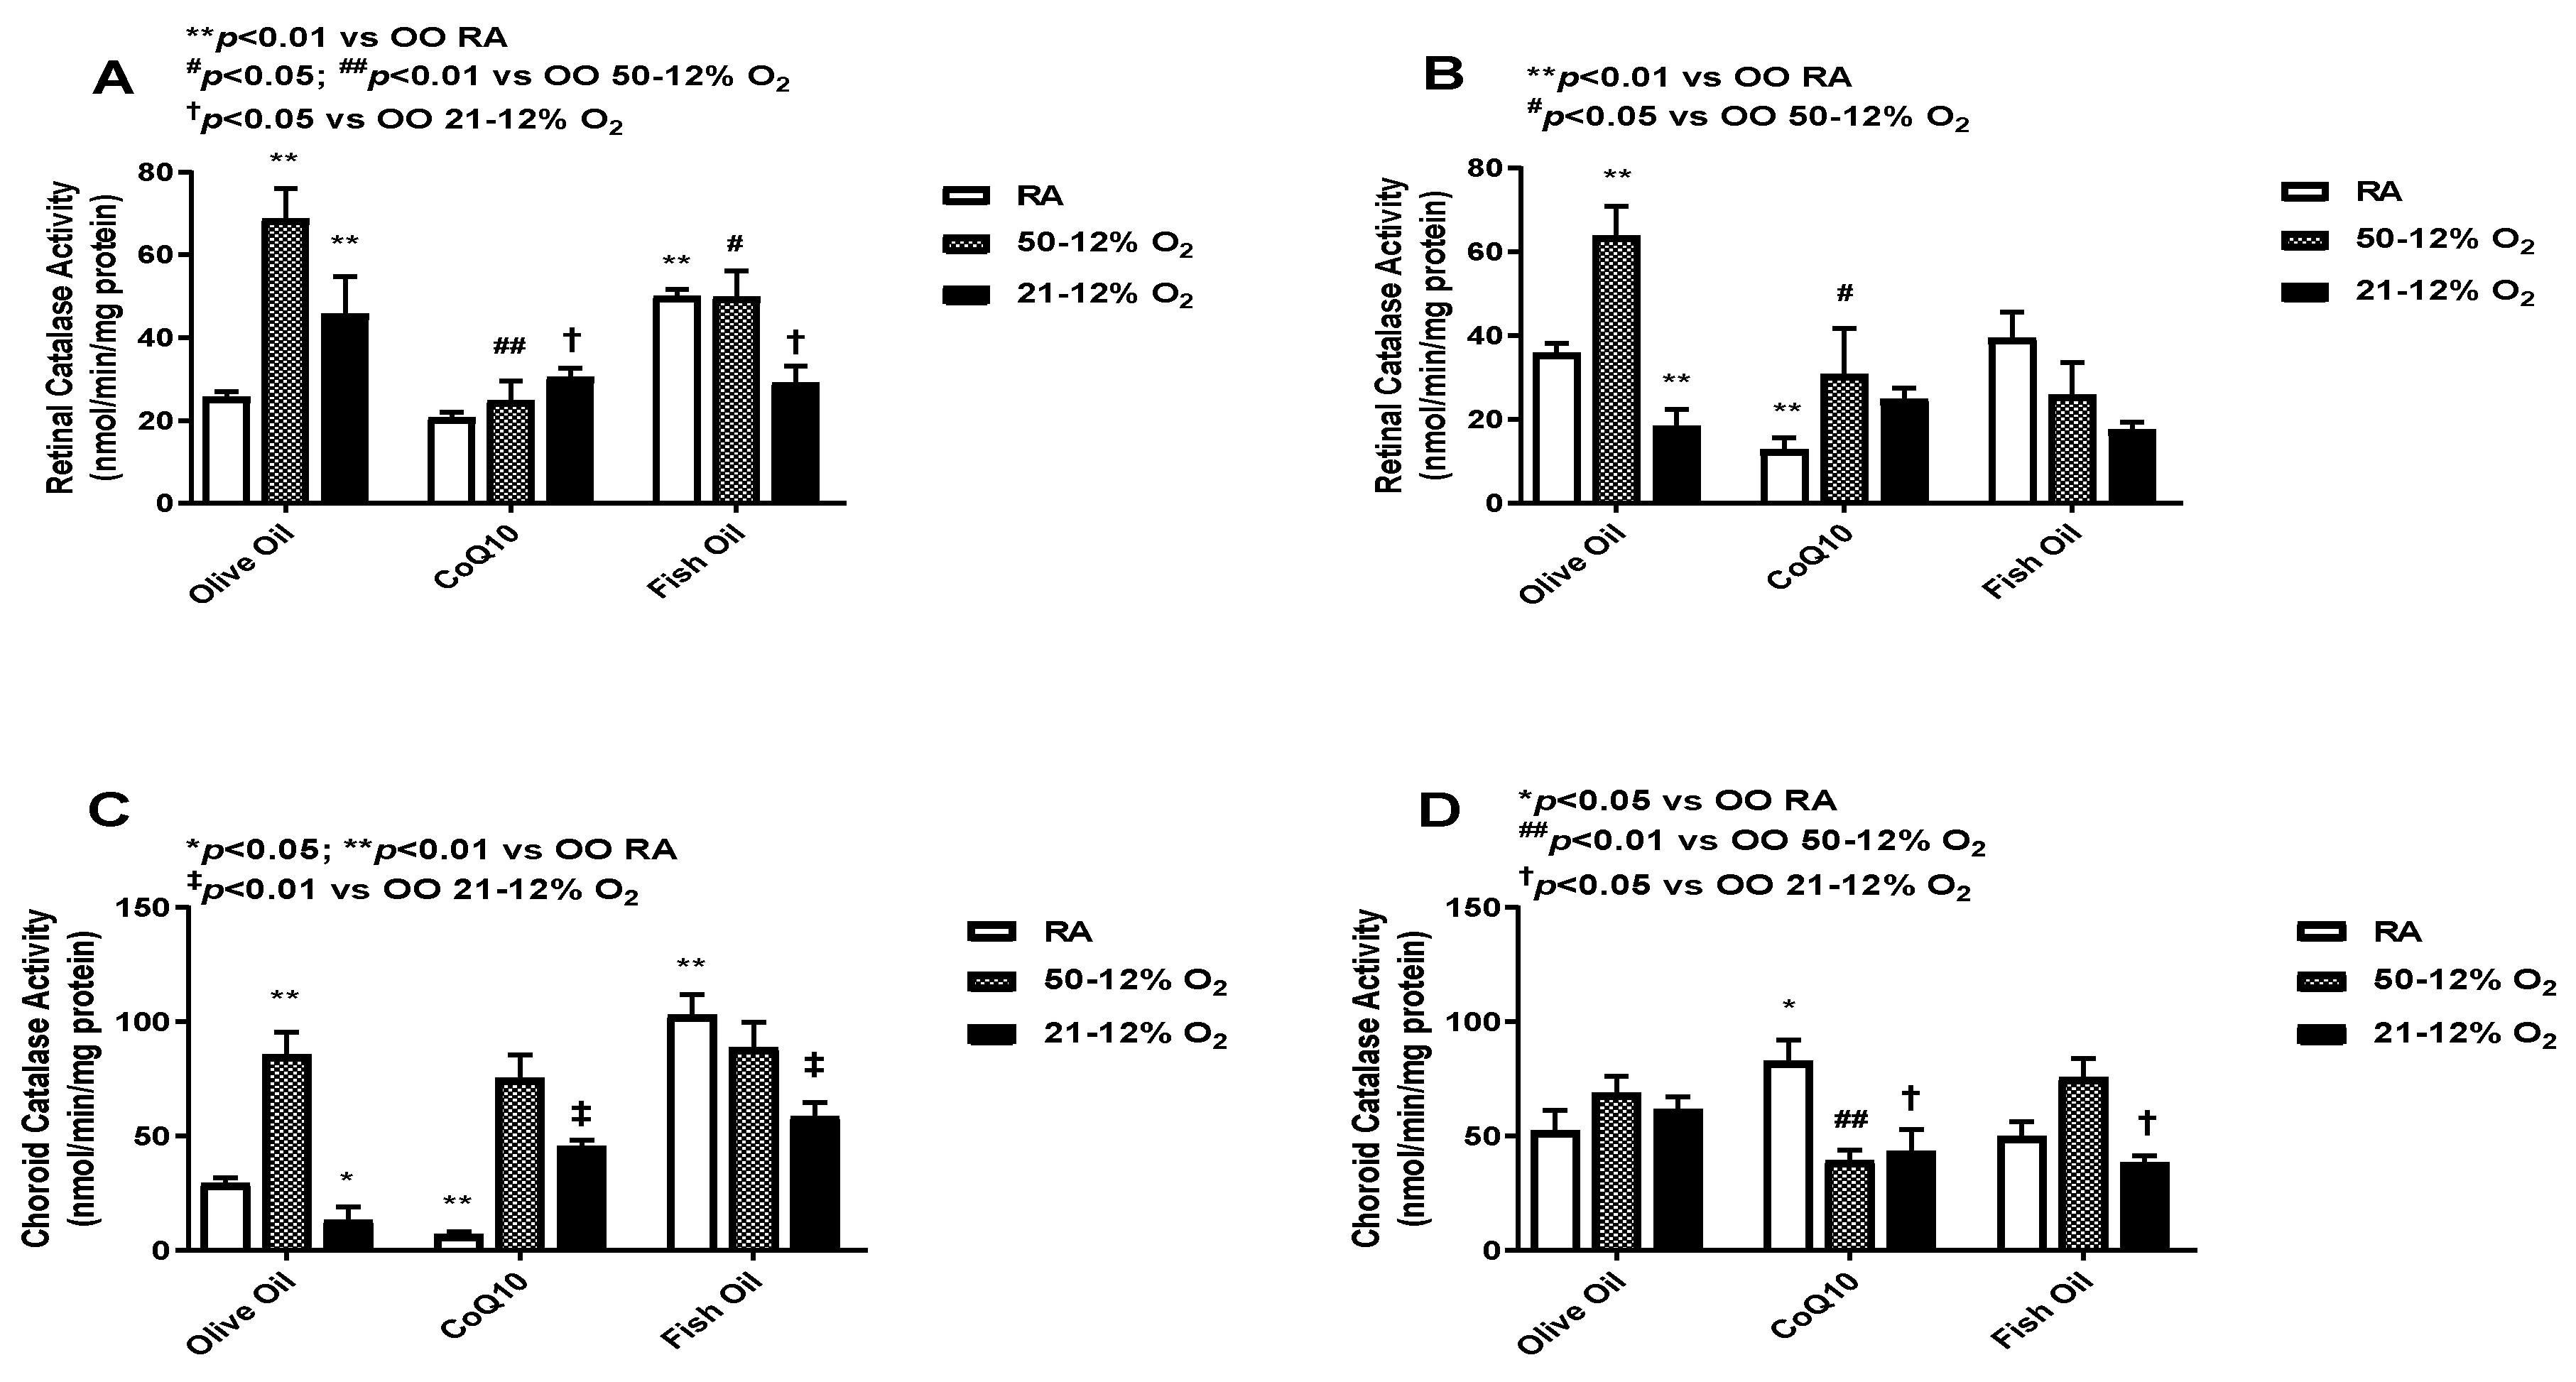
3.5. Catalase
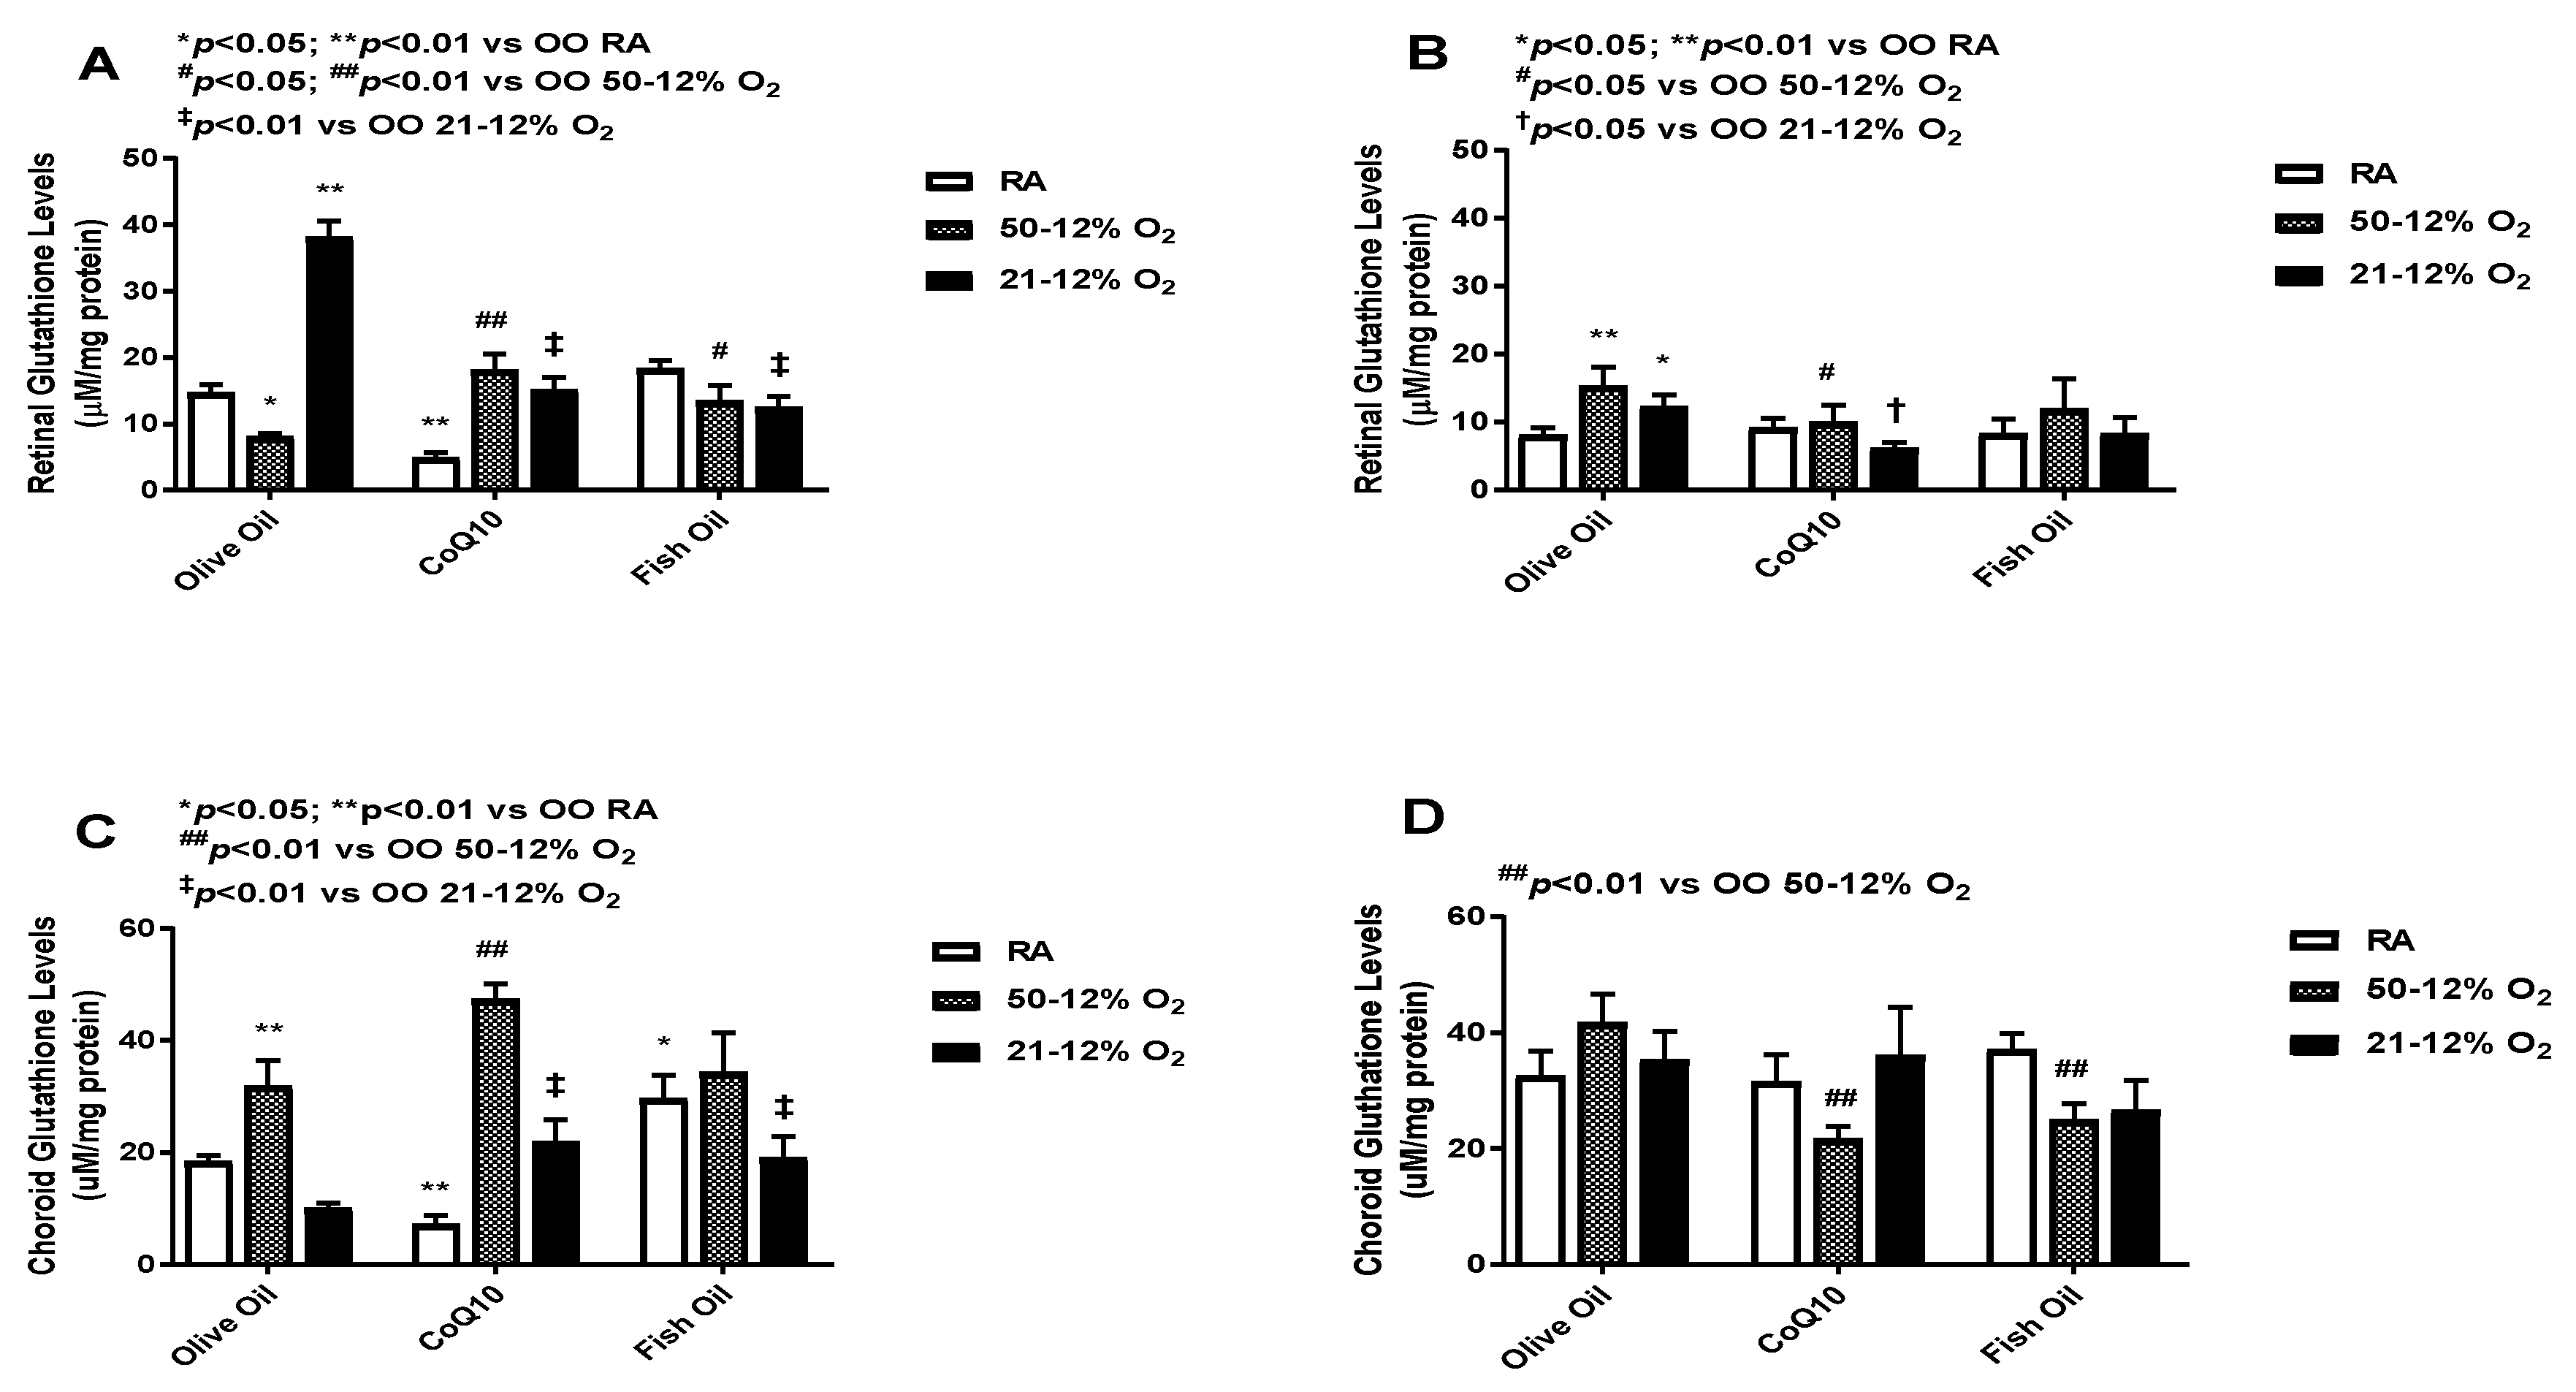
3.6. Glutathione
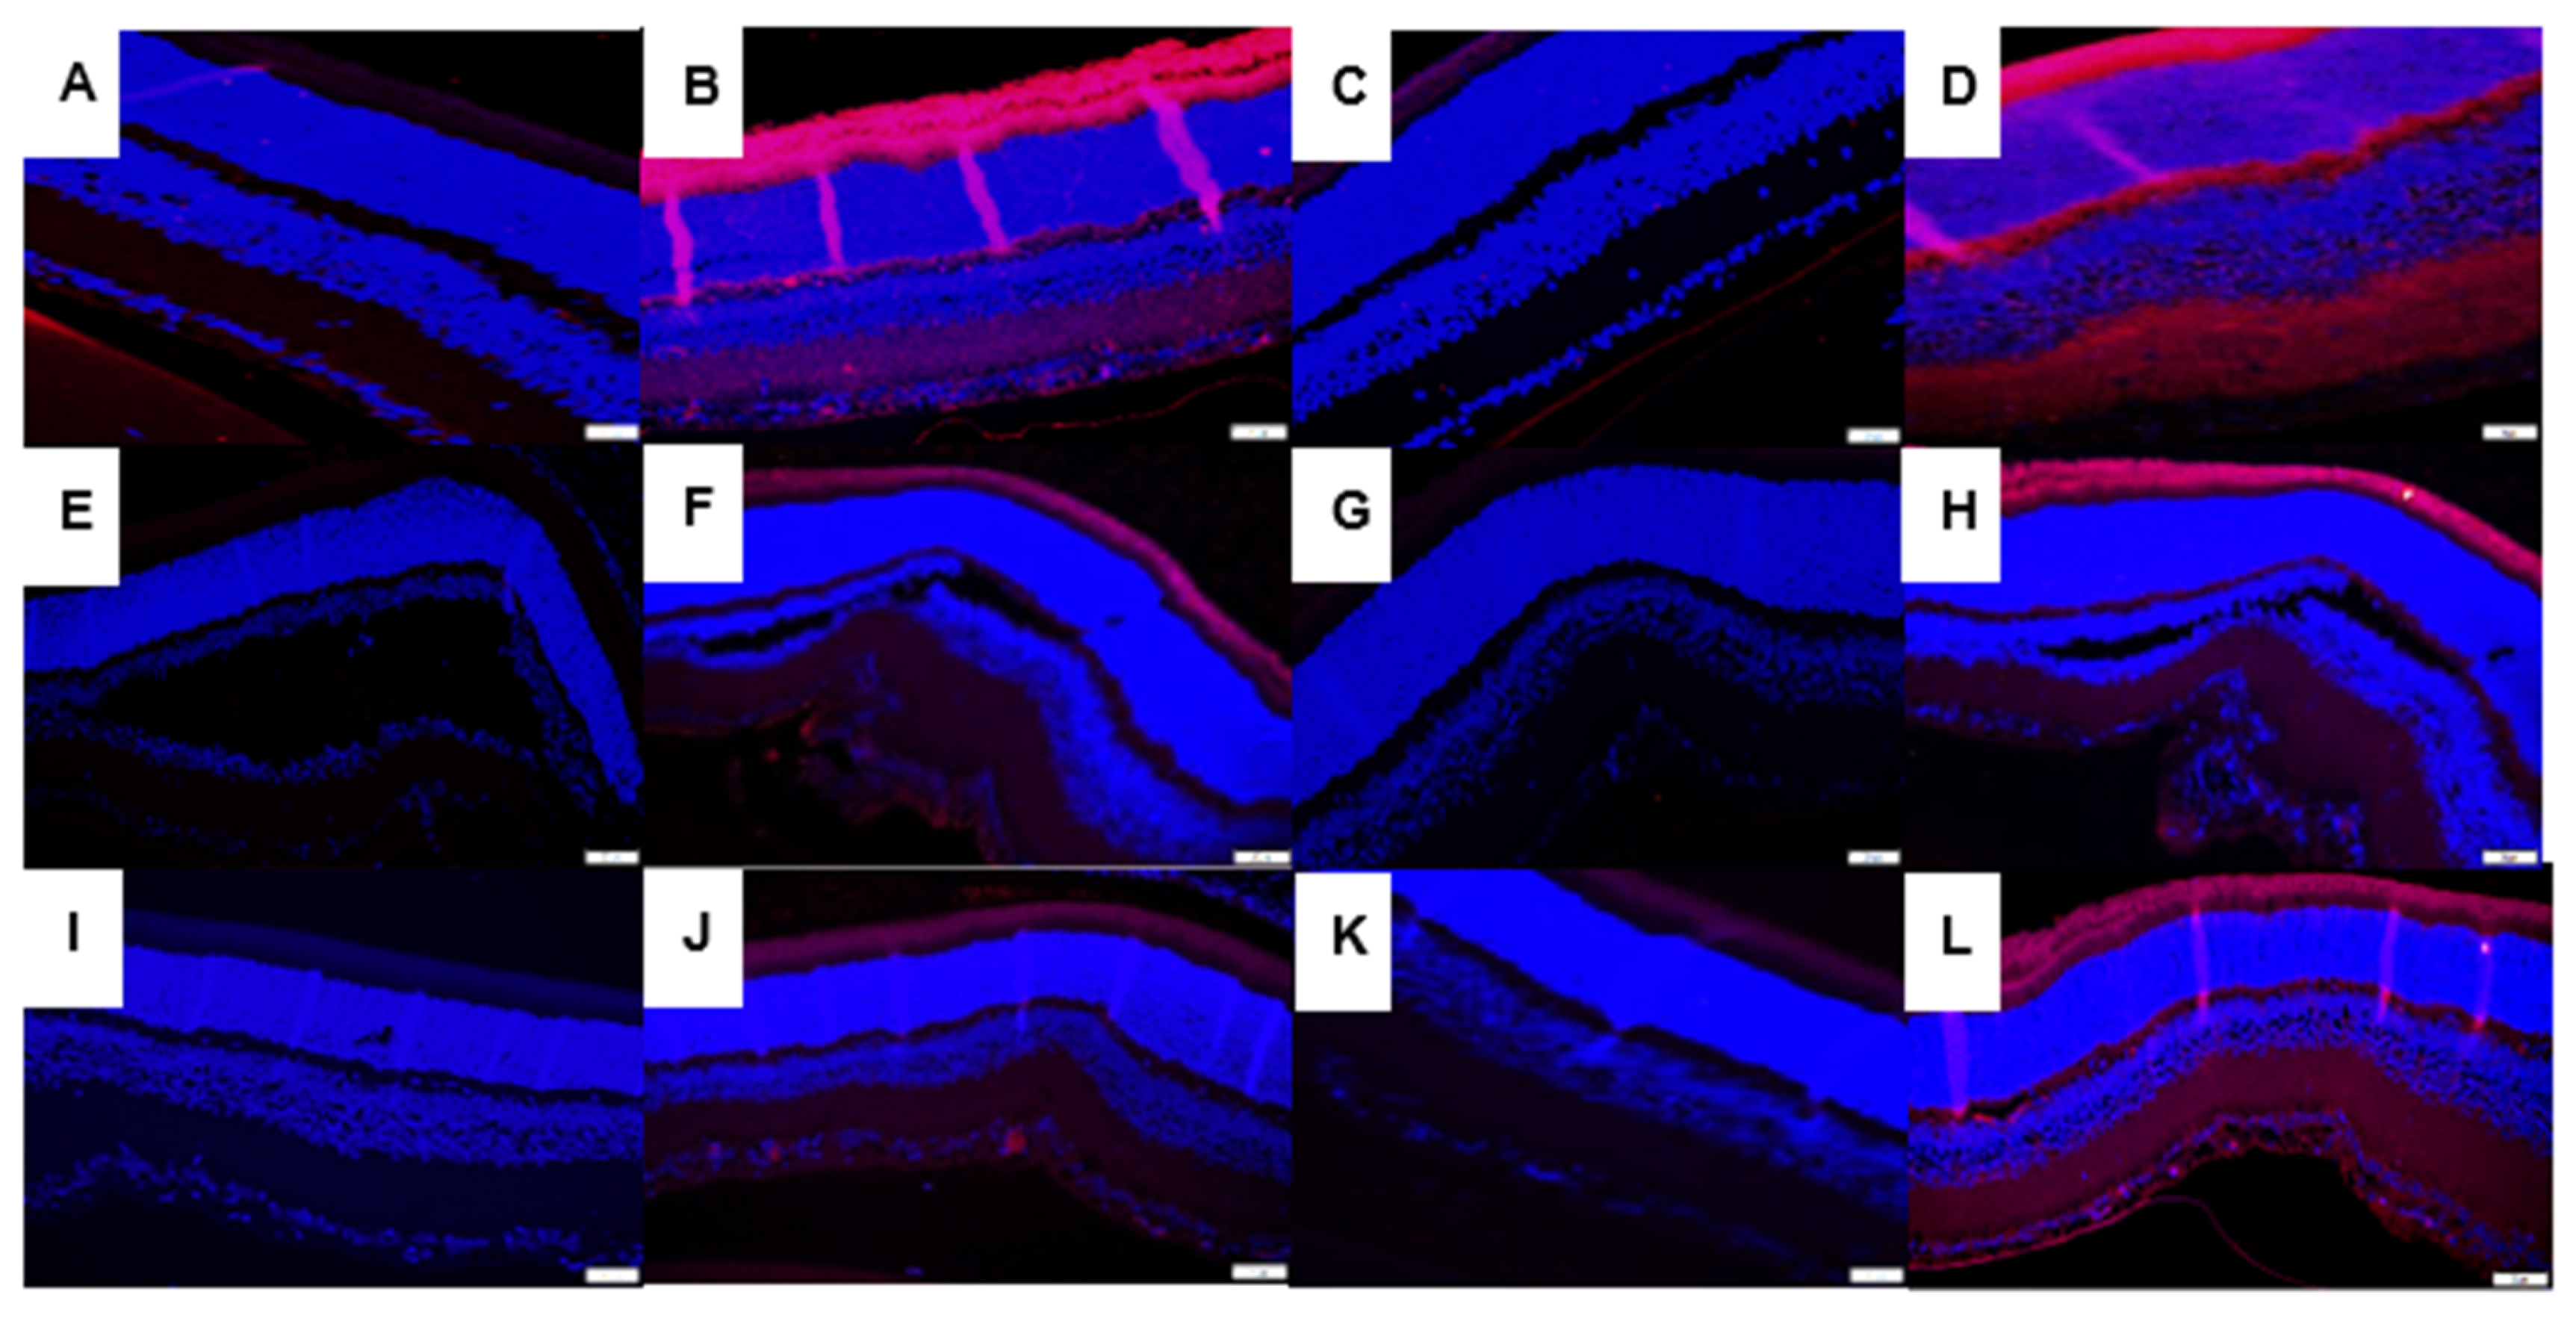
3.7. Immunofluorescence
3.8. Mitochondrial RT2 Profiler PCR Array in the Retina
4. Discussion
5. Conclusions
Supplementary Materials
Author Contributions
Funding
Institutional Review Board Statement
Informed Consent Statement
Data Availability Statement
Conflicts of Interest
Ethics Statement
References
- Phelps, D.L. Retinopathy of Prematurity: History, Classification, and Pathophysiology. NeoReviews 2001, 2, 153e–166e. [Google Scholar] [CrossRef] [Green Version]
- Wheatley, C.M. Retinopathy of prematurity: Recent advances in our understanding. Arch. Dis. Child Fetal Neonatal. Ed. 2002, 87, 78F–82F. [Google Scholar] [CrossRef] [Green Version]
- Gilbert, C. Retinopathy of prematurity: A global perspective of the epidemics, population of babies at risk and implications for control. Early Hum. Dev. 2008, 84, 77–82. [Google Scholar] [CrossRef] [PubMed]
- Good, W.V.; Hardy, R.J.; Dobson, V.; Palmer, E.A.; Phelps, D.L.; Quintos, M.; Tung, B. The Incidence and course of retinopathy of prematurity: Findings from the early treatment for retinopathy of prematurity study. Pediatrics 2005, 116, 15–23. [Google Scholar] [PubMed]
- Schaffer, D.B.; Palmer, E.A.; Plotsky, D.F.; Metz, H.S.; Flynn, J.T.; Tung, B.; Hardy, R.J. Prognostic factors in the natural course of retinopathy of prematurity. Ophthalmology 1993, 100, 230–237. [Google Scholar] [CrossRef] [PubMed]
- Cringle, S.J.; Yu, D.Y. Oxygen supply and consumption in the retina: Implications for studies of retinopathy of prematurity. Doc. Ophthalmol. 2009, 120, 99–109. [Google Scholar] [CrossRef]
- Kinsey, V.E. Retrolental fibroplasia; cooperative study of retrolental fibroplasia and the use of oxygen. AMA Arch. Ophthalmol. 1956, 56, 481–543. [Google Scholar] [CrossRef]
- Di Fiore, J.M.; Martin, R.J.; Gauda, E.B. Apnea of prematurity—Perfect storm. Respir. Physiol. Neurobiol. 2013, 189, 213–222. [Google Scholar] [CrossRef]
- Ruehland, W.R.; Rochford, P.D.; O’Donoghue, F.J.; Pierce, R.J.; Singh, P.; Thornton, A.T. The new AASM criteria for scoring hypopneas: Impact on the apnea hypopnea index. Sleep 2009, 32, 150–157. [Google Scholar] [CrossRef] [Green Version]
- Inayat, M.; Bany-Mohammed, F.; Valencia, A.; Tay, C.; Jacinto, J.; Aranda, J.V.; Beharry, K.D. Antioxidants and biomarkers of oxidative stress in preterm infants with symptomatic patent ductus arteriosus. Am. J. Perinatol. 2015, 32, 895–904. [Google Scholar] [CrossRef]
- Kehrer, J.P. The Haber-Weiss reaction and mechanisms of toxicity. Toxicology 2000, 149, 43–50. [Google Scholar] [CrossRef]
- Bielski, B.H.; Arudi, R.L.; Sutherland, M.W. A study of the reactivity of HO2/O2- with unsaturated fatty acids. J. Biol. Chem. 1993, 258, 4759–4761. [Google Scholar] [CrossRef]
- Bagch, I.D.; Bagchi, M.; Hassoun, E.A.; Stohs, S.J. Cadmium-induced excretion of urinary lipid metabolites, DNA damage, glutathione depletion, and hepatic lipid peroxidation in Sprague-Dawley rats. Biol. Trace Elem. Res. 1996, 52, 143–154. [Google Scholar] [CrossRef]
- Martin, C.R.; DaSilva, D.A.; Cluette-Brown, J.E.; Dimonda, C.; Hamill, A.; Bhutta, A.Q.; Coronel, E.; Wilschanski, M.; Stephens, A.J.; Driscoll, D.F.; et al. Decreased postnatal docosahexaenoic and arachidonic acid blood levels in premature infants are associated with neonatal morbidities. J. Pediatr. 2011, 159, 743–749. [Google Scholar] [CrossRef] [Green Version]
- Zhang, P.P.; Lavoie, M.; Lacaze-Masmonteil, T.; Rhainds, M.; Marc, I. Omega-3 Long-chain polyunsaturated fatty acids for extremely preterm infants: A systematic review. Pediatrics 2014, 13, 120–134. [Google Scholar] [CrossRef] [PubMed] [Green Version]
- Saugstad, O.D. Oxidative stress in the newborn—A 30-year perspective. Neonatology 2005, 88, 228–236. [Google Scholar] [CrossRef] [PubMed]
- Sarmiento, A.; Diaz-Castro, J.; Pulido-Moran, M.; Kajarabille, N.; Guisado, R.; Ochoa, J.J. Coenzyme Q10 supplementation and exercise in healthy humans: A systematic review. Curr. Drug Metab. 2016, 17, 345–358. [Google Scholar] [CrossRef]
- Beharry, K.; Cai, C.; Henry, M.; Chowdhury, S.; Valencia, G.B.; Aranda, J.V. Co-Enzyme Q10 and n-3 polyunsaturated fatty acid supplementation reverse intermittent hypoxia-induced growth restriction and improved antioxidant profiles in neonatal rats. Antioxidants 2017, 6, 103. [Google Scholar] [CrossRef] [Green Version]
- Beharry, K.D.; Cai, C.L.; Siddiqui, F.; Chowdhury, S.; D’Agrosa, C.; Valencia, G.B.; Aranda, J.V. Comparative Effects of Coenzyme Q10 or n-3 Polyunsaturated Fatty Acid Supplementation on Retinal Angiogenesis in a Rat Model of Oxygen-Induced Retinopathy. Antioxidants 2018, 7, 160. [Google Scholar] [CrossRef] [Green Version]
- Beharry, K.D.; Cai, C.L.; Skelton, J.; Siddiqui, F.; D’Agrosa, C.; Calo, J.; Valencia, G.B.; Aranda, J.V. Oxygen-induced retinopathy from recurrent intermittent hypoxia is not dependent on resolution with room air or oxygen, in neonatal rats. Int. J. Mol. Sci. 2018, 19, 1337. [Google Scholar] [CrossRef] [PubMed] [Green Version]
- Aranda, J.V.; Cai, C.L.; Ahmad, T.; Bronshtein, V.; Sadeh, J.; Valencia, G.B.; Lazzaro, D.R.; Beharry, K.D. Pharmacologic synergism of ocular ketorolac and systemic caffeine citrate in rat oxygen-induced retinopathy. Pediatr. Res. 2016, 80, 554–565. [Google Scholar] [CrossRef] [Green Version]
- Beharry, K.D.; Cai, C.L.; Sharma, P.; Bronshtein, V.; Valencia, G.B.; Lazzaro, D.R.; Aranda, J.V. Hydrogen peroxide accumulation in the choroid during intermittent hypoxia increases risk of severe oxygen-induced retinopathy in neonatal rats. Investig. Opthalmol. Vis. Sci. 2013, 54, 7644–7657. [Google Scholar] [CrossRef] [Green Version]
- Montuschi, P.; Barnes, P.J.; Roberts, L.J. Isoprostanes: Markers and mediators of oxidative stress. FASEB J. 2004, 18, 1791–1800. [Google Scholar] [CrossRef] [PubMed]
- Marinho, H.S.; Real, C.; Cyrne, L.; Soares, H.; Antunes, F. Hydrogen peroxide sensing, signaling and regulation of transcription factors. Redox Biol. 2014, 2, 535–562. [Google Scholar] [CrossRef] [PubMed] [Green Version]
- Zelko, I.N.; Mariani, T.J.; Folz, R.J. Superoxide dismutase multigene family: A comparison of the CuZn-SOD (SOD1), Mn-SOD (SOD2), and EC-SOD (SOD3) gene structures, evolution, and expression. Free Radic. Biol. Med. 2002, 33, 337–349. [Google Scholar] [CrossRef] [PubMed]
- Semenza, G.L. Oxygen-dependent regulation of mitochondrial respiration by hypoxia-inducible factor 1. Biochem. J. 2007, 405, 1–9. [Google Scholar] [CrossRef] [Green Version]
- Sies, H. Glutathione and its role in cellular functions. Free Radic. Biol. Med. 1999, 27, 916–921. [Google Scholar] [CrossRef]
- Bains, J.S.; Shaw, C.A. Neurodegenerative disorders in humans: The role of glutathione in oxidative stress-mediated neuronal death. Brain Res. Rev. 1997, 25, 335–358. [Google Scholar] [CrossRef]
- Pawlik, D.; Lauterbach, R.; Turyk, E. Fish-oil fat emulsion supplementation may reduce the risk of severe retinopathy in VLBW infants. Pediatrics 2011, 127, 223–228. [Google Scholar] [CrossRef]
- Ozsurekci, Y.; Aykac, K. Oxidative stress related diseases in newborns. Oxid. Med. Cell Longev. 2016, 2016, 2768365. [Google Scholar] [CrossRef] [Green Version]
- Murphy, M.P. How mitochondria produce reactive oxygen species. Biochem. J. 2008, 417, 1–13. [Google Scholar] [CrossRef] [PubMed] [Green Version]
- Jalilov, A.S.; Zhang, C.; Samuel, E.L.; Sikkema, W.K.; Wu, G.; Berka, V.; Kent, T.A.; Tsai, A.L.; Tour, J.M. Mechanistic study of the conversion of superoxide to oxygen and hydrogen peroxide in carbon nanoparticles. ACS Appl. Mater. Interfaces 2016, 8, 15086–15092. [Google Scholar] [CrossRef] [PubMed]
- Wong, H.-S.; Dighe, P.A.; Mezera, V.; Monternier, P.A.; Brand, M.D. Production of superoxide and hydrogen peroxide from specific mitochondrial sites under different bioenergetic conditions. J. Biol. Chem. 2017, 292, 16804–16809. [Google Scholar] [CrossRef] [Green Version]
- Ashton, N.; Ward, B.; Serpell, G. Effect of oxygen on developing retinal vessels with particular reference to the problem of retrolental fibroplasia. Br. J. Ophthalmol. 1954, 38, 397–432. [Google Scholar] [CrossRef] [PubMed] [Green Version]
- Kim, B.; Kusibati, R.; Heisler-Taylor, T.; Mantopoulos, D.; Ding, J.; Abdel-Rahman, M.H.; Satoskar, A.R.; Godbout, J.P.; Bhattacharya, S.K.; Cebulla, C.M. MIF Inhibitor ISO-1 Protects Photoreceptors and Reduces Gliosis in Experimental Retinal Detachment. Sci. Rep. 2017, 7, 14336. [Google Scholar] [CrossRef] [Green Version]
- Romano, M.R.; Biagioni, F.; Besozzi, G.; Carrizzo, A.; Vecchione, C.; Fornai, F.; Lograno, M.D. Effects of bevacizumab on neuronal viability of retinal ganglion cells in rats. Brain Res. 2012, 1478, 55–63. [Google Scholar] [CrossRef]
- Bhagavan, H.N.; Chopra, R.K. Coenzyme Q10: Absorption, tissue uptake, metabolism and pharmacokinetics. Free Radic. Res. 2006, 40, 445–453. [Google Scholar] [CrossRef] [PubMed]
- Yiyi, Z.; Liisa, A.; Åberg, F.; Eeva, A.; Ernster, L. Uptake of dietary coenzyme Q supplement is limited in rats. J. Nutr. 1995, 125, 446–453. [Google Scholar]
- Lee, D.; Shim, M.S.; Kim, K.Y.; Noh, Y.H.; Kim, H.; Kim, S.Y.; Weinreb, R.N.; Ju, W.K. Coenzyme Q10 inhibits glutamate excitotoxicity and oxidative stress–mediated mitochondrial alteration in a mouse model of glaucoma. Investig. Opthalmol. Vis. Sci. 2014, 55, 993–1005. [Google Scholar] [CrossRef] [Green Version]
- Miller, A.-F. Superoxide dismutases: Ancient enzymes and new insights. FEBS Lett. 2011, 586, 585–595. [Google Scholar] [CrossRef] [PubMed] [Green Version]
- Jivabhai Patel, S.; Bany-Mohammed, F.; McNally, L.; Valencia, G.B.; Lazzaro, D.R.; Aranda, J.V.; Beharry, K.D. Exogenous superoxide dismutase mimetic without scavenging H2O2 causes photoreceptor damage in a rat model for oxygen-induced retinopathy. Investig. Ophthalmol. Vis. Sci. 2015, 56, 1665–1677. [Google Scholar] [CrossRef] [PubMed] [Green Version]
- Parad, R.B.; Allred, E.N.; Rosenfeld, W.N.; Davis, J.M. Reduction of retinopathy of prematurity in extremely low gestational age newborns treated with recombinant human Cu/Zn superoxide dismutase. Neonatology 2012, 102, 139–144. [Google Scholar] [CrossRef] [PubMed]
- Lisanti, M.P.; Martinez-Outschoorn, U.E.; Lin, Z.; Pavlides, S.; Whitaker-Menezes, D.; Pestell, R.G.; Howell, A.; Sotgia, F. Hydrogen peroxide fuels aging, inflammation, cancer metabolism and metastasis: The seed and soil also needs “fertilizer”. Cell Cycle 2011, 10, 2440–2449. [Google Scholar] [CrossRef] [PubMed] [Green Version]
- Yoon, H.H.; Lee, M.S.; Kang, J.H. Reaction of ferritin with hydrogen peroxide induces lipid peroxidation. BMB Rep. 2010, 43, 219–224. [Google Scholar] [CrossRef] [PubMed] [Green Version]
- Kobayashi, S.; Ueda, K.; Komano, T. The effects of metal ions on the DNA damage induced by hydrogen peroxide. Agric. Biol. Chem. 1990, 4, 69–76. [Google Scholar]
- Papp, A.; Németh, I.; Karg, E.; Papp, E. Glutathione status in retinopathy of prematurity. Free Radic. Biol. Med. 1999, 27, 738–743. [Google Scholar] [CrossRef]
- Tan, S.M.; Stefanovic, N.; Tan, G.; Wilkinson-Berka, J.L.; de Haan, J.B. Lack of the antioxidant glutathione peroxidase-1 (GPx1) exacerbates retinopathy of prematurity in mice. Investig. Ophthalmol. Vis. Sci. 2013, 54, 555–562. [Google Scholar] [CrossRef] [Green Version]


| HIF1α | VEGF | SOD-1 | SOD-2 | SOD-3 | Catalase | |
|---|---|---|---|---|---|---|
| RA: | ||||||
| Olive Oil | 529.8 ± 140.2 | 907.3 ± 199.0 | 949.6 ± 95.4 | 619.9 ± 64.4 | 674.3 ± 147.6 | 715.6 ± 91.2 |
| CoQ10 | 133.1 ± 13.3 * | 869.2 ± 121.2 | 989.5 ± 90.8 | 919.2 ± 147.9 | 468.1 ± 99.7 | 283.8 ± 51.2 ** |
| Fish Oil | 1029.3 ± 108.6 ** | 1958.0 ± 153.9 ** | 1599.7 ± 155.5 ** | 661.0 ± 123.9 | 945.0 ± 54.9 | 852.7 ± 123.8 |
| 50/12% IH: | ||||||
| Olive Oil | 1399.1 ± 230.1 ## | 1150.1 ± 164.6 | 1297.5 ± 45.5 # | 1257.0 ± 191.9 ## | 1337.7 ± 134.9 ## | 1997.2 ± 173.1## |
| CoQ10 | 276.6 ± 51.9 **# | 471.5 ± 46.1 **## | 1242.3 ± 86.9 | 712.6 ± 56.1 * | 115.6 ± 18.7 **## | 160.6 ± 15.5 **# |
| Fish Oil | 1329.6 ± 219.0 | 1445.8 ± 112.1 ## | 985.0 ± 110.4 *## | 874.4 ± 126.8 | 770.0 ± 88.5 ** | 650.3 ± 125.9 ** |
| 21/12% IH: | ||||||
| Olive Oil | 1145.8 ± 36.8 # | 1456.4 ± 96.4 | 1475.8 ± 128.2 ## | 1308.8 ± 63.2 ## | 970.3 ± 66.2 | 830.3 ± 122.8 |
| CoQ10 | 257.1 ± 28.5 **# | 457.7 ± 47.9 **## | 1276.6 ± 75.4 # | 1144.2 ± 124.2 | 204.6 ± 14.9 **## | 150.2 ± 12.5 **# |
| Fish Oil | 869.1 ± 84.0 ** | 1077.4 ± 83.5 **## | 1120.1 ± 81.8 *# | 1034.8 ± 79.1 # | 576.0 ± 54.8 **## | 877.6 ± 137.9 |
| Genes of Interest | CoQ10 RA | Fish Oil RA | Olive Oil 50/12% | CoQ10 50/12% | Fish Oil 50/12% | Olive Oil 21/12% | CoQ10 21/12% | Fish Oil 21/12% |
|---|---|---|---|---|---|---|---|---|
| Membrane Polarization and Potential: | ||||||||
| Bnip3 | −1.4 ± 0.09 | 23.9 ± 0.2 | 11.9 ± 0.2 | 17.8 ± 0.06 | 15.4 ± 0.16 | 21.9 ± 0.64 | 32.9 ± 0.68 | 20.1 ± 0.18 |
| Gclc | 10.1 ± 0.36 | 4.7 ± 0.56 | 2.4 ± 0.37 | 14.1 ± 0.68 | 3.3 ± 0.53 | 4.4 ± 0.82 | 8.5 ± 0.48 | 3.9 ± 0.59 |
| Gclm | 9.6 ± 0.35 | 4.6 ± 0.35 | 3.4 ± 0.3 | 7.8 ± 0.34 | 5.7 ± 0.33 | 7.9 ± 0.39 | 13.2 ± 0.35 | 8.0 ± 0.3 |
| Sod1 | 10.7 ± 0.32 | 2.3 ± 0.36 | 4.1 ± 0.27 | 9.6 ± 0.34 | 8.3 ± 0.39 | 6.0 ± 0.28 | 11.9 ± 0.31 | 7.9 ± 0.3 |
| Mitochondrial Transport and Targeting Proteins to Mitochondria: | ||||||||
| Grpel1 | −1.4 ± 0.17 | 11.5 ± 0.24 | 8.6 ± 0.46 | 10.0 ± 0.22 | 9.2 ± 0.31 | 12.6 ± 0.46 | 17.7 ± 0.33 | 10.0 ± 0.24 |
| Hsp90aa1 | 2.9 ± 0.03 * | 11.3 ± 0.08 | 5.3 ± 0.05 * | 8.7 ± 0.04 * | 9.8 ± 0.09 | 9.8 ± 0.08 | 15.5 ± 0.07 | 11.0 ± 0.08 |
| Hspd1 | −1.6 ± 0.28 | 38.2 ± 0.95 | 11.8 ± 0.31 | 21.9 ± 0.35 | 26.7 ± 0.71 | 29.2 ± 0.77 | 46.6 ± 0.83 | 6.5 ± 0.05 * |
| Mfn2 | 7.0 ± 0.53 | 11.1 ± 0.4 | 5.6 ± 0.41 | 9.5 ± 0.39 | 8.7 ± 0.44 | 9.9 ± 0.46 | 14.3 ± 0.42 | 8.9 ± 0.38 |
| Mipep | 4.0 ± 39 | 8.3 ± 0.39 | 5.1 ± 0.41 | 6.2 ± 0.36 | 5.2 ± 0.37 | 7.4 ± 0.41 | 10.3 ± 0.38 | 5.7 ± 0.35 |
| Mtx2 | −1.2 ± 18 | 13.6 ± 0.29 | 6.7 ± 0.31 | 12.3 ± 0.42 | 11.1 ± 0.28 | 9.7 ± 0.42 | 17.9 ± 0.33 | 11.1 ± 0.27 |
| Timm10 | 12.2 ± 0.85 | 6.4 ± 0.78 | 13.7 ± 0.02 * | 21.0 ± 0.36 | 18.2 ± 0.24 | 13.1 ± 0.01 * | 26.3 ± 0.11 | 19.5 ± 0.42 |
| Ucp1 | 11.2 ± 0.37 | −1.8 ± 0.3 | −1.1 ± 0.7 | 4.9 ± 0.4 | −1.7 ± 0.59 | 4.8 ± 0.93 | 10.6 ± 0.25 | −1.8 ± 0.36 |
| Ucp2 | 3.6 ± 0.42 | 4.4 ± 0.37 | 2.7 ± 0.38 | 4.9 ± 0.73 | 3.4 ± 0.63 | 2.7 ± 0.43 | 8.9 ± 0.19 | 2.2 ± 0.49 |
| Ucp3 | −1.9 ± 0.35 | −1.1 ± 0.38 | 1.8 ± 0.27 | 2.2 ± 0.46 | −1.8 ± 0.33 | 4.7 ± 0.19 | 2.3 ± 0.38 | −2.0 ± 0.42 |
| Small Molecule Transport: | ||||||||
| Slc25a12 | 8.4 ± 0.62 | 23.9 ± 0.8 | 8.9 ± 0.57 | 13.2 ± 0.49 | 12.1 ± 0.59 | 12.1 ± 0.54 | 20.1 ± 0.54 | 10.1 ± 0.41 |
| Slc25a14 | 2.6 ± 0.28 | 10.5 ± 0.36 | 5.5 ± 0.37 | 8.8 ± 0.35 | 8.4 ± 0.41 | 8.8 ± 0.4 | 12.3 ± 0.35 | 9.2 ± 0.36 |
| Slc25a16 | 3.2 ± 0.3 | 12.3 ± 0.41 | 5.3 ± 0.36 | 9.2 ± 0.39 | 8.0 ± 0.38 | 8.5 ± 0.37 | 13.6 ± 0.35 | 8.8 ± 0.28 |
| Slc25a17 | 1.5 ± 0.24 | 14.5 ± 0.42 | 7.3 ± 0.43 | 11.1 ± 0.36 | 11.3 ± 0.52 | 10.4 ± 0.41 | 16.6 ± 0.39 | 12.9 ± 0.43 |
| Slc25a22 | 6.8 ± 0.55 | 12.0 ± 0.44 | 7.0 ± 0.48 | 9.7 ± 0.44 | 7.6 ± 0.43 | 8.1 ± 0.38 | 13.1 ± 0.4 | 5.6 ± 0.56 |
| Slc25a23 | 10.7 ± 0.89 | 21.8 ± 0.67 | 17.8 ± 0.05 * | 21.4 ± 0.86 | 22.6 ± 0.09 | 22.9 ± 0.2 | 34.7 ± 0.43 | 15.8 ± 0.16 |
| Slc25a27 | 4.3 ± 0.33 | 11.3 ± 0.37 | 6.7 ± 0.41 | 7.7 ± 0.3 | 8.1 ± 0.38 | 8.5 ± 0.36 | 13.9 ± 0.36 | 4.5 ± 0.39 |
| Slc25a3 | 58.2 ± 0.01 * | 15.0 ± 0.01 * | 24.7 ± 0.05 * | 43.4 ± 0.06 * | 30.6 ± 0.01 * | 27.4 ± 0.04 * | 41.7 ± 0.05 * | 6.1 ± 0.02 * |
| Slc25a36 | 1.2 ± 0.22 | 18.2 ± 0.57 | 8.2 ± 0.53 | 9.2 ± 0.37 | 10.0 ± 0.49 | 7.2 ± 0.37 | 14.2 ± 0.39 | 11.6 ± 0.39 |
| Slc25a4 | 3.1 ± 0.3 | 28.7 ± 0.05 * | 14.5 ± 0.01 * | 23.3 ± 0.03 * | 20.9 ± 0.01 * | 16.2 ± 0.01 * | 34.7 ± 0.01 * | 25.0 ± 0.01 * |
| Slc25a5 | 6.3 ± 0.83 | 20.5 ± 0.6 | 12.4 ± 0.97 | 18.6 ± 0.69 | 14.9 ± 0.77 | 13.2 ± 0.47 | 33.0 ± 0.84 | 18.2 ± 0.68 |
| Mitochondrial Protein Import: | ||||||||
| Cav2 | −4.4 ± 0.16 | 12.1 ± 0.3 | 5.4 ± 0.26 | 9.7 ± 0.41 | 10.2 ± 0.31 | 9.2 ± 0.24 | 12.1 ± 0.64 | 8.1 ± 0.22 |
| Gpx1 | 11.3 ± 0.8 | 13.2 ± 0.7 | 9.3 ± 0.12 | 20.5 ± 0.01 * | 11.5 ± 0.05 * | 16.0 ± 0.35 | 17.8 ± 0.03 * | 14.0 ± 0.05 * |
| Grpel1 | −1.4 ± 0.17 | 11.5 ± 0.24 | 8.6 ± 0.46 | 10.0 ± 0.23 | 9.2 ± 0.31 | 12.6 ± 0.46 | 17.7 ± 0.33 | 10.0 ± 0.24 |
| Hspd1 | −1.6 ± 0.28 | 38.2 ± 0.05 * | 11.8 ± ±0.31 | 21.9 ± 0.35 | 26.7 ± 0.71 | 29.2 ± 0.03 * | 46.6 ± 0.03 * | 6.5 ± 0.53 |
| Mipep | 4.0 ± 39 | 8.3 ± 0.39 | 5.1 ± 0.41 | 6.2 ± 0.36 | 5.2 ± 0.37 | 7.4 ± 0.41 | 10.3 ± 0.38 | 5.7 ± 0.35 |
| Ppargc1a | 4.0 ± 0.19 | 10.6 ± 0.23 | 5.0 ± 0.19 | 10.2 ± 0.23 | 11.1 ± 0.42 | 8.7 ± 0.23 | 13.6 ± 0.22 | 9.7 ± 0.22 |
| Sh3glb1 | 12.5 ± 0.64 | 29.0 ± 0.01 * | 11.5 ± 0.01 * | 23.2 ± 0.65 | 21.6 ± 0.01 * | 19.4 ± 0.57 | 32.0 ± 0.8 | 21.3 ± 0.12 |
| Timm10 | 12.2 ± 0.85 | 6.4 ± 0.78 | 13.7 ± 0.02 * | 21.0 ± 0.36 | 18.2 ± 0.24 | 13.1 ± 0.01 * | 26.3 ± 0.11 | 19.5 ± 0.42 |
| Outer Membrane Translocation | ||||||||
| Tomm22 | 6.0 ± 0.38 | 4.4 ± 0.37 | 7.0 ± 0.53 | 12.3 ± 0.61 | 11.3 ± 0.49 | 12.6 ± 0.5 | 16.7 ± 0.36 | 12.3 ± 0.38 |
| Tomm34 | 4.0 ± 0.34 | 19.6 ± 0.38 | 14.8 ± 0.03 * | 3.7 ± 0.4 | 7.0 ± 0.41 | 18.0 ± 0.03 * | 8.1 ± 0.36 | 7.2 ± 0.5 |
| Tomm40 | 3.0 ± 0.39 | 6.0 ± 0.37 | 5.5 ± 0.44 | 6.8 ± 0.4 | 4.0 ± 0.38 | 11.1 ± 0.41 | 9.5 ± 0.4 | 3.9 ± 0.36 |
| Tomm70 | 6.4 ± 0.34 | 17.4 ± 0.47 | 9.1 ± 0.5 | 13.5 ± 0.36 | 11.9 ± 0.48 | 11.6 ± 0.47 | 16.4 ± 0.28 | 11.3 ± 0.38 |
| Inner Membrane Translocation: | ||||||||
| Immp1l | 1.9 ± 0.17 | 16.7 ± 0.43 | 5.9 ± 0.22 | 12.0 ± 0.29 | 12.0 ± 0.47 | 5.0 ± 0.11 | 17.1 ± 0.29 | 7.9 ± 0.16 |
| Opa1 | 1.8 ± 0.07 | 26.8 ± 0.58 | 12.5 ± 0.01 * | 21.1 ± 0.01 * | 19.3 ± 0.01 * | 21.3 ± 0.01 * | 30.4 ± 0.01 * | 28.2 ± 0.01 * |
| Timm10 | 12.2 ± 0.85 | 6.4 ± 0.78 | 13.7 ± 0.02 * | 21.0 ± 0.36 | 18.2 ± 0.24 | 13.1 ± 0.01 * | 26.3 ± 0.11 | 19.5 ± 0.42 |
| Timm17a | 6.0 ± 0.46 | 11.3 ± 0.38 | 6.2 ± 0.42 | 8.9 ± 0.36 | 7.5 ± 0.39 | 8.1 ± 0.38 | 10.7 ± 0.33 | 7.5 ± 0.34 |
| Timm22 | 6.4 ± 0.53 | 13.8 ± 0.43 | 6.6 ± 0.43 | 10.6 ± 0.4 | 8.8 ± 0.42 | 9.0 ± 0.4 | 14.8 ± 0.51 | 9.4 ± 0.38 |
| Timm44 | 3.3 ± 0.33 | 10.1 ± 0.45 | 6.5 ± 0.42 | 9.2 ± 0.39 | 6.1 ± 0.36 | 9.8 ± 0.43 | 11.1 ± 0.36 | 8.6 ± 0.38 |
| Timm8a1 | 8.1 ± 0.41 | 18.1 ± 0.25 | 8.2 ± 0.17 | 17.2 ± 0.36 | 12.7 ± 0.32 | 10.6 ± 0.11 | 21.2 ± 0.22 | 14.8 ± 0.31 |
| Timm8b | 2.2 ± 0.56 | 15.2 ± 0.75 | 35.2 ± 0.05 * | 14.7 ± 0.86 | 10.8 ± 0.63 | 20.0 ± 0.04 * | 14.8 ± 0.66 | 12.8 ± 0.48 |
| Timm9 | 3.0 ± 0.21 | 13.4 ± 0.34 | 5.1 ± 0.27 | 11.7 ± 0.36 | 8.8 ± 0.53 | 6.7 ± 0.49 | 13.1 ± 0.36 | 7.0 ± 0.38 |
| Apoptosis: | ||||||||
| Bnip3 | −1.4 ± 0.09 | 23.9 ± 0.2 | 11.9 ± 0.2 | 17.8 ± 0.06 | 15.4 ± 0.16 | 21.9 ± 0.64 | 32.9 ± 0.68 | 20.1 ± 0.18 |
| Dnm1l | 4.7 ± 0.16 | 19.6 ± 0.45 | 10.1 ± 0.49 | 18.8 ± 0.36 | 16.1 ± 0.35 | 14.5 ± 0.4 | 21.7 ± 0.32 | 16.2 ± 0.29 |
| Gpx1 | 11.3 ± 0.8 | 13.2 ± 0.07 * | 9.3 ± 0.12 | 20.5 ± 0.06 * | 11.5 ± 0.7 | 16.0 ± 0.35 | 17.9 ± 0.03 * | 14.0 ± 0.05 * |
| Sh3glb1 | 12.5 ± 0.64 | 29.0 ± 0.01 * | 11.5 ± 0.01 * | 23.2 ± 0.65 | 21.6 ± 0.01 * | 19.4 ± 0.57 | 32.0 ± 0.8 | 21.3 ± 0.12 |
| Sod2 | 11.4 ± 0.64 | 14.5 ± 0.48 | 25.2 ± 0.07 | 22.5 ± 0.09 | 26.9 ± 0.07 | 30.9 ± 0.01 | 20.6 ± 0.06 * | 28.4 ± 0.03 * |
| P53 | 4.6 ± 0.46 | 9.8 ± 0.4 | 4.4 ± 0.39 | 6.2 ± 0.37 | 6.7 ± 0.39 | 6.0 ± 0.38 | 10.1 ± 0.53 | 6.6 ± 0.75 |
Disclaimer/Publisher’s Note: The statements, opinions and data contained in all publications are solely those of the individual author(s) and contributor(s) and not of MDPI and/or the editor(s). MDPI and/or the editor(s) disclaim responsibility for any injury to people or property resulting from any ideas, methods, instructions or products referred to in the content. |
© 2023 by the authors. Licensee MDPI, Basel, Switzerland. This article is an open access article distributed under the terms and conditions of the Creative Commons Attribution (CC BY) license (https://creativecommons.org/licenses/by/4.0/).
Share and Cite
Siddiqui, F.; Cai, C.; Aranda, J.V.; Beharry, K.D. Coenzyme Q10 and Fish Oil Supplementation for Reducing Retinal Oxidative Stress in a Rat Model. Vision 2023, 7, 20. https://doi.org/10.3390/vision7010020
Siddiqui F, Cai C, Aranda JV, Beharry KD. Coenzyme Q10 and Fish Oil Supplementation for Reducing Retinal Oxidative Stress in a Rat Model. Vision. 2023; 7(1):20. https://doi.org/10.3390/vision7010020
Chicago/Turabian StyleSiddiqui, Faisal, Charles Cai, Jacob V. Aranda, and Kay D. Beharry. 2023. "Coenzyme Q10 and Fish Oil Supplementation for Reducing Retinal Oxidative Stress in a Rat Model" Vision 7, no. 1: 20. https://doi.org/10.3390/vision7010020