Article

Optimization of Extraction Parameters of Anthocyanin Compounds and Antioxidant Properties from Red Grape (Băbească neagră) Peels

by
Daniela Serea
,
Oana Emilia Constantin
,
Georgiana Horincar
,
Nicoleta Stănciuc
,
Iuliana Aprodu
,
Gabriela Elena Bahrim
and
Gabriela Râpeanu
*
Faculty of Food Science and Engineering, Dunărea de Jos University of Galati, 111 Domnească Street, 800201 Galati, Romania
*
Author to whom correspondence should be addressed.
Inventions 2023, 8(2), 59; https://doi.org/10.3390/inventions8020059
Submission received: 30 December 2022 / Revised: 10 February 2023 / Accepted: 22 March 2023 / Published: 27 March 2023

Abstract

:
Using a Central Composite Design, the extraction of bioactive compounds from red grape Băbească neagră peels was optimized by applying a conventional solvent extraction. On the anthocyanin content, total phenolic content, and antioxidant activity (using the DPPH method), the effects of extraction factors, including ethanol and citric acid concentrations, extraction temperature, and duration, were investigated. For each of the investigated parameters, a quadratic model was suggested. The maximum and minimum variables investigated in the coded form of the experimental plan are the concentrations of citric acid (0.10–2.64%), ethanol (38.06–96.93%), operating temperature (13.06–71.90 °C), and extraction time (11.36–78.63 min). The optimal mixture for recovering the most significant amount of polyphenol content and antioxidant activity was 85% ethanol, 0.85% citric acid, 52.14 min, and 57 °C. Based on the experimental approach, the anthocyanin content ranged from 1.71 to 2.74 mg C3G/g DW, the total phenolic content ranged from 24.67 to 43.97 mg/g, and the antioxidant activity ranged from 15.95 to 20.98 mM TE/g DW. Overall, it should be stressed that establishing operating factors to maximize model responses can improve the extraction process and the obtaining of red grape peel value-added extracts for creating functional food products.

1. Introduction

Nowadays, due to the high content of valuable compounds, the wine industry is responsible for the generation of by-products used, in various branches of industry such as animal feed, composting, or ethanol production [1]. About 75% of cultivated grapes are intended for wine production, of which 20–30% represent residual products [2,3]. This waste represents grape pomace which consists of skin, remaining pulp, seeds, and bunch fragments [4]. Grape pomace represents a valuable source of important nutrients. Different studies have presented the use of dried pomace powder for directly fortifying food products such as dairy, meat, and fish [2]. The research on grape pomace may be relevant for industrial reasons due to the rising need for nutraceutical and antioxidant compounds [5]. Increasing demand and production of wines have begun generating increased amounts of grape by-products during the winemaking process such as peel/skin, and their disposal poses a burden on the environment. However, grape skin/peels are stocked with bioactive compounds, favoring the use of these by-products as functional ingredients. The major bioactive compounds in grapes are phenolic acids, flavonoids, anthocyanins, proanthocyanins, and stilbenes [6,7], most concentrated in the skin [8]. The composition of grape peel/skin is variable based on varietal diversity, agronomic conditions of the region in which they were cultivated, and the extraction techniques used [9]. Despite these environmental factors, the bioactive chemicals that remain in the grape skins after winemaking can be extracted [10,11,12]. Those compounds are evaluated as potential antioxidants [13] and food colorants [14]. Given the antioxidant characteristics of grape skin/peel, these compounds can be useful in many foods’ industrial aspects where the prevention of oxidative damage or free radical formation is involved. Therefore, food quality, shelf-life extension, and intelligent packaging could be improved or maintained by developing these characteristics [13].
Among the phenolic compounds present in grapes, flavonoids (flavonols, anthocyanins, flavan-ols, and their derivative proanthocyanidins) are the most abundant physiologically active phytonutrients in grapes with major grape skins and seeds and are involved in the biological activities of grape products [15,16]. Due to their dual functions, anthocyanin pigments play a significant role in grapes and wines. Firstly, their concentration, forms, and derivatives directly affect the finished wine’s color, making them a crucial component of sensory qualities. Secondly, they are thought to possess a variety of biological qualities, such as antioxidant properties, which protect against neurological disorders and exhibit anti-inflammatory, anti-hepatotoxicity, cardioprotective, chemotherapeutic, hepatoprotective, and neuroprotective activity [17,18,19]. The anthocyanins profile from red grapes consists of 3-O-monoglucosides of delphinidin, cyanidin, petunidin, peonidin, and malvidin [20]. Therefore, their extraction and application in different food matrices represent a way of valorizing grape by-products (skins) by obtaining value-added ingredients (natural colorants and antioxidants) in order to replace synthetic food additives [21]. Additionally, phenolic acids can be found in grapes, free or conjugated with sugars, anthocyanins, or condensed tannins [22]. Proanthocyanidins, also known as condensed tannins, are released from both grape skins and seeds and are what give wine its astringent and bitter characteristics [23,24].
Optimizing the extraction process efficiently to maximize the amount of biologically active compounds from the by-products of the food industry is still a scientific concern [9]. Over time, many studies have highlighted different methods of extracting bioactive compounds from the skin of grapes through different extraction techniques [9,25], among them solid–liquid extractions, such as mechanical agitation and solvent extraction (ethanol and methanol extraction). The solvent selection used for the extraction can increase extraction efficiency, time, quality, and solvent consumption. The development and optimization of efficient extraction procedures are essential to improve the extraction of valuable compounds. To improve the extraction process, the following parameters are usually taken into account: matrix, solvent, temperature, pH, liquid–solid ratio, and extraction time [26]. Common methods for extracting phenolic compounds from fruit and vegetables include Soxhlet extraction, maceration, and hydrodistillation, which rely on the effectiveness of various solvents as extractants as well as the use of heat and/or mixing. The selection of a solvent is based on several factors, such as its physicochemical properties, cost, and toxicity. Some solvents, such as ethanol, water, and their mixtures, are designated as “generally recognized as safe”). Moreover, the preferred solvent systems are currently used for natural products [27].
Using a central composite design and response surface methodology (RSM), this study sought to maximize the extraction of phenolic antioxidants from grape skins. A conventional single-factor experiment, which does not consider the interactive effects among the analyzed variables, could not fully show the effects of the parameters on the responses. The screening of a wide variety of factors is possible with response surface methodology based on a central composite design (RSM-CCD), which provides information on the cumulative impact of the factors while helping to lower the cost of the analysis, in addition to evaluating the contribution of each factor [28]. The study used ethanol concentration, acid type, duration, and temperature as our extraction parameters. The dependent variables included total phenolic content (mg GAE/g), total monomeric anthocyanins (mg G3G/g), and DPPH radical scavenging levels (responses). Data on extraction factors having notable impacts on the phenolic antioxidants in grape skins were obtained from single-factor trials. The ideal extraction condition was then more precisely determined by the RSM-CCD analysis of these components. The CCD offers a decent quantity of information for inconsistency testing without requiring many design points, making it perfect for sequential experimentation [29].

2. Materials and Methods

2.1. Reagents and Chemicals

For the chemical characterization of biologically active compounds from red grape skins, we used 96% ethanol, Folin–Ciocâlteu reagent (FC), DPPH (2,2-diphenyl-1-picrylhydrazyl), Trolox (6-hydroxy-2,5,7,8-tetramethylchroman-2-carboxylic acid), methanol (MeOH), potassium chloride solution (KCl), sodium acetate solution (CH3COONa), sodium carbonate (Na2CO3) 20%, and Gallic acid solution which were obtained from Sigma Aldrich (St. Louis, MO, USA).

2.2. Red Grape Skins Preparation

Red grapes from the Băbească neagră variety were purchased from a local market in Galati, Romania (from the 2020 harvest). The grape skins were manually separated, washed with cold water, and rinsed with distilled water at a ratio of 1:2 (w/w). Then, they were wiped with paper towels to remove any residual pulp. The collected skins were freeze-dried using Alpha 1–4 LD plus equipment (CHRIST, Osterode am Harz, Germany) at −42 °C under a pressure of 10 Pa for 48 h. Finally, the dried skins were grounded and stored at 4 °C in a hermetically closed jar until further analysis.

2.3. Extraction of Biologically Active Compounds

A total of 1 g of dried peel grape powder was utilized for the extraction along with 9 mL of the solvent (38.06–96.93% ethanol) and 1 mL of citric acid with a range of concentrations from 0.01 to 2.64%. The extractions took place at 13.06–71.9 °C for 11.36 to 78.6 min using a sonication water bath (MRC Scientific 193 Instruments, Holon, Israel), followed by centrifugation at 5000 rpm for 10 min at 4 °C, and the supernatant was phytochemically analyzed.

2.4. Determination of the Total Anthocyanins Content (TAC)

In order to estimate the total monomeric anthocyanins content (TAC), a modified pH differential method was used [30]. Before the analysis, the samples were diluted (D = 1:10). Then, 200 µL of vegetable extract, and 800 µL of a buffer solution with a pH of 1.0/4.5 were used, and the absorbance of diluted extracts was measured at two distinct wavelengths: 520 nm and 700 nm. The results were expressed as milligrams of cyanidin-3-glucoside (C3G) per gram of dry weight (DW).

2.5. Total Phenolic Compounds Determination

The total phenolic compounds content (TPC) was achieved using the modified method of Dewanto et al. [31]. Briefly, a mixture was obtained by adding 200 μL extract, 15.8 mL ultrapure water, and 1 mL of Folin-Ciocâlteu reagent. After 10 min, a volume of 3 mL of 20% Na2CO3 was added, and the mixture was maintained in a dark place for 60 min at 25 °C. The mixture absorbance was measured at a wavelength of 765 nm. The results obtained were expressed as mg gallic acid equivalents GAE/g DW. The gallic acid concentration for the standard curve was 10–100 ppm, and the equation obtained was y = 1.6991x − 0.0256.

2.6. Antioxidant Activity—DPPH Assay (AOA)

The antiradical activity of red grape skin extracts was determined using 2,2-diphenyl-1-picrylhydrazyl (DPPH) according to Castro-Vargas et al. [32] and Turturică et al. [30]. Briefly, a mixture was obtained by adding a 200 μL extract and a 3.9 mL DPPH solution 0.1M. The mixture was maintained in a dark place for 90 min at 25 °C. The mixture absorbance was measured at a wavelength of 515 nm. A control was prepared by adding 200 μL methanol and 3.9 mL DPPH solution 0.1 M, and the absorbance mixture was also measured. The results obtained were expressed as mM Trolox/g DW. The Trolox concentration for the standard curve was 10–100 ppm, and the equation obtained was y = 0.45x + 0.0075.

2.7. Experimental Design

The antioxidant activity of the red grape skin extract was experimentally determined, and the TAC, TPC, and AOA were optimized using the Central Composite Design (CCD) approach. An experimental factorial model was created using the design of 21 experimental variants, 3 central points, and a core component of 5 variables. The experimental plan’s variables’ maximum and lowest values are shown in Table 1 in both their present and coded forms. Additionally, the CCD develops a quadratic model for the response variables.
The experimental conditions can be represented by a second-order polynomial model (1):
R = b 0 + i n b i   · x i + i = 1 n b i i · x i i 2 +   b i j · x i · x j d
where R is the predicted response, b0 is the intercept, b i , b i i , and b i j are the regression coefficients, x i and x j d are the independent variables analyzed, and n is the number of factors.

2.8. Statistical Analysis

To assess the experimental model in the study, we used the statistical program Design Expert (v. 13) from Design-Expert® (Stat-Ease, Inc., Minneapolis, MN, USA). The results of each analysis were performed in triplicate, and they are shown as mean standard deviation.

3. Results and Discussion

In order to find the optimized parameters for the extraction process, a Central Composite Design (CCD) and surface response modeling were used to establish the ideal parameters for optimizing the extraction process. In this respect, the content of total anthocyanins, total polyphenolic compounds, and antioxidant activity were measured.
The four independent variables (citric acid concentration, ethanol concentration, temperature, and time of extraction) were used to optimize the extraction parameters modeled by CCD in this study (Table 2).

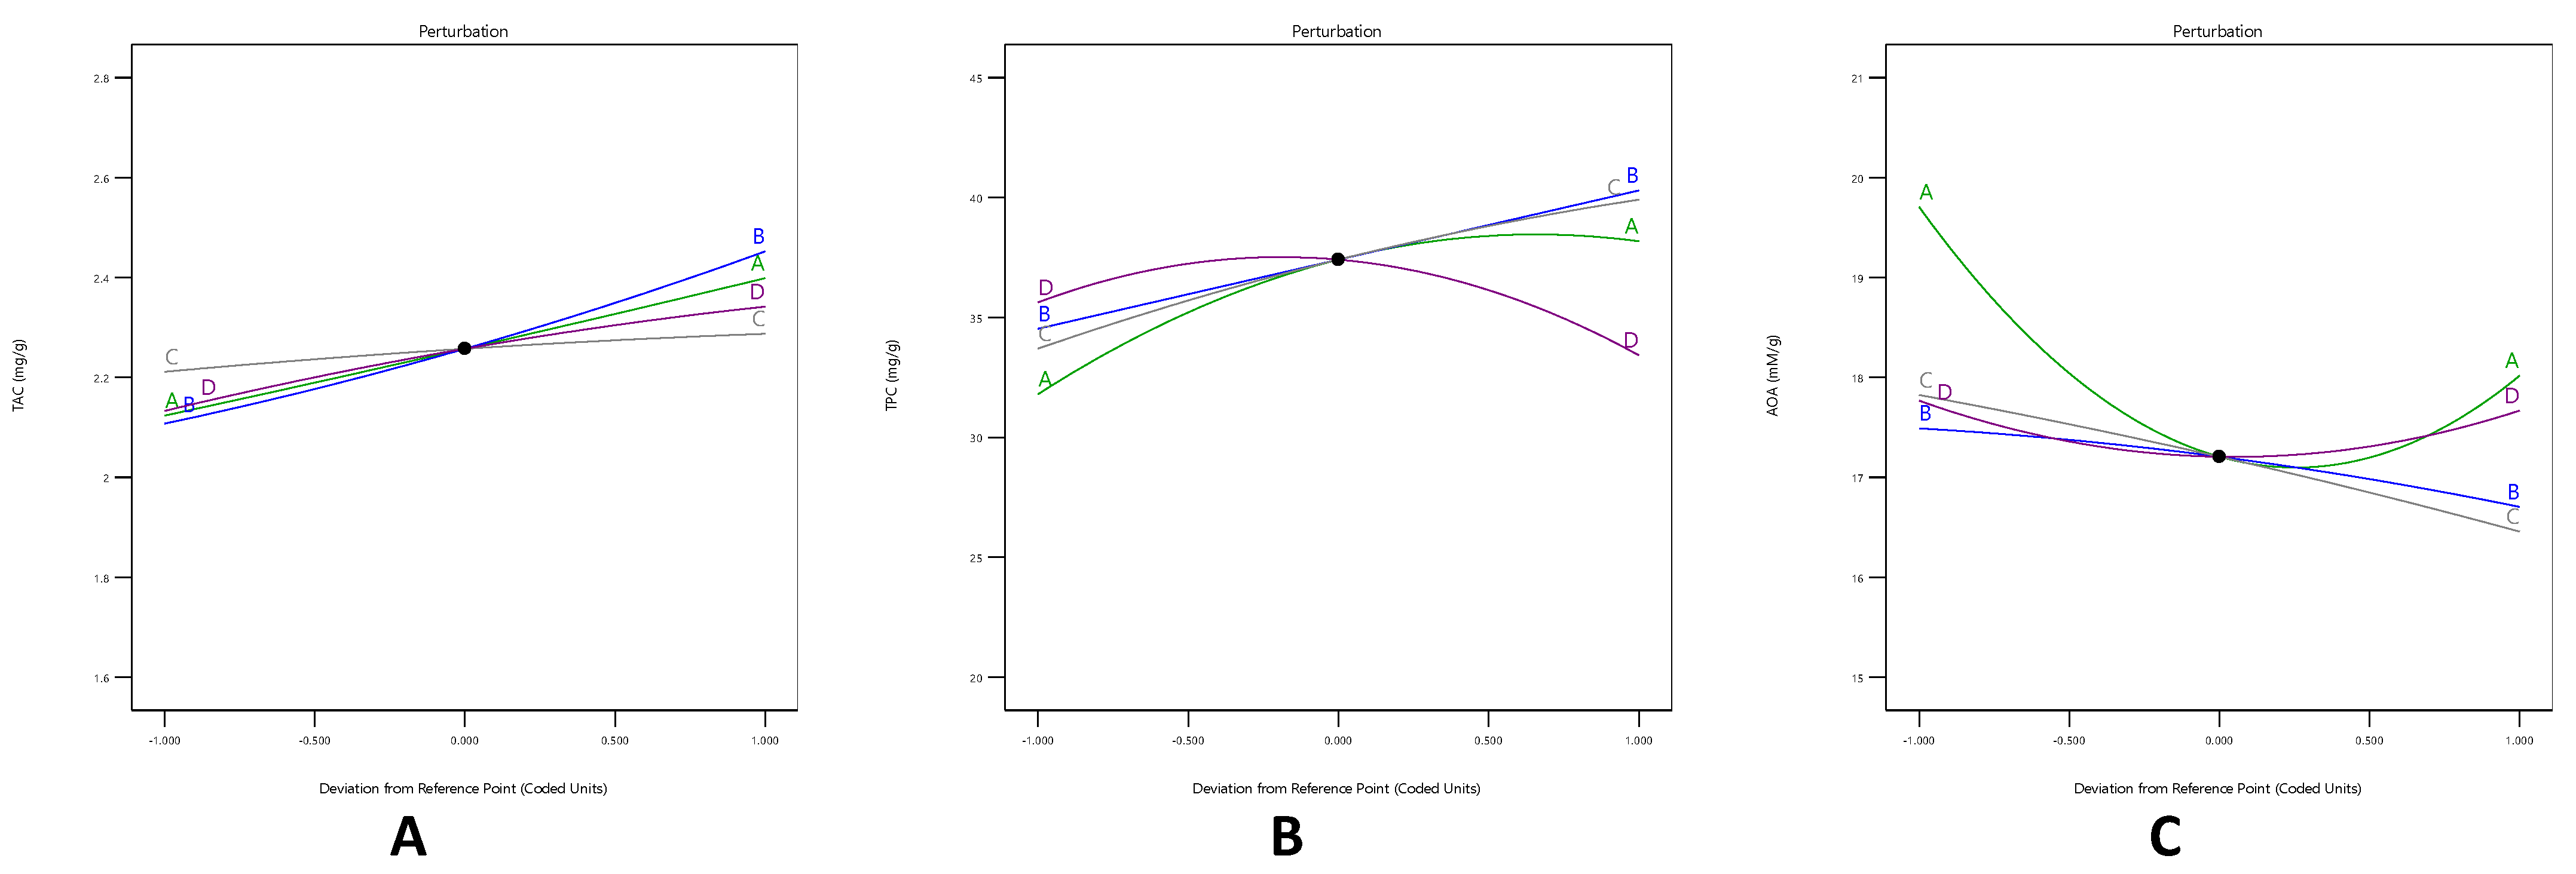
3.1. Effect of the Extraction Parameters on TAC

As can be seen in Table 2, the total anthocyanins content varied from 1.71 to 2.64 mg/g DW as a function of the various variables. Considering the extraction environment’s variables, the values of TAC from red grape skins were explained using regression equations developed after the ANOVA analysis (Table 3). The Model F-value of 1003.34 for TAC from red grape peels suggests that the model is significant. Model terms are significant if the determined p-values are less than the value of 0.0500, according to the results. In this situation, the following terms, such as A, B, C, D, AB, AC, AD, BC, BD, CD, B², C², and D², are significant model terms.
R1 (TAC) = 2.26 + 0.1375A + 0.1722B + 0.0380C + 0.1043D + 0.0368AB − 0.06AC + 0.3622AD + 0.1324BC + 0.2475BD − 0.0750CD + 0.0038A2 + 0.0225B2 − 0.008C2 − 0.0200D2
The ethanol (B) had the most positive impact on the anthocyanins content according to the regression equation’s b coefficients. Furthermore, citric acid concentration (A), and extraction time (D) all improved the TAC of the extracts. The extraction of TAC from red grape skins was negatively influenced, as shown in equation 1, by interactions between citric acid concentration and temperature (AC), temperature and time of extraction (CD), and a quadratic time of extraction (C2) and temperature (D2).
There was a moderate effect on the TAC from the interactions between citric acid and ethanol concentration (AB), citric acid concentration and time (AD), and ethanol concentration and time (BD) of TAC extraction from red grape skins.
In analyzing Figure 1(Aa–Ad), a synergistic effect of the independent variables (citric acid concentration, ethanol concentration, temperature, and time) on the TAC of the extract was found. Figure 1A depicts the correlation between the independent and dependent variables which was predicted using second-order contour plots. The three-dimensional response reveals the impact of the selected parameters on the extract’s TAC. Figure 1(Ab) shows that citric acid concentration and extraction time are the main parameters impacting TAC extraction. The maximum value for TAC was achieved at 2% citric acid concentration and about 65 min extraction time. The negative effect of interaction between time and temperature was also identified by Li et al. [9], who observed that from 40 to 51 °C, there was a significant rise in TAC extraction yield, but above 51 °C, the yield began to decline. Furthermore, as shown in Figure 1(Ad), lower extraction times (25 min) and higher concentrations of ethanol (85%) led to a decreased TAC value. The contour plots showed that the concentration of anthocyanins was affected by ethanol concentration rather than temperature variation (Figure S1(Aa,Ac)).
Several parameters’ perturbation plots show how each impacted the current response (Figure 2A). The perturbation plot compares the effects of all factors in the design space and is used to determine which factors have the greatest impact on the response. A steep slope or curvature in a factor indicates the sensitivity of the response to that factor, whereas a relatively flat line indicates a factor’s insensitivity to change [33]. Thereby, curve B in the perturbation graph looks crucial in determining TAC, showing how significantly the ethanol value affected the result. Curves A and D, which represented time and citric acid, respectively, showed that these variables had a less significant impact on the extraction than ethanol.
Table 2 shows the concentrations of anthocyanins extracted from the skin of Băbească neagră grapes obtained by varying the parameters of the conventional extraction method using a CCD model. The highest concentration of anthocyanins TAC (2.64 mg/g) corresponds to the extracts obtained with EtOH 50% acidified with citric acid 2% at 25 °C, for 65 min of extraction. Therefore, the yields of anthocyanin extraction may be increased by mixing water with ethanol, and the extracts are easy to introduce into biological systems. The results corroborate those of Khazaei et al. [34], who used RSM with Box–Behnken to discover that increasing the solvent ratio to the solute improved anthocyanin extractions by raising TAC. Similar results were obtained by de Andrade et al. [35] who reported in the skin of Syrah grapes an anthocyanin content of 3.25 ± 0.03 mg M3G/g DW. Yammine [36] used an extraction ratio of 50% ethanol and extracted from the Cabernet Franc grape an anthocyanin content of 11.67 ± 1.67 mg/g DW from the pomace of the Cabernet Franc grape. With the help of the maceration method, Arozarena et al. [37] extracted a concentration of anthocyanins from the skins of the grape variety Cabernet Sauvignon of 23.3 ± 0.3 g M3G/kg DW. The same approach was used to obtain, from the skins of the Graciano grape variety, an amount of 22.6 ± 0.4 g M3G/kg DW. Rockenbach et al. [12] observed a total anthocyanin content value between 2.89 and 9.34 mg/g DW in six red grape (Vitis vinifera and Vitis labrusca) extracts from Brazil. These differences between the anthocyanin contents in the grape can be explained by the factors involved in the vine cultivation and also between varieties.

3.2. Effect of the Extraction Parameters on TPC

This study aimed to find the ideal parameters for extracting phenolic compounds from red grape skins. The TPC ranged from 24.67 to 43.97 mg/g DW based on the experimental design depicted in Table 2. Data presented in Table 3 revealed that for TPC, a Model F-value of 2495.65 implies that the model is significant, and p-values less than 0.05 imply that the model terms were significant. Model terms are considered significant if their p-values are less than 0.0500. In this case, A, B, C, D, AC, AD, BC, BD, CD, A², C², and D² are significant model terms.
R2 (TPC) = +37.41 + 3.19A + 2.88B + 3.10C − 1.10D − 0.1614AB − 0.9895AC + 5.39AD − 0.9180BC + 5.21 BD − 2.07CD − 2.42A2 − 0.6054C2 − 2.89D2
The model equation presenting the correlation between the R2 (TPC) and the variables in coded units is revealed in Equation 3. The regression equation’s b coefficients showed that the ethanol concentration and extraction time positively affected the phenolic compounds extraction.
The interactions between citric acid concentration and time of extraction (AD) and between ethanol concentration and extraction time (BD) had an appreciably positive effect on TPC extraction. On the contrary, citric acid concentration (A2) and extraction time (D2) had an appreciably negative contribution. Furthermore, interactions between citric acid concentration and ethanol concentration (AB) and acid citric concentration and temperature (AC) of extraction, as well as ethanol concentration and temperature (BC), had a moderately negative effect on the TPC yield.
Figure 1(Ba–Bf) shows the tridimensional surface plots and 3D surfaces of the interactions between the concentrations of citric acid and ethanol, temperature, and extraction time that have the greatest influence on the extraction of TPC. The TPC increased when the ethanol concentration approached 85% and the citric acid concentration reached over 2%, according to an analysis of the impacts of ethanol concentration and citric acid concentration (Figure 1(Ba)). According to the surface graphs, citric acid concentration and ethanol concentration had a greater impact on polyphenol concentration than did extraction duration. A decrease in phenolic compounds content is observed at an increased concentration of citric acid and extraction time (Figure 1(Bb)). Additionally, the increase in TPC with an increasing temperature was observed at low (<25 min) and moderate (35 min) extraction time concentrations. However, the effect of the temperature almost disappeared at a higher extraction time (>65 min) (Figure 1(Bc)). Figure 1(Bd) demonstrates a considerable increase in TPC with a decreasing temperature and increasing ethanol concentration in the solvent composition.
Moreover, the perturbations graph (Figure 2B) exhibiting the effects of each independent variable on the TPC revealed that both citric acid and ethanol concentration had a significant influence on increasing the TPC.
Following the conventional extraction, the highest content of total phenolic compounds, 43.97 mg EAG/g DW, was obtained for the extraction with 50% ethanol and 0.1% citric acid after 25 min of extraction at 60 °C. Katalinić et al. [38] reported content of 45.0 ± 26.3 mg EAG/g grape skin following a conventional extraction with ethanol (ethanol/water 80/20, at 60 °C, for 60 min). On the other hand, Negro et al. [39] obtained a content of 33.3 ± 0.3 mg EAG /100 g DW in the skin of red grapes by extraction with 80% ethanol with acetic acid. Poudel et al. [40] determined a content of 8.47 ± 0.20 (mg/g EAG) in the skin of the Ebizuru grape variety by 80% methanol extraction with 1N HCl. Tournour et al. [41] reported a content ranging from 69.30 to 131.70 mg/g EAG for different grape cultivars following a conventional magnetic stirring extraction for 48 h using an 80% ethanolic solution.

3.3. Effect of Extraction Parameters on AOA

The recorded values of antioxidant activity ranged from 15.95 to 20.98 mM TE/g DW according to the influence of various variables (Table 2). For the AA parameter, the model is suggested to be significant by the model’s Model F-value of 1241.30, and p-values less than 0.0500 indicate that model terms are significant. In this case, A, B, C, D, AB, AC, AD, BC, BD, CD, A², B², C², and D² are significant model terms.
Equation (4) reveals the model equation for the relationship between the antioxidant activity (R3) and variables expressed in coded units.
R3 (AOA) = +17.21 − 0.8438A − 0.3931B − 0.6835C − 0.0497D − 11.84AB − 0.4843AD − 0.4184BC − 0.8576BD + 0.5237CD + 1.66A² − 0.1089B² − 0.0656C2 + 0.5114D2
The regression equation’s b coefficients showed that among all the variables, the time of extraction had a minor negative effect on antioxidant activity. The interaction between citric acid concentration and ethanol concentration (AB) significantly negatively impacted the AOA of the red grape skin extract. The interactions between citric acid concentration and time of extraction (AD), ethanol concentration and temperature (BC), ethanol concentration and time of extraction (BD), quadratic ethanol concentration (B2), and quadratic temperature (BD) were all found to have a small negative impact (C2). Additionally, the interaction between temperature and time (CD) and quadratic extraction duration had a moderate impact on the extract’s antioxidant activity (D2). Additionally, the antioxidant activity of the red grape skins extract is significantly positively influenced by quadratic citric acid content (A2).
The second-order contour plots were designed to predict the correlation between the independent and dependent variables, as seen in Figure 1C. The same correlation is used to highlight the synergistic effects of the studied independent variables on the values of antioxidant activity for the red grape skin extract. The correlative effect of the selected independent three-dimensional response area can describe the extract’s antioxidant activity. Figure 1(Ca–Cd) shows the extraction parameters that affect antioxidant activity. The maximum antioxidant activity was obtained after 25 min of extraction at a concentration of ethanol of about 85%. Antioxidant activity increases as citric acid concentrations increase (Figure 1(Ca,Cb)). Shorter extraction times and higher citric acid concentrations also positively impacted the DPPH free radical-scavenging capacity, as evidenced by the plots. AOA decrease was observed at an increased ethanol concentration (Figure 1(Cc)). However, at higher extraction times (≥45 min) and at a moderate ethanol concentration (64%) an increase in AOA was observed (Figure S1(Cc)). Higher temperatures increase the solubility of phenolic compounds, leading to an increase in AOA. Nonetheless, using higher extraction temperatures and a longer extraction time, the extracted phenolic compounds began to degrade and, after reaching equilibrium, reduced AOA concentrations (Figure 1(Cd)). Similar results were obtained by Li et al. [9] who found a negative correlation between increasing ethanol concentration and increasing temperature, indicating that the antioxidant activity of AOA decreased as the ethanol concentration and temperature increased. Moreover, curve D from the perturbations graph has played a significant role in the determination of AOA in the perturbation graph, demonstrating the sizeable influence of the time of extraction value. Additionally, curves B and C will have less impact on extraction than curve A (Figure 2C).
After 25 min of extraction at 25 °C, the extraction with 85% ethanol and 2% citric acid produced the highest AOA of 24.67 mM TE/g DW. For the same grape variety but harvested in 2012, Constantin et al. [42] reported 4.89 ± 0.02 µM TE/g DW by the ABTS assay. Rockenbach et al. [12] obtained an average of 2.076 mM TE/100 g DW for different grape varieties from Brazil. The pinot noir and Isabel varieties had the highest levels of antioxidant activity. In a study conducted by Kupe et al. [43], nine ‘Karaerik’ grape clones’ peel samples showed DPPH radical scavenging between 1.08 and 1.34 mM TE /100 g FW. After model validation, for extraction, Li et al. [9] used the following parameters: 49% ethanol/51 C/15 min and obtained an AOA of 41.78 ± 1.13 mg TE/g.

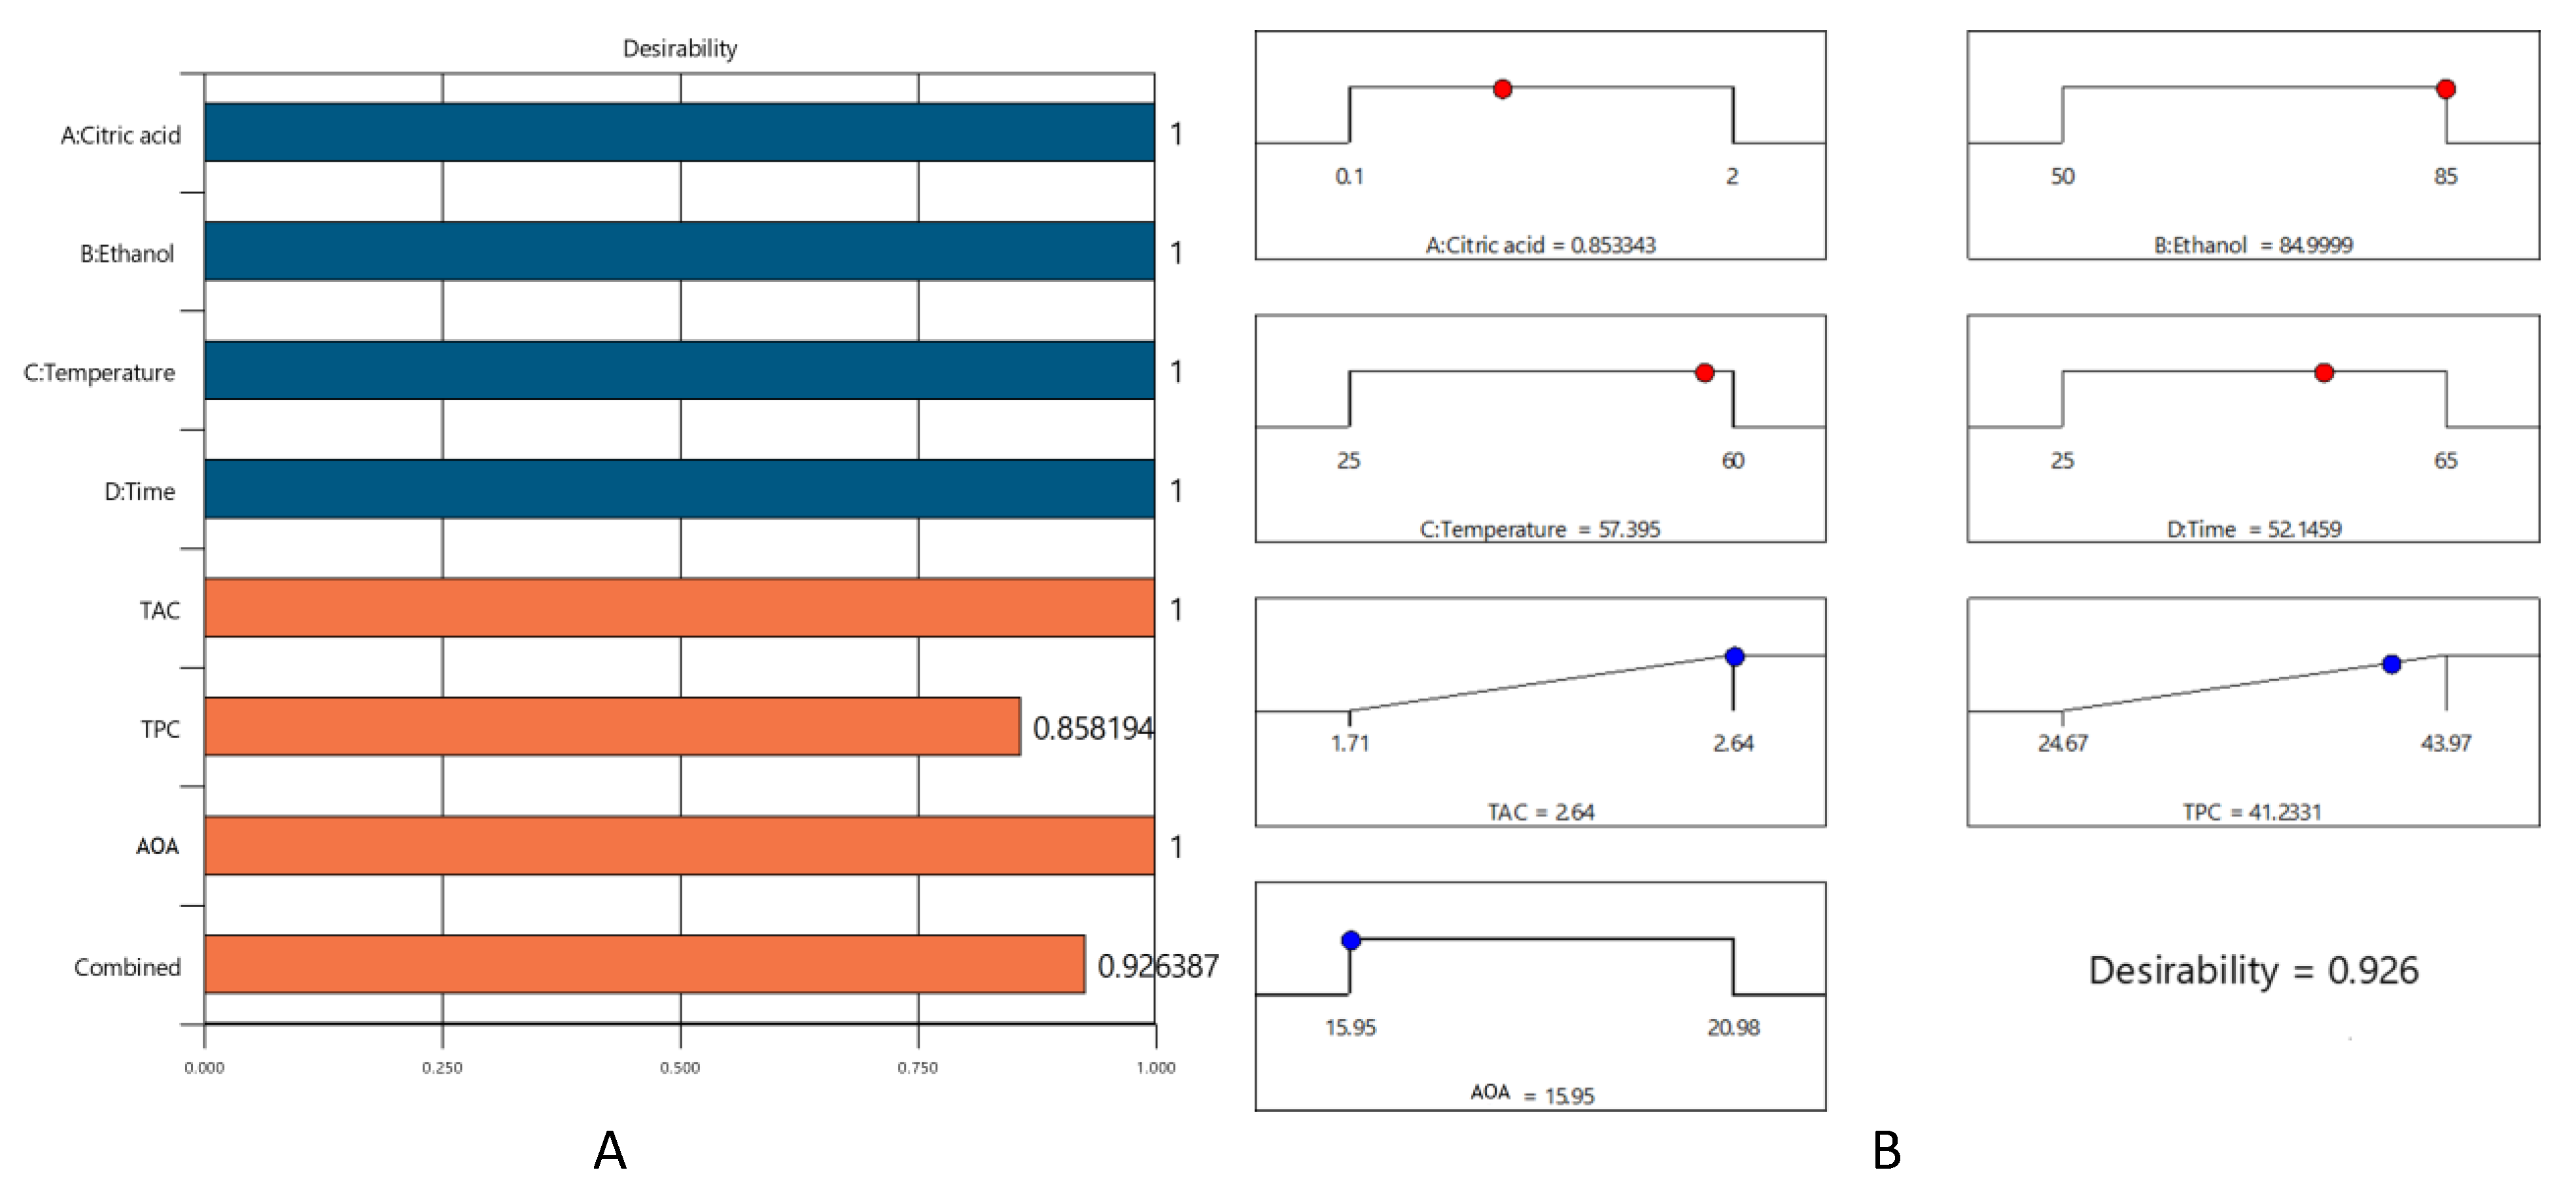
3.4. Extraction Parameter Optimization and Validation

To verify the model equation, the model suggested the best factors based on maximizing response desirability (Figure 3, Table 4). The ramp graphs are labeled with a specific point that represents the optimal level for the variable under study. The value of the desirability function varies from the value zero, outside the imposed limits, to the value 1 or a value close to 1. The program’s objective is to maximize the function, starting at a random point and aiming for the steepest slope possible [44]. A score of 1 (0.926) meant that all chosen conditions were true. The ideal conditions for maximizing phenolic compounds extraction and antioxidant activity were 0.85% citric acid, 85% ethanol, a temperature of 57.39 °C, and an extraction time of 52.14 min.
According to the model, the maximal levels of anthocyanins, total phenolic compounds, and antioxidant activity were 2.25 mg C3G/g DW, 37.41 mg GAE/g DW, and 17.2 mM TE/g DW, respectively. The experimental findings (Table 4) demonstrated fast responses to the model’s predictions. Three extractions were carried out under those predicted variables to verify the model. In a study conducted by Li et al. [9], using a Box–Behnken design by RSM optimized the extraction parameters (48.80% ethanol at 50.79 °C for 14.82 min) of grape skin for obtaining the highest yields of the TPC (15.24 mg GAE/g) and TAC (3.46 mg CGE/100 g).

4. Conclusions

To obtain peel extracts from Băbească neagră grapes with a high yield of phenolic compounds and high levels of antioxidant activity, the conventional solvent extraction process variables (citric acid concentration—0.85%, ethanol concentration—85%, temperature—57.39 °C, and extraction time—52.14 min) were optimized using a CCD and response surface methodology. The maximum concentrations of anthocyanins (2.25 mg C3G/g DW), total phenolic compounds (37.41 mg GAE/g DW), and DPPH radical scavenging activity (17.2 mM TE/g DW) in the experiment were obtained from the interaction of time, temperature, acid, and solvent concentrations. The optimized extraction process may be a potentially efficient way to obtain valuable extracts from affordable, natural sources like grape skins with potential antioxidants and a high yield of anthocyanins and other phenolic compounds. These results demonstrate proper factor combinations and a unique solvent mixture for obtaining a high yield of phenolic compounds and, particularly, anthocyanins.

Supplementary Materials

The following supporting information can be downloaded at: https://www.mdpi.com/article/10.3390/inventions8020059/s1.

Author Contributions

Conceptualization, D.S., O.E.C. and G.R.; methodology, D.S., G.H. and O.E.C.; software, O.E.C. and I.A.; validation, O.E.C. and I.A.; formal analysis, G.H. and D.S.; investigation, D.S.; resources, G.E.B.; data curation G.R. and N.S.; writing—original draft preparation D.S. and I.A.; writing—review and editing, G.R. and N.S.; visualization, N.S.; supervision, G.E.B. All authors have read and agreed to the published version of the manuscript.

Funding

This research received no external funding.

Institutional Review Board Statement

Not applicable.

Informed Consent Statement

Not applicable.

Data Availability Statement

The data supporting this study’s findings are available from the corresponding author (G.R.) upon reasonable request.

Acknowledgments

The results of this work have been presented to the 10th edition of the Scientific Conference organized by the Doctoral Schools of “Dunărea de Jos” University of Galati (SCDS-UDJG) http://www.cssd-udjg.ugal.ro/ (accessed on 9 April 2022) that will be held on the 9–10 June 2022, in Galati, Romania.

Conflicts of Interest

The authors declare no conflict of interest.

References

  1. Djilas, S.M.; Canadanović-Brunet, J.; Ćetković, G. By-Products of Fruits Processing as a Source of Phytochemicals. Chem. Ind. Chem. Eng. Q. 2009, 15, 191–202. [Google Scholar] [CrossRef]
  2. Antonić, B.; Jančíková, S.; Dordević, D.; Tremlová, B. Grape Pomace Valorization: A Systematic Review and Meta-Analysis. Foods 2020, 9, 1627. [Google Scholar] [CrossRef] [PubMed]
  3. García-Lomillo, J.; González-SanJosé, M.L. Applications of Wine Pomace in the Food Industry: Approaches and Functions. Compr. Rev. Food Sci. Food Saf. 2017, 16, 3–22. [Google Scholar] [CrossRef] [PubMed]
  4. Balbinoti, T.C.V.; Stafussa, A.P.; Haminiuk, C.W.I.; Maciel, G.M.; Sassaki, G.L.; de Matos Jorge, L.M.; Jorge, R.M.M. Addition of Grape Pomace in the Hydration Step of Parboiling Increases the Antioxidant Properties of Rice. Int. J. Food Sci. Technol. 2020, 55, 2370–2380. [Google Scholar] [CrossRef]
  5. Jara-Palacios, M.J.; Hernanz, D.; Cifuentes-Gomez, T.; Escudero-Gilete, M.L.; Heredia, F.J.; Spencer, J.P.E. Assessment of White Grape Pomace from Winemaking as Source of Bioactive Compounds, and Its Antiproliferative Activity. Food Chem. 2015, 183, 78–82. [Google Scholar] [CrossRef] [Green Version]
  6. Nassiri-Asl, M.; Hosseinzadeh, H. Review of the Pharmacological Effects of Vitis Vinifera (Grape) and Its Bioactive Constituents: An Update. Phytother. Res. 2016, 30, 1392–1403. [Google Scholar] [CrossRef]
  7. Sabra, A.; Netticadan, T.; Wijekoon, C. Grape Bioactive Molecules, and the Potential Health Benefits in Reducing the Risk of Heart Diseases. Food Chem. X 2021, 12, 100149. [Google Scholar] [CrossRef]
  8. Rebello, L.P.G.; Lago-Vanzela, E.S.; Barcia, M.T.; Ramos, A.M.; Stringheta, P.C.; Da-Silva, R.; Castillo-Muñoz, N.; Gómez-Alonso, S.; Hermosín-Gutiérrez, I. Phenolic Composition of the Berry Parts of Hybrid Grape Cultivar BRS Violeta (BRS Rubea×IAC 1398-21) Using HPLC–DAD–ESI-MS/MS. Food Res. Int. 2013, 54, 354–366. [Google Scholar] [CrossRef]
  9. Li, J.; Zhang, S.; Zhang, M.; Sun, B. Novel Approach for Extraction of Grape Skin Antioxidants by Accelerated Solvent Extraction: Box–Behnken Design Optimization. J. Food Sci. Technol. 2019, 56, 4879–4890. [Google Scholar] [CrossRef]
  10. Brazinha, C.; Cadima, M.; Crespo, J.G. Optimization of Extraction of Bioactive Compounds from Different Types of Grape Pomace Produced at Wineries and Distilleries. J. Food Sci. 2014, 79, E1142–E1149. [Google Scholar] [CrossRef]
  11. Caldas, T.W.; Mazza, K.E.L.; Teles, A.S.C.; Mattos, G.N.; Brígida, A.I.S.; Conte-Junior, C.A.; Borguini, R.G.; Godoy, R.L.O.; Cabral, L.M.C.; Tonon, R.V. Phenolic Compounds Recovery from Grape Skin Using Conventional and Non-Conventional Extraction Methods. Ind. Crops Prod. 2018, 111, 86–91. [Google Scholar] [CrossRef]
  12. Rockenbach, I.I.; Gonzaga, L.V.; Rizelio, V.M.; de Souza Schmidt Gonçalves, A.E.; Genovese, M.I.; Fett, R. Phenolic Compounds and Antioxidant Activity of Seed and Skin Extracts of Red Grape (Vitis Vinifera and Vitis Labrusca) Pomace from Brazilian Winemaking. Food Res. Int. 2011, 44, 897–901. [Google Scholar] [CrossRef]
  13. Kumar, M.; Barbhai, M.D.; Hasan, M.; Punia, S.; Dhumal, S.; Radha; Rais, N.; Chandran, D.; Pandiselvam, R.; Kothakota, A.; et al. Onion (Allium cepa L.) Peels: A Review on Bioactive Compounds and Biomedical Activities. Biomed. Pharmacother. 2022, 146, 112498. [Google Scholar] [CrossRef]
  14. Giusti, M.M.; Wrolstad, R.E. Acylated Anthocyanins from Edible Sources and Their Applications in Food Systems. Biochem. Eng. J. 2003, 14, 217–225. [Google Scholar] [CrossRef]
  15. Georgiev, V.; Ananga, A.; Tsolova, V. Recent Advances and Uses of Grape Flavonoids as Nutraceuticals. Nutrients 2014, 6, 391–415. [Google Scholar] [CrossRef] [Green Version]
  16. Gouot, J.C.; Smith, J.P.; Holzapfel, B.P.; Walker, A.R.; Barril, C. Grape Berry Flavonoids: A Review of Their Biochemical Responses to High and Extreme High Temperatures. J. Exp. Bot. 2019, 70, 397–423. [Google Scholar] [CrossRef]
  17. Putta, S.; Yarla, N.S.; Peluso, I.; Tiwari, D.K.; Reddy, G.V.; Giri, P.V.; Kumar, N.; Malla, R.; Rachel, V.; Bramhachari, P.V.; et al. Anthocyanins: Multi-Target Agents for Prevention and Therapy of Chronic Diseases. Curr. Pharm. Des. 2017, 23, 6321–6346. [Google Scholar] [CrossRef]
  18. Ren, K.-W.; Li, Y.-H.; Wu, G.; Ren, J.-Z.; Lu, H.-B.; Li, Z.-M.; Han, X.-W. Quercetin Nanoparticles Display Antitumor Activity via Proliferation Inhibition and Apoptosis Induction in Liver Cancer Cells. Int. J. Oncol. 2017, 50, 1299–1311. [Google Scholar] [CrossRef] [Green Version]
  19. Rasines-Perea, Z.; Teissedre, P.-L. Grape Polyphenols’ Effects in Human Cardiovascular Diseases and Diabetes. Molecules 2017, 22, 68. [Google Scholar] [CrossRef]
  20. Costa, E.; Cosme, F.; Jordão, A.M.; Mendes-Faia, A. Anthocyanin Profile and Antioxidant Activity from 24 Grape Varieties Cultivated in Two Portuguese Wine Regions. OENO One 2014, 48, 51–62. [Google Scholar] [CrossRef]
  21. Samota, M.K.; Sharma, M.; Kaur, K.; Sarita; Yadav, D.K.; Pandey, A.K.; Tak, Y.; Rawat, M.; Thakur, J.; Rani, H. Onion Anthocyanins: Extraction, Stability, Bioavailability, Dietary Effect, and Health Implications. Front. Nutr. 2022, 9, 917617. [Google Scholar] [CrossRef]
  22. Kumar, N.; Goel, N. Phenolic Acids: Natural Versatile Molecules with Promising Therapeutic Applications. Biotechnol. Rep. 2019, 24, e00370. [Google Scholar] [CrossRef]
  23. Sun, B.; de Sá, M.; Leandro, C.; Caldeira, I.; Duarte, F.L.; Spranger, I. Reactivity of Polymeric Proanthocyanidins toward Salivary Proteins and Their Contribution to Young Red Wine Astringency. J. Agric. Food Chem. 2013, 61, 939–946. [Google Scholar] [CrossRef] [PubMed]
  24. Kyraleou, M.; Kallithraka, S.; Theodorou, N.; Teissedre, P.-L.; Kotseridis, Y.; Koundouras, S. Changes in Tannin Composition of Syrah Grape Skins and Seeds during Fruit Ripening under Contrasting Water Conditions. Molecules 2017, 22, 1453. [Google Scholar] [CrossRef] [PubMed] [Green Version]
  25. Machado, A.P.D.F.; Pasquel-Reátegui, J.L.; Barbero, G.F.; Martínez, J. Pressurized Liquid Extraction of Bioactive Compounds from Blackberry (Rubus Fruticosus L.) Residues: A Comparison with Conventional Methods. Food Res. Int. 2015, 77, 675–683. [Google Scholar] [CrossRef]
  26. Martiny, T.R.; Raghavan, V.; de Moraes, C.C.; da Rosa, G.S.; Dotto, G.L. Optimization of Green Extraction for the Recovery of Bioactive Compounds from Brazilian Olive Crops and Evaluation of Its Potential as a Natural Preservative. J. Environ. Chem. Eng. 2021, 9, 105130. [Google Scholar] [CrossRef]
  27. da Silva Meirelles, L.; Fontes, A.M.; Covas, D.T.; Caplan, A.I. Mechanisms Involved in the Therapeutic Properties of Mesenchymal Stem Cells. Cytokine Growth Factor Rev. 2009, 20, 419–427. [Google Scholar] [CrossRef]
  28. Mei, Z.; Zhang, R.; Zhao, Z.; Zheng, G.; Xu, X.; Yang, D. Extraction Process and Method Validation for Bioactive Compounds from Citrus Reticulata Cv. Chachiensis: Application of Response Surface Methodology and HPLC–DAD. Acta Chromatogr. 2020, 33, 270–280. [Google Scholar] [CrossRef]
  29. Weremfo, A.; Abassah-Oppong, S.; Adulley, F.; Dabie, K.; Seidu-Larry, S. Response Surface Methodology as a Tool to Optimize the Extraction of Bioactive Compounds from Plant Sources. J. Sci. Food Agric. 2022, 103, 26–36. [Google Scholar] [CrossRef]
  30. Turturică, M.; Stănciuc, N.; Bahrim, G.; Râpeanu, G. Effect of Thermal Treatment on Phenolic Compounds from Plum (Prunus Domestica) Extracts—A Kinetic Study. J. Food Eng. 2016, 171, 200–207. [Google Scholar] [CrossRef]
  31. Dewanto, V.; Wu, X.; Adom, K.K.; Liu, R.H. Thermal Processing Enhances the Nutritional Value of Tomatoes by Increasing Total Antioxidant Activity. J. Agric. Food Chem. 2002, 50, 3010–3014. [Google Scholar] [CrossRef]
  32. Castro-Vargas, H.I.; Rodríguez-Varela, L.I.; Ferreira, S.R.S.; Parada-Alfonso, F. Extraction of Phenolic Fraction from Guava Seeds (Psidium guajava L.) Using Supercritical Carbon Dioxide and Co-Solvents. J. Supercrit. Fluids 2010, 51, 319–324. [Google Scholar] [CrossRef]
  33. Anderson, M.J.; Whitcomb, P.J. RSM Simplified: Optimizing Processes Using Response Surface Methods for Design of Experiments, 2nd ed.; Productivity Press: London, UK, 2016. [Google Scholar]
  34. Khazaei, K.M.; Jafari, S.M.; Ghorbani, M.; Kakhki, A.H.; Sarfarazi, M. Optimization of Anthocyanin Extraction from Saffron Petals with Response Surface Methodology. Food Anal. Methods 2016, 9, 1993–2001. [Google Scholar] [CrossRef]
  35. de Andrade, R.B.; Machado, B.A.S.; de Abreu Barreto, G.; Nascimento, R.Q.; Corrêa, L.C.; Leal, I.L.; Tavares, P.P.L.G.; Ferreira, E.d.S.; Umsza-Guez, M.A. Syrah Grape Skin Residues Has Potential as Source of Antioxidant and Anti-Microbial Bioactive Compounds. Biology 2021, 10, 1262. [Google Scholar] [CrossRef]
  36. Yammine, S. Extraction of High-Value Added Compounds by Subcritical Water and Fractionation by Membrane Processes: Valorization of Vine and Wine by-Products by Eco-Innovative Processes. Ph.D. Thesis, Université de Bordeaux, Bordeaux, France, 2016. [Google Scholar]
  37. Arozarena, I.; Casp, A.; Marín, R.; Navarro, M. Multivariate Differentiation of Spanish Red Wines According to Region and Variety. J. Sci. Food Agric. 2000, 80, 1909–1917. [Google Scholar] [CrossRef]
  38. Katalinić, V.; Možina, S.S.; Skroza, D.; Generalić, I.; Abramovič, H.; Miloš, M.; Ljubenkov, I.; Piskernik, S.; Pezo, I.; Terpinc, P.; et al. Polyphenolic Profile, Antioxidant Properties and Antimicrobial Activity of Grape Skin Extracts of 14 Vitis Vinifera Varieties Grown in Dalmatia (Croatia). Food Chem. 2010, 119, 715–723. [Google Scholar] [CrossRef]
  39. Negro, C.; Tommasi, L.; Miceli, A. Phenolic Compounds and Antioxidant Activity from Red Grape Marc Extracts. Bioresour. Technol. 2003, 87, 41–44. [Google Scholar] [CrossRef]
  40. Poudel, P.R.; Tamura, H.; Kataoka, I.; Mochioka, R. Phenolic Compounds and Antioxidant Activities of Skins and Seeds of Five Wild Grapes and Two Hybrids Native to Japan. J. Food Compos. Anal. 2008, 21, 622–625. [Google Scholar] [CrossRef]
  41. Tournour, H.H.; Segundo, M.A.; Magalhães, L.M.; Barreiros, L.; Queiroz, J.; Cunha, L.M. Valorization of Grape Pomace: Extraction of Bioactive Phenolics with Antioxidant Properties. Ind. Crops Prod. 2015, 74, 397–406. [Google Scholar] [CrossRef]
  42. Constantin, O.; Skrt, M.; Ulrih, N.; Rapeanu, G. Anthocyanins Profile, Total Phenolics and Antioxidant Activity of Two Romanian Red Grape Varieties: Feteasca Neagra and Babeasca Neagra (Vitis Vinifera). Chem. Pap. 2015, 69, 1573–1581. [Google Scholar] [CrossRef]
  43. Kupe, M.; Karatas, N.; Unal, M.S.; Ercisli, S.; Baron, M.; Sochor, J. Phenolic Composition and Antioxidant Activity of Peel, Pulp and Seed Extracts of Different Clones of the Turkish Grape Cultivar ‘Karaerik. ’ Plants 2021, 10, 2154. [Google Scholar] [CrossRef] [PubMed]
  44. De, B.; Bhandari, K.; Katakam, P.; Goswami, T.K. Development of a Standardized Combined Plant Extract Containing Nutraceutical Formulation Ameliorating Metabolic Syndrome Components. SN Appl. Sci. 2019, 1, 1484. [Google Scholar] [CrossRef] [Green Version]
Figure 1. Three-dimensional surface plots screening the effect of the variables on the TAC ((A)—(a): citric acid–ethanol; (b): citric acid–time; (c): ethanol–temperature; (d): ethanol–time), TPC ((B)—(a): citric acid–ethanol; (b): citric acid–time; (c): temperature–time; (d): ethanol–temperature) and AOA ((C)—(a): citric acid–ethanol; (b): citric acid–time; (c): ethanol–time; (d): temperature–time).
Inventions 08 00059 g001
Figure 2. Perturbation graphs of each independent variable on TAC (A), TPC (B), and AOA (C) of the red grape peel extracts. A: citric acid (%); B: ethanol (%); C: temperature (°C); D: time (min).
Inventions 08 00059 g002
Figure 3. The optimization desirability bar chart (A) and ramps (B).
Inventions 08 00059 g003
Table 1. Range of values for the variables examined and values encoded.
CodeIndependent VariablesUnitsMinimumMaximumCoded LowCoded High
ACitric acid%0.01002.64−1 = 0.10+1 = 2.00
BEthanol%38.0696.93−1 = 50.00+1 = 85.00
CTemperature°C13.0671.90−1 = 25.00+1 = 60.00
DTimemin11.3678.63−1 = 25.00+1 = 65.00
Table 2. The CCD matrix with the measured values in terms of TAC, TPC, and AOA.
RunFactor 1Factor 2Factor 3Factor 4Response 1 (R1)Response 2 (R2)Response 3 (R3)
A: Citric Acid
%
B: Ethanol
%
C: Temperature
°C
D: Time
min
TAC
mg/g
TPC
mg/g
AOA
mM/g
10.18525652.09 ± 0.0829.01 ± 1.7019.76 ± 0.25
216713.06452.15 ± 0.1129.97 ± 1.5518.24 ± 0.13
316771.9452.29 ± 0.0240.97 ± 1.7015.95 ± 0.39
416742452.24 ± 0.0236.94 ± 1.6717.26 ± 0.14
516742452.25 ± 0.1837.04 ± 1.4917.25 ± 0.16
60.15025252.45 ± 0.0329.93 ± 0.3819.65 ± 0.66
725025652.64 ± 0.1830.12 ± 1.7119.05 ± 0.89
80.18560652.4 ± 0.3931.09 ± 0.5618.91 ± 0.50
925060652.17 ± 0.2231.92 ± 0.8919.31 ± 0.24
100.016742452.1 ± 0.0930.86 ± 1.2320.16 ± 0.64
110.15060252.53 ± 0.2943.97 ± 0.9418.38 ± 0.20
121674211.362.05 ± 0.1031.41 ± 1.3918.77 ± 0.29
132.646742452.49 ± 0.1535.88 ± 0.9820.49 ± 0.55
1428525251.71 ± 0.0824.67 ± 1.1120.98 ± 0.40
151674278.632.32 ± 0.1126.45 ± 1.9218.72 ± 0.18
1628560252.07 ± 0.0731.1 ± 0.5617.47 ± 0.50
1716742452.24 ± 0.0237.12 ± 1.9417.26 ± 0.27
1816742452.25 ± 0.0037.01 ± 1.1517.26 ± 0.13
19196.9342452.59 ± 0.1042.07 ± 1.6616.35 ± 1.25
20138.0642452.03 ± 0.1632.25 ± 1.4417.61 ± 0.80
2116742452.25 ± 0.1137.14 ± 1.9617.35 ± 0.21
Table 3. ANOVA for the reduced quadratic model calculated for TAC and TPC extraction and AOA.
TACTPCAOA
SourceSSdfMSF-Valuep-ValueSSdfMSquareF-Valuep-ValueSSdfMSF-Valuep-Value
Model a0.9492140.06781003.34<0.0001518.331339.872495.65<0.000137.31142.671241.30<0.0001
A-Citric acid0.054710.0547809.95<0.000129.58129.581851.33<0.00012.0612.06960.80<0.0001
B-Ethanol0.166110.16612457.72<0.000146.57146.572915.05<0.00010.864810.8648402.78<0.0001
C-Temperature0.019710.0197290.88<0.0001131.491131.498230.00<0.00016.3716.372967.68<0.0001
D-Time0.060610.0606896.65<0.00016.7816.78424.19<0.00010.013710.01376.400.0447
AB0.004410.004465.510.00020.085310.08535.340.05410.045910.045921.390.0036
AC0.031410.0314465.24<0.00017.8417.84490.84<0.00010.158410.158473.760.0001
AD0.431210.43126380.64<0.000195.57195.575982.19<0.00010.770710.7707358.95<0.0001
BC0.140310.14032076.49<0.00016.7416.74422.14<0.00011.4011.40652.50<0.0001
BD0.130210.13021926.32<0.000157.93157.933626.06<0.00011.5611.56728.21<0.0001
CD0.045010.0450665.91<0.000134.40134.402153.40<0.00012.1912.191022.08<0.0001
0.000110.00011.570.256844.28144.282771.33<0.000120.60120.609596.00<0.0001
0.007610.0076112.10<0.0001-----0.177110.177182.50<0.0001
0.001010.001014.160.00945.4915.49343.61<0.00010.064210.064229.900.0016
0.006010.006088.49<0.0001125.061125.067827.78<0.00013.9113.911820.54<0.0001
Residual0.000460.0001 0.111870.0160 0.012960.0021
Lack of Fit b0.000320.00014.760.08760.08530.02834.230.09860.006020.00301.720.2885
Pure Error0.000140.000 0.026840.0067 0.006940.0017
Cor Total0.949620 518.4420 37.3320
Sum of Squares—SS; Mean Square—MS; a Significant; b Not significant. Equation (2) presents the relationship between the TAC (R1) and the variables expressed in coded units.
Table 4. The mathematical model’s validation.
Dependent VariablePredicted Value 95% Confidence IntervalsExperimental Value
TAC (mg C3G/g DW)2.252.23–2.272.26
TPC (mg GAE/g DW)37.4137.09–37.7337.22
AOA (mM TE/g DW)17.2017.08–17.3217.11
Disclaimer/Publisher’s Note: The statements, opinions and data contained in all publications are solely those of the individual author(s) and contributor(s) and not of MDPI and/or the editor(s). MDPI and/or the editor(s) disclaim responsibility for any injury to people or property resulting from any ideas, methods, instructions or products referred to in the content.

