Article

Machine Learning Systems Detecting Illicit Drugs Based on Their ATR-FTIR Spectra

by
Iulia-Florentina Darie
1,2,
Stefan Razvan Anton
3 and
Mirela Praisler
4,*
1
Department of Mathematics and Computer Sciences, “Dunarea de Jos” University of Galati, 47 Domneasca Street, 800008 Galati, Romania
2
“Paul Dimo” High School, Str. 1 Decembrie 1918 nr. 27, 800566 Galati, Romania
3
Center for Research and Training in Innovative Techniques of Applied Mathematics in Engineering, Polytechnic University of Bucharest, 060042 Bucharest, Romania
4
Department of Chemistry, Physics and Environment, “Dunarea de Jos” University of Galati, 47 Domneasca Street, 800008 Galati, Romania
*
Author to whom correspondence should be addressed.
Inventions 2023, 8(2), 56; https://doi.org/10.3390/inventions8020056
Submission received: 7 December 2022 / Revised: 6 February 2023 / Accepted: 6 March 2023 / Published: 13 March 2023

Abstract

:
We present a comparative study aiming to determine the most efficient multivariate model screening for the main drugs of abuse based on their ATR-FTIR spectra. A preliminary statistical analysis of selected spectra data extracted from the public SWGDRUG IR Library was first performed. The results corroborated those of an exploratory analysis that was based on several dimensionality reduction methods, i.e., Principal Component Analysis (PCA), Independent Component Analysis (ICA), and autoencoders. Then, several machine learning methods, i.e., Support Vector Machines (SVM), eXtreme Gradient Boosting (XGB), Random Forest, Gradient Boosting, and K-Nearest Neighbors (KNN), were used to assign the drug class membership. In order to account for the stochastic nature of these machine learning methods, both models were evaluated 10 times on a randomly distributed subset of the whole SWGDRUG IR Library, and the results were compared in detail. Finally, their performance in assigning the class identity of three classes of drugs of abuse, i.e., hallucinogenic (2C-x, DOx, and NBOMe) amphetamines, cannabinoids, and opioids, were compared based on confusion matrices and various classification parameters, such as balanced accuracy, sensitivity, and specificity. The advantages of each of the illicit drug-detecting systems and their potential as forensic screening tools used in field scenarios are also discussed.

1. Introduction

Amphetamines are a class of psychotropic compounds that became popular in recent decades for their stimulant, euphoric, and hallucinogenic effects. In recent decades, many such new psychotropic substances have emerged in the black market [1]. Among these, three important groups of hallucinogenic amphetamines have been noticed in recent years, i.e., 2C-x, DOx, and NBOMe amphetamines.
The 2C-x class of drugs owes its name to Alexander Shulgin and refers to the two carbon atoms that bind the amino group to the benzene ring [2]. The compounds included in the DOx class of hallucinogenic amphetamines are characterized by the presence of methoxy groups in the phenyl ring at the 2 and 5 positions, and a substituent at the 4- position of the phenyl ring [3]. The NBOMe amphetamines, which are analogs of the 2C-x drugs, emerged in the early 2000s when they were first synthesized [4,5].
Cannabinoids are a class of drugs similar in structure to the chemical compounds found in the natural products of Cannabis sativa. With the accessibility of cannabinoids expanding, especially of synthetic ones, public concern about these compounds is rising [6]. Opioids represent a class of drugs of abuse with important effects for the treatment of pain, used in a medical but also in an illicit scope [7,8].
Such illicit drugs constantly emerging in the black market represent a current problem of our days. From this point of view, it is important to develop models which can be able to automatically detect the class membership of these new compounds.

2. Related Work

Machine learning and statistical methods have been successfully applied to detect various types of drugs. Pereira et al. [9] applied PCA followed by PLS-DA (Partial Least Squares Discriminant Analysis) and ATR-FTIR spectra to identify the presence of different illegal drugs in seized ecstasy tablets. In a recent study [10], Koshute et al. developed a machine-learning model based on various techniques, such as random forests, neural networks, or logistic regression, in order to identify fentanyl analogs based on mass spectra. Lee et al. [11] developed machine learning models applied to LC-MS-MS (High-Resolution Liquid Chromatography Mass Spectrometry) in order to identify unknown controlled substances and new psychoactive substances (NPS). For this purpose, Artificial Neural Networks (ANN), Support Vector Machine (SVM), and K-Nearest Neighbors (KNN) models were developed for the classification of 13 subgroups, including the 2C series, opiates, and classical cannabinoids. Wong et al. [12] analyzed the detection of some novel psychoactive substances based on Gas Chromatography–Mass Spectrometry (GC-MS). In this scope, three machine learning models were applied, namely ANN, Convolutional Neural Networks (CNN) and Balanced Random Forest (BRF).
The aim of our study is to develop a machine learning system that can be used for the detection of various drugs of abuse, namely 2C-x, DOx, and NBOMe amphetamines, opioids, and cannabinoids, based on their ATR-FTIR (Attenuated Total Reflectance–Fourier-Transform Infrared Spectroscopy) spectra.

3. Materials and Methods

3.1. Dataset Preparation

Attenuated Total Reflectance–Fourier Transform Infrared (ATR-FTIR) spectrometers are increasingly used for in-field screening for illicit drugs, as they are portable instruments and do not require sample preparation [13]. The ATR-FTIR spectra used in this study were extracted from the SWGDRUG public spectral library [14]. They consist of 95 spectra of the targeted illicit drugs and of randomly selected negatives of forensic interest, as shown in Table 1. In order to perform statistical analysis, the spectra were divided into four classes: Class 1—amphetamines (including 2C-x, DOx, and NBOMe hallucinogens); Class 2—opioids; Class 3—cannabinoids; and Class 4—negatives. The class of amphetamines contains the spectra of 25 substances, the class of opioids includes the spectra of 36 compounds, the class of cannabinoids consists of the spectra of 18 substances, and the class of negatives was formed with the spectra of 16 different (randomly selected) compounds. The statistical analysis, autoencoders, and machine learning modeling were performed by using the Python packages numpy 1.24.1, scipy 1.10.0, scikit-learn 1.2.1, and sequitur 1.2.4.

3.2. Exploratory Data Analysis

In order to identify patterns and anomalies, an exploratory investigation based on statistics and graphical representations was first performed on the dataset. Two types of exploratory data analysis methods were used, i.e., statistical and dimensionality-reduction methods.

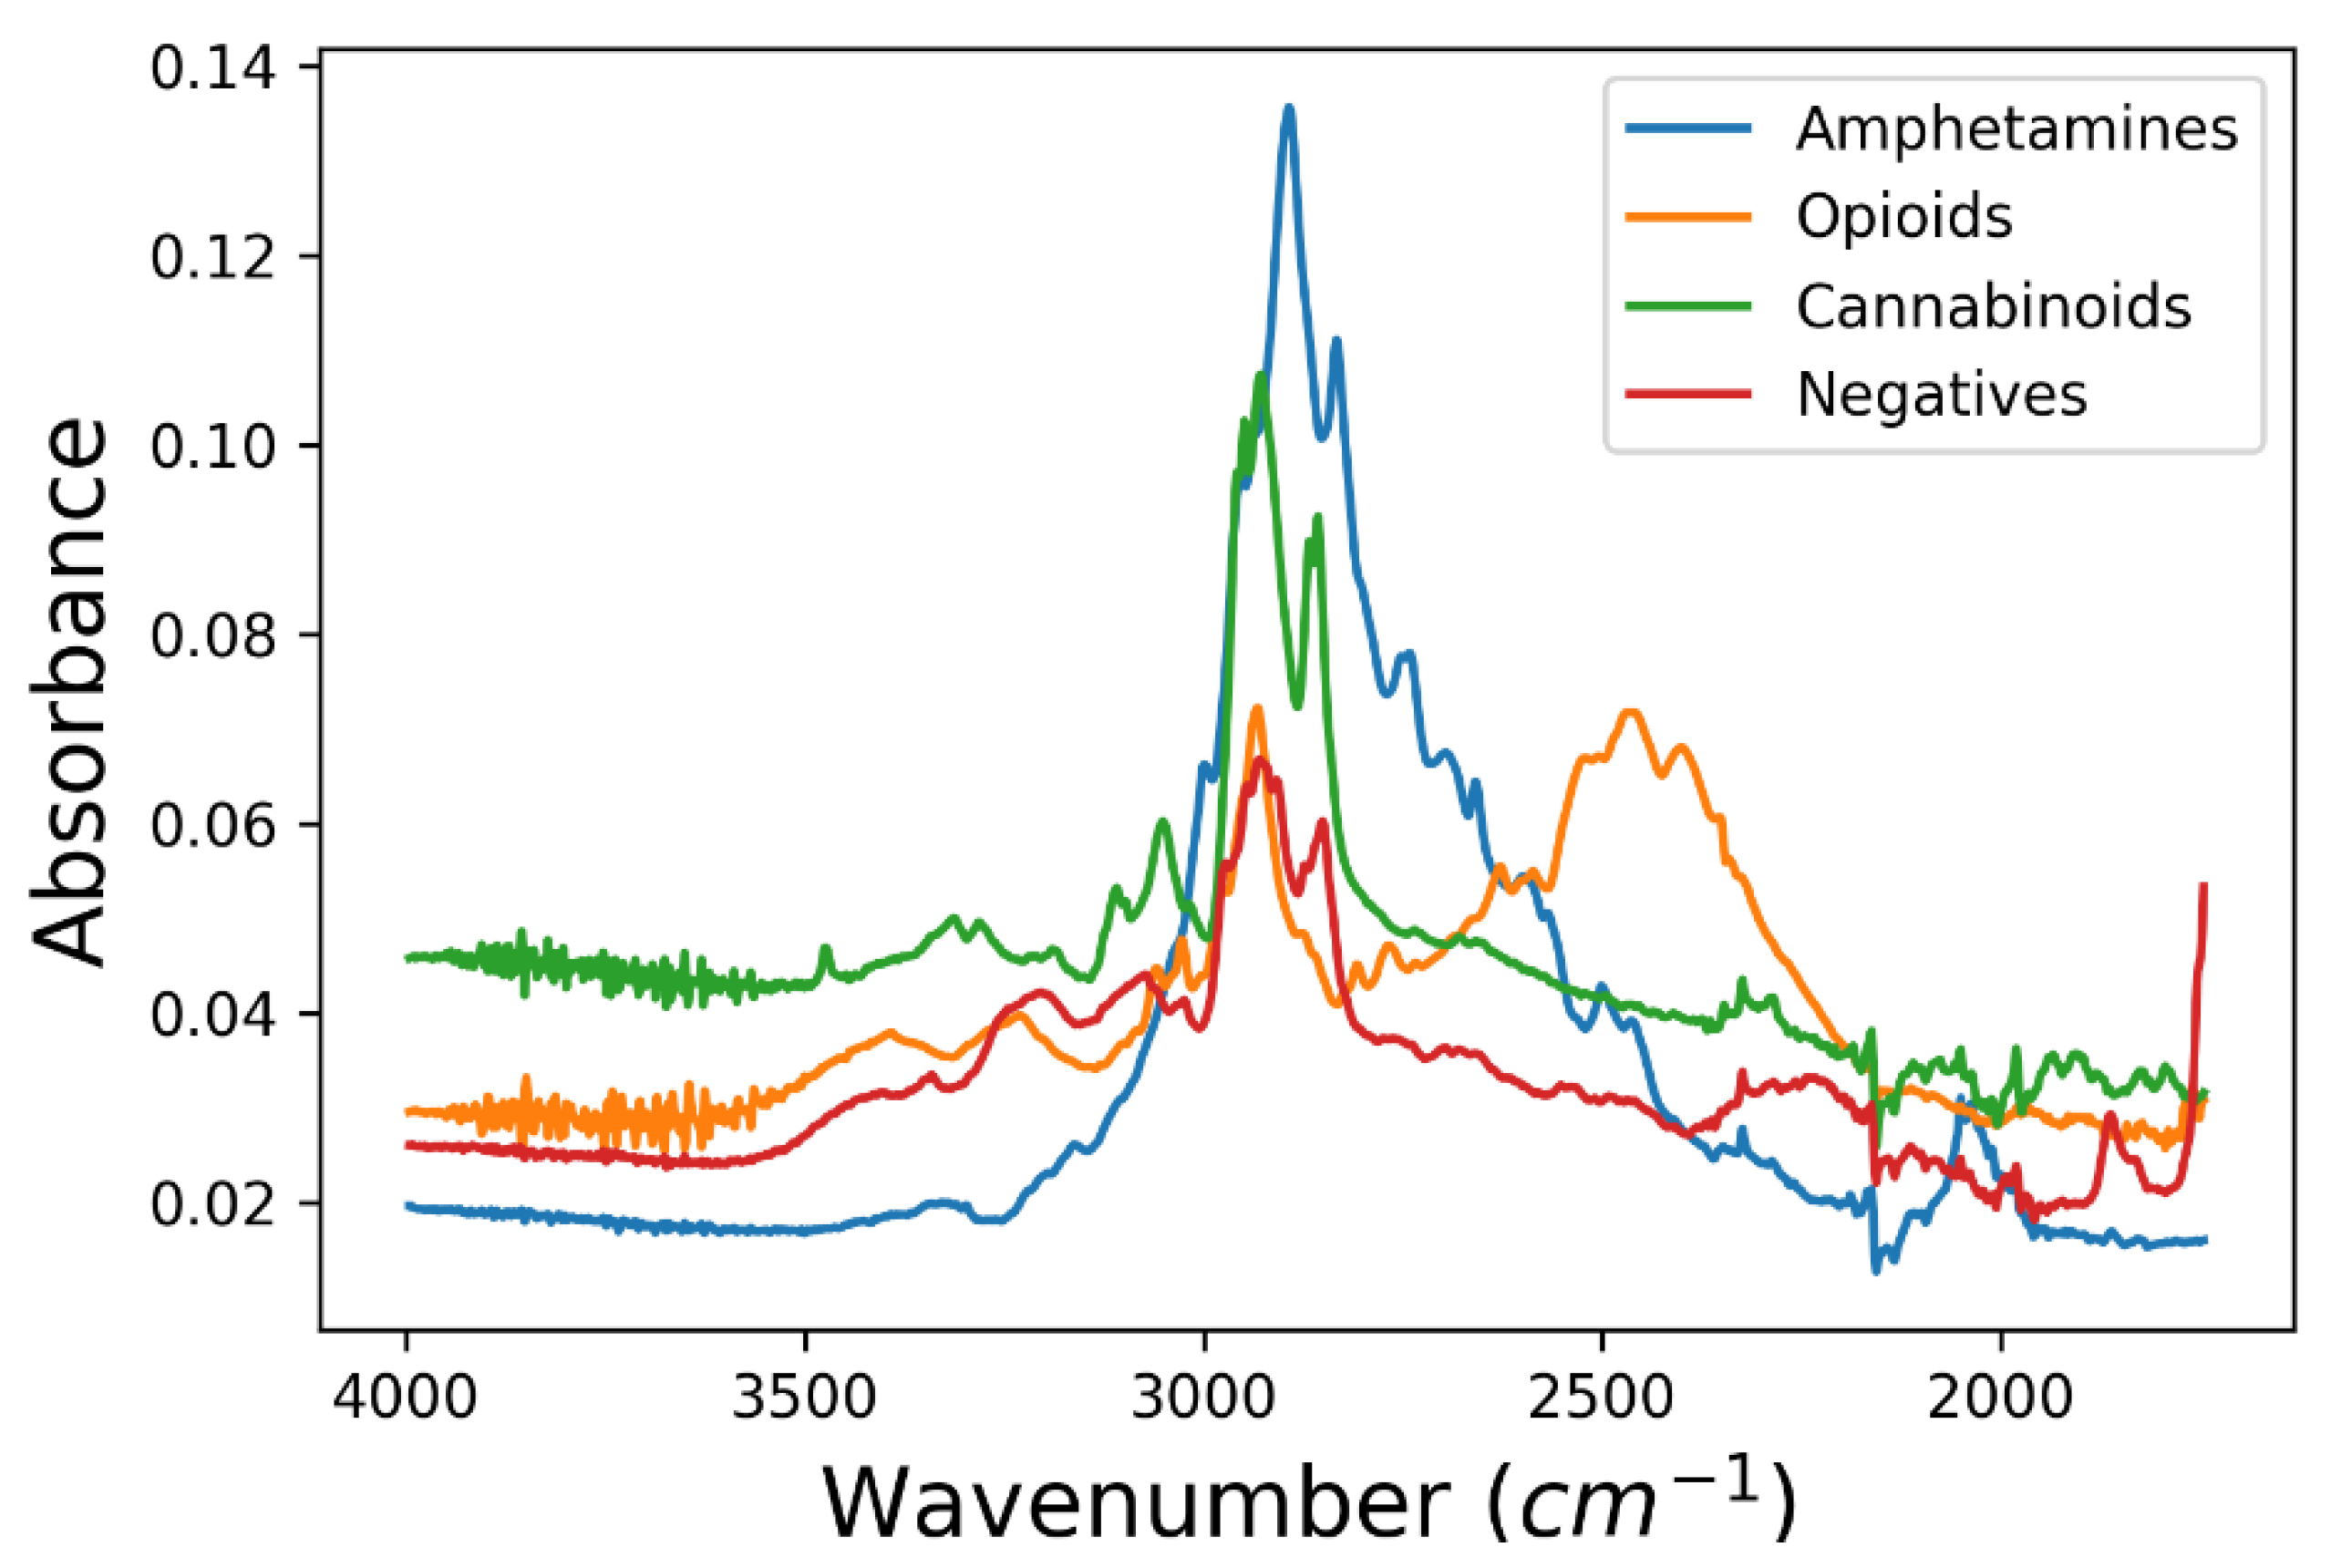
3.2.1. Statistical Measures

To gain a better understanding of the trends in our dataset, we used a series of statistical parameters. The mean was used to assess the central tendency of the data, while the standard deviation was used to measure the amount of dispersion of the data. A low value of the standard deviation indicates that the data values tend to be close to the true value of the set, and a higher value indicates that the data values are spread out on a larger interval.
The skewness considers the extremes of the dataset. A distribution is considered symmetrical if the skewness is between −0.5 and 0.5, moderately skewed if the skewness is between −1 and −0.5 or 0.5 and 1, and highly skewed if the skewness is less than −1 or greater than 1. In his paper on series analysis, Grigoletto [15] argued that the more skewed the data, either positive or negative, the less accurate the analysis is.
Excess kurtosis indicates how much the dataset resembles a normal distribution. This parameter has been successfully used by Loperfido [16] for outlier detection. Distributions similar to the normal distribution are called mesokurtic; those with positive excess kurtosis are referred to as leptokurtic, while distributions with negative excess kurtosis are called platykurtic [17]. Minimum and maximum values were also calculated to account for the peaks of the spectra.

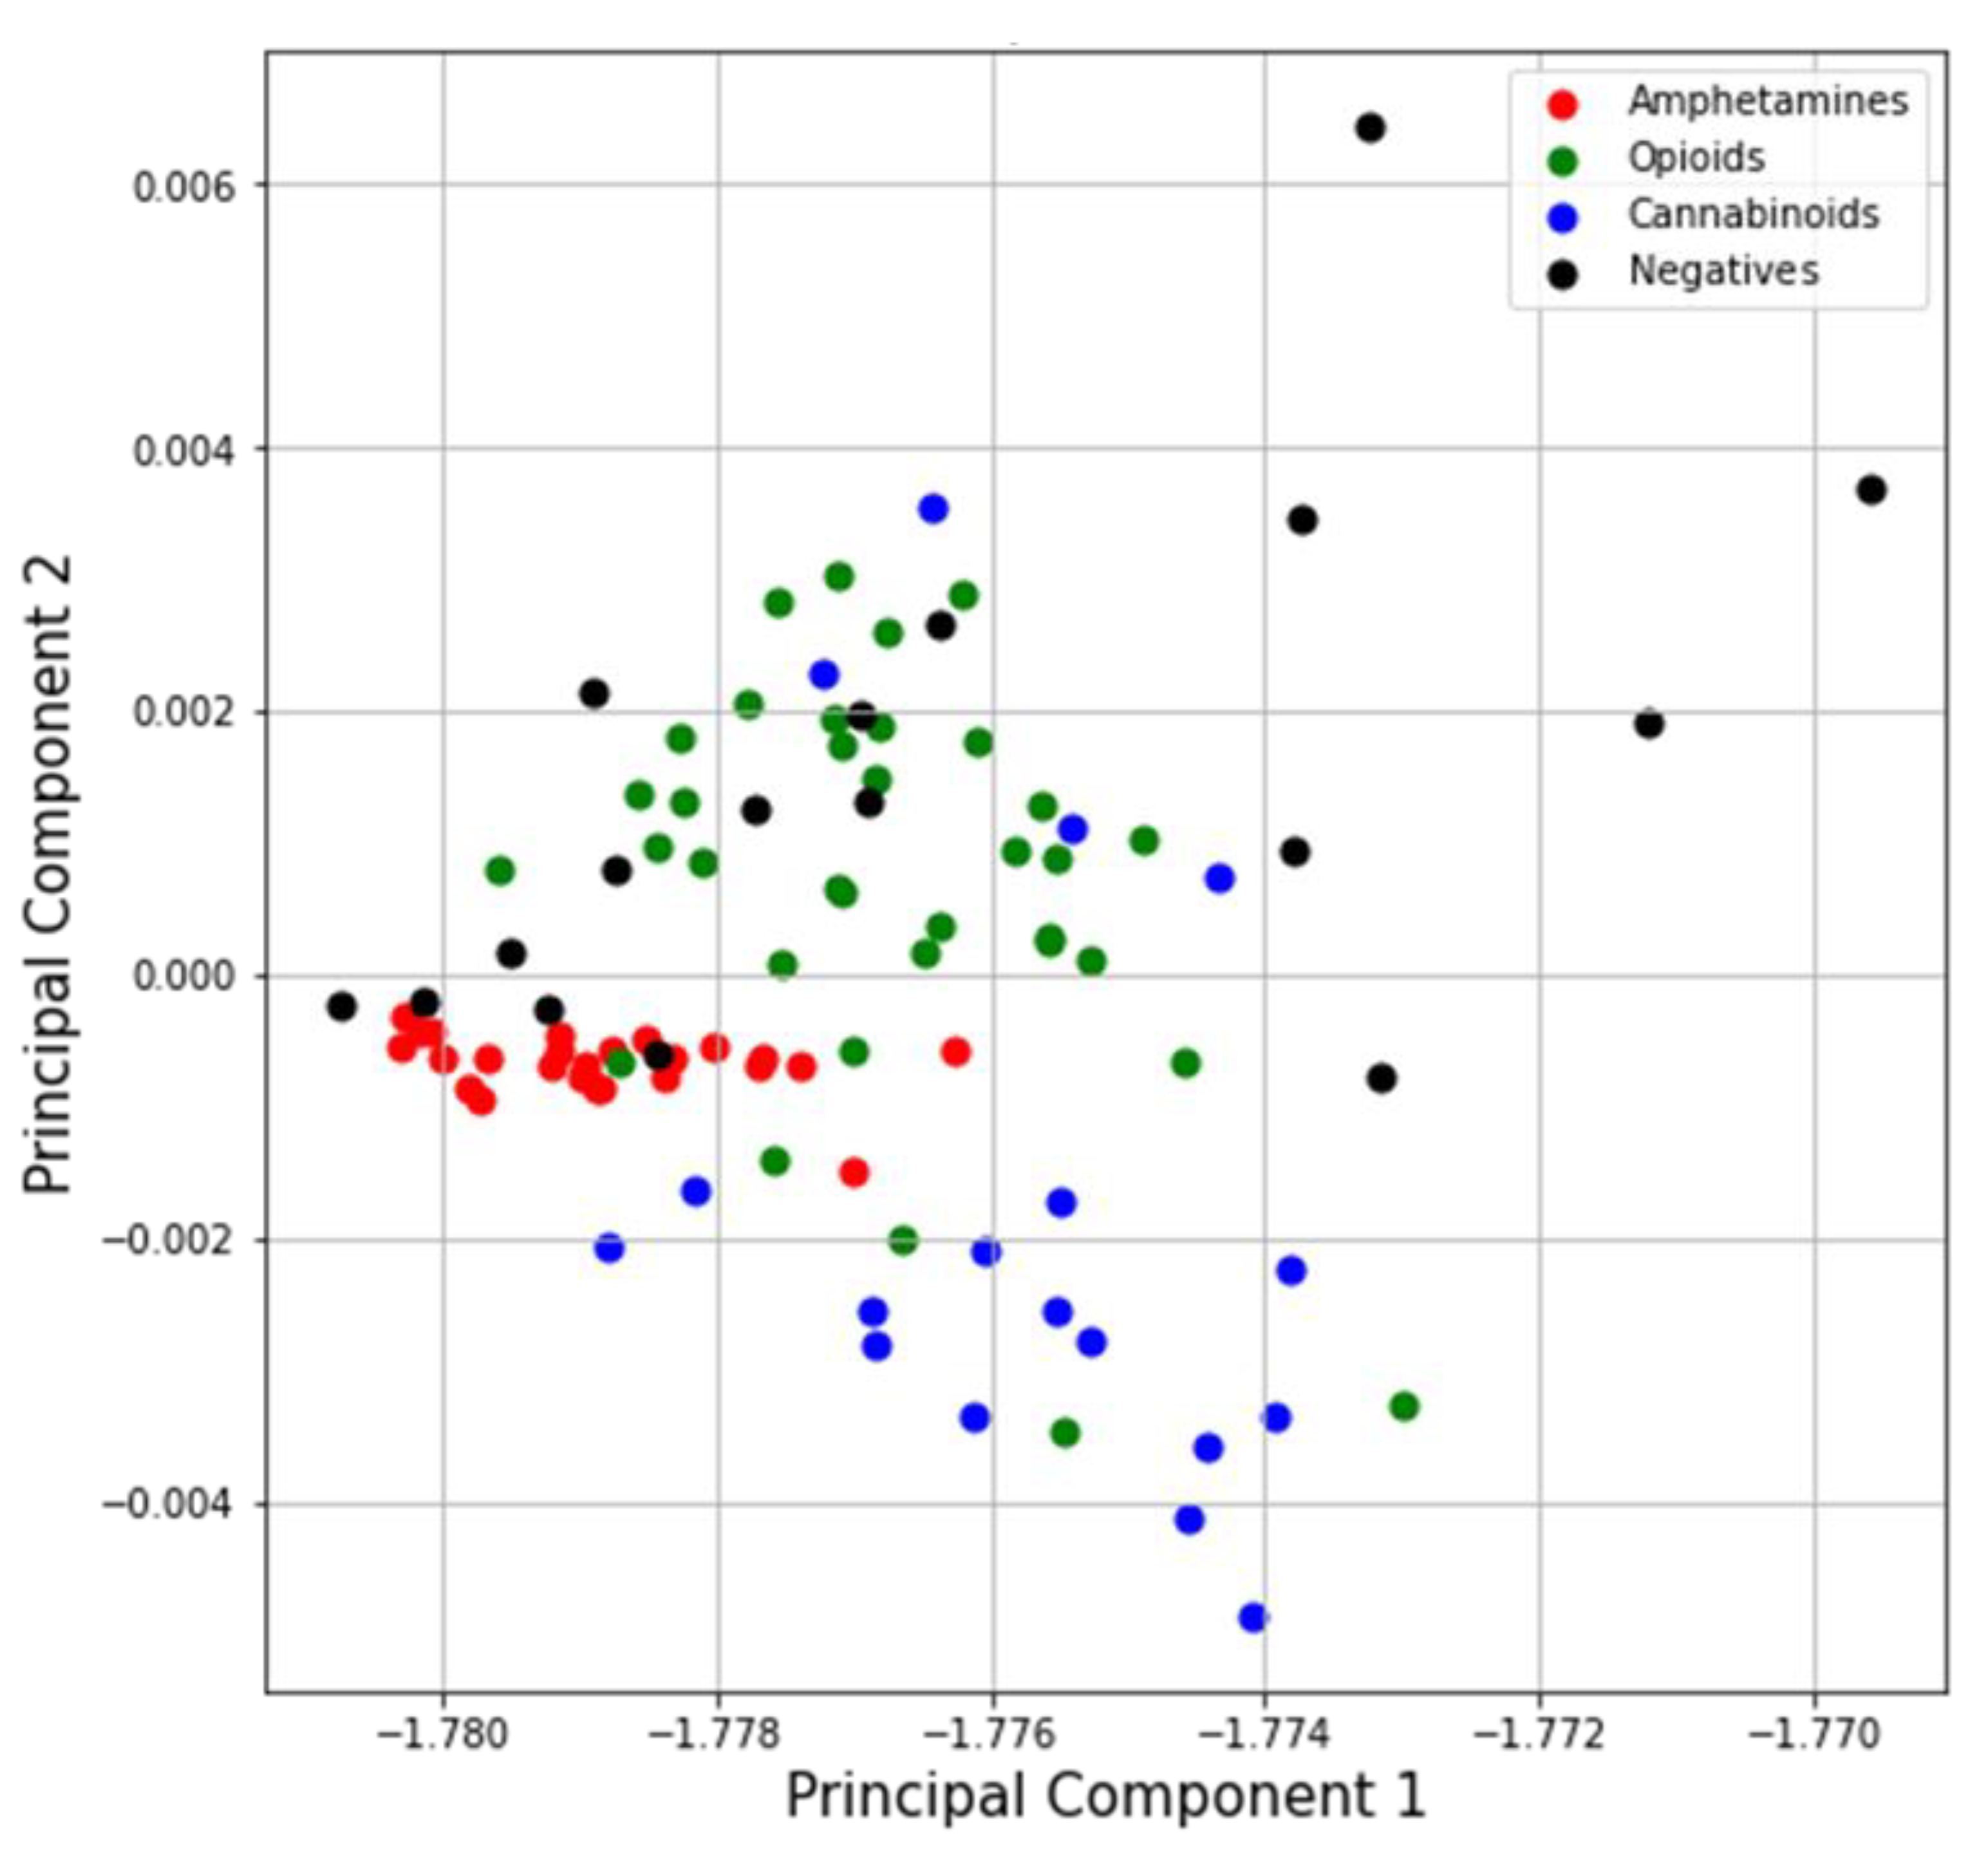
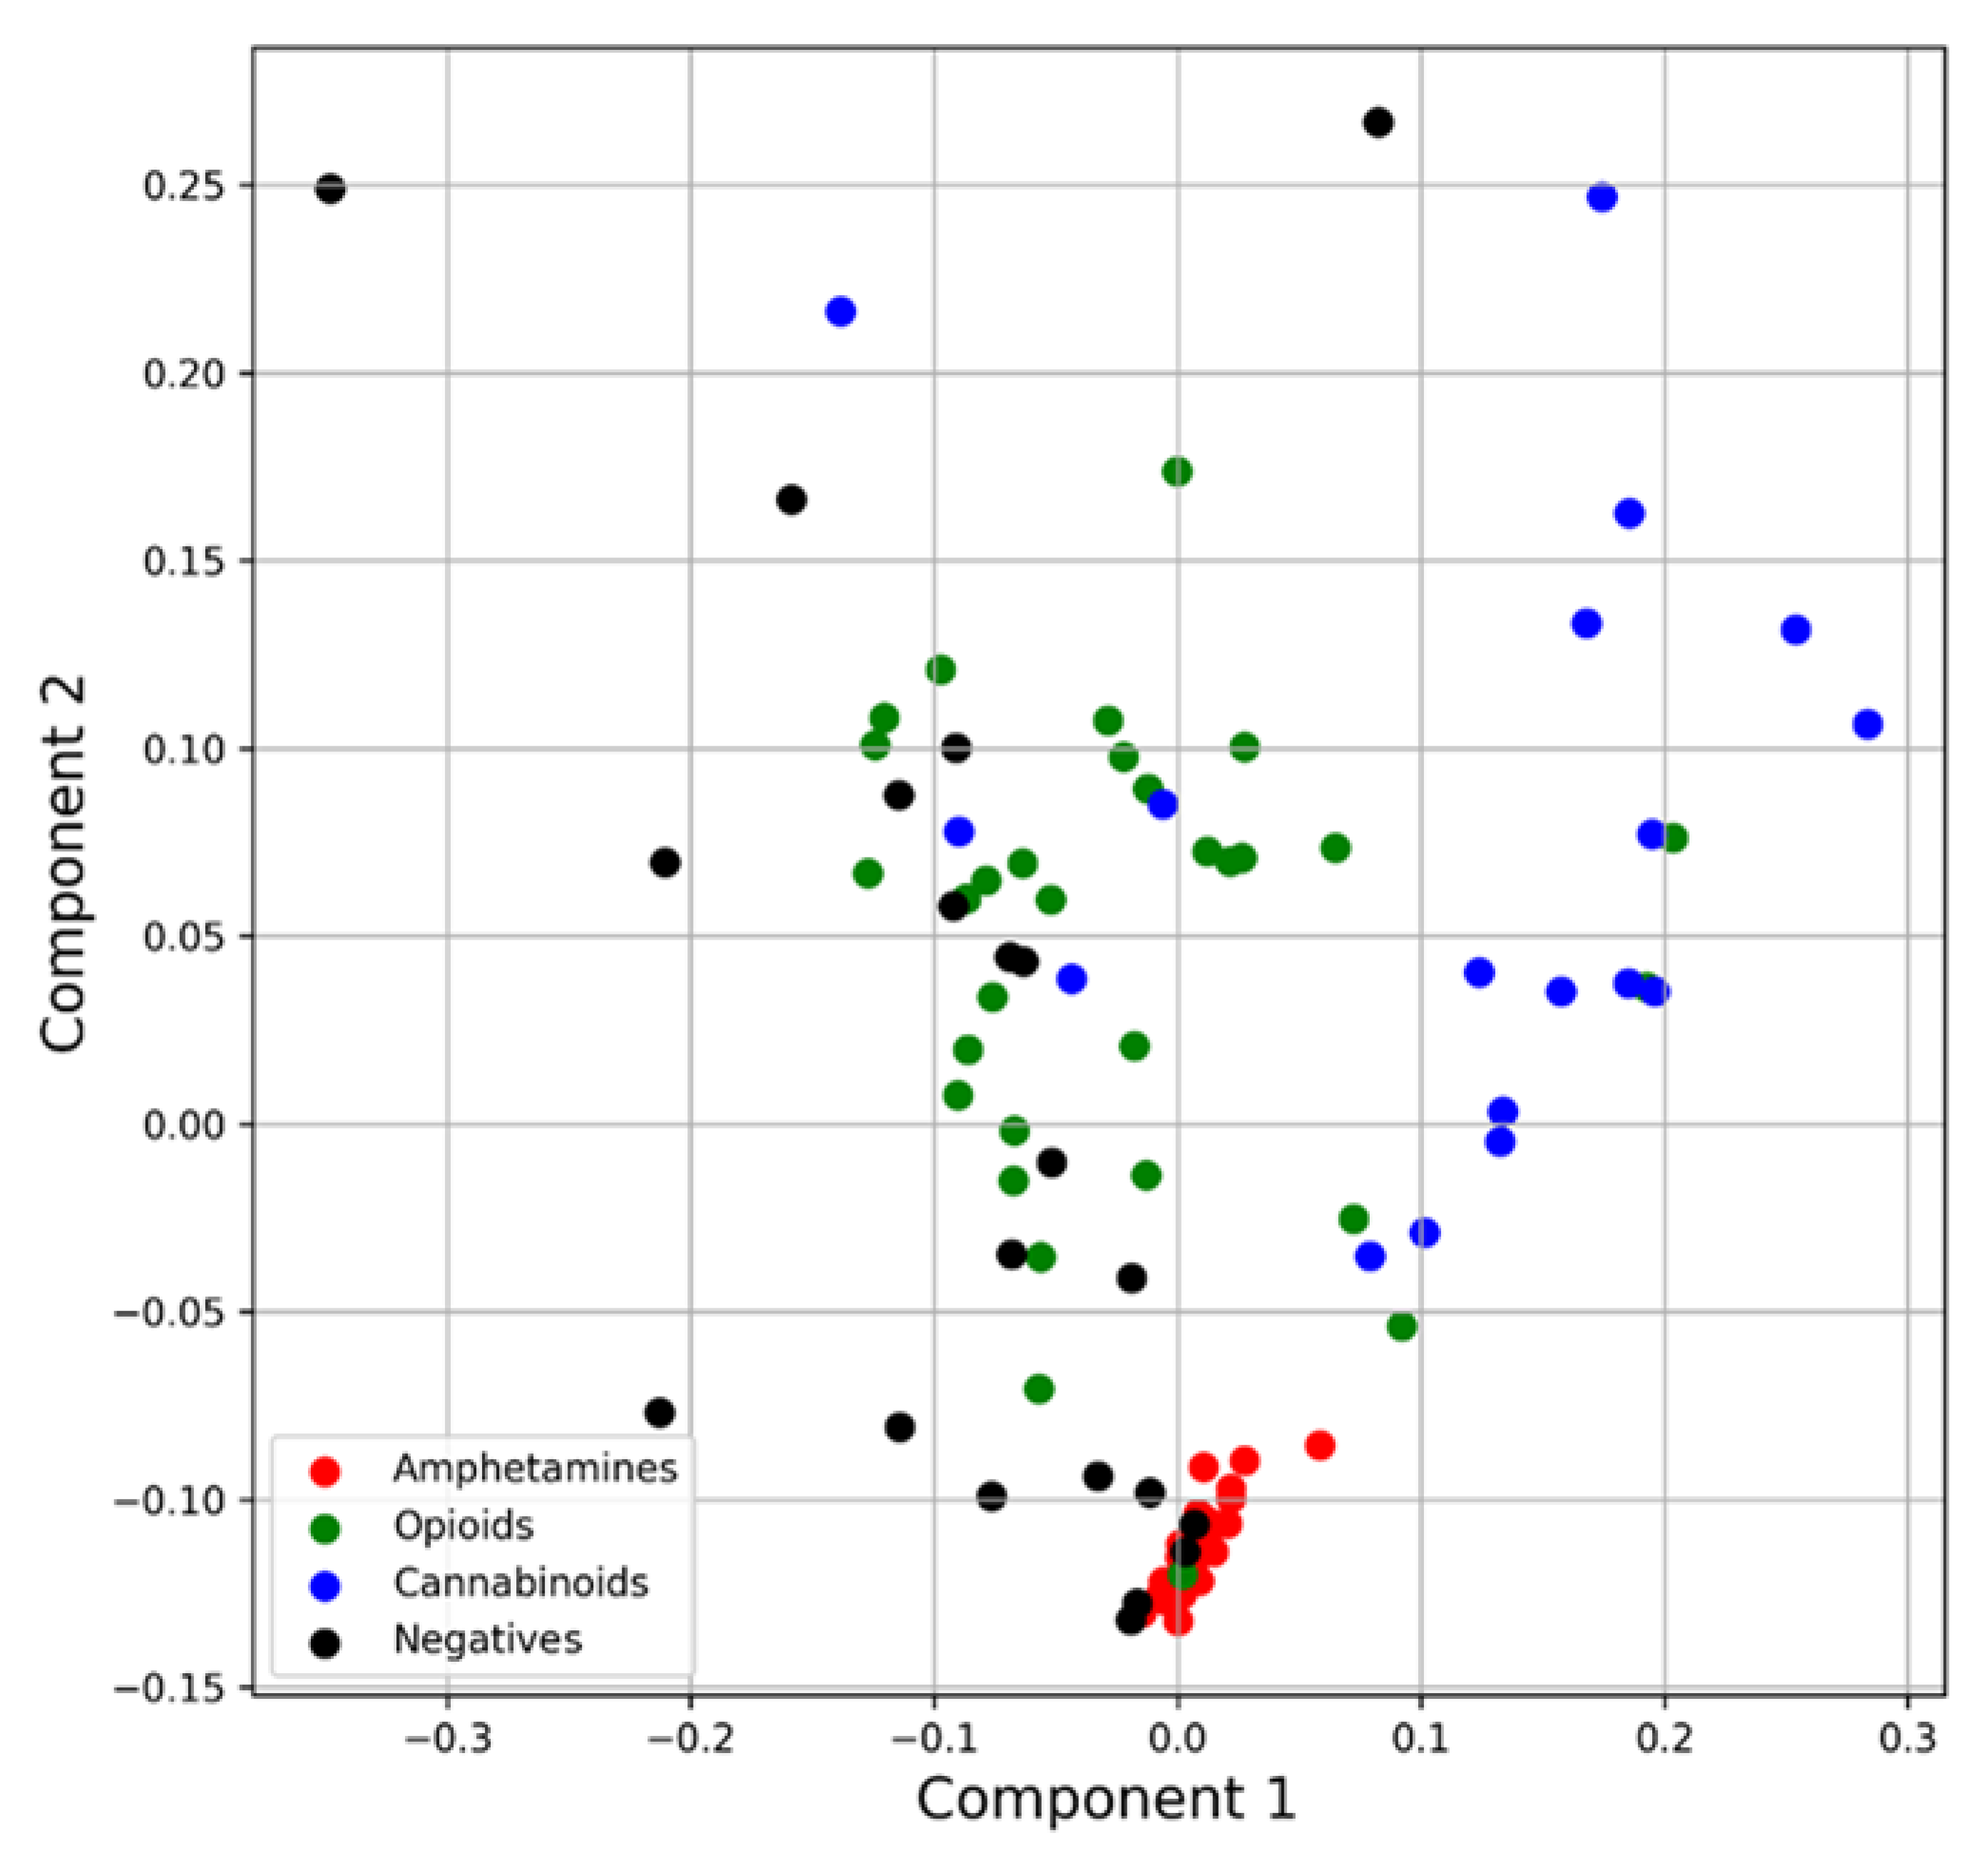
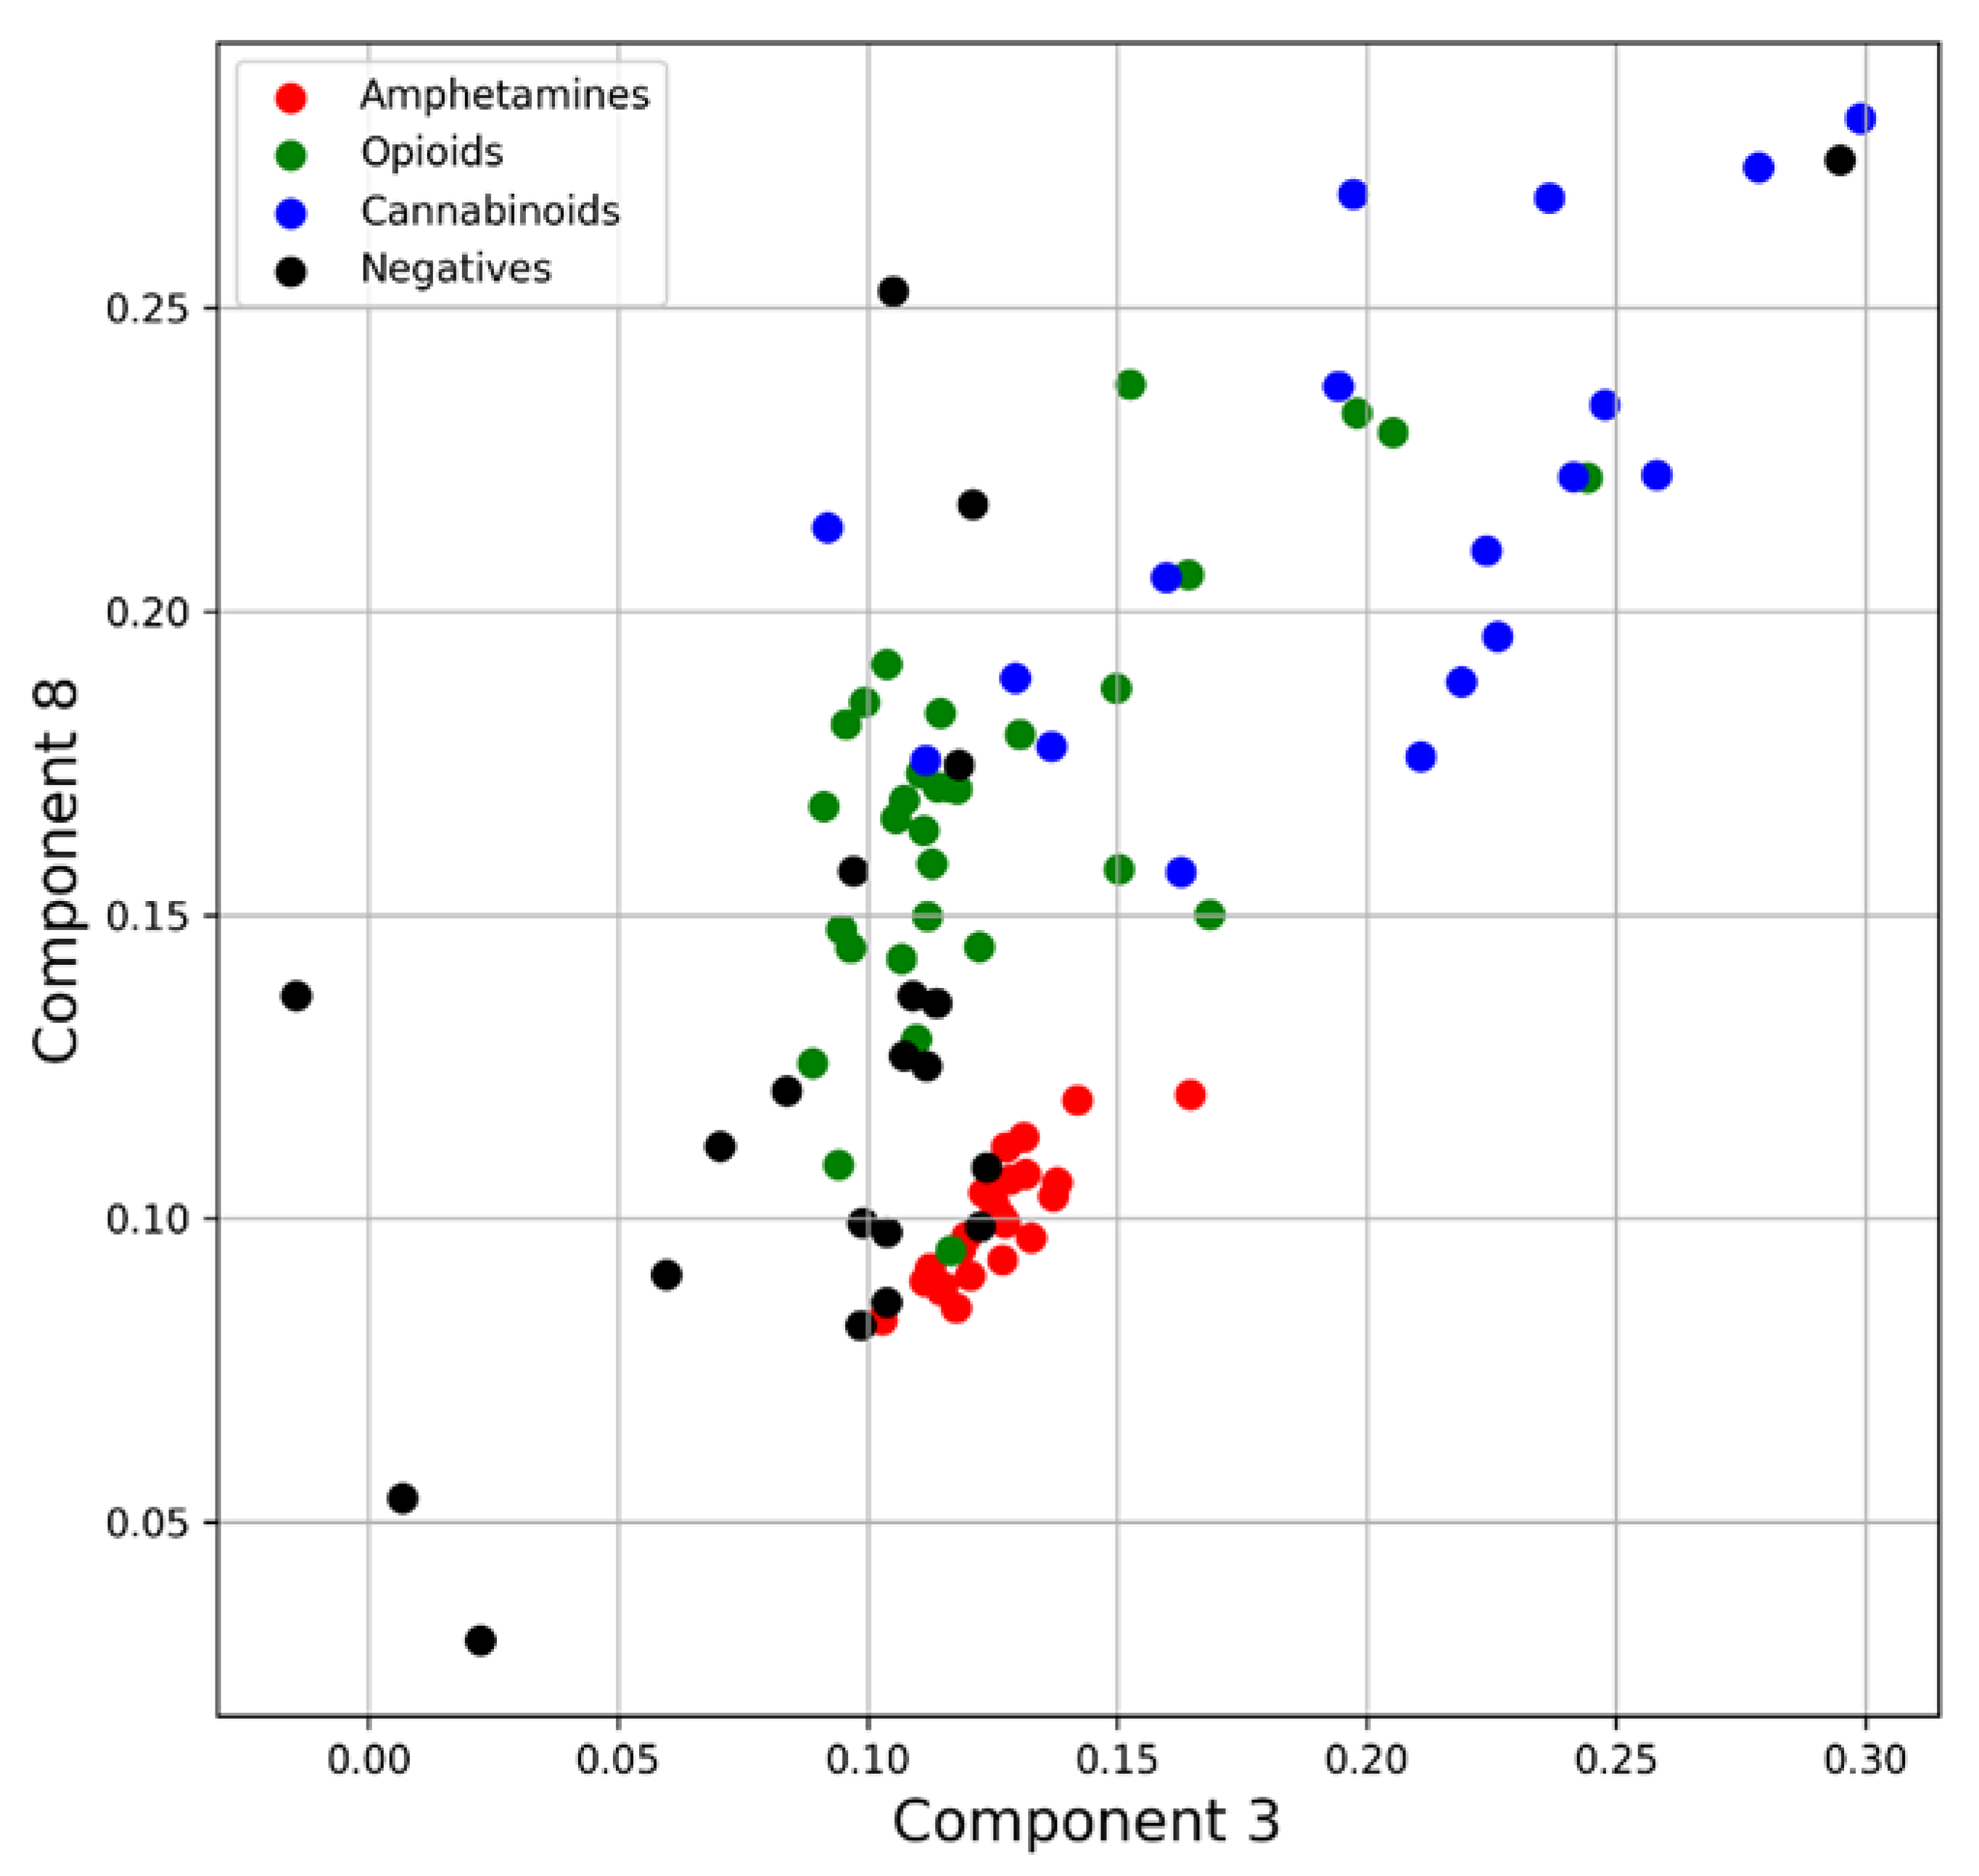
3.2.2. Principal Component Analysis (PCA)

PCA is a multivariate technique [18] that accomplishes dimensionality reduction by linearly transforming the data into a new coordinate system, where the variation in the data can be described with a set of new orthogonal variables, called principal components (PCs). Its advantage is the ability to plot combinations of PC scores in order to identify clusters of closely related data points. PCA was also used as an exploratory analysis method, in order to evaluate to what extent the chosen classes form well-defined clusters.

3.2.3. Independent Component Analysis (ICA)

ICA is a technique often used in signal processing and presumes to separate a multivariate signal into additive subcomponents by making the hypothesis that one subcomponent is Gaussian and all other subcomponents are statistically independent of each other [19]. ICA can also be used for signals that are not generated by mixing, such as our case, where we consider each ATR-FTIR spectrum as a complex multivariate signal. This technique also uses graphical tools to plot combinations of components to identify clusters of similar objects (compounds in our case).
Similarly to PCA, ICA was used as an exploratory method. Even if PCA and ICA have the same role, they differentiate one from another. An important difference is that PCA is focused on dimension reduction, while ICA concentrates on separating information into independent components [20].

3.2.4. Autoencoders

Autoencoders represent a subset of ANN used to obtain efficient representations of data. The algorithm extracts several features and then attempts to recreate the original input from these features [21]. The autoencoder is defined by two functions, i.e., the encoder function and the decoder function. The first step in using these networks is to train both the encoder and the decoder at the same time through gradient descent. The second step consists of removing the decoder part of the model, leaving only the encoder. Thus, the output of a model consists of the key features of the input. Those features can be used in the same way as with PCA or ICA for a two-dimensional representation of spectra. In our paper, we used a linear autoencoder trained on the whole dataset with an encoding dimension of 10. For the graphical representation, we chose the best features for cluster formation.

3.3. Machine Learning Methods (MLM)

Multiclass classification of the analyzed spectra was then performed with five machine learning models, i.e., SVM [22], eXtreme Gradient Boosting (XGB) [23], Random Forest [24], Gradient Boosting [25], and KNN [26]. These models were chosen due to their efficiency, simplicity, and their fast implementation. Such models have been successfully used to classify counterfeit drugs based on their infrared spectra [27].
For all the models, the dataset was randomly split into two partitions, summing up 60% of all spectra for training and 40% for testing. Each model was then trained on the training set and evaluated on the testing set. The model, training, and test datasets were then deleted. We define this process as a training session. Although the initial dataset for each session was the same, the training and testing sets were different at each iteration, because the entries were randomly selected each time. In other words, the models were trained and evaluated each time on different selections of the same dataset. Each training session was repeated 10 times. Furthermore, the hyperparameter selection was performed using the Optuna 3.1.0 hyperparameter optimization framework.
The following parameters were calculated in order to assess and compare the performances of the models:
S e n s i t i v i t y ( T P R ) = T P T P + F N
S p e c i f i c i t y ( T N R ) = T N T N + F P
B a l a n c e d   a c c u r a c y ( T N R ) = T P R + T N R 2
M a t t h e w s   c o r r e l a t i o n   c o e f f i c i e n t = T P × T N F P × F N ( T P + F P ) ( T P + F N ) ( T N + F P ) ( T N + F N )
where TP is the number of true positives, TN is the number of true negatives, FP is the number of false positives, and FN is the number of false negatives.

4. Results and Discussions

4.1. Exploratory Data Analysis

4.1.1. Statistical Measures

The purpose of the statistical analysis was to better understand the relationship between the three classes of drugs of abuse and the class of negatives. First, the mean ATR-FTIR spectrum was calculated for each class for the qualitative assessment of the data. The results, illustrated in Figure 1, indicate that all the targeted classes have the main peak near 2800 cm−1. The strongest peak characterizes the amphetamines, followed by the cannabinoids, opioids, and negatives. Although the peak at 2800 cm−1 of opioids and negatives have nearly the same intensity, their mean spectra can be easily differentiated because the opioids have a second relatively strong peak at 2400 cm−1.
The statistical parameters calculated for the mean spectra are presented in Table 2. In terms of the central tendency of the spectra, the mean values vary only between 0.0338 and 0.0452. The data dispersion shows that the class of amphetamines stands out with a standard deviation of 0.0263, almost double of the next one, determined for the class of cannabinoids. The relatively large standard deviation of the class of amphetamines indicates that the spectra of these compounds are less similar than those included in the other classes. This is probably due to the fact that the class of hallucinogenic amphetamines is formed by three subclasses of compounds, i.e., 2C-x, DOx, and NBOMe amphetamines.
The skewness of the spectra of each class indicates that none ranges between −0.5 and 0.5, so none of the analyzed classes of compounds has a symmetrical distribution. The class of negatives is a moderately skewed dataset, as its skewness ranges between 0.5 and 1. The sets formed by the spectra of the three modeled classes of positives have skewness values larger than 1, so they are highly skewed.
The distributions of the spectra of the three classes of positives are leptokurtic, as they have large excess kurtosis. The largest excess kurtosis is recorded for the cannabinoids. The negatives have a mesokurtic distribution. The excess kurtosis of this group being very small (close to zero), their distribution may be considered practically normal. The results obtained for the negatives are consistent with the fact that it contains the highest diversity of substances, with the rest of the classes consisting of substances with very similar molecular structures and hence very similar ATR-FTIR spectra.

4.1.2. Principal Component Analysis

A two-component PCA was then performed as a preliminary exploratory analysis. Figure 2 displays the score plot obtained for the first two PCs, which indicates that the amphetamines form the most compact cluster. The points associated with the opioid and cannabinoid compounds are much more spread out. Many of the points associated with the negatives are overlying the clusters formed by the positives, especially the cluster of opioids.

4.1.3. Independent Component Analysis

The score plot obtained with a three-component ICA is displayed in Figure 3. It indicates that ICA leads to better clustering, especially for the class of amphetamines. The opioids and the cannabinoids also show a better grouping than in the case of PCA. There is practically no improvement in the group of negatives, their associated points being scattered on nearly the whole plot.

4.1.4. Transformers

The results obtained with 10 component transformers are presented in Figure 4. For the class of amphetamines, this method leads to results similar to those obtained with ICA. However, there is an improvement in the other three modeled classes: the opioid and cannabinoid classes are more clearly separated, and the negatives tend to be better discriminated as well.

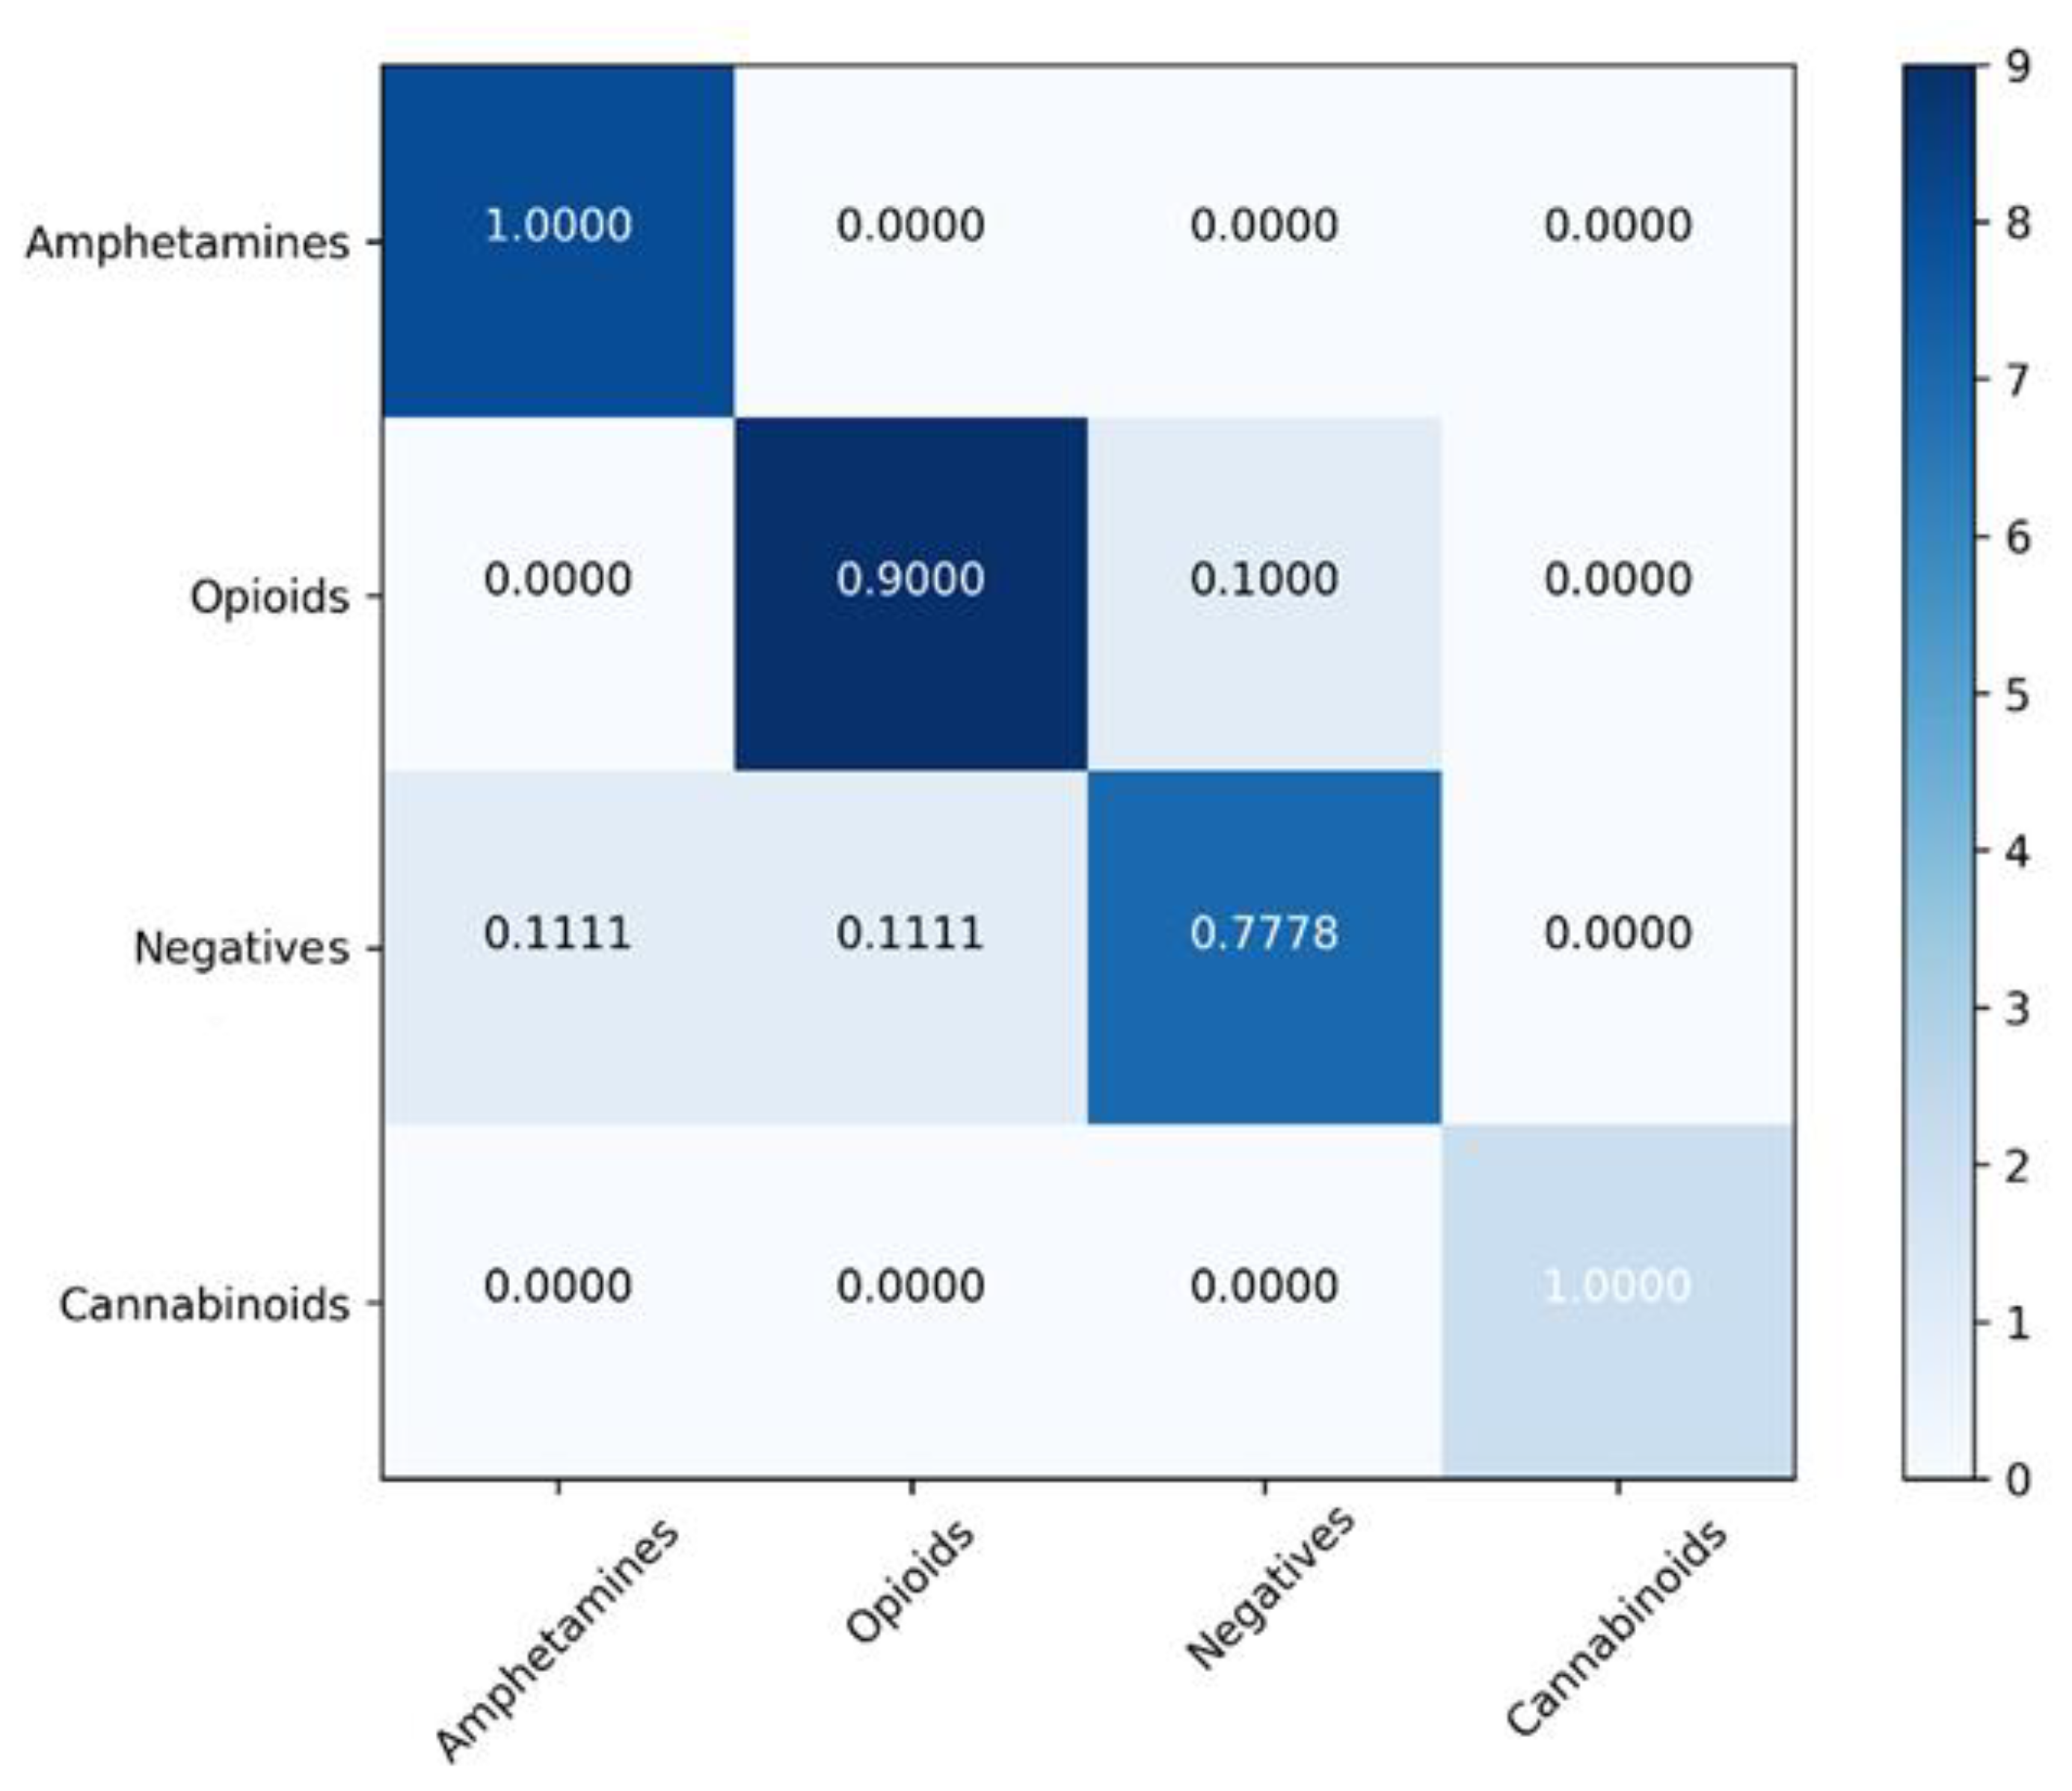
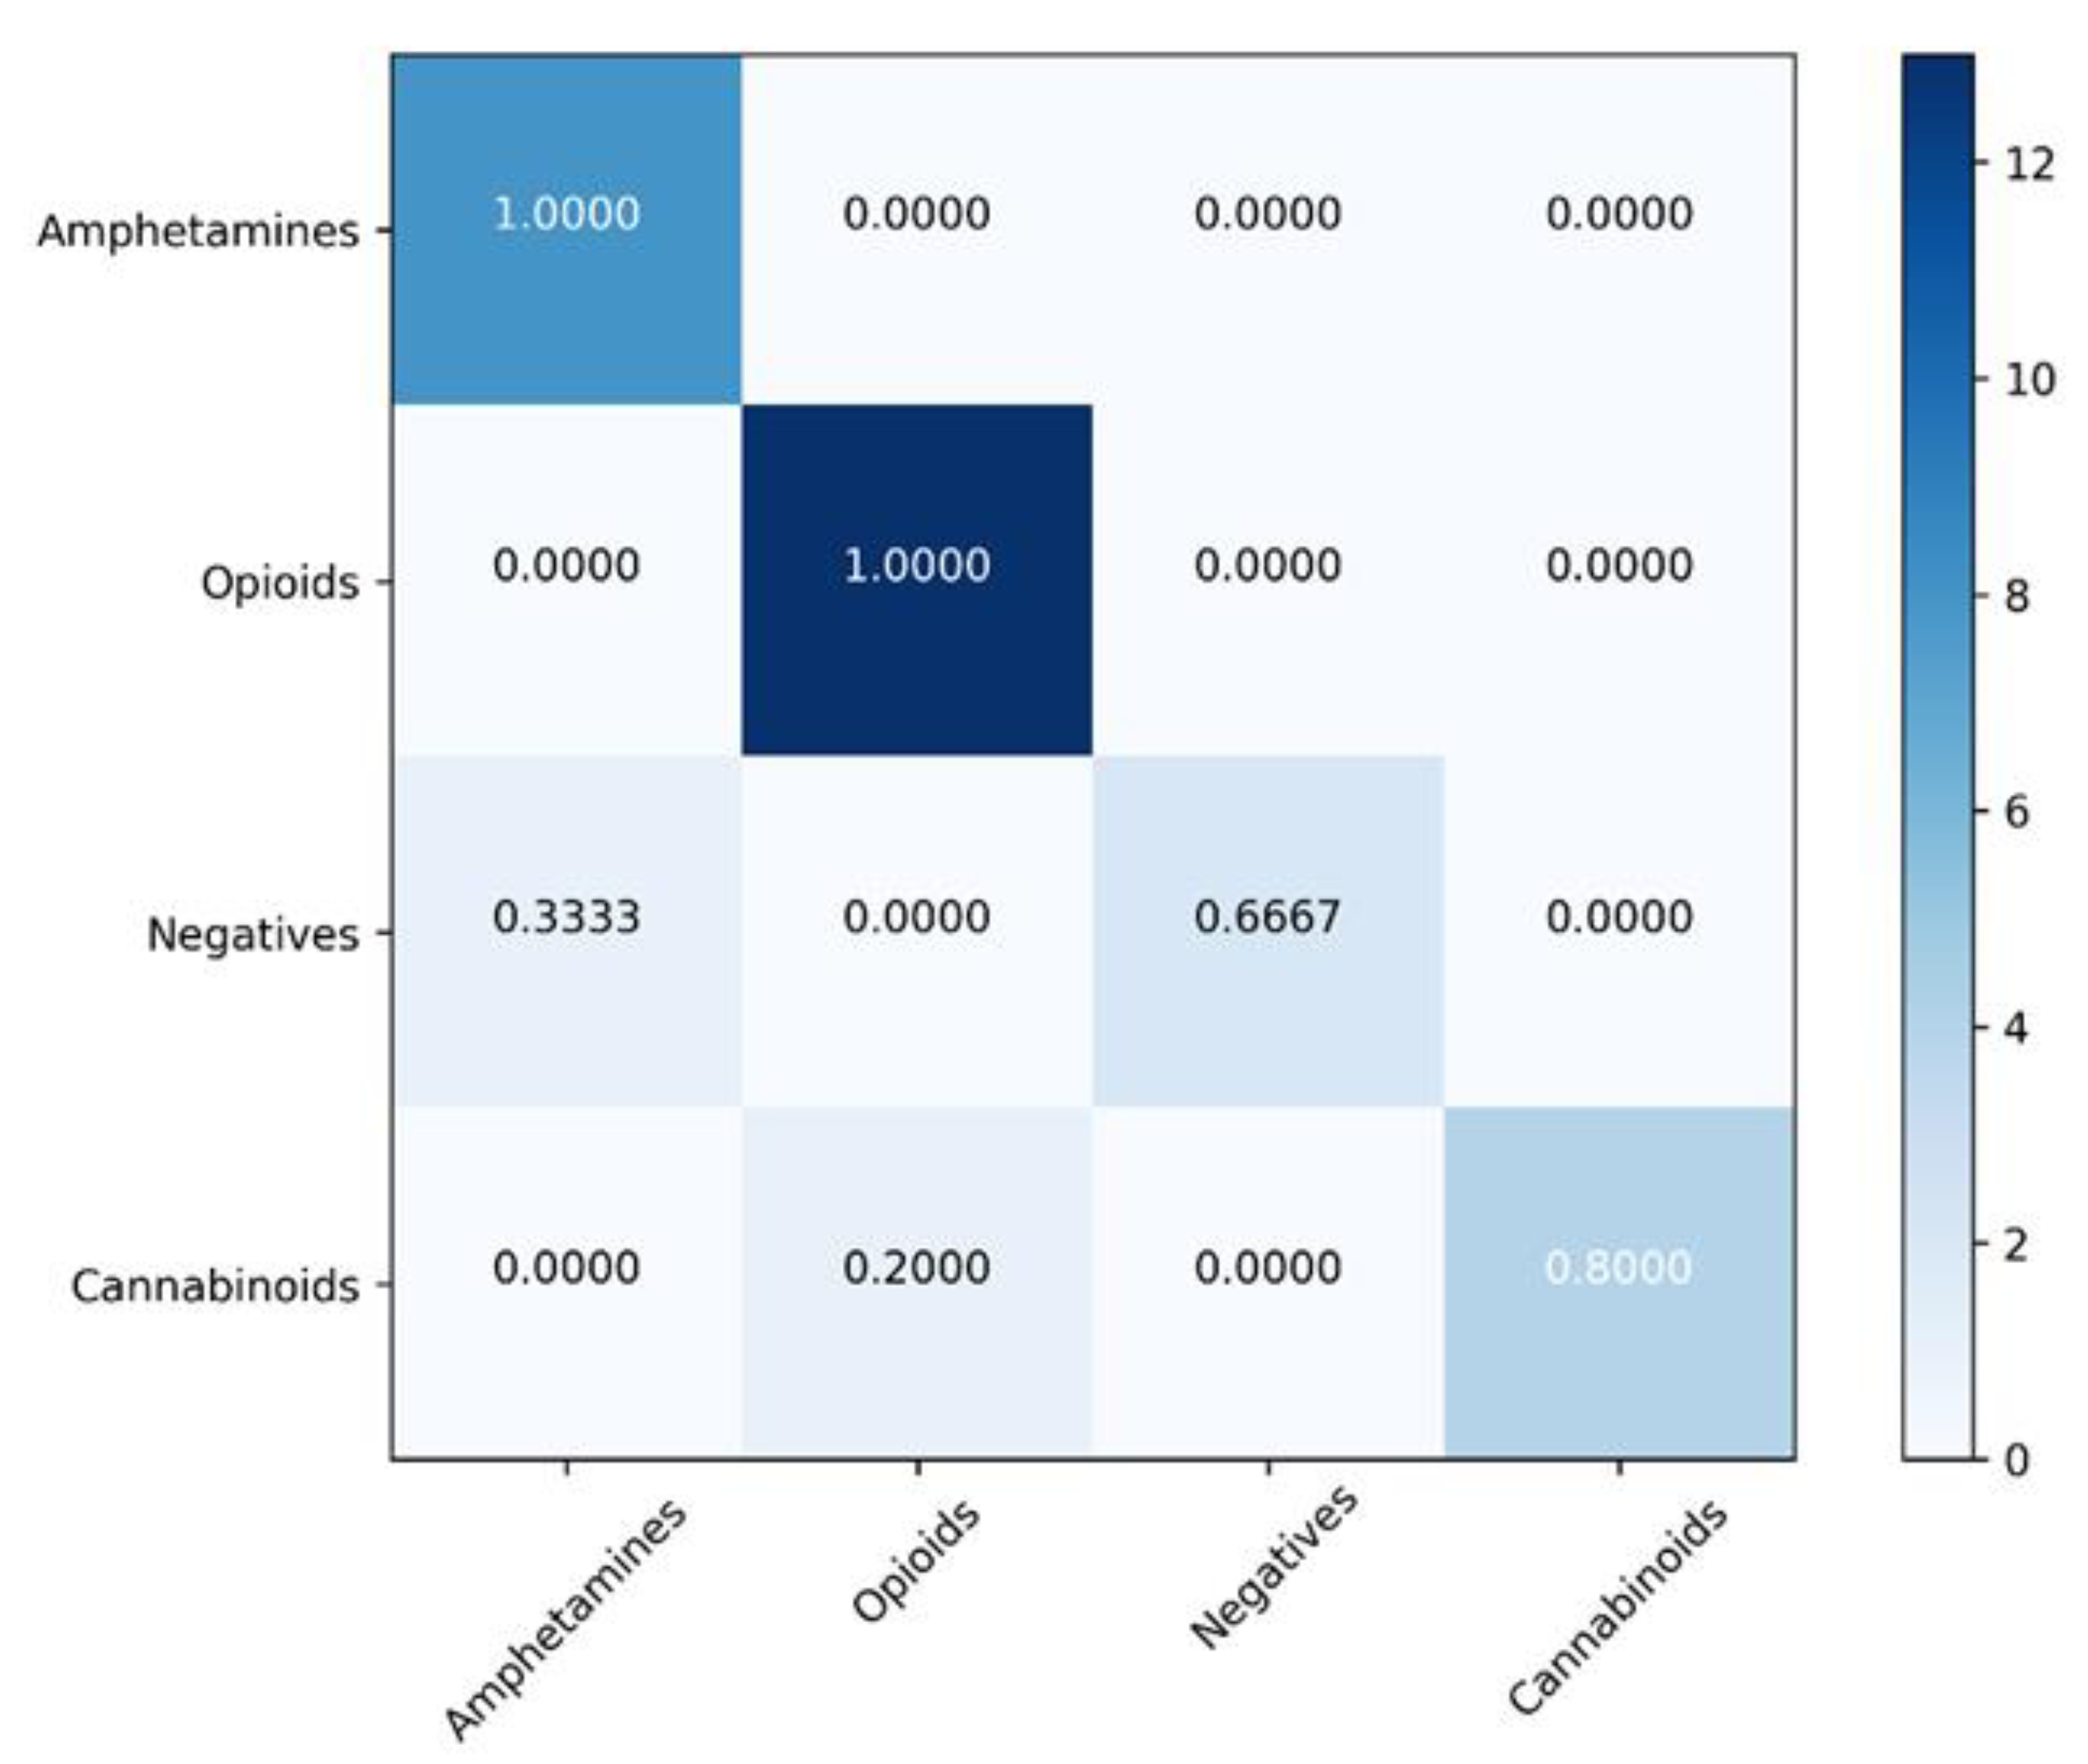
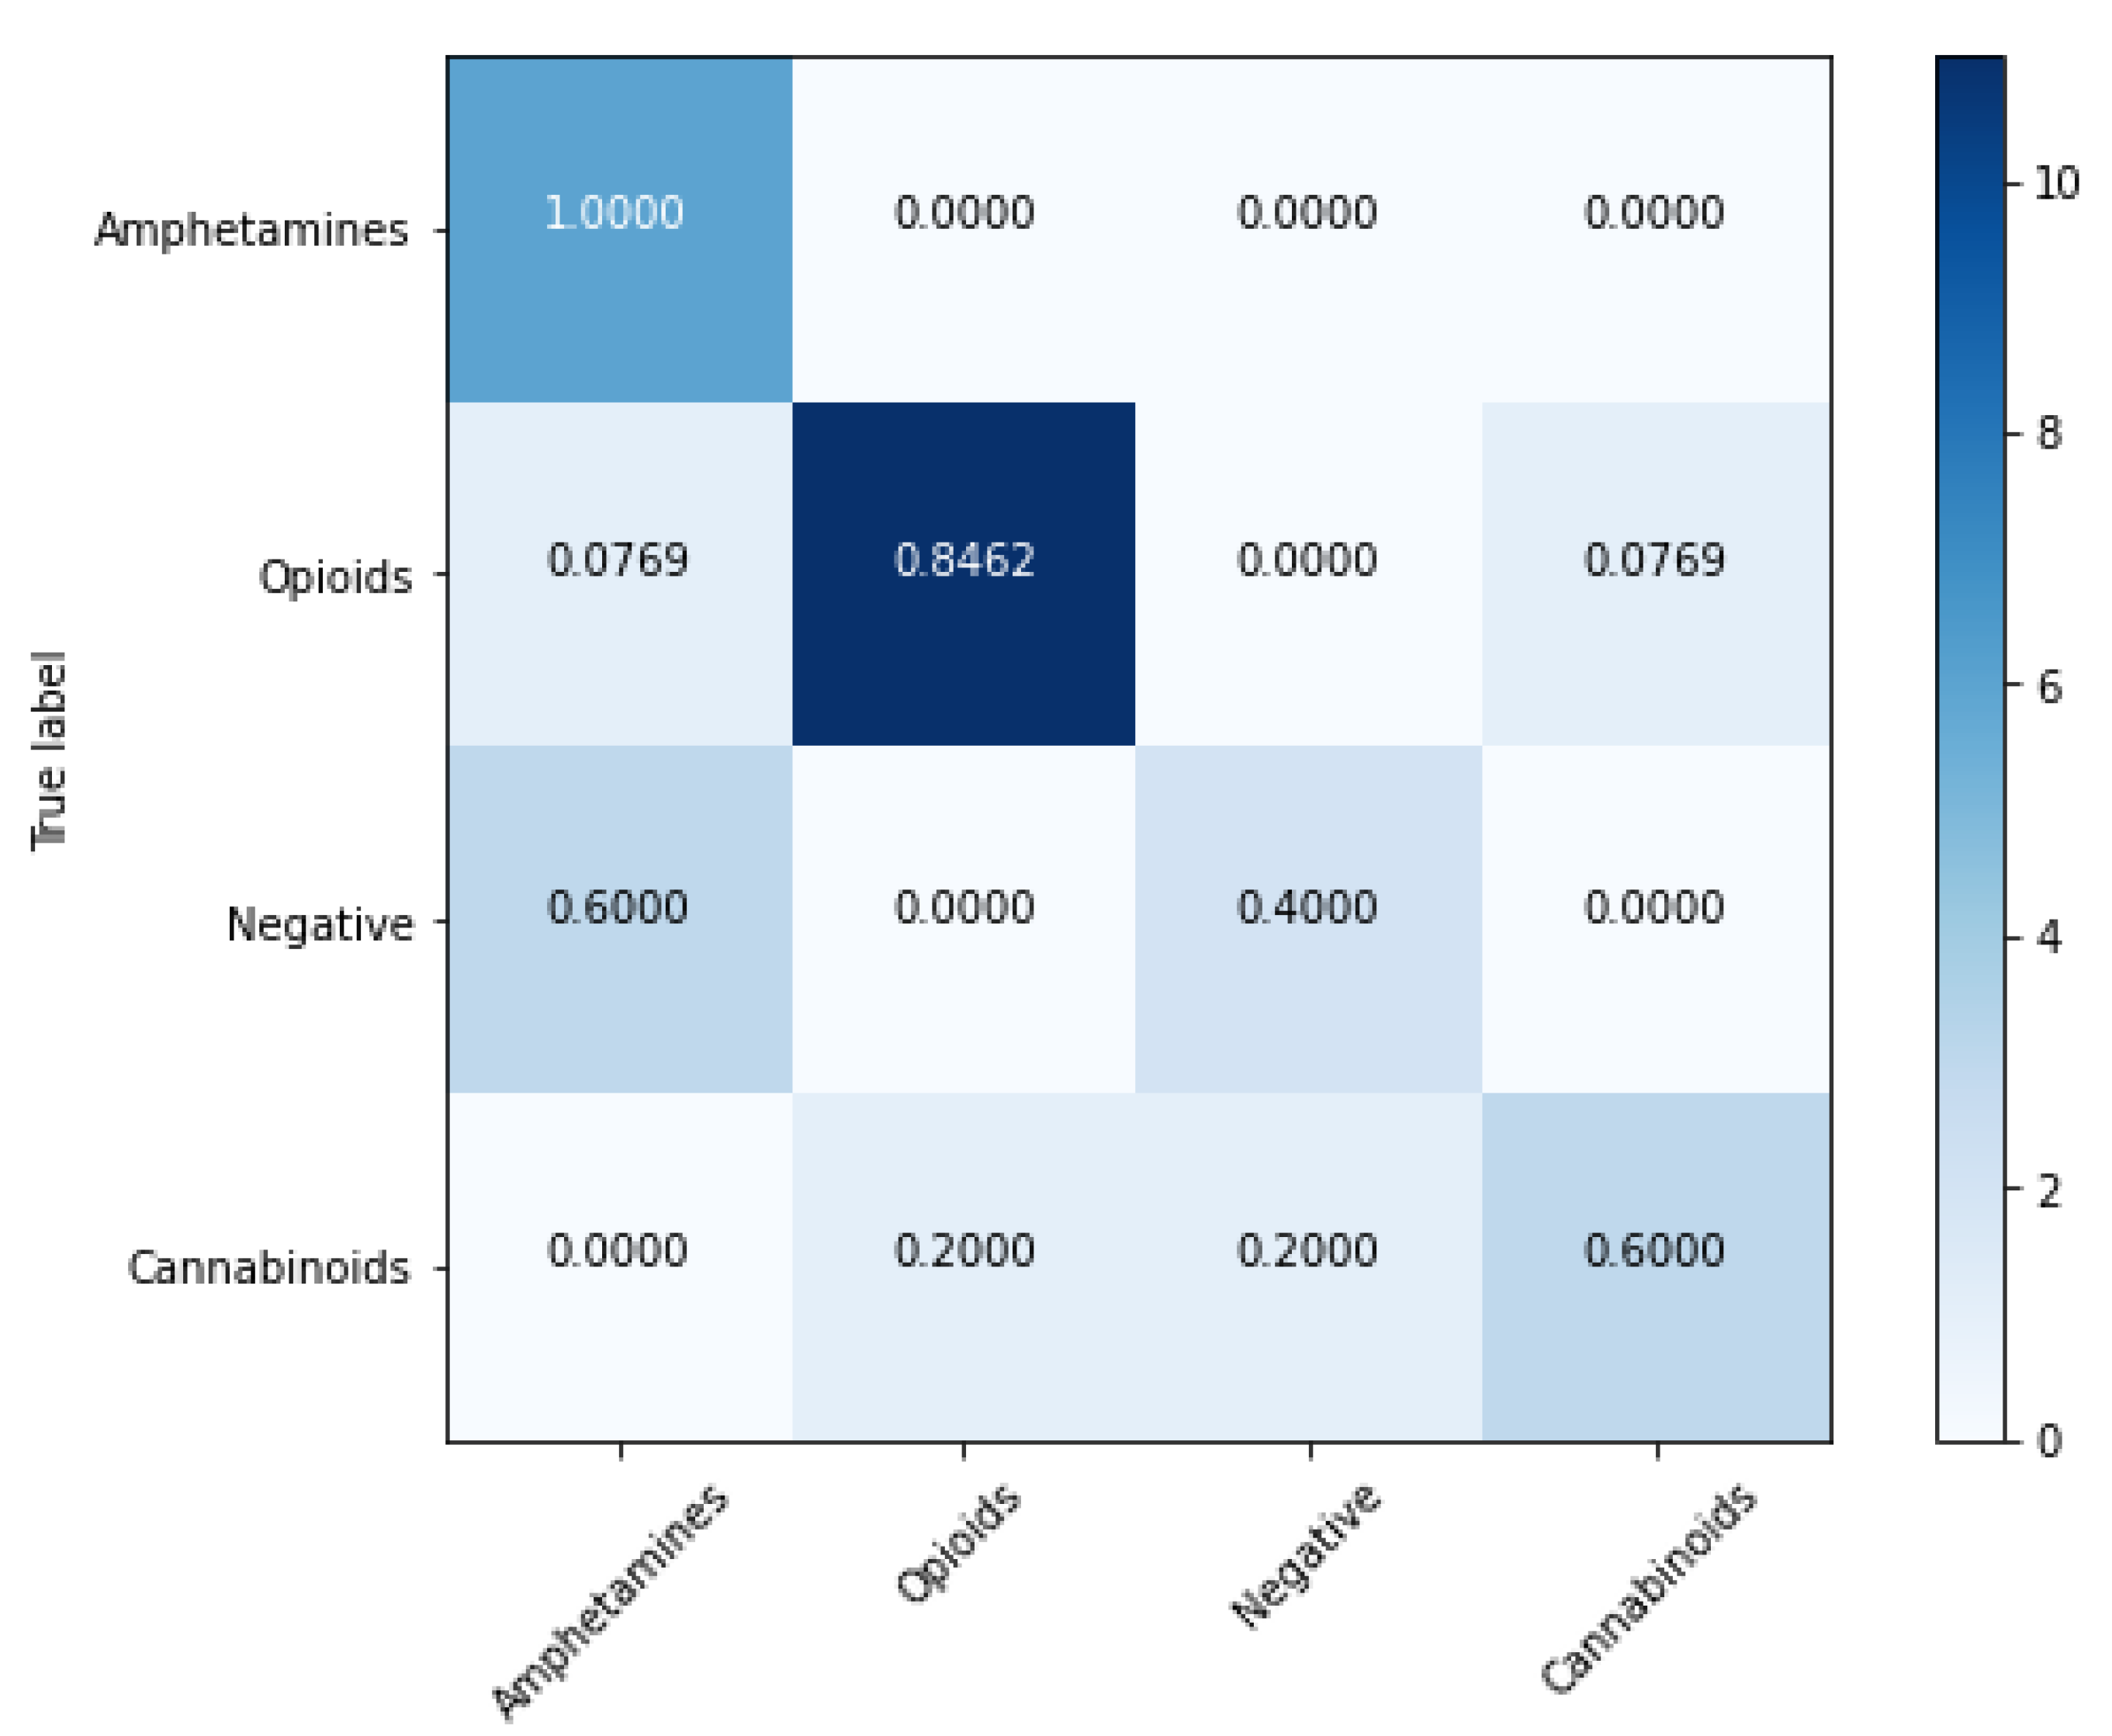
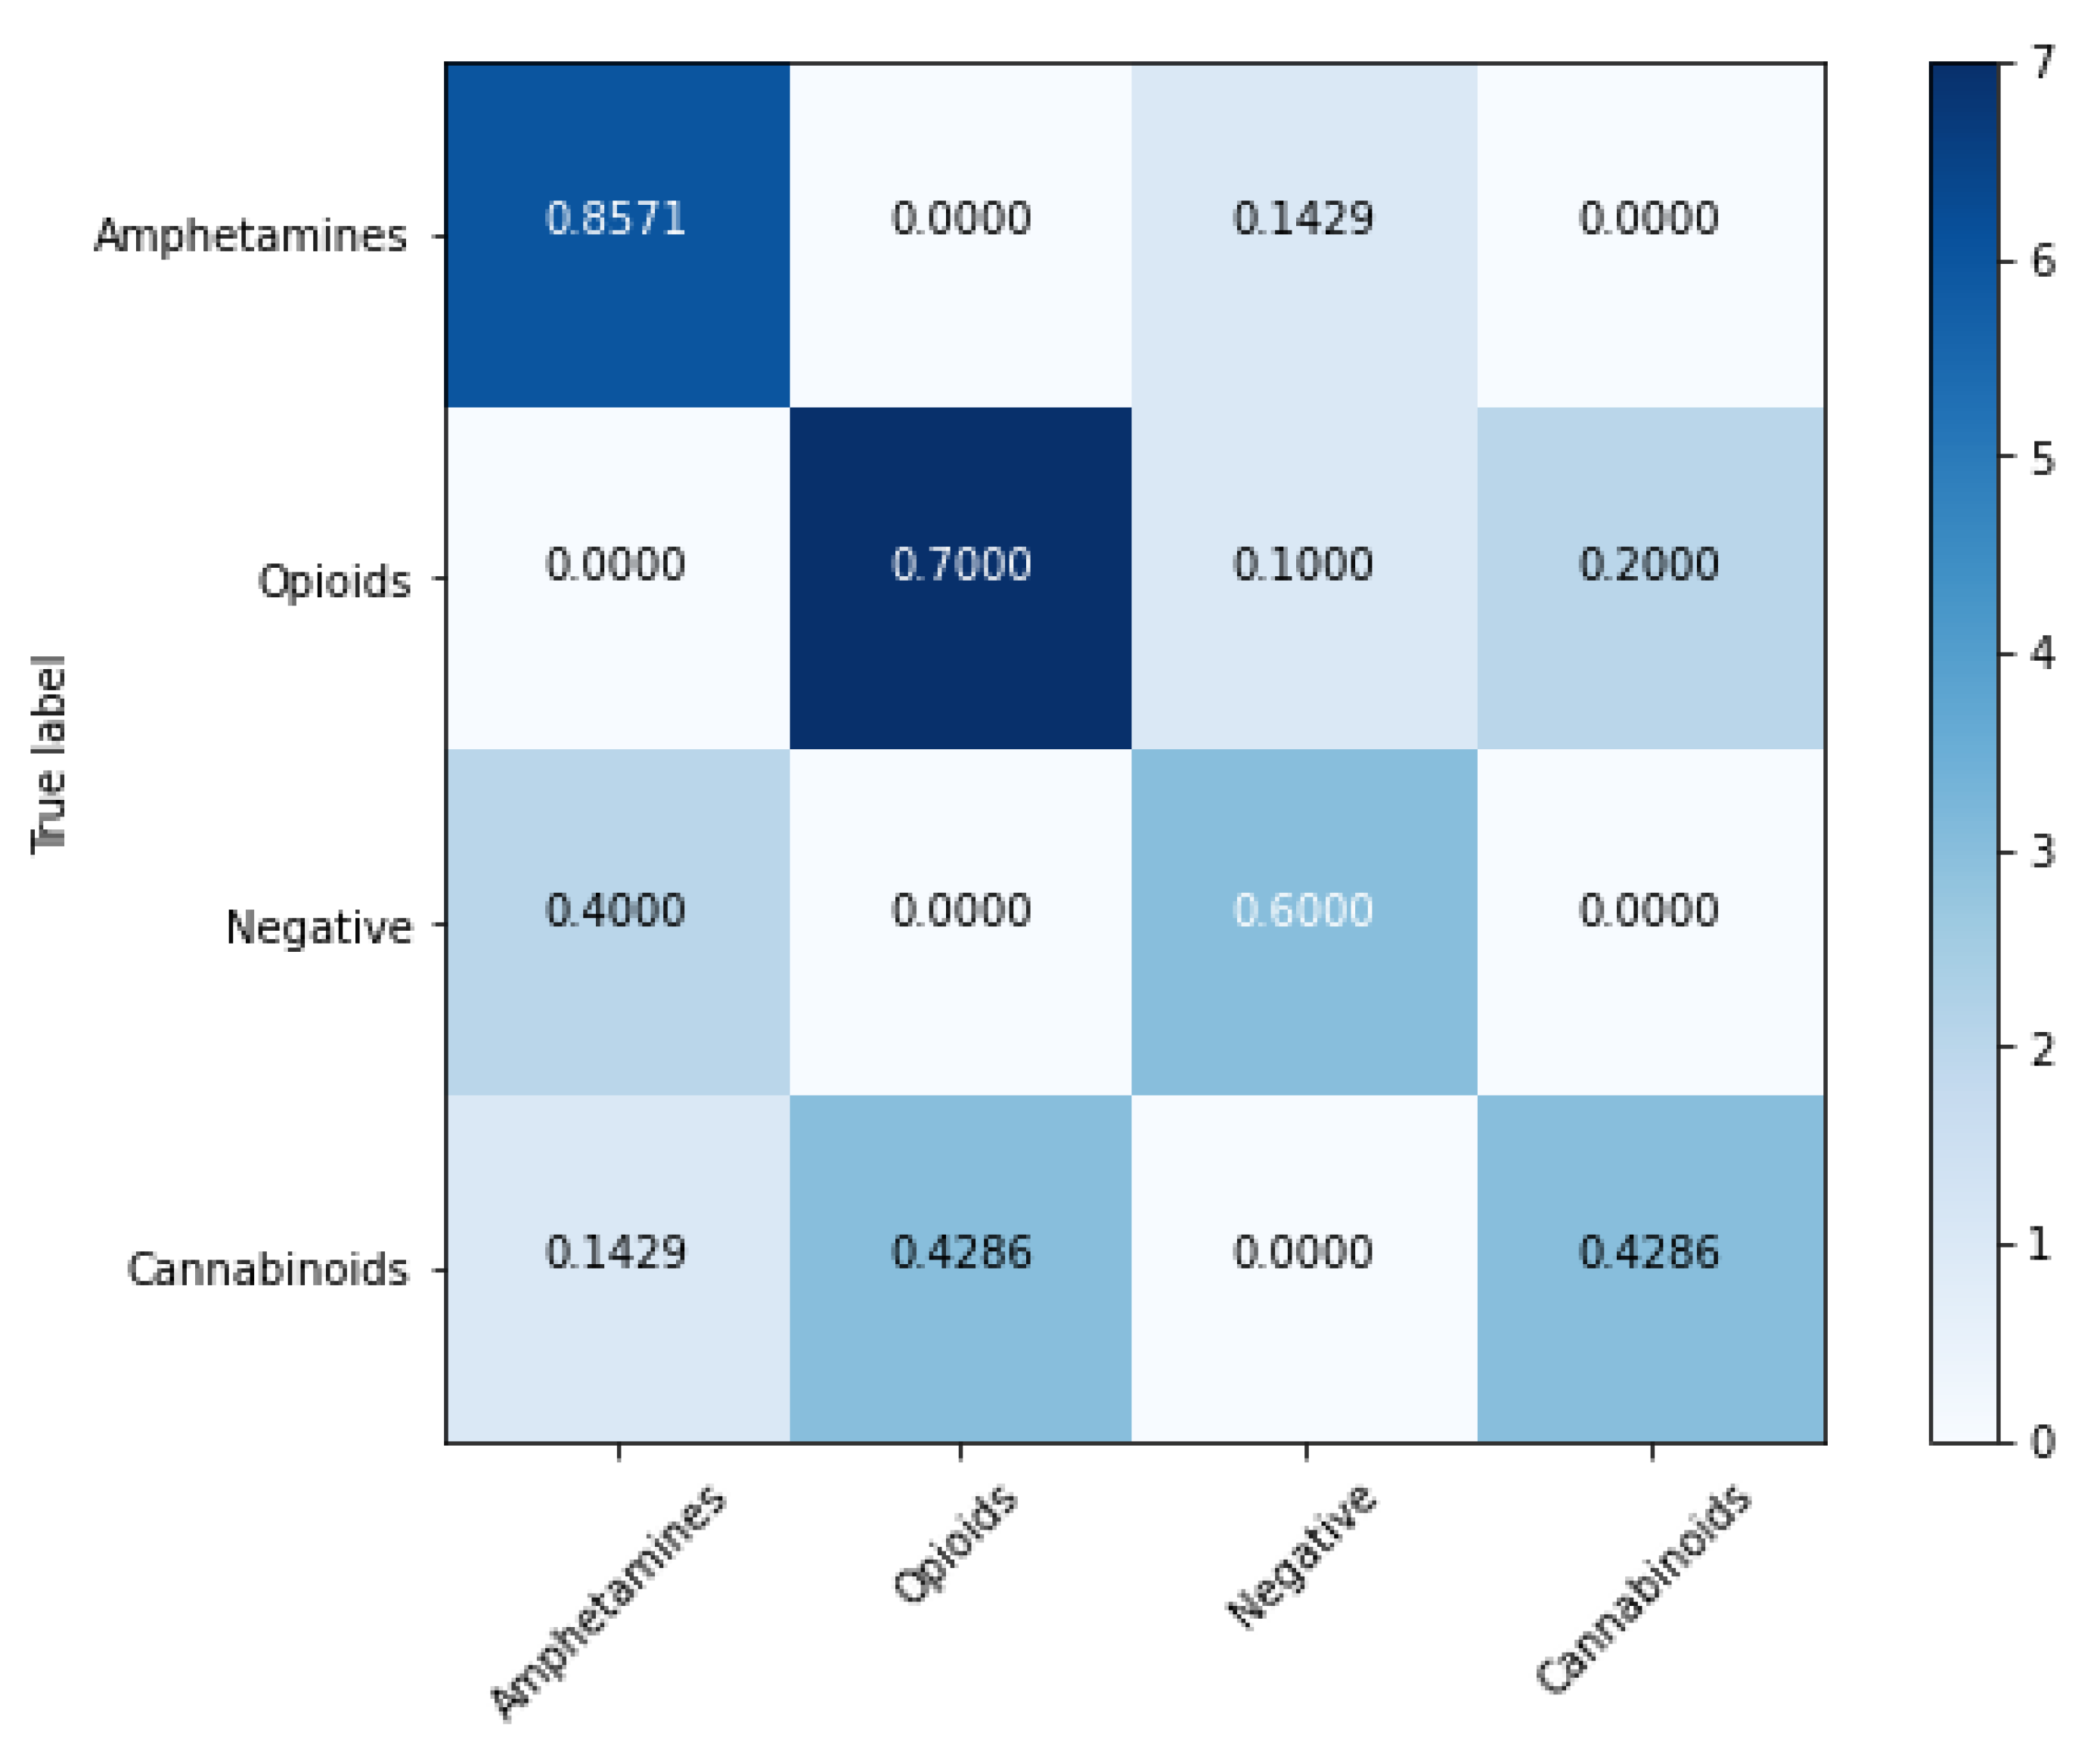
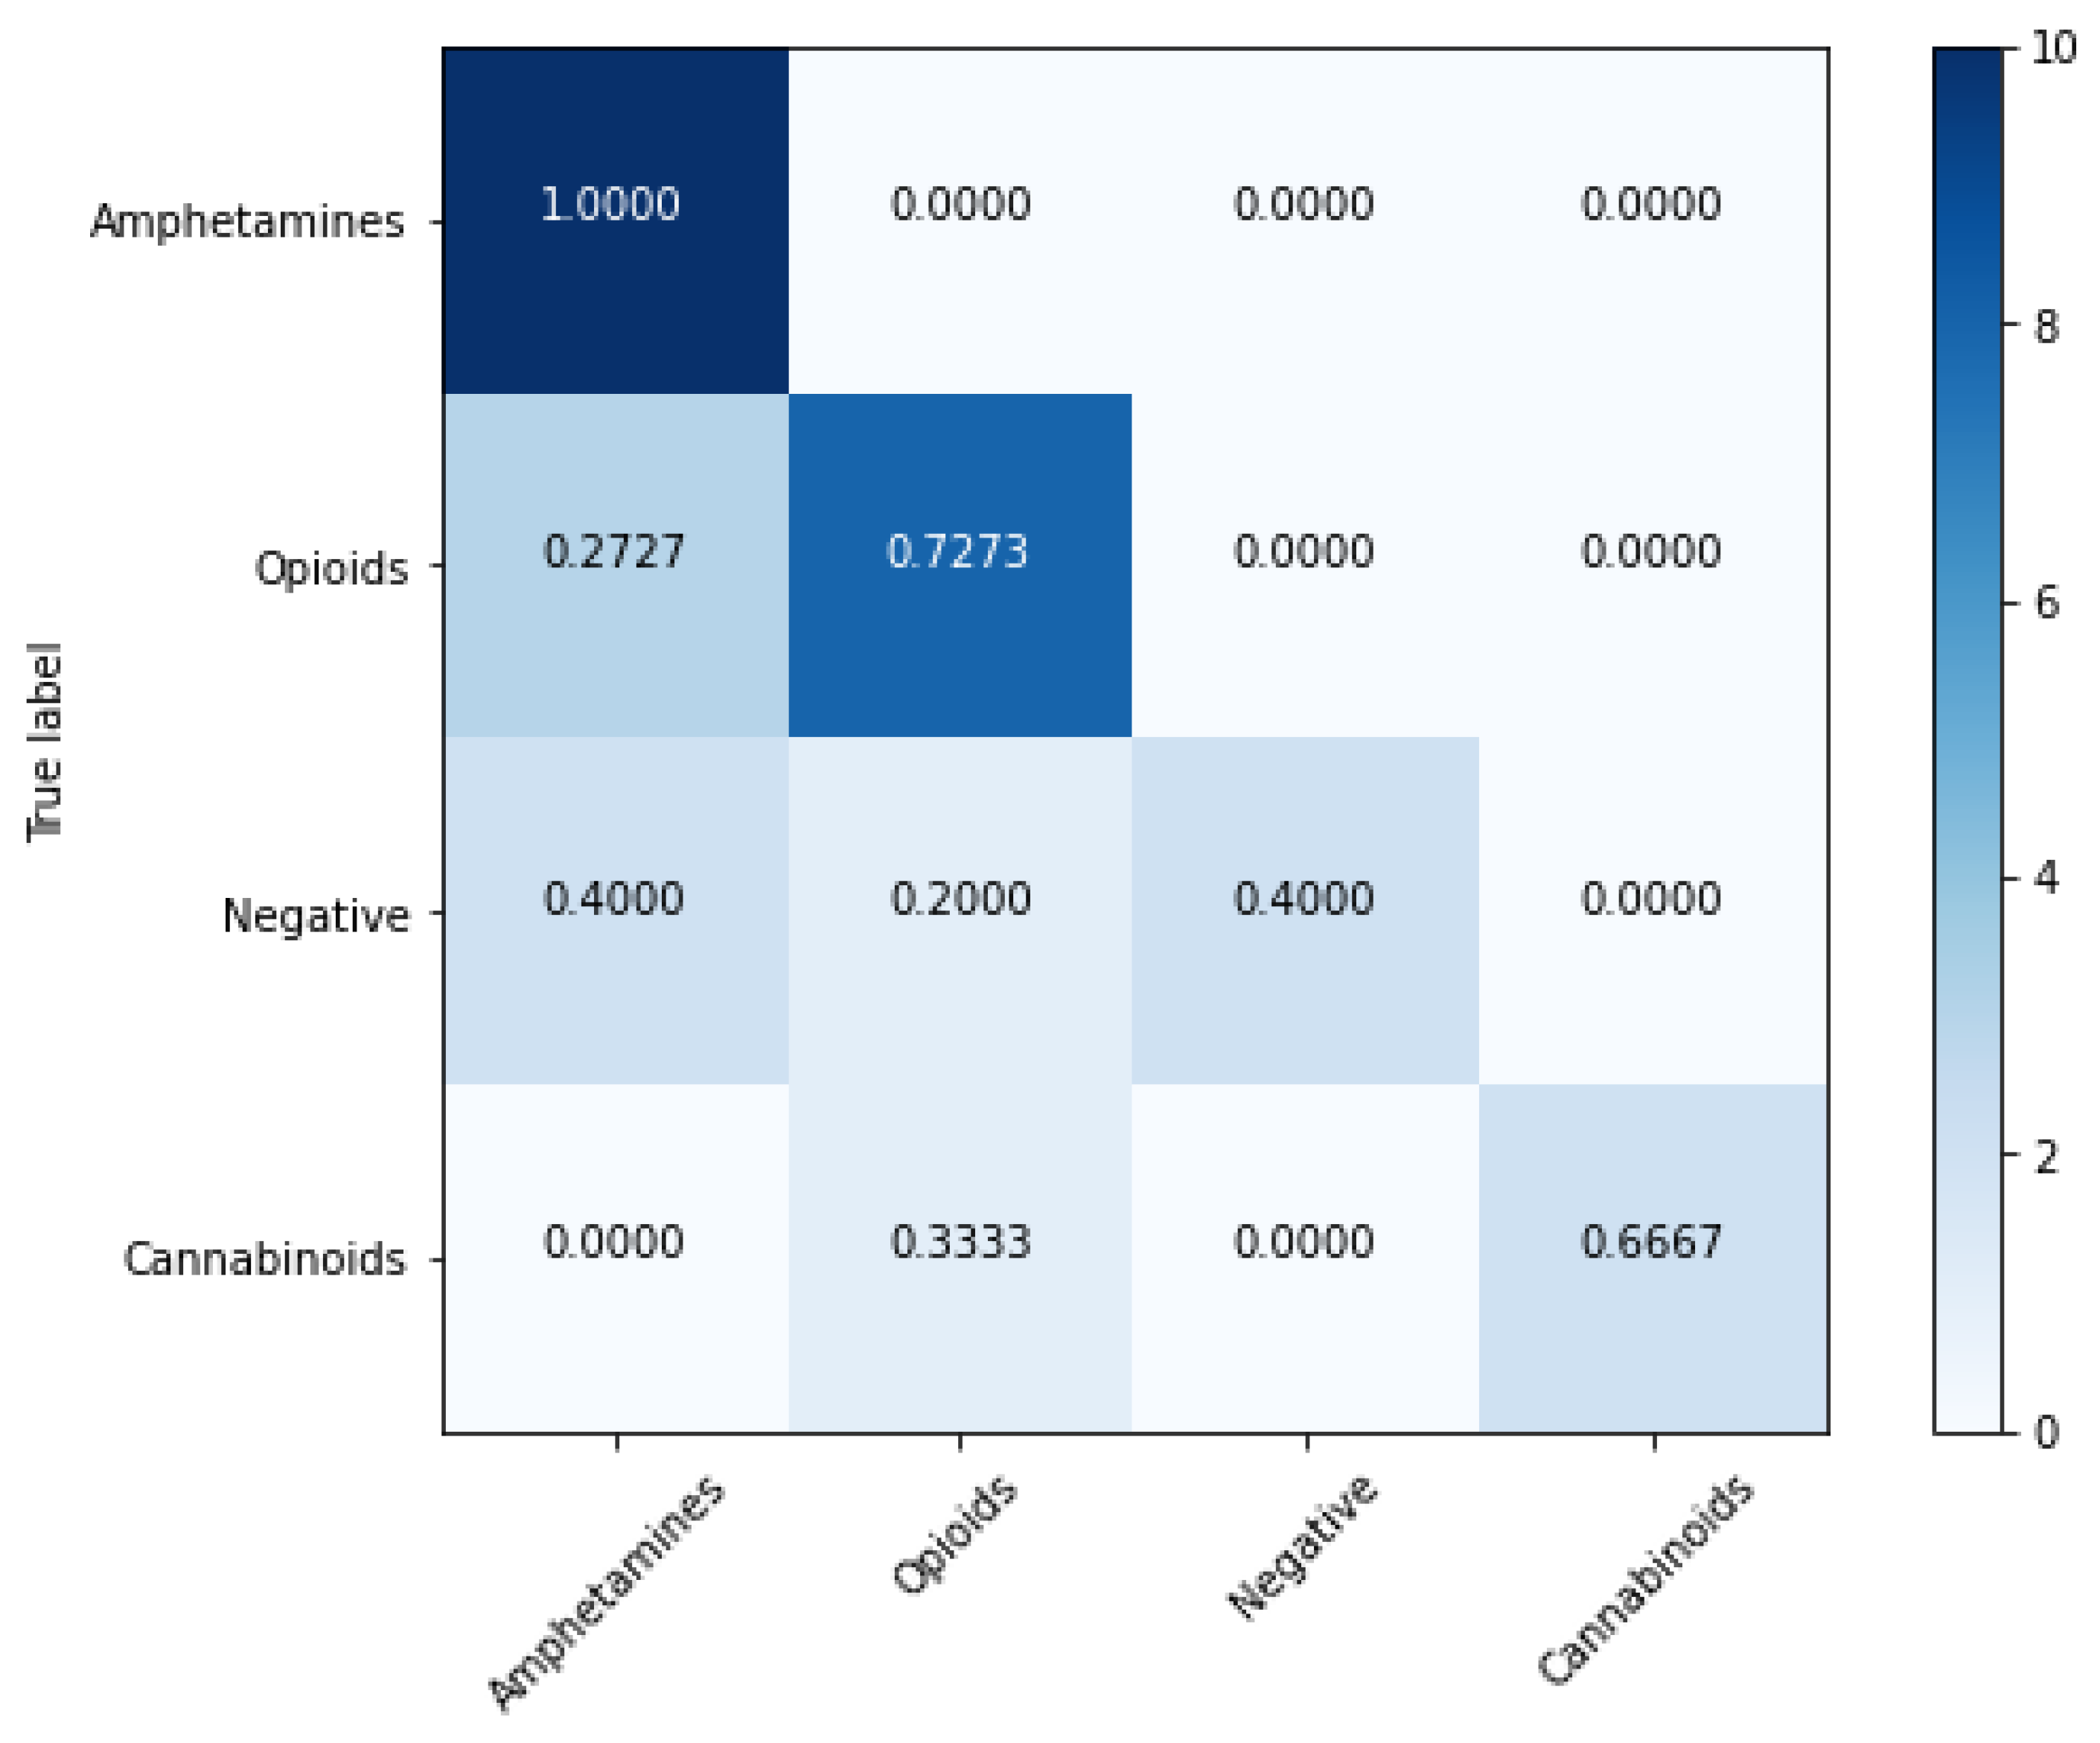
4.2. Classification Models

SVM, XGB, Random Forest, Gradient Boosting, and KNN were then used for classification purposes. In order to assess the overall performances of the models, as measured based on the average values obtained for 10 runs, it is useful to analyze Table 3 in conjunction with the confusion matrices that were determined for each model, which are displayed in Figure 5, Figure 6, Figure 7, Figure 8 and Figure 9. Table 3 indicates that the SVM and the XGB models are the most accurate, their accuracy being nearly the same. At the same time, SVM has the highest specificity, while XGB is the most sensitive model, all other models being significantly less specific or sensitive. SVM and XGB have the best (and comparable) Matthews correlation coefficient, while the coefficient determined for the other models is significantly smaller. The value of this coefficient is positive for all the models, which indicates positive correlations in all cases. The SVM and XGB models also have the highest ROC AUC, which has the same value (of 0.91) for both models. The ROC AUC being very high (very close to 1), we may conclude that these two models have a very good prediction rate.
If we take into account that the tested models are tree-based models (XGB, Random Forest, and Gradient Boosting), decision boundary models (SVM), and non-parametric models (KNN), we may conclude that the decision boundary models performed best, followed by the tree-based models and the non-parametric models.
The confusion matrices (Figure 5, Figure 6, Figure 7, Figure 8 and Figure 9) indicate that, except for the Gradient Boosting model, all the models classify the amphetamines with 100% accuracy. The Gradient Boosting model is not that far behind, with an accuracy of 85.71%. The main difference between the models, regarding the class of amphetamines, is related to the rate of false positives, which is 11.11% for the SVM model, 33.33% for the XGB model, 60% for the Random Forest model, 50.29% for the Gradient Boosting model, and 67.27% for the KNN model. In other words, the classification of amphetamines with the Random Forest, Gradient Boosting, and KNN models is only marginally better than a random guess.
The opioids are 100% correctly classified by the XGB model. The second-best correct classification rate (90%) is recorded for the SVM model, with 10% of the opioids being misclassified as negatives. The other models fail to assign the correct class identity for a significant number of opioids.
The cannabinoids are recognized as such with 100% accuracy only by the SVM model. The second-best model is the XGB model, the rest of the models often failing to distinguish them, especially from the opioids. The other models have significantly lower performances in the case of the cannabinoids as well.
Taking into account both the accuracy and the misclassification rates, the negatives seem to be the hardest to classify correctly for all models, most probably because of the large variety of substances that are forming this class in the dataset.
The availability of screening tools able to screen for illicit substances harmful to humans in a fast and reliable way is essential for public safety. The models presented in this paper can work in harmony with the currently recommended methodology of designer drug detection.
We explored the use of five distinct and highly different multivariate models and discussed their classification performance, next to the interpretation of the confusion matrix for addressing the specifics of each class of substances used in the classification. All the models are more specific than sensitive (see Table 3).
Both SVM and XGB models yielded accuracy results close to other systems previously built for screening for drugs of abuse [28,29]. However, it should be noted that the later systems were built to detect only one (cannabinoids) [28] or two (hallucinogenic amphetamines and cannabinoids [29]) classes of illicit drugs. In our case, the balanced accuracy is calculated for three classes of positives (amphetamines, opioids, and cannabinoids). Hence, the results obtained with SVM and XGB may be considered very good, as both models screen simultaneously for a larger number of classes of drugs of abuse, i.e., (2C-x, DOx, and NBOMe) hallucinogenic amphetamines, cannabinoids, and opioids. Moreover, it is reasonable to expect that their accuracy will increase once more ATR-FTIR spectra of substances belonging to the targeted classes of compounds become available.
From the point of view of overall accuracy, the best-performing model was SVM. As forensic screening systems designed to operate ATR-FTIR field (portable) analytical instruments, the developed models should be able to perform cost-effective, non-destructive, real-time, direct, on-site tests. However, the main objective of these models is to narrow down the number of samples further subjected to in-depth analysis with more sophisticated stationary analytical instruments in the laboratory. Only the samples tested on-site and assigned a positive class identity (hallucinogenic amphetamines, cannabinoids, and opioids) will be analyzed in the laboratory in order to determine their individual identity (not only their class membership).
Hence, the essential feature of such a screening system is its efficiency in detecting positives. In our case, no hallucinogenic amphetamine, cannabinoid, or opioid should be misclassified as a (false) negative. For this reason, XGB is a better fit for the purpose than SVM, as XGB yields no false negatives. While 10% of the opioids are erroneously classified as negatives by SVM, no amphetamine, opioid, or cannabinoid is misclassified as a negative by XGB.
It is true that XGB has a higher rate of misclassified positives than the SVM model. XGB misclassifies 33% of the negatives as amphetamines and 20% of the cannabinoids as opioids, while SVM misclassifies only 11.11% of the negatives as amphetamines and 11.11% as opioids. However, the false positives (false hallucinogenic amphetamines, cannabinoids, and opioids), although also not desirable, are less important. As mentioned before, their individual identity (molecular structure) will be determined during the tests subsequently performed in the laboratory, based on a series of analytical methods that are recommended for each class of drugs of abuse by specialized international agencies such as the United Nations Office on Drugs and Crime [30,31]. In conclusion, SVM performs better than the other tested models, but XGB is a better choice from a forensic point of view.

5. Conclusions

The high classification accuracy of the presented models indicates that artificial intelligence-based strategies represent an important route to follow in the context of automatizing the processing of ATR-FTIR spectra during field operations. The model which performs best under the classification strategy that takes into account only the overall accuracy is SVM. However, as these are forensic tools, the classification strategy should also consider the false negative rate. For this reason, XGB was found to be the best choice, as it has a significantly lower false negative rate, while its overall accuracy is only very slightly lower than that of SVM.
We believe that the screening systems presented in this paper still have an important potential for improvement, especially in terms of distinguishing better between the classes of positives (amphetamines, cannabinoids, and opioids). We aim to continue our work by using strategies such as the following: increasing the number of positives included in the training set; applying the classification algorithms not to their spectra, but to the PCA or ICA scores derived from these spectra [32]; preprocessing the input with a feature weight that enhances the variables having the largest modeling and/or discriminating power [33]; and using as input only the most relevant variables, as selected with techniques such as Genetic Algorithms (GA) [29].

Author Contributions

Conceptualization, I.-F.D., S.R.A. and M.P.; methodology I.-F.D., S.R.A. and M.P.; software, I.-F.D. and S.R.A.; validation, I.-F.D., S.R.A. and M.P.; formal analysis, I.-F.D., S.R.A. and M.P.; investigation, I.-F.D., S.R.A. and M.P.; resources, I.-F.D. and S.R.A.; data curation, I.-F.D.; writing—original draft preparation, I.-F.D., S.R.A. and M.P.; writing—review and editing, I.-F.D., S.R.A. and M.P.; visualization, I.-F.D., S.R.A. and M.P.; supervision, M.P.; project administration, M.P. All authors have read and agreed to the published version of the manuscript.

Funding

This research received no external funding.

Data Availability Statement

The ATR-FTIR spectra used in this study were extracted from the Scientific Working Group for the Analysis of Seized Drugs (SWGDRUG) public spectral library (www.swgdrug.org).

Acknowledgments

The authors appreciate the “Wiley Online Library” and the forensic spectral data science platform SWGDRUG, important and useful tools used to develop the system architectures presented in this paper.

Conflicts of Interest

The authors declare no conflict of interest.

References

  1. Carvalho, M.; Carmo, H.; Costa, V.M.; Capela, J.P.; Pontes, H.; Remião, F.; Carvalho, F.; Bastos, M.d.L. Toxicity of amphetamines: An update. Arch. Toxicol. 2012, 86, 1167–1231. [Google Scholar] [CrossRef]
  2. Dean, B.V.; Stellpflug, S.J.; Burnett, A.M.; Engebretsen, K.M. 2C or not 2C: Phenethylamine designer drug review. J. Med. Toxicol. 2013, 9, 172–178. [Google Scholar] [CrossRef] [PubMed]
  3. Trachsel, D.; Lehmann, D.; Enzensperger, C. Phenethylamine: Von der Struktur zur Funktion; Nachtschatten-Verlag: Solothurn, Switzerland, 2013. [Google Scholar]
  4. Herrmann, E.S.; Johnson, P.S.; Johnson, M.W.; Vandrey, R. Novel drugs of abuse: Cannabinoids, stimulants, and hallucinogens. In Neuropathology of Drug Addictions and Substance Misuse; Elsevier: Amsterdam, The Netherlands, 2016; pp. 893–902. [Google Scholar]
  5. Zawilska, J.B.; Kacela, M.; Adamowicz, P. NBOMes–highly potent and toxic alternatives of LSD. Front. Neurosci. 2020, 14, 78. [Google Scholar] [CrossRef] [PubMed]
  6. Shi, V.Y.J.; Hsiao, M.; Loves, I.; Hamsavi, A. Comprehensive Guide to Hidradenitis Suppurativa; Elsevier: Amsterdam, The Netherlands, 2021; pp. 273–282. [Google Scholar]
  7. Kerrigan, S.; Goldberger, B.A. Opioids. In Principles of Forensic Toxicology; Springer: Berlin/Heidelberg, Germany, 2020; pp. 347–369. [Google Scholar]
  8. Zöllner, C.; Stein, C. Opioids. In Analgesia. Handbook of Experimental Pharmacology; Stein, C., Ed.; Springer: Berlin/Heidelberg, Germany, 2006; pp. 31–63. [Google Scholar]
  9. Pereira, L.S.; Lisboa, F.L.; Neto, J.C.; Valladão, F.N.; Sena, M.M. Screening method for rapid classification of psychoactive substances in illicit tablets using mid infrared spectroscopy and PLS-DA. Forensic Sci. Int. 2018, 288, 227–235. [Google Scholar] [CrossRef] [PubMed]
  10. Koshute, P.; Hagan, N.; Jameson, N.J. Machine learning model for detecting fentanyl analogs from mass spectra. Forensic Chem. 2022, 27, 100379. [Google Scholar] [CrossRef]
  11. Lee, S.Y.; Lee, S.T.; Suh, S.; Ko, B.J.; Oh, H.B. Revealing unknown controlled substances and new psychoactive substances using high-resolution LC–MS-MS machine learning models and the hybrid similarity search algorithm. J. Anal. Toxicol. 2022, 46, 732–742. [Google Scholar] [CrossRef] [PubMed]
  12. Wong, S.L.; Tan, J.; Ng, L.T.; Pan, J. Screening Unknown Novel Psychoactive Substances Using GC-MS Based Machine Learning. ChemRxiv 2022. [Google Scholar] [CrossRef]
  13. Piorunska-Sedlak, K.; Stypulkowska, K. Strategy for identification of new psychoactive substances in illicit samples using attenuated total reflectance infrared spectroscopy. Forensic Sci. Int. 2020, 312, 110262. [Google Scholar] [CrossRef] [PubMed]
  14. Scientific Working Group for the Analysis of Seized Drugs (SWGDRUG). Available online: www.swgdrug.org (accessed on 20 January 2023).
  15. Grigoletto, M.; Lisi, F. Looking for skewness in financial time series. Econom. J. 2009, 12, 310–323. [Google Scholar] [CrossRef]
  16. Loperfido, N. Kurtosis-based projection pursuit for outlier detection in financial time series. Eur. J. Financ. 2020, 26, 142–164. [Google Scholar] [CrossRef]
  17. McAlevey, L.G.; Stent, A.F. Kurtosis: A forgotten moment. Int. J. Math. Educ. Sci. Technol. 2018, 49, 120–130. [Google Scholar] [CrossRef]
  18. Deconinck, E.; Duchateau, C.; Balcaen, M.; Gremeaux, L.; Courselle, P. Chemometrics and infrared spectroscopy—A winning team for the analysis of illicit drug products. Rev. Anal. Chem. 2022, 41, 228–255. [Google Scholar] [CrossRef]
  19. Stone, J.V. Independent component analysis: An introduction. Trends Cogn. Sci. 2002, 6, 59–64. [Google Scholar] [CrossRef] [PubMed]
  20. Himberg, J.; Mantyjarvi, J.; Korpipaa, P. Using PCA and ICA for exploratory data analysis in situation awareness. In Proceedings of the Conference Documentation International Conference on Multisensor Fusion and Integration for Intelligent Systems. MFI 2001 (Cat. No. 01TH8590), Baden-Baden, Germany, 20–22 August 2001; pp. 127–131. [Google Scholar]
  21. Kunapuli, S.S.; Bhallamudi, P.C. A review of deep learning models for medical diagnosis. In Machine Learning, Big Data, and IoT for Medical Informatics; Elsevier: Amsterdam, The Netherlands, 2021; pp. 389–404. [Google Scholar]
  22. Rodríguez-Pérez, R.; Bajorath, J. Evolution of Support Vector Machine and Regression Modeling in Chemoinformatics and Drug Discovery. J. Comput. Aided Mol. Des. 2022, 36, 355–362. [Google Scholar] [CrossRef] [PubMed]
  23. Wade, C. Hands-On Gradient Boosting with XGBoost and Scikit-Learn: Perform Accessible Machine Learning and Extreme Gradient Boosting with Python; Packt Publishing: Birmingham, UK, 2020. [Google Scholar]
  24. Smith, C.; Koning, M. Decision Trees and Random Forests: A Visual Introduction For Beginners; Blue Windmill Media: Chicago, IL, USA, 2017. [Google Scholar]
  25. Bentéjac, C.; Csörgő, A.; Martínez-Muñoz, G. A comparative analysis of gradient boosting algorithms. Artif. Intell. Rev. 2021, 54, 1937–1967. [Google Scholar] [CrossRef]
  26. Vitola, J.; Pozo, F.; Tibaduiza, D.A.; Anaya, M. A Sensor Data Fusion System Based on K-Nearest Neighbor Pattern Classification for Structural Health Monitoring Applications. Sensors 2017, 17, 417. [Google Scholar] [CrossRef]
  27. Scafi, S.H.F.; Pasquini, C. Identification of counterfeit drugs using near-infrared spectroscopy. Analyst 2001, 126, 2218–2224. [Google Scholar] [CrossRef]
  28. Burlacu, C.M.; Burlacu, A.C.; Praisler, M. Sensitivity analysis of artificial neural networks identifying JWH synthetic cannabinoids built with alternative training strategies and methods. Inventions 2022, 7, 82. [Google Scholar] [CrossRef]
  29. Negoita, C.; Praisler, M.; Ion, A. Artificial intelligence application designed to screen for new psychoactive drugs based on their ATR-FTIR spectra. In AIP Conference Proceedings; Mishonov, T.M., Varonov, A.M., Eds.; AIP Publishing: Melville, NY, USA, 2019. [Google Scholar]
  30. United Nations Office on Drugs and Crime. Recommended Methods for the Identification and Analysis of Amphetamine, Methamphetamine and Their Ring-Substituted Analogues in Seized Materials; United Nations Publications: New York, NY, USA, 2006. [Google Scholar]
  31. United Nations Office on Drugs and Crime. Recommended Methods for the Identification and Analysis of Synthetic Cannabinoid Receptor Agonists in Seized Materials; United Nations Publications: New York, NY, USA, 2013. [Google Scholar]
  32. Gosav, S.; Praisler, M.; Birsa, M.L. Principal Component Analysis Coupled with Artificial Neural Networks—A Combined Technique Classifying Small Molecular Structures Using a Concatenated Spectral Database. Int. J. Mol. Sci. Spec. Issue Adv. Comput. Toxicol. 2011, 12, 6668–6684. [Google Scholar] [CrossRef]
  33. Ciochina, S.; Praisler, M.; Coman, M.M. Choosing Between Quantum Cascade Lasers (QCL) Equipping a New Hollow Fiber Infrared Scanner Designed to Detect New Psychoactive Substances (NPS). In AIP Conference Proceedings; Mishonov, T.M., Varonov, A.M., Eds.; AIP Publishing: Melville, NY, USA, 2019. [Google Scholar]
Figure 1. Mean ATR-FTIR spectrum calculated for the amphetamines (blue), opioids (orange), cannabinoids (green), and negatives (red) included in the database.
Inventions 08 00056 g001
Figure 2. Score plot of the first two principal components of a two-component PCA displaying the class of amphetamines (red), opioids (green), cannabinoids (blue), and negatives (black).
Inventions 08 00056 g002
Figure 3. Score plot of the first two components of a three-component ICA displaying the class of amphetamines (red), opioids (green), cannabinoids (blue), and negatives (black).
Inventions 08 00056 g003
Figure 4. Score plot of the 3rd and 8th components of a ten-component transformed operation displaying the class of amphetamines (red), opioids (green), cannabinoids (blue), and negatives (black).
Inventions 08 00056 g004
Figure 5. Confusion matrix for the SVM model.
Inventions 08 00056 g005
Figure 6. Confusion matrix for the XGB model.
Inventions 08 00056 g006
Figure 7. Confusion matrix for the Random Forest model.
Inventions 08 00056 g007
Figure 8. Confusion matrix for the Gradient Boosting model.
Inventions 08 00056 g008
Figure 9. Confusion matrix for the KNN model.
Inventions 08 00056 g009
Table 1. Compounds included in the database.
Nr. crt.AmphetaminesOpioidsCannabinoidsNegatives
12C-B HCl4’-Methyl acetyl fentanyl HClJWH-018
N-(5-
chloropentyl) analog
4-Acetoxy-N,N-
Dimethyltrypt-
amine oxalate
22C-C HClpara-Methyl acetyl fentanyl HClJWH-203Cocaine base
32C-E HClBenzylfentanyl HClJWH-250Sertraline HCl
42C-T-7 HClAcryl fentanyl HClJWH-122Trenbolone Hexahydro
benzylcarbonate
52C-T-2 HCl2-Furanylbenzyl fentanylJWH-018 adamantyl-
carboxamide
4-estren-3beta, 17beta-diol
62C-I HCl2R,4S-2-Methyl fentanyl HClJWH-018Butalbital
72,5-Dimethoxy-4-Chloro-amphetamine HClDespropionyl para-fluorofentanylJWH-307Boldenone Acetate
82,5-Dimethoxy
phenethylamine HCl
Despropionyl ortho-fluorofentanylJWH-081Cocaine HCl
93,4-Dimethoxy
amphetamine HCl
cis-3-Methyl fentanyl HClJWH-022Safrole
102,5-Dimethoxyamphetamine HClNorfentanylJWH-210Phenazepam
11DOI HCltrans-3-Methyl fentanyl HClJWH-019Methenolone
12d,l-4-Bromo-2,5-dimethoxyamphetamine HClpara-Methoxy fentanyl HClJWH-073Methaqualone base
134-Chloro-2,5-dimethoxyamphetamine HCl (DOC)para-Chloroisobutyryl fentanyl HClJWH-018 BenzimidazoleMBZP HCl
1425B-NBOMe HClortho-Methylacetyl fentanyl HClFUB-JWH-018Diazepam
1525C-NBOMe HClHeptanoyl fentanyl HClJWH-249Etaqualone HCl
1625I-NBOMe Basebeta-Hydroxy fentanyl HClJWH-018 indazoleOxazepam
1725E-NBOMe HCl3-Methyl butyryl fentanyl HClAB-FUBICA
1825D-NBOMe HClbeta’-Phenyl fentanylADB-PINACA
1925H-NBOMe HClortho-Fluoroisobutyryl fentanyl HCl
2025N-NBOMe HClpara-Fluoroacetyl fentanyl HCl
2125C-NB3OMe HClmeta-Fluoroisobutyryl fentanyl HCl
2225C-NB4OMe HClTetrahydrofuran fentanyl 3-tetrahydrofurancarboxamide HCl
2325I-NBOMe HClpara-Methyl cyclopropyl fentanyl HCl
2425I-NB3OMe HClpara-Methoxy furanyl fentanyl HCl
2525I-NB4OMe HClortho-Methyl cyclopropyl fentanyl HCl
26 ortho-Fluoro furanyl fentanyl HCl
27 N-benzyl para-fluoro norfentanyl HCl
28 N-Benzyl para-fluoro cyclopropyl norfentanyl HCl
29 Despropionyl meta-
Fluorofentanyl
30 para-Fluoro
fentanyl HCl
31 ortho-Methoxy furanyl fentanyl
32 Heroin Hydrochloride Monohydrate
33 W-18
34 W-15
35 06-Monoacetyl
morphine HCl
36 Morphine HCl
trihydrate
Table 2. Statistical parameters calculated based on the mean ATR-FTIR spectra of the targeted classes of compounds, between 1500 and 4000 cm−1, with a resolution of 1.92 cm−1.
AmphetaminesOpioidsCannabinoidsNegatives
Mean0.03380.03930.04520.0341
Standard Deviation0.02630.01260.01280.0105
Skewness1.8771.2612.5670.7721
Excess Kurtosis2.7601.2768.0980.2311
Minimum0.01260.02540.02580.0186
Maximum0.1350.07440.10720.0678
Table 3. Standard performance metrics calculated for the machine learning models.
ModelBalanced
Accuracy
(%)
Sensitivity
(%)
Specificity
(%)
Matthews
Correlation
Coefficient
ROC AUC
SVM92.08 ± 5.4187.91 ± 5.1696.25 ± 4.130.86 ± 0.040.91
XGBoost91.99 ± 7.3395.29 ± 7.5988.69 ± 6.110.81 ± 0.050.91
Random forest81.57 ± 8.6671.15 ± 7.5592.00 ± 8.740.67 ± 0.090.81
Gradient Boosting76.46 ± 5.8664.64 ± 4.9588.28 ± 5.470.53 ± 0.050.76
K-Nearest Neighbors66.88 ± 10.2069.84 ± 10.2090.64 ± 9.660.49 ± 0.120.80
Disclaimer/Publisher’s Note: The statements, opinions and data contained in all publications are solely those of the individual author(s) and contributor(s) and not of MDPI and/or the editor(s). MDPI and/or the editor(s) disclaim responsibility for any injury to people or property resulting from any ideas, methods, instructions or products referred to in the content.

