1. Introduction
The conventional monitoring systems tend to consist of a control terminal and a controlled terminal, with computers in the control terminal generally linked to the equipment in the controlled terminal through direct wires such as RS-232 cables to collect monitoring data and issue commands. Due to substantial advances in Internet technology in recent years, an increasing number of monitoring systems have been equipped with Internet-based frameworks containing three parts: a user terminal, a server terminal, and a controlled terminal. Users use computers at their terminal. These users log into the system at the server terminal via the Internet to assign monitoring tasks to equipment at the controlled terminal. Users must use a graphical user interface (GUI) in each monitoring system to observe the information collected by the controlled equipment before issuing suitable commands. Interface design is crucial because the information displayed by poorly designed interfaces can lead to judgment errors and erroneous commands, which, in turn, can result in severe losses. Moreover, control personnel require more time to comprehend and manage sudden situations if the monitoring interface requires overly complex operations, which adversely affects the system practicality. Complex monitoring interfaces require more system operation training when personnel changes occur, which increases the costs of factory production and enterprise operations. Thus, the interface design quality is crucial because it influences the convenience and practicality of the system usage and development costs.
In many industries that require manual labor, few tasks can be completed using manual labor alone. These tasks include recording the information of all operating machinery, collecting the data from operating machinery present in different areas of a factory, and obtaining real-time data from the operating machinery. Therefore, many of these tasks are automated. This has led to the development of many monitoring systems to meet the automation requirements in various fields including agriculture [
1,
2,
3], fisheries [
4,
5], environmental monitoring [
6,
7], medical and home automation [
8], and factory equipment monitoring [
9,
10].
Due to the significance of monitoring interface designs, we categorized the development methods of monitoring interfaces into two types: window applications and web-based approaches. The former method requires a user to install an application to operate various system functions. The user must download an update file when the application is updated, which creates some inconvenience. Previous studies have presented examples of window applications [
6,
7,
8,
9,
10]. To overcome this problem, recent monitoring systems have been developed using web technology to enable users to perform monitoring tasks by logging into the system via an Internet browser [
1,
3,
5]. Due to the presentation of monitoring interfaces, the monitoring webpage designed in Pandey [
11] uses pure text to display all monitoring information, which is more suitable for monitoring applications with a small scope and simple data. Previous studies [
12,
13] have used text, figures, and tables to present information so that the personnel in charge can observe trends in the monitoring data. However, this method lacks map information pertaining to a monitored scene, which may prevent personnel from rapidly comprehending and managing sudden situations.
The monitoring interface created by Toma [
14] presents the pollution information summarized in various diagrams/dashboards/maps, based on the physical location of the sensors. This method provides a visualized monitoring interface that can effectively aid the personnel involved in determining the relative location of each monitoring point and is extremely useful. However, the monitored scene should be planned in terms of factors such as the image file design and the layout of the sensor nodes before developing this monitoring interface. The completed interface can only be applied to the scene for which it was designed. This approach lacks flexibility for applications in numerous monitored scenes and cannot be updated according to the user requirements. Thus, additional manual labor and development costs are incurred.
To address the aforementioned problems in monitoring interface development, we used web technology to develop a mechanism that could establish visualization–monitoring interfaces on demand. Geographic map creation and management functions enable users to upload the floor plans of monitored sites at any time. Moreover, we designed a simulated environment monitoring mechanism to help the monitor personnel determine the node locations. The image files of the monitoring nodes corresponding to the actual locations in the monitored scene can be dragged to the corresponding points on the monitoring webpage using a mouse. When the monitored scene or requirements change, the locations of the monitoring nodes on the user interface can be changed.
The monitoring mechanisms designed in this study reduce not only the costs but also the time required for system development and installation. Moreover, this system monitors the physiological information of patients in intensive care units (ICUs) using ZigBee physiological status monitoring devices and presents a two-dimensional virtual scene. Thus, the system enables any doctor to comprehend the conditions of critically ill patients and provide timely and appropriate treatments.
Section 2 presents the design concepts, overall architecture, and details of the proposed approach that enable the construction of a simulated graphical monitoring interface on demand. In
Section 3, details regarding the application of the proposed approach to the ICU of an actual medical center is presented and the collected data are verified.
2. Materials and Methods
The design concepts, overall architecture, and details of the proposed approach enable the construction of a simulated graphical monitoring interface on demand.
The ability to monitor the status of a monitored area in real-time is the primary requisite for remote monitoring. Thus, the most common and intuitive design is to install cameras within a monitored area to obtain real-time images [
15]. However, this monitoring method has high hardware installation costs and requires considerable circuit-wiring time. Moreover, establishing an entire monitoring system is highly complex. For remote monitoring applications that do not require real-time video images [
16,
17], we developed an approach to establish a system for simulated environment monitoring that is easy to operate and incurs low hardware installation costs. The mechanism provides users with a monitoring interface that can simulate an environment based on an actual monitoring site. Clients can create objects above the ground in the monitored environment and edit their geographical locations using a webpage browser.
This study used Ajax and Silverlight technology to build a simulated monitoring GUI on demand [
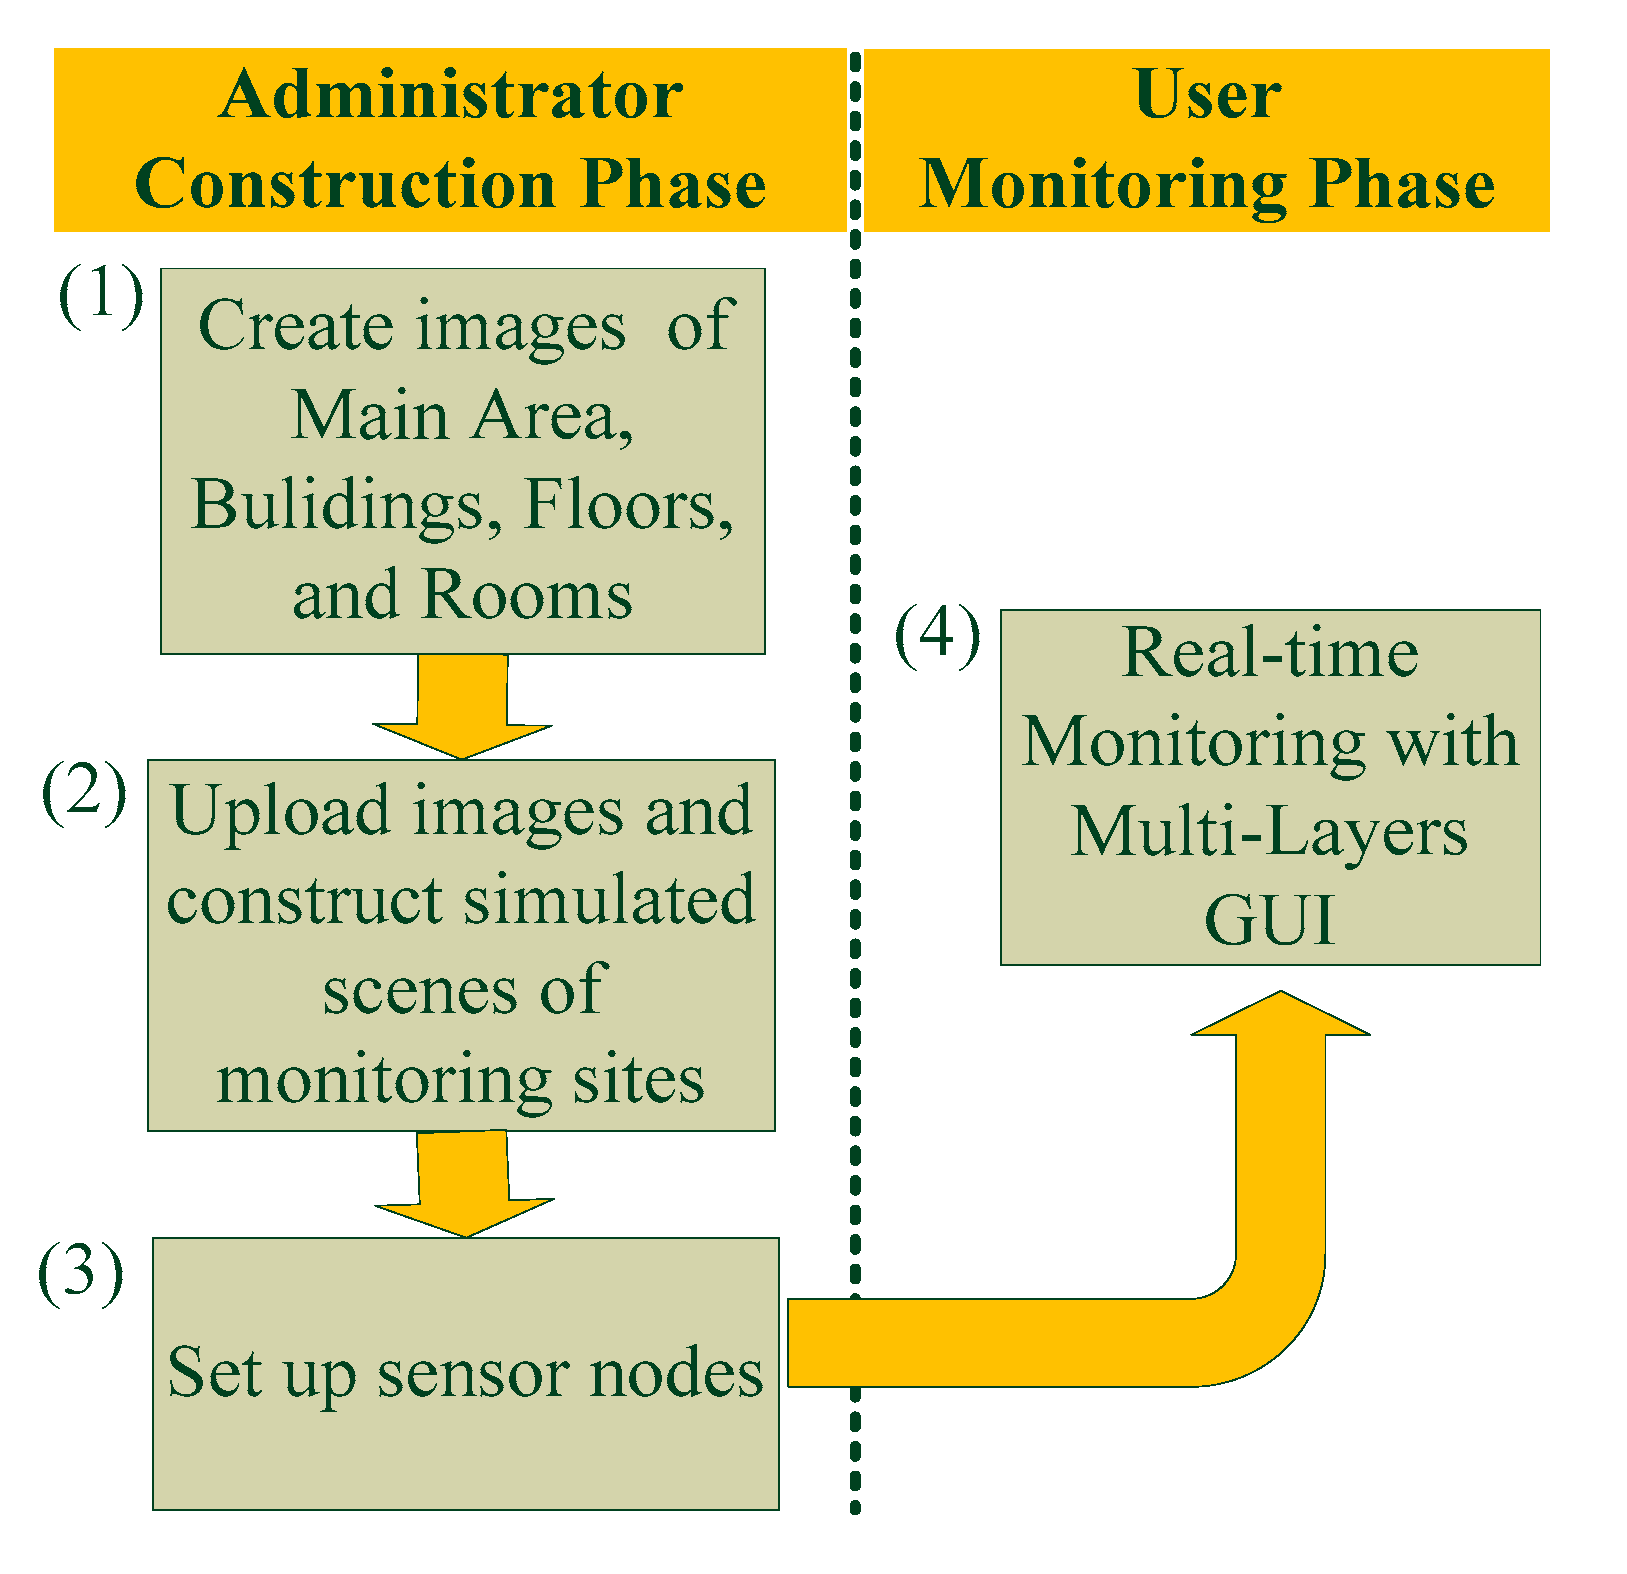
18]. In this paper, we explain the procedures and mechanisms in two phases: administrator construction and user monitoring (
Figure 1). These two phases consisted of four steps: (1) creating image files and images, (2) uploading the geographic map data and constructing the simulated environment, (3) setting up sensor node images and numbering, and (4) establishing a multilayer real-time monitoring interface. In the following sections, we explain the design procedures and the realization of each step in detail.
2.1. Create Image Files and Images
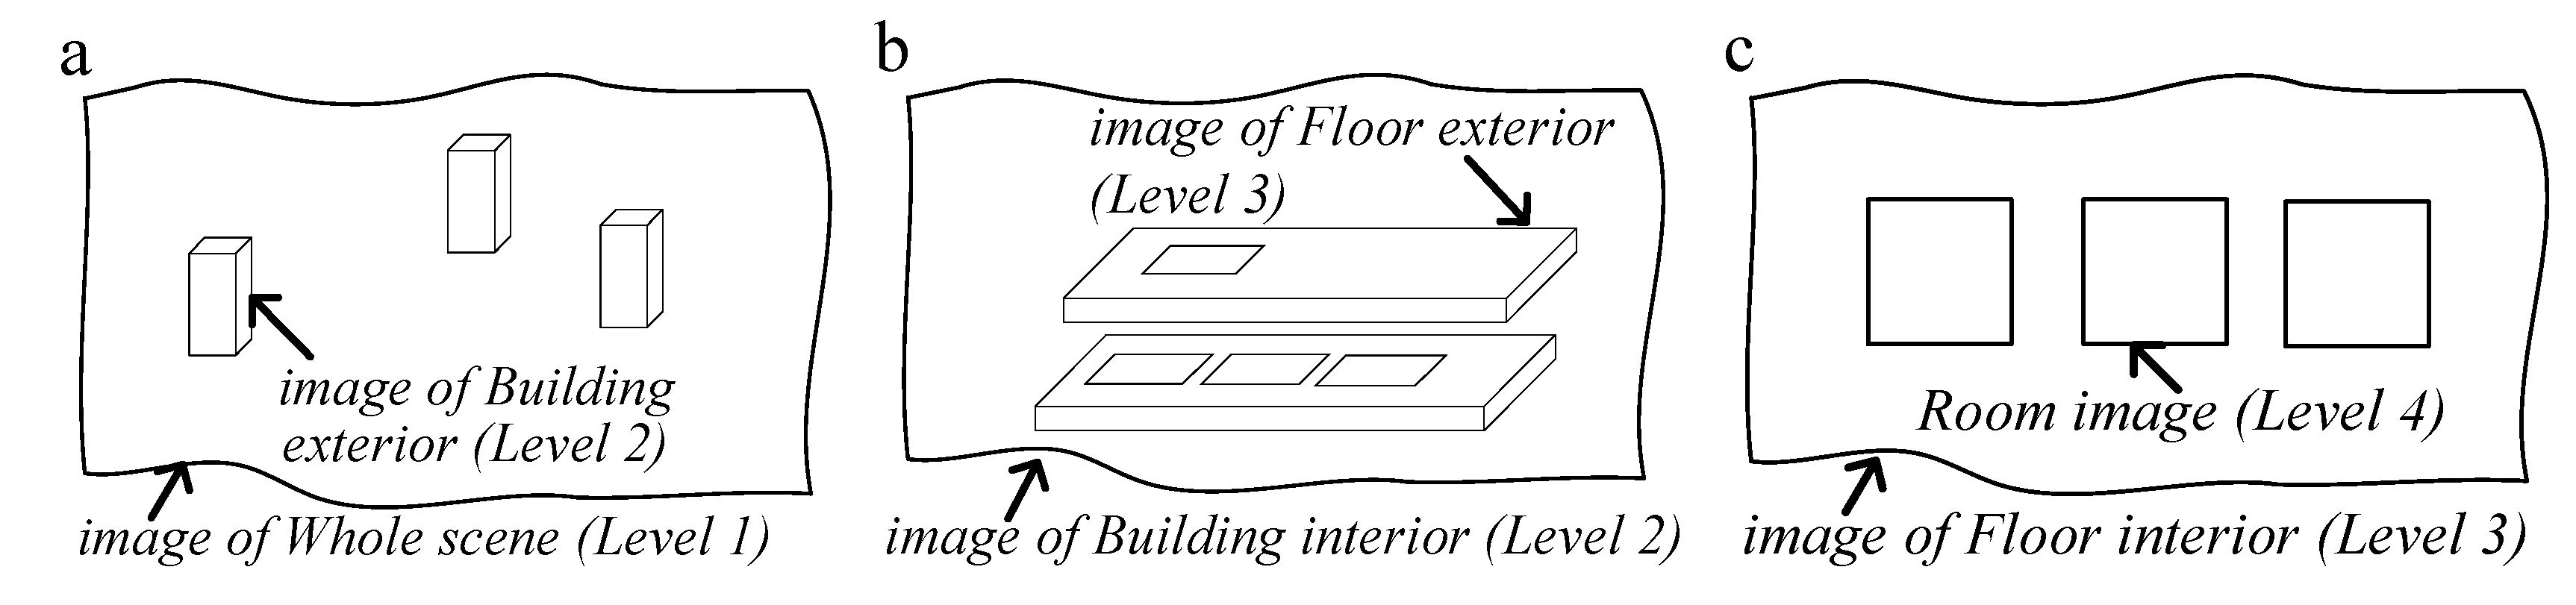
The most commonly monitored environment in wireless sensor networks (WSNs) comprises four levels (see
Figure 2). Level 1 includes the entire scene of the monitored area, Level 2 contains the buildings in the monitored area, Level 3 contains all floors in the buildings, and Level 4 contains the rooms on each floor.
Thus, users can capture photographs of buildings based on the actual monitored environment. The images must contain the entire scene, exterior and interior of the monitored buildings, and monitored rooms. The optimal image resolution is 800 × 600 pixels.
For the entire scene page (e.g., as shown in
Figure 2a), a Google map image can serve as the layout for the main image. The images of the buildings in the main image and the rooms in the layout (e.g., in
Figure 2c) can be obtained by capturing their photographs. For the internal images of buildings and external images of floors on the webpage of the floors in a single building (e.g., in
Figure 2b) and the internal images of floors on the webpage of the rooms on a single floor (e.g., in
Figure 2c), complete images cannot be obtained through photography. Thus, simple drawings can be made using image editing software.
2.2. Upload Geographic Map Data and Construct a Simulated Environment
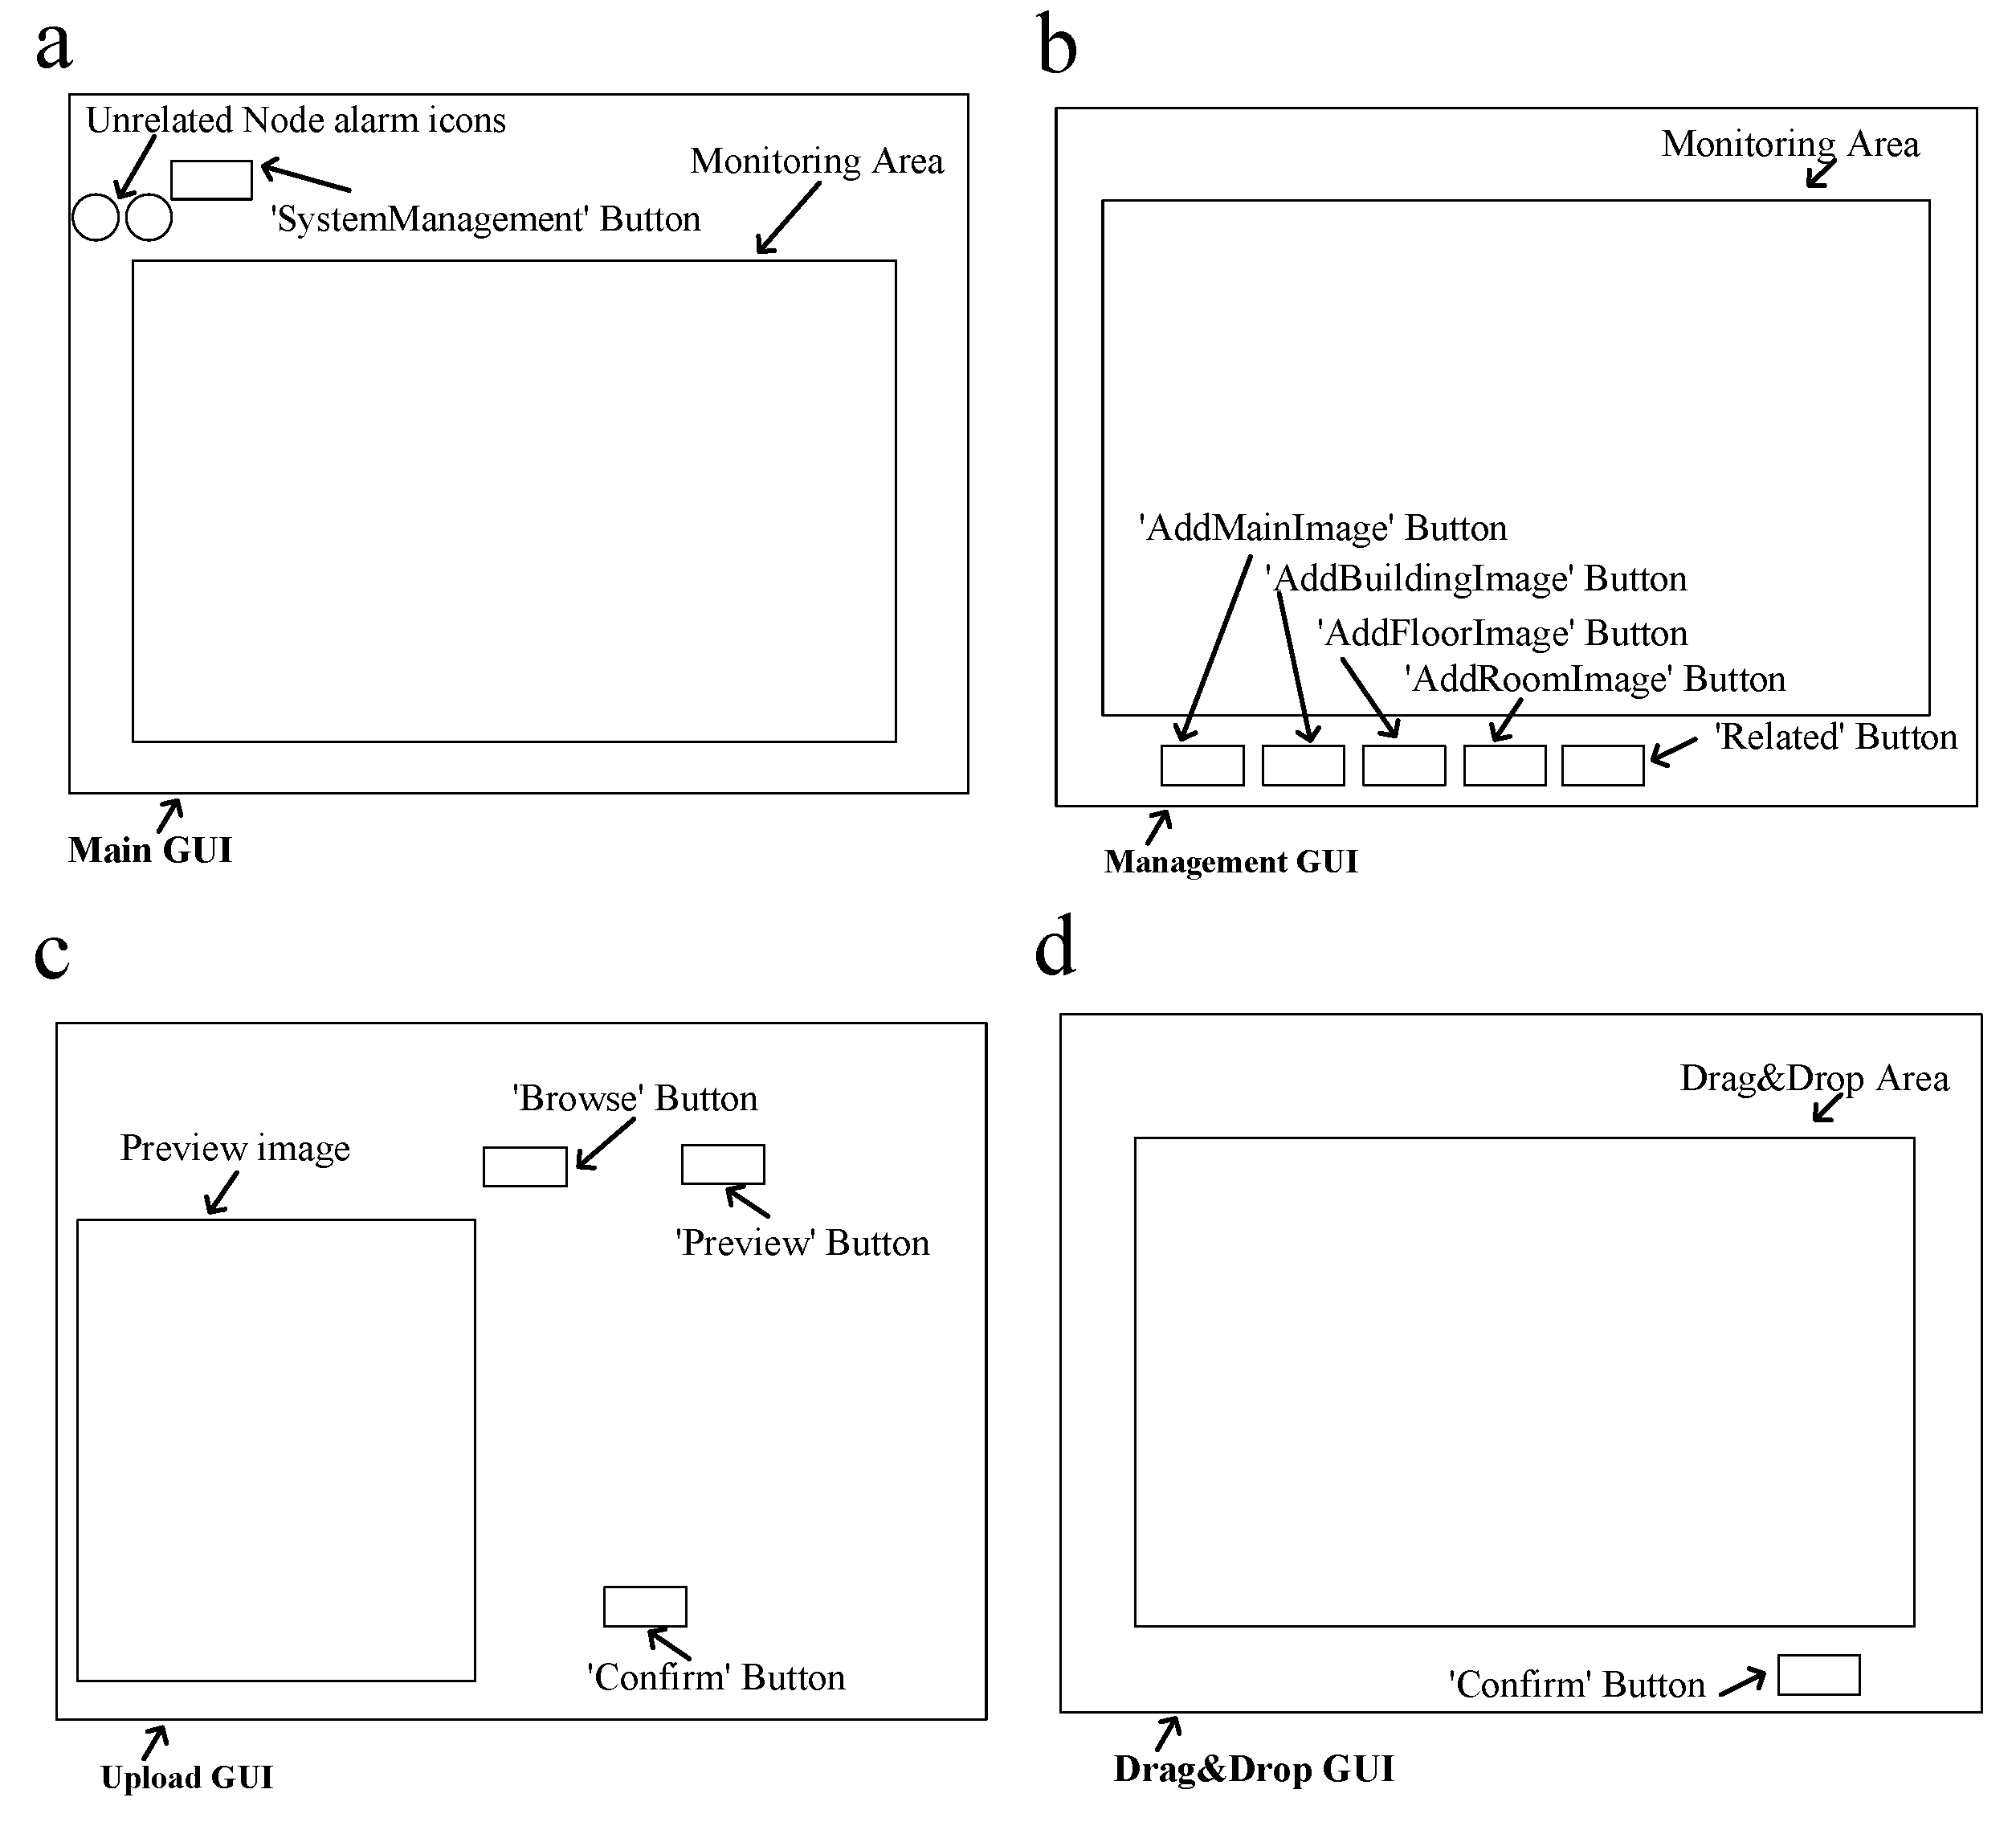
To upload the geographic map data and construct the simulated environment, we created four different graphical webpages (see
Figure 3): main GUI (
Figure 3a), management GUI (
Figure 3b), upload GUI (
Figure 3c), and drag-and-drop GUI (
Figure 3d).
2.3. Use of a Mouse to Drag and Relocate Objects
The coordinates of the objects were set by dragging and dropping them with a mouse. There are two methods to accomplish this: (1) definition of the coordinate range in the display screen, and (2) the image dragging function. The details are as follows.
2.3.1. Definition of the Coordinate Range in the Display Screen
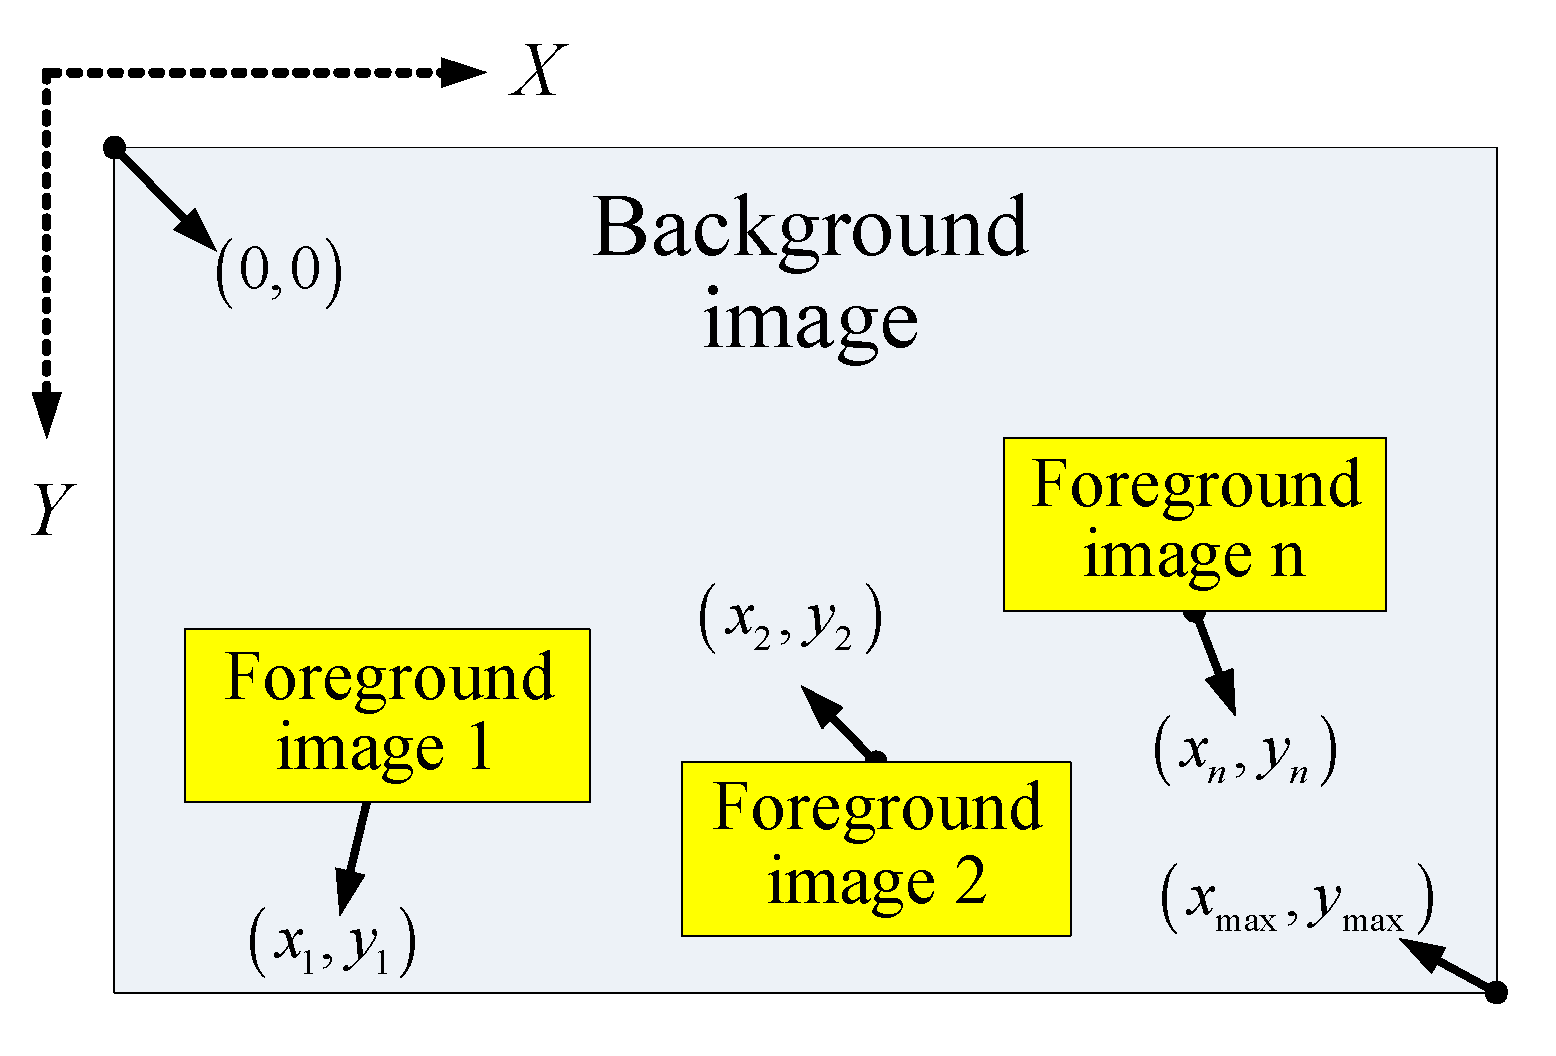
The system display screen includes a background image object and foreground image objects (see
Figure 4). According to the resolution, the background image was divided into coordinates (
x,
y) with the horizontal
x axis and vertical
y axis. The origin (0, 0) is located in the upper-left corner, and the maximum coordinates (
xmax,
ymax) indicate the lower-right corner. If the resolution is 800 × 600 pixels,
xmax = 800 and
ymax = 600.
Several foreground image objects can be distributed over the background image to show the exterior images of the object at the next level. Each foreground image object has a set of coordinates (
xn,
yn) in the background image. Managers can drag and drop an object by clicking the mouse button to select an object and then moving the mouse while keeping the mouse button pressed, so that the monitoring environment is proportionally reduced in the monitoring system to create a simulated environment. The design of the visualized monitoring interface comprises of three levels, as listed in
Table 1. The background image is the image of the entire scene (M
M), which was obtained using the monitoring screen of Level 1 as an example. Users can upload multiple objects such as the image of a building exterior (
) on the background image. The design concepts of the remaining levels are similar to those of Level 1. Thus, the configuration of the simulated environment can be displayed on a monitoring screen.
2.3.2. Object Coordinate Settings
There are two modes for the user to operate the monitoring GUI. The monitoring GUI should be in monitoring mode to monitor the sensor nodes in real-time. In other words, there are two behavioral modes for the operation of the foreground image object: multilevel monitoring and object coordinate settings. Thus, we designed a state variable MS for the object in order to determine the current operating mode:
The monitoring mode (
MS = 0) is introduced in detail in
Section 3.
Editing mode (MS = 1) enables users to drag and drop the object to simulate a monitoring environment.
When a mouse moves over an icon, three actions can be performed: pressing the left button [OnMouseLeftButtonDown], moving the mouse [OnMouseMove], and releasing the left button. The state variable
MS contains an icon on the interactive webpage of the monitoring system. The user can change the flag variables and decide whether to move the mouse or drag the object by pressing or releasing the left mouse button.
Table 2 lists the relevant mouse actions.
When the user presses the left mouse button, the [OnMouseLeftButtonDown] processing procedure records the current coordinates of the mouse (xstart, ystart) and sets the flag variables as “true” so that the visual effects display the icon for dragging.
A moving mouse triggers the [OnMouseMove] processing procedure. During this procedure, “true” flag variables mean that the left mouse button is pressed, and the current mouse coordinates (xcurrent, ycurrent) are extracted. By calculating (xcurrent, ycurrent) − (xprevious, yprevious) and adding the result to the coordinates of the icon’s location, the moving icon effects are achieved. In contrast, no actions are performed when the flag variables are “false”.
When the user releases the left mouse button, the [OnMouseLeftButtonUp] processing procedure extracts the coordinates of the point to which the user has dragged the icon (xn, yn) = (xcurrent, ycurrent). Moreover, the flag variables are set as “false” so that the visual effects display the icon as unselected. Next, the coordinates and detailed information of the icon are stored in the system database. Finally, multilevel dynamic display monitoring screen mechanisms present the real-time monitoring images.
2.4. Set Up Sensor Node Images and Numbering
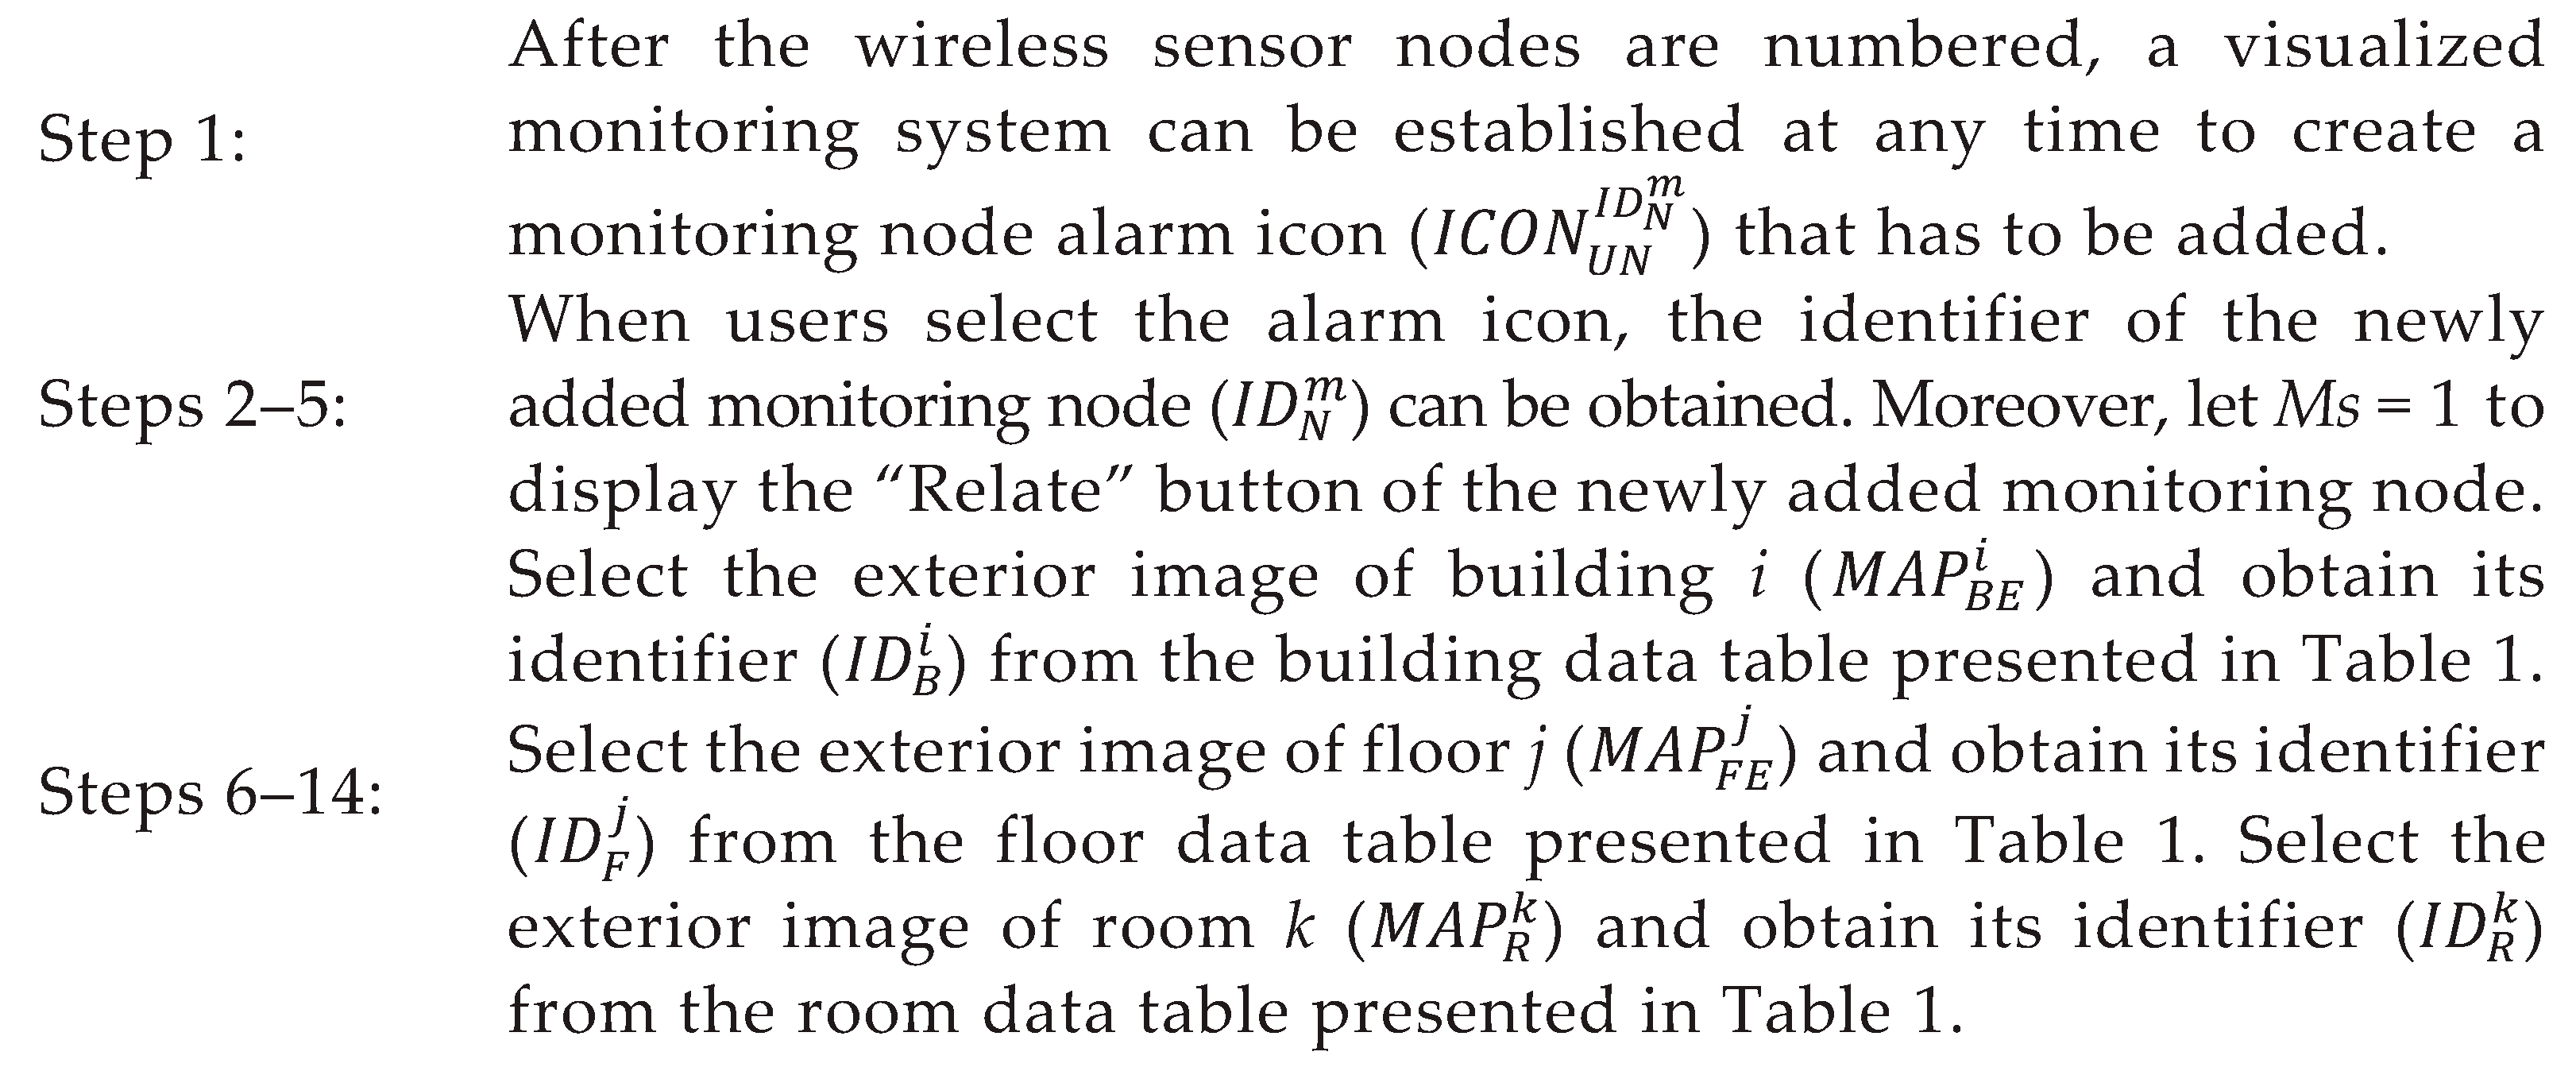
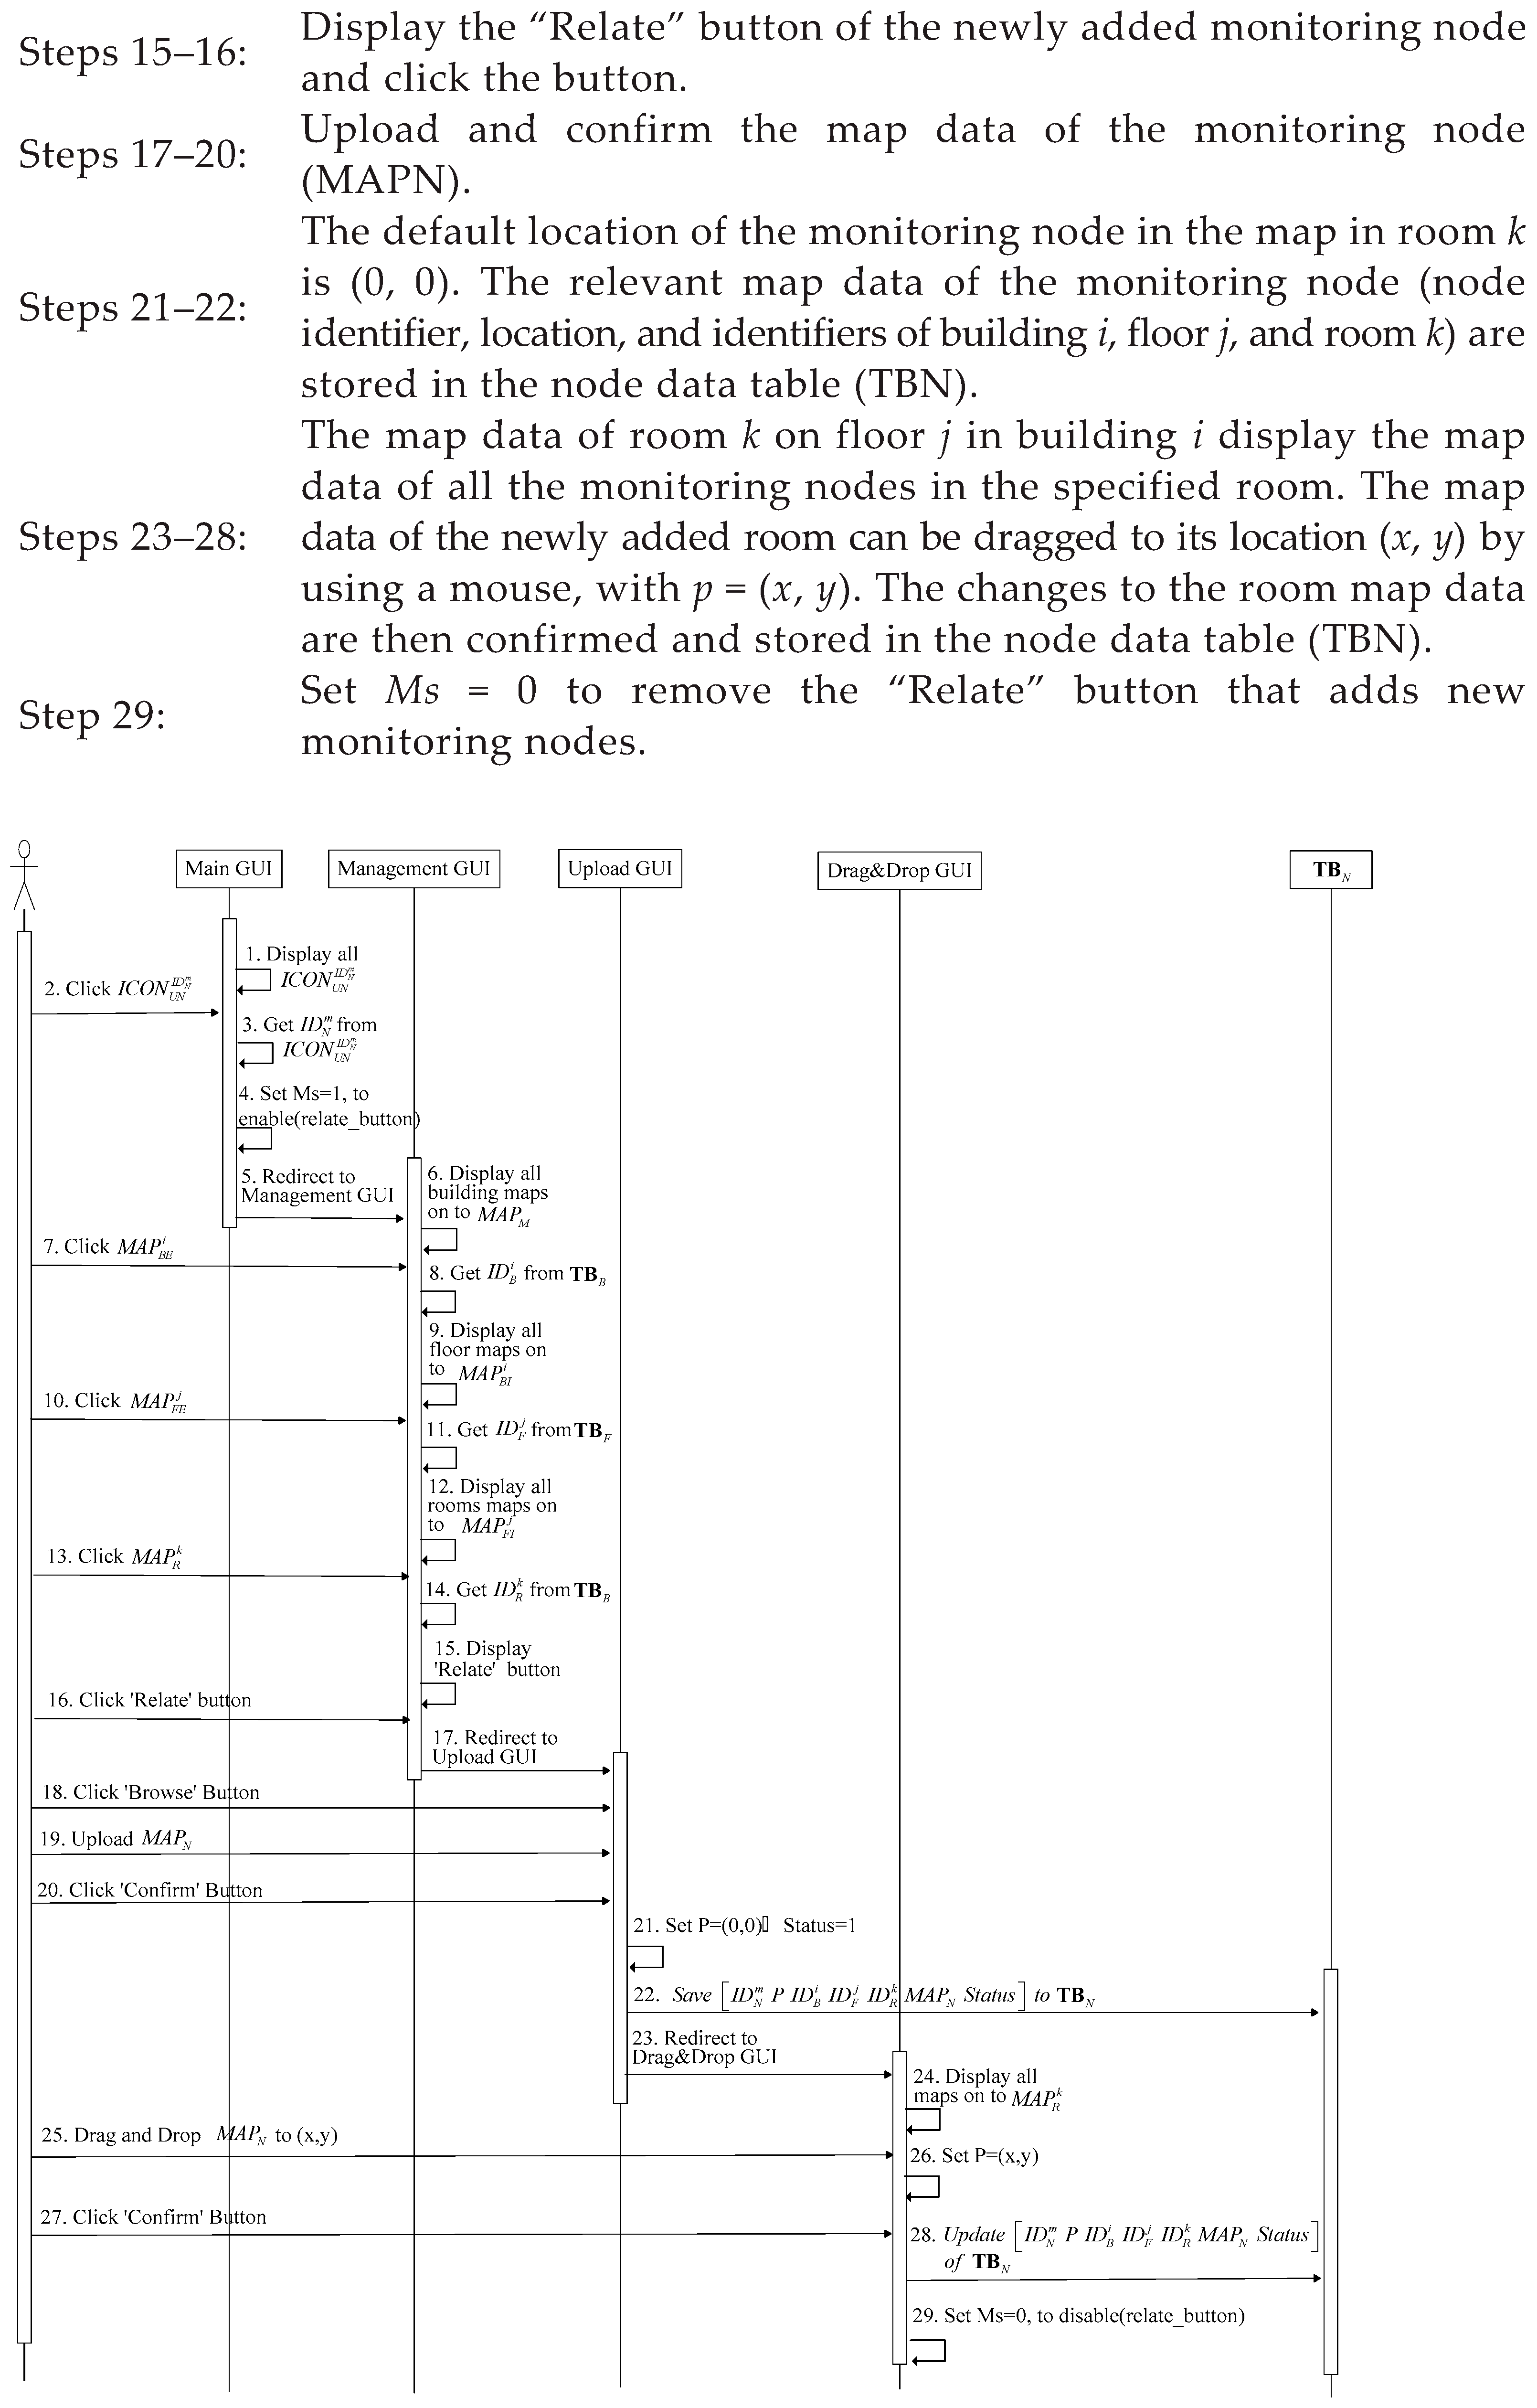
Once the simulated configuration of the monitored environment is completed, the number of wireless sensor monitoring nodes must only be linked to their icons to complete the establishment of the visualized monitoring system. The procedure for relating the monitoring node numbers to their icons is as follows (see
Figure 5):
2.5. Implementation and Evaluation in ICUs
We used a three-layer (coordinator, control router, and end device) ZigBee-based tree topology [
19] to monitor the physiological signals in real-time. The proposed system provides a node deployment process to systematically construct a ZigBee-based WSN based on tree topology. The system possesses automatic-numbering and automatic-related algorithms so that the monitoring and control system (MCS) can automatically obtain the addresses of the nodes by using only the region’s name to facilitate automatic data collection, and adopts a hierarchical node-numbering approach to enable the MCS to easily display the collected data in the correct positions of monitoring GUIs [
20].
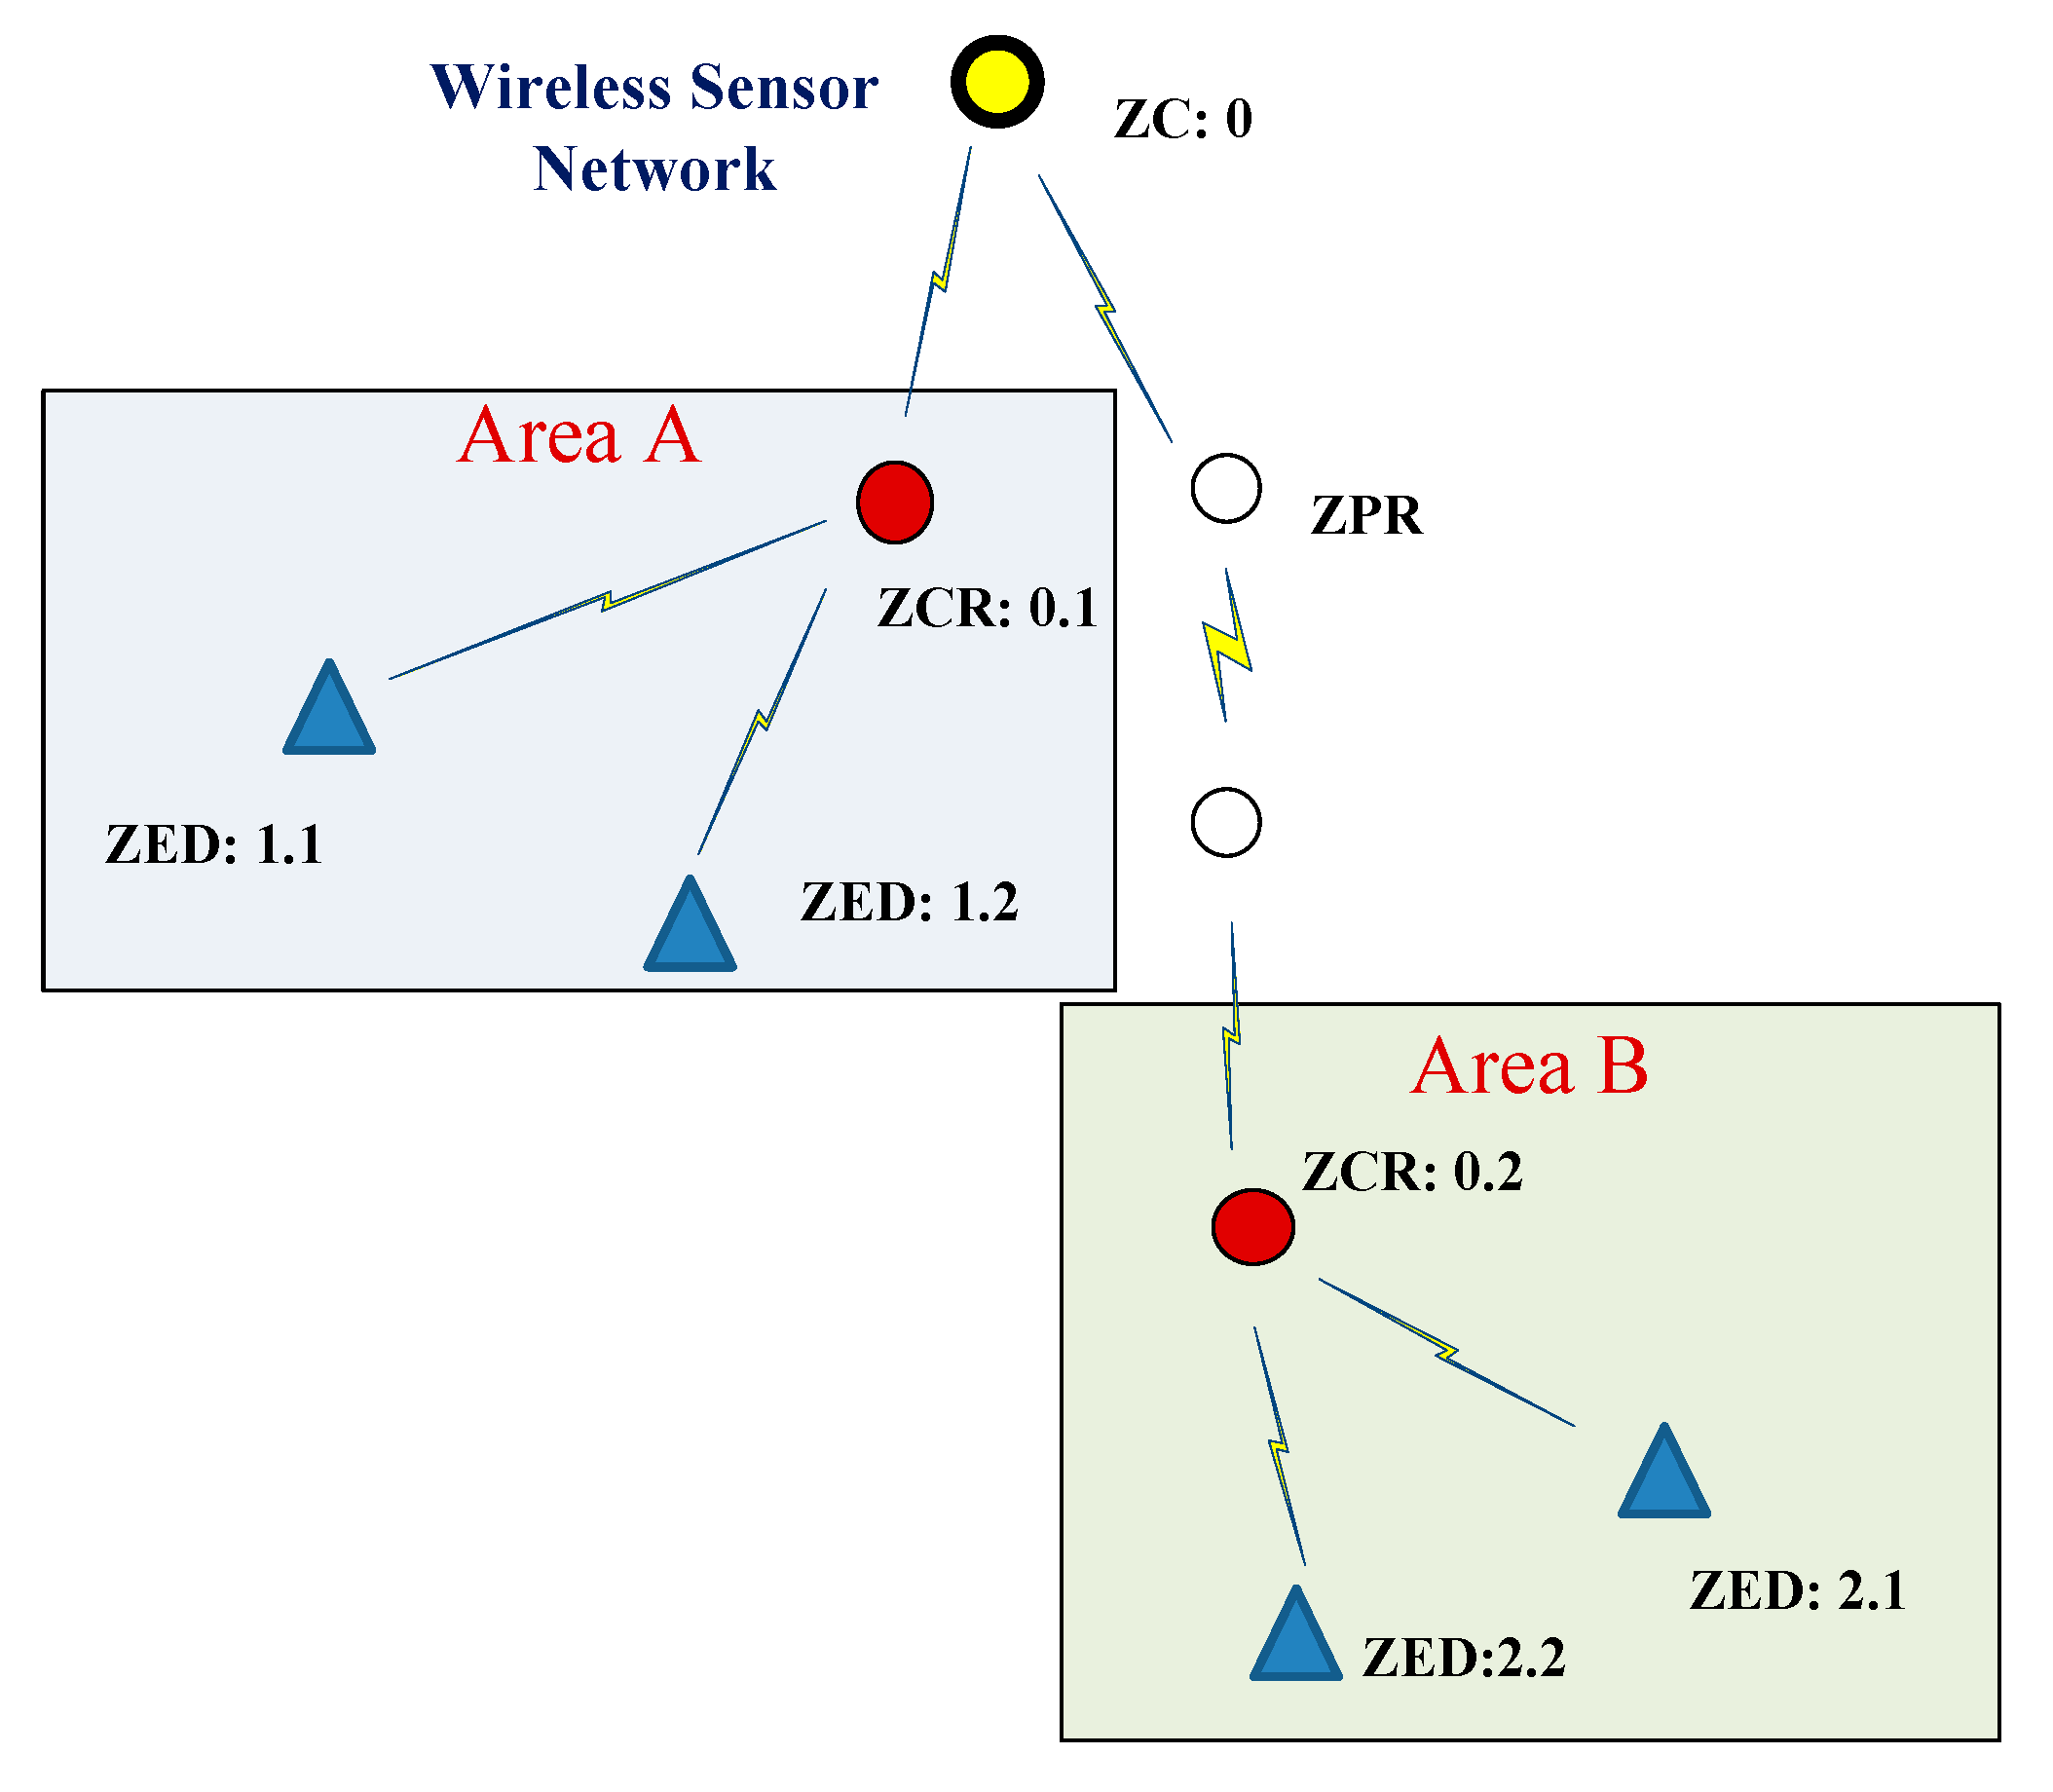
The node deployment process was used while developing a ZigBee WSN with a tree topology (see
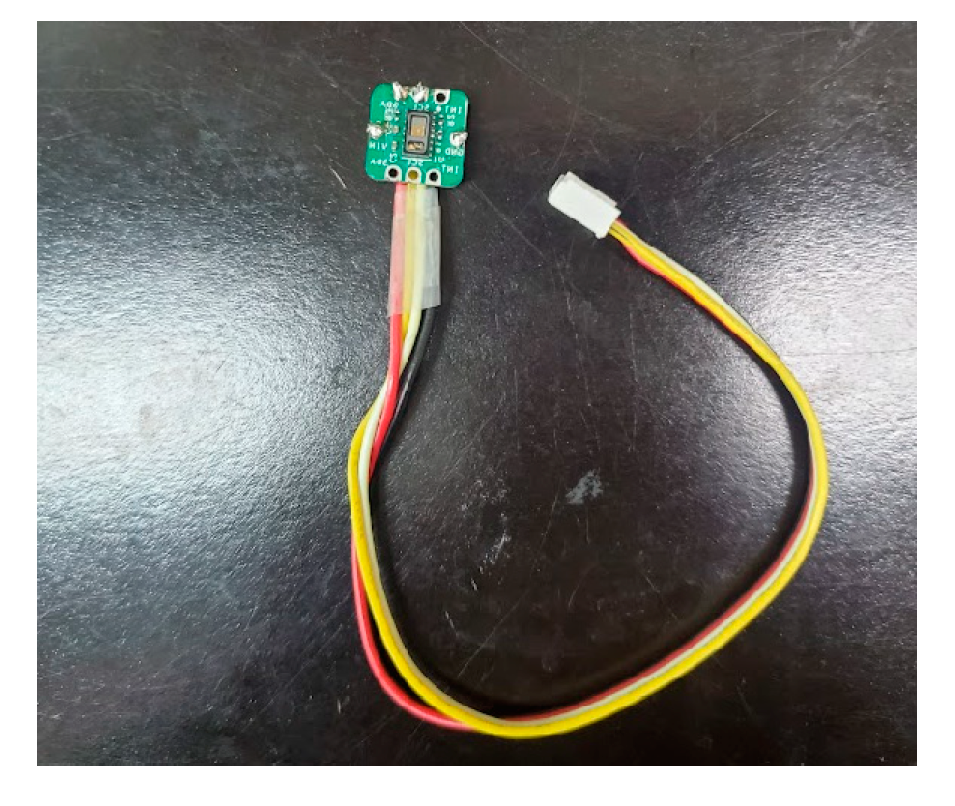
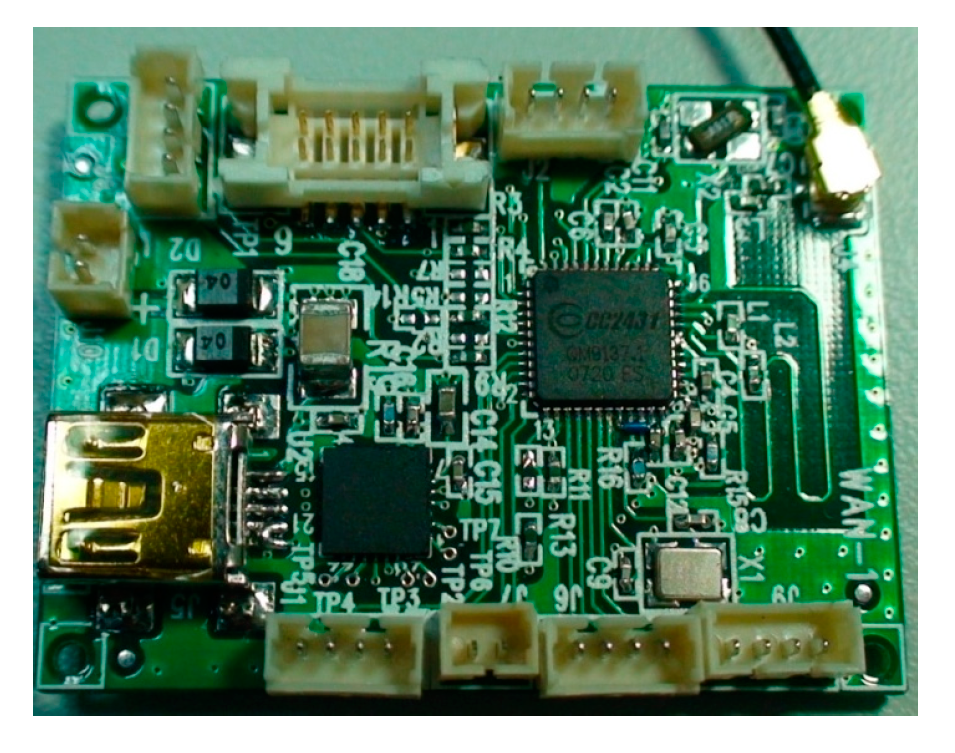
Figure 6). This includes four main devices: the ZigBee coordinator (ZC), controller router (ZCR), pure router (ZPR), and terminal equipment (ZED). The ZC is responsible for establishing the WSN and managing and controlling all nodes. The ZCR controls and manages all sensor nodes in its monitoring areas and monitors data collection. The ZPR is responsible only for forwarding the available signals used to extend the wireless transmission distance. The ZED is responsible for acquiring vital signs through the heart-rate and pulse-oximetry sensor, as shown in
Figure 7. The ZC, ZCR, ZPR, and ZED nodes all used the MICRO TECH WAN-1 sensor developed by the Zhongshan Academy of Sciences. These nodes collect and transmit data from the WSN, as shown in
Figure 8.
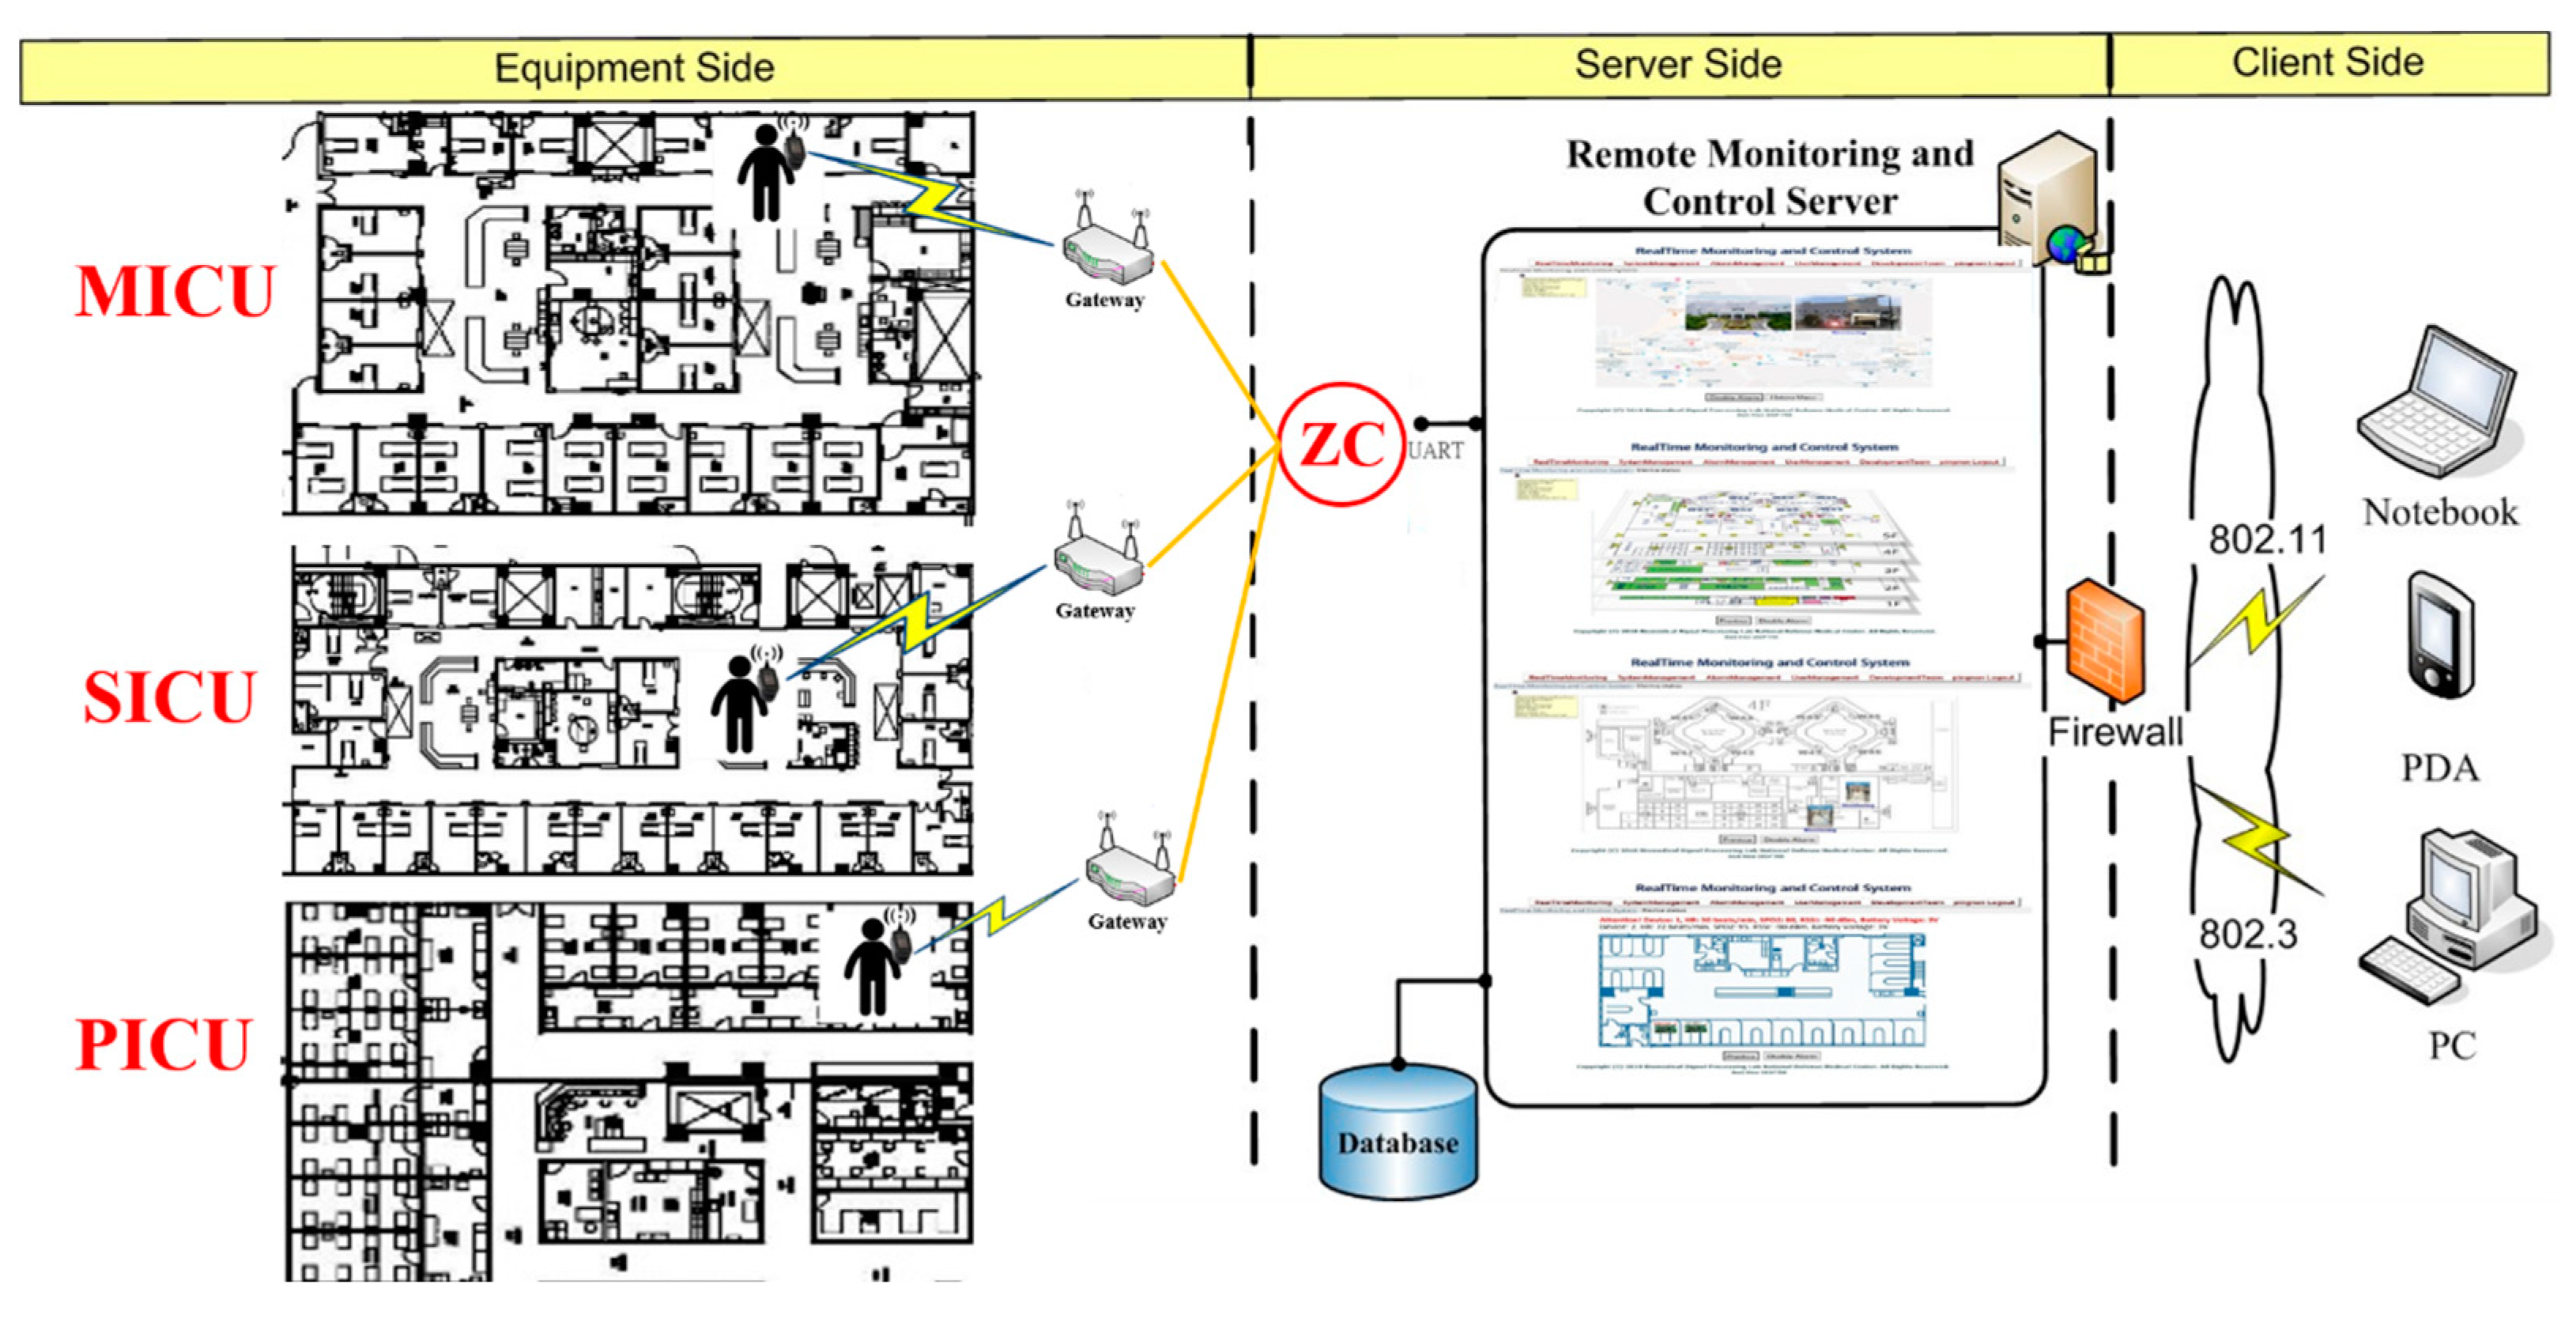
The research architecture diagram in this section is illustrated in
Figure 9. The monitoring system uses wireless sensing devices deployed in the intensive care unit to capture physiological signal information (such as heart rate, blood oxygen concentration, battery power, etc.) and wirelessly senses it. It transmits these sensing data to the monitoring server connected to the wireless sensor network coordinator for processing and storage by means of wireless transmission and displays the patients in the intensive care ward in real-time via the monitoring webpage information on heart rate and blood oxygen concentration.
The monitoring scene uses the incomplete intensive care room space in a hospital to simulate the actual intensive care room environment. We built three intensive care unit spaces to simulate an internal medical intensive care unit (MICU) with 10 beds, a surgical intensive care unit (SICU) with 16 beds, and pediatric intensive care unit (PICU) with eight beds. A monitoring center was built in the room to monitor the physiological signal status of the simulated patients in each intensive care unit in real-time.
In the simulation experiment scenario deployed in this research, because the intensive care unit where the wireless node was set up is on the fourth and fifth floors, the smart gateway designed in the previous section was used to set up the intensive care unit of the simulation experiment and was matched with the physical network of the medical institutions to address the need to transmit physiological signal data to the server across floors.
3. Results
Four-layer real-time monitoring GUI screenshots (shown in
Figure 10,
Figure 11,
Figure 12 and
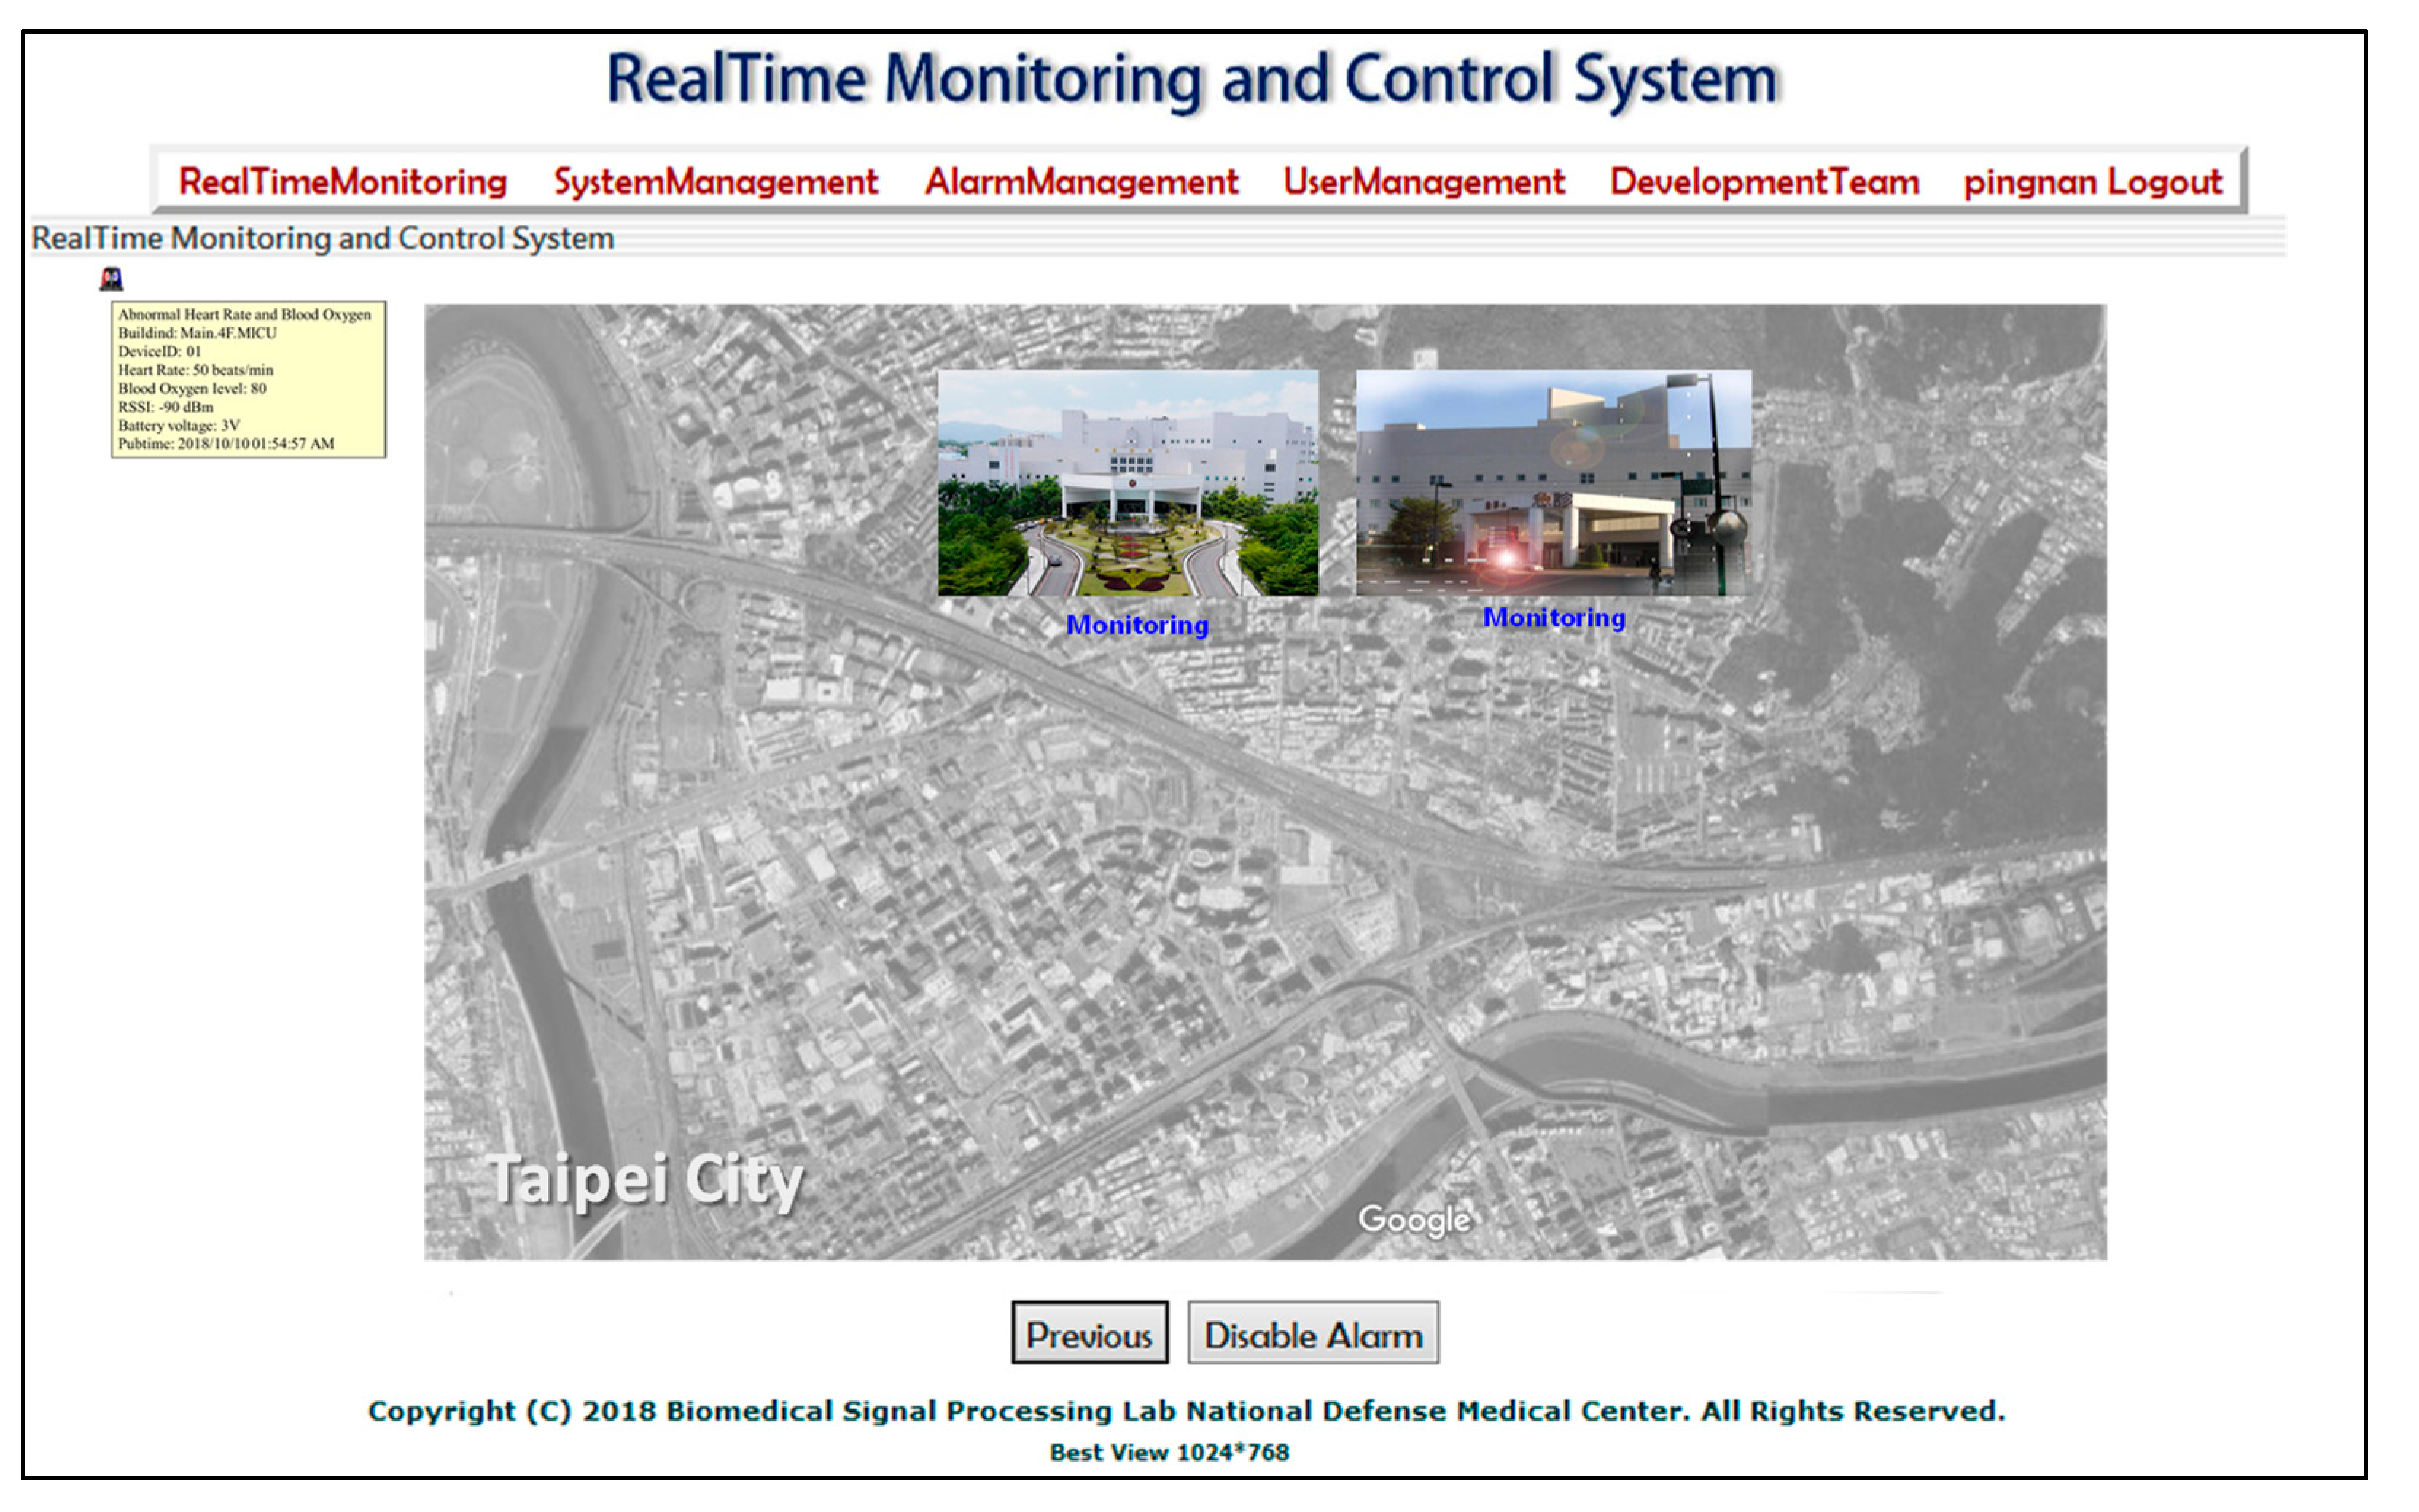
Figure 13). When users select the RealTimeMonitoring tab navigation on the main monitoring interface page, they enter the real-time graphical monitoring interface page for Level 1, which displays the main screen of the monitored area. This page also presents the warning signals and visuals for abnormalities in the sensor nodes (see
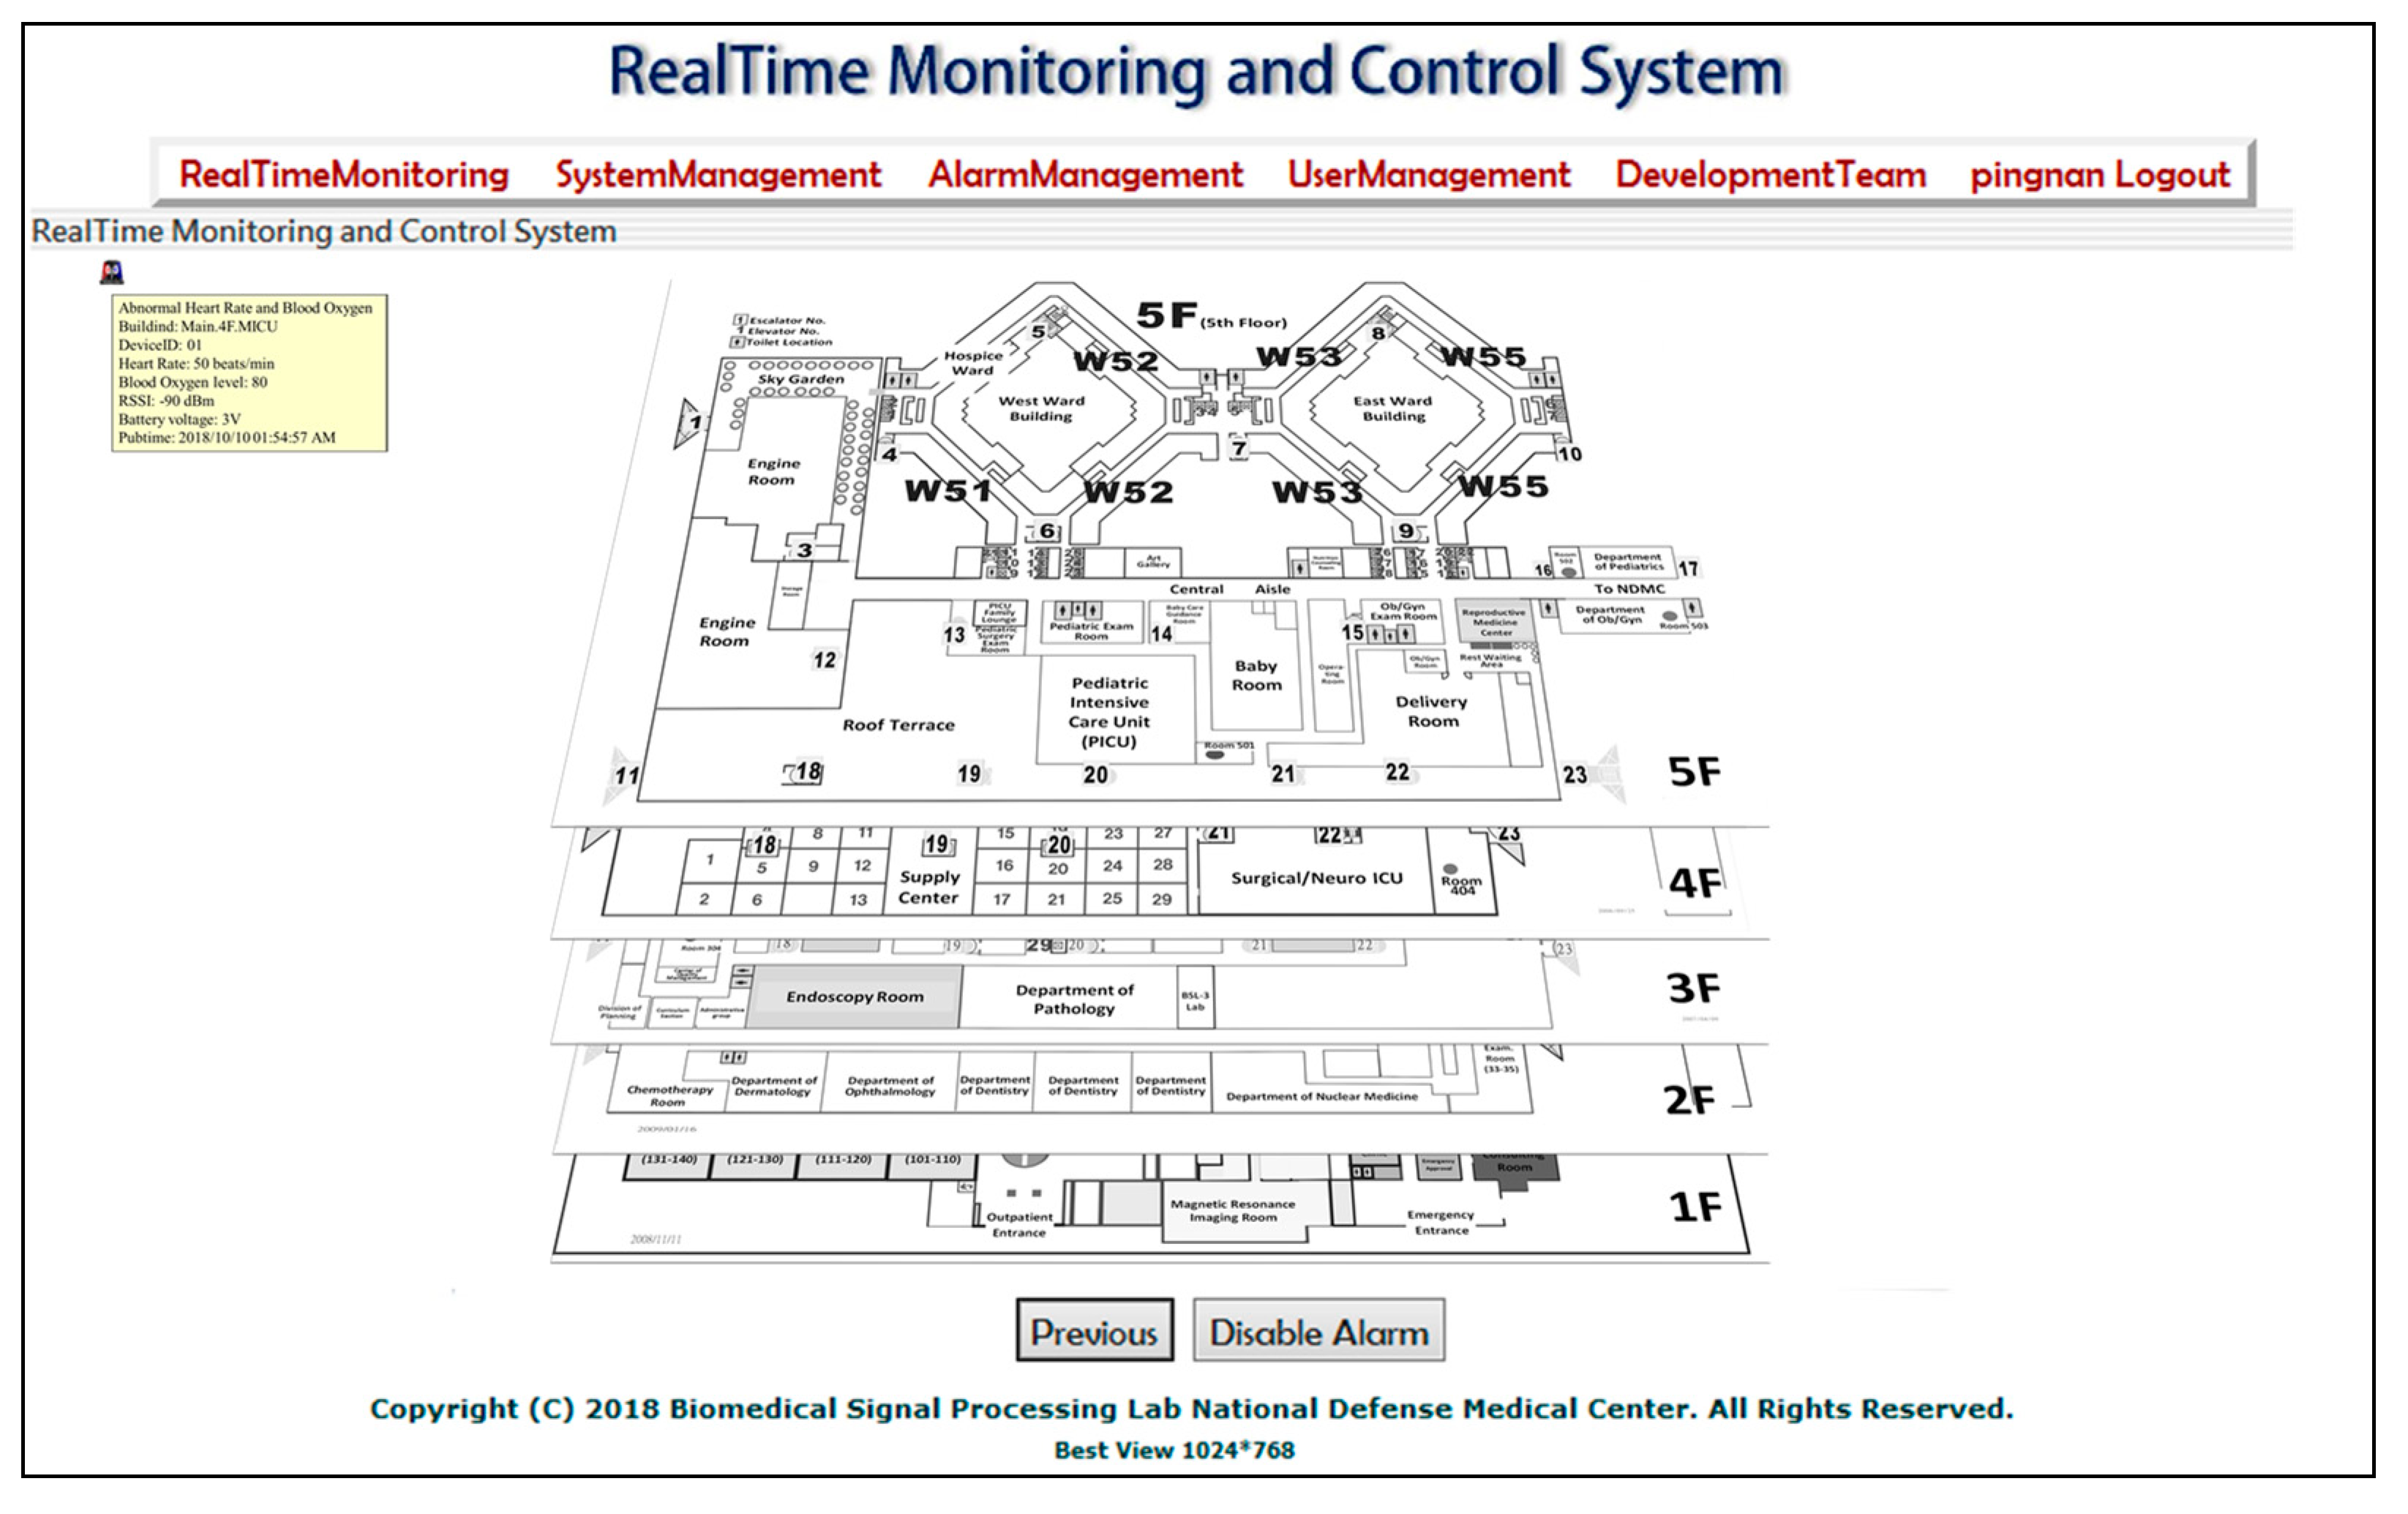
Figure 10). Level 2 includes the layouts of the floors where the ICUs are located (
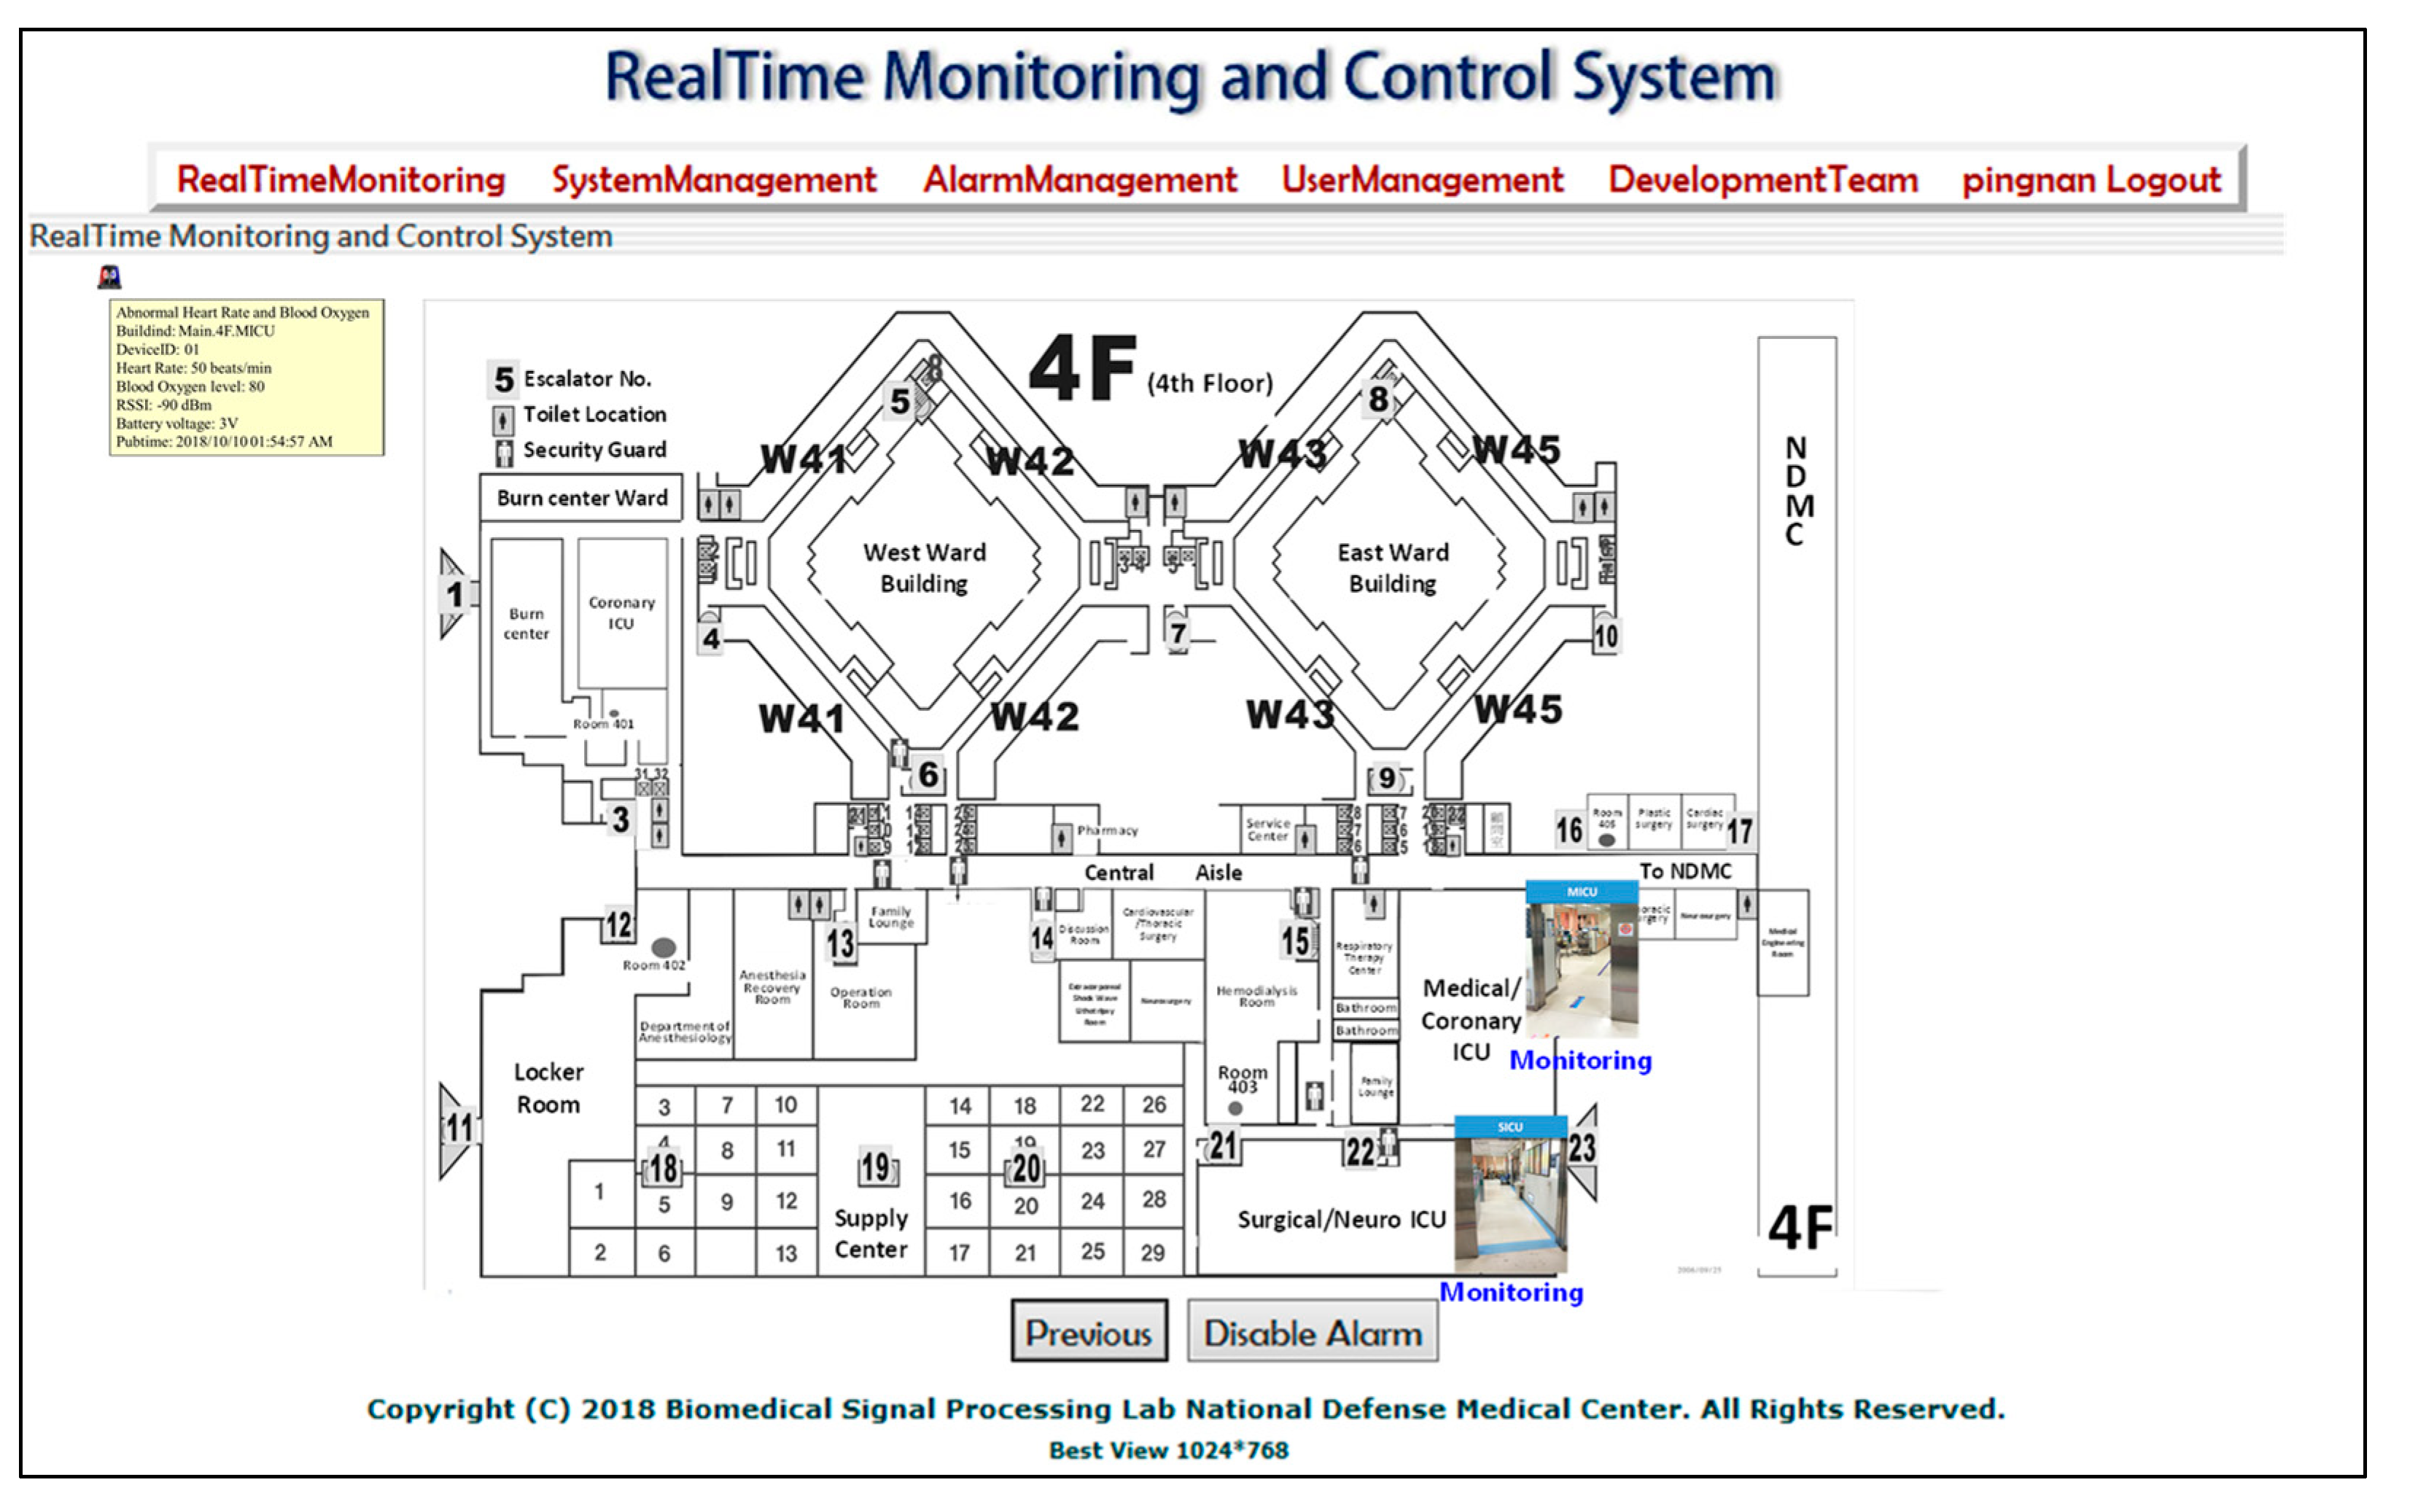
Figure 11). Level 3 is the monitoring page of ICUs on a single floor. The main screens of the monitored areas were the MICU and SICU (see
Figure 12). The system shows a warning icon in the upper left corner of the screen and issues an alarm signal to remind personnel to assess and manage the situation when the system detects abnormalities in the ICUs through the sensors. When a user moves the mouse pointer over the warning icon, the page displays the alarm details. In this example, the alarm details include abnormal heart rate (HR) and the saturation of peripheral oxygen (SpO
2) values, the patient’s location (SICU), identifier of the device (No. 1), HR value (50 beats/min), SpO
2 value (80), battery voltage (3 V), and timestamp of the details (11 October 2018 12:39:45 p.m.).
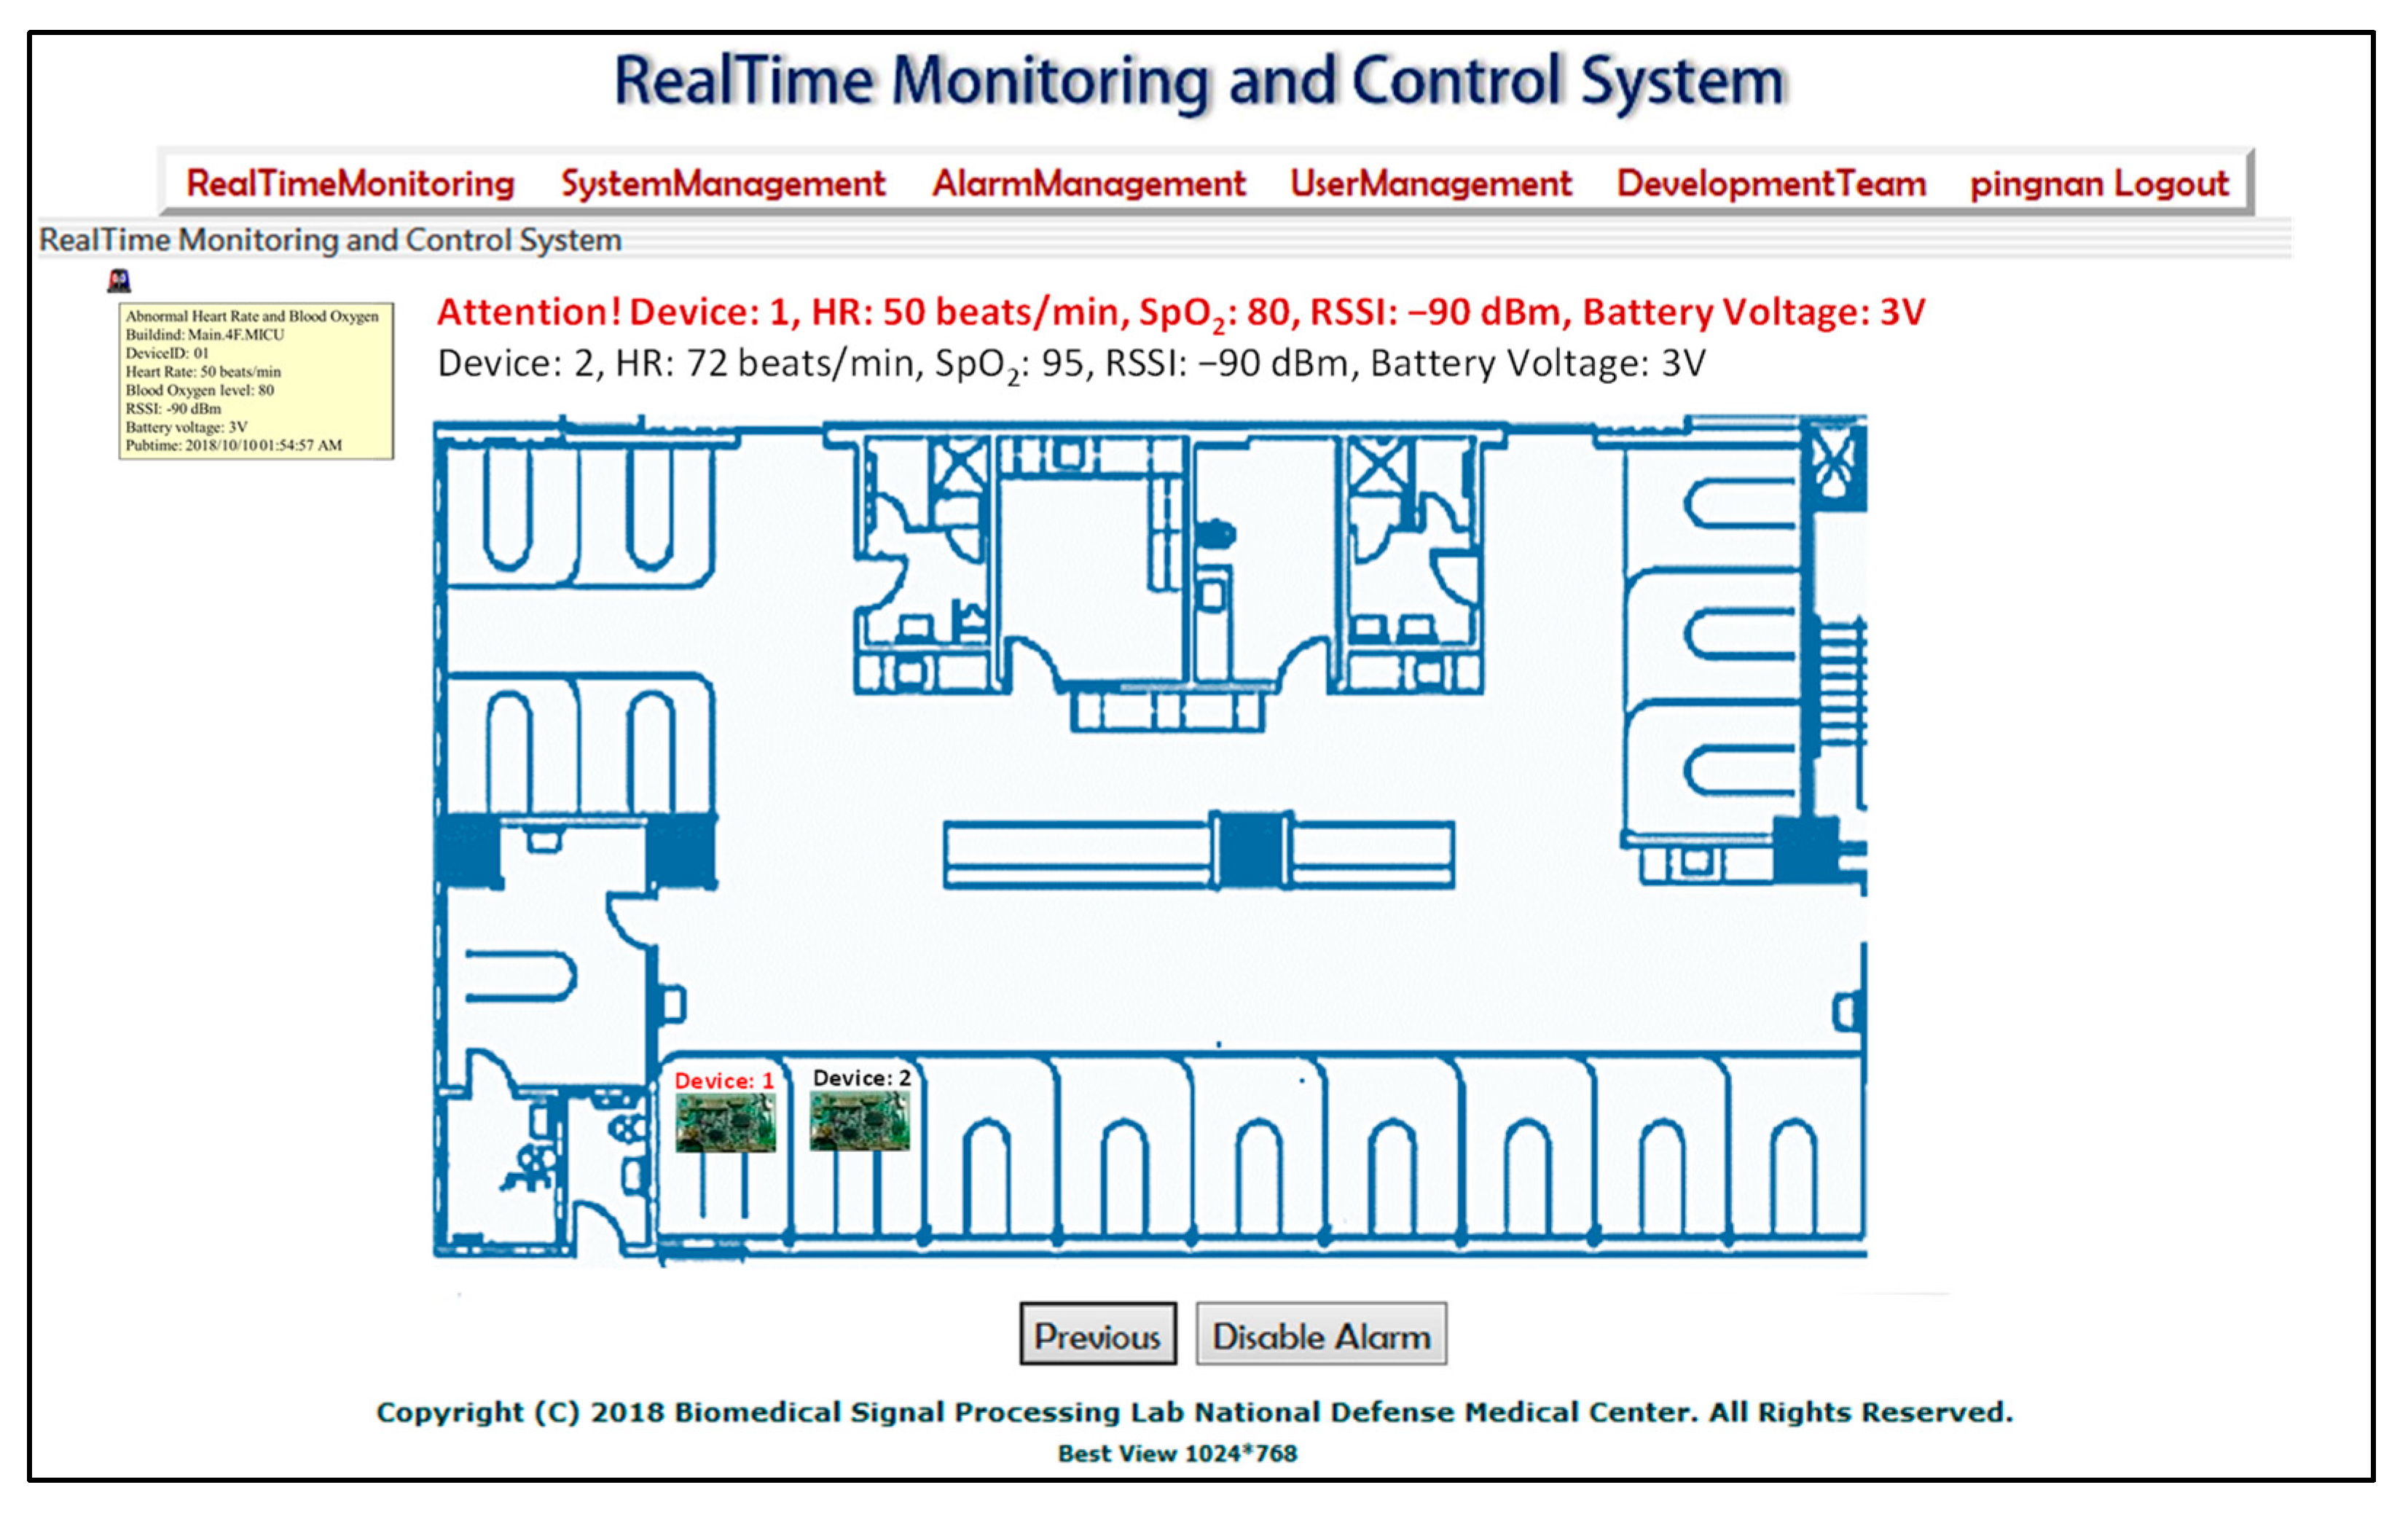
Users can click on the warning icon. The system then redirects the user to Level 4, which includes real-time monitoring of the physiological parameters of the ICU patients. This level displays the images of the bed and sensor device and the detailed information pertaining to the abnormal monitoring parameters detected by the sensor node. The ICU to which the warning icon corresponds is the SICU. Thus, the screen presents images of the SICU and its sensor nodes. The top of the page displays the real-time readings of all sensor nodes. In this example, the warning message shows that sensor node 1 detected an abnormal HR and blood oxygen level. Thus, the following details were displayed in red text: Attention! Device: 1, HR: 50 beats/min, SpO
2: 80, RSSI: −90 dBm, Battery Voltage: 3 V. The HR and SpO
2 detected by sensor device No. 2 did not exceed the set alarm threshold; thus, the following details were displayed in black text: Device: 2, HR: 72 beats/min, SpO
2: 95, RSSI: −90 dBm, Battery Voltage: 3 V (see
Figure 13).
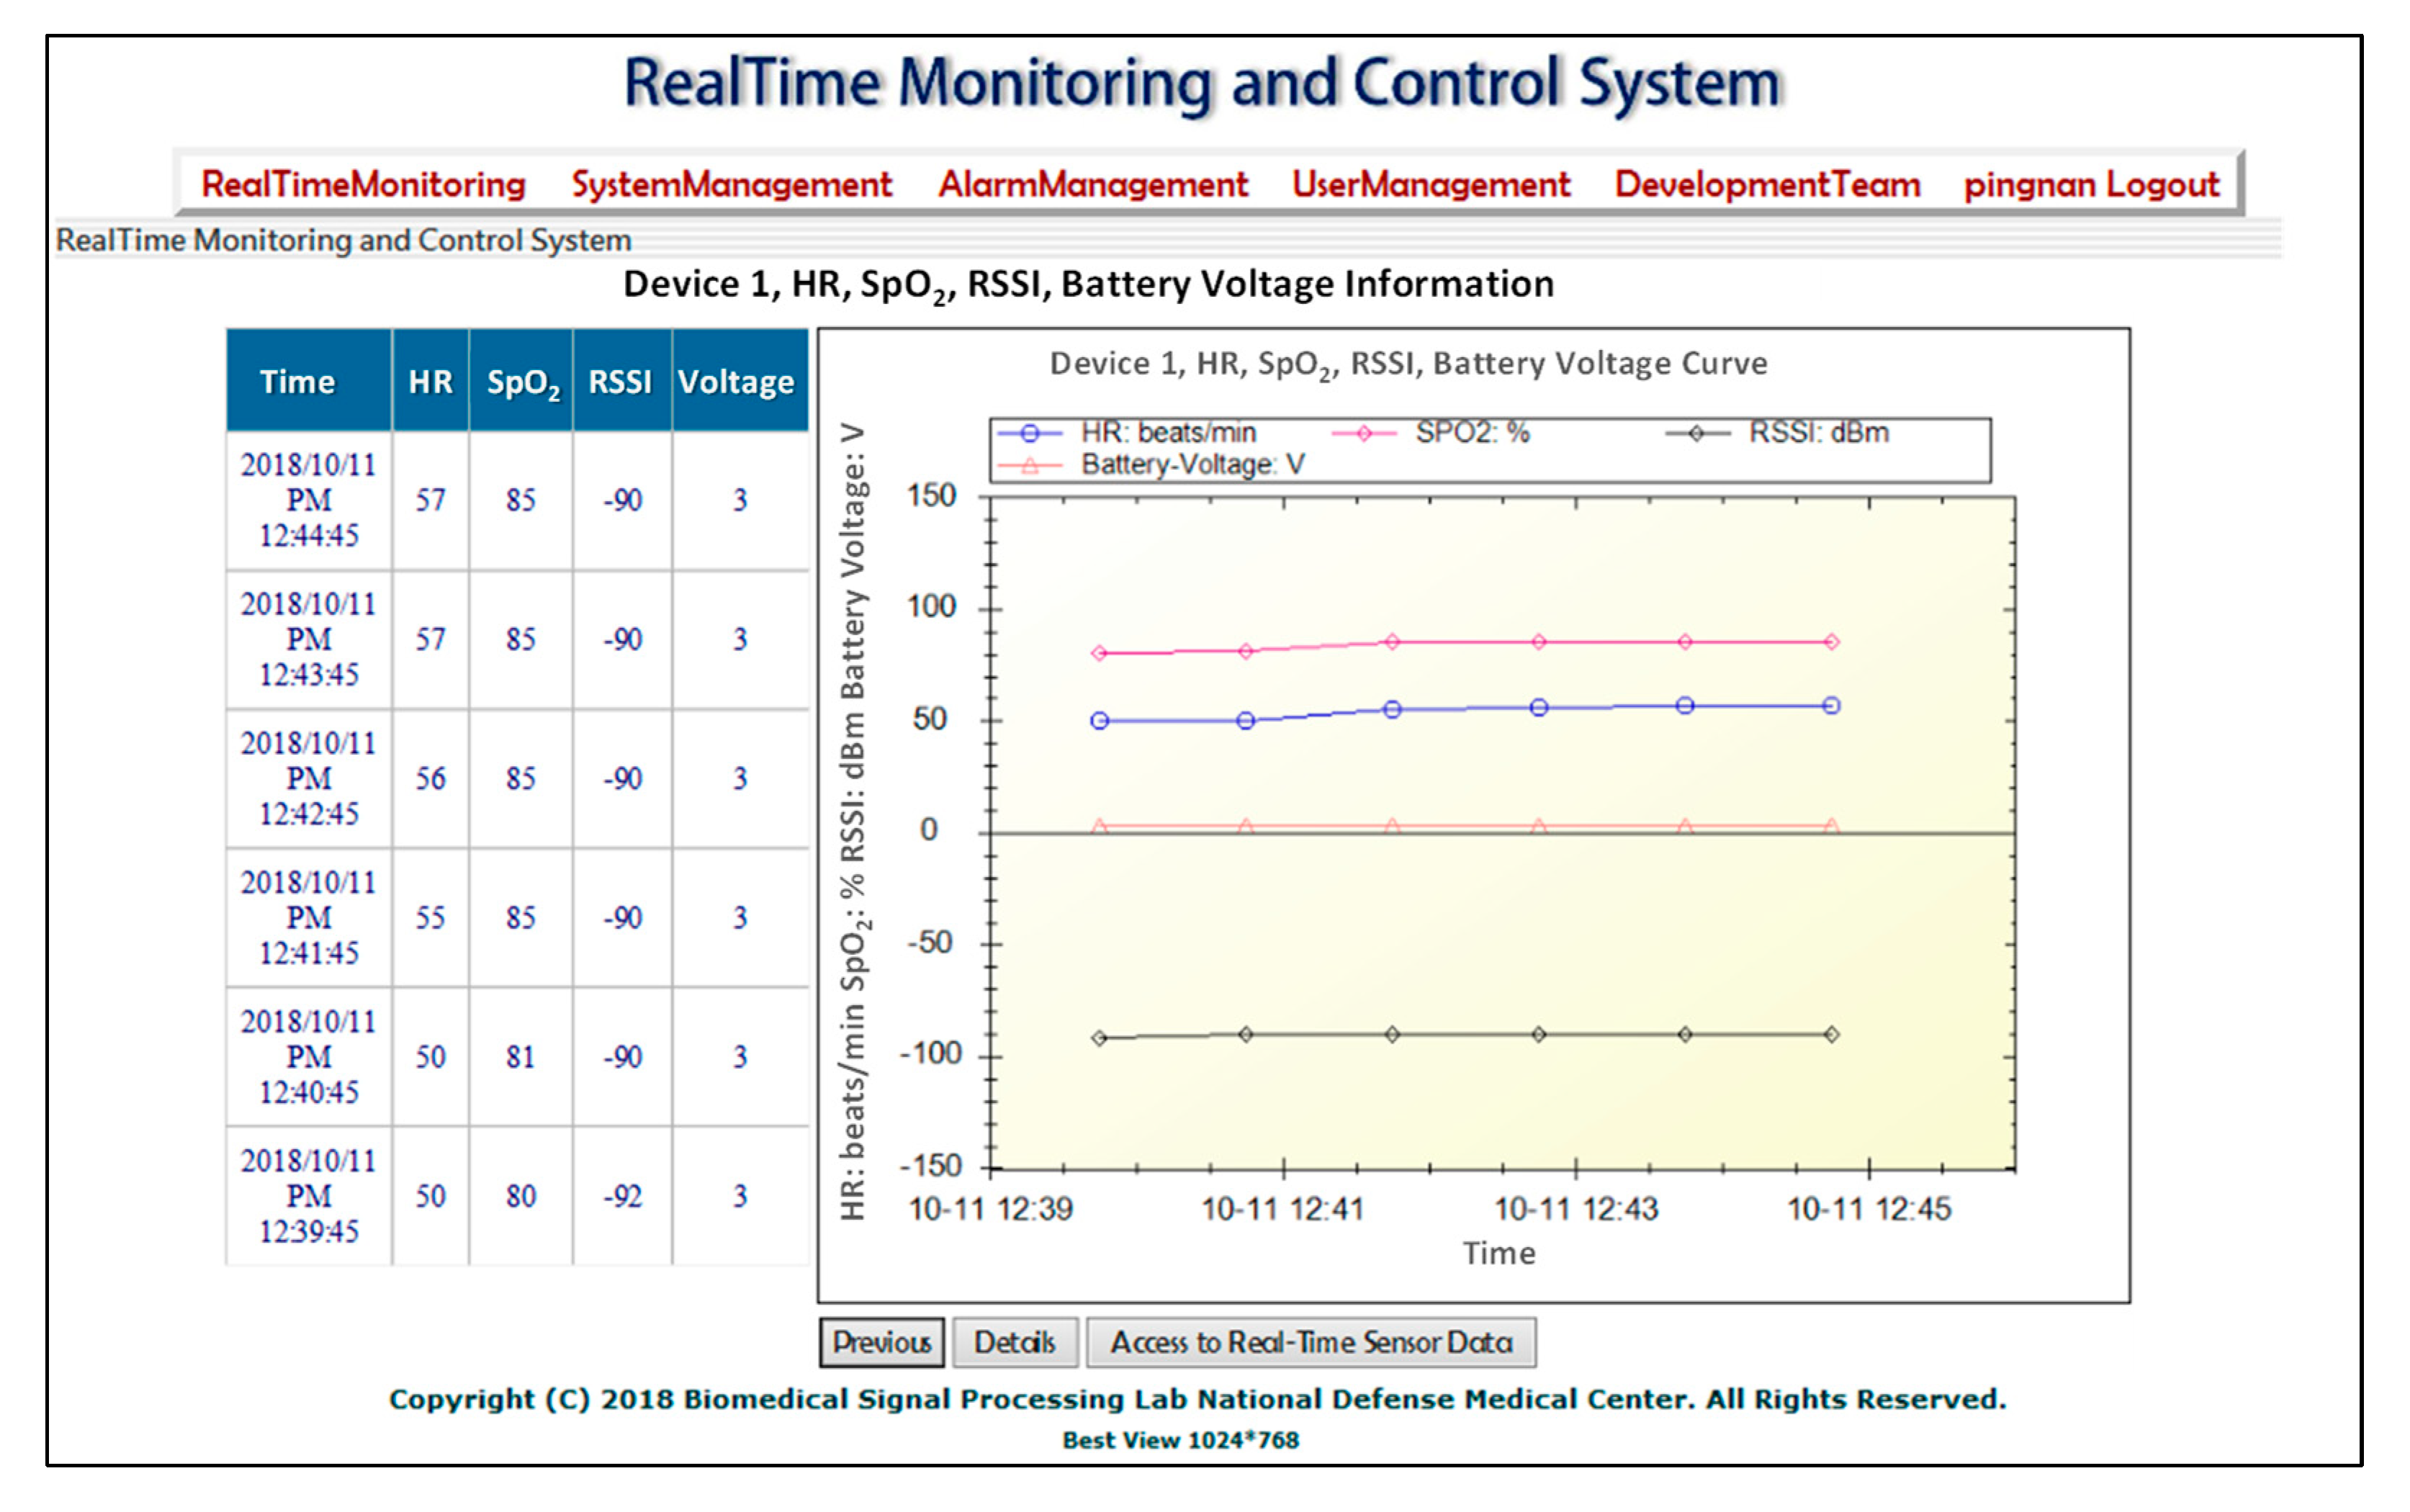
Next, the user can select a monitoring node device that detects abnormal HR and SpO
2 values. The system redirects the user to Level 3 based on the identifier of the monitoring node, which presents a real-time graphical monitoring interface page. This page displays the parameter data and curves detected by the selected sensor node. The left side of the page lists the five latest readings in a table, and the right side of the page displays the readings in a graph (the ○, ◇, □, and △ symbols indicate HR, SpO
2, RSSI, and the state of the charge, respectively). Finally, the user can click the “Details” button at the bottom of the page to be redirected to the details of the sensor node parameters. The user can obtain all of the historical information of the sensor node and export the data as an Excel file to conduct the parameter comparison and verification (see
Figure 14).
The systems developed in previous studies [
1,
5,
12,
14] used graphical methods to display the sensor information. A system proposed in some previous studies [
1,
5,
14] can also display the data curves. In addition to the aforementioned advantages, the system proposed in this study offers a sensor-data-exporting function for comparison and verification. Moreover, the multilayer real-time monitoring windows in the proposed system make it convenient for users to manage tasks according to the category. We also designed a simulated graphical monitoring interface so that users can rapidly create simulated monitoring GUIs on demand. When the monitoring system has to be relocated to a different monitoring scene, suitable simulated graphical monitoring interfaces can be quickly created using the systematic procedures presented in this study. The users do not have to develop an entire new system, which effectively reduces the system development costs. Furthermore, this study proposed the concept of multilayer real-time monitoring, which can enable personnel to implement hierarchical management operations in multiple monitored areas (see
Table 3).
In the conventional program design, three steps are required to establish the monitoring system, which requires 131 min in total. In the proposed method, two of these steps are unnecessary. However, an additional step is required—uploading the image files of the various monitored items to the system. We performed an actual test. The results revealed that the time required to develop the monitoring program, which includes capturing photographs of the monitored areas, writing the monitoring program, integrating and testing the monitoring program, and deploying the captured images in the system, was only 4 min on average (see
Table 4). This demonstrates that the proposed method is superior to the conventional methods in terms of time while simulating graphical monitoring interfaces on demand.
4. Discussion
This study simulated and treated a large number of wounded people and used ZigBee wireless sensor network technology to develop an efficient ZigBee node management mechanism for monitoring vital signs. Through the three-layer architecture (coordinator, control router, and terminal equipment) and the automatic node numbering system, efficient and fast active numbering when a large number of wounded are transferred to the emergency room is improved, so that medical staff can grasp the status of a large number of injured patients in the first place trend.
The medical early warning system used can be connected to the machine by the medical staff when the wounded enter the emergency room to realize remote machine information transmission and early warning functions, aiming to monitor heart rate (HR) and blood oxygen saturation through wireless transmission. Received in the monitoring center, the degree of monitoring is displayed on the monitor, where it is convenient to grasp the life status and dynamics of the wounded in charge, know when to add medicine or perform other first aid treatment, improve the efficiency of rescue work, and at the same time, enable the medical staff to easily understand the living conditions of the wounded and sick in charge, and correctly carry out wireless online guidance work.
Patient biosignature data can also be linked to specific bed numbers and real-time vital sign data using a GUI on a computer or smart device to track patients across the ward and ensure that they receive the most appropriate care. Vital sign data can also be linked in real-time to alert medical staff in critical situations. The proposed system helps in handling a large number of patients in emergency rooms. A bridging mechanism is currently being developed to facilitate the transfer of patients to operating theater wards, intensive care centers, or recovery wards.
Cost analysis, taking the patient’s physiological monitoring system as an example and using a set of monitoring system software developed in this paper, for each hospital branch or nursing center under its jurisdiction can take pictures or draw images, and after reconfiguration, complete the customized remote monitoring system. Therefore, there is only the need to spend on a set of procurement costs, that can be freely expanded as needed. Specifically, during the installation phase, the system administrator only needs to complete steps such as “creating map files and icons”, “uploading geographic map data and creating a virtual environment”, “setting monitoring node icons and numbers”, and the users can operate a multi-layer real-time monitoring interface. When the monitoring system needs to be transplanted to different monitoring scenarios, it only needs to follow the systematic method proposed in this study to quickly build a monitoring graphical interface suitable for the actual situation, without redeveloping the system, which effectively saves the cost of system development.
Oxygen saturation and pulse rate are important indicators for physiological monitoring. The normal range of oxygen saturation is between 95% and 99% [
21]. If the oxygen saturation is lower than 90%, the pulse rate increases to compensate for and provide sufficient oxygen for various organs in the body to maintain the physiological mechanism. If a patient’s blood oxygen concentration drops below the normal range, immediate medical intervention is required. During the COVID-19 pandemic, the use of wireless communication systems as designed in this study in the field of health care can help provide immediate physiological monitoring data to obtain immediate and appropriate treatment to maintain patient health. In addition, the use of wireless medical sensor networks to monitor patient conditions also reduces the threat of COVID-19 or other highly contagious infectious diseases to the medical staff. The four-layer real-time monitoring design also allows COVID-19 patients from admission to the ward, allowing medical staff to monitor the patient’s physiological condition and ensure patient safety. Especially in the face of such high-fatality infectious diseases, medical institutions will take contingency measures including planning dedicated passages and temporarily expropriating wards for admission. The rapid transition of the medical field requires the rapid establishment of a monitoring system. If an emergency occurs, it can quickly respond to the location.
5. Conclusions
This paper presented an example of applying the system for ICU monitoring, which encompassed the construction of graphical monitoring interfaces, operation demonstrations, and verification. We also compared the functions and effectiveness of the proposed method with those of the conventional methods. The results indicate that the proposed method provides user-friendly operations, imposes low costs, and can be applied to many medical care, monitoring systems, and telemedicine. According to the actual needs, the physiological signals of patients in independent intensive care units can be built on the same monitoring center interface, so that even if patients are scattered in different intensive care units, the same interface can be controlled to improve patient safety.


