Article

Methodology for Evaluating the Performance Data of Practical Honeycomb Fairing

by
Valeriy V. Bodryshev
1,*,
Artem A. Larin
2 and
Lev N. Rabinskiy
1
1
Moscow Aviation Institute, Volokolamskoe Highway 4, 125993 Moscow, Russia
2
Research and Production Enterprise “Kaluga-Based Instrument-Making Plant “TYPHOON” Joint-Stock Company, Grabtsevskoe Highway 174, 248035 Kaluga, Russia
*
Author to whom correspondence should be addressed.
Inventions 2023, 8(1), 42; https://doi.org/10.3390/inventions8010042
Submission received: 23 November 2022 / Revised: 24 January 2023 / Accepted: 29 January 2023 / Published: 3 February 2023
(This article belongs to the Special Issue Data Analytics in the Energy Sector)

Abstract

:
The quality criteria for fairing used to protect antenna devices (AD) of radar stations (RS) from environmental influences are the requirements for ensuring and maintaining strength and protective properties with minimal insertion loss of the transmitted electromagnetic wave (EMW). It is important to assess the influence of manufacturing technology on these parameters, identifying narrow critical zones on the product with minimum strength characteristics and maximum EMW insertion loss. Calculation models of the stress state in a three-layer sandwich are presented with the identification of critical places from a given type of loading. A method for flaw detection of fairings is presented, taking into account the influence of the dynamics of changes in the maximum allowable threshold of EMW losses, which is extremely necessary for analyzing the technological process and correcting strength calculations.

1. Introduction

The fairings are designed to protect AD of RS from environmental influences and must have sufficient mechanical strength and radio transparency (they should introduce minimal energy losses during the passage of EMW) [1,2].
The choice of the optimal constructive variant of the radio-transparent shelter includes the solution of the following tasks:
  • selection of the optimal geometric shape of the shelter, based on the layout solution of the entire structure of the object;
  • choice of materials and technological solution when creating a shelter shell;
  • analysis of the strength component of the manufacture of fairings.
When choosing a technological solution in the process of manufacturing fairings at the stages of output inspection, the task of detecting and localizing defects (flaw detection) with an analysis of their size, shape, and influence on the mechanical strength of the product arises.
Honeycomb fairings are structures with a good combination of strength and radio transparency. In addition to this, these structures have a low weight.
A feature of the manufacture of honeycomb structures is the need to control performance indicators in the process of their manufacture. Known methods of non-destructive testing of materials (acoustic, magnetic, vortex, thermal, etc.) [3] are able to detect a structural defect in a material, which is important for analyzing the design strength of a product, but they do not evaluate the second factor—the effect of a detected defect on radio transparency. In addition, there are cases when, within the framework of non-destructive testing, defects are not detected, or the detected defect is insignificant from the point of view of structural strength, while this area has a greater effect on the radio characteristics of the shelter compared to its other areas. Therefore, in order to decide on the suitability of the product, it is necessary to carry out flaw detection based on the measurement of radio engineering (electrical) parameters.
In addition to this, these methods—as applied to honeycomb composite materials—are ineffective due to their design features: uneven spreading of the binder between the layers during the formation of the wall material leads to their forced heterogeneity, which, in turn, leads to the identification of many false defects.
Therefore, in order to make a decision on the suitability of a product, it is necessary not only to search for structural defects in the fairing, but also to control the level of EMW energy losses introduced by it, taking into account a comprehensive assessment of the strength parameters from various types of impact and meeting the requirements for the radio transparency of structures.
To test finished specimens of radio-transparent shelters (radomes), the substitution method in the field of a flat EMW is often used. As a rule, such tests are carried out “normally”, as part of the antenna and antenna-feeder path of the radar, i.e., the entire radome antenna system (RAS) serves as the object of research. Detailed radio engineering tests of the RAS are described in the specialized literature [4,5]. However, it is not always convenient to manufacture, as a workplace, the antenna system of a product for which the radome is intended, including from an economic point of view. In addition, the manufacture of the antenna system and the radome are often spaced apart in time and space (for example, a specialized enterprise is engaged).
In the practical implementation of this method, it is necessary to ensure stable values of the radiated power level, the characteristics of the receiving devices and the path, and to exclude reflections from third-party objects. It is also desirable that the dimensions of the aperture and the regular radar antenna be close.
This method is especially important for fairings, since it allows not only to detect defective zones, but also to evaluate radio transparency, which is their most important property.
The purpose of this article is to develop a comprehensive methodology for assessing the strength and electrical indicators of practical designs of honeycomb fairings with a methodology for assessing defectiveness zones and their position on the product structure.

2. Methodology

The performance indicators of honeycomb fairings in terms of strength and radio-transparent requirements are most often opposite. These indicators largely depend on technological defects in the manufacture of radio-transparent shelters (RTS). The scheme for assessing the performance of the object structure is shown in the Figure 1.
At the first stage, the electrical parameters of the fairing are studied. At this stage, RTS is evaluated, which consists of measuring the amount of EMW energy losses introduced according to a predetermined grid of points (Figure 2) and the subsequent calculation of a complex electrical indicator. In the process of checking the fairing, its working area is divided into a grid of control discrete “points”, in each of which the signal level of the incident EMW is measured with further calculation of EMW energy loss L. Thus, as a result of testing, an array of data is formed [x, y, z, L, f], where there are values of energy losses Li for each geometric point [xi, yi, zj] at each specific frequency fk.
At the second stage, the study of strength indicators is carried out. As a part of this stage, defects are detected, and strength indicators are calculated in order to further compare the results obtained. At the third stage, it is important to analyze the effect of defectiveness on the requirements for the loss of EMW. At the last stage, a comprehensive assessment of the manufacturability of RTS design is made.
The amount of EMW energy loss introduced by the fairing directly depends on the design of the material (on the thickness and number of layers and on their dielectric characteristics) [6,7] from which it is made. Since structural defects in a composite material represent a violation of the structure (thickening or thinning of layers, foreign inclusions, adhesive joint thickness, presence of voids, etc.), the value of insertion loss measured on the section of RTS wall corresponding to the defect will differ from areas without defects. Accordingly, zones with sharply distinguished values of EMW losses “coincide” with zones of change in design parameters and, as a result, changes in strength characteristics will be observed in these zones. Comparison of the results of flaw detection on the finished fairing and the results of calculating the strength parameters provides comprehensive data on its performance.

2.1. Study of Electrical Indicators as Parameters for Assessing the Quality of Honeycomb Fillers

The following equipment is required for testing: a transmitting and receiving test antenna, cable assemblies of known length, and a vector network analyzer with a time domain function. The workplace is schematically shown in the Figure 3. The choice of antenna size depends on two factors: the required frequency range (dictated by the operating range of the radome) and the dimensions of the radome structure being measured. The distance between the receiving and transmitting antennas is selected based on the fulfillment of the far zone condition so that the EMW incident on the fairing has a flat front. EMW from the generator is broadcasted by the transmitting measuring antenna. The receiving antenna receives the emitted signal, which is transmitted via a microwave cable to the receiver, on which its level is fixed. Processing of the obtained results and generation of reports takes place on a personal computer.
Measurement of EMW losses at a given “point” of the fairing at a given operating frequency f0 are carried out under anechoic conditions in two stages. At the first stage, the signal level of the incident EMW is measured from the output of the measuring antenna (antenna) without a fairing P0, then (at the second stage) the signal level is measured Pij (where i, j are the serial numbers of the geometric point vertically and horizontally, respectively) from the antenna output with the installed fairing. The frequency grid step is selected based on the expected size of the detected defect. In practice, it was found that the minimum size of a detected defect is 1/10…1/4 (depending on its structure and nature) of the measuring antenna aperture area. If the controlled fairing wall has a spherical or cylindrical shape, it is necessary to take into account the possible error caused by its non-flatness [8,9]. Based on the ratio of the measured signals, EMW losses are calculated at a given point:
L i j = P i j P 0 .
Measurements Pij, P0 are carried out on products placed in anechoic conditions: for small-sized products—in anechoic chambers [10], for large-sized products—at landfills that create anechoic conditions [11,12].
Evaluation of operability by the criterion of radio transparency is based on the fulfillment of the requirements of not exceeding the permissible value of EMW loss Lv with a given confidence probability.
Based on the generated data array [x, y, z, L, f] for a given specific exposure frequency EMW f, it is necessary to determine the confidence interval for the following average value:
L ¯ = i = 1 n j = 1 m L i j n m .
Here n, m are, respectively, the number of measurements Lij measurement data in “rows” (levels) and “columns” of the corresponding array (Figure 2).
Confidence interval mL is determined by dependency [13]:
m L L ¯ ± Z p S L n m ,
where
S L = 1 n m 1 i = 1 n j = 1 m L i j L ¯ 2 .
Zp is the value determined by the confidence probability p by the value of the Laplace function Φ (Zp).
In this case, there is the following condition:
L ¯ + Z p S d n m L v .
Therefore, non-exceeding of the given level Lv is determined with confidence p.
The effect of the fairing on the operating wavelength of AD, for which this fairing is intended, is characterized by a decrease in the directivity of the antenna under the influence of random amplitude errors introduced by the fairing kD [14]. Coefficient kD is the ratio of D (directivity of the antenna-fairing) to D0 directivity ideal antenna without the following antenna error:
k D = D D 0 1 1 + 3 4 π d λ 2 S L 2 ,
where d is the maximum size of AD aperture, λ is the maximum operating wavelength AD, and SL is the standard deviation of the value L at a given frequency.

2.2. Methods for Determining the Strength Characteristics of Honeycomb Sandwiches

On the Figure 4 there are the examples of samples of a three-layer radio-transparent material.
All of them are a sandwich of two skins and a middle filling layer glued together. For design schemes, the relative density of these fillers is most often considered. Relative density ρ ¯ of the cellular structure is the ratio of the density of the aggregate structure to the density of its material.
Honeycomb sandwiches are characterized by the relative density of the cellular structure ρ ¯ : the ratio of the density of the aggregate structure to the density of its material.
There are two types of porous aggregates: with open cells (Figure 4b) and with closed cells (Figure 4a,c). The modulus of elasticity and the relative density decrease as the number of pores increases. The relative density for porous aggregates can be represented as follows [15]:
  • for open cell fillers:
E a E a M ρ 2 ,
where Eɜ is the value of the modulus of elasticity of the filler and Es is the value of the modulus of elasticity of the filler material;
  • for close cell fillers:
E a E a M ϕ 2 ρ 2 + 1 ϕ ρ ¯ ,
where ϕ is the proportion of solids in the aggregate.
The papers [16] show the main dependencies for evaluating the strength characteristics of three-layer sandwiches depending on the type of loading. With external mechanical influences, the main loads are assumed by the skins. At the same time, shear loads of a rather high level act on the gluing surface of the skins with the honeycomb panel, and compressive loads act on the honeycomb panel. The structure can lose stability from normal and shear deformations, as well as interlayer shear between the skin and the filler.
In the papers [17,18], elements of analytical strength calculations of radio-transparent fairing are presented. The stress–strain state is compared under different types of loading. The dependences of external pressure loading of cylindrical and conical structures are presented. It is shown that at the initial stages of design, analytical dependencies make it possible to choose the fundamental design of radio-transparent fairing. A calculation method involving the finite element method is considered.
The Figure 5 shows an example of a graphical display of the stress state in a honeycomb sandwich during bending, related to the ultimate stresses obtained. Based on the calculation model, we can see the “imprints” of honeycombs on the skin and the concentration of stresses in the walls of the honeycombs near the zone of their gluing to the skins, demonstrating the transfer of forces in this design.
In the place where the skins and the honeycomb panel are glued together, the stress is summed up not only under bending loads, but also under other types of external influences.
Based on the calculation model (Figure 5), the gluing site is the maximum stressed state. At the same time, it is these places that have the greatest number of technological deviations. It is important to have ways to detect them and analyze the impact on the performance of the structure and to evaluate the impact of a change in the strength component at the site of the detected defect.

2.3. Evaluation of the Quality of Products by the Parameter of EMW Loss. Determination of Defect Zones

When analyzing the performance of a design, it is necessary to evaluate the stability of the manufacturing technology of the product. This task consists of solving the following questions (Table 1):
  • Assessment of the identity of the structure manufacture by the parameter L.
  • Evaluation of the homogeneity of the structure by assessing the stability L in its individual sections.
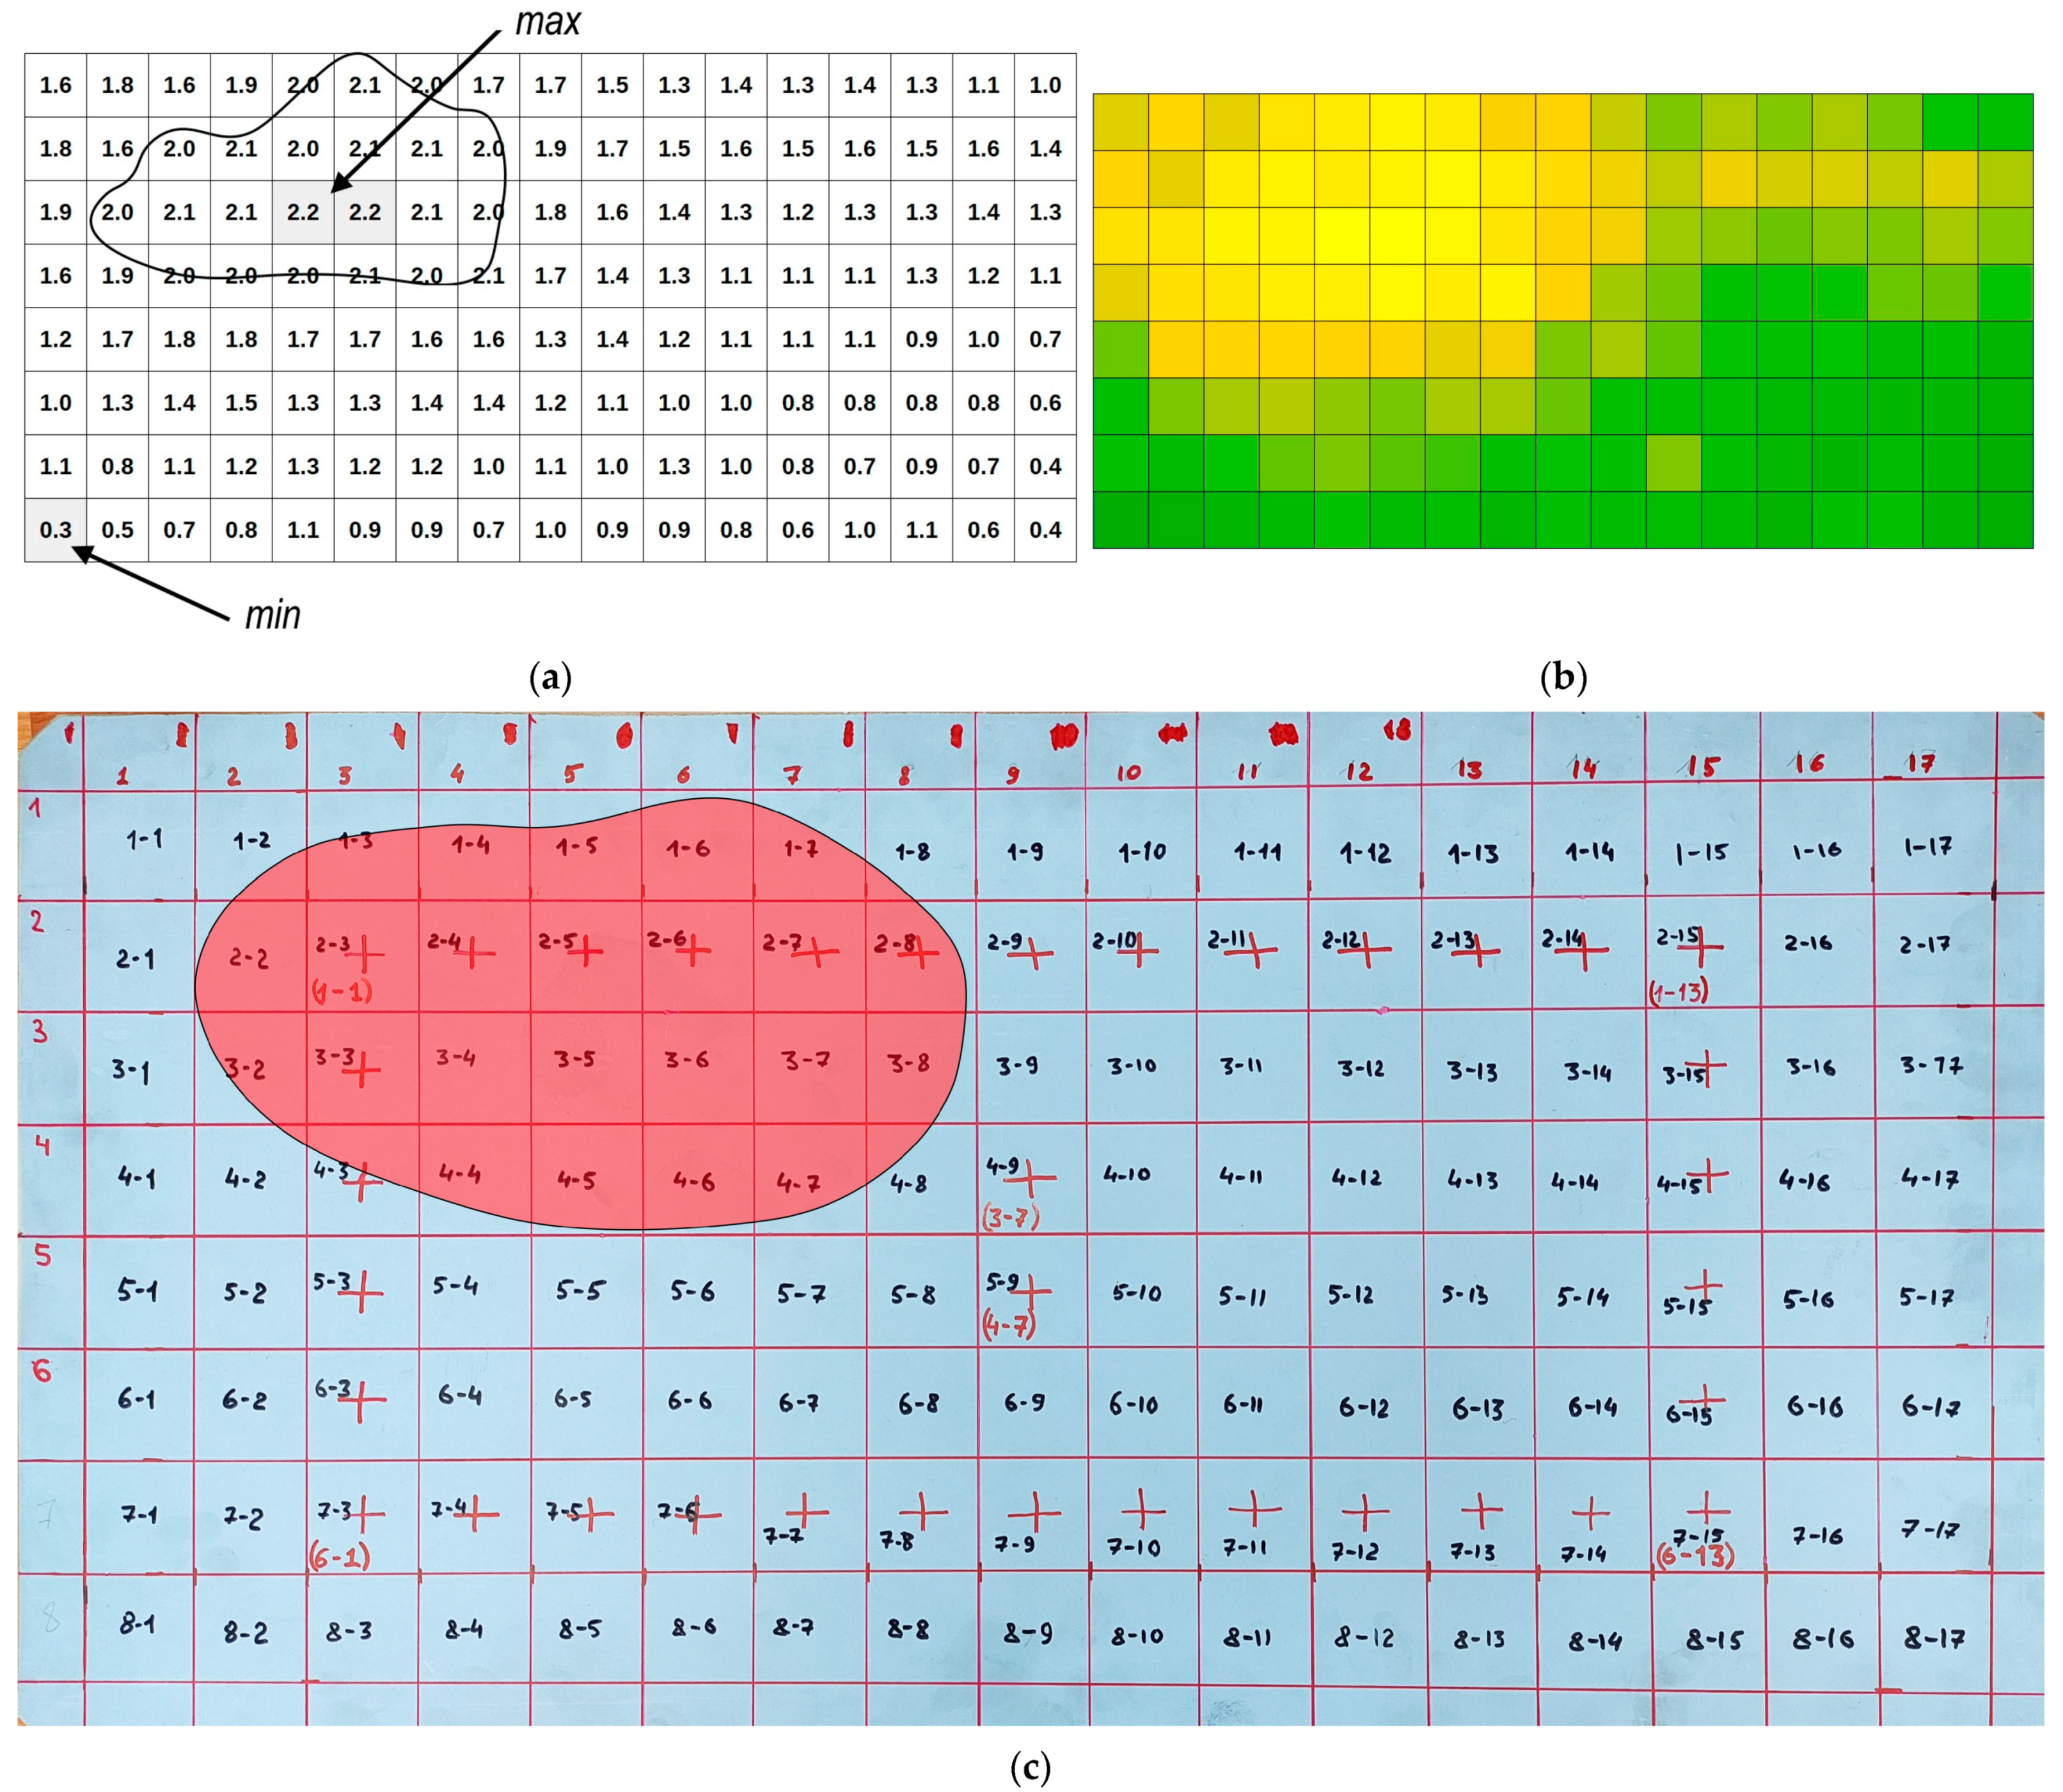
  • Determination of defect zones, their geometric dimensions and position on the structure.
Thus, there are two independent samples of measurements n1 and n2. To assess the identity of the manufacture of honeycomb structures in terms of the dispersion parameter of the scatter of the parameter L, it is appropriate to apply the F-test (Fisher’s test) for two samples:
F = s 1 2 s 2 2 .
Here, the scatter variances s 1 2 and s 2 2 for two measurement arrays are estimated by the following expressions:
s 1 2 = 1 n 1 1 i = 1 n 1 L i 1 L 1 ¯ 2 ,
s 2 2 = 1 n 2 1 i = 1 n 2 L i 2 L 2 ¯ 2 .
The values L 1 ¯ , L 2 ¯ are the average values for samples 1 and 2 (site), n1, n2 are the number of measurements Li in given samples.
According to the table of critical points for a given level of significance α and number of degrees of freedom k1 = n1  1 and k2 = n2  1, we determine the critical point Fcr (α, k1, k2).
If F < Fcr, then the difference between the calculated variances is insignificant.
In addition to analyzing the spread of the variances of two samples, it is important to have data on the equality of the means. This is extremely relevant when comparing designs made using different manufacturing processes. We carry out testing the hypothesis about the equality of means L ¯ using the t-test:
t = L 1 ¯ L 2 ¯ s 1 2 n 1 + s 2 2 n 2 .
Critical value tcr is determined from the student distribution table with a confidence level of 0.95 and the number of degrees of freedom n − 1.
If t > tcr, the null hypothesis and the hypothesis of mean values is rejected, i.e., there are deviations from the technological process in the manufacture of these products (sections of the object).
In the case of analyzing sections of the object in accordance with the specified criteria, they can be qualified as identical, with the selection of sections on which the F-test and t-test indicate the rejection of this hypothesis.
To determine the geometric coordinates of “defective” cells with an assessment of the shape and area of heterogeneity, it is advisable to use the theory of receptor models. Mathematically, the receptor model is described by the set A = {aij}:
a i j = 1 ,   i f   L i j L v 0 ,   i f   n o t  
or
a i j = L i j ,   i f   L i L v 0 ,   i f   n o t   .
In this case, two types of cells are displayed: 1—with excess Lv and 0—without excess Lv. For Equation (14) in the zone (cells) of defectiveness, the values Lij are fixed with excess of Lv.
Thus, using Equations (13) and (14), we can determine the defectiveness zone and its position on the structure.
For a more detailed study of the structure of the defect, we choose m limit values Lvφ (φ from 1 to m) and introduce additional coefficients k1…kn to the following dependence (14):
a i j φ = 1   i f   k 1 L v φ L i j < L v φ 2   i f   L v φ L i j < k 2 L v φ n 1   i f   k n 1 1 L v φ L i j < k n 1 L v φ n   i f   k n L v φ L i j . .
Here the coefficients ki define zones in the vicinity of excess Lv (ki < 1) and with equality and some given excess Lv (ki ≥ 1). Number m of limit values Lvφ (and therefore the values aijφ) depends on the solution of a given practical problem.
When solving defect zones, the following tasks are solved:
  • finding the distribution of EMW losses over the area of defect zone and estimating the coordinates of the cells with the minimum and maximum values;
  • calculation of the distance between defect zones;
  • calculation of the area of defect zone;
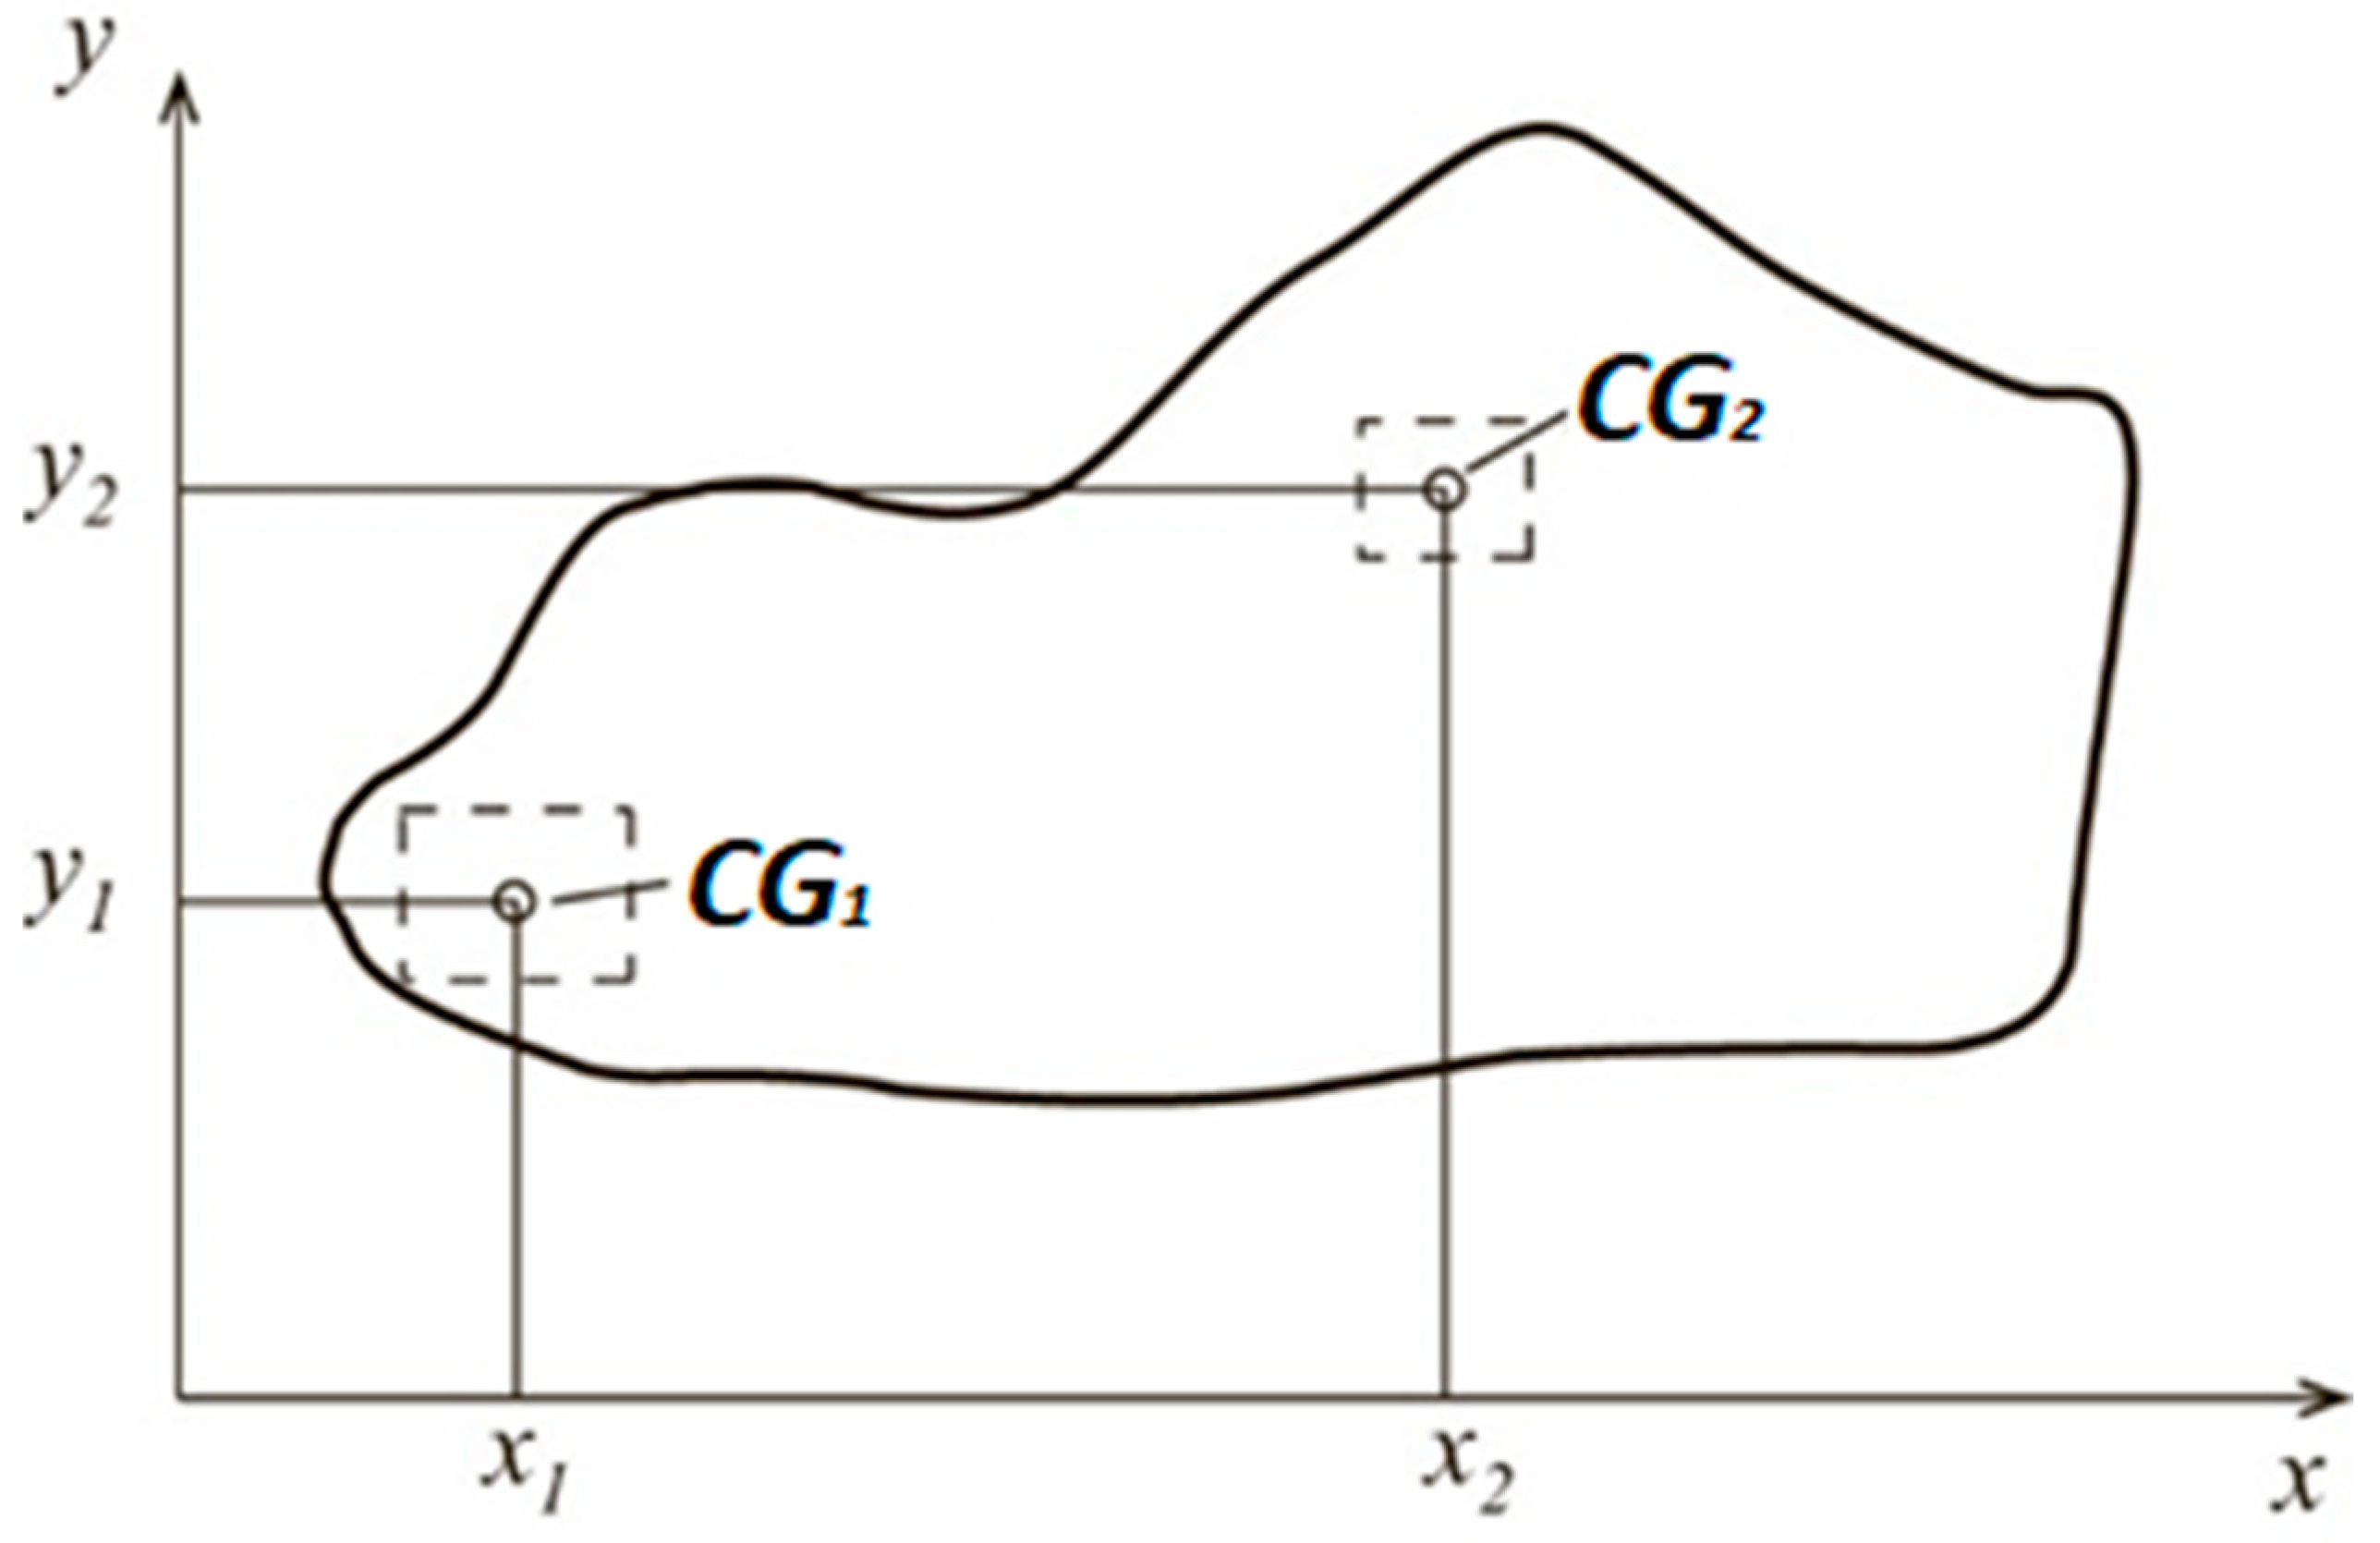
  • determination of the “center of gravity” (CG) of the defect zone.
The geometric scheme for estimating defect zone for Equation (14) is shown in the Figure 6a. A grid of control points is presented, each of which contains the measured value of losses in the fairing enlightenment zone (EMW operating frequency). For this type of fairing, the calculated value of the loss should not exceed 2.0 dB. Points where this value is exceeded are recorded as defective. The figure shows the points with the minimum and maximum loss values for this sample (Lmin, Lmax). On Figure 6b, as an example, color data processing using MatLab is presented. On Figure 6c, the defect zone on a real structure is presented. The dimensions of the controlled area of the sample are 850 × 400 mm, the dot grid spacing is 50 mm. The grid of control points 8 × 17 corresponding to the points of the zone on the fairing are numbered 1–1…8–17 respectively. Since it is not technically possible to control points located at the edges of the sample, the part under study is located with some indents from the edges of the sample. The worst loss values are found in cells 3–5 and 3–6.
The sample thickness is 6 mm. The sample is an element of the radio-transparent fairing wall. The skins are made of fiberglass impregnated with epoxy resin, the inner layer is a honeycomb core, and the honeycomb pitch is 6 mm (Figure 4b).
It is advisable to calculate the area of defect zone SΣ according to the dependence (Figure 6a).
S Σ 1 n S i = 1 n a b .
Here a, b are the width and height of the cell, respectively, and n is the number of cells with excess of Lv (cells defined by parameter 1). Since there are much fewer boundary cells along the contour of the defect zone than inside the zone, this calculation has an acceptable accuracy. This option is advisable to use with a large number of cells in the area of defectiveness.
The second option, when the number of cells included in the defect zone is insignificant, it is divided into several sections (i = 1, 2, …, n) with its width ai and medium size bavri (Figure 7). In this case bavri, we multiply by ai and obtain the area Si. Next, we sum up the areas Si for all sites:
To analyze the position of defect zones, it becomes necessary to know the CG of the defect zone area. To determine the position of CG, the defect zone is divided into several parts (Figure 7), and an arbitrary coordinate system is selected (Figure 8). Then, the coordinates of the common CG are calculated by the following formulas:
X C G = Σ F i y i Σ F i ,   Y C G = Σ F i Y i Σ F i
Specific area of all zones exceeding Lv is found according to the following equation:
S Σ = 1 n S i = 1 m S j .
Here Si, Sj, n, m are, respectively, the area of i—zone and the area of j cell, n is the number of zones number with excess of Lv, and m is the total number of cells in the total area SΣ.
For a cylindrical shell, the coordinates of CG of the defect zone are characterized by the following coordinate system:
x C G = ρ c o s φ C G y C G = ρ c o s φ C G z = z .
Here, ρ and φCG are, respectively, the outer radius of the cylindrical shell and the angle of rotation from the origin of the coordinate system.
Inhomogeneities that arise in the layers of the fairing wall and are local in nature most often have blurred boundaries. As a result of a gradual increase in heterogeneity (for example, excessive accumulation of glue between layers), often—only in its central part—a sharp increase in the amount of losses will be recorded; despite this, the actual spot (area) of the defect can be much larger.

3. Results and Discussion

Evaluation of performance according to the criterion of radio transparency is based on the fulfillment of the requirements not to exceed the permissible value of the loss of EMW Lv with a given confidence level.
The Figure 9 shows a graph of the dependence of the number of detected defects depending on the value of the maximum allowable value of EMW losses Lv calculated according to dependencies (13) and (14).
To level Lv = Lv3, there is an avalanche-like decrease in cells exceeding Lv, then there is a relation between Lv and the number of cells exceeding its value according to the parabolic law.
Therefore, if the value Lv is chosen incorrectly, the interpretation of the flaw detection results will be incorrect (if the value is too small Lv the digital image will “drown in noise” too many false defects will be detected, and, conversely, with an overestimated value Lv, some defects may be missed in the digital image, and the area of the detected defects may be smaller than it actually is).
This display is specific to a specific frequency only. Studies carried out in the field of operating frequencies (Figure 10) show different curves of the relation between Lv and the number of cells with their excess.
If Lv = Lv1, in each cell, there is an excess of the value Li. This means that the intrinsic value of computer losses in the entire range is more than Lv1. If Lv = Lv2, two frequency peaks begin to stand out, in which a sharp increase in the number of cells is recorded, exceeding the value Lv. This suggests that in the range of these peaks, partially dependent defects are found (these can be thickenings, joints of material layers, seams, etc.), as well as zones of local enlightenment. If the operating frequency range of the fairing EMW corresponds to these peaks, we should give them special attention.
If Lv = Lv4 and more peaks disappear and the graph takes the form of a “plateau”, while the number of cells exceeding Lv is not equal to 0, then there are defects on the plane of the sample that affect the number of losses in a wide frequency range. If Lv = Lv8, cells with an excess are not recorded. Based on these data, it can be concluded that there are permanent structural defects on the sample plane; most often, these can be completely or conditionally opaque zones (accumulation of water, resin, foreign inclusions, etc.).
The receptor model with the introduced coefficients k (15) makes it possible to obtain digital images displaying, in addition to the main defect, zones with a critical value of Li. From the point of view of operational control, the detection of such zones makes it possible to predict the development of a defect, as well as to identify zones to which special attention must be paid when deciding on the further operation of the product. Figure 11 shows graphs of the dependence of the number of detected defects on the value of Lv for different values of the coefficient k1. The Lv value is presented on a logarithmic scale.
In Figure 12, there is an example of the dynamics of changes in the defectiveness zone at values Lv1Lv5, determined in accordance with dependence (15). Here, Lv1 has the smallest value and Lv5 has the biggest value. The presented graphical representations of the measured values of EMW energy losses of a certain zone of the object at a frequency f were made using digital methods of information processing. The loss value is given on a logarithmic scale. In the cells marked in blue, the value of the loss is minimal; in yellow, the value of the loss maximum. In the center of the zone, we can see a local increase in the magnitude of losses, indicating the probable presence of any inhomogeneity in a given area.
In addition, when using this receptor model, already at Lv = Lv2, it is possible to distinguish the main defect zone located in the center of the fairing sample under study. At Lv = Lv4, the heterogeneity of the detected defect becomes visible on the digital image.
With an increase in Lv, it is clearly seen in the images that there are zones on the left and right along the edges of the defect in which the loss is less than in its central part. Based on such images, information about the location of the epicenter of the defect and the direction of its propagation (the direction in which the defect is likely to develop (further degradation of the material)) can be concluded.
The use of such a modified receptor model, due to the ability to see the heterogeneity of the defect in the image, makes it possible to achieve the following:
  • evaluate the total area of the defect;
  • detect the defect epicenter;
  • detect the direction of defect propagation;
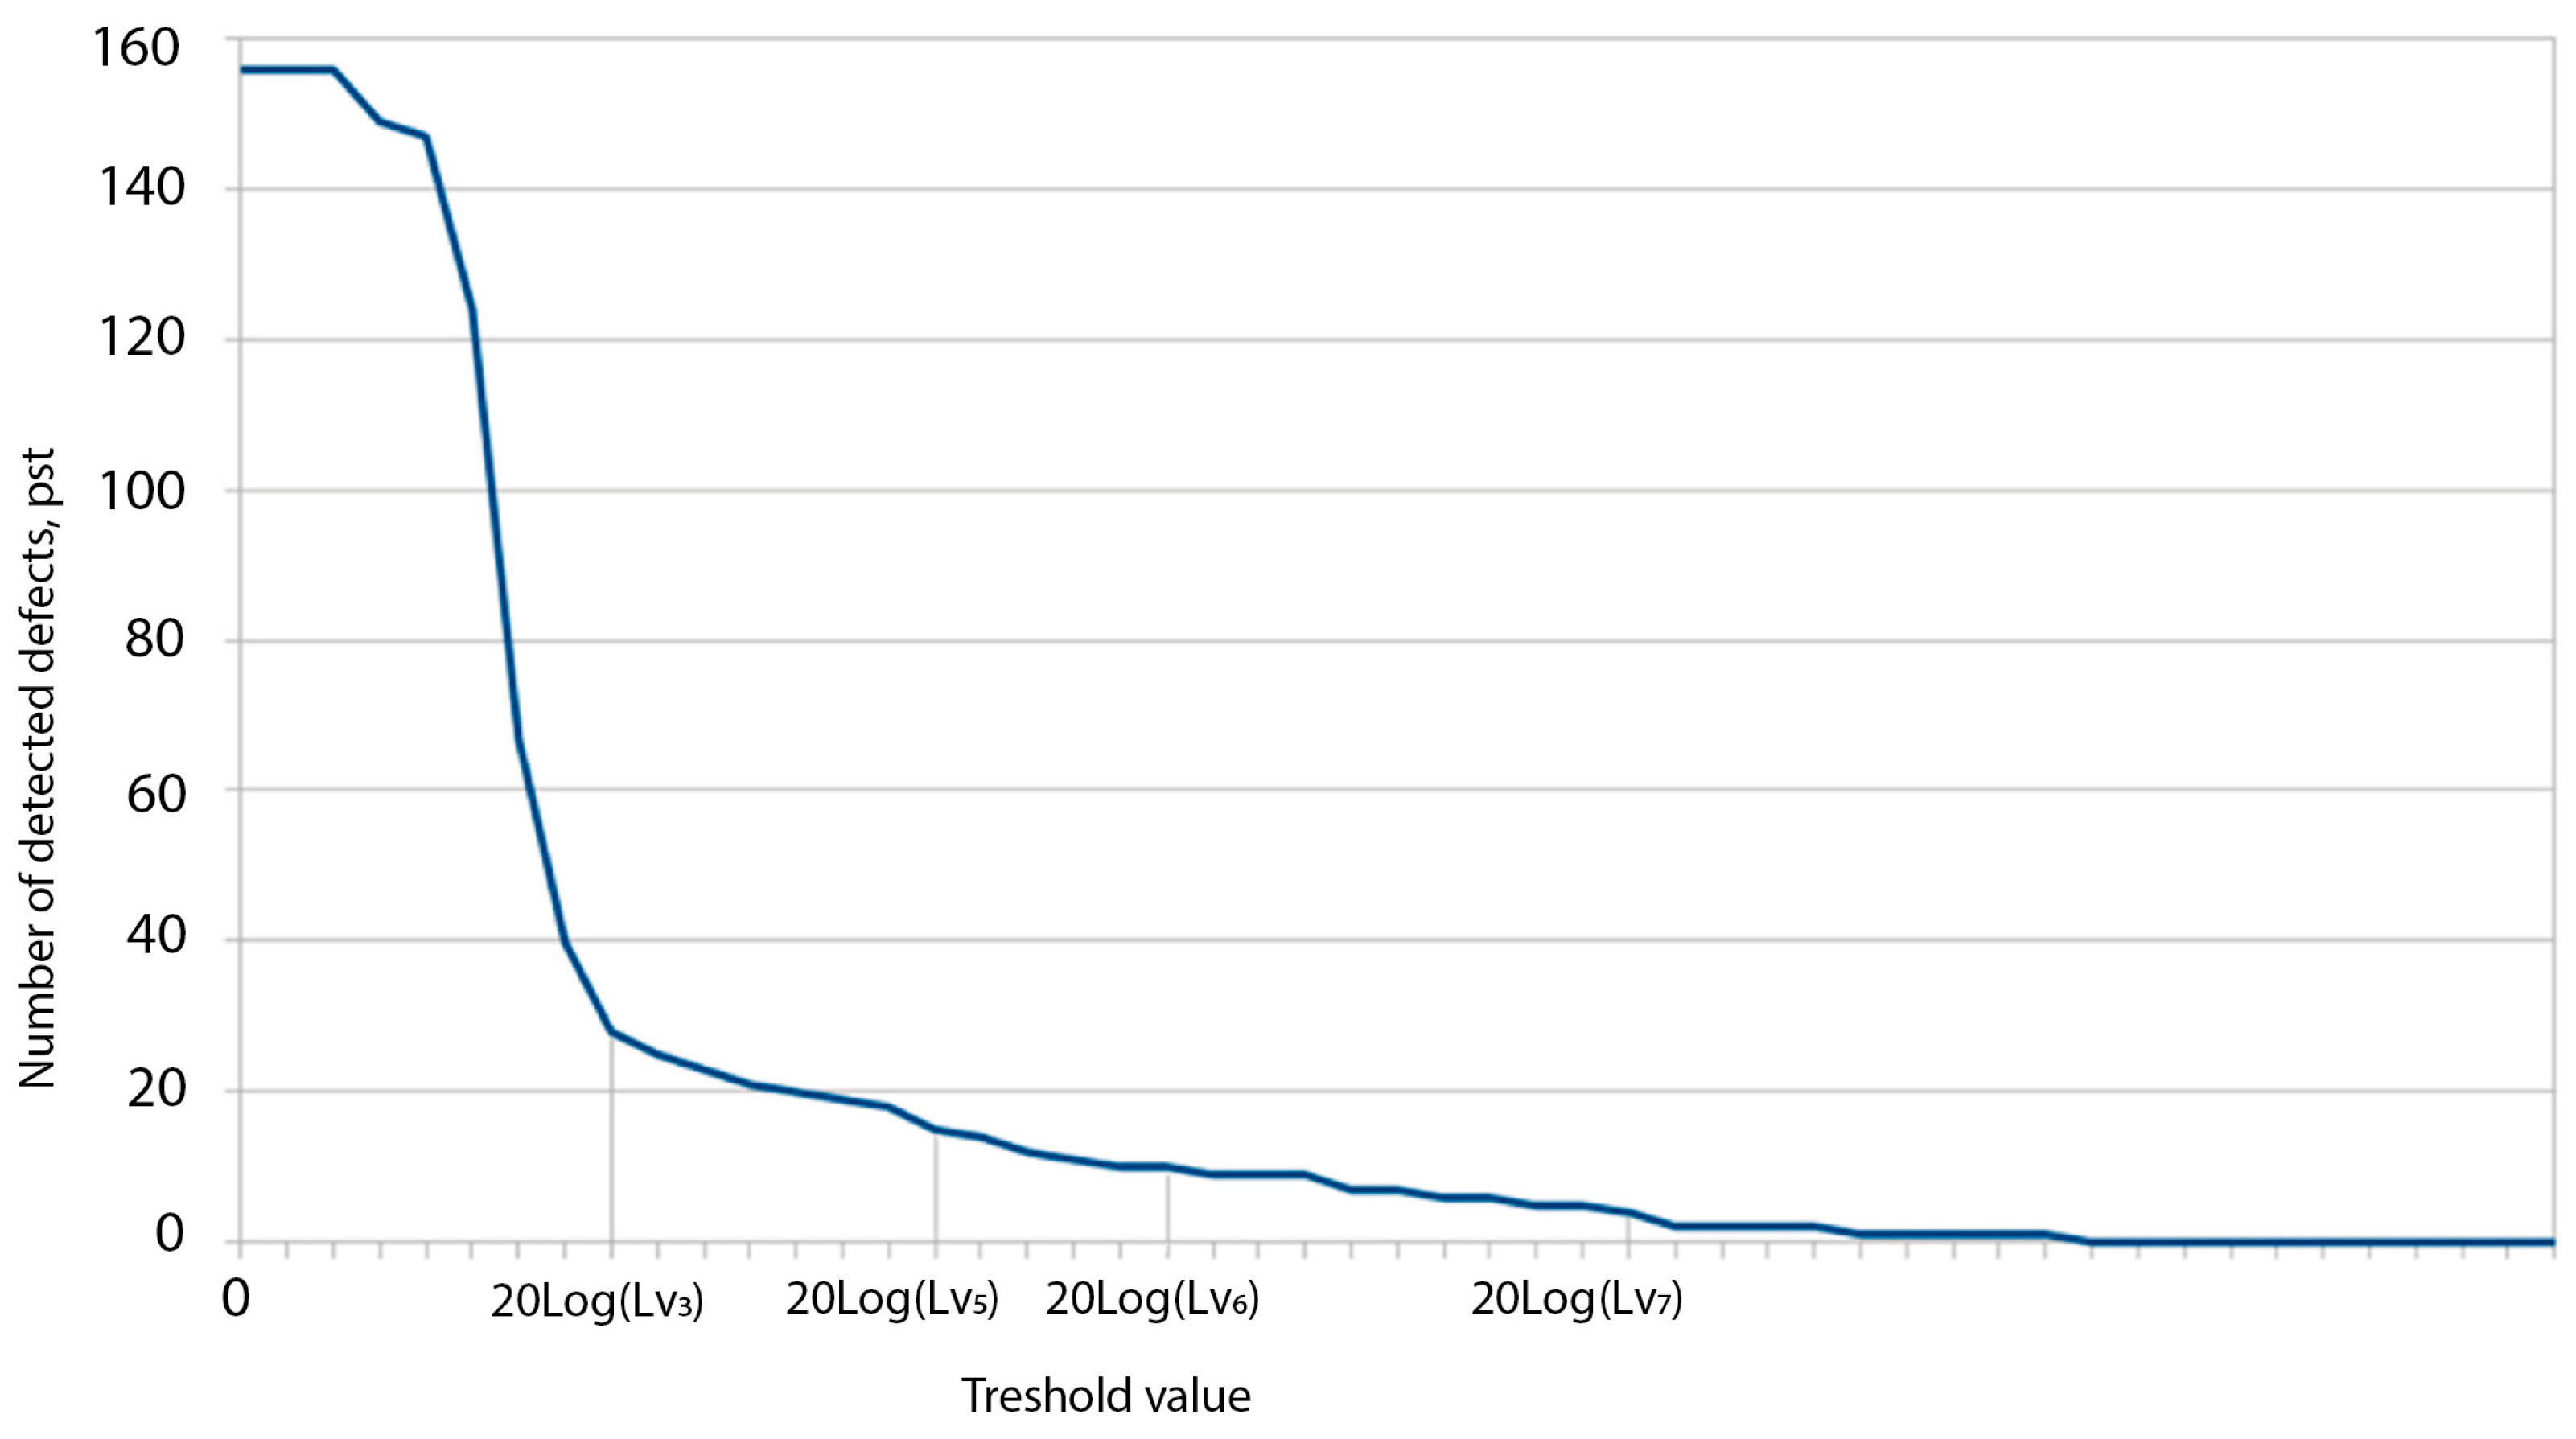
  • detect critical zones (zones with losses close to Lv).
Thus, for this sample, the best choice of Lv value is Lv = Lv4. With this value of Lv, both the core of the defect and the halo around it are clearly visible, which makes it possible to more accurately localize the defect on the surface of the fairing and its propagation direction.
In the course of the study, it was shown that the choice of the permissible value of EMW loss affects the assessment of defectiveness Lv. There is the dependence of the number of detected defectiveness zones on the choice of Lv. In addition, it was shown that the number of detected defects depends on the frequency of the computer, so the tests must be carried out in a wide frequency range, and the defect area is estimated by the total criterion.
It is advisable to extend this method to structures with a different geometric shape and other methods for changing the EMW loss.

4. Conclusions

To analyze the stability of the quality of manufacturing RTS, a flaw detection method based on measuring the magnitude of EMW energy losses is proposed.
The assessment of the quality of RTS is carried out according to the stability of EMW energy loss (mathematical expectation and dispersion dispersion) as between objects; sections of one object are based on the Fisher’s F-test and t-test.
The proposed method for determining the position and type of defects is based on the use of receptor models. The application of this method makes it possible to reveal the dynamics of changes in the shape, defect area, CG of the defect zone, and the distance between them, taking into account the maximum allowable level of EMW loss. The proposed technique has been repeatedly tested during the production of fairings. At least 10 tests were carried out on various fairings made using different technologies, and the results obtained showed good repeatability of defect detection, regardless of the manufacturing technology and electrical properties of the fairings. It should be noted that it is more correct to detect defects in the operating frequency range of the fairing (in the antireflection zone). The results of inspection of the radio-transparent fairing wall demonstrated above clearly show the possibility of the method for detecting defective zones, namely, the defect zone was detected, its boundaries were outlined, and its area was estimated. Subsequent examination of the tested fairing wall revealed the presence of resin leakage into the structure’s honeycomb cells. In the course of the work, it was found that different types of defects have a different effect on the distortion of the energy loss, therefore, it is promising to develop a technique that allows not only to localize the defect, but also to assess its nature (stratification, flow, thickening, etc.).
It has been experimentally shown that the shape of the defective zone depends on EMW frequency. For a complete analysis of defectiveness zones, it is necessary to sum up the defectiveness zones identified during their assessment for the required computer frequency zones.
Modeling the stress state of a honeycomb sandwich for various types of loading makes it possible to evaluate the stress state at any point of the object. In accordance with the developed method for determining the parameters of defect zones, it allows adjusting the stress state assessment depending on the type of defect and their location on the product.

Author Contributions

Conceptualization, V.V.B. and A.A.L.; methodology, A.A.L. and L.N.R.; software, A.A.L.; validation, V.V.B., A.A.L. and L.N.R.; formal analysis, A.A.L.; investigation, V.V.B.; resources, L.N.R.; data curation, L.N.R.; writing—original draft preparation, A.A.L.; writing—review and editing, V.V.B.; visualization, L.N.R.; supervision, V.V.B.; project administration, V.V.B.; funding acquisition, L.N.R. All authors have read and agreed to the published version of the manuscript.

Funding

This research received no external funding.

Data Availability Statement

Not applicable.

Conflicts of Interest

The authors declare no conflict of interest.

Abbreviations

ADantenna devices;
RSradar stations;
EMWelectromagnetic wave;
RASradome antenna system;
RTSradio-transparent shelters;
Ddirectivity of the antenna-fairing;
F-testFisher’s test;
CGcenter of gravity.

References

  1. Binzer, T.; Waldschmidt, C.; Hellinger, R.; Hansen, T. Radome for a Radar Sensor in a Motor Vehicle and Corresponding Radar Sensor, WO2012013398A1. Available online: https://patentimages.storage.googleapis.com/61/86/3a/0ebe0c954038f2/WO2012013398A1.pdf (accessed on 30 December 2022).
  2. Chen, H.; Hou, X.; Deng, L. Design of frequency-selective surfaces radome for a planar slotted waveguide antenna. IEEE Antenn. Wir. Prop. Lett. 2009, 8, 1231–1233. [Google Scholar] [CrossRef]
  3. Gavrilov, D.; Babayan, G.; Losev, V. Thermal imaging control of radio-transparent shelters transmitting headlamps. In Prospects for the Development of Early Warning Radars and Integrated Systems and Complexes for Information Support of Aerospace Defense (RTI Systems VKO-2014); Bauman, N.E., Ed.; Moscow State Technical University: Moscow, Russia, 2014; pp. 165–173. [Google Scholar]
  4. Bodryshev, V.V.; Larin, A.A.; Rabinsky, L.N. Flaw detection method for radomes in weakly anechoic conditions. TEM J. 2020, 9, 169–176. [Google Scholar]
  5. Samburov, N.V. Multi-Frequency Method for Measuring Losses in Fairings. Bull. South Ural State Univ. Ser. Comp. Technol. Control Rad. El. 2015, 15, 83–94. [Google Scholar]
  6. Shalgunov, S.I.; Sokolov, V.I.; Morozova, I.V.; Prokhorova, Y.S. Features of the design and development of radio-transparent fairings and shelters operating in the centimeter and millimeter ranges of radio waves. Antennas 2015, 3, 63–68. [Google Scholar]
  7. Zhidkova, O.G.; Borodavin, A.V.; Mityushkina, D.V.; Bersekova, N.V. Design of radio transparent structures from composite materials. Struct. Comp. Mat. 2020, 1, 6–12. [Google Scholar]
  8. Bodryshev, V.V.; Larin, A.A. Analysis of the Influence of the Form of Large-Scale Fairings on the Accuracy of Measuring the Energy Loss Value. News Tula State Univ. Technol. Sci. 2022, 2, 348–353. [Google Scholar]
  9. Larin, A.A. Method of Evaluation of the Errors of Measuring the Value of Energy Losses in Spherical or Spherocylindrical Fairings. In II International Conference "Composite materials and structures". Abstracts; Moscow Aviation Institute: Moscow, Russia, 2021. [Google Scholar]
  10. Aksenov, A.V.; Larin, A.A.; Samburov, N.V. An anechoic chamber built into industrial premises. Bull. South Ural State Univ. Ser. Comp. Technol. Man. Radio Electr. 2021, 21, 66–74. [Google Scholar]
  11. Baskov, K.M.; Politiko, A.A.; Semenenko, V.N.; Chistyaev, V.A.; Akimov, D.I.; Krasnolobov, I.I. Radio wave control of the parameters of samples of multilayer walls of radio-transparent shelters. J. Rad. Electr. 2019, 11, 6. [Google Scholar]
  12. Endogur, A.I. Design of Aircraft. Airframe Assembly Design; MAI-Print: Moscow, Russia, 2012. [Google Scholar]
  13. Eliseeva, I.I.; Yuzbashev, M.M. General Theory of Statistics; Finance and Statistics: Moscow, Russia, 2008. [Google Scholar]
  14. Voskresensky, D.I.; Granovskaya, R.A.; Gostyukhin, V.L.; Filippov, V.S. Antennas and Microwave Devices. Calculation and Design of Antenna Arrays and Their Radiating Elements: Textbook for Universities; Soviet Radio: Moscow, Russia, 1972. [Google Scholar]
  15. Gibson, L.J.; Ashby, M.F. Cellular Solid Structure and Properties; Cambridge University Press: Cambridge, UK, 1999. [Google Scholar]
  16. Gurtovnik, I.G.; Sokolov, V.I.; Trofimov, N.N.; Shalgunov, S.I. Radiotransparent Products from Fiberglass; Mir: Moscow, Russia, 2002. [Google Scholar]
  17. Bitkin, V.E.; Zhilkova, O.G.; Denisov, A.V.; Borodavin, A.V.; Matyushit, D.V.; Rodionov, A.V.; Nonin, A.S. Mathematical modeling of the stress-strain state of dimensionally stable composite elements of optical telescope structures using the finite element method. Bull. State Samara Technol. Univ. Ser. Phys. Math. Sci. 2016, 20, 707–729. [Google Scholar]
  18. Yang, C.C.; Nakae, H. Foaming characteristics control during production of aluminum alloy foam. J. Alloys Compd. 2000, 313, 188–191. [Google Scholar] [CrossRef]
Figure 1. Stages of performance study.
Inventions 08 00042 g001
Figure 2. Example of the considered shape of the fairing, with schematically plotted points for measuring the magnitude of EMW energy losses.
Inventions 08 00042 g002
Figure 3. Scheme of the workplace for measuring the magnitude of energy losses.
Inventions 08 00042 g003
Figure 4. Samples of three-layer glued radio-transparent material: (a) Sample № 1—with foam plastic filling; (b) Sample № 2—with a filling layer of honeycomb material; (c) Sample № 3—with a filling layer of honeycomb structure material, the cells of which are filled with glass spheres.
Inventions 08 00042 g004
Figure 5. Graphical example of the design stress in a honeycomb structure during bending.
Inventions 08 00042 g005
Figure 6. Image options for the detected defect: (a) numerical display of the measured values of the loss (dB) at the control points; (b) digital image obtained by color processing of the measurement results; (c) defect zone on a real structure.
Inventions 08 00042 g006
Figure 7. Calculation of defect zone area of a complex shape.
Inventions 08 00042 g007
Figure 8. Scheme for determining CG of the defect zone.
Inventions 08 00042 g008
Figure 9. Dynamics of change in the number of detected defects depending on the value Lv.
Inventions 08 00042 g009
Figure 10. Number of cells with excess Lv at different EMW frequencies depending on the value Lv.
Inventions 08 00042 g010
Figure 11. Dependence of the number of detected defects on the value of Lv for different values of the coefficient k1.
Inventions 08 00042 g011
Figure 12. Schematic representation of defectiveness zones at various values Lv: (a) Lv1; (b) Lv2; (c) Lv3; (d) Lv4; (e) Lv5.
Inventions 08 00042 g012
Table 1. Questions to evaluate the stability of the manufacturing technology of the product.
Stages of Assessment of the Technological ComponentIdentity Fabrication DesignTechnological Identity of Construction SectionsDetermination of Defect Zones
Assessment method1. One-way analysis of variance using F-test
2. Testing the hypothesis about the average values (t-test)
1. One-way analysis of variance using F-test
2. Testing the hypothesis about the average values (t-test)
Application of the method of receptor models
Tasks to be solvedThe problem of checking for the identity of products is consideredThe uniformity of the quality of manufacturing of different parts of the product is analyzed.
The zones with the largest spread in parameter P are determined
The question of the position of the defect on the product, its area and the center of “severity” is considered, the number of defects and the distance between them are estimated
Disclaimer/Publisher’s Note: The statements, opinions and data contained in all publications are solely those of the individual author(s) and contributor(s) and not of MDPI and/or the editor(s). MDPI and/or the editor(s) disclaim responsibility for any injury to people or property resulting from any ideas, methods, instructions or products referred to in the content.

