Article

The Influence of Different Type Materials of Grit Blasting on the Corrosion Resistance of S235JR Carbon Steel

by
Nicoleta Bogatu
1,
Alina Crina Muresan
1,
Laurentiu Mardare
1,2,
Viorica Ghisman
1,
Anca Ravoiu
1,3,*,
Floricel Maricel Dima
4,5,* and
Daniela Laura Buruiana
1
1
Interdisciplinary Research Centre in the Field of Eco-Nano Technology and Advance Materials CC-ITI, Faculty of Engineering, “Dunarea de Jos” University of Galati, 47 Domneasca Street, RO-800008 Galati, Romania
2
Amrared Research Consulting, 54 Brailei Street, RO-800201 Galati, Romania
3
Faculty of Medicine and Pharmacy, “Dunarea de Jos” University of Galati, 35 Al. I. Cuza Street, RO-800010 Galati, Romania
4
Institute for Research and Development in Aquatic Ecology, Fishing and Aquaculture, 54 Portului Street, RO-800211 Galati, Romania
5
Faculty of Engineering and Agronomy from Braila, 29 Calea Calarasilor Street, RO-810017 Braila, Romania
*
Authors to whom correspondence should be addressed.
Inventions 2023, 8(1), 39; https://doi.org/10.3390/inventions8010039
Submission received: 31 December 2022 / Revised: 17 January 2023 / Accepted: 30 January 2023 / Published: 2 February 2023

Abstract

:
The aim of this paper is to evaluate the corrosion rate expressed in material loss per unit of time and the surface properties of carbon steel type S235JR blasted with different types of materials (quartz, alumina, and red garnet with a particle size between 60 and 80 mesh (0.25–0.60 mm)). The estimation of corrosion rate was determined by electrochemical methods, such as open circuit potential (OCP), polarization resistance (Rp), corrosion rate (Vcorr), and gravimetric method by immersing the samples in 3.5% NaCl solution for a period of 336 h. All surfaces were characterized before and after corrosion tests using ex-situ characterizations, such as optical microscopy and roughness analysis. The results indicate that S235JR non-sandblasted exhibited higher polarization resistance, the lowest corrosion rate, and the lowest roughness values. While for the S235JR sandblasted groups, reduced corrosion resistance and increasing roughness values were noted. From the sandblasted groups, the lowest corrosion resistance and the highest value of roughness are attributed to the S235JR surface sandblasted with quartz. The S235JR surface sandblasted with quartz shows a decrease in corrosion resistance approximately two times lower than the non-sandblasted surface and an increasing of roughness approximately six times greater than the non-sandblasted surface.

1. Introduction

Metals and alloys are widely used as building materials and not only [1]. Steel is a common material widely used for the construction of naval, offshore, mechanical, and civil engineering structures [2]. Carbon steel S235JR is a material mainly intended for the construction of industrial and residential facilities, parts of power transmission towers, equipment elements, offshore structures, car bridges, oil, and gas platforms, as well as other structures [2]. It presents advantages, such as good mechanical resistance and extremely low cost, compared to other types of materials [3,4]. The main disadvantage of these types of materials is their tendency to corrode, which limits their applications [5,6].
Corrosion is a phenomenon that affects the aesthetics of these structures and, more than that, reduces the resistance of the structures over time [7,8].
The surface treatment of metallic materials is one of the most important factors governing their resistance. There are many methods of pretreatment of the surface of the materials. The most common treatments are mechanical, chemical, and electrochemical methods [9,10]. Mechanical methods consist of roughening processes, such as sandblasting, polishing, or abrasion [11]. Sandblasting is a mechanical surface treatment that consists of forcefully propelling a stream of non-metallic or metallic particles onto the surface to be treated, to remove contaminated layers, modify surface roughness, promote mechanical anchoring, and increase free energy of the surface by increasing the thermodynamic interactions at the interface of the bonded materials [12].
Sandblasting could also affect the chemical composition, crystal structure, micro-stiffness thermal expansion coefficient, resistance, and microstructure on the surface of the material. Sandblasting could also be used as a mechanical surface treatment for various materials, such as titanium alloys, steel, and aluminum, etc. The deformation caused by this type of surface treatment is inhomogeneous [13,14].
As a surface treatment method, sandblasting is commonly used for surface modification, surface strength enhancement, surface cleaning, and rust removal. Therefore, a smoother surface can be obtained by sandblasting in general [15,16].
During the sandblasting process, the surface of metal materials is repeatedly blasted by sand particles or other hard particles at high speed, which leads to the removal of the oxide layer from the surface, at the same time, generating the effect of severe local plastic deformation [12,17].
During sandblasting, the shocks produced between the sand particles and the surface of the steel structure cause serious damage to the surface. This is manifested by the erosion of craters of different shapes and depths present on the surface of the metal material, the thickness of the wall is gradually reduced, and the rupture occurs when the stresses in the crater reach a limiting threshold [12,17]. The sand erosion process improves fatigue strength under tension. This improvement comes from the introduction of compressive residual stresses to the hardened surface layers [18,19].
The aim of this paper is to determine the corrosion resistance by electrochemical and gravimetric methods of carbon steel S235JR sandblasted with different materials (quartz, alumina, and red garnet) over a period of 14 days by immersing the materials in 3.5% NaCl solution. The influence of the roughness, the pH of the solution, and the evolution of the optical micrographs of the surface before and after the corrosion process are also discussed. The novelty of the study consists in adding to the specialized literature a study that has not been reported before. Respectively, the influence of different types of sandblasting materials on the corrosion resistance of S235JR steel immersed for a period of 14 days in the 3.5% NaCl solution simulating the seawater environment will be investigated.
In the specialized literature, there are very few studies that treat the effect of sandblasting on the corrosion resistance of different types of steels, and the results are contradictory [15,20,21,22,23,24,25]. Some studies show that sandblasting decreases corrosion resistance [21,25], while others claim that sandblasting increases corrosion resistance [15,20,22,23,24].
The importance of the study consists in the fact that sandblasting is one of the most effective methods of cleaning or finishing the surfaces of any type of solid material with the help of sandblasting grits. The metal surfaces that have been cleaned and from which the oxides have been removed can be covered with anti-corrosive protective films resistant to the action of aggressive environmental factors [25].
Steels sandblasted and covered with anti-corrosive films can be part of maritime structures, civil and industrial architecture structures and elements [2].
Practically, the effective life of an anti-corrosion film depends a lot on the way the steel surface was prepared before painting. The influence of sandblasting on the corrosion resistance of steel before the application of anti-corrosion protection is an important factor.
Because sandblasting also determines the appearance of deep grooves that can capture the corrosion products formed in the upper part of the surfaces, favoring the appearance of micro reactions, generating pitting corrosion, thus affecting the life of the anti-corrosion protections [25].
At the same time, the corrosion under the coating often progresses locally, leading to the collapse of the structures in some cases or to the breaking of the steel elements [4].
Therefore, the surface treatment method before applying anticorrosive coatings is crucial for protecting steel structures against corrosion [4]. In this work, quartz was used as a material for sandblasting because it is a material that consists mainly of quartz (which is a durable crystal) that allows for efficient sandblasting, it is also cheap and very easy to find compared to other types of materials. The main disadvantage of this sandblasting material is the fact that once inhaled, it is harmful to the human body [26].
The red garnet grit used in the sandblasting process was used because it is an ecological material that has the advantage of being able to be recycled several times [27].
Alumina (Al2O3) was selected due to the numerous properties that recommend it for use in structural and tribological applications, being a combination of high hardness, heat resistance, chemical inertness, and commercial availability [28].

2. Materials and Methods

In the present experimental study, S235JR steel (purchased from Mairon Galati, Romania) was used, whose chemical composition is indicated in Table 1.
The samples used in this study were cut from a steel plate with dimensions of 500 × 500 × 2 mm and brought to the size of 23 × 23 × 2 mm.
Prior to the gravimetric method and electrochemical measurements, the S235JR non-sandblasted were treated with mechanical grinding with 1200 grit SiC emery sandpaper in order to remove the layer of native oxide formed instantaneously on the surface of S235JR steel in contact with the environment. After cutting the samples to the desired dimensions, they were sandblasted with three different types of sandblasting materials that had different chemical compositions. However, with the same grain of the sandblasting grits for quartz, red garnet, and the alumina (ABRAZIV TRADE SRL, Mureș, Romania) used, respectively, 30/60 Mesh [0.25–0.60 mm] and their technical data are listed in Table 2.
The mechanical sandblasting process was done with the help of the Seltech brand-sandblasting equipment, which has a capacity of 80 L, an air flow of 600 L, and a working pressure of 6 bar. The size of the ceramic nozzle was 3.5 mm.
The samples were sandblasted at a 45° angle. The schematic drawing of the blasting process of the S235JR steel samples is illustrated in Figure 1. The sandblasting was done according to the ISO 8501 standard, which is the international standard for dry abrasive blasting, at the Sa (degree of cleaning) 2 ½ blasting level [29].
After sandblasting, the samples were blown with air to remove the excess dust formed after the sandblasting process.
For the electrochemical tests, the S235JR non-sandblasted and sandblasted S235JR carbon steel samples were bonded to a copper wire. After that, they were insulated with epoxy resin to obtain an active surface area of 5.29 ± 0.3 cm2. The electrochemical equipment PGP 201 connected to a PC was used for electrochemical investigations, on which the VoltaMaster version 5.10 software runs.
The electrochemical cell used to evaluate the corrosion behavior of the sandblasted and untreated S235JR carbon steel is a classic cell made of glass with a maximum volume of 250 mL composed of three electrodes where (1) the working electrode (the material to be studied in our case, the steel S235JR sandblasted and non-sandblasted), (2) the reference electrode (Ag/AgCl inside which is saturated KCl solution, which has a potential of +199 mV vs. SHE (standard hydrogen electrode) and (3) an auxiliary electrode made of Pt.
Before and after each experiment, both the analyzed sample and the counter electrode were washed with distilled water, and the volume of electrolyte (3.5% NaCl solution) used for each experiment was kept constant at 150 mL. The 3.5% NaCl solution was prepared with distilled water by dissolving the NaCl p.a reagent (purchased from Sigma-Aldrich).
The physical-chemical parameters of the 3.5% NaCl solution before and after the corrosion process were measured using a Toledo S20k pH meter, and the resulting values are presented in Table 3.
The tests were performed at room temperature, respectively 22 ± 1 °C. All studied samples were repeated three times to verify the reproducibility of the experimental data. After immersing the sample in the 3.5% NaCl solution, sequences of electrochemical measurements of OCP (open circuit potential or free potential), Rp, and Vcorr (polarization resistance and corrosion rate) were performed as follows.
(a)
At T1 = 0 (immersion):
-
OCP1 with a duration of 60 min, meas period 0.6 s.
-
Rp1-Vcorr1, determine 30 points, scan rate = 1 mV/s, over voltage = 40 mV, OCP duration = 1 min
(b)
At T2 = (after 336 h):
-
OCP2 with a duration of 60 min, meas period 0.6 s.
-
Rp2-Vcorr2, determine 30 points, scan rate = 1 mV/s, over voltage = 40 mV, OCP duration = 1 min
Each measurement sequence (Rp-Vcorr) contains 30 value points calculated by using the Stern–Geary equation (Equations (1) and (2)).
i c o r = B R p
B = b a | b c | 2.303 ( b a + | b c | )
where icor = corrosion current density, B = the specific constant, Rp = polarization resistance, ba = are the Tafel slopes for anodic, and bc = Tafel slopes for cathodic reactions.
It should be mentioned that the samples were not taken out of the solution during the experiment until after the passage of 336 h. The obtained results were interpreted with the help of the Origin 2022 program.
In order to determine by the gravimetric method, the loss of material caused by the corrosion process, the sandblasted and untreated S235JR steel samples were weighed before and after immersing the samples for 336 h in 3.5% NaCl. Weighing the samples before and after the corrosion process was done using a Kern EWJ 300-3H analytical balance, which has a measurement accuracy of ±0.1 g. The samples were immersed in a 3.5% NaCl solution in hermetically sealed sterile vials that had a solution volume of 40 mL. The tests were done at room temperature 22 ± 1 °C and repeated three times. The images of the immersed samples before and after 336 h from immersion in 3.5% NaCl are presented in Figure 2.
After weighing, weight loss was evaluated using ASTM G1-90 (1999) with Equations (3) and (4) below, respectively [30,31]:
Δ W = W 1 W 2
Δ w = Δ W S · t
where ΔW is weight loss in g, W1 is the initial weight of the sample before immersion, W2 is the final weight of the sample after immersion, Δw is the gravimetric index of the sample in g/m2 h, S is the surface area of the sample in m2 and t—is exposure time in hours.
The corrosion rate in mm year−1 was evaluated from weight loss data using the relation Equation (5):
C R   ( m m   y e a r 1 ) = Δ W · K ρ · A · t
where ΔW is weight loss in grams, ρ is metal density in g cm−3, A is the area of the sample in cm2, t—is exposure time in hours, and K is a constant depending on the unit of measurement of the corrosion speed according to ASTM G1-90 (1999) (=87.600).
To highlight the variations suffered by the studied samples before and after the corrosion process, a Kern OBE114 metallurgical microscope was used.
The topographical characterization in terms of obtaining 2D roughness profiles was measured using a Mitutoyo Surftest SJ-210 Series roughness meter by moving the feeler needle on the surface of the studied samples over a distance of 4 mm and with a speed of 0.20 μm/s. A number of three samples from each set were analyzed, on which three measurements were performed in different areas on each sample. After which the average roughness parameters Ra (arithmetic roughness average), Rq (average maximum peak to valley distance for five sampling lengths within the measurement length), and Rz (the difference between the deepest valley and the tallest peak in the surface) [32] were calculated.

3. Results and Discussion

3.1. Electrochemical Measurements and Gravimetric Method Results Used to Determine the Corrosion of Tested Samples

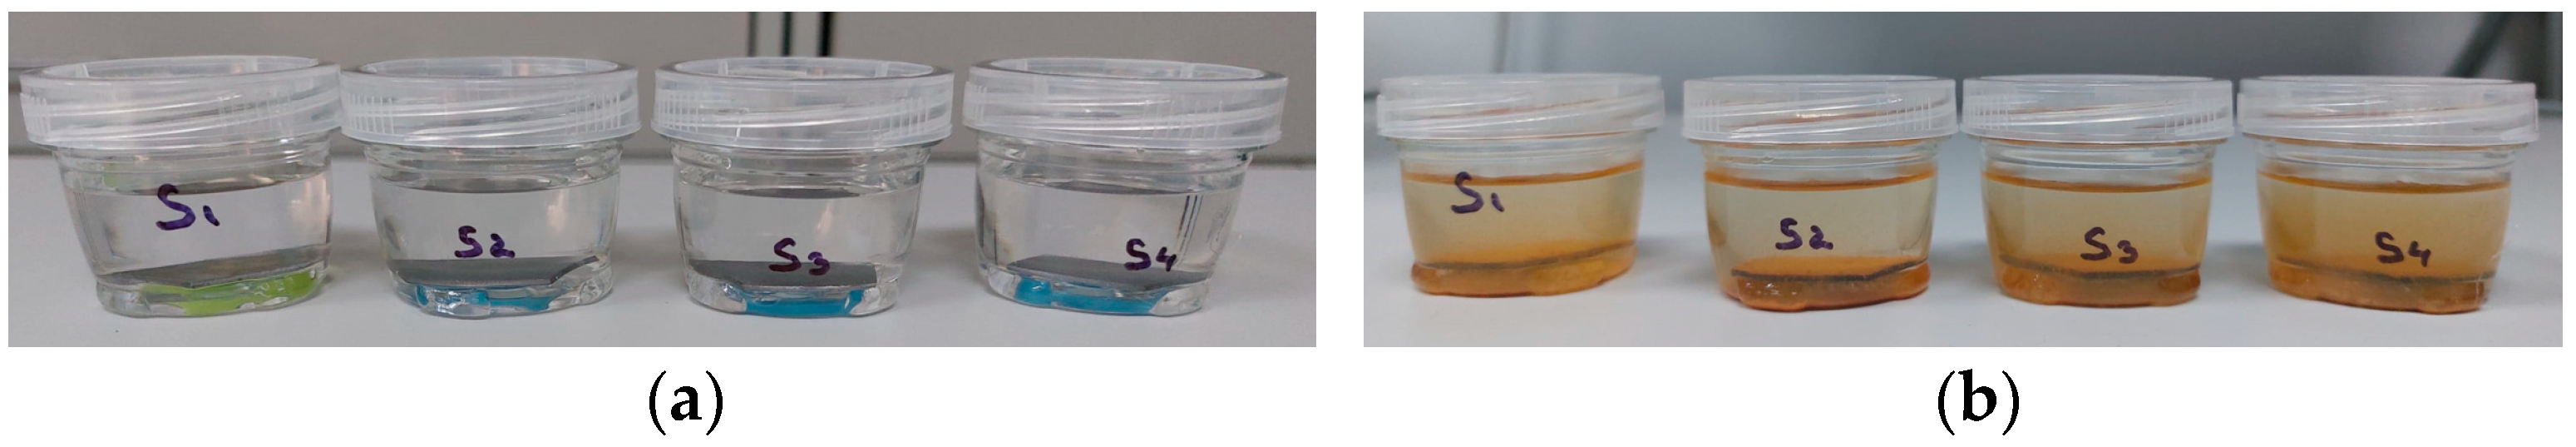
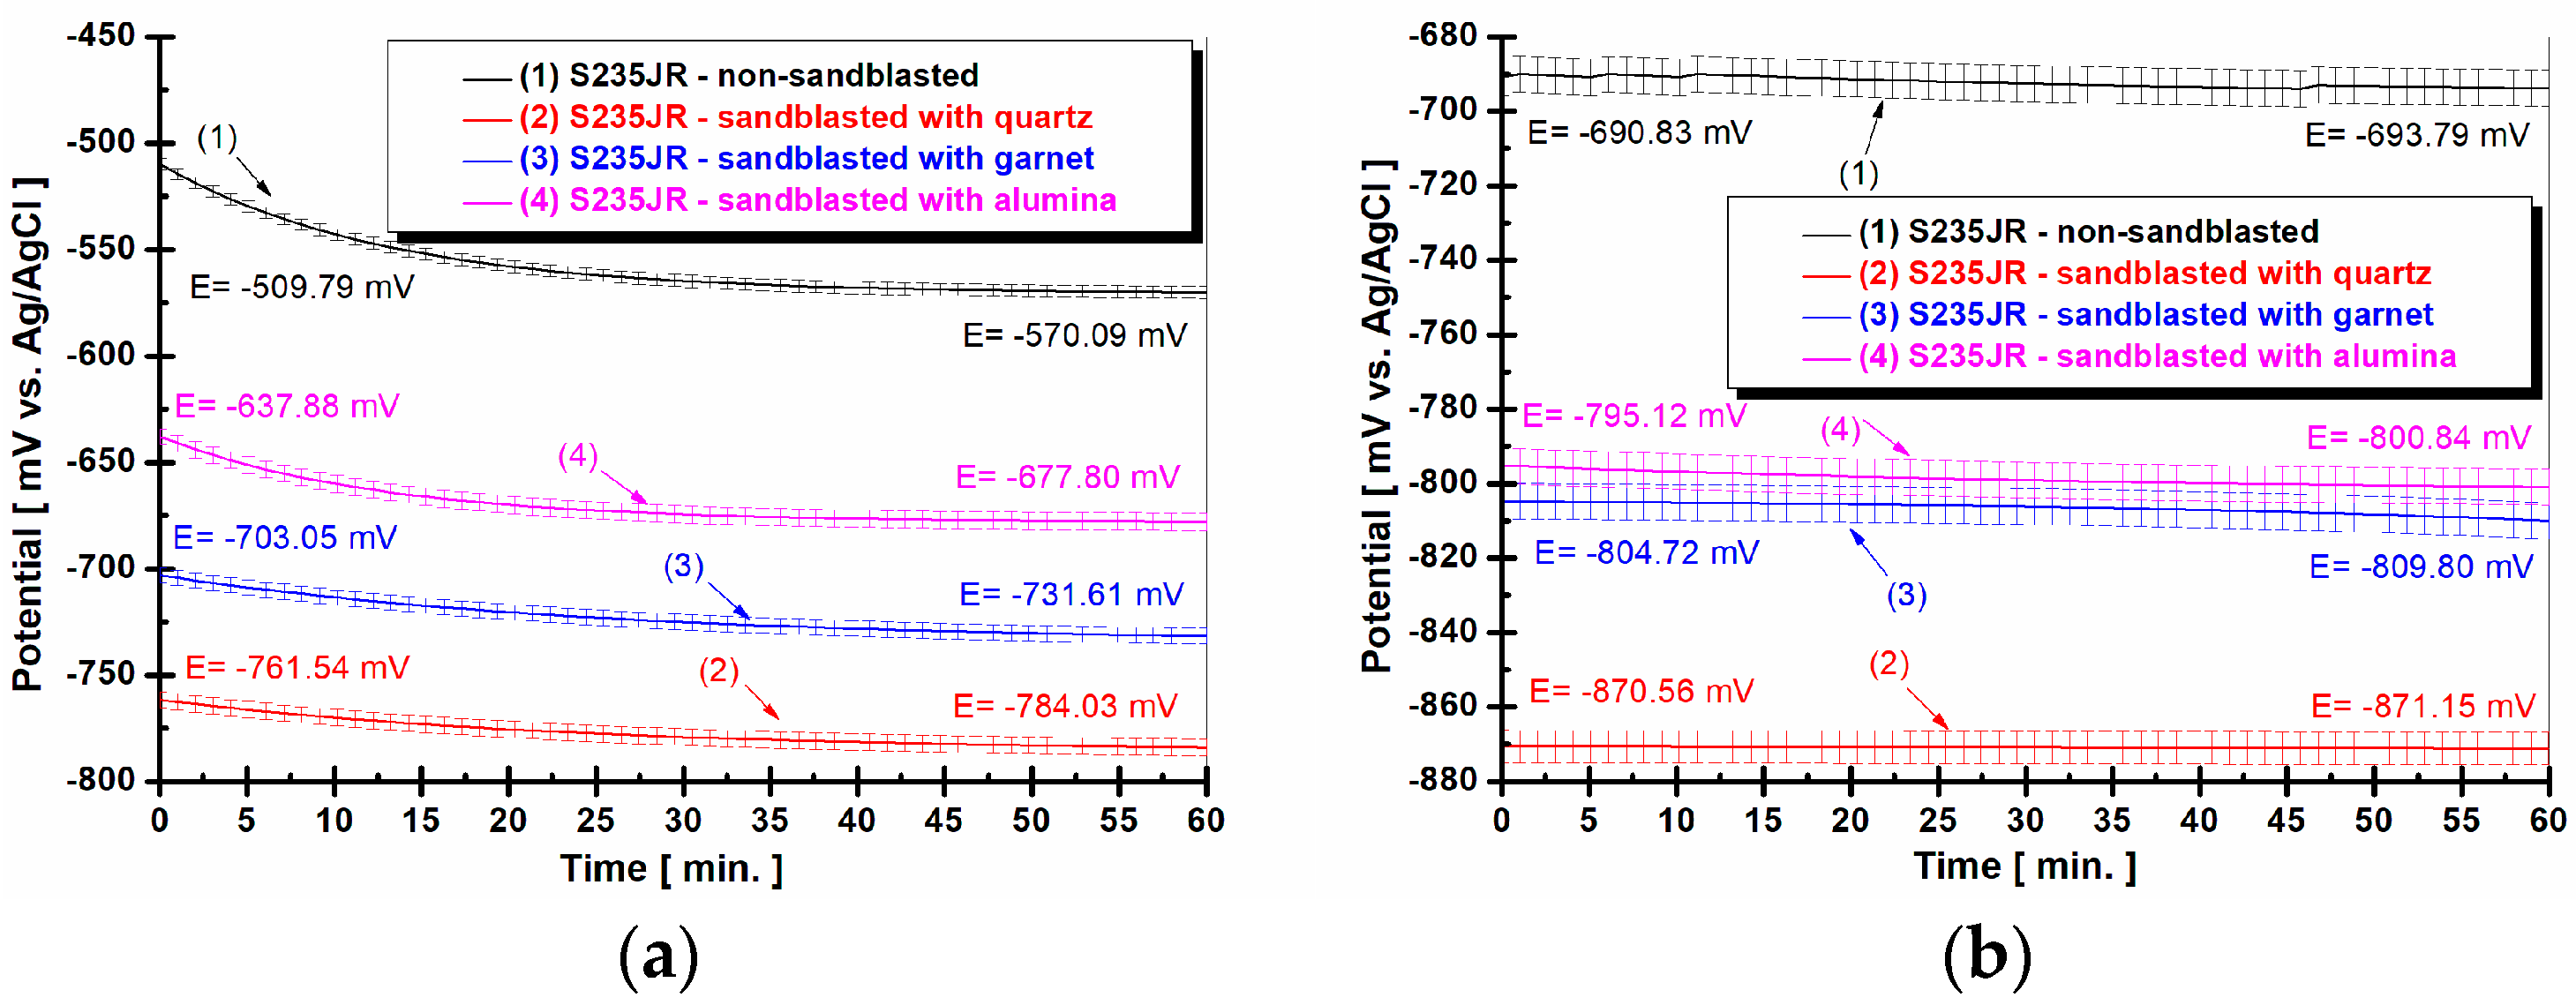
3.1.1. Open Circuit Potential

The open circuit potential (OCP) method is the first method applied in a protocol for determining the corrosion rate. It should be mentioned that this method is not a quantitative method for determining corrosion but rather a qualitative method that indicates the oxidation tendency of a surface/material studied in an electrochemical environment [31].
Figure 3a,b shows the evolution of the free potential of surfaces studied at (a) (T1 = immersion time) and (b) after 336 h from immersion (T2).
From Figure 3, it can be observed that the values of the free potential upon immersion of all studied surfaces have a tendency to move towards more negative values, being more pronounced in the case of sandblasted surfaces compared to the untreated surface.
The movement of the free potential towards more negative values indicates the inability of the material to form a protective oxide film on its surface, while the stationary state indicates that the surface has reached a state of equilibrium (it neither dissolves nor forms the oxide layer on the surface of the samples) [25]. If for S235JR—non-sandblasted (curve 1), the value of the free potential at immersion (Figure 3a) is E = −509.79 ± 24 mV vs. Ag/AgCl at the end of the first measurement period reaches E = −570.09 ± 32 mV vs. Ag/AgCl, the potential difference between the two values being 60.3 mV more negative than the free potential value from immersion.
For the same surface studied, it can be observed that after 336 h from immersion, the value of the free potential decreases compared to the first measurement period (during immersion), however, stabilizing around the value of −693 mV.
For S235JR—sandblasted with quartz (curve 2) it can be observed that at immersion (Figure 3a), it has a value of E = −761.54 ± 17 mV vs. Ag/AgCl reaching the end of the measurement at the value of E = −784.03 ± 31 mV vs. Ag/AgCl, ΔE in this case, being 22.49 mV lower than the value from immersion. Moreover, for the same surface studied (Figure 3b), a decrease in the values of the free potential can be observed compared to the first measurement period. The same tendency of the free potential moving towards more negative values with increasing immersion time is also observed for S235JR—sandblasted with garnet (curve 3) and S235JR—sandblasted with alumina (curve 4).
Comparing all the surfaces studied, it can be seen that the free potential values are more negative for S235JR—sandblasted with quartz, S235JR—sandblasted with garnet, and S235JR—sandblasted with alumina as compared to S235JR—non-sandblasted at both period time measured.
A displacement of the potential towards more negative values (behavior indicating dissolution of the oxide layer) in the case of sandblasted surfaces was observed in the specialized literature also by other authors [25]. This behavior can be attributed to the increase in the roughness of a surface that causes an increase in corrosion processes because the roughness influences the corrosion potential favoring the appearance of corrosion pits [33].

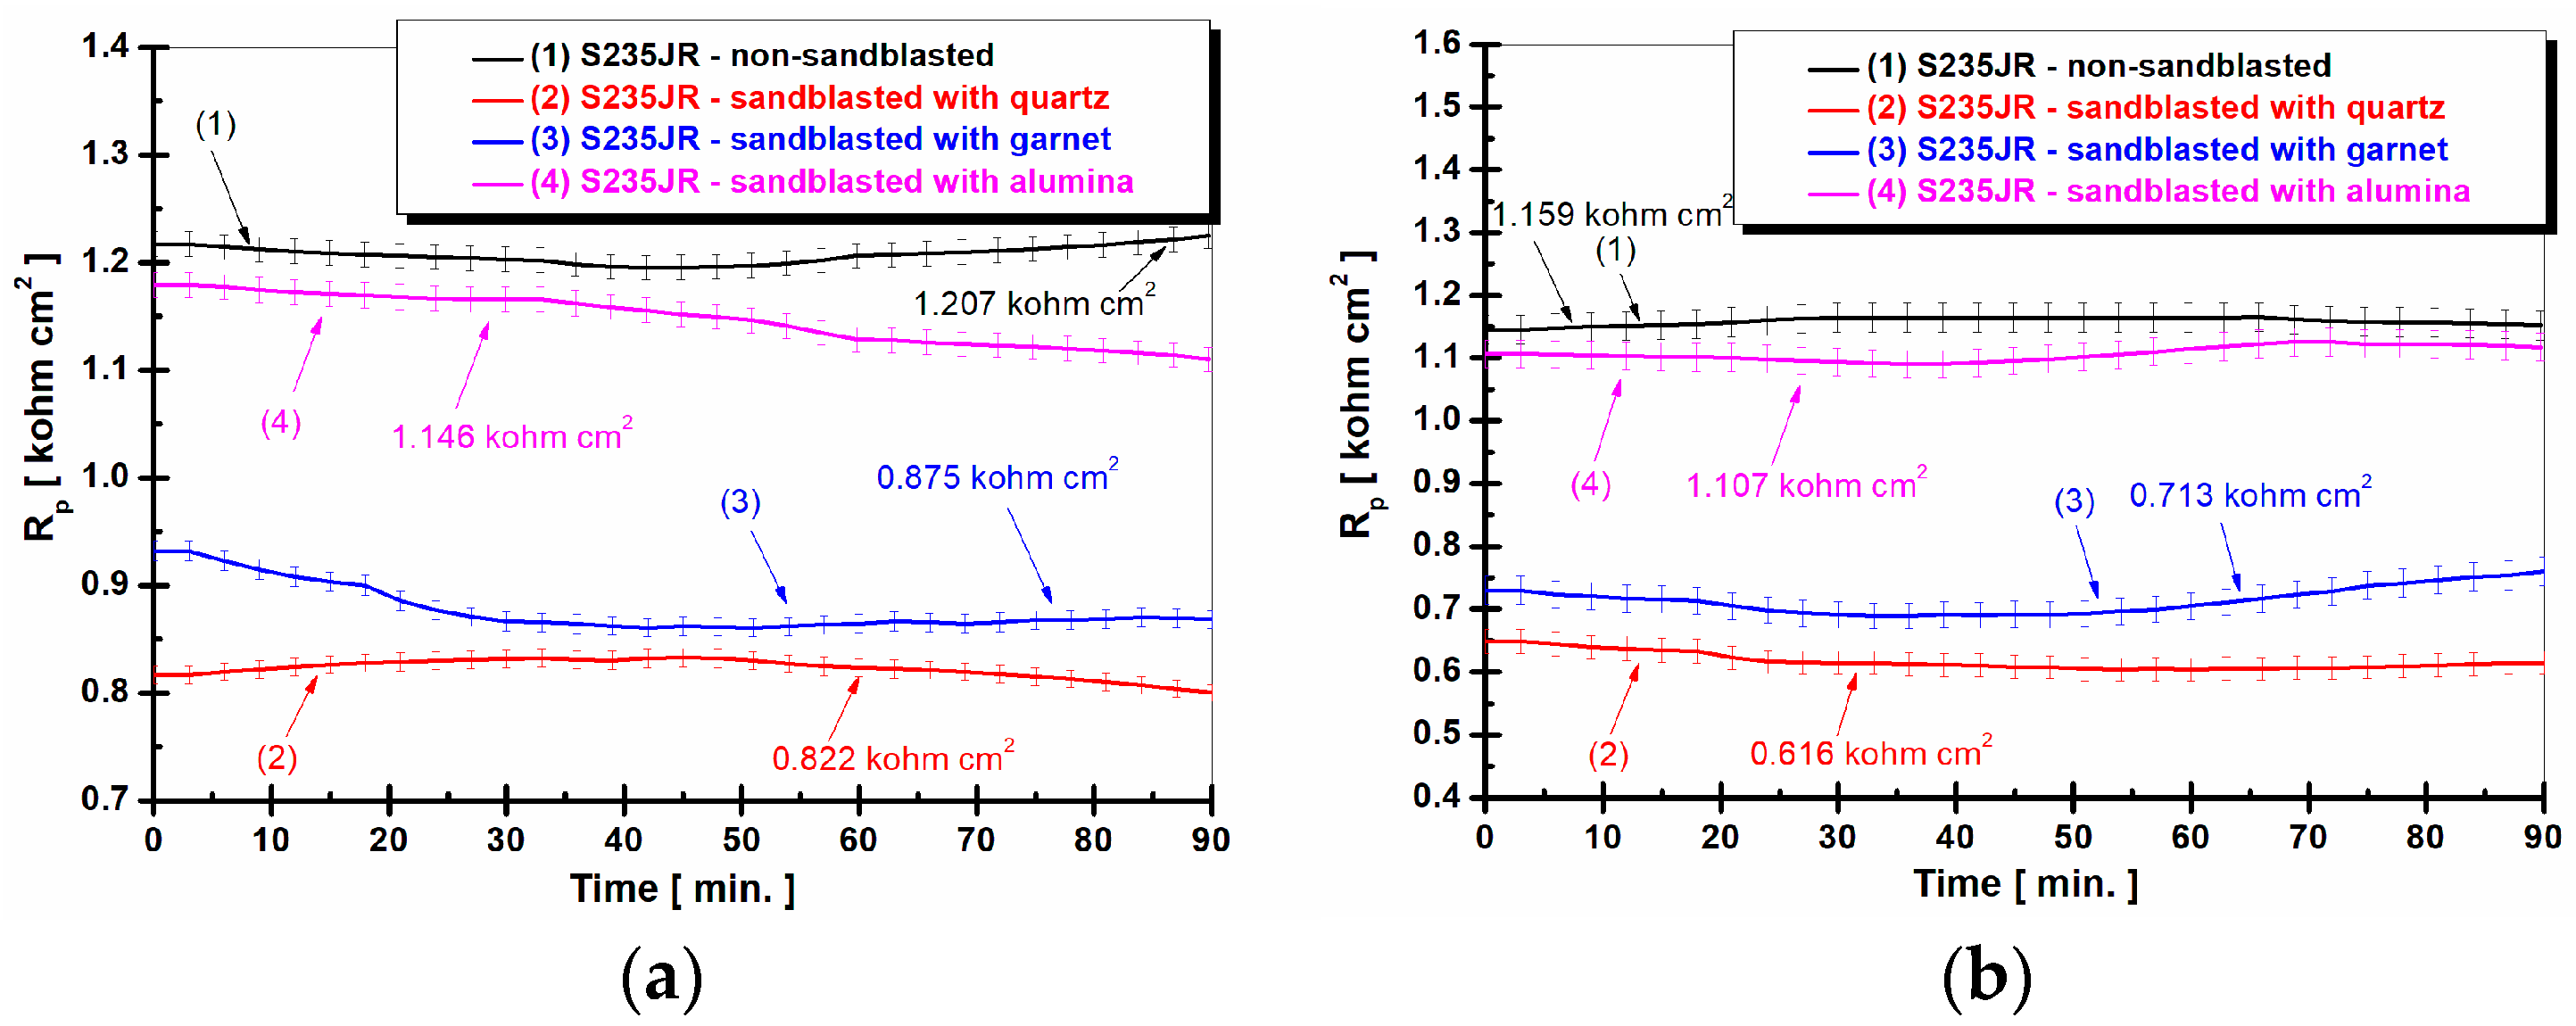
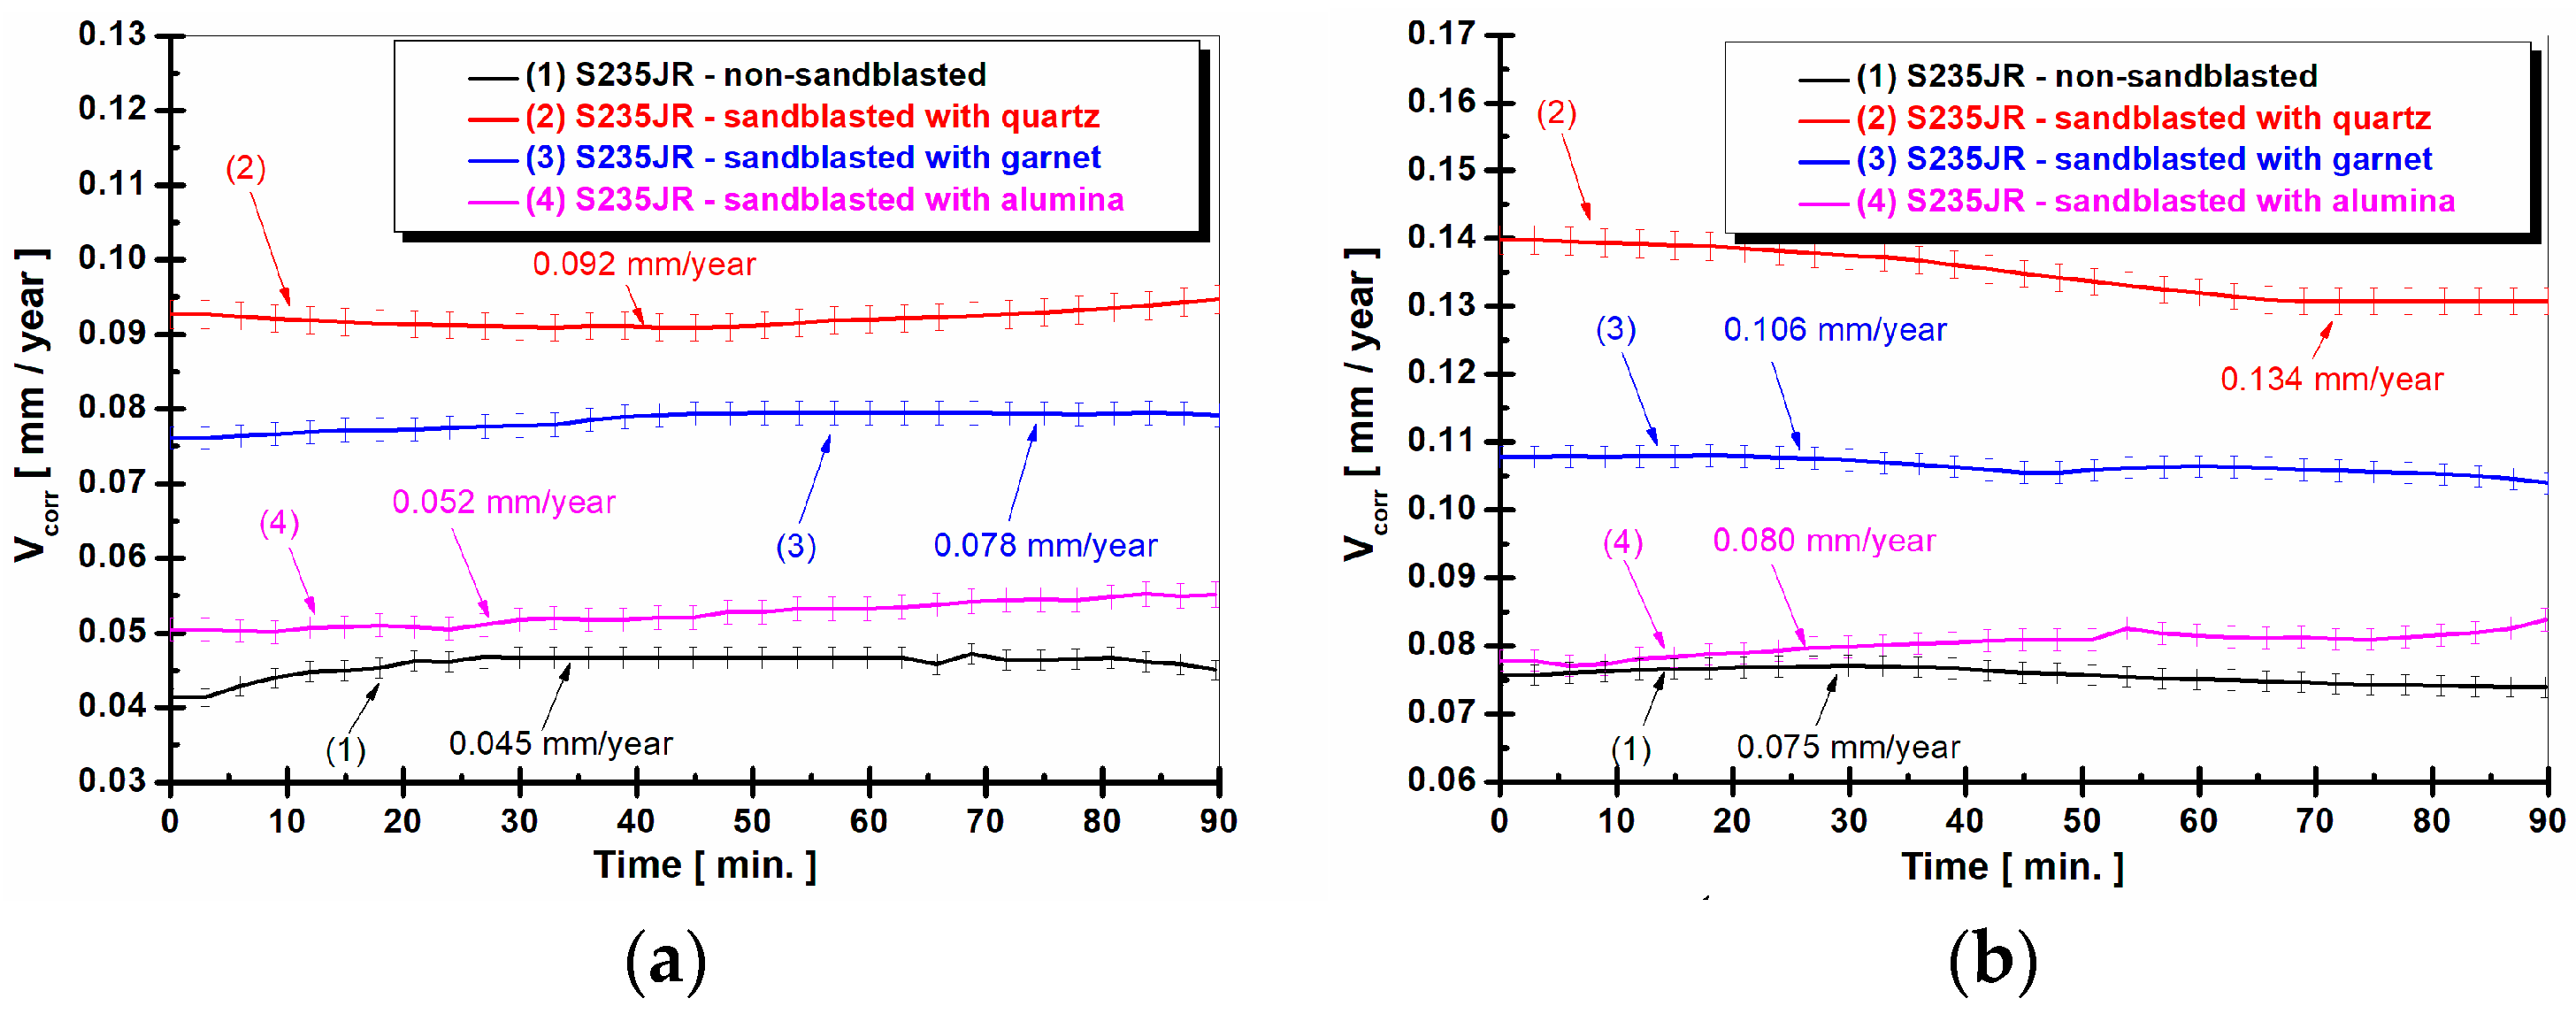
3.1.2. Evolution of Polarization Resistance and Corrosion Rate (Rp-Vcorr)

The Rp method is a corrosion monitoring method that makes it possible to measure the corrosion rate in real time and directly [31].
The corrosion current calculated with this method, represents the current that occurs at the metal-medium (corrosive) interface when the metal is immersed in the electrolyte [31].
The variation of the polarization resistance for the studied surfaces immersed in the 3.5% NaCl solution at (a) (T1 = immersion time) and (b) after 336 h from immersion (T2) is presented in Figure 4a,b.
From Figure 4a, it can be observed that the values of the polarization resistance at both studied times decrease in the case of the sandblasted samples compared to the value obtained for the untreated surface. If for S235JR—non-sandblasted (curve 1) the Rp value after one hour from immersion is 1.207 ± 0.04 kohm cm2, for S235JR—sandblasted with quartz (curve 2) the lowest Rp value is 0.822 ± 0.06 kohm cm2, the difference between these 2 values being 0.385 kohm cm2. A high value of polarization resistance means a low value of corrosion rate.
For S235JR—sandblasted with garnet (curve 3), it is observed that the Rp value = 0.875 ± 0.03 kohm cm2, a value which is also lower than S235JR—non-sandblasted (curve 1) with 0.332 kohm cm2 but higher than S235JR—sandblasted with quartz (curve 2) with 0.53 kohm cm2.
For S235JR—sandblasted with alumina (curve 4), it can be seen that the Rp value is 1.146 ± 0.05 kohm cm2 with 0.061 kohm cm2 lower than S235JR—non-sandblasted but higher than S235JR—sandblasted with quartz with 0.324 kohm cm2 and 0.271 kohm cm2 compared to S235JR—sandblasted with garnet.
After 336 h from immersion, Figure 4b shows a decrease in all polarization resistance values compared to the values obtained in Figure 4a after one hour from immersion.
If after one hour of immersion, S235JR—non-sandblasted has a value of 1.207 ± 0.04 kohm cm2, after 336 h of immersion, this sample reaches a value of 1.159 ± 0.06 kohm cm2, the value decrease in this case is 0.048 kohm cm2 compared to the first measurement period. In the case of S235JR—sandblasted with quartz, the difference between the first measurement period and the second measurement period is 0.206 kohm cm2. At S235JR—sandblasted with garnet, the difference between the first measurement period and the second measurement period is 0.162 kohm cm2. For S235JR—sandblasted with alumina, the difference between the first measurement period and the second measurement period is 0.039 kohm cm2.
The variation of the corrosion rate expressed as a penetration index for the studied surfaces at (a) (T1 = immersion time) and (b) after 336 h from immersion (T2) is shown in Figure 5a,b.
From the analysis of Figure 5a, it can be observed that the values of the corrosion rate at both studied times increase in the case of the sandblasted samples compared to the value obtained for the untreated surface.
If for S235JR—non-sandblasted (curve 1), the Vcorr value after one hour of immersion is 0.045 ± 0.02 mm/year, for S235JR—sandblasted with quartz (curve 2) the highest Vcorr value is 0.092 ± 0.04 mm/year, the difference between these two values being 0.047 mm/year.
It is well known that Rp is inversely proportional to Vcorr. A high value of polarization resistance means a low value of corrosion rate [31].
For S235JR—sandblasted with garnet (curve 3), it is observed that the Vcorr value = 0.078 ± 0.05 mm/year, a value which is also higher than S235JR—non-sandblasted (curve 1) with 0.033 mm/year but lower than S235JR—sandblasted with quartz (curve 2) with 0.014 mm/year.
For S235JR—sandblasted with alumina (curve 4), it can be seen that the Vcorr value is 0.052 ± 0.04 mm/year with 0.007 mm/year higher than S235JR—non-sandblasted (curve 1) but lower than S235JR—sandblasted with quartz (curve 2) with 0.04 mm/year and 0.026 mm/year compared to S235JR—sandblasted with garnet (curve 3).
After 336 h of immersion, Figure 5b shows an increase in all Vcorr values compared to the values obtained in Figure 5a after one hour of immersion.
If after one hour of immersion, S235JR—non-sandblasted (curve 1) has a value of 0.045 ± 0.02 mm/year, after 336 h of immersion, this sample reaches a value of 0.075 ± 0.05 mm/year, the increase of the Vcorr value, in this case, being with 0.03 mm/year higher than the first measurement period. In the case of S235JR—sandblasted with quartz (curve 2), the difference between the first measurement period and the second measurement period is 0.042 mm/year.
At S235JR—sandblasted with garnet (curve 3), the difference between the first measurement period and the second measurement period is 0.028 mm/year, and for S235JR—sandblasted with alumina (curve 4), the difference between the first measurement period and the second measurement period is 0.028 mm/year.
A decrease in the corrosion resistance in the case of other sandblasted materials was also observed in the literature by other authors [21,25].
From the electrochemical results, it can be seen that the S235JR non-sandblasted surface shows the highest corrosion resistance. This behavior is possible due to the fact that the non-sandblasted surface has a lower roughness value compared to sandblasted surfaces.
The lowest corrosion resistance is obtained by the S235JR sandblasted with quartz, which has a corrosion resistance approximately two times lower compared to the non-sandblasted surface. This behavior is due to the increase in roughness value approximately six times higher compared to the non-sandblasted surface. Sandblasting increases the roughness and determines the appearance of deep grooves that can capture the corrosion products formed in the upper part of the surfaces, favoring the appearance of micro reactions, thus generating pitting corrosion [33].
Table 4 shows the values of the corrosion rate and the gravimetric index calculated according to the formulas presented in the material and methods chapter.
From Table 4, it can be seen that, in the case of the results determined by the gravimetric method, the trend of the samples after 336 h of immersion in the 3.5% NaCl solution remains the same as that determined by the electrochemical method. Thus, it can be seen that the corrosion rate increases in the case of sandblasted samples compared to the non-sandblasted S235JR sample. This is mainly because the roughness of the surfaces increases compared to the untreated sample, favoring the occurrence of corrosion.

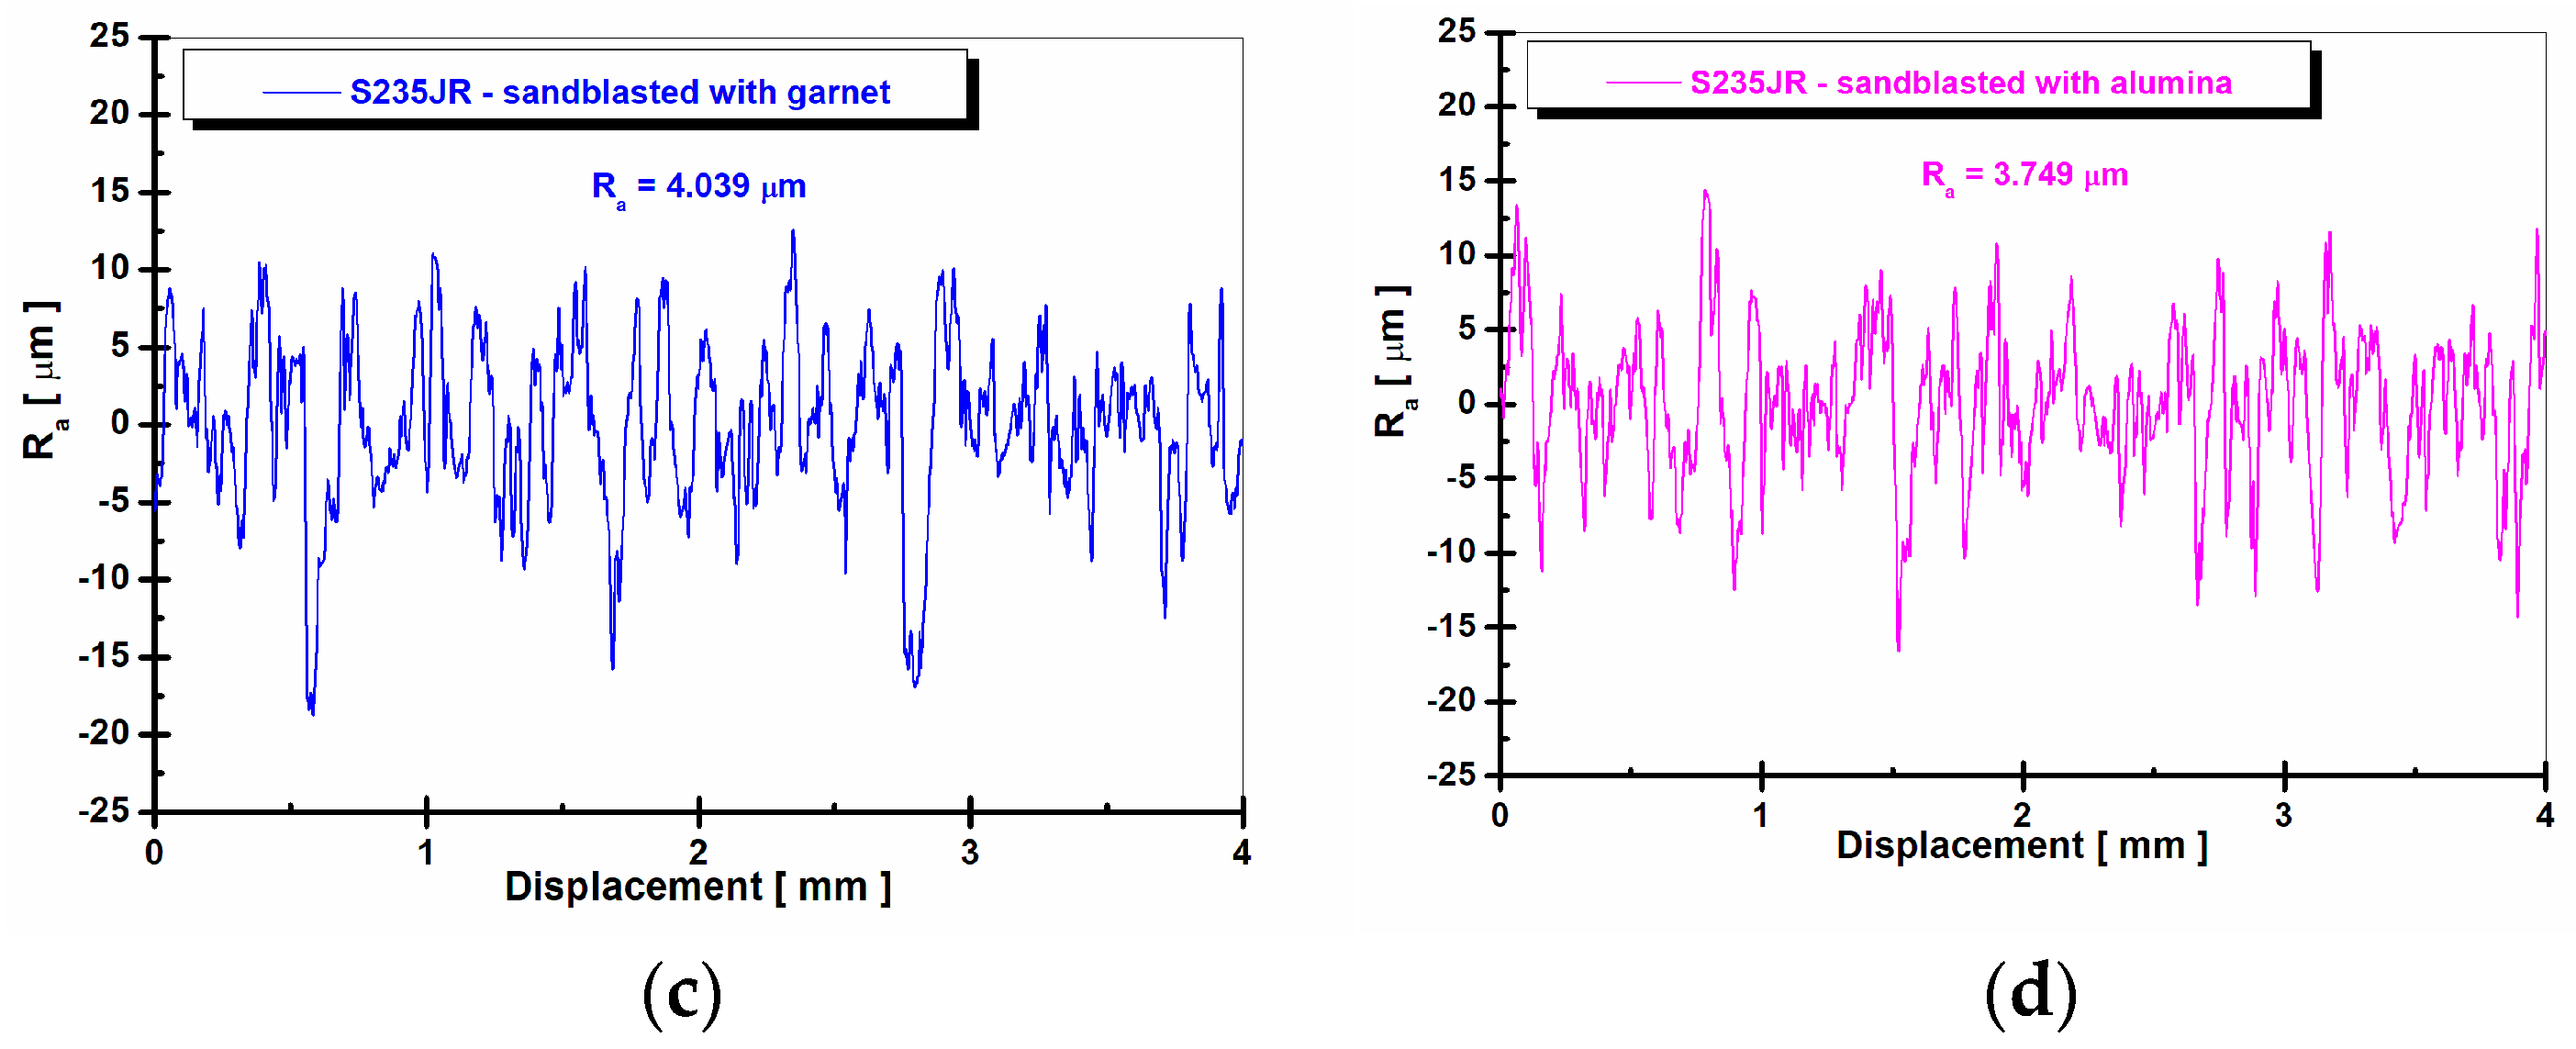
3.2. Surface Roughness Results of Tested Surfaces before and after Corrosion Process

Roughness is an important parameter in understanding the effect that surface topography has on the corrosion resistance of a material [33,34]. Figure 6a–d shows the surface roughness before corrosion, and Figure 7a–d shows the surface roughness after corrosion. Table 5 shows the average values of the obtained roughness parameters.
From the analysis of Figure 6, it can be seen that after the sandblasting process, the roughness of the samples increased compared to the S235JR—non-sandblasted steel sample (Figure 6a). If S235JR—non-sandblasted has a roughness of 0.856 ± 0.01 µm, it can be seen that S235JR—sandblasted with quartz (Figure 6b) has a roughness of 5.548 ± 0.05 µm, the increase of the roughness parameter, in this case, is 4.692 µm.
In the case of S235JR—sandblasted with garnet (Figure 6c), the roughness value has a value of 4.039 ± 0.02 µm, while S235JR—sandblasted with alumina (Figure 6d) has a value of 3.749 ± 0.01 µm. The increase in roughness after the sandblasting process was also observed in the specialized literature by other authors [25,32,35,36].
This behavior is explained in the specialized literature by the fact that during the sandblasting process, the surface of the samples is repeatedly sandblasted with hard particles at a very high speed, which leads to the removal of the superficial oxide layer formed on the surface of the samples generating at the same time a local plastic deformation and a micro cutting process (formation of irregular cavities with random distribution) in the surface layer [25,32].
From the analysis of Figure 7, an increase in roughness after the corrosion process can be observed in the case of S235JR—non-sandblasted (Figure 7a). If before the corrosion process, it had a roughness of 0.856 µm, after the corrosion process, it has a value of 1.153 µm. In this case, the increase of the parameter of roughness (Ra) is higher than the initial value with 0.297 µm.
This is possible due to the appearance of corrosion products on the surface of the sample that generated an inhomogeneous surface. In the case of the sandblasted samples, a decrease in the roughness parameter (Ra) after the corrosion process is observed compared to the values of the roughness parameter before the corrosion process.
In the case of samples sandblasted after the corrosion process, the roughness decreases due to the fact that the corrosion products formed on the surface of the layer fill the voids formed after sandblasting, resulting in a more uniform surface [33].
According to Evgeny Barmatov and his team [33], sandblasting is a process that causes surface defects, plastic deformations, micro deformations, and changes in heterogeneity through the possible fragmentation of the particles used in the sandblasting process that reach the surface of the sandblasted materials [33]. Sandblasting also determines the appearance of deep grooves that can capture the corrosion products formed in the upper part of the surfaces, favoring the appearance of micro reactions, thus generating pitting corrosion [25,33].
Thus, in the same study [33], the authors state that the increase in the roughness of a surface causes an increase in corrosion processes because the roughness influences the corrosion potential favoring the appearance of corrosion pits. While a less rough surface reduces, the occurrence of metastable pits by reducing the sites capable of being activated [33].
The results of the roughness tests presented in this study confirm the results obtained from the corrosion and optical microscopy study.

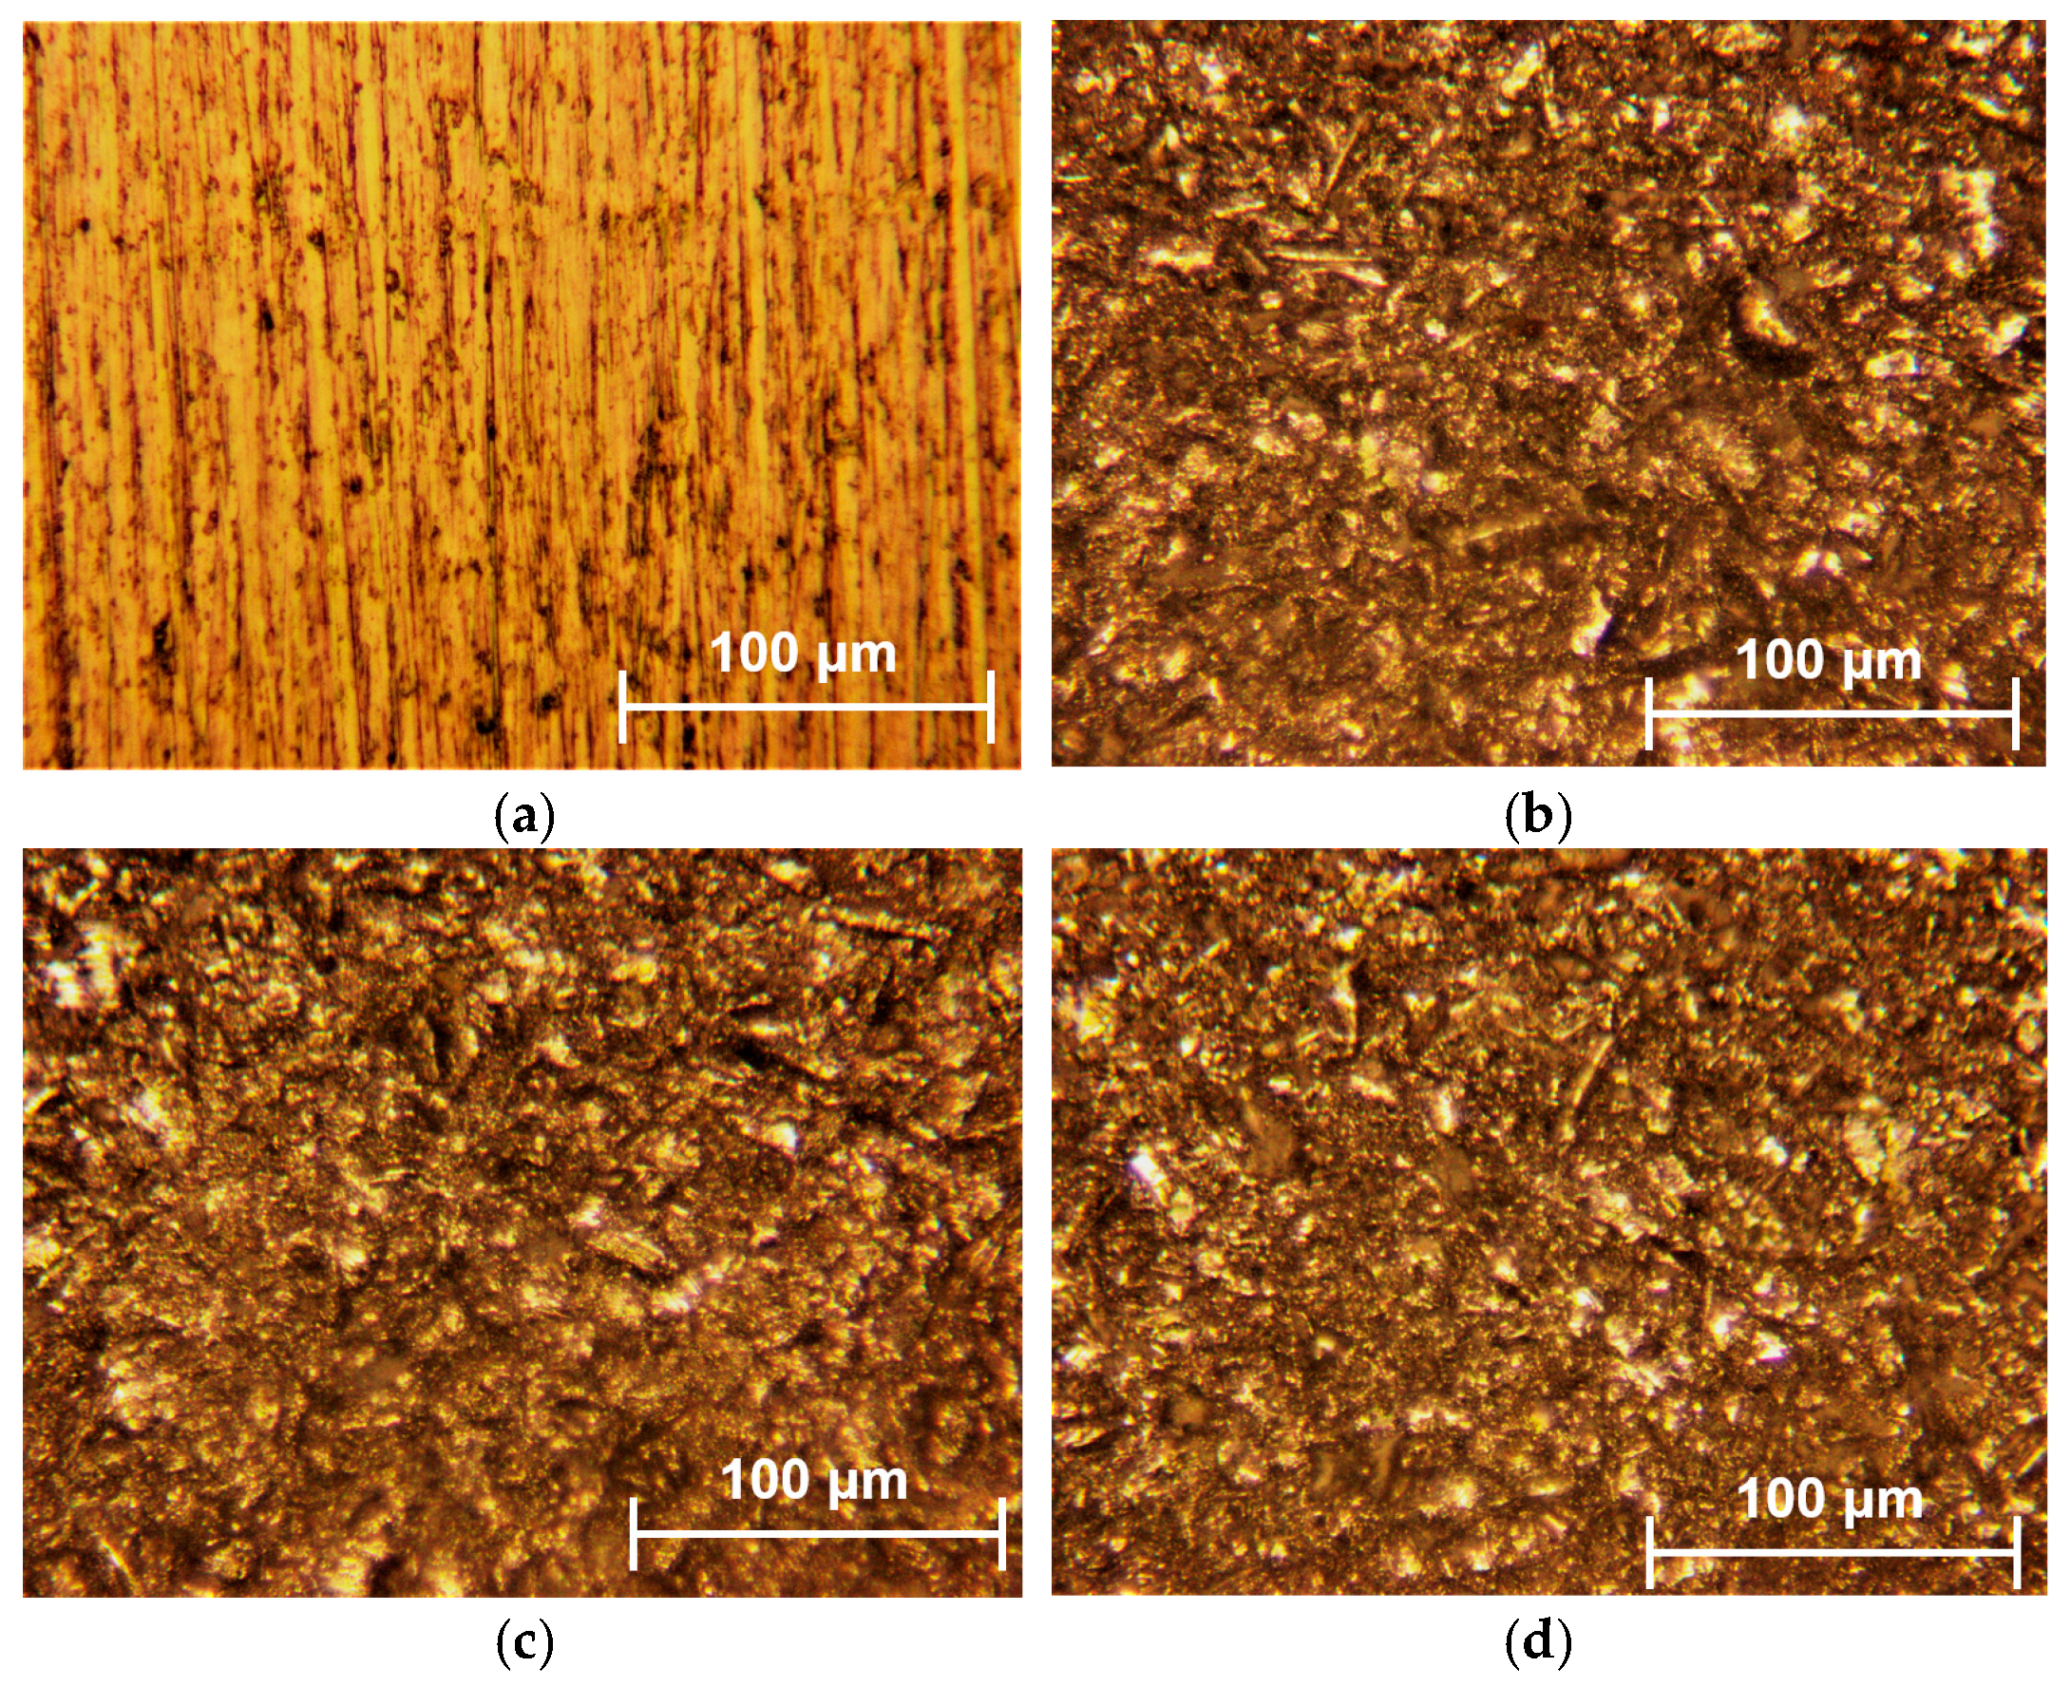
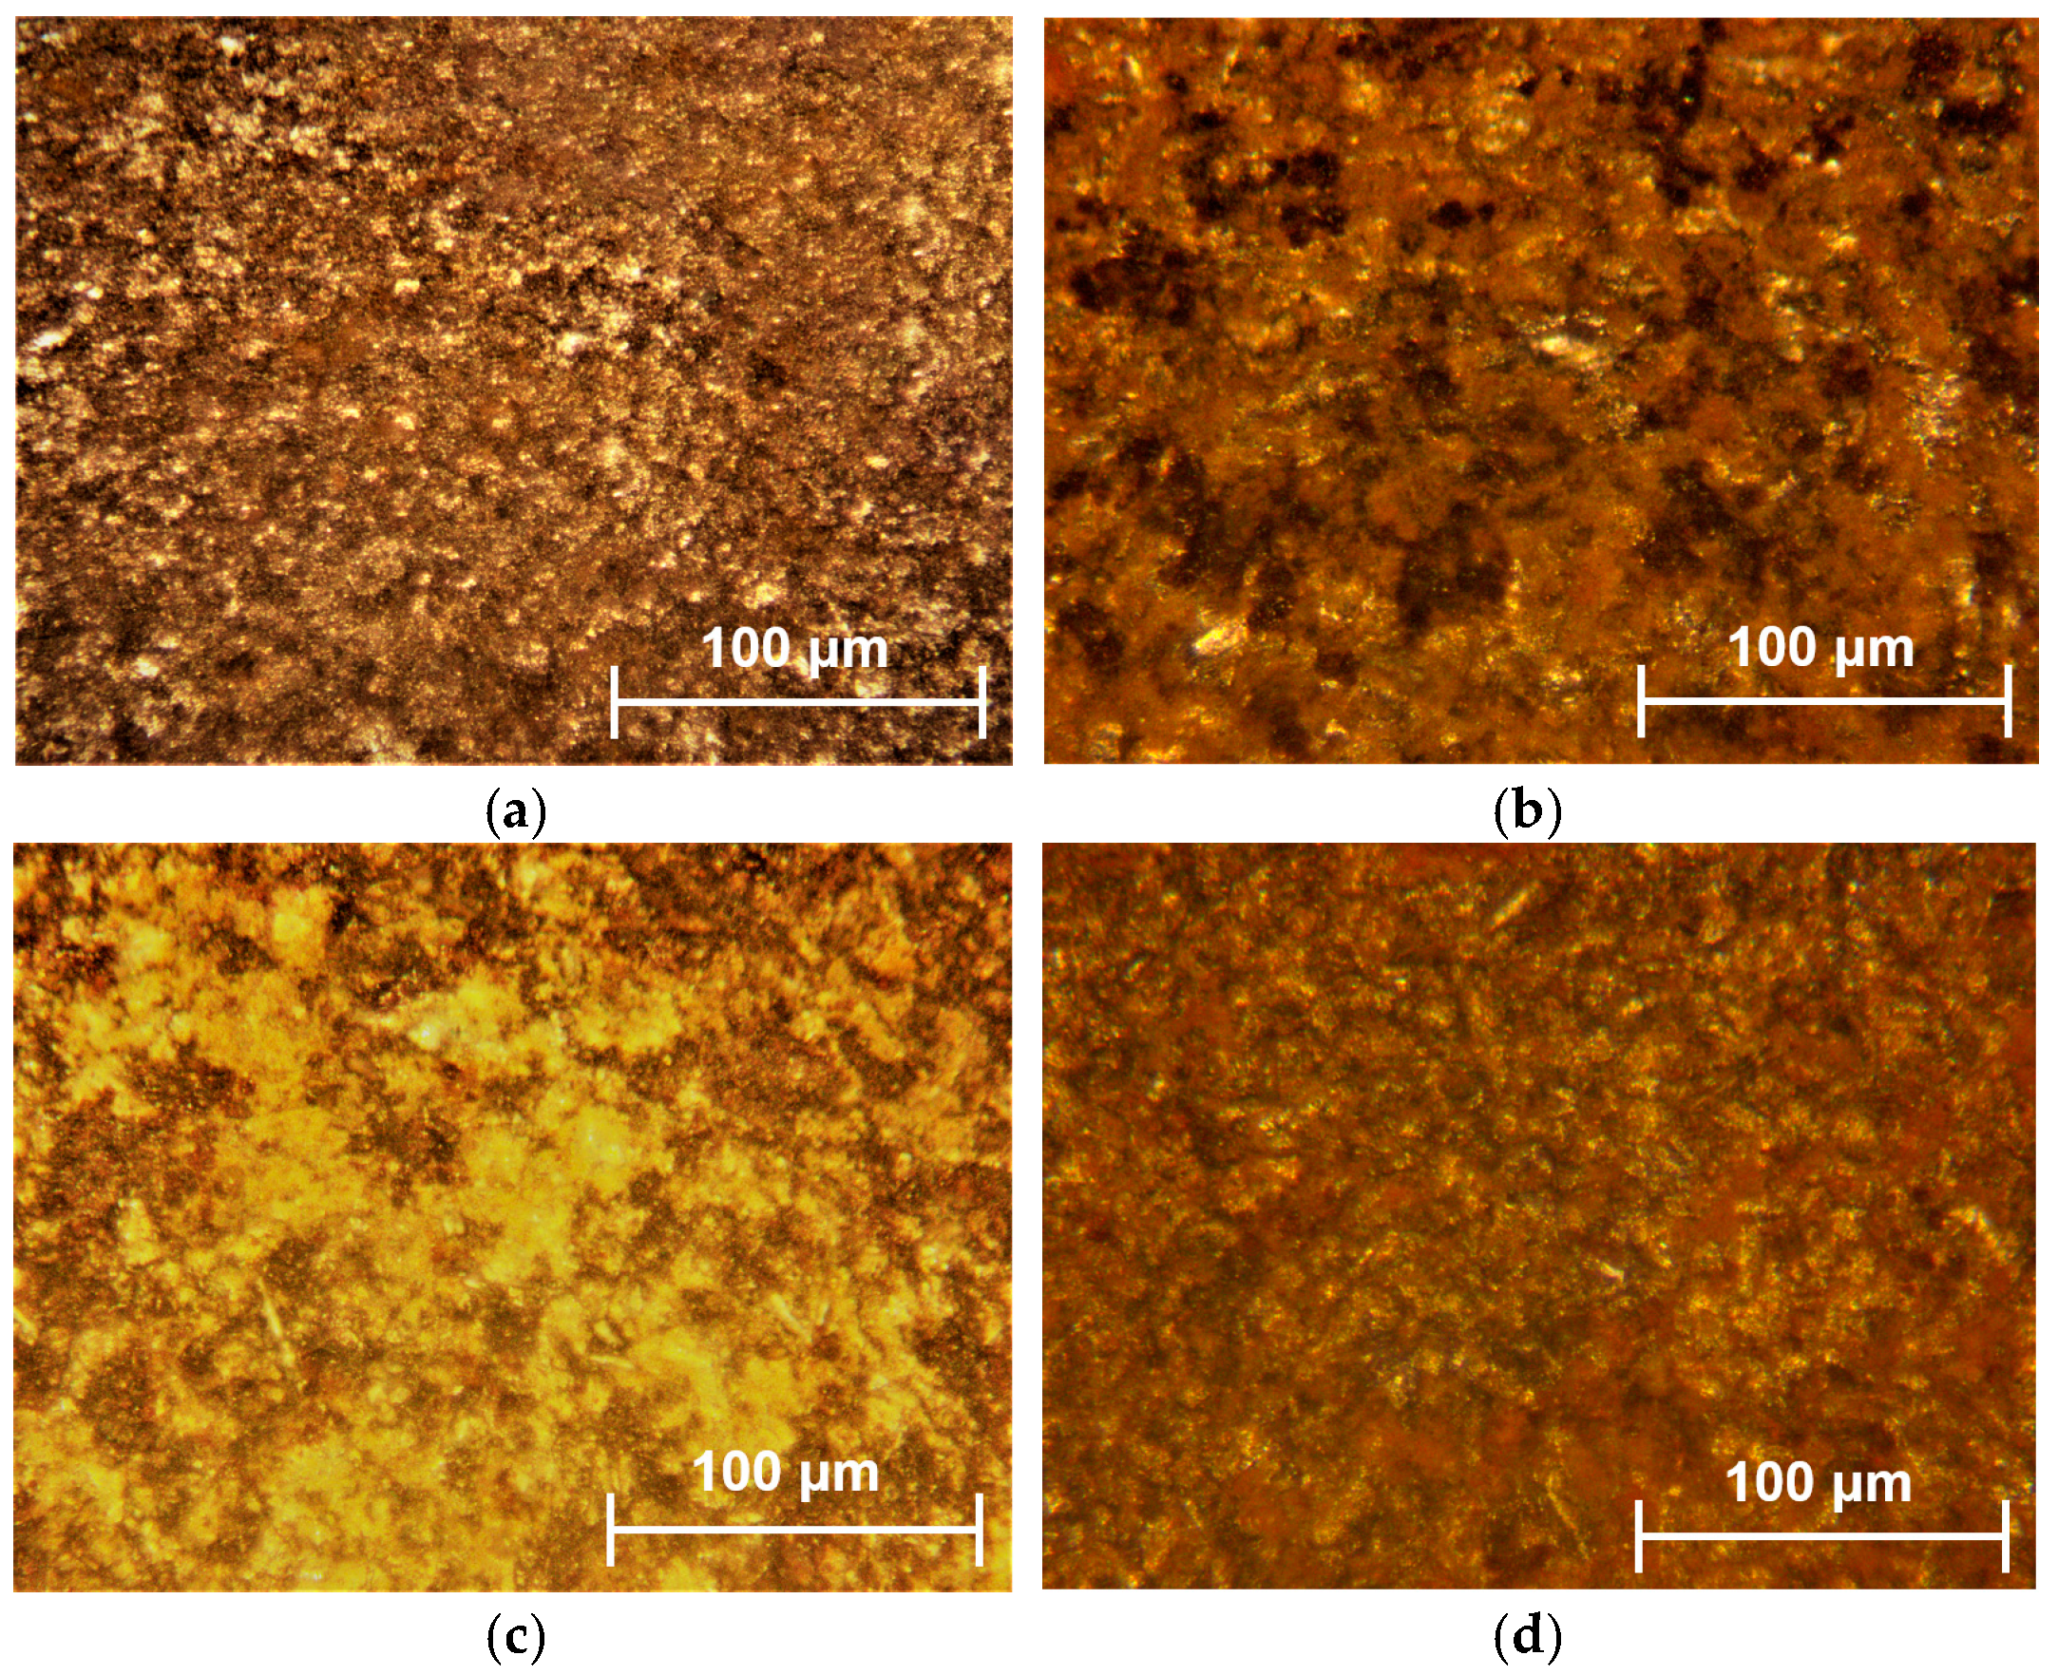
3.3. Optical Microscopy of Tested Surfaces before and after Corrosion

The surface of untreated S235JR steel, and blasted with quartz sand, red garnet, and white electrocorundum investigated by optical microscopy before and after corrosion tests in NaCl 3.5% to highlight the corrosive attack are shown in Figure 8a–d and Figure 9a–d.
From the analysis of the images obtained with the help of optical microscopy before immersing the samples in the 3.5% NaCl solution, it can be observed that the surfaces are clean, without traces of corrosion products and defects.
From the analysis of the images after immersing the samples in the 3.5% NaCl solution for 336 h, it can be seen that the surfaces show corrosion products (rust products) that formed on the surface of the samples. The surface most affected by corrosion products is the surface of the S235JR—sandblasted with quartz (Figure 9b), which shows pitting corrosion. The pitting corrosion covers a high surface of S235JR—sandblasted with quartz, and the pits are deeper into the substrate. The least affected surface by corrosion products is the surface of the S235JR—non-sandblasted (Figure 9a), which shows more generalized corrosion at the surface of the materials without attacking the substrate. The optical microscopy images are in good agreement with all the measurements analysis presented in this study.

4. Conclusions

The present study describes the influence of different type materials of grit blasting on the corrosion resistance by immersing the samples in 3.5% NaCl solution for 336 h. As a result, the following conclusions were observed:
From the evolution of the free potential, a decrease in the free potential can be observed in the case of sandblasted samples compared to the untreated sample. After one hour from immersion, the studied samples show a shift of the free potential towards more negative values, indicating dissolution of the oxide layer on the surface of the samples.
From the electrochemical and gravimetric methods used to determine the corrosion resistance, it can be seen that sandblasting has a negative effect on the corrosion resistance of the S235JR steel. The highest corrosion resistance is observed for the S235JR non-sandblasted surface, which presents higher values of Vcorr compared to the sandblasted surfaces. This behavior is possible due to the fact that the S235JR non-sandblasted surface has a lower roughness value compared to sandblasted surfaces.
The lowest corrosion resistance is obtained by the S235JR sandblasted with quartz, which has a corrosion resistance approximately two times lower compared to the non-sandblasted surface. This behavior is possible due to the increase in roughness value approximately six times higher compared to the non-sandblasted surface. Sandblasting increases the roughness and determines the appearance of deep grooves that can capture the corrosion products formed in the upper part of the surfaces, favoring the appearance of micro reactions, thus generating pitting corrosion. In the case of the S235JR steel surface sandblasted with garnet, a decrease in corrosion resistance of approximately 1.4 times less is observed compared to the non-sandblasted surface. For the surface of S235JR steel sandblasted with alumina, it can be seen that it has Vcorr values, which are close to the Vcorr values obtained by the non-sandblasted surface, indicating that sandblasting with alumina grit can be chosen as a method of steel preparation in order to prepare the surfaces for possible coatings. It was also observed that as the immersion time increases, the corrosion rate increases, a behavior observed on all studied surfaces.
From the roughness analysis, it can be seen that after the sandblasting process, the roughness of the sandblasted samples increases compared to the untreated surface. This behavior is due to the fact that the oxide layer formed on the surface of the sample is removed by sandblasting process, generating at the same time a local plastic deformation and a micro-cutting process (formation of irregular cavities with random distribution) in the surface layer.
After the corrosion process, the roughness of the sandblasted samples decreases due to the fact that the corrosion products formed on the surface of the layer fill the voids formed after sandblasting, resulting in a more uniform surface, while the roughness of the non-sandblasted surface studied increases. This behavior can be explained by the fact that the appearance of corrosion products on the surface of the sample generated an inhomogeneous surface.
Determining the corrosion behavior of a material used in various industrial applications represents one of the most important properties that determine its choice or replacement in a specific application. Thus, this study offers a deeper understanding of the effect that sandblasting has on the corrosion resistance of carbon steel S235JR, a material of major interest considering its wide range of uses in various industrial sectors.
Further studies will be done regarding the influence of the three presented sandblasting grits on the corrosion resistance of S235JR steel coated with different paints enriched with ceramic nanoparticles. The studies will be completed by the analysis of the corrosion products that appear on the surface of material.

Author Contributions

Conceptualization, N.B., F.M.D. and A.R.; methodology, N.B., A.C.M. and A.R.; software, L.M.; validation, N.B., A.C.M. and A.R.; formal analysis, V.G.; investigation, N.B., F.M.D. and A.R.; resources, D.L.B.; data curation, L.M.; writing—original draft preparation, N.B., A.C.M. and D.L.B.; writing—review and editing, N.B., A.C.M., A.R. and D.L.B.; visualization, V.G.; supervision, A.C.M. and D.L.B. All authors have read and agreed to the published version of the manuscript.

Funding

This research was funded by the project “PROINVENT”, Contract no. 62487/03.06.2022—POCU/993/6/13—Code 153299, financed by the Human Capital Operational Programme 2014–2020 (POCU), Romania.

Data Availability Statement

The raw/processed data required to reproduce these findings cannot be shared at this time: as the data also form part of an ongoing study.

Acknowledgments

The work of Nicoleta Bogatu was supported by the project “PROINVENT”, Contract no. 62487/03.06.2022—POCU/993/6/13—Code 153299, financed by the Human Capital Operational Programme 2014–2020 (POCU), Romania. In addition, the authors would like to acknowledge of the company ABRAZIV TRADE SRL, Mureș, Romania for donation the sandblasting materials.

Conflicts of Interest

The authors declare no conflict of interest.

References

  1. Fang, C.K.; Chuang, T.H. Surface morphologies and erosion rates of metallic building materials after sandblasting. Wear 1999, 230, 156–164. [Google Scholar] [CrossRef]
  2. Rajput, A.; Paik, J.K. Effects of naturally-progressed corrosion on the chemical and mechanical properties of structural steels. Structures 2021, 29, 2120–2138. [Google Scholar] [CrossRef]
  3. Chelaru, J.D.; Mureşan, L.M. Study of S235 steel corrosion process in wastewater from the petrochemical industry. Stud. UBB Chem. 2019, LXIV 2 Tom II, 323–333. [Google Scholar] [CrossRef]
  4. Kim, A.; Kainuma, S.; Yang, M. Surface characteristics and corrosion behavior of carbon steel treated by abrasive blasting. Metals 2021, 11, 2065. [Google Scholar] [CrossRef]
  5. Trela, J.; Chat, M.; Scendo, M. Influence of sodium molybdate (VI) on the corrosion of S235 carbon steel. Chemik 2015, 69, 592–599. [Google Scholar]
  6. Lipiński, T. Corrosion of S235JR steel in NaCl environment at 3 °C. In Proceeding of the 26th International Conference on Metallurgy and Materials, Brno, Czech Republic, 24–26 May 2017. [Google Scholar]
  7. Khalaj, G.; Pouraliakbar, H.; Arab, N.; Nazerfakhari, M. Correlation of passivation current density and potential by using chemical composition and corrosion cell characteristics in HSLA steels. Measurement 2015, 75, 5–11. [Google Scholar] [CrossRef]
  8. Kiahosseini, S.R.; Mohammadi Baygi, S.J.; Khalaj, G.; Khoshakhlagh, A.; Samadipour, R. A study on structural, corrosion, and sensitization behavior of ultrafine and coarse grain 316 stainless steel processed by multiaxial forging and heat treatment. J. Mater. Eng. Perform. 2017, 27, 271–281. [Google Scholar] [CrossRef]
  9. Burduhos-Nergis, D.-P.; Vizureanu, P.; Sandu, A.V.; Bejinariu, C. Phosphate surface treatment for improving the corrosion resistance of the C45 carbon steel used in carabiners manufacturing. Materials 2020, 13, 3410. [Google Scholar] [CrossRef]
  10. Burduhos-Nergis, D.-P.; Vizureanu, P.; Sandu, A.V.; Bejinariu, C. Evaluation of the corrosion resistance of phosphate coatings deposited on the surface of the carbon steel used for carabiners manufacturing. Appl. Sci. 2020, 10, 2753. [Google Scholar] [CrossRef]
  11. Rudawska, A.; Danczak, I.; Müller, M.; Valasek, P. The effect of sandblasting on surface properties for adhesion. Int. J. Adhes. Adhes. 2016, 70, 176–190. [Google Scholar] [CrossRef]
  12. Bechikh, A.; Klinkova, O.; Maalej, Y.; Tawfiq, I.; Nasri, R. Sandblasting parameter variation effect on galvanized steel surface chemical composition, roughness and free energy. Int. J. Adhes. Adhes. 2020, 102, 102653. [Google Scholar] [CrossRef]
  13. Geng, S.; Sun, J.; Guo, L. Effect of sandblasting and subsequent acid pickling and passivation on the microstructure and corrosion behavior of 316L stainless steel. Mater. Des. 2015, 88, 1–7. [Google Scholar] [CrossRef]
  14. Petrov, Y.M.; Vasiliev, M.O.; Trofimova, L.M.; Filatova, V.S. Layer-by-layer evolution of a microstructure in a Cu–Zn alloy after sandblasting. Usp. Fiz. Met. 2006, 7, 173–187. [Google Scholar] [CrossRef]
  15. Ding, L.; Torbati-Sarraf, H.; Poursaee, A. The influence of the sandblasting as a surface mechanical attrition treatment on the electrochemical behavior of carbon steel in different pH solutions. Surf. Coat. Technol. 2018, 352, 112–119. [Google Scholar] [CrossRef]
  16. Multigner, M.; Frutos, E.; González-Carrasco, J.L.; Jiménez, J.A.; Marín, P.; Ibáñez, J. Influence of the sandblasting on the subsurface microstructure of 316LVM stainless steel: Implications on the magnetic and mechanical properties. Mater. Sci. Eng. C 2009, 29, 1357–1360. [Google Scholar] [CrossRef]
  17. Heikki, R.; Eero, K.; Pauli, L.; Jani, R.; Ari, N.; Pasi, H.; Tuomo, K. Influence of surface integrity on the fatigue strength of high-strength steels. J. Constr. Steel Res. 2013, 89, 21–29. [Google Scholar] [CrossRef]
  18. Garbatov, Y.; Parunov, J.; Kodvanj, J.; Saad-Eldeen, S.; Guedes Soares, C. Experimental assessment of tensile strength of corroded steel specimens subjected to sandblast and sandpaper cleaning. Mar. Struct. 2016, 49, 18–30. [Google Scholar] [CrossRef]
  19. Alhussein, A.; Capelle, J.; Gilgert, J.; Dominiak, S.; Azari, Z. Influence of sandblasting and hydrogen on tensile and fatigue properties of pipeline API 5L X52 steel. Int. J. Hydrog. Energy 2011, 36, 2291–2301. [Google Scholar] [CrossRef]
  20. Krawczyk, J.; Bembenek, M.; Frocisz, Ł.; ´Sleboda, T.; Pa´cko, M. The effect of sandblasting on properties and structures of the DC03/1.0347, DC04/1.0338, DC05/1.0312, and DD14/1.0389 steels for deep drawing. Materials 2021, 14, 3540. [Google Scholar] [CrossRef]
  21. Wang, X.; Li, D. Mechanical and electrochemical behavior of nanocrystalline surface of 304 stainless steel. Electrochim. Acta 2002, 47, 3939–3947. [Google Scholar] [CrossRef]
  22. Hou, J.; Fu, X.; Chung, D.D.L. Improving both bond strength and corrosion resistance of steel rebar in concrete by water immersion or sand blasting of rebar. Cem. Concr. Res. 1997, 27, 679–684. [Google Scholar] [CrossRef]
  23. Ding, L.; Poursaee, A. The impact of sandblasting as a surface modification method on the corrosion behavior of steels in simulated concrete pore solution. Constr. Build. Mater. 2017, 157, 591–599. [Google Scholar] [CrossRef]
  24. Marina, C.; Vasco, P.P.; Apostolos, N.C.; Spiros, G.P. Effect of corrosion and sandblasting on the high cycle fatigue behavior of reinforcing B500C steel bars. Frat. Integrita. Strutt. 2017, 42, 9–22. [Google Scholar]
  25. Hammouda, N.; Belmokre, K. Effect of surface treatment by sandblasting on the quality and electrochemical corrosion properties of a C-1020 carbon steel used by an Algerian oil company. MATEC Web Conf. 2019, 272, 01001. [Google Scholar] [CrossRef]
  26. Hubbs, A.F.; Minhas, N.S.; Jones, W.; Greskevitch, M.; Battelli, L.A.; Porter, D.W.; Goldsmith, W.T.; Frazer, D.; Landsittel, D.P.; Ma, J.Y.; et al. Comparative pulmonary toxicity of 6 abrasive blasting agents. Toxicol. Sci. 2001, 61, 135–143. [Google Scholar] [CrossRef]
  27. Franziska, K.; Michael, B.; Torsten, G. Potential of garnet sand as an unconventional resource of the critical high-technology metals scandium and rare earth elements. Sci. Rep. 2021, 11, 5306. [Google Scholar] [CrossRef]
  28. Zadorozhnaya, O.Y.; Khabasa, T.A.; Tiunova, O.V.; Malykhin, S.E. Effect of grain size and amount of zirconia on the physical and mechanical properties and the wear resistance of zirconia-toughened alumina. Ceram. Int. 2020, 46, 9263–9270. [Google Scholar] [CrossRef]
  29. EN ISO 8501-1:2007; Corrosion Protection of Steel Structures by Painting. ISO: Geneva, Switzerland, 2007.
  30. Ofoegbu, S.U. Comparative gravimetric studies on carbon steel corrosion in selected fruit juices and acidic chloride media (HCl) at different pH. Materials 2021, 14, 4755. [Google Scholar] [CrossRef] [PubMed]
  31. Muresan, A.C.; Istrate, G.G. Elemente de Electrochimie si Coroziune; Note de curs; Editura Galati, University Press: Galati, Romania, 2021; pp. 170–171. [Google Scholar]
  32. Hagen, C.M.H.; Hognestad, A.; Knudsen, O.Ø.; Sørby, K. The effect of surface roughness on corrosion resistance of machined and epoxy coated steel. Prog. Org. Coat. 2019, 130, 17–23. [Google Scholar] [CrossRef]
  33. Evgeny, B.; Hughes, T.; Eskin, D. Effect of surface roughness on corrosion behaviour of low carbon steel in inhibited 4 M hydrochloric acid under laminar and turbulent flow conditions. Corros. Sci. 2016, 103, 196–205. [Google Scholar] [CrossRef]
  34. Toloei, A.; Stoilov, V.; Northwood, D. The relationship between surface roughness and corrosion. In Proceeding of the ASME International Mechanical Engineering Congress and Exposition (IMECE), San Diego, California, USA, 15–21 November 2013. [Google Scholar]
  35. Finger, C.; Stiesch, M.; Eisenburger, M.; Breidenstein, B.; Busemann, S.; Greuling, A. Effect of sandblasting on the surface roughness and residual stress of 3Y-TZP (zirconia). SN Appl. Sci. 2020, 2, 1700. [Google Scholar] [CrossRef]
  36. Poorna Chander, K.; Vashista, M.; Sabiruddin, K.; Paul, S.; Bandyopadhyay, P.P. Effects of grit blasting on surface properties of steel substrates. Mater. Des. 2009, 30, 2895–2902. [Google Scholar] [CrossRef]
Figure 1. Schematic drawing of the sandblasting process used for S235JR steel samples.
Inventions 08 00039 g001
Figure 2. Images of S235JR steel samples for (S1)—S235JR—non-sandblasted, (S2)—S235JR—sandblasted with quartz, (S3)—S235JR—sandblasted with garnet, (S4)—S235JR—sandblasted with alumina: (a) at T1 = at immersion, (b) T2 = after 336 h from immersion time.
Inventions 08 00039 g002
Figure 3. Evolution of free potential of S235JR steel samples immersed in 3.5% NaCl solution for (1) S235JR—non-sandblasted, (2)—S235JR—sandblasted with quartz, (3)—S235JR—sandblasted with garnet, (4)—S235JR—sandblasted with alumina: (a) at T1 = at immersion, (b) T2 = after 336 h from immersion time.
Inventions 08 00039 g003
Figure 4. Evolution of polarization resistance (Rp) of S235JR steel samples immersed in 3.5% NaCl solution for (1) S235JR—non-sandblasted, (2)—S235JR—sandblasted with quartz, (3)—S235JR—sandblasted with garnet, (4)—S235JR—sandblasted with alumina: (a) at T1 = at immersion, (b) T2 = after 336 h from immersion time.
Inventions 08 00039 g004
Figure 5. Evolution of corrosion rate (Vcorr) of S235JR steel samples immersed in 3.5% NaCl solution for (1) S235JR—non-sandblasted, (2)—S235JR—sandblasted with quartz, (3)—S235JR—sandblasted with garnet, (4)—S235JR—sandblasted with alumina: (a) at T1 = at immersion, (b) T2 = after 336 h from immersion time.
Inventions 08 00039 g005
Figure 6. 2D surface profile of surface roughness before corrosion for: (a) S235JR—non-sandblasted, (b)—S235JR—sandblasted with quartz, (c)—S235JR—sandblasted with garnet, (d)—S235JR—sandblasted with alumina.
Inventions 08 00039 g006aInventions 08 00039 g006b
Figure 7. 2D surface profile of surface roughness after corrosion of S235JR immersed during 336 h in 3.5 NaCl solution for: (a) S235JR—non-sandblasted, (b)—S235JR—sandblasted with quartz, (c)—S235JR—sandblasted with garnet, (d)—S235JR—sandblasted with alumina.
Inventions 08 00039 g007
Figure 8. Optical microscopy before corrosion of S235JR for: (a) S235JR—non-sandblasted, (b)—S235JR—sandblasted with quartz, (c)—S235JR—sandblasted with garnet, (d)—S235JR—sandblasted with alumina.
Inventions 08 00039 g008
Figure 9. Optical microscopy after corrosion of S235JR immersed during 336 h in 3.5 NaCl solution for: (a) S235JR—non-sandblasted, (b)—S235JR—sandblasted with quartz, (c)—S235JR—sandblasted with garnet, (d)—S235JR—sandblasted with alumina.
Inventions 08 00039 g009
Table 1. Chemical composition of S235JR steel [%].
CMnSiPSNCuFe
0.171.400.0250.0280.0250.120.45Balance
Table 2. Technical data of sandblasting grits.
Type of Sandblasting GritHardness
[Mohs]
Chemical CompositionShape of ParticlesGrain Size
[mm]
Density
[g/cm3]
Quartz7SiO2: 99%
Fe2O3: 0.2%
Other: 0.8%
rounded, yellowish white0.25–0.60 mm1.63
Red garnet8Almandine: 98%
Ilmenite: 1%
Quartz: 0.5%
Other: 0.5%
angular2.4
Alumina (white electrocorundum)9.2Al2O3: 99.52%
Fe2O3: 0.029%
SiO2: 0.034%
Na2O: 0.26%
Other: 0.16%
angular3.85
Table 3. Physical-chemical parameters of 3.5% NaCl solution before and after the corrosion process.
Parameters3.5% NaCl
before Corrosion Process
S235JR—Non-SandblastedS235JR—Sandblasted with QuartzS235JR—Sandblasted with GarnetS235JR—Sandblasted with Alumina
pH6.73 ± 0.2
Conductivity [mS/cm]42.3 ± 1
Salinity [ppt]26.5 ± 0.5
after Corrosion Process
pH7.11 ± 0.37.96 ± 0.57.88 ± 0.27.80 ± 0.1
Conductivity [mS/cm]43.5 ± 0.543.7 ± 0.943.6 ± 0.643.1 ± 0.3
Salinity [ppt]26.8 ± 0.126.5 ± 0.427.3 ± 0.727.1 ± 0.5
Table 4. The weight loss of the S235JR steel samples for S235JR—non-sandblasted, S235JR—sandblasted with quartz, S235JR—sandblasted with garnet, and S235JR—sandblasted with alumina during 336 h from immersion time.
ParametersSample Code
S235JR—Non-SandblastedS235JR—Sandblasted with QuartzS235JR—Sandblasted with GarnetS235JR—Sandblasted with Alumina
W1 [g]6.0982 ± 0.0035.9829 ± 0.0095.4550 ± 0.0065.4520 ± 0.002
W2 [g]6.0875 ± 0.0025.9630 ± 0.0075.4394 ± 0.0035.4393 ± 0.001
S [m2]0.0529 ± 0.003
t [h]336
K87.600
ρ [g cm−3]7.87
Δw [g/m2 h]6.07 ± 0.03 × 10−41.11 ± 0.06 × 10−38.77 ± 0.04 × 10−47.14 ± 0.02 × 10⁻⁴
CR [mm year−1]0.067 ± 0.0040.124 ± 0.0090.097 ± 0.0050.074 ± 0.003
Table 5. Roughness parameter values for the tested surfaces before and after the corrosion process.
ParametersSample Code
before Corrosion Process
S235JR—Non-SandblastedS235JR—Sandblasted with QuartzS235JR—Sandblasted with GarnetS235JR—Sandblasted with Alumina
Ra [µm]0.856 ± 0.015.548 ± 0.054.039 ± 0.023.749 ± 0.01
Rq [µm]1.068 ± 0.16.805 ± 0.25.209 ± 0.44.826 ± 0.2
Rz [µm]4.652 ± 0.331.723 ± 0.925.732 ± 0.525.291 ± 0.7
after Corrosion Process
Ra [µm]1.153 ± 0.035.065 ± 0.033.642 ± 0.013.349 ± 0.02
Rq [µm]1.422 ± 0.56.452 ± 0.64.881 ± 0.44.360 ± 0.3
Rz [µm]6.894 ± 0.129.812 ± 0.325.571 ± 0.124.448 ± 0.5
Disclaimer/Publisher’s Note: The statements, opinions and data contained in all publications are solely those of the individual author(s) and contributor(s) and not of MDPI and/or the editor(s). MDPI and/or the editor(s) disclaim responsibility for any injury to people or property resulting from any ideas, methods, instructions or products referred to in the content.

