1. Introduction
Nowadays, renewable energy sources (RES) have been the major providers of power generation worldwide. As reported by the BP Statistical Review of World Energy [
1], renewable energy production increased by about 15% in 2021, with wind and solar contributing more than nuclear energy in power production for the first time ever. Wind energy is the prevalent RES among them, but in order to have a future, the environmental conditions, such as dust, rain, hailstorm, ice, salt spray and even through insect contamination, must be taken into serious consideration, since they affect not only the power output but also the lifespan of horizontal axis wind turbines (HAWT).
Bech et al. [
2] conducted rain erosion tests (RET) to study the effects of drop sizes in a commercial topcoat used in HAWT blades and they estimated the lifespan of a 15 MW HAWT at various meteorological conditions. They concluded that as the droplet size increases, the lifespan of HAWT due to erosion decreases. Hasager et al. [
3] predicted the lifespan of HAWTs located in Denmark and found out that the HAWTs operating in locations with higher frequency of heavy rain had four times shorter lifespan. Verma et al. [
4] developed a fluid–structure interaction (FSI) computational model to predict rain droplet impact on HAWT blades for conditions from light to very heavy rainfall. Their study revealed that the blade coating damage, which has a direct effect on the HAWT power output, is more severe for larger droplets and higher droplet impact angles. Small particles, such as sand particles, that are contained in the airflow can be transferred high to the wind turbine rotor. Since these particles impact the blades, the surface roughness is increased, in particular, at the leading edge, close to the stagnation point [
5].
The effect of icing has been studied in depth, both for aviation [
6,
7,
8] and wind turbines [
9,
10,
11,
12,
13,
14,
15], as a wide variation of icing-related issues have been observed, including not only reduced power output but also damage to or failure of these machines. Research into the effect of icing in aviation has a long history. The first successful iced flight experiment was carried out by Preston and Blackman [
6] in 1948. They observed that in icing conditions the aircraft was practically uncontrollable, due to the increase in drag coefficient, which reached 81%. Another similar study was conducted by Leckman [
7]. He evaluated the performance characteristics of light aircraft, using limited flight data, and the results revealed that the drag coefficient increases significantly due to ice presence. A recent systematic literature review by Cao et al. [
8] concluded that knowledge of the serious effects of aircraft icing has not been spread, which has led to many air crashes caused by icing. These air crashes could have been prevented if the necessary attention had been paid.
Sunden and Wu [
9] reviewed the formation of ice and the de-icing techniques applied in HAWTs, and it was clearly indicated that wind speed and air temperature are the most important parameters that affect the accumulation of ice. Davis et al. [
10] developed a statistical model to predict the degradation of the HAWT power output due to ice. Sundaresan et al. [
11] experimentally studied the aerodynamic performance of HAWT airfoils under icing conditions and confirmed that the aerodynamic characteristics of the airfoils degrade due to ice. Recently, Yang et al. [
12] predicted numerically the aerodynamic performance of a 5 MW offshore floating HAWT under icing conditions, and they estimated that the power output of a certain HAWT under these hazard conditions was about 17% lower. Their results agree well with corresponding results from Blasco et al. [
13] who reported that the power output of a 1.5 MW HAWT operating in icing events can be degraded by 16% up to 22%. Li et al. [
14] and Tagawa et al. [
15] computationally investigated the effect of ice roughness on the aerodynamic efficiency of HAWT blades, constructed by NREL S809 and NACA 0012 airfoils, respectively. They agreed that the aerodynamic performance is reduced due to ice roughness.
Recently, Contreras Montoya et al. [
16] reviewed the current methodologies for the estimation of wind turbines power loss when subjected to severe environmental conditions. They concluded that the annual power output is related to the severity and the probability of icing occurrence. In general, power output was found to be decreased by 8% to 30% under icing conditions.
Several researchers have investigated the effect of blades roughness on the efficiency of wind turbines. The first serious discussion and experiment study about this topic emerged in 2007 by Khalfallah and Koliub [
17]. They examined the mechanisms of dust stacking on a blade, and they agreed that the power output of a HAWT is degreased in dusty environments and the severity to which roughness influences the efficiency of the HAWT is related to the airfoil type, the Reynolds number, and the roughness magnitude, in relation to the boundary layer thickness. Much of the current literature pays particular attention to airfoils surface roughness, since these experiments and/or numerical analyses are cheaper and easier to conduct.
Until now, numerous studies have been conducted on the effects of roughness on the airfoil aerodynamic performance, mainly focusing on roughness at the leading edge, which indicated that the aerodynamic performance degrades. Herring et al. [
18] reviewed the protection techniques used by industry against leading edge erosion of HAWT blades. Han et al. [
19] studied with the commercial CFD code Star-CCM the effect of roughness on the aerodynamic characteristics of NACA 64-618 airfoil and estimated that the annual energy production of a HAWT could be reduced by up to 3.7%. Pires et al. [
20] conducted an experimental study with NACA63
3-418 airfoil, both in a wind tunnel and in a HAWT blade, and found out that the surface roughness results in increased drag and decreased lift and that the aerodynamic degradation is more intense as the roughness height is increased and the eroded area is expanded. The results from their research agreed well with the results by Brumby [
21]. To better understand the mechanisms of aerodynamic degradation due to roughness, Zhang [
22] also experimentally studied the low Reynolds number (Re) GA (W)-1 airfoil with leading edge roughness. He reported that the most critical factor for the aerodynamic degradation and the stall occurrence is the height of the roughness. In 2016, Zidane et al. [
23], for the first time, reviewed studies about the effects of surface roughness on HAWT efficiency, and they concluded that so far there are only a few studies in the literature about the effect of blades surface roughness on HAWT output. Moreover, it is now well established from a variety of studies that the airfoil sensitivity to surface roughness depends on Reynolds number (Re) and on the angle of attack (aoa). In particular, the airfoil is more sensitive to surface roughness as Re decreases and as aoa increases.
Several studies have been carried out regarding the roughness and geometry change of an airfoil subjected to erosion due to the presence of sand particles [
24,
25]. Furthermore, existing turbulence models have been extended and new methods have emerged to predict the aerodynamic effects of roughness in an airfoil [
26], and new computational models have been proposed to predict the reduced efficiency of HAWTs when operating in dusty environments [
27]. In addition, the sensitivity of different airfoil sections operating in such environment has been studied, and it has been found that the sections whose surface is less sensitive perform better [
28].
Additionally, research has been carried out on the influence of air–sand particle flow on the aerodynamic performance of airfoil, used in wind turbines, with the discrete phase model (DPM), examining different sand particle sizes and various sand concentration in the air. Zidane et al. [
29] studied the aerodynamic degradation of NACA 63-415 airfoil under light and heavy sand storms that are usual in Gulf and southern African countries. The airfoil operates at Re = 460 × 10
3 and at aoa from 0° to 10°, and the results showed that lift coefficient is reduced up to 28%. Douvi et al. examined the aerodynamic behavior of NACA 0012 [
30] and NREL S809 [
31] airfoils at Re, ranging from 1 × 10
6 to 2 × 10
6 and for various concentrations of sand particles in the air. The analysis of the results showed that independent of the airfoil type and Reynolds number, the degradation increases for higher aoa and increases the concentration of sand particles in the air. Khakpour et al. [
32] studied the effect of particle diameter, the sand/air mass flow rate and drift velocity on the aerodynamic performance of S819 airfoil in dry dusty environments. The aerodynamic degradation was more intense at higher aoa for small particles and at aoa = 0° for coarse particles and for higher values of sand/air drift velocity. In addition, numerous studies have been conducted on the effect of rainfall on the aerodynamic behavior of airfoils, both experimentally [
33,
34,
35] and computationally [
36,
37]. Early examples of research into aerodynamic degradation of airfoils operating under rainfall include the experimental study of NACA 64-210 airfoil under various rainfall conditions [
33] in order to show the airplane behavior in rain by lift and drag. The surface water characteristics for the same airfoil were also examined [
34]. NACA 0012 airfoil behavior operating at low Re and under various rainfall conditions and various droplet sizes was also studied experimentally and computationally [
35]. DPM model was used for the simulation of rain in the flow field around the NACA 0012 airfoil [
36,
37]. Researchers agree that under rainfall conditions, the aerodynamic performance of airfoils degrade. It was also apparent from the computational studies that bigger droplets were more likely to break up than smaller droplets and that they generally broke up close to the airfoil, where high pressure gradients exist.
Using computer code, rainfall conditions over wind turbines have been simulated, and it was found that with increasing rainfall intensity the efficiency of a wind turbine decreases. In 1985, Corrigan and DeMiglio [
38] developed a code based on blade element momentum (BEM) method to estimate the effect of rain on HAWT performance. They modified the NACA 23024 airfoil aerodynamic characteristics to include the effect of rain in their calculations, and they estimated a 31% efficiency loss at moderate rainfall and high wind speeds. Recently, Douvi et al. [
39] simulated three different rainfall conditions over a HAWT and concluded that the power coefficient of the HAWT was 10.8% to 22% lower under rainfall, depending on the rainfall rate.
Moreover, researchers attempted to evaluate the power degradation of wind turbines due to the presence of insects. Corten and Veldkamp [
40] tried to explain the unexpected variations in power output levels in California, where, for no obvious reason, the performance of HAWTs operating in high-wind conditions can be reduced, causing losses of up to 25%. They experimentally investigated the flow field over the blades by using a flow-visualization technique, and they found out that insects, which are adherent to the leading edge during the previous periods of low winds, are responsible for this phenomenon.
More recent attention has focused on the influence of hailstorms on the aerodynamic performance of a HAWT [
41] by not only reporting the power degradation, which was estimated to be, for wind speeds of 10 m·s
−1 and 15 m·s
−1, 6.4% and 3.0%, respectively, but also the entire flow field characteristics over a three-bladed HAWT rotor. In hailstorm conditions, the wake appeared to diminish faster, and the hailstones and the water droplets accumulated close to the hub, on the pressure side of the blade.
Although there are plenty of studies relative to the effect of dust on the HAWTs, they remain narrow in focus, dealing only with the effect of roughness on the aerodynamic performance of the airfoils used for the construction of blades. What is not yet clear is the impact of sand particles on the entire flow field over the HAWT rotor. This study aims to contribute to this growing area of research by examining the entire flow field and understanding the link between the operation of wind turbines under hazard conditions. Six different cases were studied, in particular, three different sand particles concentrations in the air, i.e., 1%, 5% and 10%, for wind speeds of 10 m·s−1 and 15 m·s−1 each.
The findings from this study in conjunction with the results from our previous study [
41] will be expected to contribute significantly to the understanding of aerodynamics of HAWT operation in hazardous conditions. The computational study discussed in this paper is one of the first studies of the whole flow field over a HAWT operating in a dusty environment. The results of this study offer a framework for recommendations for the design and manufacturing of wind turbine blades for HAWTs located in areas with dust.
2. Computational Modelling Method
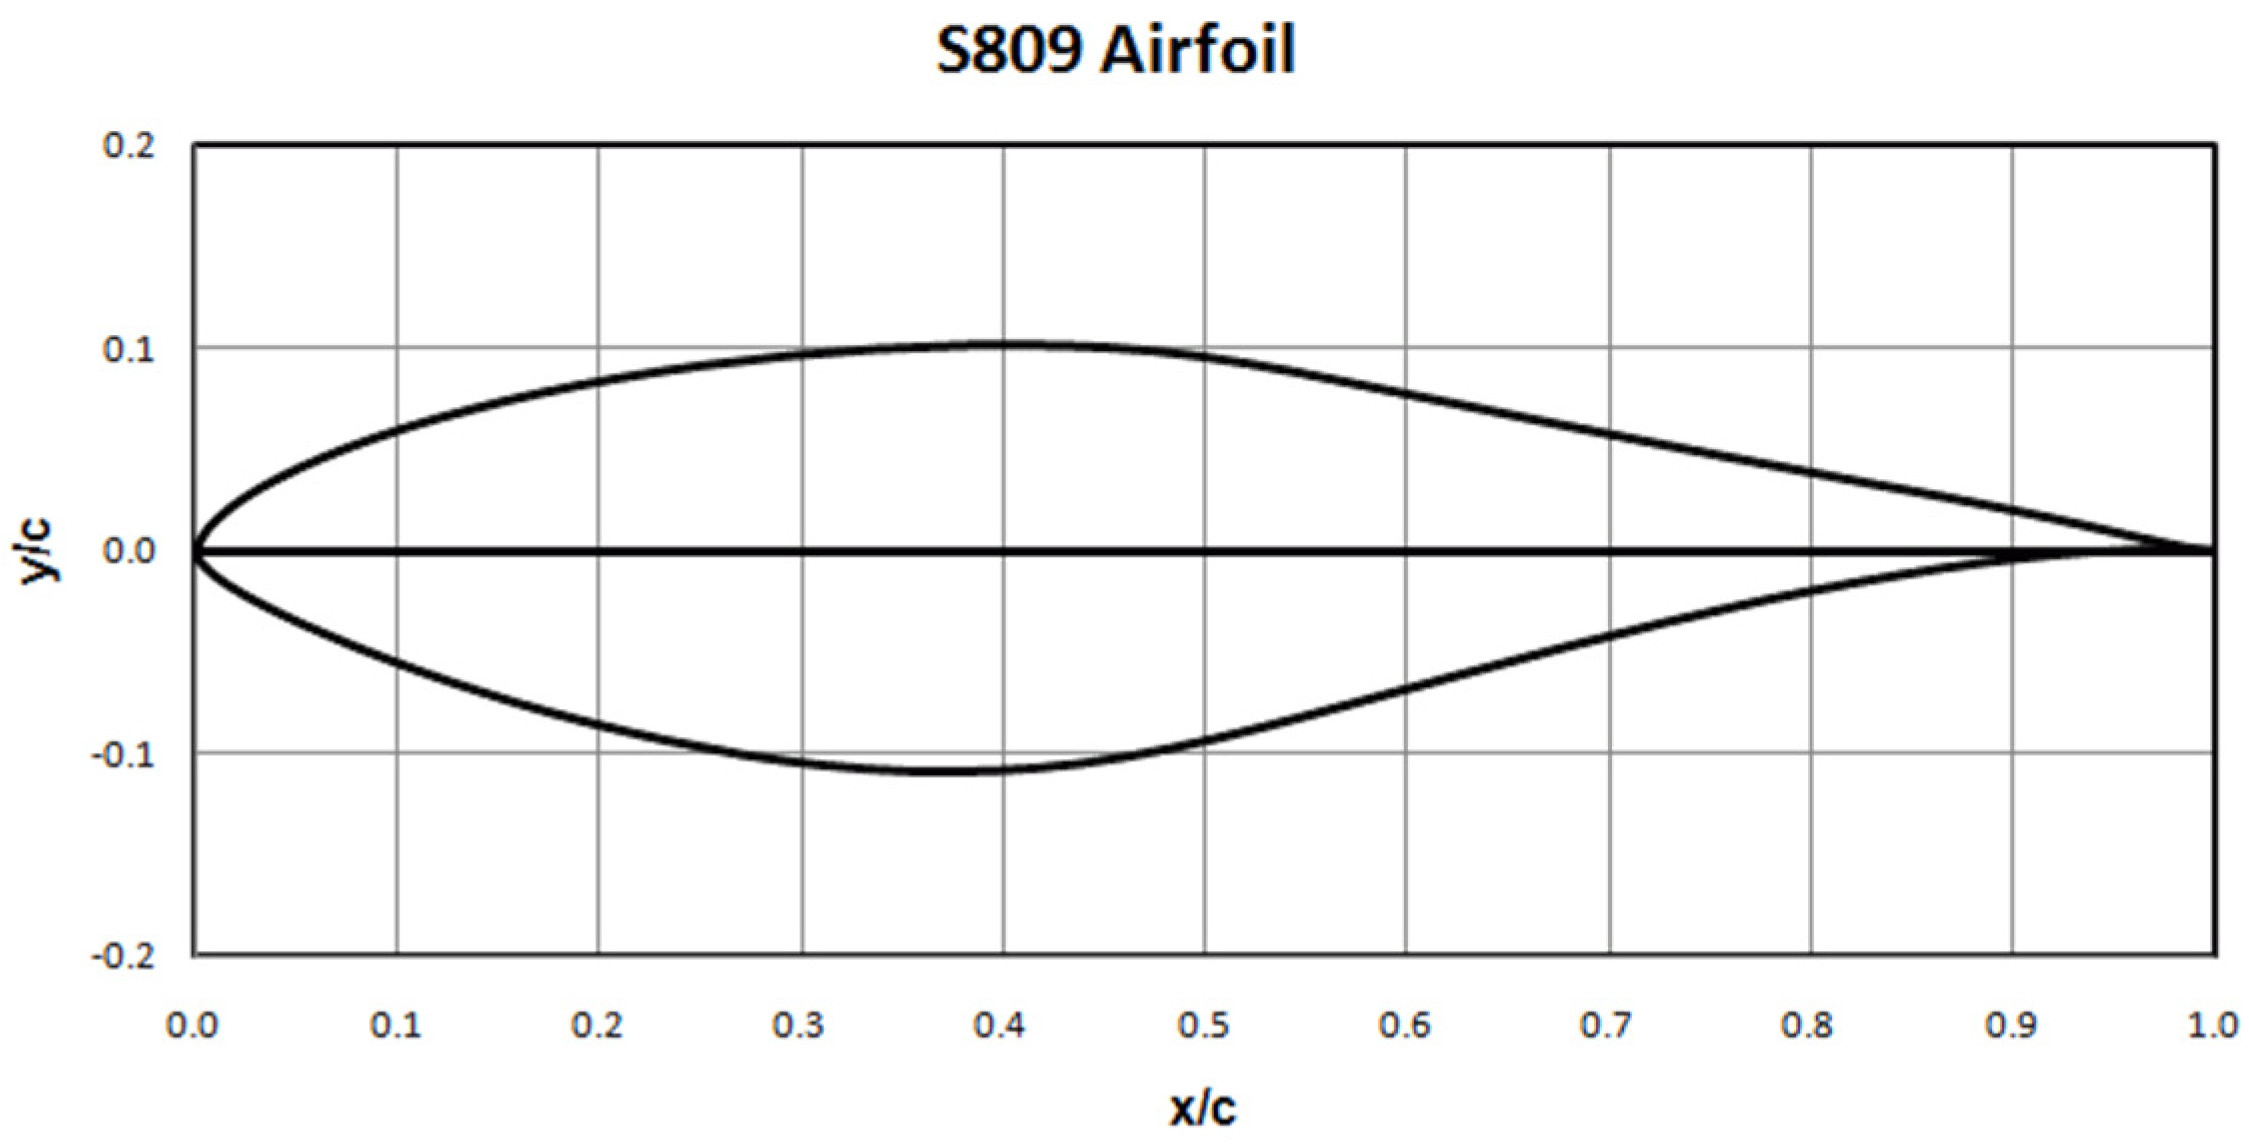
The preliminary stage in the creation of the 3D model is to identify the optimum blade geometry of the three-bladed HAWT. The airfoil for present study was the NREL S809 airfoil (
Figure 1), and it was selected given it had been particularly designed for horizontal axis wind turbine blades, and it was extensively used in their manufacture. Somers [
42] theoretically studied and experimentally tested the S809 airfoil, an airfoil of 21% maximum thickness and 1% maximum camber at 21% and at 39.5% of the chord length, respectively. The key features of S809 airfoil, which make it suitable for HAWT blades construction, are that (i) it produces less peak lift and less drag than other airfoils and (ii) it is less sensitive to the leading edge roughness.
The next step of the blade geometry design was the estimation of the chord length and the twist along the optimum blade geometry. Optimal geometry was defined as the distribution of chord length and twist along the length of the blade in order to achieve maximum rotor efficiency. The user-friendly application TTBEM [
44,
45] was applied in which the required features of the HAWT rotor were inputted by the user, such as the number of blades; the blade length (L), which was chosen to be equal to 40 m; the airfoil from which the blades are made characteristics; the tip speed ratio (TSR = 6); and the speed and density of the wind. The values that were entered in the TTBEM application are summarized in
Table 1. The numerical code of this application is based on a well-known BEM method, proposed by Glauert in 1927 [
46]. TTBEM was first proposed for tidal turbines, but it can be implemented for HAWTs as well.
According to BEM method, the rotor blades of the HAWT were divided into N elementary sections along their length and then the flow field around each elementary section, named blade element, was analyzed. The control volume was considered to be a stacked ring with radius r and thickness dr. In this method, it is assumed that the flow in each ring is independent of the flow in adjacent rings. Moreover, the generated thrust in the blade element with length dr was equated to the variation in the momentum of the fluid in the corresponding flow tube, formed by this part of the blade and with surface area 2π·r·dr. On each blade element, an initial determination of the chord length and twist angle was performed. An iterative loop was then carried out on each element, based on the torque and thrust produced by the element, until the values of the axial and angular induction coefficients converged. Equations (1) and (2) were used for the calculation of axial and tangential momentum for each blade element, respectively.
and
are thrust and torque for each element, respectively,
is air density,
is wind speed,
and
are axial and angular induction factors,
is radial position along the blade and
is angular velocity. Knowing the blades number, B, the aerodynamic lift and drag coefficients of the airfoil,
and
, the twist angle,
, and the chord length,
, the normal force,
, and the torque,
, can be calculated.
BEM method was applied for each independent control volume in which the blade had been discretized and was terminated when the total number of control volumes comprising the blade was completed. When the solution was converged, the distribution of the tangential and vertical force on the blade was obtained, and so was the chord length and the twist angle at each blade element, as well as the HAWT power output and power coefficient.
TTBEM allows the user to study any blade geometry by simply inputting certain airfoil aerodynamic characteristics, particularly lift and drag coefficients at aoa, where lift-to-drag ratio obtains its highest value. Another advantage of TTBEM application is that different airfoil sections can be considered for the optimum blade geometry calculation.
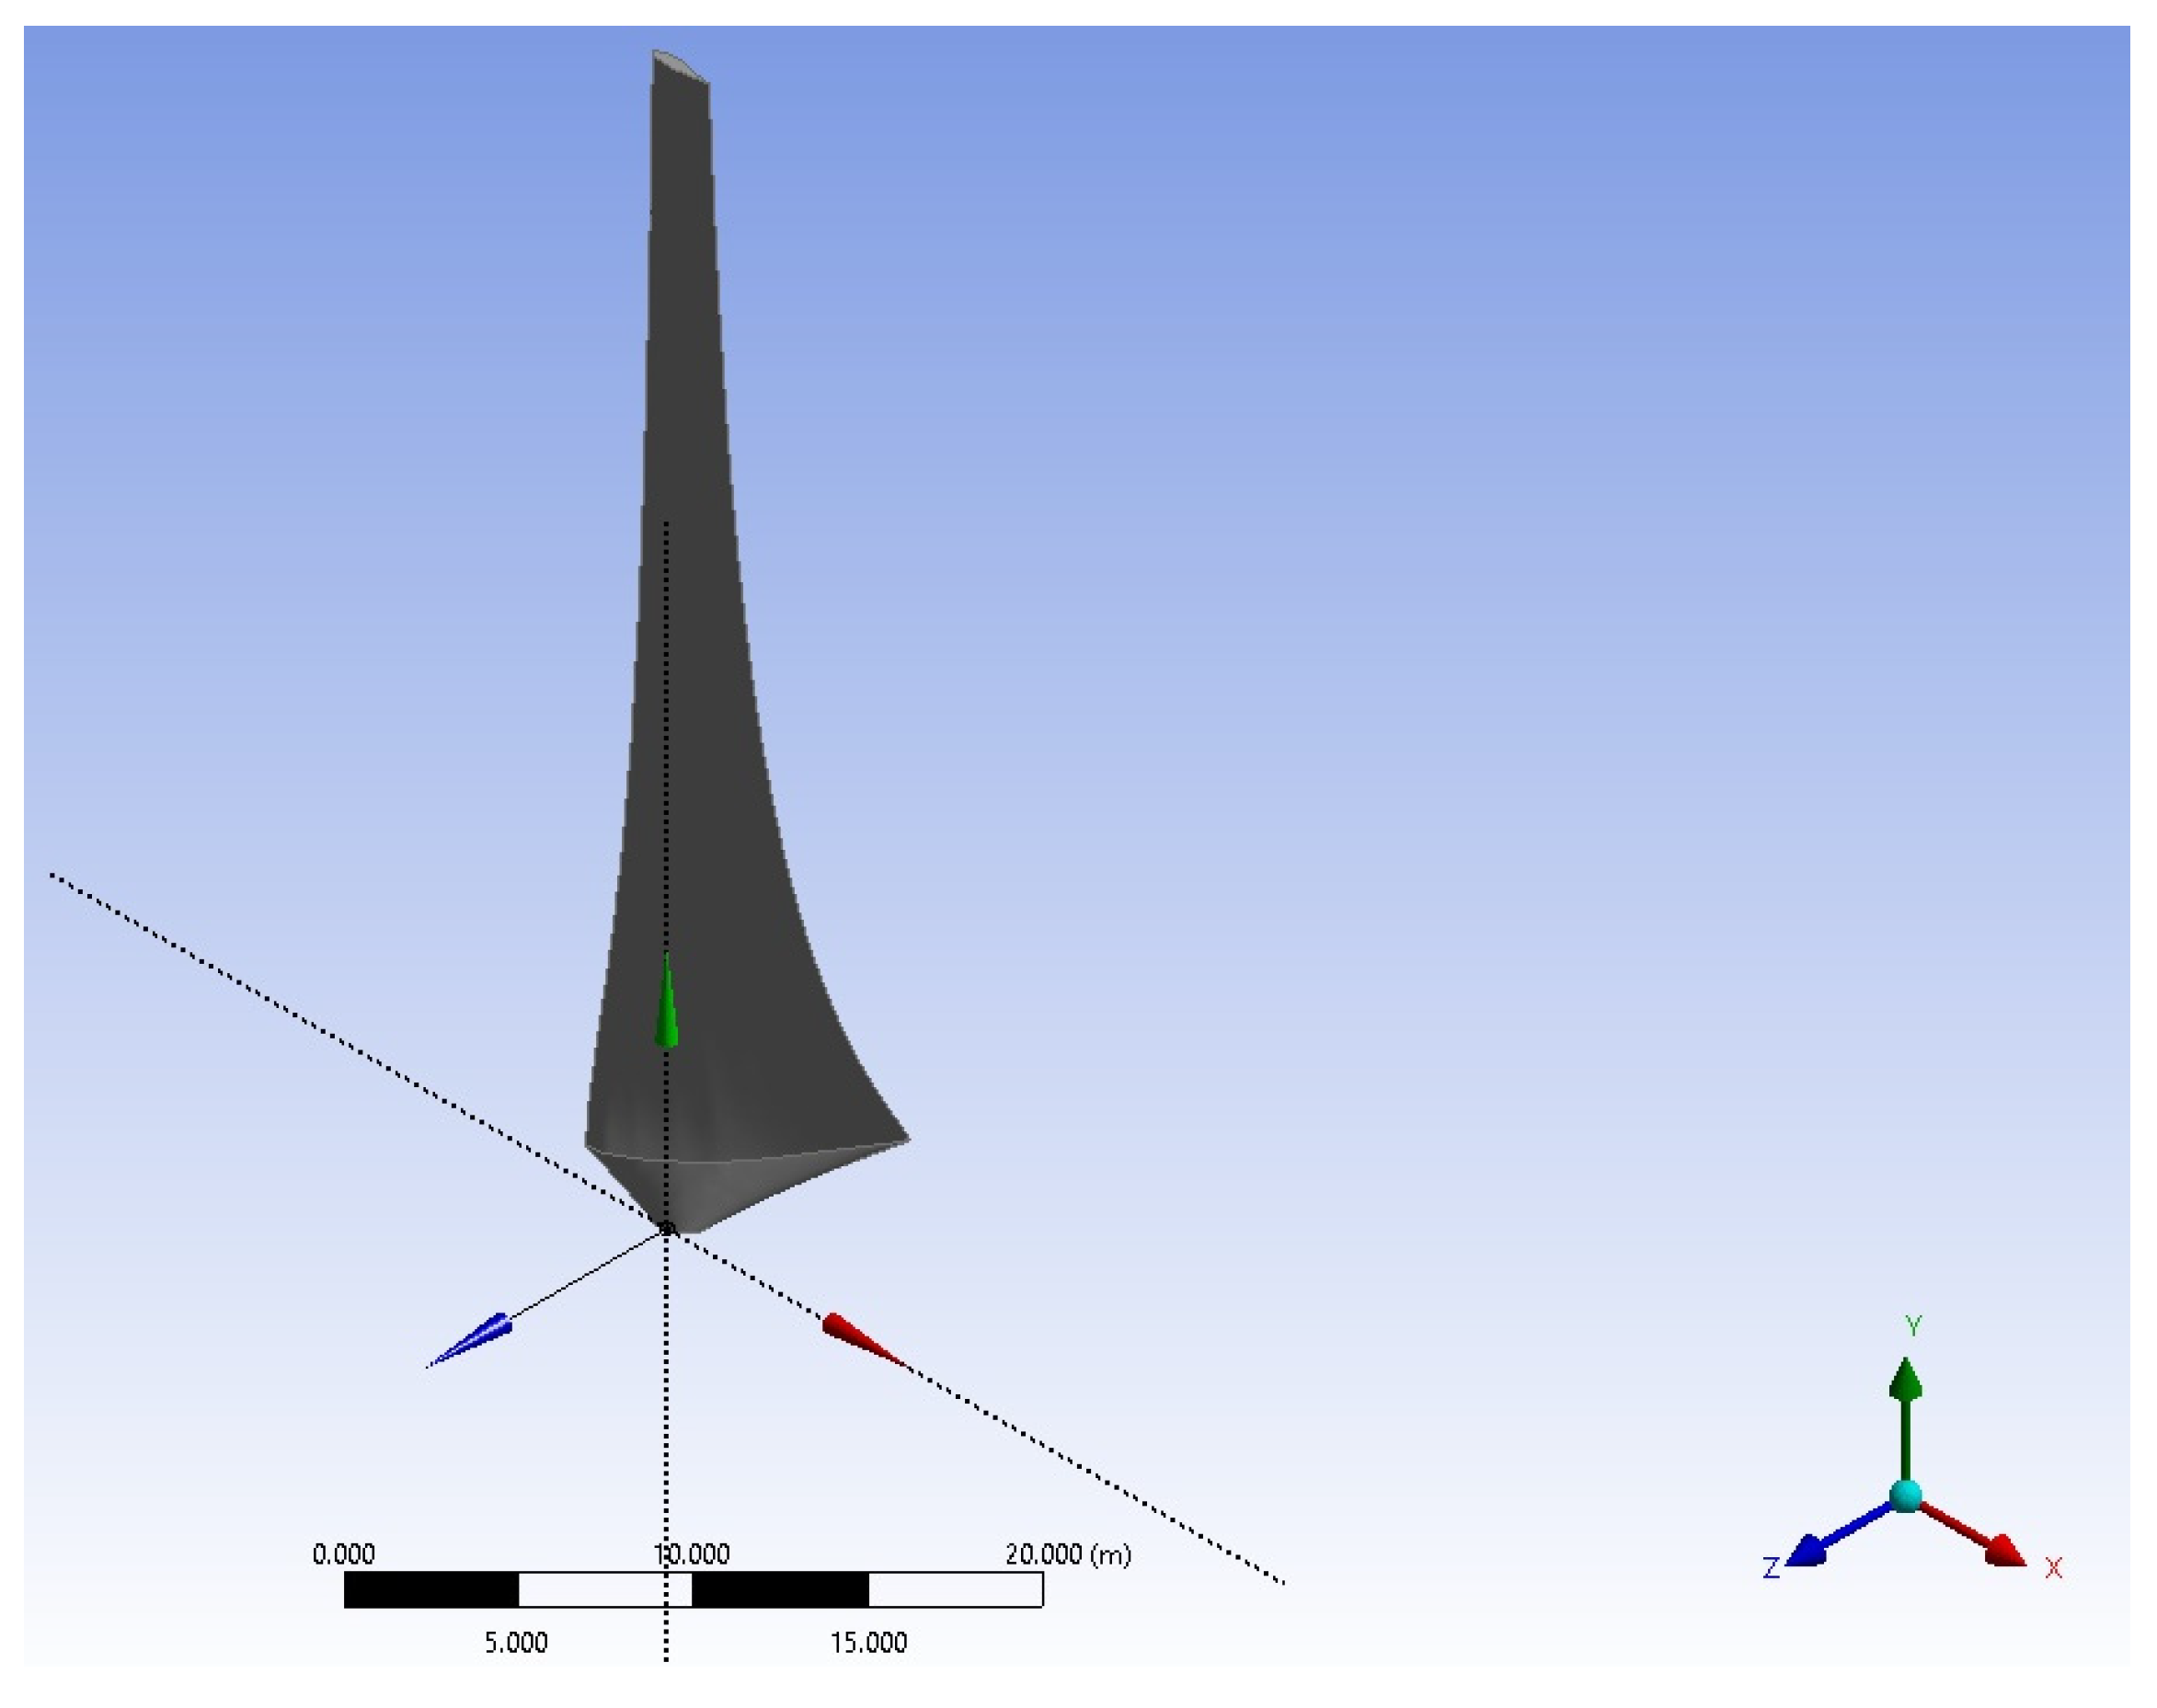
The opensource software QΒlade [
47] was then used to design the three-dimensional blade with the optimum characteristics obtained by TTBEM (
Table 2), which was finally imported into ANSYS 16.0 DesignModeler [
48], where the necessary computational field around the blade was created. To reduce computational time and memory, periodicity of 120° around a single blade was applied. Hsu and Bazilevs [
49] simulated a full-scale geometry of a three bladed HAWT and confirmed that the aerodynamic loads on each blade are identical, so periodic boundary conditions can be applied when studying HAWT rotors, without any introduced implications of this boundary condition. Since the tower and the hub did not affect the aerodynamic behavior of rotor, they were not included in the simulation.
Figure 2 demonstrates the optimum blade design.
The computational field, i.e., the area of interest surrounding the blade, was one-third of a horizontally placed cropped cone. The radius of the front side was L and was placed 0.75·L upstream the blade. The rear side of the cropped cone radius and position downstream of the blade was 2·L. Several computational domain dimensions were studied, and the above-mentioned dimensions were the most suitable for current study, since it was found that they do not influence the results and, at the same time, the required computational time is reduced.
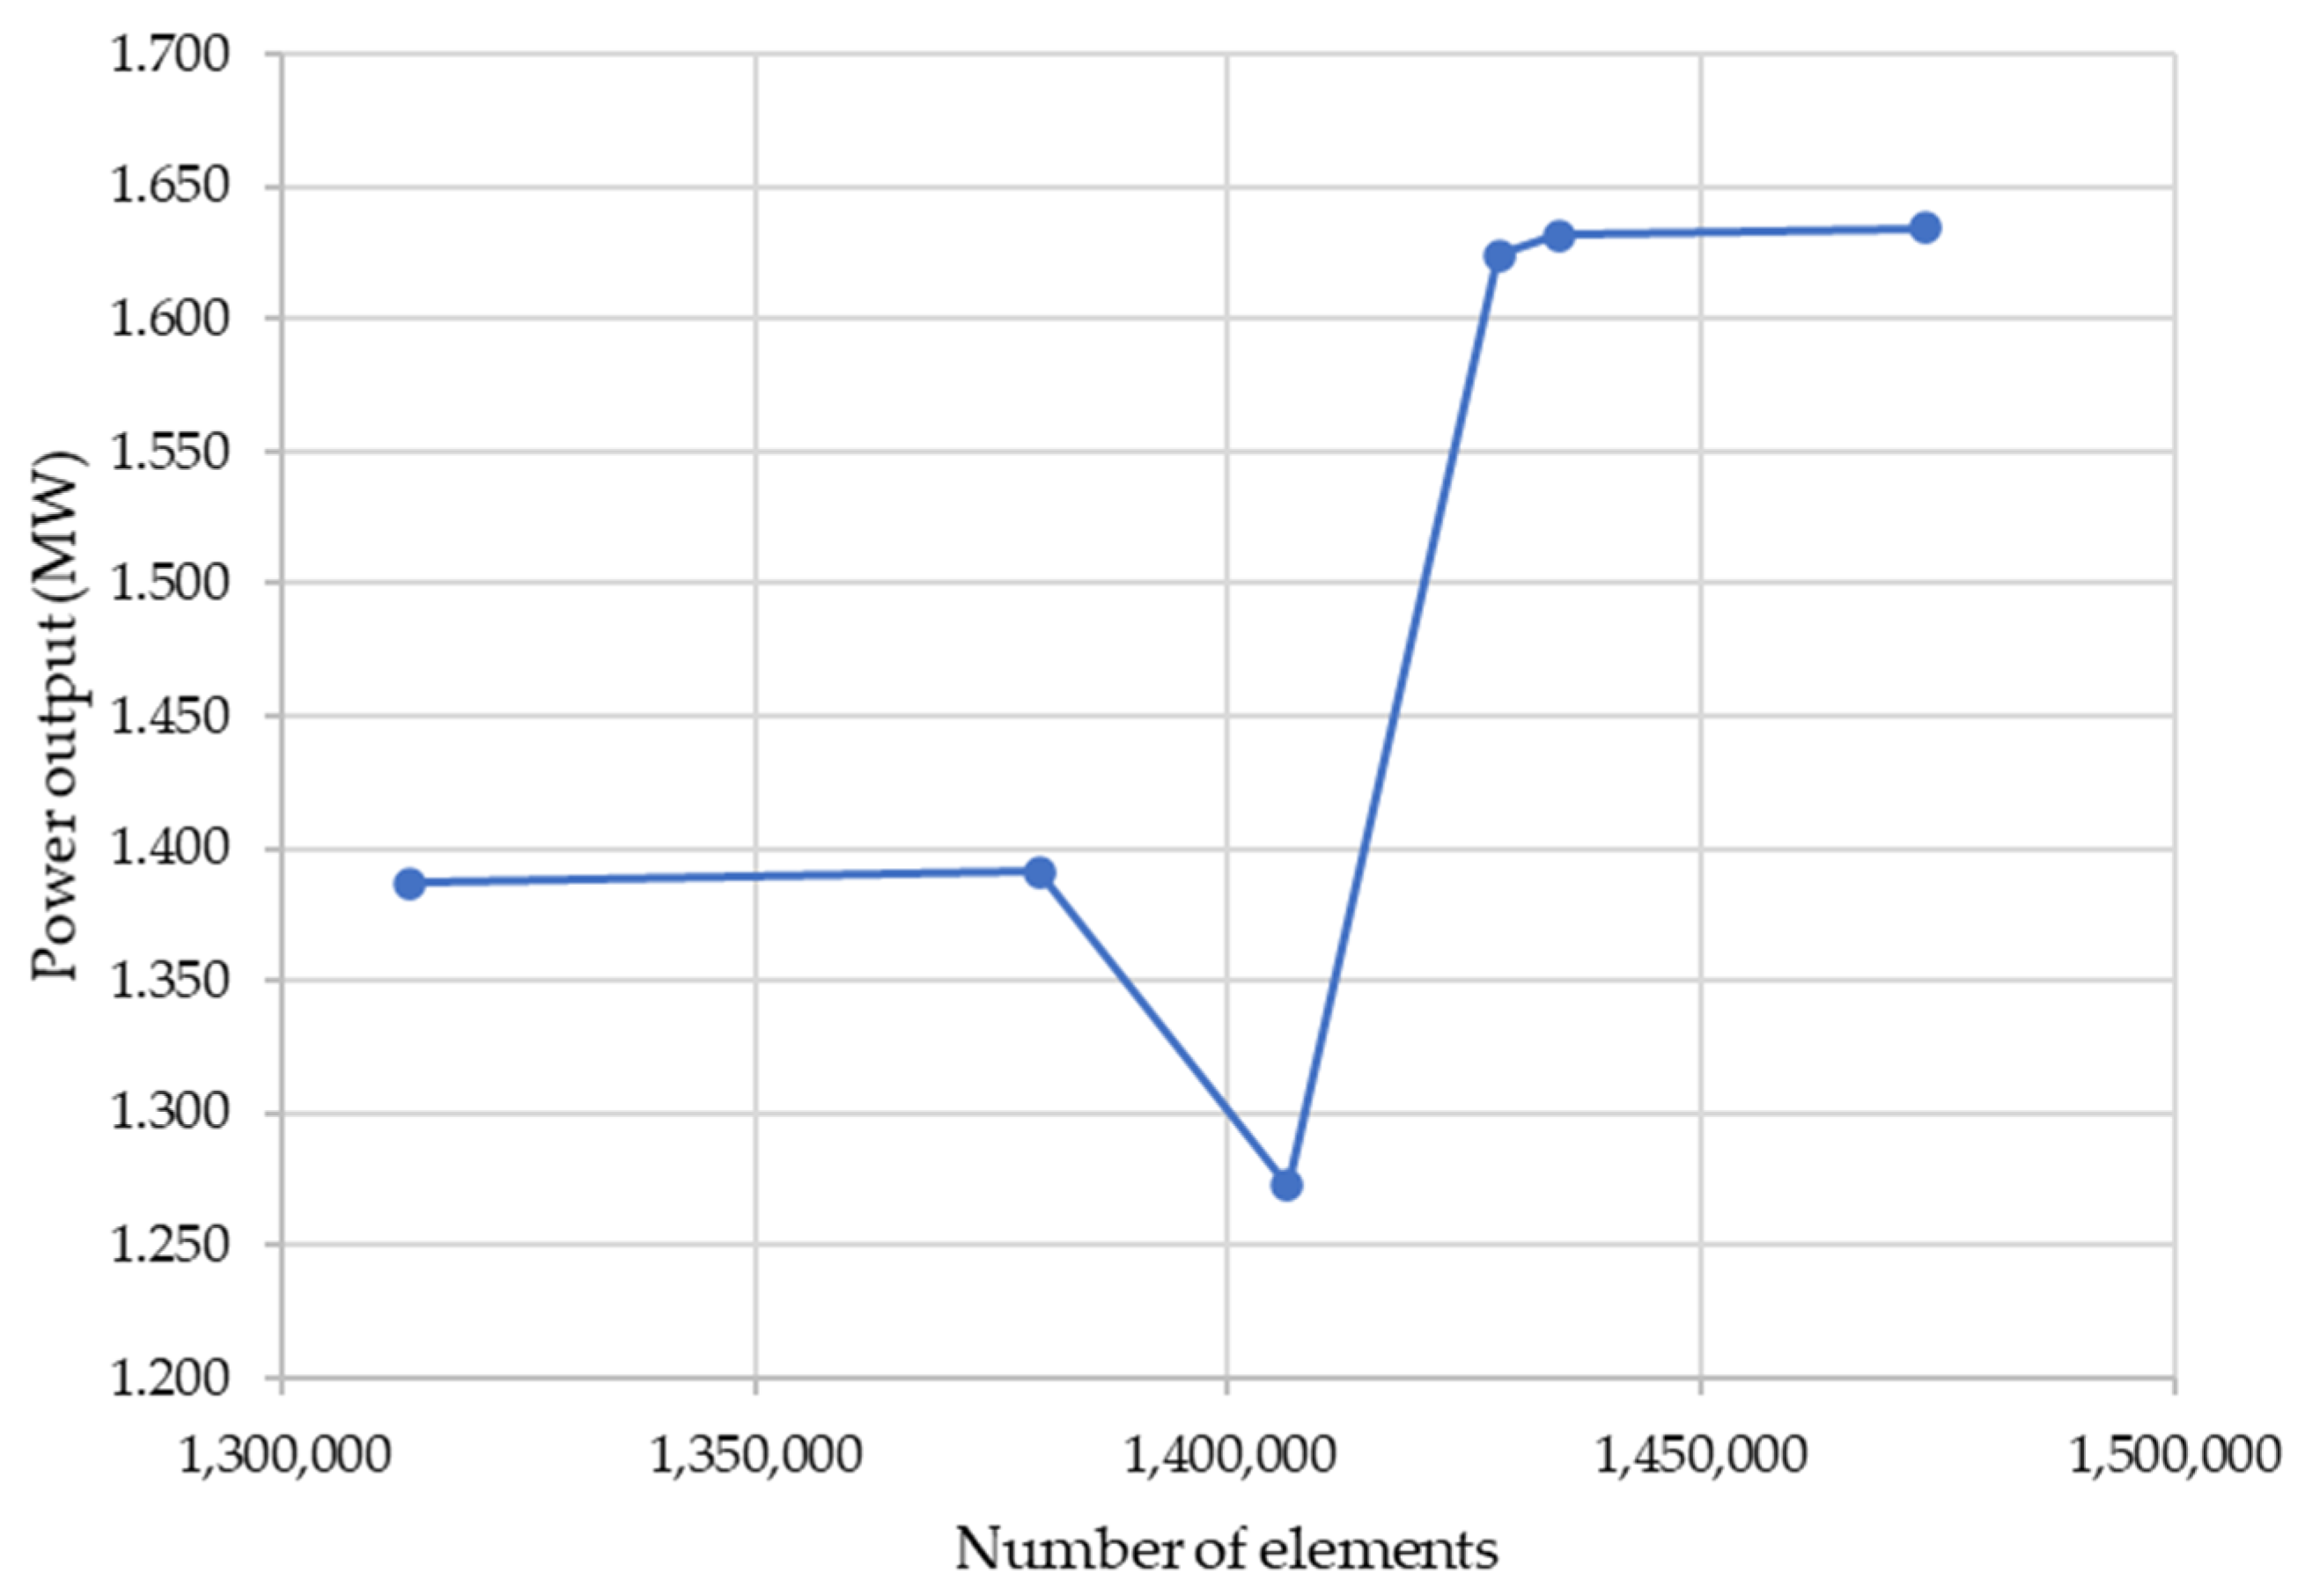
The subsequent stage of computational procedure is mesh generation and boundary conditions determination. From the grid independence study, it was concluded that a grid of about 1,435,000 cells is the most appropriate.
Table 3 and
Figure 3 show a representative sample of several meshes studied during the grid independence study. The power output of the HAWT was estimated and it was clear that M5 mesh quality does not affect simulation results. M5 and M6 accounted for nearly 0.15% difference in the estimated power output and the required computational time for M6 was greater, so M5 was selected for the simulations.
The obtained results also agreed well with the predicted power output by TTBEM [
44,
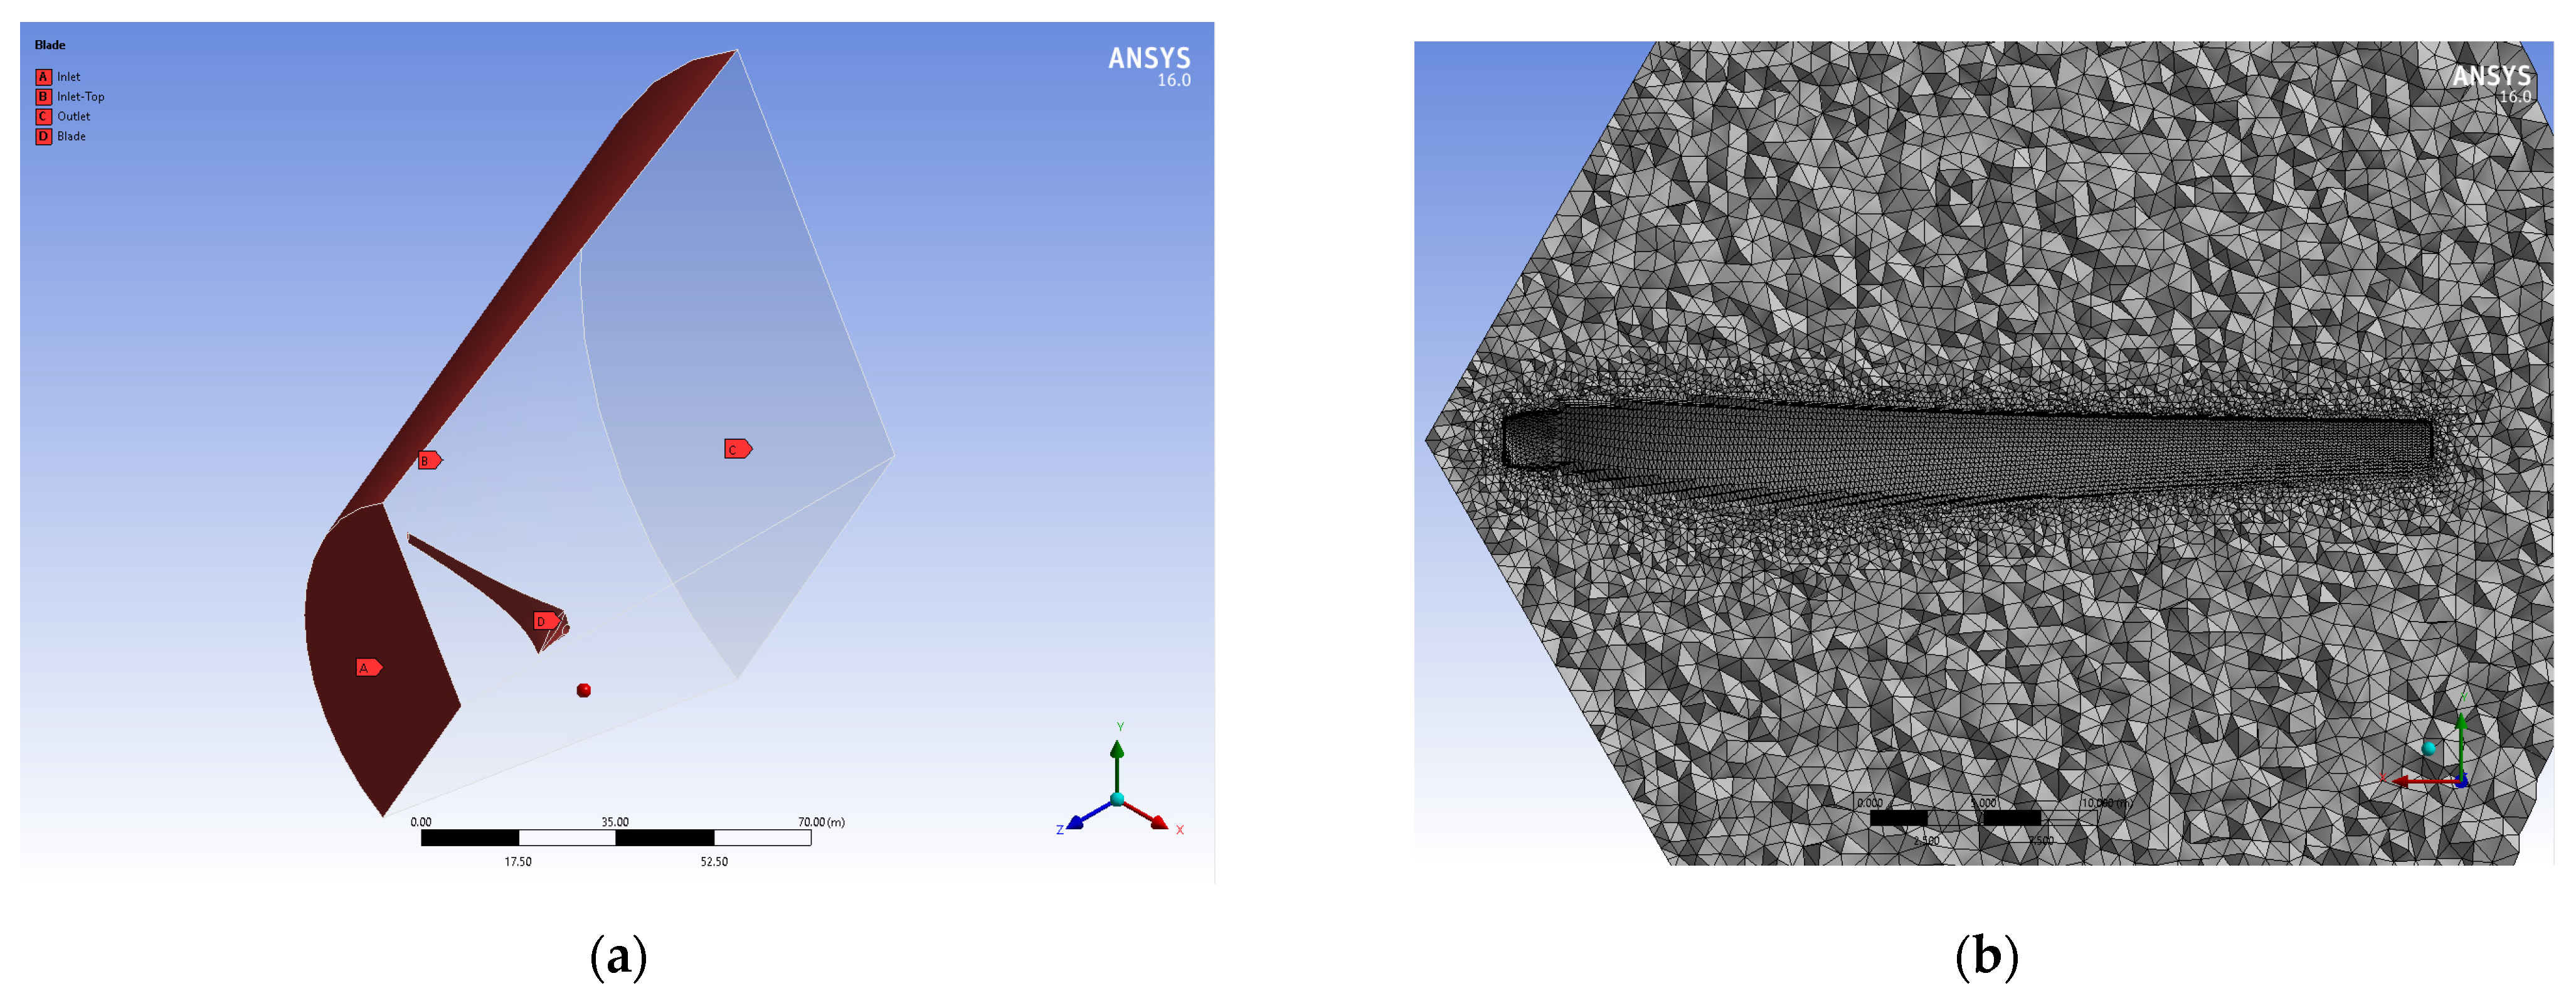
45]. The grid was hybrid, consisting of tetrahedral cells close to the blade surface and hexahedral cells in the rest computational domain. Inflation was added over the blade in order to ensure fine meshing near the wall, with y+ < 5. The mesh was densified towards the blade, where more severe fluctuations in flow were caused by blade’s existence, to achieve a better approach to the flow field. According to the boundary conditions, the upstream and the sideways sides of the computational domain were defined as the velocity inlet and the downstream side as the pressure outlet.
Figure 4 shows in detail the boundary conditions, the computational domain, and the mesh to the area close to the blade.
In the table, 10 m·s−1 and 15 m·s−1 were simulated to indicate the impact of wind speed on the HAWT performance in dusty environment. Initially, air flow over the blade was simulated and afterwards it was simulated with the dust conditions, so that along with the power output, the whole flow field could be compared and discussed. The blade surface was considered to be smooth in order to find the regions where dust was dissipated and erosion occurred.
Moving reference frame (MRF) model was activated in ANSYS Fluent 16.0 [
48] for simulation of blades rotation and SST k-ω turbulence model [
50] for simulation of turbulence. Governing flow equations for rotation of the blades were solved in a moving reference frame, regarding which the flow was assumed to be constant as time passed. This was accomplished by specifying certain air zones as moving parts when the MRF model was activated and by including the acceleration terms from the conversion of the inertial to a rotating frame in the equations of motion. The SST k-ω turbulence model is the most appropriate for these kinds of problems because it is capable of precisely estimating adverse pressure gradient flows.
The DPM was used for the injection of dust, in other words spherical sand particles, in the air flow field. The air–sand particle flow is a dilute pneumatic separated flow, in which the air velocity is sufficient to carry the particles in suspension and simultaneously the particles are fully mixed with the air over the entire flow field. The mass concentrations of sand particles in the air, Q, used in the computational study were 1%, 5% and 10%, and the sand particles were assumed to be spherical with diameter of 0.5 mm and density of 2196.06 kg·m
−3, which were considered as medium-to-coarse sand [
51].
To save as much computational time as memory, the sand particles were introduced into the flow from an orthogonal area located at the min. distance upstream from the blade, where the flow remained undisturbed. The insertion of the particles on the horizontal axis was accomplished with initial velocity identical to the wind speed and on the vertical axis the same as the free fall velocity. The free fall velocity of solid sand particles was calculated by equations, which were solved using an approximate method [
52]. Initially, the free fall velocity was calculated by Equation (5):
where
is the diameter and
and
the density of sand particles and fluid, i.e., the air,
the gravitational acceleration, and
the drag coefficient, which is in the transition range, where
is equal to:
with the relevant Reynolds number given by Equation (7):
where
is the kinematic viscosity of the fluid. In
Table 4, the air and sand solid particles properties are presented.
3. Results
The degradation of HAWTs aerodynamic performance when operating in dusty conditions was determined by examining its behavior under air flow conditions in the initial stage and subsequently under dusty conditions. Since the present model is impractical to be validated due to the absence of relevant experimental data, the yield results were verified against the power output of commercial HAWTs from Vestas and United Energies with an identical rotor diameter and at a wind speed of 10 m·s
−1 [
53] (
Table 5).
The power output in MW of the present model, estimated by TTBEM [
44,
45] and by ANSYS Fluent 16.0 [
48] for clean air, is shown in
Table 6. From the calculated results, it is clear that the results between the two applications agree well and that the power output increases expeditiously as the wind speed increases. The power output of the present model operating in a dusty environment and its percentage degradation is presented in
Table 7. The power output values indicate that the presence of dust in the air can degrade the efficiency of the wind turbine and degradation is more severe as additional particles are inserted in the flow field.
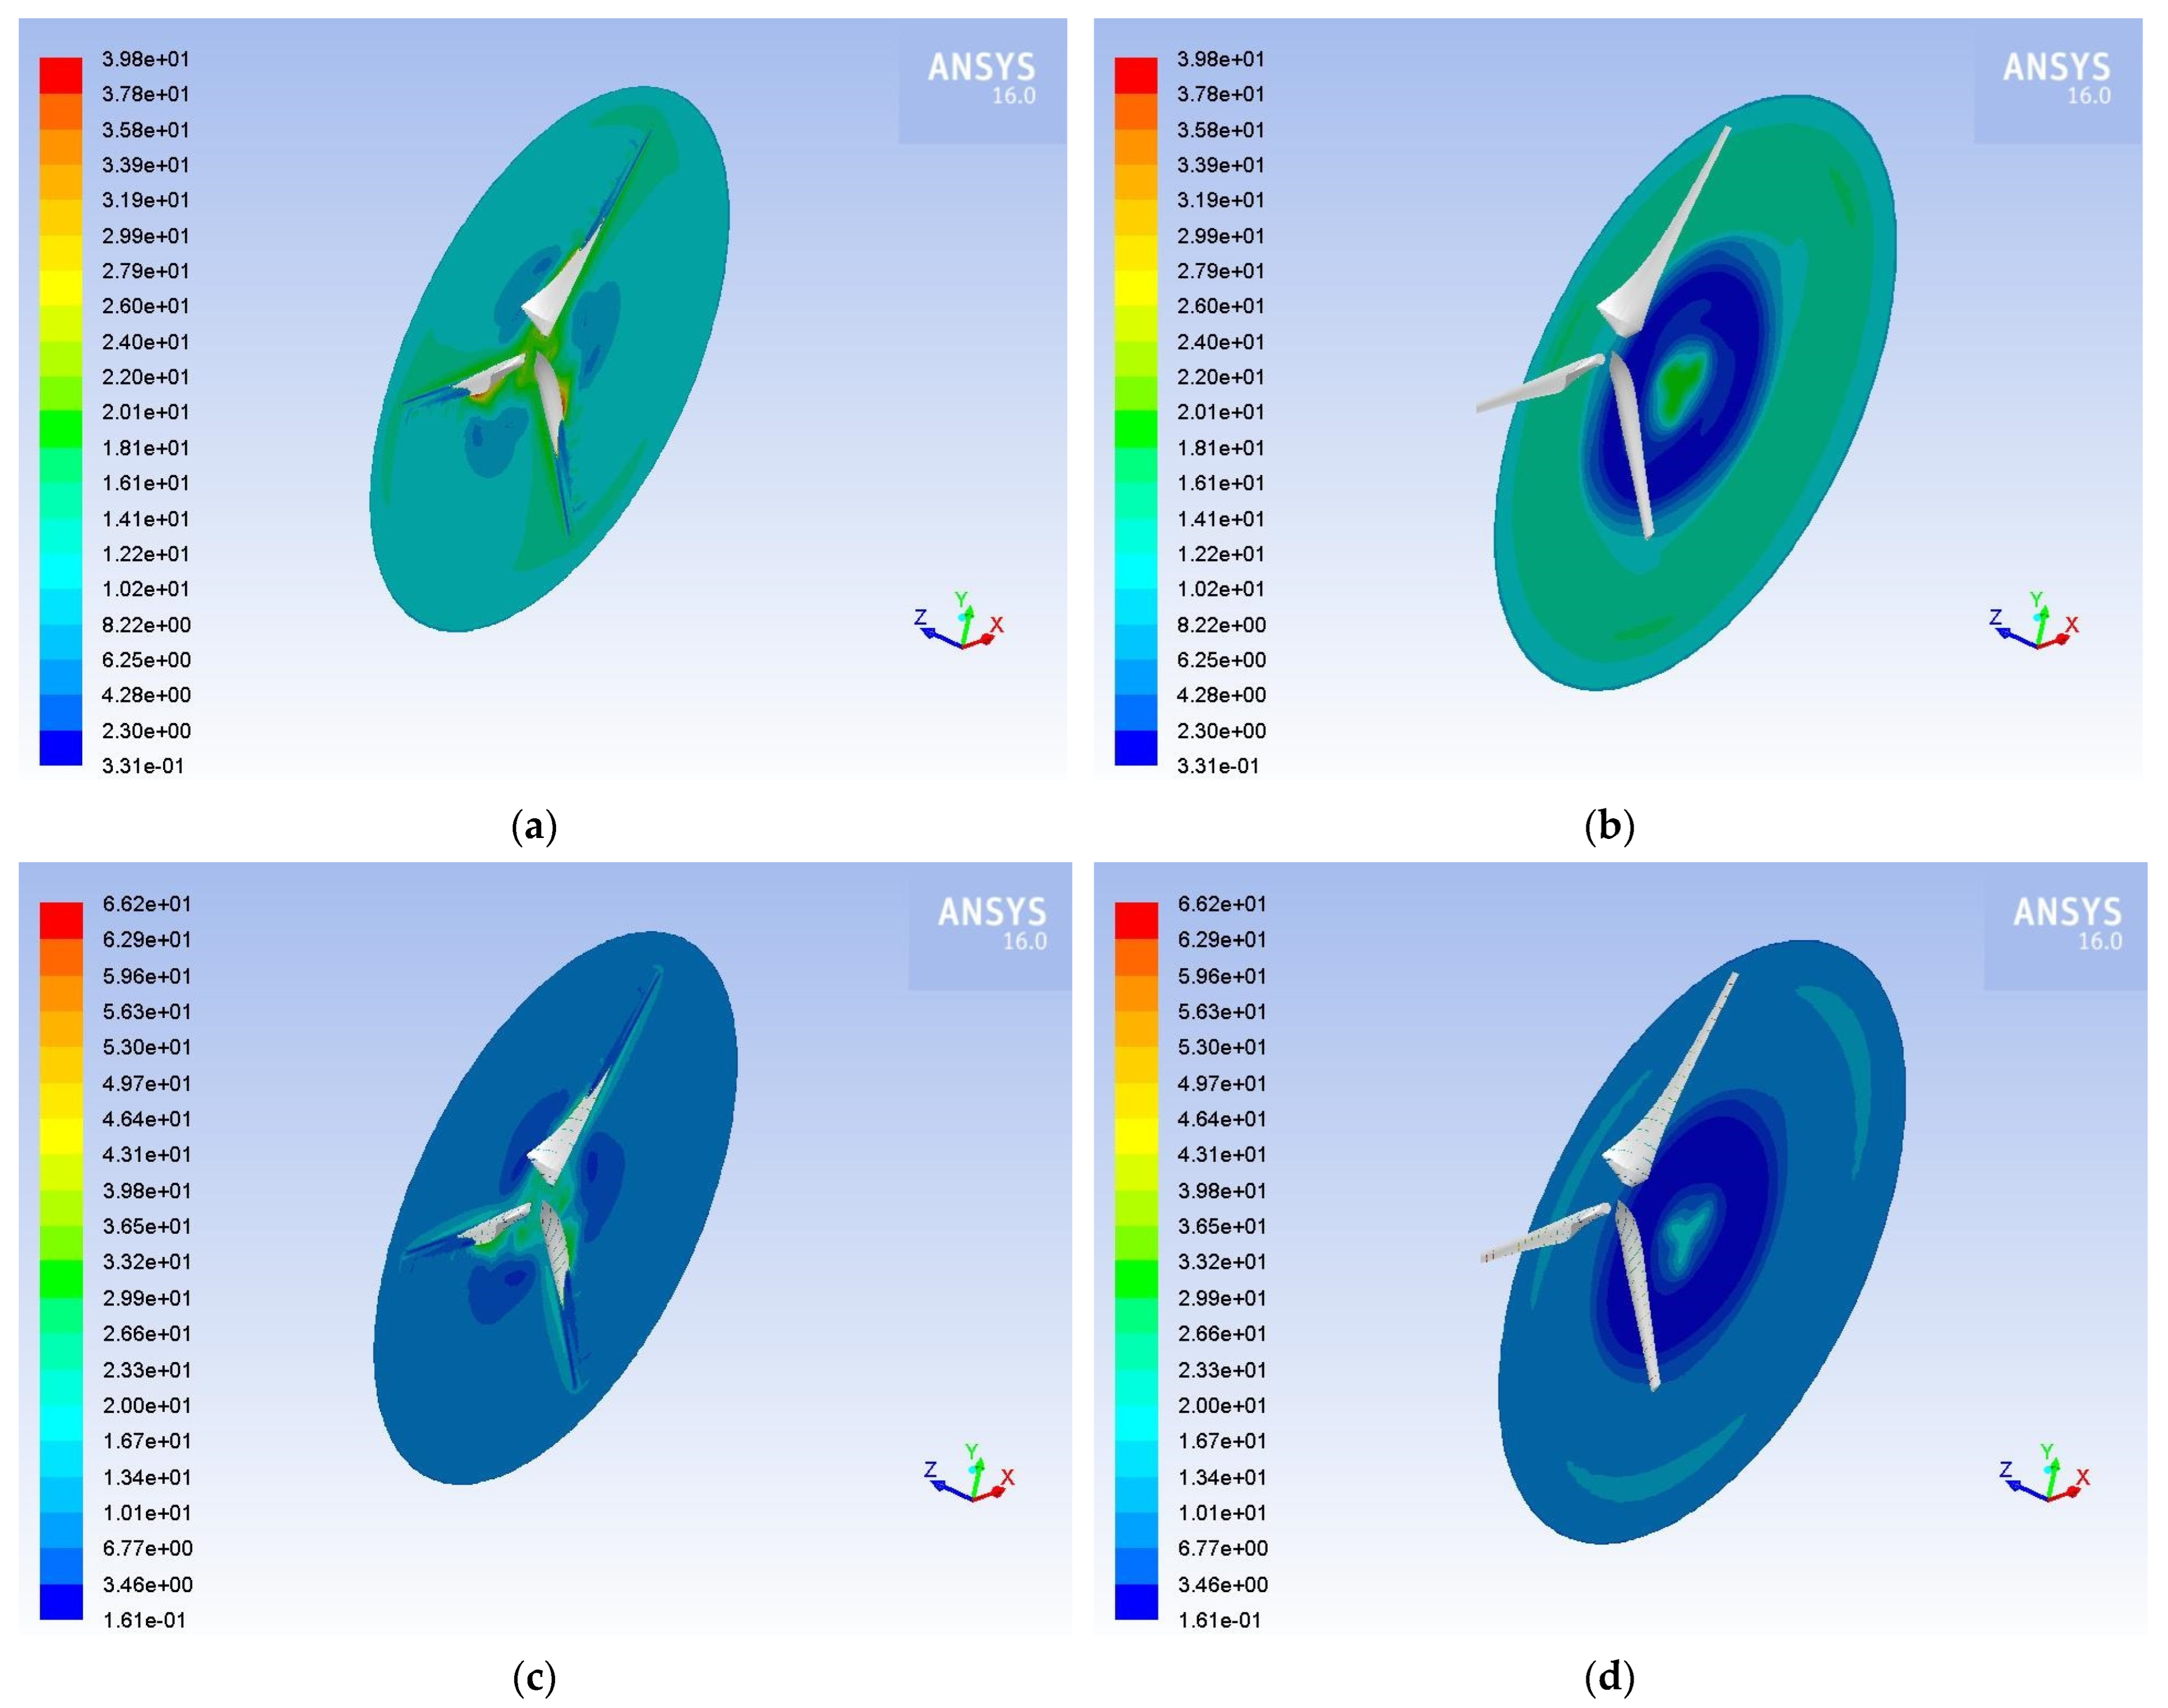
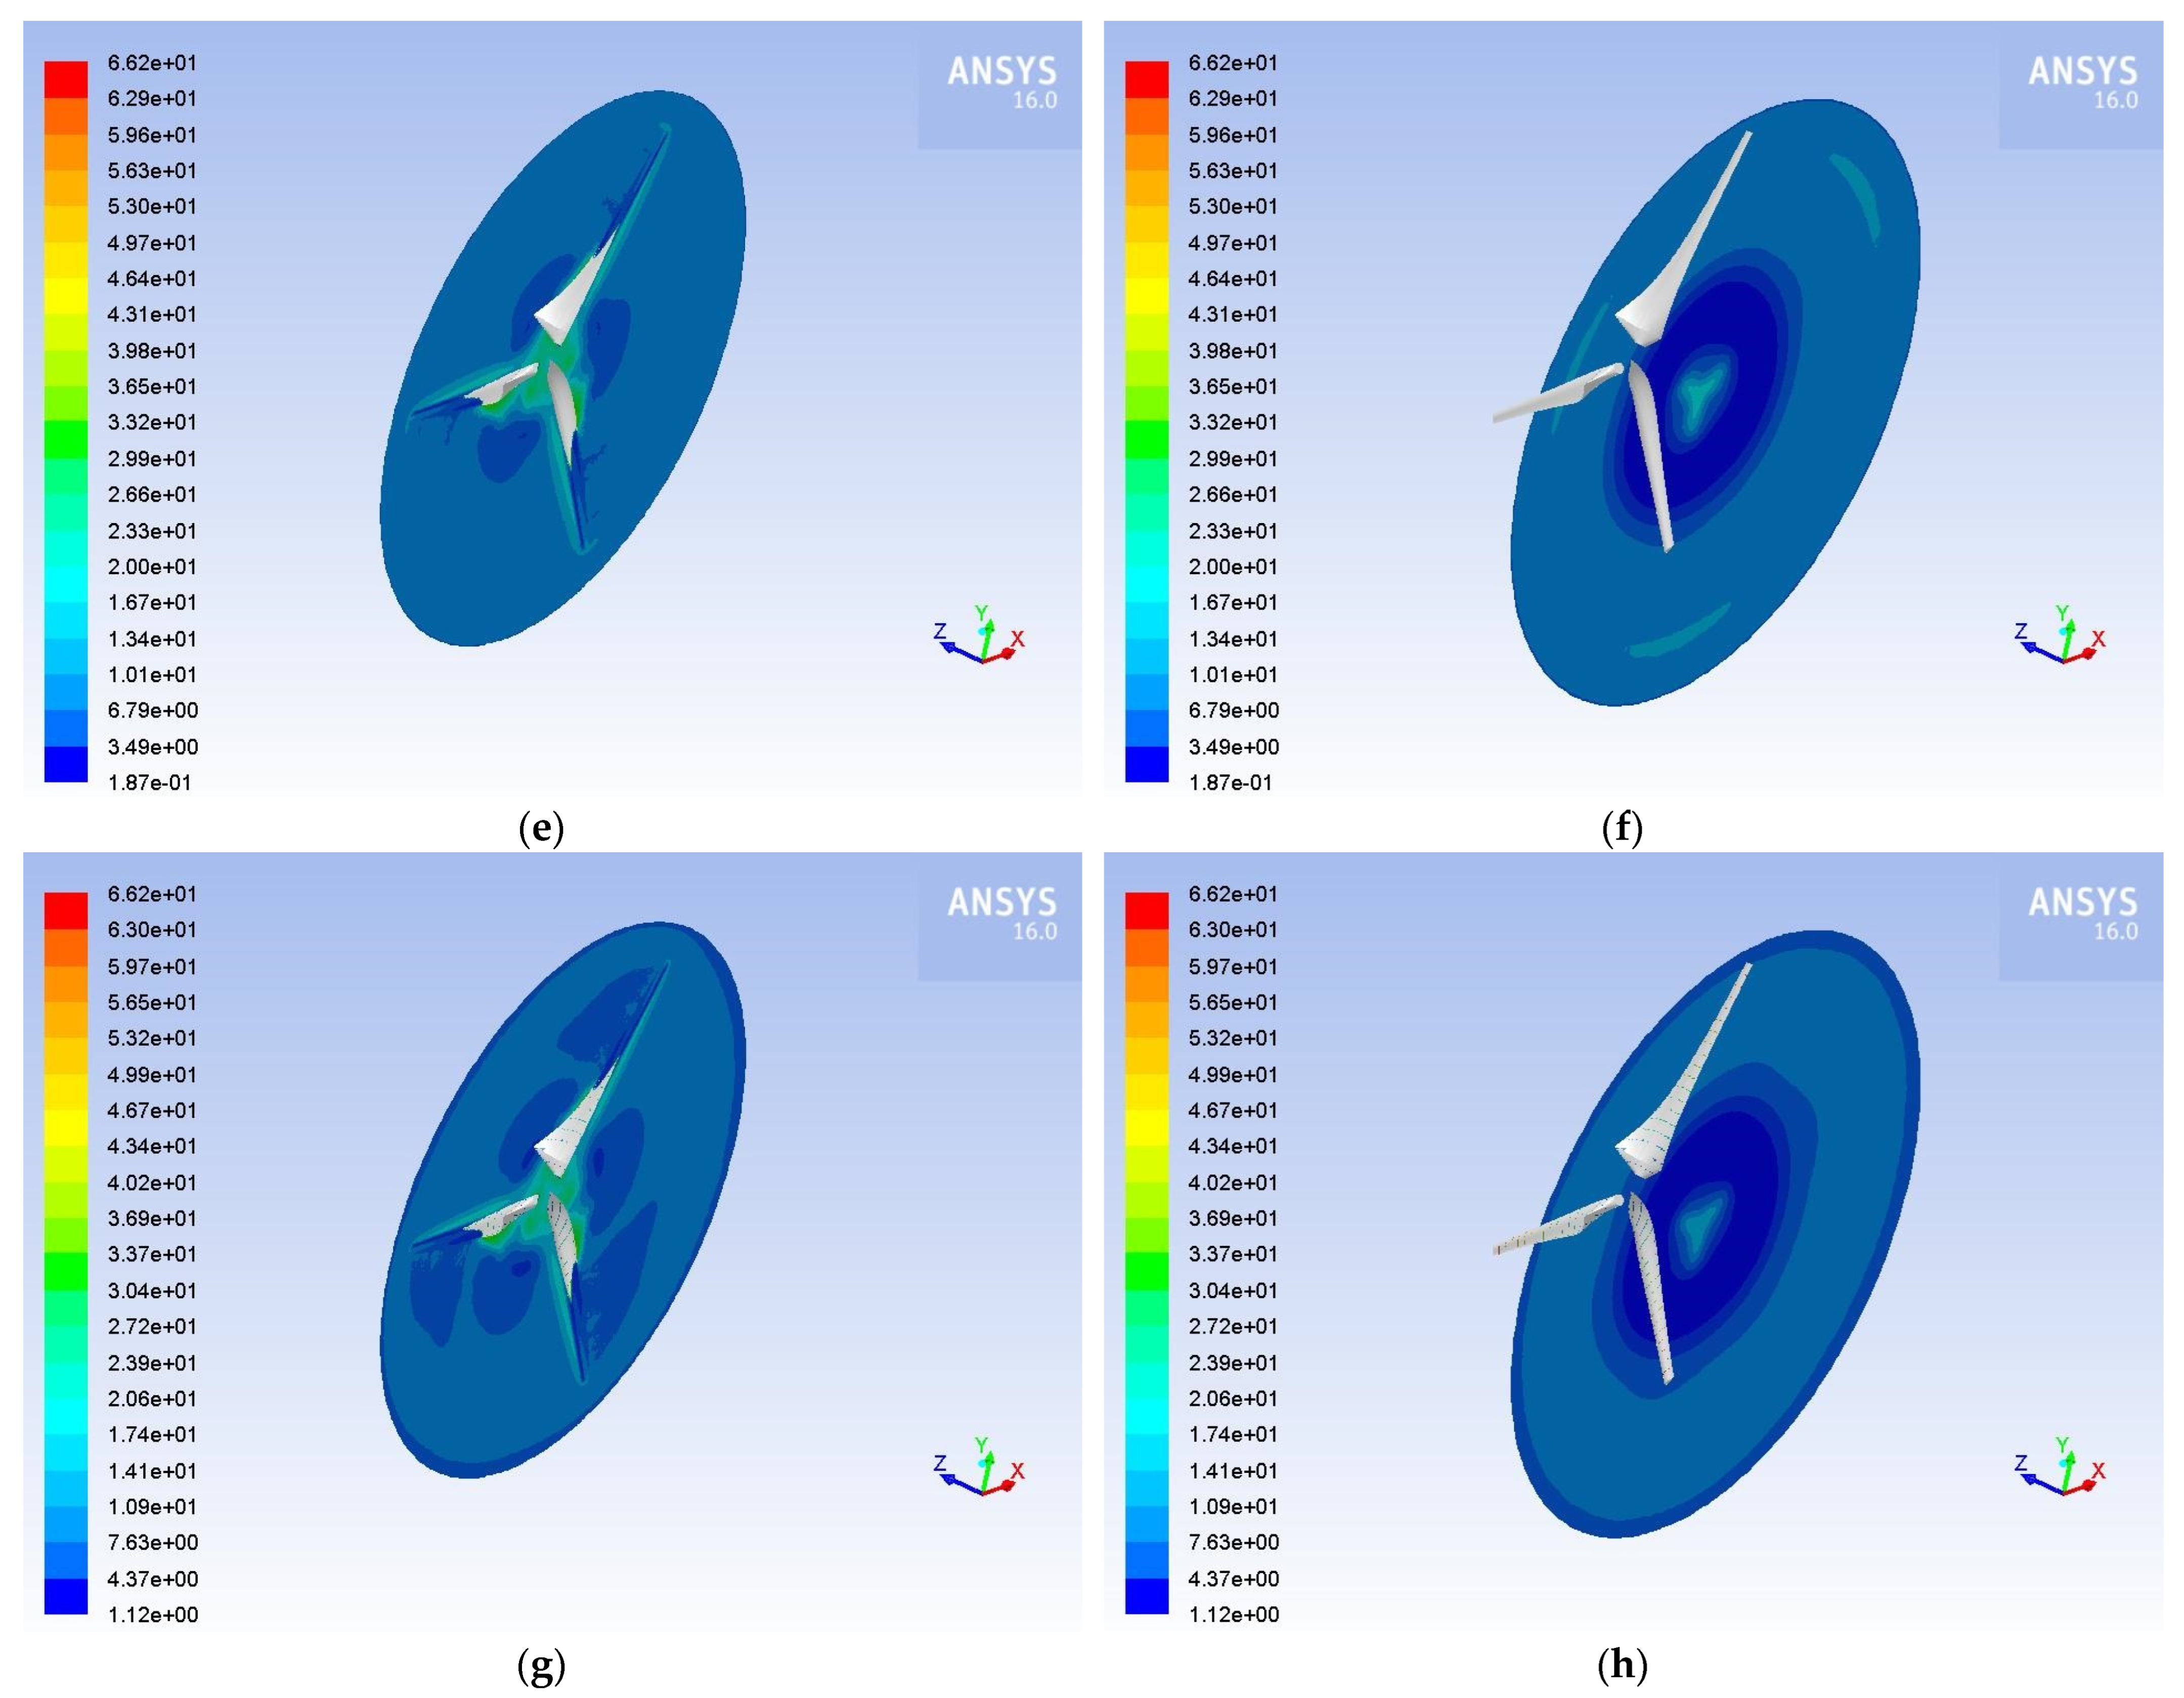
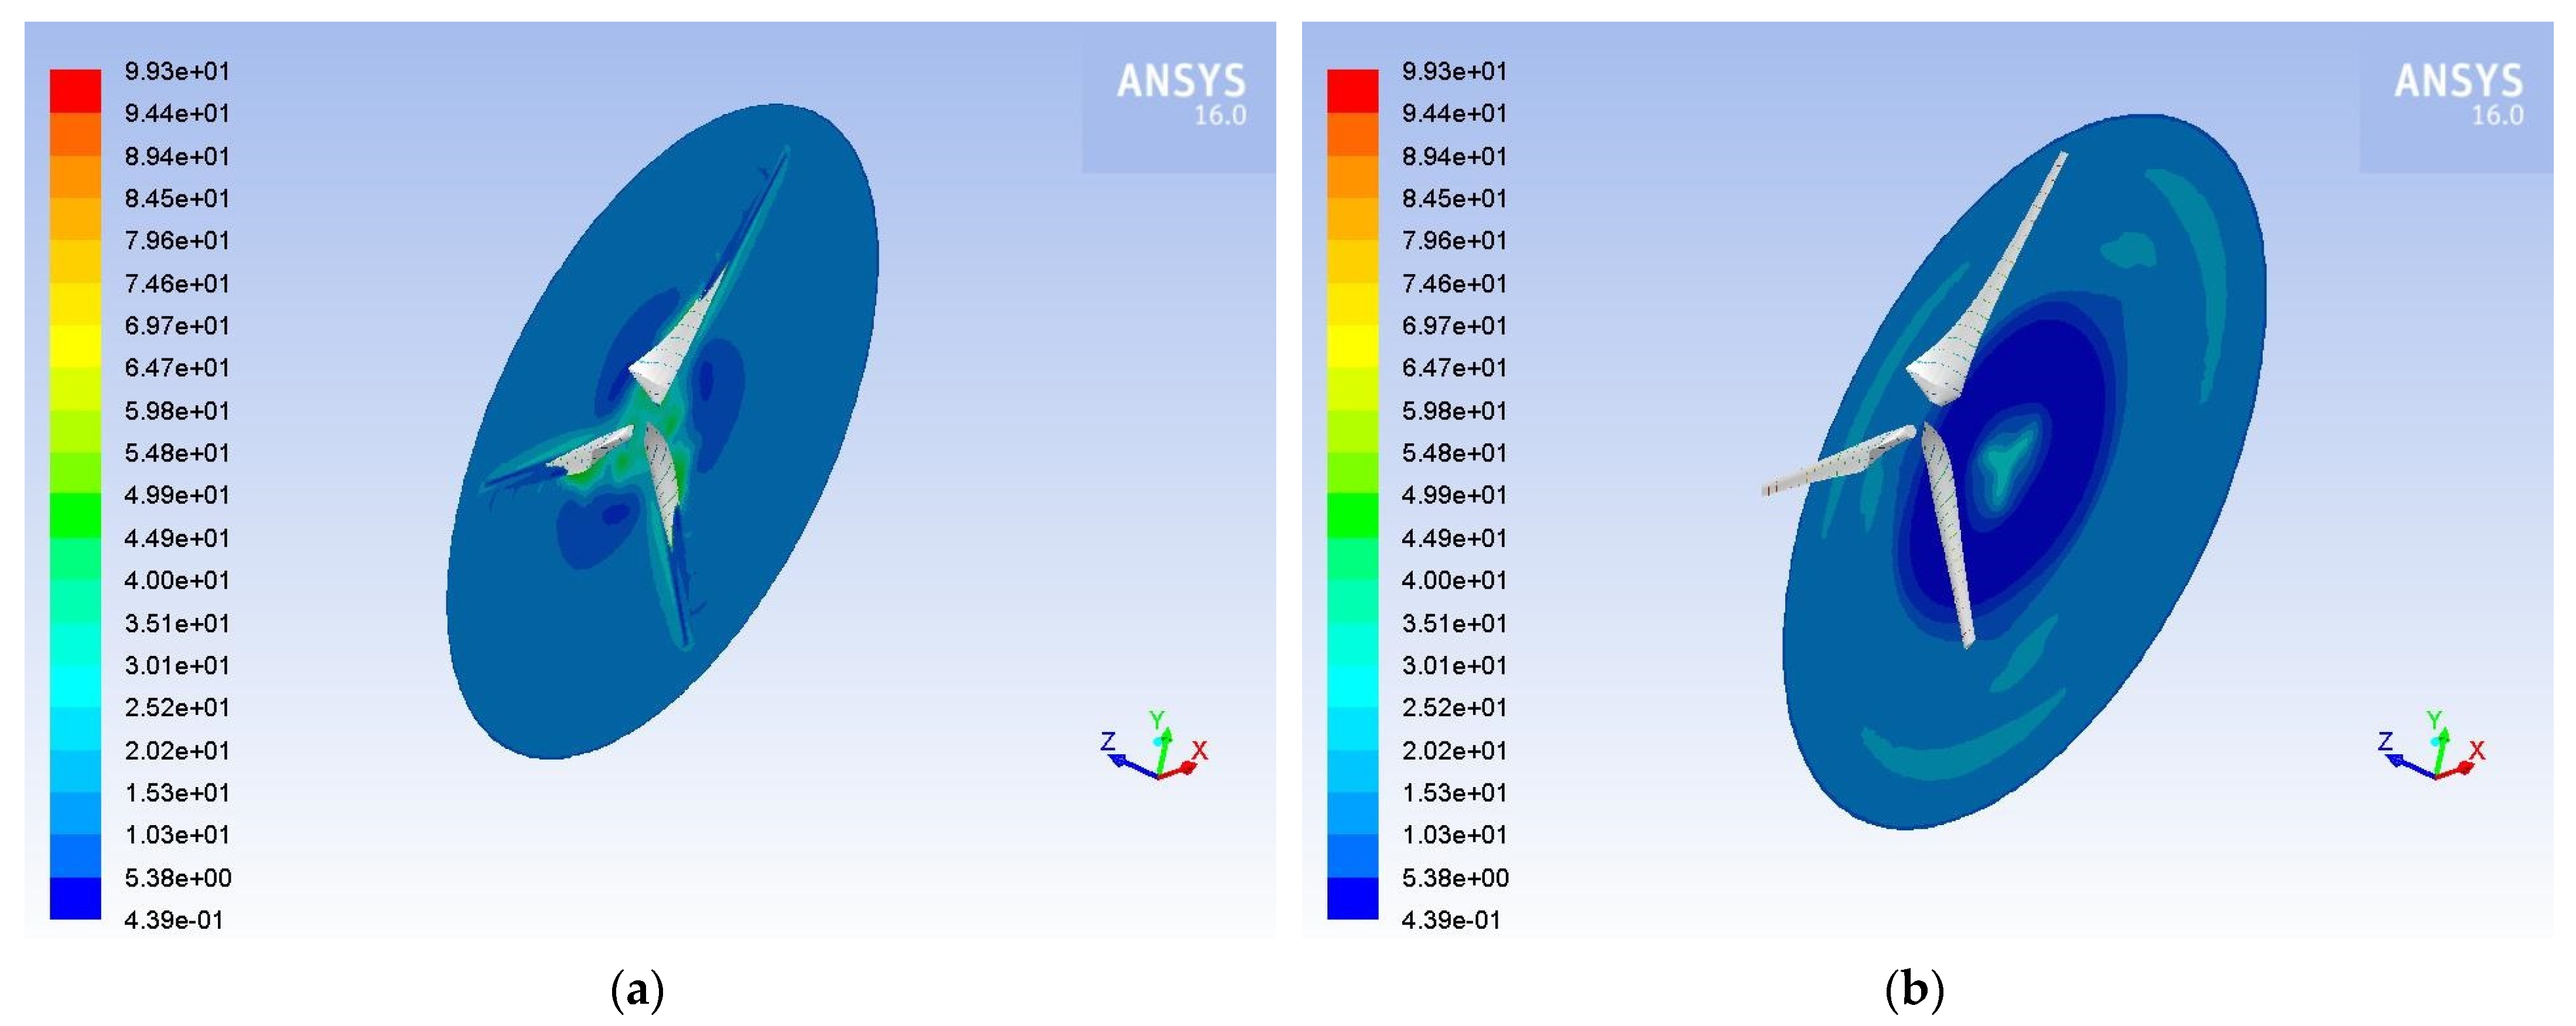
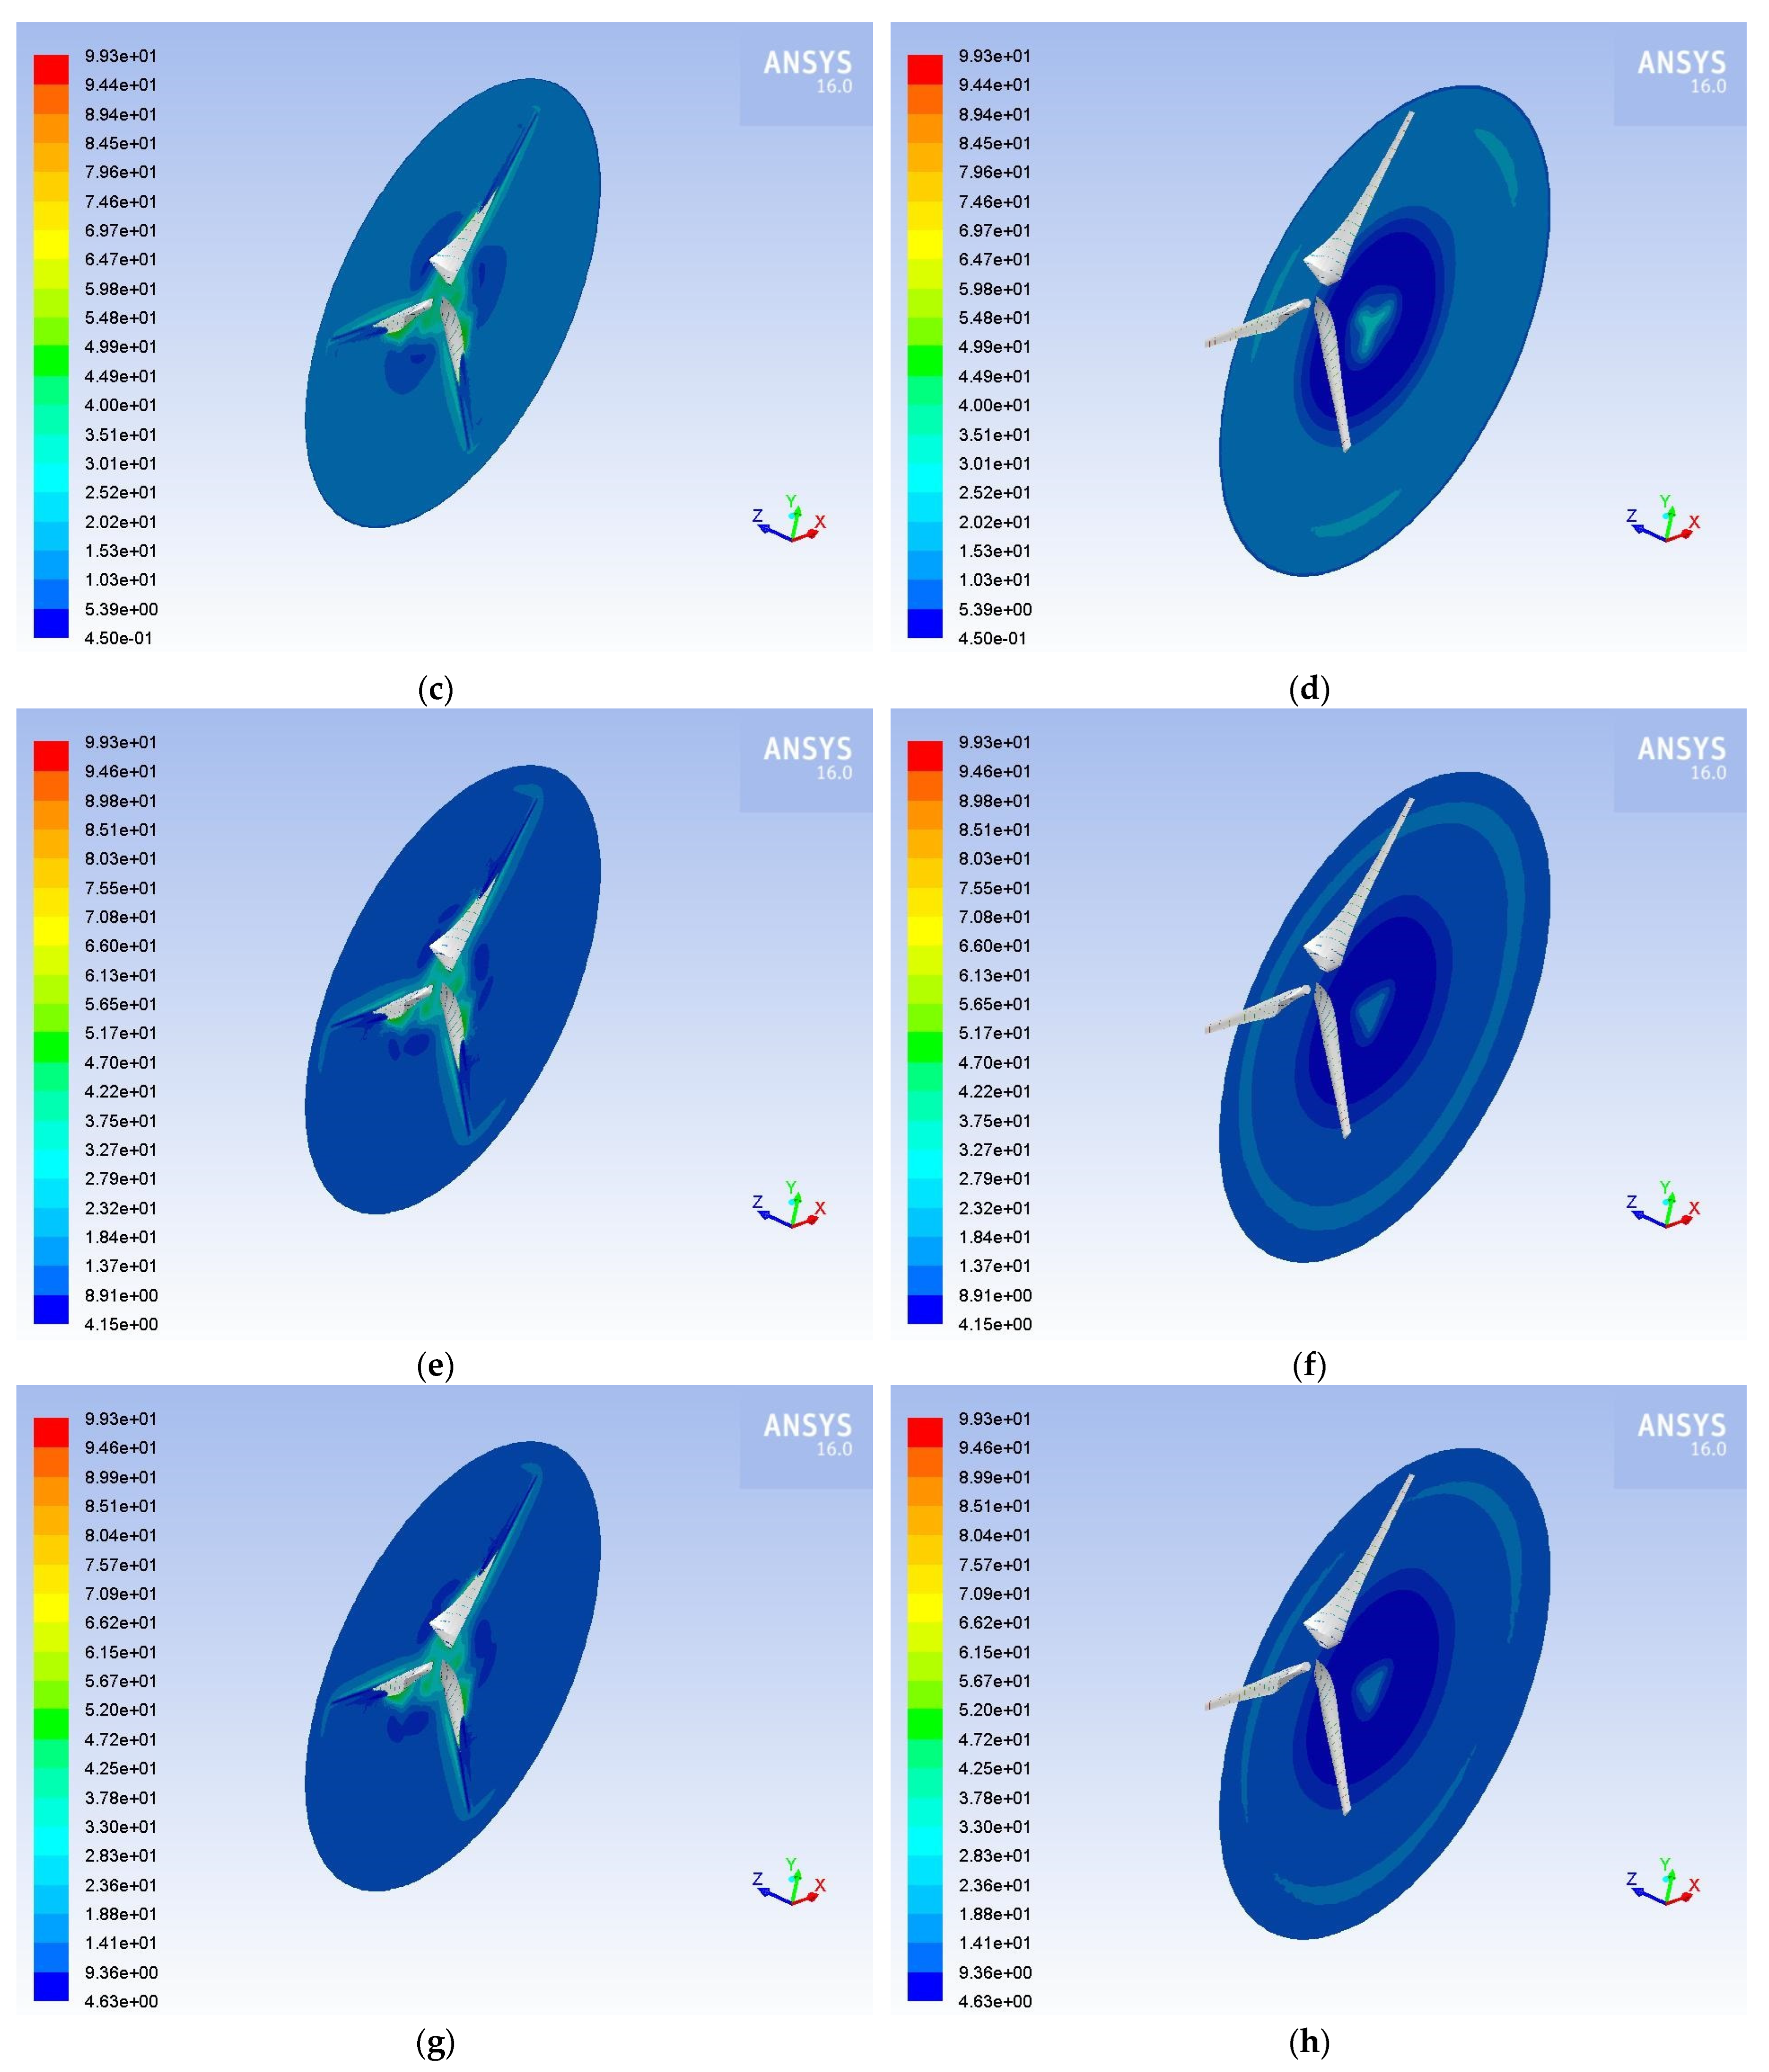
In order to understand in detail the flow domain around the HAWT rotor, visualized results of the airflow and of the air–sand particles flow are presented. The velocity distributions in different regions near the rotor of the HAWT operating in airflow and in three different cases of two-phase air-solid sand particle flow, for wind speeds of 10 m·s
−1 and 15 m·s
−1, are demonstrated in
Figure 5 and in
Figure 6, respectively. From
Figure 5, it is obvious that, both in clean airflow and in dusty conditions, as the air hits the rotor, the velocity increases and reaches higher values in areas around the blades and in the vicinity of the hub. In areas between the blades and away from the hub, air has lower values of velocity. As the concentration of sand particles in the air increases, more extended regions with lower values of velocity appear. With regard to the wake, the rings of different velocity are formed, and as dust in the air increases, velocity distributions have a similar shape, and the minimum velocity values decrease further. As wind speed increases (
Figure 6), velocity distribution has the same form, while the range of values received increases and the wake weakens faster.
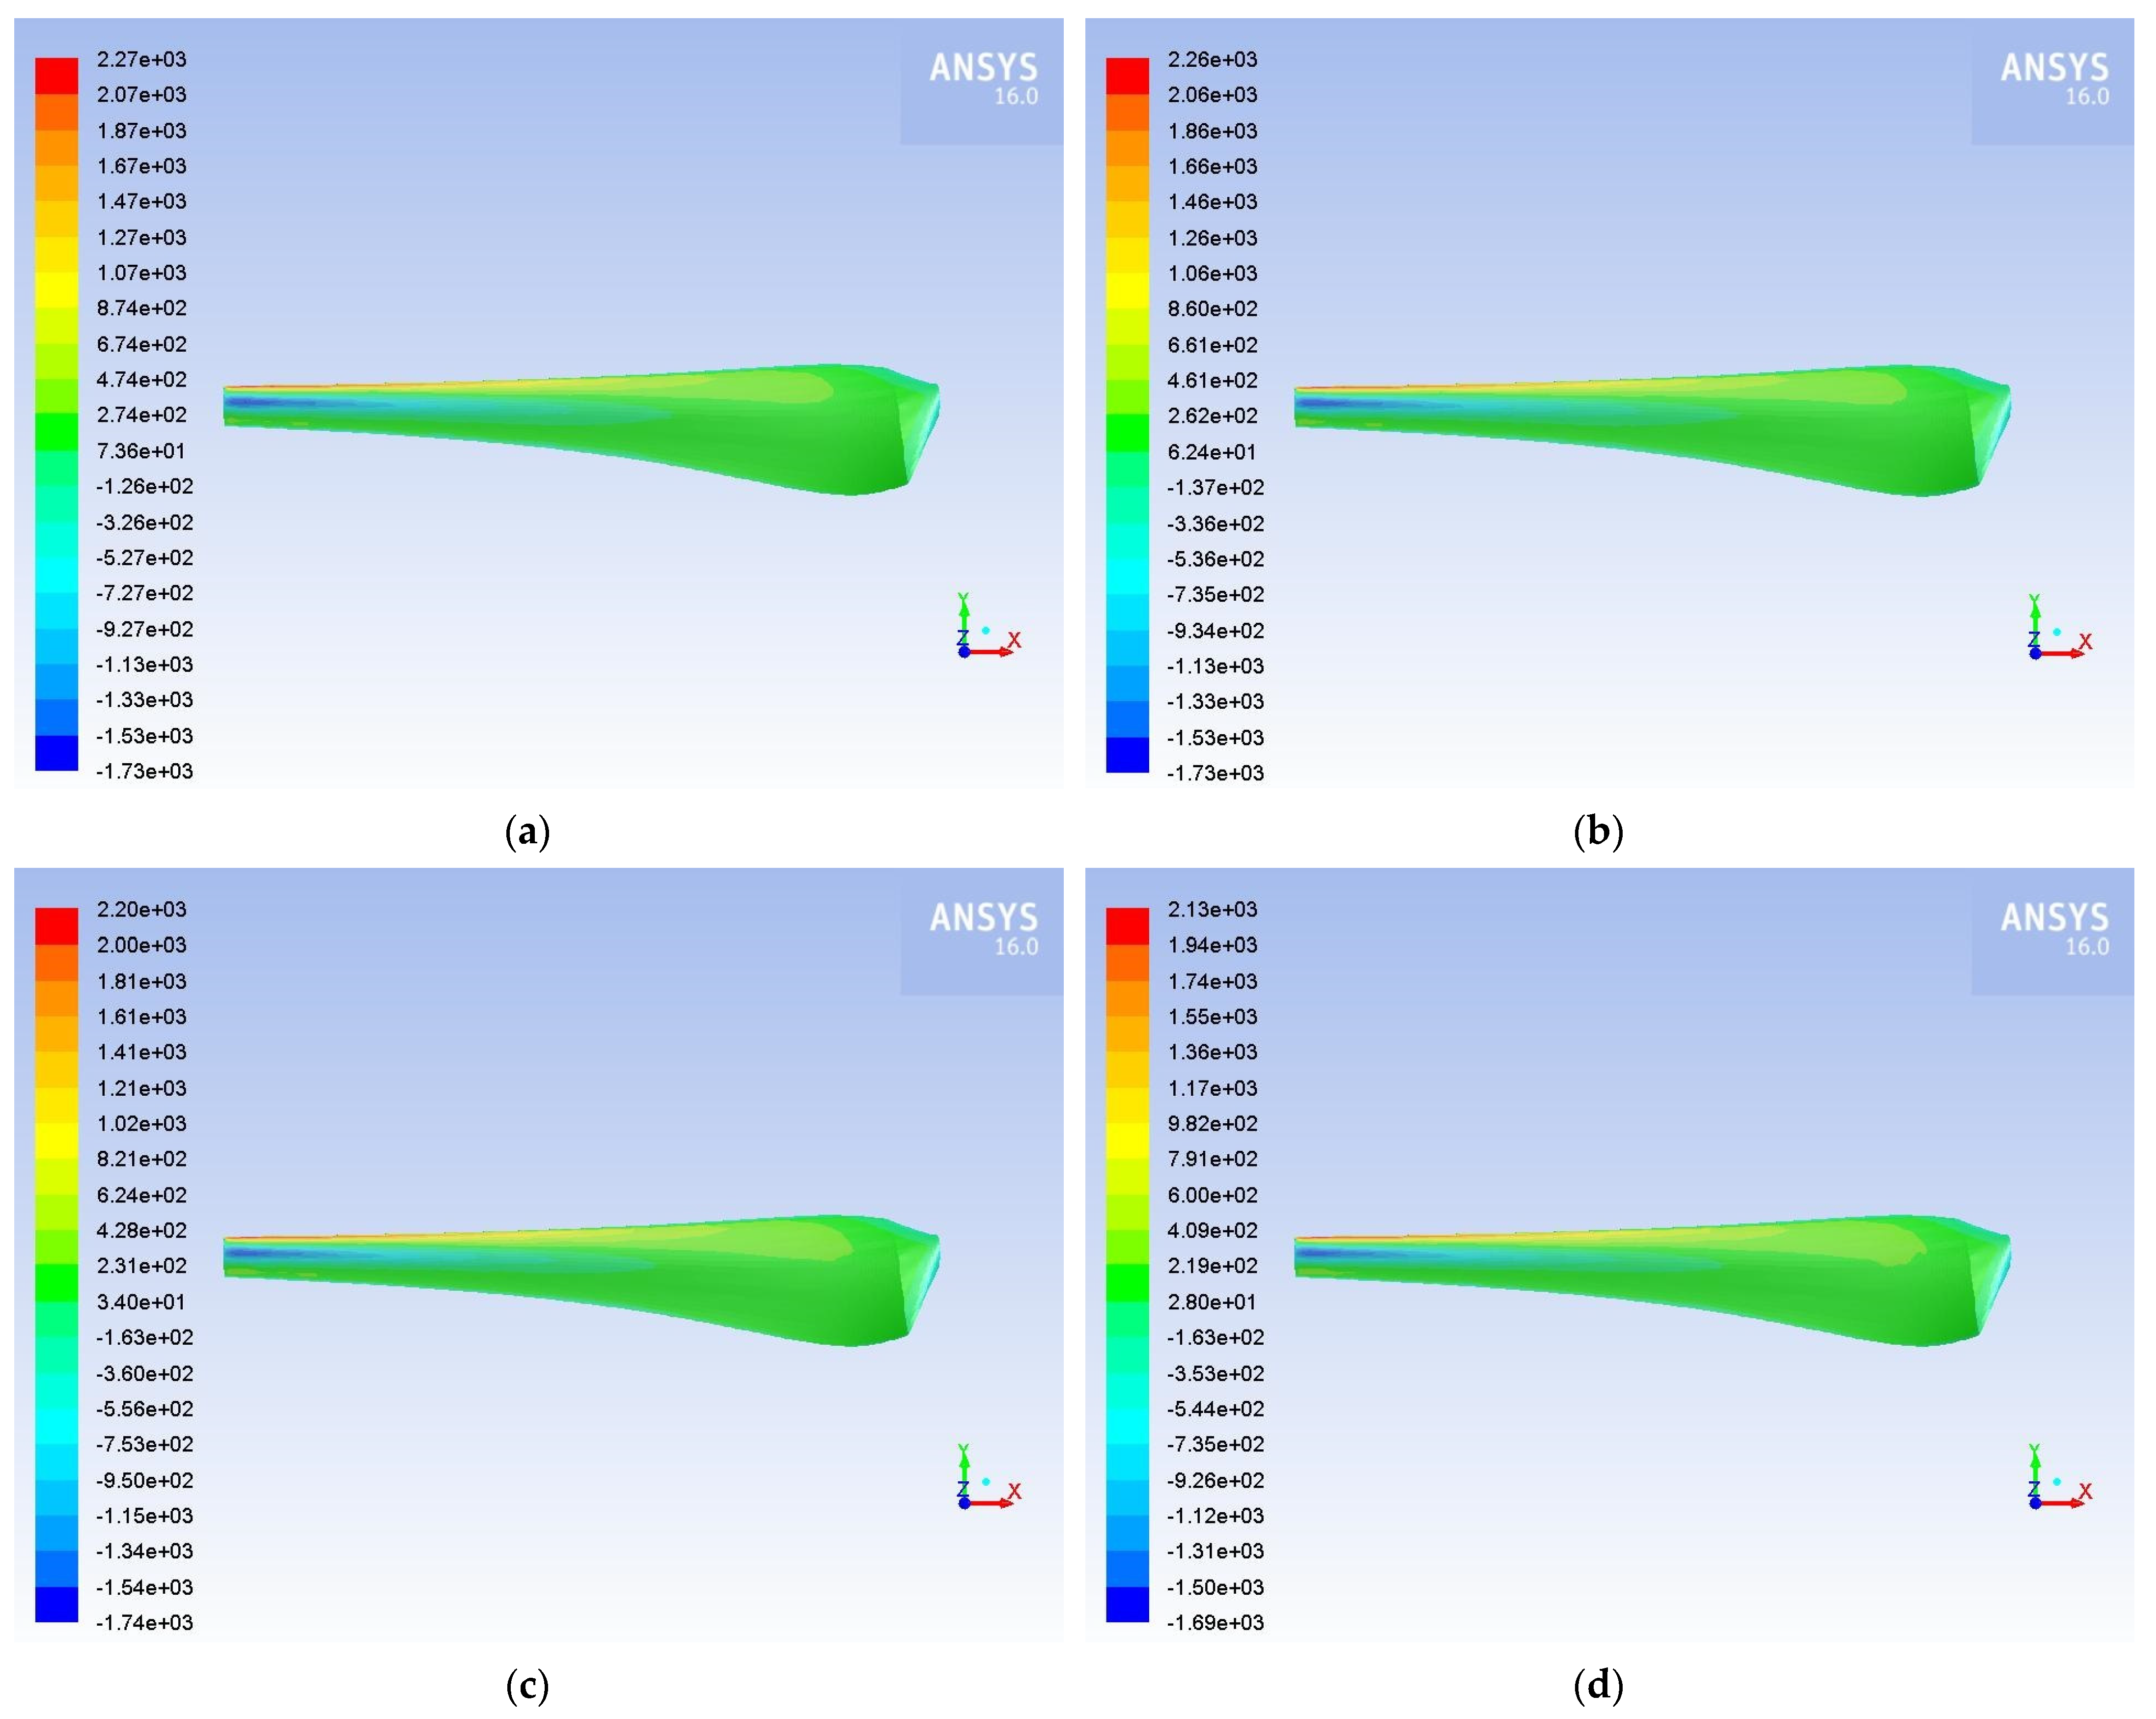
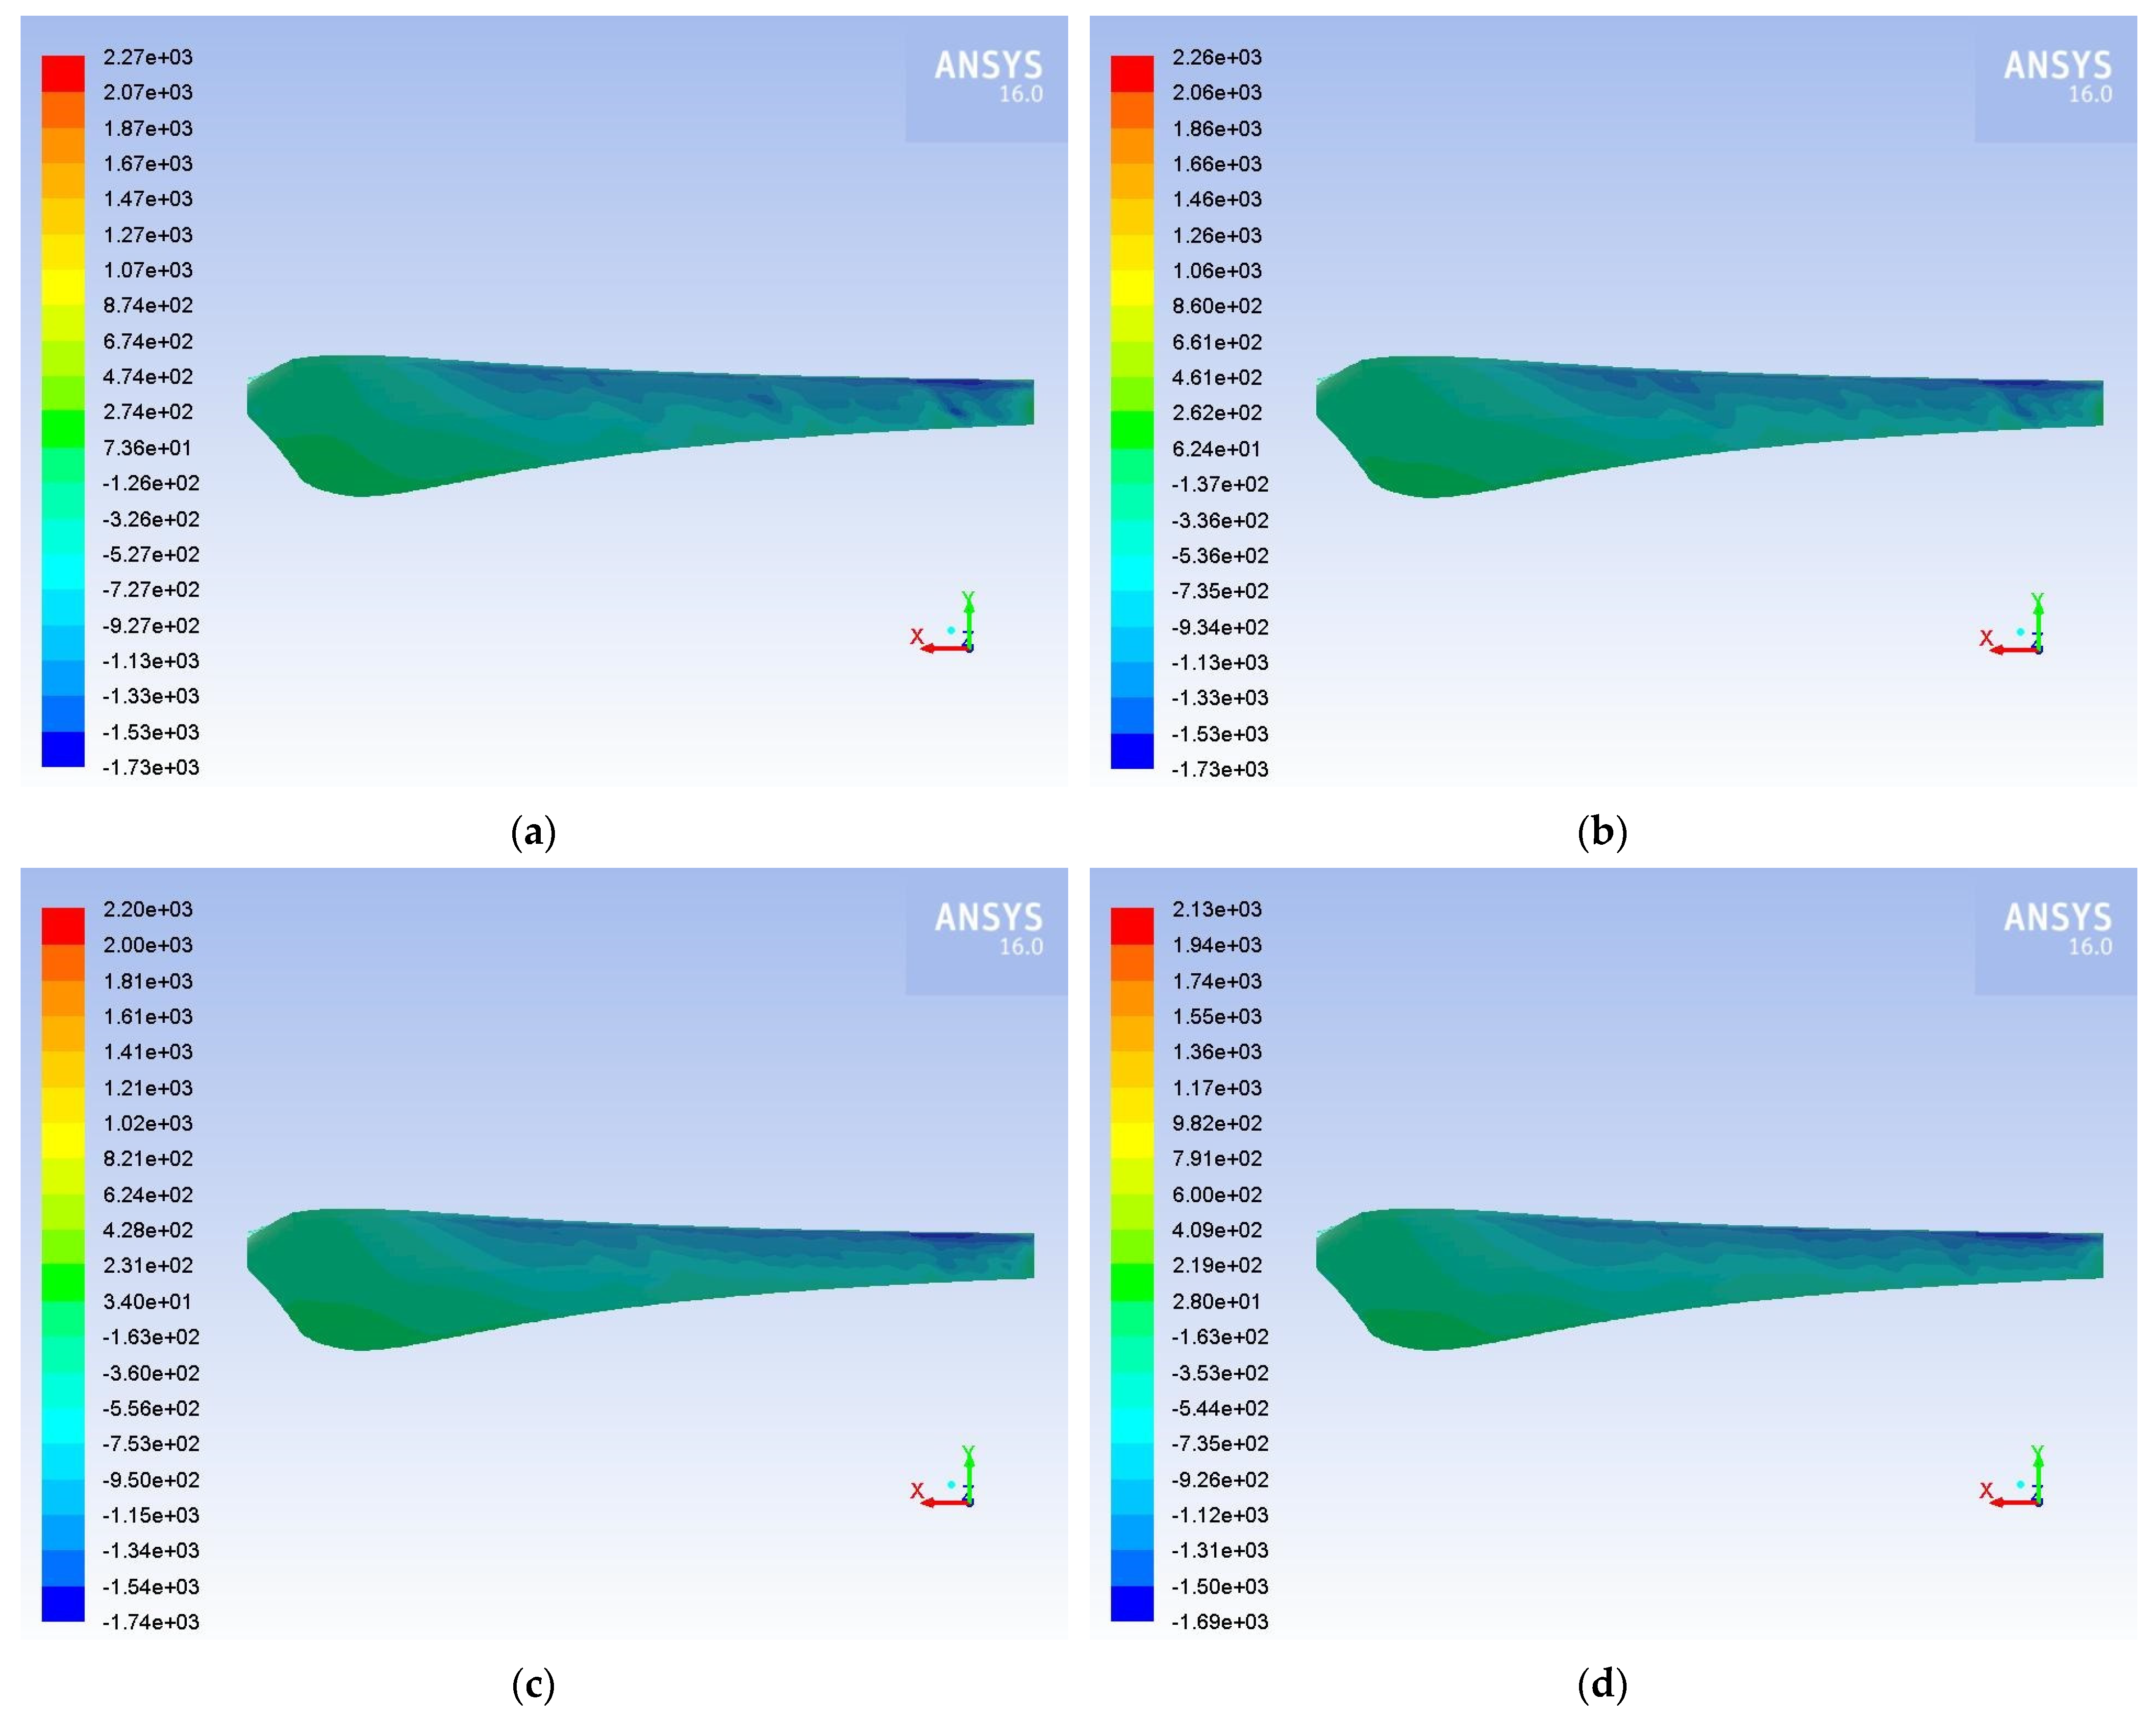
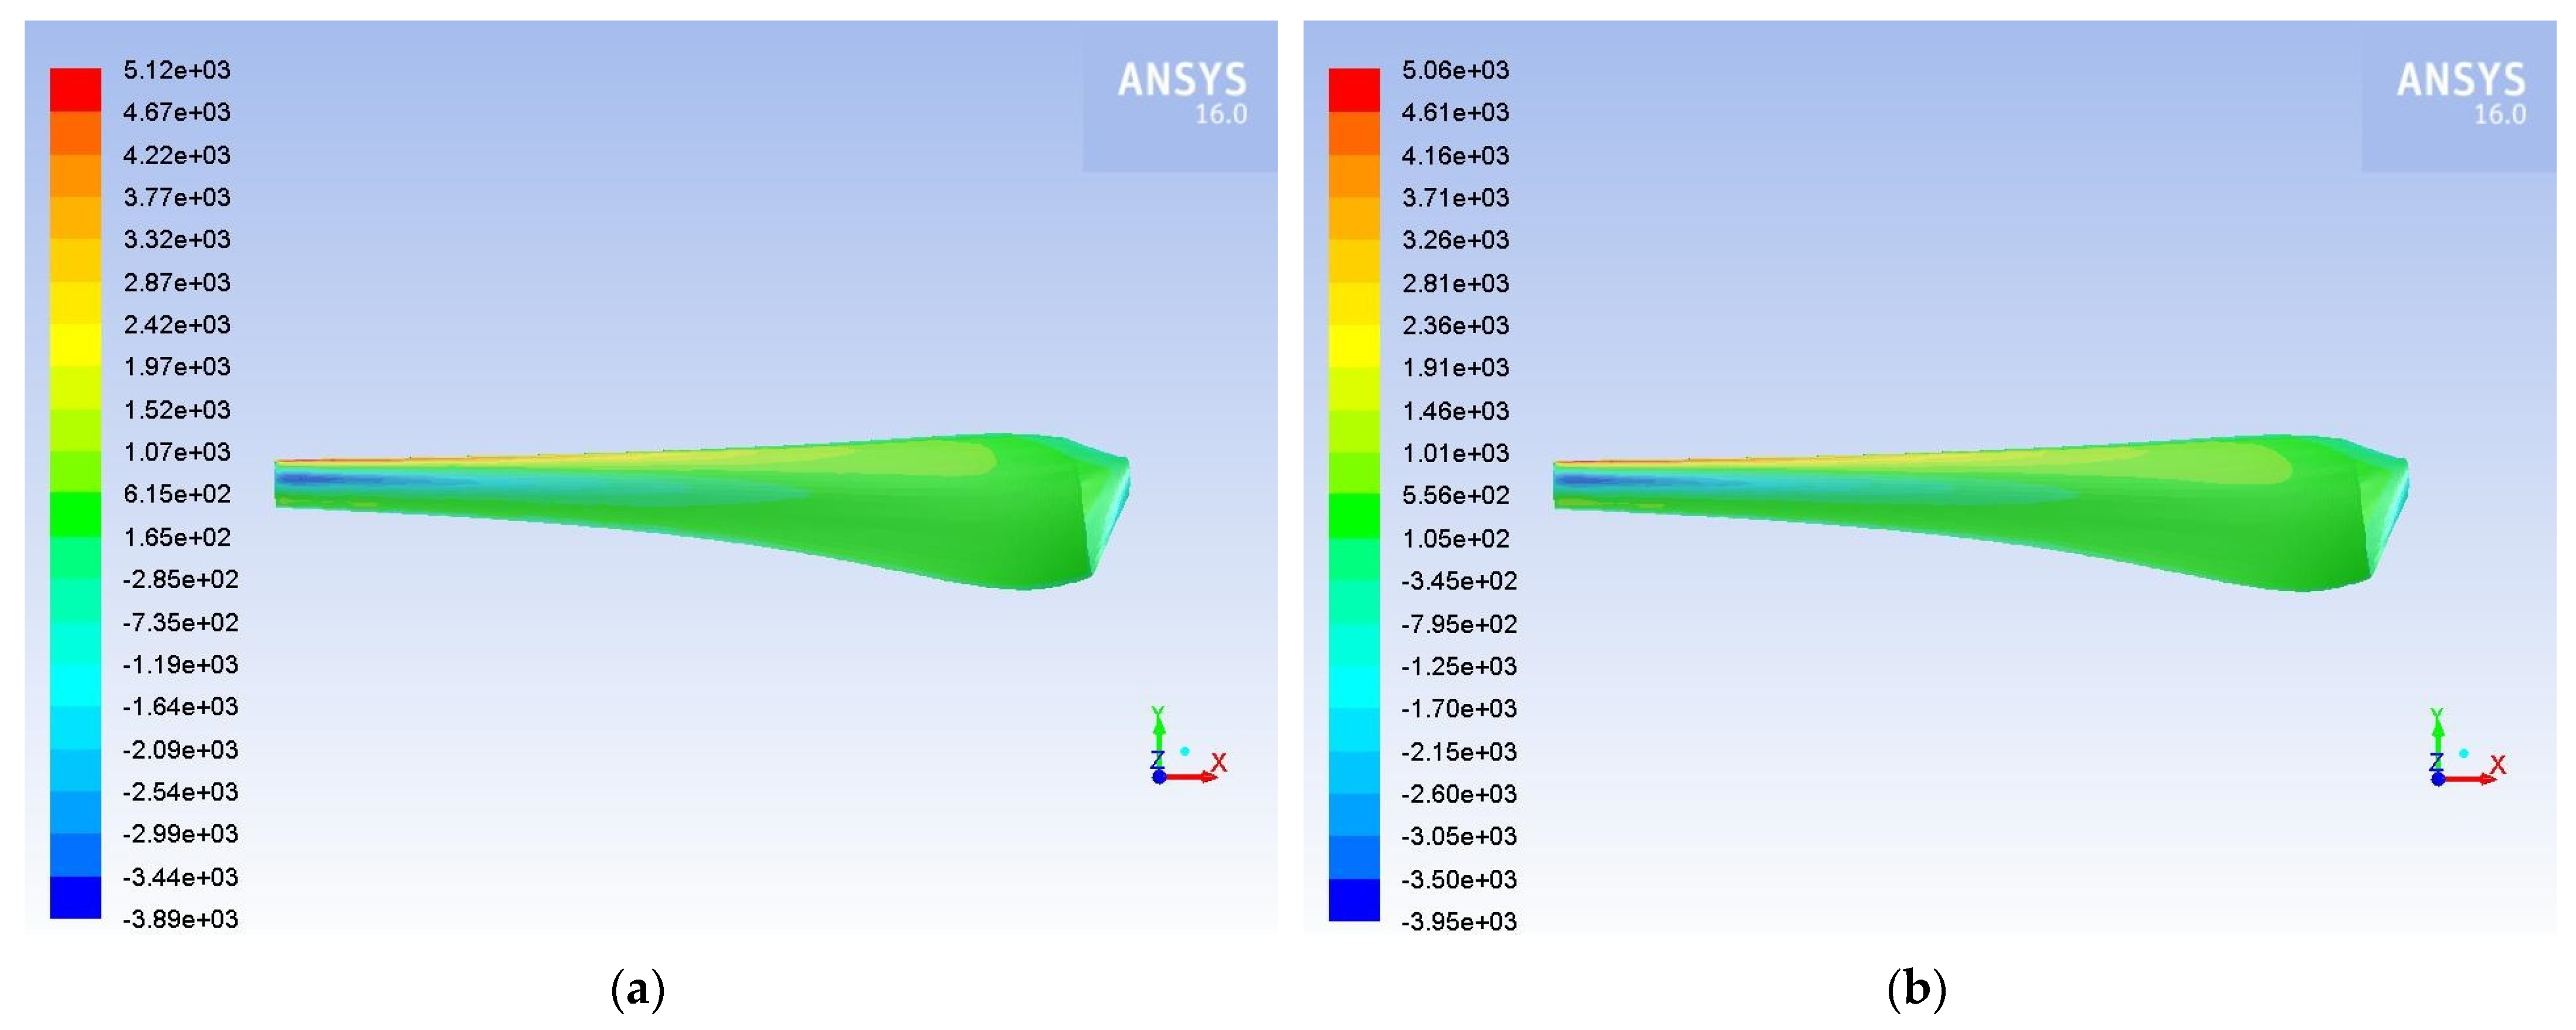
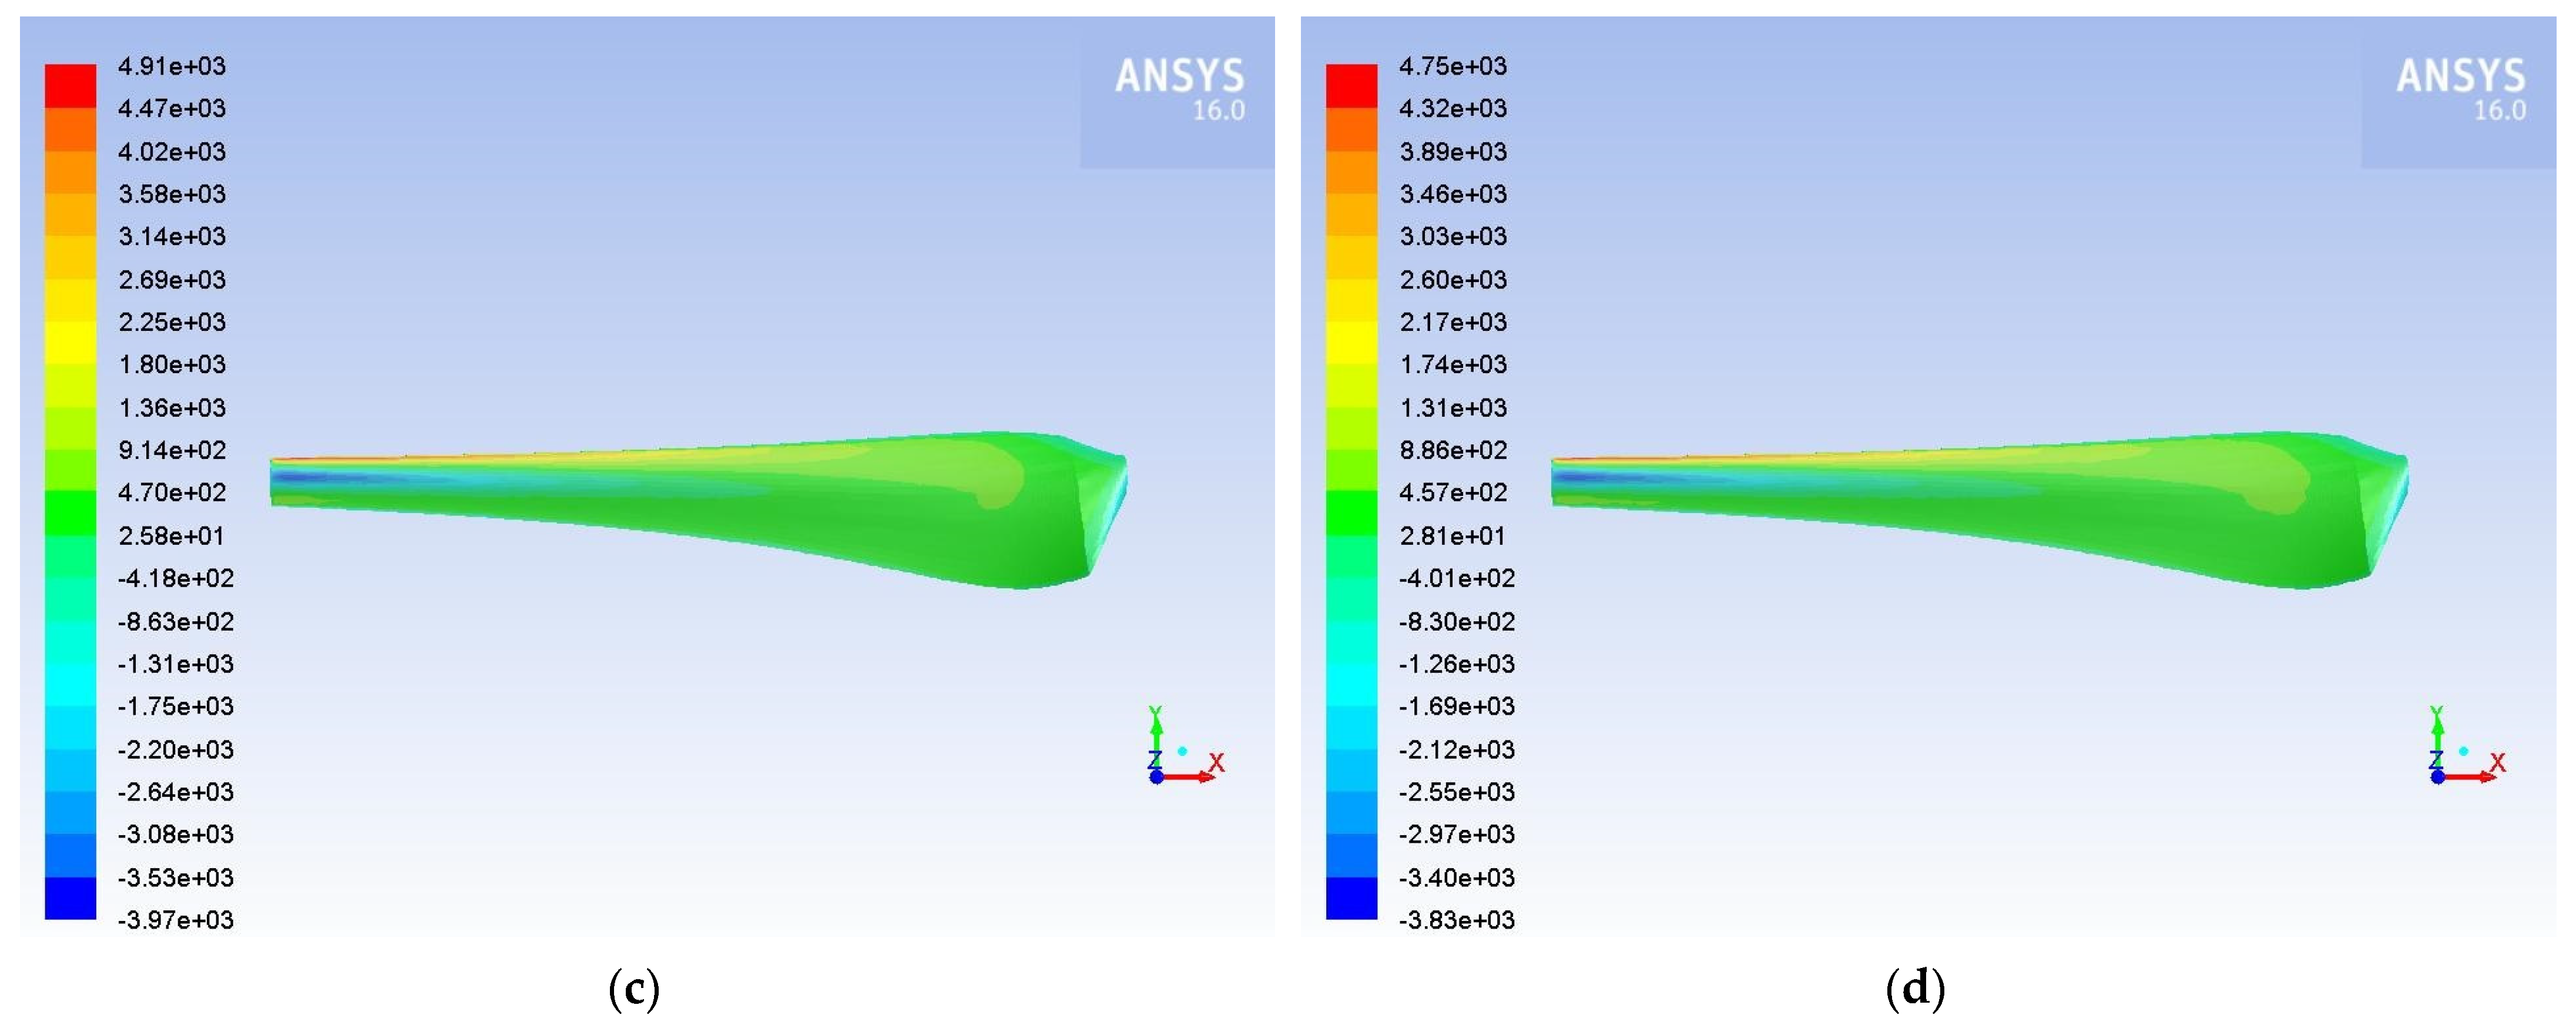
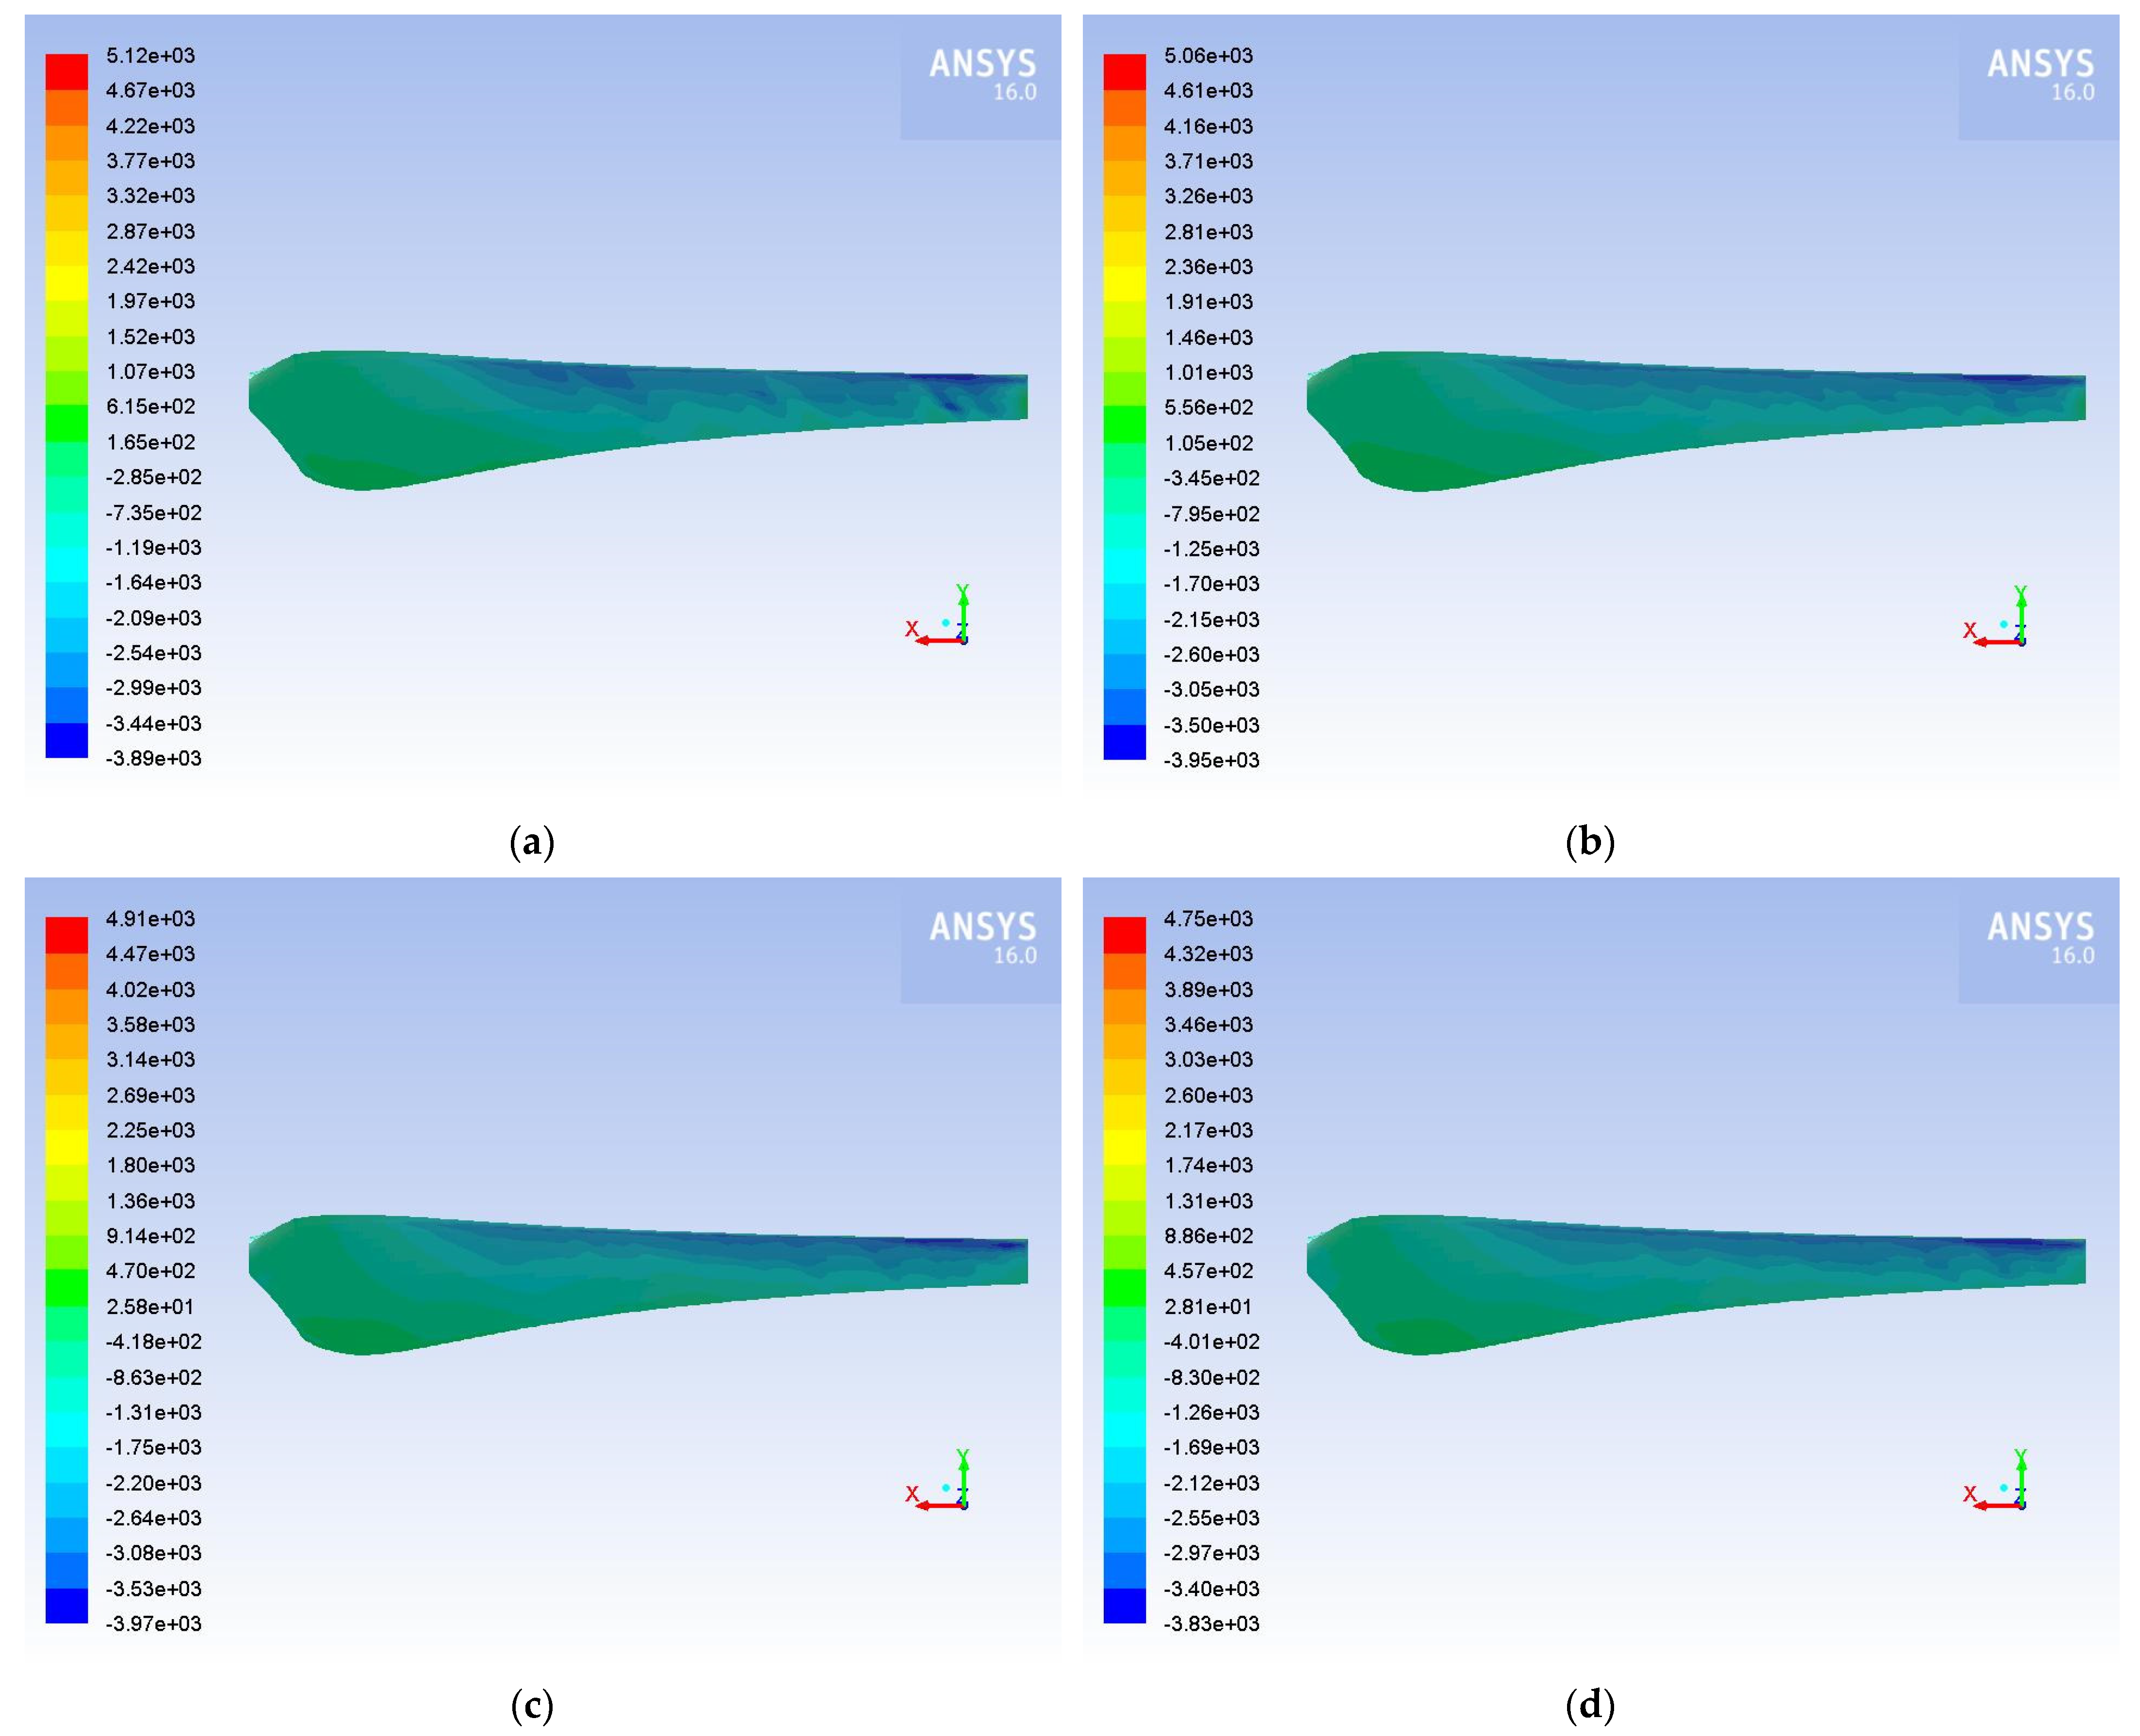
Subsequently, in
Figure 7,
Figure 8,
Figure 9 and
Figure 10, the contours of static pressure on pressure and on the suction side of the wind turbine blade are presented for all conditions studied. In all cases, a similar distribution of pressure on the blade is observed, with the max. value appearing in the vicinity of the tip of the blade and decreasing towards the hub. In general, the highest pressure values are obtained on the blade’s pressure side, near the leading edge, while on the blade’s suction side the pressure is lower, and thus lift is generated. Furthermore, as dust in the air increases, the max. values of the static pressure on the blade decrease, and at the same time the lowest values increase, thus reducing the lift of the blade. Moreover, with increasing wind speed, the range of pressure values seems to increase.
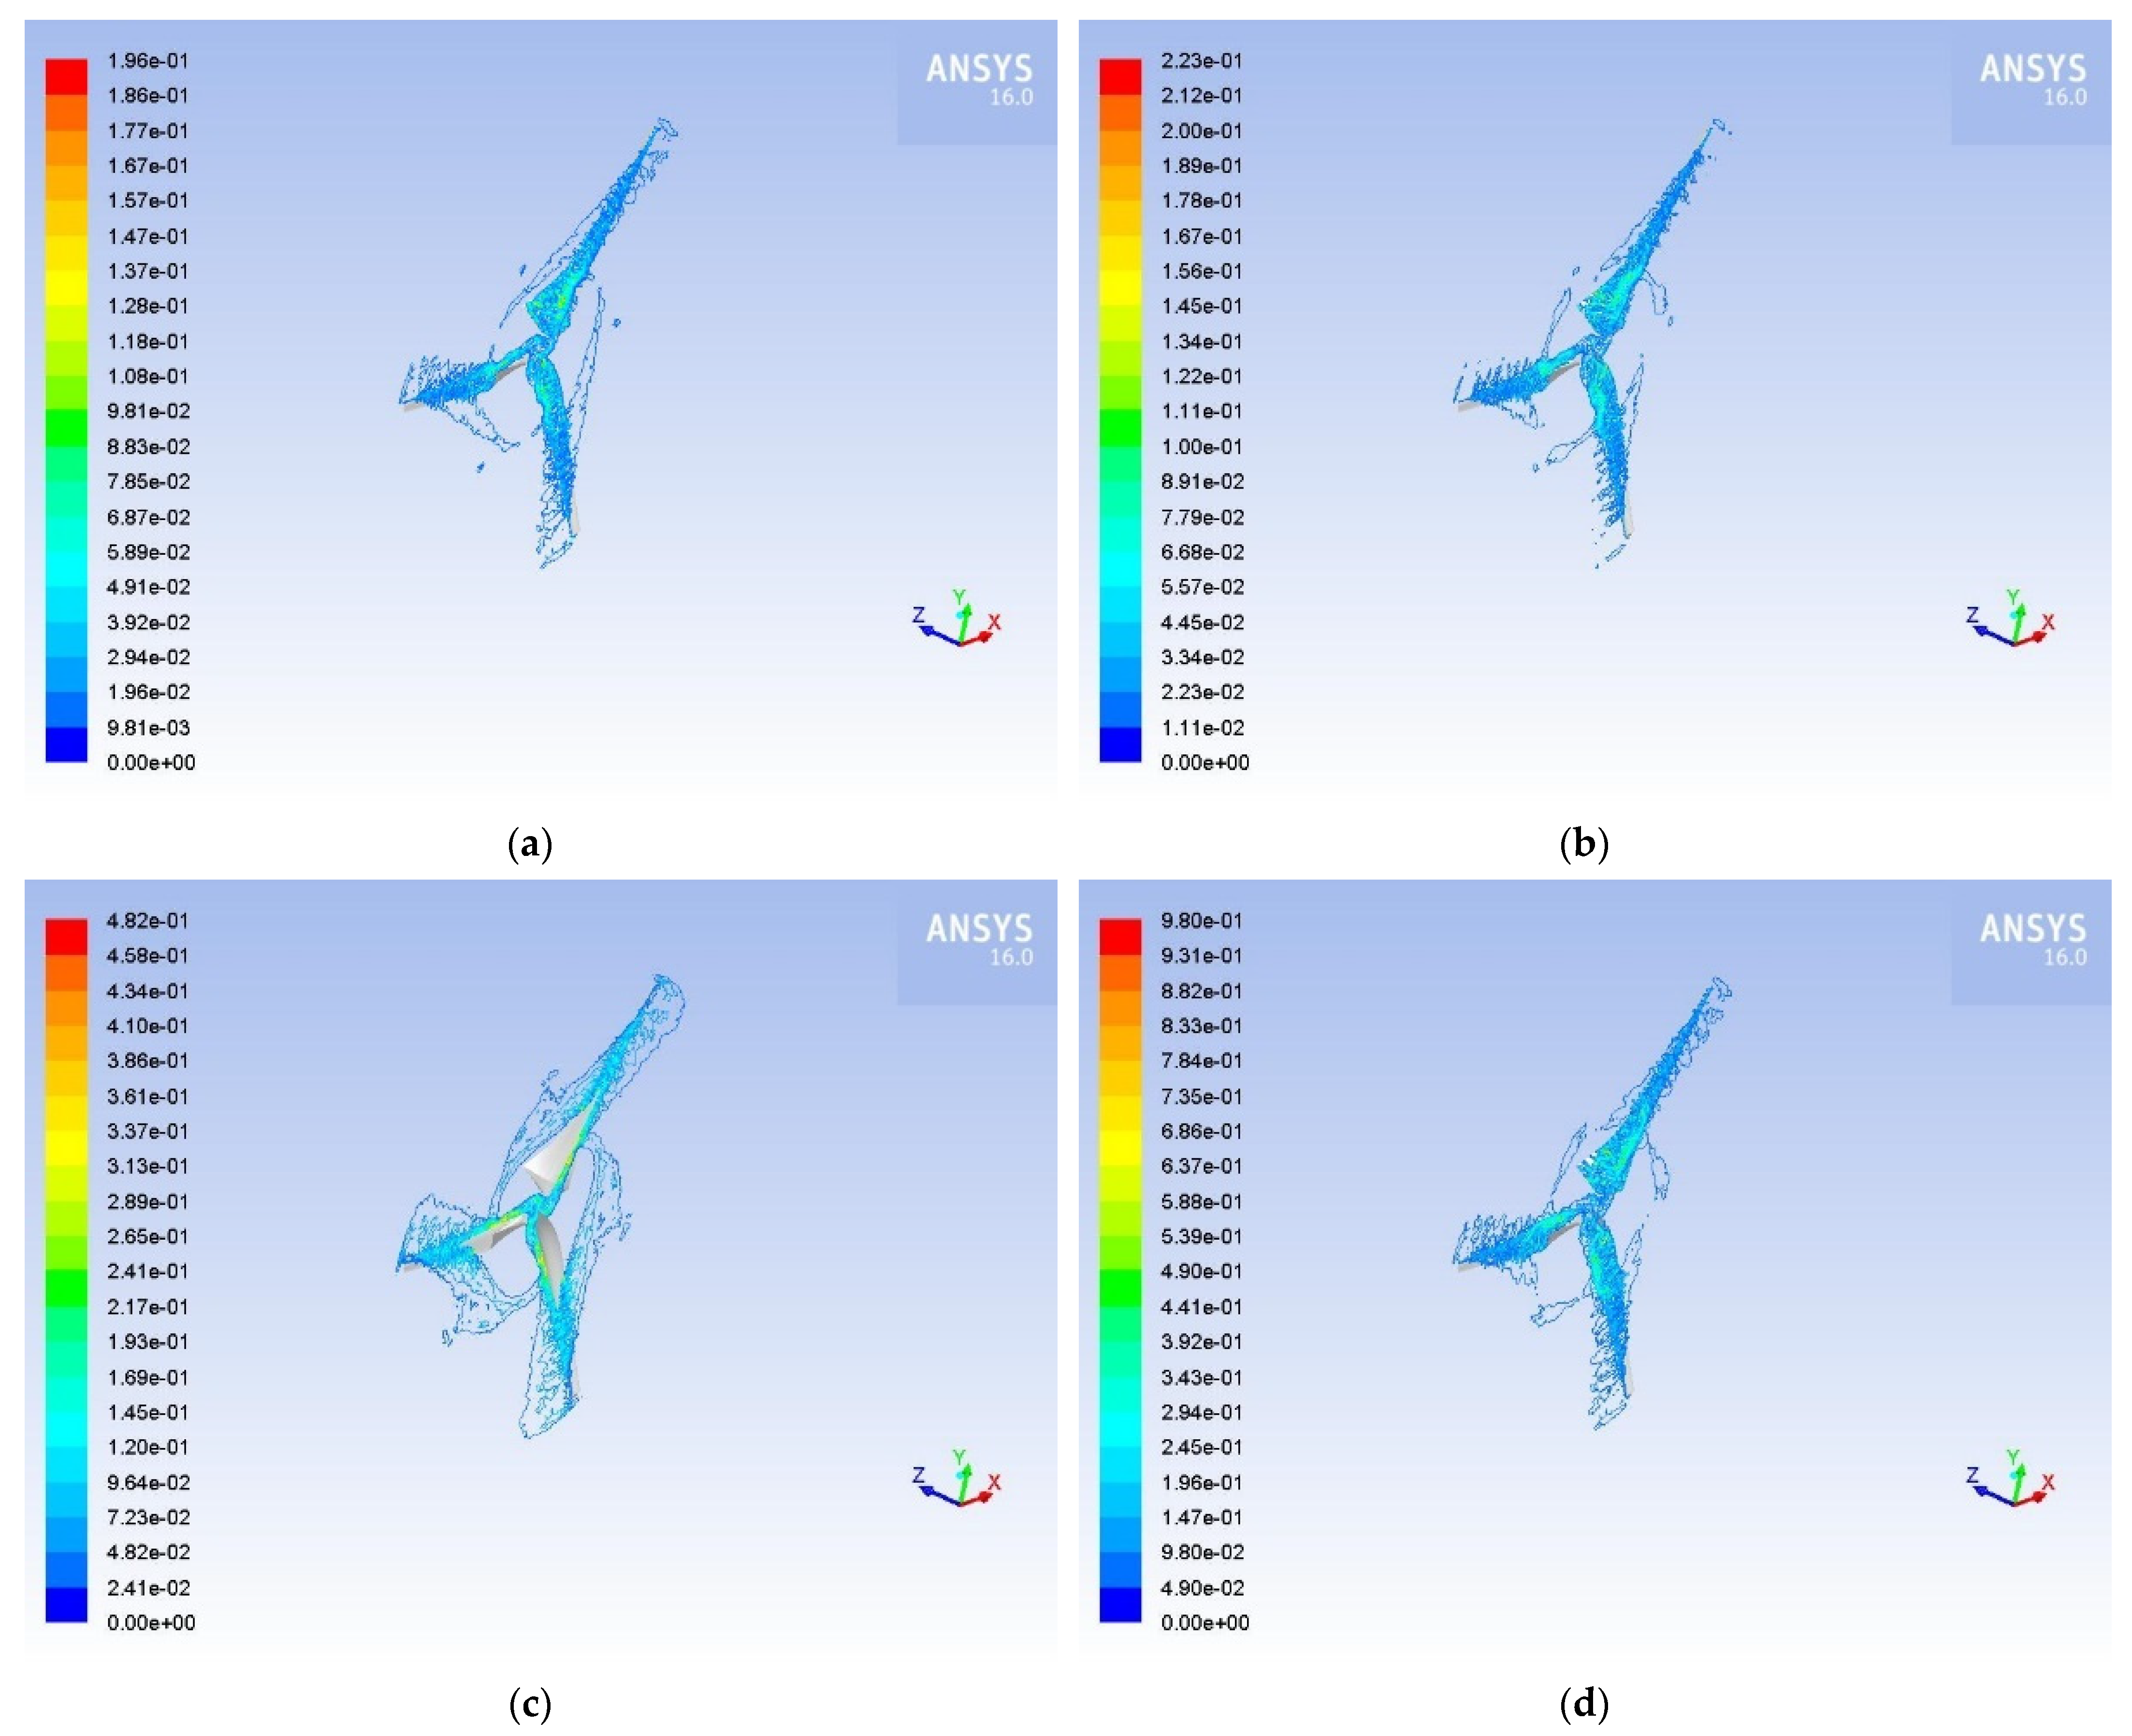
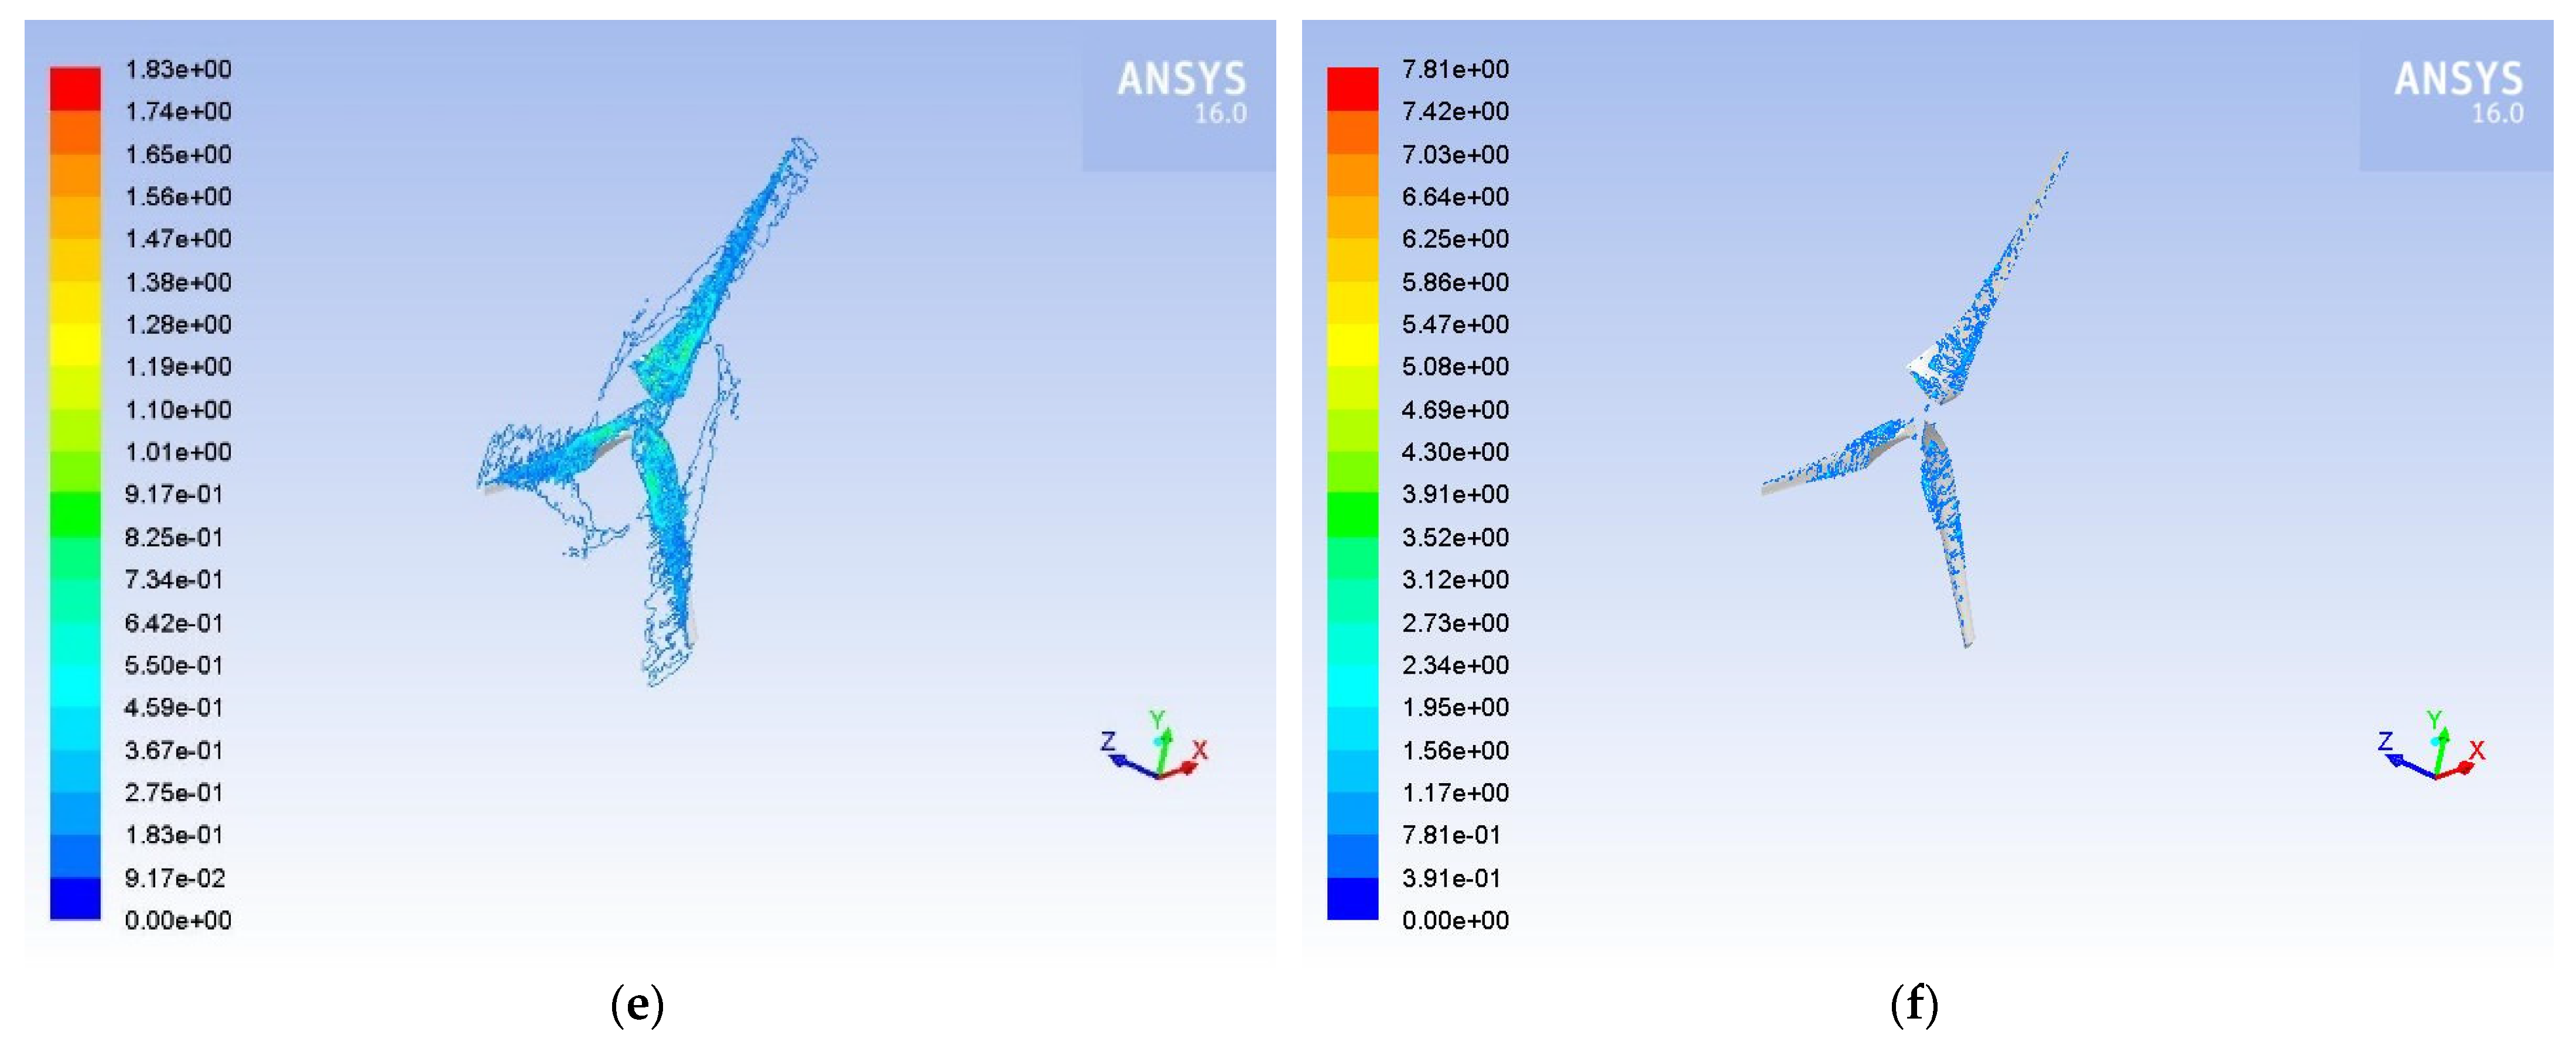
Furthermore,
Figure 11 shows the concentration of sand particles around the rotor for the three Q values studied and for wind speeds of 10 m·s
−1 and 15 m·s
−1. In all cases, the sand particles appear to be more concentrated in the areas where the air velocity is increased, i.e., towards the hub. With increasing sand particles concentration and with increasing wind speed, more sand particles are concentrated on the rotor of the wind turbine.
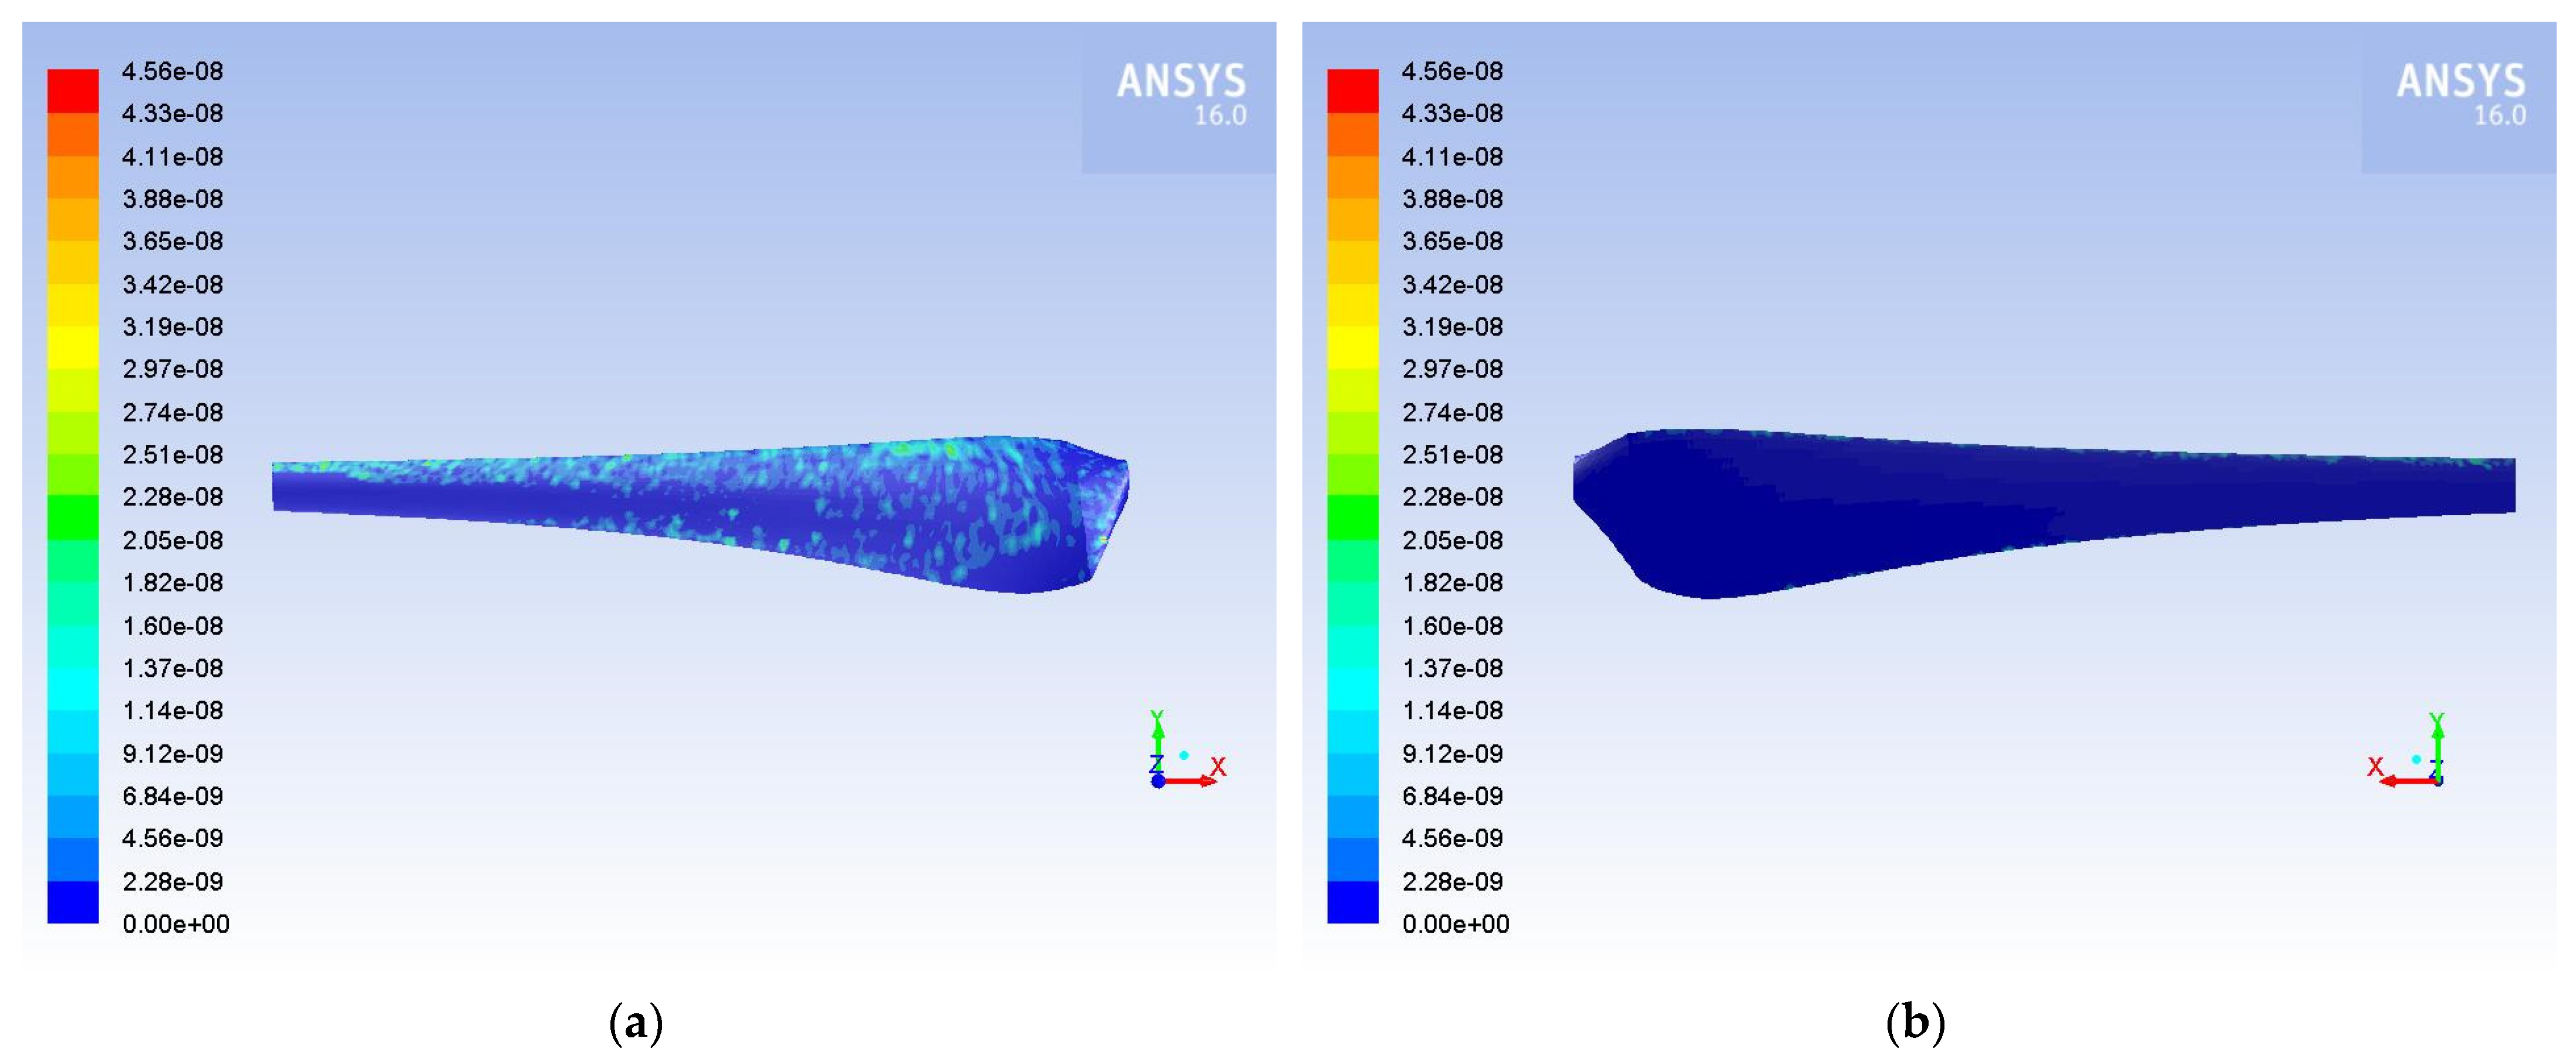
Figure 12 shows the rate at which the sand particles are dissipated on the HAWT blade for Q = 10% and a wind speed of 15 m·s
−1. It can be noted that sand particles are mainly concentrated in the area near the leading edge along the blade, on both sides of the blade, where stagnation points appear and velocity obtains the lowest values, while static pressure reaches the highest values. Approaching the hub, sand particles are dissipated on a larger area on the pressure side of the blade, adding an extra weight, which leads to a greater loss of lift, and finally resulting in reduced power output of the wind turbine.
Figure 13 shows the erosion rate on the blade for the same flow conditions, and it can be seen that the areas where sand is dissipated at a higher rate are those subject to the highest erosion rate. That means in practice that in these areas, the use of special coatings or more durable material in the construction of the blade is recommended for wind turbines operating in dusty environments, i.e., deserts or coastal areas.
4. Conclusions
The present study was designed to determine the effect of dusty environments in the operation of a HAWT, examining both the power output degradation and the flow field over the rotor. An optimized rotor of a three bladed HAWT, with blades constructed from S809 airfoil, was calculated with the help of a user-friendly application named TTBEM and designed by QΒlade. Furthermore, ANSYS Fluent 16.0 was utilized for the numerical simulation, where the MRF model was applied for the blades rotation and DPM model for the dust injection in the flow field.
The findings of this investigation complement those of earlier studies as they confirmed that the aerodynamic performance of a HAWT operating in dusty environments degrades, since it degrades when it operates in hailstorm conditions [
41]. The power output of the HAWT was reduced from between 1.24% and 9.04%, depending on the conditions.
From the visualization of the flow field, it was clear that with increasing sand particle concentration in the air, the wake became weaker and the minimum velocity values decrease. For higher wind speed, the velocity distribution pattern was the same, but the range of values increased, and the wake fading was faster. From the presentation of the static pressure distribution on the blade, similar distribution was observed for all cases studied, but with the increase in dust in the air, maximum values of static pressure decreased and at the same time the lowest values increased, leading to a decrease in lift. Furthermore, the sand particles tended to concentrate more towards the hub, and with increasing sand particles concentration and wind speed, the particles on the rotor appeared to become more plentiful. In addition, it was observed that the particles were mainly dissipated in the area near the leading edge along the blade and on the pressure surface of the blade, where static pressure obtained the highest values. Approaching the hub, the particles were concentrated in a larger area on the blade’s pressure surface, creating a negative impact on the produced power by the wind turbine. The areas where the highest dissipation rate of sand were identical to the areas with the highest erosion rate.
These findings have significant implications for the understanding of how hazard conditions affect the aerodynamic performance of wind turbines. Taken together with the results of previous studies concerning the effect of hailstorm on HAWTs [
41], these findings support strong recommendations to wind turbine blade designers and manufactures for HAWTs sited in areas with hazard conditions.


