
Organization of Control of the Generalized Power Quality Parameter Using Wald’s Sequential Analysis Procedure


1
Department of Electroenergetics, Power Supply and Power Electronics, Nizhny Novgorod State Technical University R.E. Alekseev, 603950 Nizhny Novgorod, Russia
2
Department of Research on the Relationship between Energy and the Economy, Energy Research Institute of the Russian Academy of Sciences, 117186 Moscow, Russia
3
Department of Hydropower and Renewable Energy, National Research University “Moscow Power Engineering Institute”, 111250 Moscow, Russia
4
Department of Power Supply and Electrical Engineering, Irkutsk National Research Technical University, 664074 Irkutsk, Russia
*
Author to whom correspondence should be addressed.
Inventions 2023, 8(1), 17; https://doi.org/10.3390/inventions8010017
Submission received: 4 December 2022
/
Revised: 5 January 2023
/
Accepted: 9 January 2023
/
Published: 10 January 2023
(This article belongs to the Special Issue Recent Advances and Challenges in Emerging Power Systems)
Abstract
:This paper analyzes the key defining features of modern electric power distribution networks of industrial enterprises. It is shown that the requirements set by industrial enterprises with respect to power quality parameters (PQPs) at the points of their connection to external distribution networks of utilities have been becoming increasingly strict in recent years. This is justified by the high sensitivity of critical electrical loads and distributed generation facilities to distortions of currents and voltages from a pure sine wave. Significant deviations of PQPs lead to significant damage at the consumer end due to the shutdown of electrical equipment by electrical and process protections as a result of overheating and increased wear and tear of individual elements of process lines. This necessitates the implementation of continuous monitoring systems at industrial enterprises, or sampling-based monitoring of PQPs at the boundary bus with an external distribution network. When arranging sampling-based monitoring of PQPs at certain time intervals, only those parameters that are critical for specific electrical loads should be calculated. We provide a rationale for the transition from the monitoring of a set of individual PQPs to a generalized PQP with the arrangement of simultaneous monitoring of several parameters. The joint use of the results of simulation and data from PQP monitoring systems for PQP analysis using the sampling-based procedure produces the desired effect. We present an example of a sequential decision-making process in the analysis of a generalized PQP based on Wald’s sequential analysis procedure. This technique makes it possible to adapt the PQP monitoring procedure to the features of a specific power distribution network of an industrial enterprise. We present the structural diagram of the device developed by the authors, which implements the sampling-based monitoring procedure of the generalized PQP. We put forward an approach for determining the average number of sampling data points required to make a decision about the power quality in the implementation of the sequential analysis procedure.
1. Introduction
Modern electric power distribution networks (EPDNs) of industrial enterprises are growing increasingly complex due to the integration of various types of generating units (GUs) of distributed generation (DG) facilities, including those based on renewable energy sources (RESs), electricity storage systems (ESSs), and nonlinear loads with power electronic components (e.g., soft starters, variable-frequency drives, uninterruptible power supply units, etc.). The operation of DG and ESS facilities as part of the EPDN makes them active, allowing them to change the mode of electricity consumption in accordance with the signals of the electricity market, which contributes to reducing the cost of power supply [1,2,3]. The use of RESs—mainly rooftop solar power plants—reduces the carbon footprint by decreasing the value of specific CO2 emissions per unit of output. The need for this is due to the 2023 introduction of the carbon tax in the European Union, with goods exported to the EU from countries with high levels of atmospheric CO2 emissions subject to the tax. Thus, the more visible the carbon footprint of an industrial enterprise, the less attractive it will be to consumers and investors.
The main task of the EPDN is to provide a reliable power supply to electrical loads in both steady and transient states [4,5]. However, given the wide adoption of RESs, with their stochastic mode of power generation, as well as in the context of switching high-power electrical loads on/off (as required by specific features of processes), the EPDN records a significant increase in the amplitude of random fluctuations of power flow parameters, with significant deviations of power quality parameters from their standard values [6,7,8].
The generating units of DG facilities have low values of mechanical inertia constants, as well as low rates of loading when using GUs based on turbocharged internal combustion engines. The rate of electromechanical transients in the EPDN as a result of various disturbances in the island/isolated operating states (e.g., short circuits, significant load surges/shedding, etc.) is 3–10 times higher than in large power systems [9,10].
Simultaneous application of nonlinear loads with power electronic components in the EPDN can lead to prolonged transients and, in some cases, to persistent self-induced oscillations of operating state parameters. When a load of electrical equipment with power electronic components is no more than 30% (for example, uninterruptible power supply units), the total harmonic current distortion (THDi) increases significantly, and the smaller the load, the greater the THDi [11].
The THDi values and the consequences of its growth in the EPDN are as follows:
- THDi < 0.1—normal situation, with no faults in the operation of electrical equipment;
- 0.1 < THDi < 0.5—significant pollution of the EPDN by harmonic components, with the danger of increasing the temperature of electrical equipment, which necessitates the transition to larger cross-sections of cable lines, as well as the use of GUs of DG facilities and backup power supply sources of higher capacity;
- THDi > 0.5—a large degree of pollution of the EPDN by harmonic components, which can lead to failures and shutdowns of electrical equipment due to overheating; requires the installation of filtering and compensation devices.
Significant PQP deviations in the EPDN affect particularly critical electrical loads that are sensitive to deviations from the pure sine wave of currents and voltages, including modern process lines, automatic process control systems, server and network equipment of data centers, etc., causing increased wear of their components and leading to tripping by electrical and process protections [12,13].
The greatest damage to consumers is caused by voltage sags, which are short-term reductions in the RMS voltage on the buses of electrical loads. Some electrical loads are disconnected by protections in case of voltage sags when the RMS value of the voltage drops below 90% of Urated within one or two periods of the utility frequency [14].
Moreover, voltage sags have a negative effect on low- and medium-power GUs of DG facilities, which are disconnected by protection relays with either minimal time delays or no time delays. As a consequence, the balance of generated/consumed active/reactive power in the EPDN is disturbed, which leads to more significant deviations of the operating state parameters and further aggravation of the operating state. Emergency shutdowns of GUs of DG facilities in the EPDN often cause shutdowns of process lines, with corresponding economic damage. Statistical data attest to the fact that emergency disturbances in external distribution networks lead to a cascading development of accidents in the EPDNs of industrial enterprises [15,16].
In Russia, regulation of PQPs at the boundary bus between the utility and the industrial consumer is performed in all states of operation of external distribution networks, except for those containing operating state deviations associated with random events, such as the following:
- Voltage sags (less than 90% of Urated in at least one phase);
- Voltage interruptions (less than 5% of Urated phase voltage in all phases);
- Overvoltages and surge voltages (switching and atmospheric overvoltages).
Hence, the cycles (short circuit, protective relay tripping, operation of automatic reclosing devices or automatic use of backup power, and associated self-starting of motors) are not subject to standardization. At the same time, it is short-term voltage sags and interruptions that cause significant damage at most industrial enterprises [17,18].
In the U.S., the economic losses from power outages due to voltage sags and interruptions for all categories of consumers amount to about USD 79 billion annually. The distribution of damages by consumer type is as follows: commercial—72% (USD 56.8 billion), industrial—26% (USD 20.4 billion), and residential—≤2% (USD 1.5 billion) of total damages. At the same time, two-thirds of the total annual damage—67% (USD 52.3 billion) results from voltage sags due to short circuits in external distribution networks [19].
Under these circumstances, industrial enterprises are forced to install systems of continuous PQP monitoring or sampling-based PQP monitoring in the EPDN to record PQP deviations at the boundary with external distribution networks, in order to make claims to utilities for reimbursement of damages.
The purpose of this article is to justify the expediency of the transition in the EPDN from the monitoring of a set of individual PQPs to a generalized PQP with the arrangement of simultaneous monitoring of several parameters, as well as the effectiveness of the joint use of simulation results and data from PQP monitoring systems to conduct a detailed analysis of PQPs with the use of a sampling-based monitoring procedure.
The systems of continuous monitoring or sampling-based monitoring of PQP implemented by industrial enterprises in the EPDN allow the following tasks to be accomplished:
- To keep the mix and values of regulated PQPs up to date based on periodic review of regulatory requirements and accumulated statistical data, as well as requirements for the efficiency of manufacturing processes and the quality of manufactured products;
- To determine the current operating conditions of the EPDN on-line;
- To carry out continuous automated data collection and processing, analysis, and reporting on PQP deviations from their standard values;
- To create a statistical database on PQPs for information support of the operation of electric power quality management systems;
- To identify critical areas of the EPDN, where deviations of PQPs are the most significant and occur quite often, which requires the arrangement of their continuous monitoring and control;
- To identify (and contain) sources of current and voltage distortions that may cause significant damage, in order to implement measures to change their operating state or power distribution circuit to mitigate the negative impact;
- To make recommendations addressed to duty officers on the implementation of organizational and engineering measures to bring the PQPs to their standard values;
- To determine the most effective ways of load balancing to compensate harmonic components in currents and voltages generated by a nonlinear load with power electronic components;
The introduction of systems of continuous monitoring or sampling-based monitoring of PQPs corresponds to the trend towards making modern EPDNs intelligent, thereby significantly expanding the possibilities of controlling the power flow and power quality, which contributes to improving the reliability of power supply to consumers [22,23].
It is generally believed that the voltage profile in the event of a sag has a rectangular shape, but this is not the case—especially in the EPDNs of industrial enterprises—due to the processes of braking and self-starting of motors after the elimination of a short circuit. In real-world conditions, there is voltage at the terminals of, for example, an induction motor (IM) until the free currents in the rotor have faded and the rotor has stopped. For low-power IMs, the voltage attenuates quickly, but for large IMs it takes a few seconds if there is no static load on the same buses. During a power outage, the static load consumes electricity derived from the kinetic energy of the rotation of the IM rotors, and the losses in the IMs increase proportionally to I2R. These two factors accelerate the processes of reducing the rotation speed and the values of free currents in the rotors of IMs [24].
Analysis of the results of calculations of transients shows that the duration of self-starting of motors after elimination of a three-phase short circuit is approximately equal to the duration of a short circuit, provided that it does not exceed 0.5–1 s (Figure 1). Therefore, the time during which the voltage is reduced at the terminals of electrical loads is almost twice as long as the duration of the short circuit. When the duration of a short circuit exceeds 1 s (tripping backup protections), self-starting of electric motors becomes either prolonged or completely impossible.
With a non-rectangular voltage sag shape (Figure 1), the impact on the operation of critical electrical loads can be both underestimated and overestimated. With the different mix of the generating equipment and motors that are switched on, the deviations of the voltage sag shape from the rectangular one may vary. Therefore, the use of conventional methods for estimating voltage sag has its limitations, since the depth and duration of the sags cannot be measured accurately.
Taking into account that the allowable time for decision-making in the EPDNs of industrial enterprises with DG facilities is tens to hundreds of milliseconds, the estimation of voltage parameters at short time intervals by means of digital signal processing has significant errors [25,26]. Consequently, to make decisions about the acceptability of voltage sags for critical electrical loads, and to determine the possible damages, it is advisable to use statistical methods [27].
PQP monitoring systems that are currently in operation and being implemented in EPDNs adopt the following two main approaches:
- Centralized data processing, as a rule, requires a large bandwidth of data transmission channels and significant computing power of the central computing device [28].
To implement the above approaches, algorithms for digital signal processing with a low degree of computational complexity are usually used, allowing the creation of relatively inexpensive equipment for PQP monitoring systems. When creating PQP monitoring systems in the EPDN, both of these approaches are often used in some combination [31,32].
Power quality monitoring systems (PQMSs) use large amounts of various data, so both meters of power quality monitoring and various intelligent electronic devices serve as sources of information for them: phasor measurement units, terminals of digital power system protection, digital loggers of alarm events, digital substation interfacing devices, etc. [33,34,35].
The PQMS performs the processes of collection, primary processing of data on voltages and currents on the buses and branches of the EPDN, and their transfer to the storage system for analysis and interpretation of data for subsequent decision-making on compliance/non-compliance of PQPs with regulatory requirements (Figure 2).
The process of analyzing PQP data was previously performed manually, but the use of digital signal processing techniques and intelligent decision-making techniques has allowed the development and implementation of algorithms for automatic analysis and interpretation of power quality data. The data placed in the storage system can be used to solve the problem of estimating the current PQP values in the EPDN, identifying critical areas of the EPDN—in which PQP deviations are most significant—in order to provide recommendations to duty officers to implement organizational and engineering measures to bring the PQPs to their standard values [36,37].
From the process standpoint, the EPDN should satisfy the electrical loads not only in quantitative terms (i.e., power and amount of electricity), but also in terms of qualitative parameters, e.g., a set of PQPs or a generalized parameter and its variance. The main components of the statistical distribution of the generalized index (i.e., mean value, variance) fully describe both measurable (quantitative) attributes of power quality and non-measurable (alternative) attributes that are qualitative in nature.
2. Materials and Methods
Various distributions of both discrete and continuous random variables are known [38]. Discrete distributions are used to model binary events, relative to which we can conclude that there was or was not a PQP deviation. For example, when arranging PQP monitoring by recording the facts of their deviations from standard values, a random binary event is only the fact of the presence or absence of such deviations. Continuous distributions describe the estimated parameters of currents and voltages associated with the power quality, which are quantitative attributes that can take an arbitrary numerical value in a range of acceptable values [39,40].
When using methods of mathematical statistics in the PQMS, one should distinguish between the tasks related to the distribution of the PQPs and the tasks related to the modeling and application of monitoring techniques. When analyzing PQP distributions, the results of the EPDN’s operation are analyzed in terms of random changes in the parameters of currents and voltages. When modeling (i.e., statistically describing) PQP monitoring procedures, the main attention is paid to the mathematical description of the ways of obtaining and processing data to form the current PQPs, along with the issues of efficacy and accuracy of monitoring PQPs, based on which control actions should be implemented in the EPDN in order to bring the PQPs to their standard values. The following distributions of random variables are used when implementing statistical monitoring procedures:
- The hypergeometric distribution determines the numerical value of deviations of PQPs that made it to the aggregate sample, while taking into account the decision-making during monitoring on deviations, as governed by the “acceptable/not acceptable” principle. The hypergeometric distribution from the outset assumes the process of sampling and the execution of the monitoring procedure;
- The binomial distribution is used when estimating the aggregate timed sample of a PQP (a composite parameter) when each instantaneous value has a probabilistic nature and may or may not correspond to the established standard values. The sampling-based monitoring procedure in the analysis of the binary “conform/fails to conform” relationship is modeled by the binomial distribution;
- Poisson distribution can be applied when investigating the distribution of non-conformities, including those of individual PQPs at certain time intervals. The use of this distribution to analyze the results of sampling-based monitoring of PQPs is implemented in order to mathematically simplify the relations of hypergeometric and binomial models of monitoring procedures;
- The normal distribution, as a rule, describes the cumulative result of monitoring with respect to alternative PQPs, as well as modeling the distribution of quantitative PQPs as a source of continuous random variables [27].
It is important to observe the conditions of Mood’s theorem, which determines the feasibility of introducing sampling-based monitoring for PQPs, taking into account a given distribution, when implementing the sampling-based monitoring of PQPs.
Suppose that there is some set of N PQP values sampled in certain moments of time. When arranging sampling-based monitoring, a truncated sample with a size of n values is analyzed. Let us introduce a random quantity D characterizing the number of deviations in the aggregate sample of N samples of PQPs, where D takes values in the range i = 0 … N. Each numerical value D from the aggregate sample can be assigned a probability P(D = i), where i ∈ 0 … N. Then, there are the expected value M[D] and the variance of the number of identified PQP deviations in the aggregate sample equal to
Let us determine the correlation coefficient ρ between the number of deviations d (d < D) of PQP in the truncated sample of size n and the number of deviations (D − d) of PQPs in the untested residue.
The correlation coefficient can be one of the following:
- Positive , when , or ;
- Negative , when , or ;
- Equal to zero , when , or .
If there is no statistical correlation between the number of PQP deviations in the sample and in the untested residue (correlation coefficient ), or if the correlation is negative , then it is inexpedient to perform sampling-based monitoring, because it fails to provide any additional useful information. Thus, introducing sampling-based monitoring makes sense only when or }.
Therefore, statistical analysis and monitoring of power quality should be understood as sampling-based analysis and monitoring of PQPs, as based on the application of methods of mathematical statistics to determine whether they conform to established specifications. In contrast to the manufacturing of industrial products, the results of statistical analysis and monitoring of PQPs in the EPDN can be used not only to determine their compliance at specified intervals with regulatory requirements (i.e., the terms of contractual obligations to supply electricity), but also to implement control actions on electrical equipment to bring the PQPs to their standard values [41,42].
Statistical analysis and monitoring of PQPs can be single-stage, two-stage, multistage, or sequential [43].
In the course of single-step monitoring, the decision on the analyzed PQPs at a given time interval is formed only on the basis of one aggregate sample of these PQPs at a given time interval.
In two-step monitoring, the decision on conformity of PQPs with the regulatory requirements is made based on the results of testing of no more than two aggregate samples, and the selection of the second sample depends on the results of the monitoring of the first one. In this case, the number of identified PQP deviations in the first sample is insufficient for making a decision, and it is made based on the sum of the results of both checks. An advantage of two-step monitoring is that on average it requires less sampling (by 20–30%) than single-step monitoring, but its implementation requires more involved algorithms.
Multistep and sequential monitoring use a number of consecutive samples, and with multistep monitoring the maximum number of samples is limited, whereas with sequential monitoring there are no such constraints. In both cases, the processing of the subsequent sample depends on the results of the previous check. During sequential monitoring, a minimum number of timed samples of PQPs are required to make a decision about their falling within the range of acceptable values. Therefore, PQP monitoring using the sequential analysis procedure is appropriate, especially when high performance of the PQP monitoring system is needed.
3. Results
In the standardization systems of some countries of the world, PQP monitoring is reduced to determining the mix and acceptable ranges of deviations of individual parameters [44,45]. In real-world conditions, there is a complex (integrated) impact of PQPs on the electrical loads of consumers. At the same time, distortions of currents and voltages, as a result of an entire set of PQP deviations that border the area of acceptable values, can cause serious negative consequences and damages for specific consumers.
Therefore, when analyzing power quality, the following should be undertaken:
- To form a generalized PQP, which can be used to estimate the comprehensive impact of a set of deviations of individual PQPs on the operation of electrical loads of a particular consumer;
- To determine the ranges of acceptable deviations of the generalized PQP, within which no damage occurs to specific consumers. This problem can be solved using simulation data for various circuit/operating state situations and the operating conditions of a particular consumer, including in the main maintenance circuits of the external distribution network;
- To develop a procedure for sampling-based monitoring of PQPs on the basis of the generalized PQP for subsequent decision-making on the implementation of organizational and technical measures to bring the generalized PQP into the acceptable range.
Deviations of PQPs at the connection points are subdivided into continuous changes and random events. The latter, as a rule, do not have a significant impact on the operation of the electrical loads of consumers, due to their short duration, and they do not require the implementation of organizational and engineering measures in order to bring the PQPs into the acceptable range.
To estimate the parameters of currents and voltages in various digital devices, including PQP monitoring devices, short time intervals (sliding data window)—for example, constituting one period of the utility frequency—are delineated. The required accuracy of estimation in determining the parameters of distorting harmonic components within such short time intervals cannot be achieved. As a consequence, the results of calculations of some PQPs will not be accurate and will not match the actual situation with distortions of currents and voltages in the EPDN.
Determination of the conformity of PQPs with regulatory requirements should be carried out during control in the process of monitoring of PQPs. Depending on the characteristics of the EPDN, as well as the financial capabilities of industrial enterprises, both continuous and sampling-based monitoring of PQPs can be arranged. With continuous monitoring, measurements and calculations of all PQPs are carried out at every moment of time and at all points of connection of consumers to external distribution networks. Given the economic feasibility factor, such a form of monitoring is unacceptable in most cases. During the sampling-based monitoring, the PQPs are evaluated at individual time intervals and at predetermined monitoring points, with the calculation of only those PQPs that are critical for a particular consumer, taking into account their process-related features.
It is expedient to organize the sampling-based monitoring of PQPs with the use of special sampling procedures of mathematical statistics [43]. In the process of observation within the limited time interval, a conclusion can be formed about the compliance with regulatory requirements within the time period until the next sampling-based monitoring.
As is attested by available experience, it is preferable to arrange the monitoring of PQPs on a quantitative basis. Given such monitoring at the points of connection of electrical loads with respect to the entire set of the calculated PQPs, it is possible to establish the validity of alternative hypotheses of conformity or non-conformity of PQPs with the regulatory requirements [41].
Let us assume that the power quality is characterized by k independent parameters. Then, the result of PQP monitoring is defined by the k-dimensional column vector , in which each component xj is binary and takes the value of 1—under unacceptable PQP deviation with respect to the j-th index—or 0—under acceptable PQP deviation.
The sampling-based monitoring of the PQP is performed within the interval, including N samples of current (voltage) signals. Let us use (0 ≤ ≤ N, j = 1, 2, …, k) to denote the number of deviations with respect to the j-th PQP and assign a random k-dimensional vector . Let the component be distributed as governed by the binomial distribution with the parameters n and , where is the probability of the parameter deviating from the acceptable value. Provided that the individual PQPs are independent, the distribution governing the vector m takes the following form:
Estimation of probabilities qj for a particular EPDN can be obtained from the results of simulation or monitoring of PQPs in various conditions of EPDN operation over a long time interval as related to its circuit and operation.
Let us introduce a generalized (composite) PQP in the form of
where is the column vector of weight coefficients, which determines the ratio of damages from violations of power quality in the event of deviations of individual PQPs.
In [46] it was proposed to group the monitored parameters in the selection of weight coefficients based on the amount of damage associated with the deviation of individual PQPs (a group thereof), with the assignment of the weight . The grouping of PQPs can be carried out using the structured expert judgment technique.
Since in Equation (2) each component of the vector m is distributed as governed by the binomial distribution with the probability independent of n, the random variable , as a linear combination of asymptotically normal quantities (j = 1, 2, …, k), also has an asymptotically normal distribution with the expected value and variance :
The degree to which the distribution approximates the normal distribution depends largely on the vector c and the numerical values of the probabilities .
Let us test the hypothesis that the mean value of the normally distributed PQP value with known variance does not exceed the specified value. Let us assume that is a random PQP value with a time-varying mean value and a known variance , as determined by the current operating state of the EPDN and the accuracy of the current and voltage measurements by digital signal processing methods. Regarding the chosen generalized PQP , the following statistical problem can be solved: the hypothesis is tested that is less than or equal to the specified setpoint value mξset.
Let there be a set of N consecutive instantaneous sample values of one of the PQPs within the analyzed time interval. It is assumed that the ratio between the analyzed time intervals relative to the sampling interval in the digital processing of current and voltage signals is very large. Deviations of the entire set of PQPs from the regulatory values are recorded by estimating the expected value of the random variable . At each point in time, the values of the random variable can generally differ from one another, but the variance of the deviations is a known quantity, and the expected value (mean) within the analyzed time interval is unknown.
To illustrate the logic of making a decision based on the generalized PQP, let us stipulate that it is preferable to have a smaller value of (e.g., a smaller value of the deviation value from the standard value). Let us specify the setpoint value such that when the deviations of the generalized PQP will be considered acceptable, and when the decision on non-compliance of the generalized PQP with the standard value will be made. When , there will be uncertainty in the process of deciding whether or not the PQP conforms to requirements. Furthermore, if increases (decreases) in the course of sequential sampling-based monitoring, then the degree of confidence in the power quality for the analyzed EPDN operating state decreases (increases) accordingly.
When performing sequential sampling-based monitoring, values of and and ) are specified at which the decision on conformity of the generalized PQP with the standard value is considered in view of damages. If , the wrong decision on the non-compliance of the generalized PQP is characterized by the so-called “supplier [utility] risk”, and the decision on the compliance of the generalized PQP if is characterized by the “consumer risk”. Thus, the area of conformity of the generalized PQP with the standard value is defined by the set of values, for which , and the area of non-conformity is defined by the set of values, for which . The region for which is the uncertainty region.
The risks inherent in the choices of and correspond to the values and and are characterized by the probabilities of making wrong decisions. The application of the sequential probability ratio criterion in the implementation of the decision-making procedure leads to the following relations: Let be a sequence of instantaneous values of the observed quantity characterizing the power quality. The probability density of the sample , if corresponds to the following Equation:
and if , to the following Equation:
During the sequential analysis procedure, at each step, the likelihood ratio is calculated, which is defined by the following equality:
Step-by-step calculations are performed as long as the following conditions are met:
The sequential analysis procedure ends with a decision on the deviation of the generalized PQP from the standard value if
With respect to whether the value of the generalized PQP belongs to the acceptable deviation range, if
The setpoint values of A and B are defined by the following Equations:
By taking the logarithm of and transforming Equations (7)–(9), we can obtain
By adding the summand to both parts of the inequalities and dividing by , we arrive at the following relations:
Inequalities (14)–(16) make it possible to implement the monitoring of the generalized PQP with the help of “acceptance” numbers. For each step m of the sequential analysis procedure, the “acceptance” number is calculated by the following Equation:
and the “rejection” number is calculated by the Equation
The numbers (relations a(m), b(m)) are calculated in advance and used as setpoint values. The sequential analysis procedure is performed as long as the following inequalities are satisfied:
When the sum of is outside the interval [a(m), b(m)], a decision is made as to whether the deviation of the generalized PQP from the set value is acceptable or not.
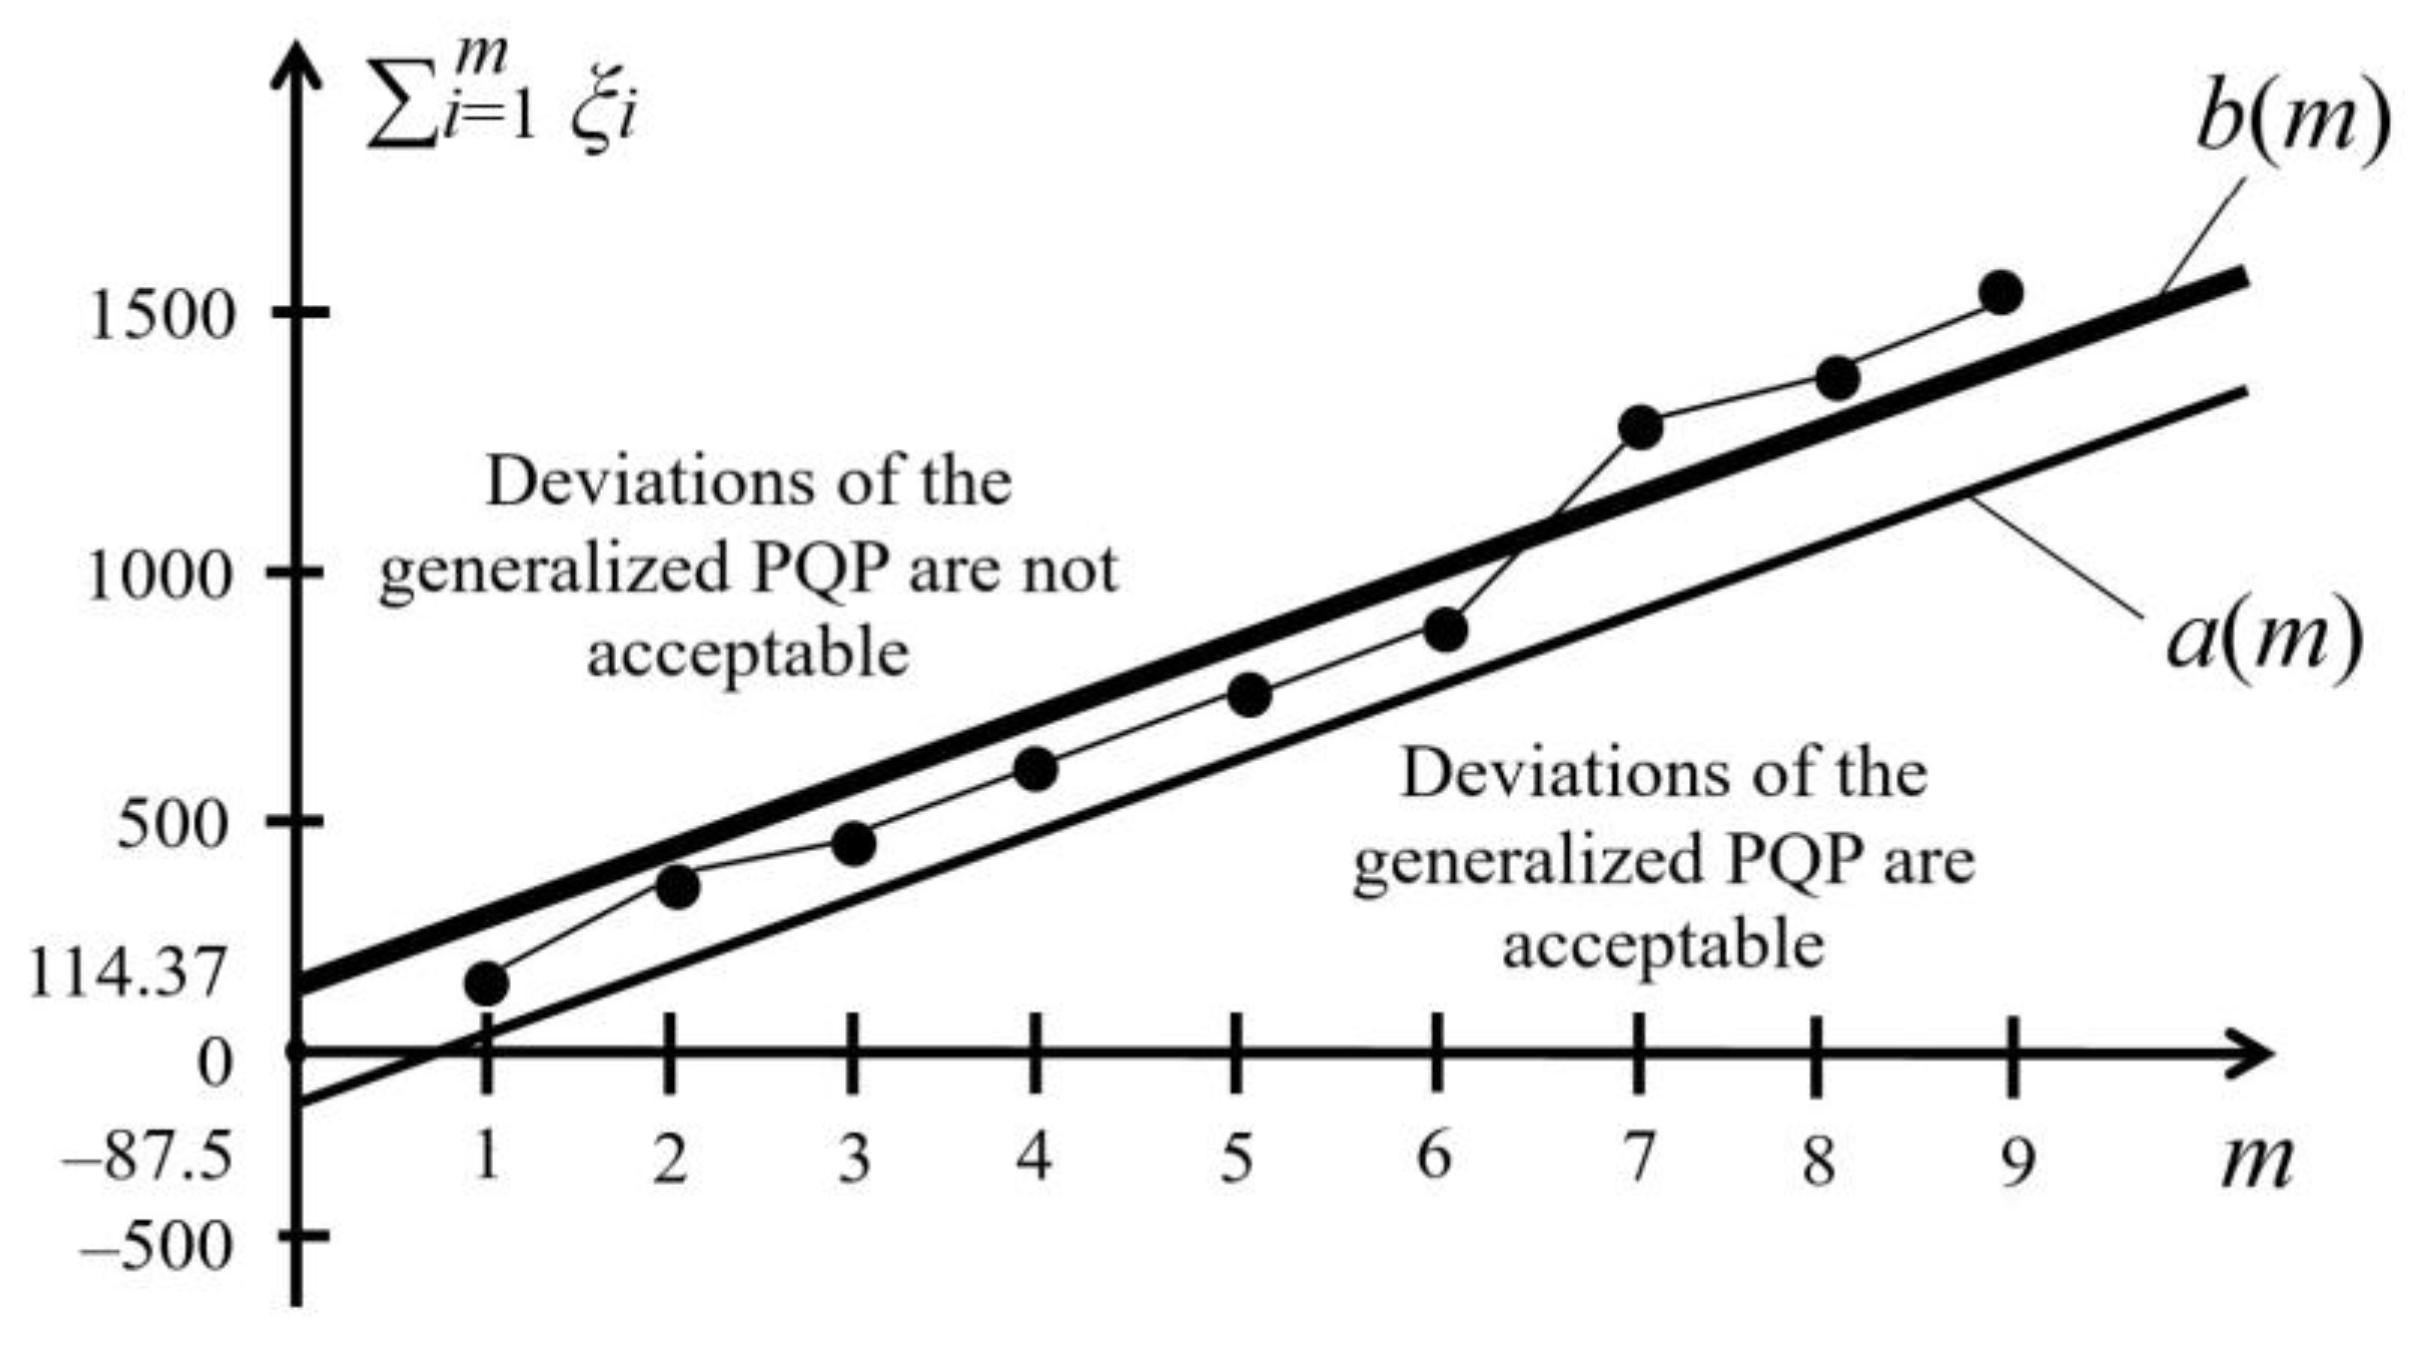
Let us present an example of arranging sampling-based monitoring of the generalized PQP in the EPDN while taking into account the weighting coefficients for individual parameters. Let us assume that, given the weight coefficients of individual parameters of the generalized PQP, the expected values and of the generalized PQP take the values = 130 and = 155. The value of the variance given the normal distribution is = 225. Let us set α = 0.01 and β = 0.03. In this case, the values of the acceptance and rejection numbers will be determined by the following Equations:
Let there be consecutive timed samples of the variable , the values of which are given in Table 1. Table 1 also includes the variables , a(m) and b(m), which vary from step to step of the sequential analysis procedure.
Figure 3 illustrates the process of sequential decision-making in the analysis of the generalized PQP.
In the graph (Figure 3), points ( )—descriptive of the decision-making process—are plotted. The coefficient s, which determines the slope angle of the setpoint limits a(m) and b(m), corresponds to the following Equation:
The setpoint limits are offset in relation to one another by the value of
The area between the setpoint limits is the area of uncertainty, which necessitates the continuation of the sampling-based monitoring procedure of the generalized PQP. The analysis of Figure 3 shows that the process of sequential analysis ends at step m = 7, when an unambiguous decision is made about the non-conformity of the generalized PQP with the established standard value.
Let us consider an approach to determining the average number of sampling-based monitoring data needed to make a decision about the power quality in the implementation of the sequential analysis procedure by the generalized PQP.
To determine the expected value of the number of sampling monitoring data (i.e., sample size) in the form of values of the generalized PQP, we can use the mathematical derivations obtained in [47]. For the problem under consideration, the probability ) that the sequential analysis procedure will end with a decision on the compliance of the generalized PQP to the established standard value, when mξ is the true mean value, is defined by the following equality:
where
The probabilistic relationship is called the operational characteristic of Wald’s sequential criterion. Since is an increasing function with respect to h, and h is a decreasing function of , is inversely related to .
The Equation for determining the average number n of sampling monitoring data points for the sequential analysis procedure associated with the power quality analysis and application of the generalized PQP is presented as the following equality [46]:
It is usually of interest to calculate the values of the operational characteristic for special values from the following set:
where by
When , the right-hand side of Equation (23) corresponds to an uncertainty of 0/0, and the expected value of the required number of sample data points for the sequential analysis procedure is as follows [47]:
Taking into account the previously stated conditions of the problem, let us calculate the value (as per Equation (24)) of the necessary average number of sample data points for the sequential analysis procedure when :
Thus, to arrange the sampling-based monitoring with the procedure of sequential analysis of the generalized PQP at the given points of connection of the EPDN of an industrial enterprise to an external power supply network, it is necessary to obtain an average of at least six outcomes of sampling-based PQP monitoring.
4. Discussion
To implement the procedure of sampling-based monitoring of the generalized PQP, a preliminary simulation is performed in order to form a database of acceptable deviations of the generalized PQP in the analyzed points of connection of the EPDN to an external distribution network for different states of its operation [42]. Simulation outcomes are entered into the memory unit of the power quality analysis device (Figure 4). Additionally, the memory unit receives information on possible damages at an industrial enterprise for specific points of connection of the EPDN of an industrial enterprise to an external distribution network, formed either by the results of simulation or by structural expert judgment, taking into account the deviations of each individual PQP [27].
Figure 4 shows an example of the structural diagram of the device that implements the sampling-based monitoring procedure of the generalized PQP with the use of sequential analysis.
The device implementing the procedure of sampling-based monitoring of the generalized PQP (Figure 4) includes the following: a power quality monitoring system, which is connected to the power quality monitoring devices (I1 … IM); a comparison unit, including comparison circuits (CC1 … CCN) for each of the PCIs; a multiplication unit, consisting of N multiplication units for each of the PCIs; a group adder unit; a sequential analysis unit; and a memory unit.
In the device that implements the sampling-based monitoring procedure of the generalized PQP (Figure 4), the set of processing (calculation) operations is carried out as follows: At each selected moment in time, the calculated PCI values arrive at the inputs of the comparison circuits from the power quality monitoring system. The other inputs of the comparison circuits receive the standardized PQP values from the memory unit as calculated for the current EPDN operating state. According to the results of the comparison performed in the comparison unit, a discrete vector of deviations is formed, whose components are multiplied by the corresponding weight coefficients included in the column vector , defining the damage values for disruptions of power quality with respect to individual parameters.
The group adder unit is designed to form a generalized PQP according to Equation (2), and from its output the sampled values ξi are fed to the input of the sequential analysis unit. The other input of the sequential analysis unit receives arrays of acceptance a(m) and rejection b(m) numbers, whose components correspond to the setpoint values for each step of the sequential analysis procedure. Figure 3 illustrates the decision-making process in the sequential analysis aided by a generalized PQP, where the sequential analysis process ends with assuming the hypothesis of an unacceptable deviation of the generalized PQP from the standard value.
The memory unit of the device (Figure 4), which implements the procedure of sampling-based monitoring of the generalized PQP, receives information about the current operating state of the power system (i.e., positions of switching devices, operating state parameters, etc.), where it is recognized, and the state number is assigned. Such information can come, for example, from the SCADA system or the system of the operational information package. In the memory unit, a set of standardized PQP values is selected from the archive for the corresponding operating state number; they are the weight coefficients and the current set of setpoint values a(m), b(m), received from the memory unit outputs by the comparison, multiplication, and sequential analysis units to analyze the power quality at the points of consumer connection to an external distribution network. Along with the information about the current operating state, the simulation data, structural expert judgment, and other information necessary for the operation of the device (Figure 4) are fed to the input of the memory unit before the power quality analysis is performed.
The results of the sampling-based monitoring of the generalized PQP are presented in the form of a discrete signal at the output of the sequential analysis unit. The appearance of “1” at the output of this unit indicates a deviation of the generalized PQP from the standard value (Figure 4), which can lead to incurring damage to the consumer. This occurs when the calculated value of the variables exceeds the upper setpoint limit b(m)—for example, for the case under consideration at step m = 7 (Figure 3). Consequently, implementation of organizational and engineering measures is required in order to bring the generalized PQP into the acceptable range [48,49,50].
5. Conclusions
It is advisable to introduce automated systems for monitoring power quality parameters using statistical data processing techniques and the formation of a generalized power quality parameter.
Given that the introduction of continuous monitoring of power quality parameters in most cases is not economically feasible, it is justified to implement sampling-based monitoring at certain time intervals, at predetermined monitoring points, with the calculation of only those parameters that are critical for a particular consumer, taking into account its specific process features.
When the power distribution network operates in quasi-steady states, it is promising to arrange the sampling-based monitoring of the generalized power quality parameter on the basis of Wald’s sequential analysis procedure.
The joint use of simulation outcomes, current operating state parameters, and sampling-based monitoring data from the power quality parameter monitoring system using Wald’s sequential analysis procedure allows the adaptation of the monitoring procedure to the specific features of a particular power distribution network of an industrial enterprise.
The implementation of the proposed approach, as implemented in the corresponding device, makes it possible to ensure reliable power supply to consumers’ electrical loads and prevent damages through the timely implementation of organizational and engineering measures when the generalized power quality parameter deviates from its standardized value.
This technique makes it possible to adapt the PQP monitoring procedure to the features of a specific power distribution network of an industrial enterprise.
Author Contributions
Conceptualization, A.K. and P.I.; methodology, S.F.; software, P.I.; validation, K.S. and S.F.; formal analysis, A.K.; data curation, K.S.; writing—original draft preparation, A.K. and P.I.; writing—review and editing, K.S. and S.F.; visualization, P.I. and K.S.; supervision, A.K.; project administration, S.F. All authors have read and agreed to the published version of the manuscript.
Funding
This research received no external funding.
Data Availability Statement
No new data were created or analyzed in this study. Data sharing is not applicable to this article.
Conflicts of Interest
The funders had no role in the design of the study; in the collection, analyses, or interpretation of data; in the writing of the manuscript; or in the decision to publish the results.
Abbreviations
| PQP | Power quality parameter |
| EPDN | Electric power distribution network |
| GU | Generating unit |
| DG | Distributed generation |
| RES | Renewable energy source |
| ESS | Electricity storage system |
| THDi | Total harmonic current distortion |
| IM | Induction motor |
| DSP | Digital signal processor |
| FPGA | Field-programmable gate array |
| ASIC | Application-specific integrated circuit |
| PQMS | Power quality monitoring system |
| SCADA | Supervisory control and data acquisition |
References
- Zeng, B.; Wen, J.; Shi, J.; Zhang, J.; Zhang, Y. A multi-level approach to active distribution system planning for efficient renewable energy harvesting in a deregulated environment. Energy 2016, 96, 614–624. [Google Scholar] [CrossRef]
- Ghadi, M.; Rajabi, A.; Ghavidel, S.; Azizivahed, A.; Li, L.; Zhang, J. From active distribution systems to decentralized microgrids: A review on regulations and planning approaches based on operational factors. Appl. Energy 2019, 253, 113543. [Google Scholar] [CrossRef]
- Begovic, M.M. (Ed.) Electrical Transmission Systems and Smart Grids: Selected Entries from the Encyclopedia of Sustainability Science and Technology; Springer Science + Business Media: New York, NY, USA, 2013. [Google Scholar]
- Alberto Escalera, A.; Prodanović, M.; Castronuovo, E.D. Analytical methodology for reliability assessment of distribution networks with energy storage in islanded and emergency-tie restoration modes. Int. J. Electr. Power Energy Syst. 2019, 107, 735–744. [Google Scholar] [CrossRef]
- Schwan, M.; Ettinger, A.; Gunaltay, S. Probabilistic reliability assessment in distribution network master plan development and in distribution automation implementation. In Proceedings of the CIGRE, 2012 Session, Paris, France, 26–30 August 2012; p. C4-203. [Google Scholar]
- Varma, R.K.; Rahman, S.A.; Vanderheide, T.; Dang, M.D.N. Harmonic impact of a 20-MW PV solar farm on a utility distribution network. IEEE Power Energy Technol. Syst. J. 2016, 3, 89–98. [Google Scholar] [CrossRef]
- Torquato, R.; Freitas, W.; Hax, G.R.T.; Donadon, A.R.; Moya, R. High frequency harmonic distortions measured in a Brazilian solar farm. In Proceedings of the 17th International Conference on Harmonics and Quality of Power (ICHQP), Belo Horizonte, Brazil, 16–19 October 2016; pp. 623–627. [Google Scholar]
- IEEE STD 519-2014; Recommended practices and requirements for harmonic control in electrical power systems/Transmission and Distribution Committee of the IEEE Power and Energy Society. The Institute of Electrical and Electronics Engineers: New York, NY, USA, 2014.
- Filippov, S.P.; Dilman, M.D.; Ilyushin, P.V. Distributed Generation of Electricity and Sustainable Regional Growth. Therm. Eng. 2019, 66, 869–880. [Google Scholar] [CrossRef]
- Shushpanov, I.; Suslov, K.; Ilyushin, P.; Sidorov, D. Towards the flexible distribution networks design using the reliability performance metric. Energies 2021, 14, 6193. [Google Scholar] [CrossRef]
- Adineh, B.; Keypour, R.; Sahoo, S.; Davari, P.; Blaabjerg, F. Robust optimization based harmonic mitigation method in islanded microgrids. Int. J. Electr. Power Energy Syst. 2022, 137, 107631. [Google Scholar] [CrossRef]
- Bahrami, M.; Eslami, S.; Zandi, M.; Gavagsaz-ghoachani, R.; Payman, A.; Phattanasak, M.; Nahid-Mobarakeh, B.; Pierfederici, S. Predictive based reliability analysis of electrical hybrid distributed generation. In Proceedings of the International Conference on Science and Technology (TICST), Pathum Thani, Thailand, 4–6 November 2015. [Google Scholar]
- Saha, S.; Saleem, M.I.; Roy, T.K. Impact of high penetration of renewable energy sources on grid frequency behavior. Int. J. Electr. Power Energy Syst. 2022, 145, 108701. [Google Scholar] [CrossRef]
- Li, W. Risk Assessment of Power Systems: Models, Methods and Applications; John Wiley and Sons: New York, NY, USA, 2005. [Google Scholar]
- McDonald, J.D.F.; Pal, B.C. Representing the risk imposed by different strategies of distribution system operation. In Proceedings of the 2006 IEEE PES General Meeting, Montreal, Canada, 18–22 June 2006. [Google Scholar]
- Ilyushin, P.V. Emergency and post-emergency control in the formation of micro-grids. E3S Web Conf. 2017, 25, 02002. [Google Scholar] [CrossRef] [Green Version]
- Gurevich, Y.E.; Kabikov, K.V. Peculiarities of Power Supply, Aimed at Failure-Free Operation of Industrial Consumers; ELEKS-KM: Moscow, Russia, 2005. (In Russian) [Google Scholar]
- Gurevich, Y.E.; Libova, L.E. Application of Mathematical Models of Electrical Load in Calculation of the Power Systems Stability and Reliability of Power Supply to Industrial Enterprises; ELEKS-KM: Moscow, Russia, 2008. (In Russian) [Google Scholar]
- Lacommare, K.; Eto, J. Cost of power interruptions to electricity consumers in the United States (US). Energy 2006, 31, 1845–1855. [Google Scholar] [CrossRef] [Green Version]
- Suslov, K.V.; Solonina, N.N.; Smirnov, A.S. Distributed power quality monitoring. In Proceedings of the IEEE 16th International Conference on Harmonics and Quality of Power (ICHQP), Bucharest, Romania, 25–28 May 2014; pp. 517–520. [Google Scholar]
- Gallego, L.; Torres, H.; Pavas, A.; Urrutia, D.; Cajamarca, G.; Rondón, D. A Methodological proposal for monitoring, analyzing and estimating power quality indices: The case of Bogotá—Colombia. In Proceedings of the IEEE Power Tech 2005, St Peterburg, Russia, 27–30 June 2005. [Google Scholar]
- Gavrilov, D.; Gouzman, M.; Luryi, S. Monitoring large-scale power distribution grids. Solid-State Electron. 2019, 155, 57–64. [Google Scholar] [CrossRef]
- Byk, F.L.; Myshkina, L.S.; Khokhlova, K. Power supply reliability indexes. In Proceedings of the International Conference on Actual Issues of Mechanical Engineering, Tomsk, Russia, 27–29 July 2017; pp. 525–530. [Google Scholar]
- Bollen, M.H.J.; Dirix, P.M.E. Simple model for post-fault motor behaviours for reliability/power quality assessment of industrial power systems. IEE Proc. Gener. Transm. Distrib. 1996, 143, 56–60. [Google Scholar] [CrossRef]
- Ribeiro, P.F.; Duque, C.A.; Silveira, P.M.; Cerqueira, A.S. Power Systems Signal Processing for Smart Grids; John Wiley & Sons Ltd.: Hoboken, NJ, USA, 2014. [Google Scholar]
- Kulikov, A.L.; Ilyushin, P.V.; Suslov, K.V.; Karamov, D.N. Coherence of digital processing of current and voltage signals at decimation for power systems with a large share of renewable power stations. Energy Rep. 2022, 8, 1464–1478. [Google Scholar] [CrossRef]
- Knowler, L.A.; Howell, J.M.; Gold, B.K.; Coleman, E.P.; Moan, O.B.; Knowler, W.S. Statistical Methods of Product Quality Control; McGraw-Hill Book Company: New York, NY, USA, 1989. [Google Scholar]
- Won, D.-J.; Chung, I.-Y.; Kim, J.-M.; Moon, S.-I.; Seo, J.-C.; Choe, J.-W. Development of power quality monitoring system with central processing scheme. In Proceedings of the IEEE Power Engineering Society Summer Meeting, Chicago, IL, USA, 21–25 July 2002; Volume 2, pp. 915–919. [Google Scholar]
- Marple, S.L., Jr. Digital Spectrum Analysis with Applications; Prentice Hall: Hoboken, NJ, USA, 1987. [Google Scholar]
- Won, D.-J.; Chung, I.-Y.; Kim, J.-M.; Moon, S.-I.; Seo, J.-C.; Choe, J.-W. A new algorithm to locate power-quality event source with improved realization of distributed monitoring scheme. IEEE Trans. Power Deliv. 2006, 21, 1641–1647. [Google Scholar] [CrossRef]
- Valsan, S.P.; Swarup, K.S. Wavelet transform based digital protection for transmission lines. Int. J. Electr. Power Energy Syst. 2009, 31, 379–388. [Google Scholar] [CrossRef]
- McGranaghan, M.F.; Santoso, S. Challenges and trends in analysis of electric power quality measurement data. EURASIP J. Adv. Signal Process. 2007, 2007, 057985. [Google Scholar] [CrossRef] [Green Version]
- Kulikov, A.L.; Misrikhanov, M.S. Introduction to Methods of Digital Relay Protection of High-Voltage Transmission Lines; Energoatomizdat: Moscow, Russia, 2007. (In Russian) [Google Scholar]
- Kezunovic, M.; Meliopoulos, S.; Venkatasubramanian, V.; Vittal, V. Application of Time-Synchronized Measurements in Power System Transmission Networks; Springer: New York, NY, USA, 2014. [Google Scholar]
- Ilyushin, P.V.; Shepovalova, O.V.; Filippov, S.P.; Nekrasov, A.A. Calculating the Sequence of Stationary Modes in Power Distribution Networks of Russia for Wide-Scale Integration of Renewable Energy Based Installations. Energy Rep. 2021, 7, 308–327. [Google Scholar] [CrossRef]
- NASPI. Synchrophasor Monitoring for Distribution Systems: Technical Foundations and Applications; A White Paper by the NASPI Distribution Task Team NASPI-2018-TR-001; NASPI: Tempe, AZ, USA, 2018. [Google Scholar]
- Edomah, N. Effects of voltage sags, swell and other disturbances on electrical equipment and their economic implications. In Proceedings of the 20th International Conference and Exhibition on Electricity Distribution, Prague, Czech Republic, 8–11 June 2009; pp. 1–4. [Google Scholar]
- Ilyushin, P.V.; Sukhanov, O.A. The Structure of Emergency-Management Systems of Distribution Networks in Large Cities. Russ. Electr. Eng. 2014, 85, 133–137. [Google Scholar] [CrossRef]
- Wentzel, E.S. Probability Theory (First Steps); Mir: Moscow, Russia, 1986. [Google Scholar]
- Won, D.J.; Chung, I.Y.; Kim, J.M.; Ahn, S.J.; Moon, S.I. A modified voltage sag duration for power quality diagnosis. Proc. IFAC 2003, 36, 739–743. [Google Scholar] [CrossRef]
- Won, D.J.; Ahn, S.J.; Moon, S.I. A modified sag characterization using voltage tolerance curve for power quality diagnosis. IEEE Trans. Power Deliv. 2005, 20, 2638–2643. [Google Scholar] [CrossRef]
- Cowden, D.J. Statistical Methods in Quality Control; Prentice-Hall, Inc.: Englewood Cliffs, NJ, USA, 1957. [Google Scholar]
- Shor, Y.B. Statistical Methods of Analysis and Quality Control and Reliability; Soviet Radio: Moscow, Russia, 1962. (In Russian) [Google Scholar]
- Belyaev, Y.K. Probabilistic Sampling Methods; Nauka: Moscow, Russia, 1975. (In Russian) [Google Scholar]
- EN 50160:2019; Voltage Characteristics of Electricity Supplied by Public Electricity Networks. European Committee for Standards: Brussels, Belgium, 2019; 34p.
- ANSI C84.1-2020; Electric Power Systems and Equipment—Voltage Ratings (60 Hz). American National Standards Institute: Washington, DC, USA, 2020; 21p.
- Wald, A. Sequential Analysis; John Wiley and Sons: New York, NY, USA, 1947. [Google Scholar]
- Ayvazyan, S.A.; Mkhitaryan, V.S. Applied Statistics and Fundamentals of Econometrics: A Textbook for High Schools; UNITY: Moscow, Russia, 1998; 1022p. [Google Scholar]
- Suslov, K.; Shushpanov, I.; Buryanina, N.; Ilyushin, P. Flexible power distribution networks: New opportunities and applications. In Proceedings of the 9th International Conference on Smart Cities and Green ICT Systems, Prague, Czech Republic, 2–4 May 2020; Volume 1, pp. 57–64. [Google Scholar]
- Ilyushin, P.V.; Suslov, K.V. Operation of automatic transfer switches in the networks with distributed generation. In Proceedings of the 2019 IEEE Milan PowerTech, Milan, Italy, 23–27 June 2019. [Google Scholar] [CrossRef]
Figure 1.
A transient in the EPDN of an industrial enterprise during a near-to-generator three-phase short circuit in the external distribution network.
Figure 1.
A transient in the EPDN of an industrial enterprise during a near-to-generator three-phase short circuit in the external distribution network.

Figure 2.
The process of monitoring power quality parameters in the EPDN.

Figure 3.
The process of sequential decision-making regarding the deviations of the generalized PQP.
Figure 3.
The process of sequential decision-making regarding the deviations of the generalized PQP.

Figure 4.
Structural diagram of the device that implements the sampling-based monitoring procedure of the generalized PQP.
Figure 4.
Structural diagram of the device that implements the sampling-based monitoring procedure of the generalized PQP.


Table 1.
Values of the variables used in the sequential decision-making procedure regarding the deviations of the generalized PQP.
Table 1.
Values of the variables used in the sequential decision-making procedure regarding the deviations of the generalized PQP.
| m | 1 | 2 | 3 | 4 | 5 | 6 | 7 | 8 | 9 |
|---|---|---|---|---|---|---|---|---|---|
| ξ | 149 | 151 | 154 | 155 | 148 | 160 | 156 | 154 | 150 |
| 149 | 300 | 454 | 609 | 757 | 917 | 1123 | 1287 | 1437 | |
| a(m) | 55 | 197.5 | 340 | 482.5 | 625 | 767.5 | 910 | 1052.5 | 1195 |
| b(m) | 256.9 | 399.4 | 541.9 | 684.4 | 826.9 | 969.4 | 1111.9 | 1254.4 | 1396.9 |
Disclaimer/Publisher’s Note: The statements, opinions and data contained in all publications are solely those of the individual author(s) and contributor(s) and not of MDPI and/or the editor(s). MDPI and/or the editor(s) disclaim responsibility for any injury to people or property resulting from any ideas, methods, instructions or products referred to in the content. |
© 2023 by the authors. Licensee MDPI, Basel, Switzerland. This article is an open access article distributed under the terms and conditions of the Creative Commons Attribution (CC BY) license (https://creativecommons.org/licenses/by/4.0/).
Share and Cite
MDPI and ACS Style
Kulikov, A.; Ilyushin, P.; Suslov, K.; Filippov, S. Organization of Control of the Generalized Power Quality Parameter Using Wald’s Sequential Analysis Procedure. Inventions 2023, 8, 17. https://doi.org/10.3390/inventions8010017
AMA Style
Kulikov A, Ilyushin P, Suslov K, Filippov S. Organization of Control of the Generalized Power Quality Parameter Using Wald’s Sequential Analysis Procedure. Inventions. 2023; 8(1):17. https://doi.org/10.3390/inventions8010017
Chicago/Turabian StyleKulikov, Aleksandr, Pavel Ilyushin, Konstantin Suslov, and Sergey Filippov. 2023. "Organization of Control of the Generalized Power Quality Parameter Using Wald’s Sequential Analysis Procedure" Inventions 8, no. 1: 17. https://doi.org/10.3390/inventions8010017