
Patterned Colouring via Variable-Speed Single Stretching
by
 , , ,
, , ,
Xuelian Wu
1,
Vishwa Mohan Tiwari
2 ,
,
Kimaya Prasad Suryarao
3,
Richard Tan
4,
Rui Xiao
5,
Haibao Lv
6,
Yilei Zhang
7,
Zhifeng Wang
8 and
Wei Min Huang
4,* 1
School of Mechanical Engineering, Jiangsu University, 301 Xuefu Road, Zhenjiang 212013, China
2
Department of Mechanical Engineering, National Institute of Technology Karnataka, Surathkal, P. O. Srinivasnagar, Mangalore 575025, India
3
Department of Metallurgical and Materials Engineering, National Institute of Technology, Tiruchirappalli 620015, India
4
School of Mechanical and Aerospace Engineering, Nanyang Technological University, 50 Nanyang Avenue, Singapore 639798, Singapore
5
Key Laboratory of Soft Machines and Smart Devices of Zhejiang Province, Department of Engineering Mechanics, Zhejiang University, Hangzhou 310027, China
6
Science and Technology on Advanced Composites in Special Environments Laboratory, Harbin Institute of Technology, Harbin 150080, China
7
Department of Mechanical Engineering, University of Canterbury, Christchurch 8140, New Zealand
8
Testing Center, Yangzhou University, Yangzhou 225002, China
*
Author to whom correspondence should be addressed.
Inventions 2022, 7(4), 93; https://doi.org/10.3390/inventions7040093
Submission received: 1 September 2022
/
Revised: 29 September 2022
/
Accepted: 10 October 2022
/
Published: 12 October 2022
(This article belongs to the Collection Feature Innovation Papers)
Abstract
:We demonstrate a cost-effective, highly reliable/stable and environmentally friendly approach for the patterned colouring of a commercial transparent polyethylene terephthalate (PET). We show that different colour patterns (transparent, white/translucent, complete white/silver and different combinations of these three colours) can be realised in PET strips upon varying the speed during continuous stretching. The conditions for good quality colour patterns are investigated, and the length of transient region during speed change is investigated.
1. Introduction
Upon stressing, some polymeric materials may become transparent, or turn to be translucent, white and even silver colour [1,2,3]. The latter type is generally called stress whitening. Refer to Figure S2a in the Supplementary Materials for an example of folding-induced whitening in a commercial transparent polyvinyl chloride (PVC) for overhead projectors. Stress whitening is a phenomenon that mostly we try to avoid in polymer processing.
Previously, it has been reported that polyethylene terephthalate (PET), a widely used colourless transparent engineering polymer, may appear to be transparent, white/translucent or silver in colour depending on the applied stretching speed, since different crystalline microstructures are formed at different stretching speeds. Systematic investigation (including morphology and X-ray diffraction analysis) has been carried out [3,4].
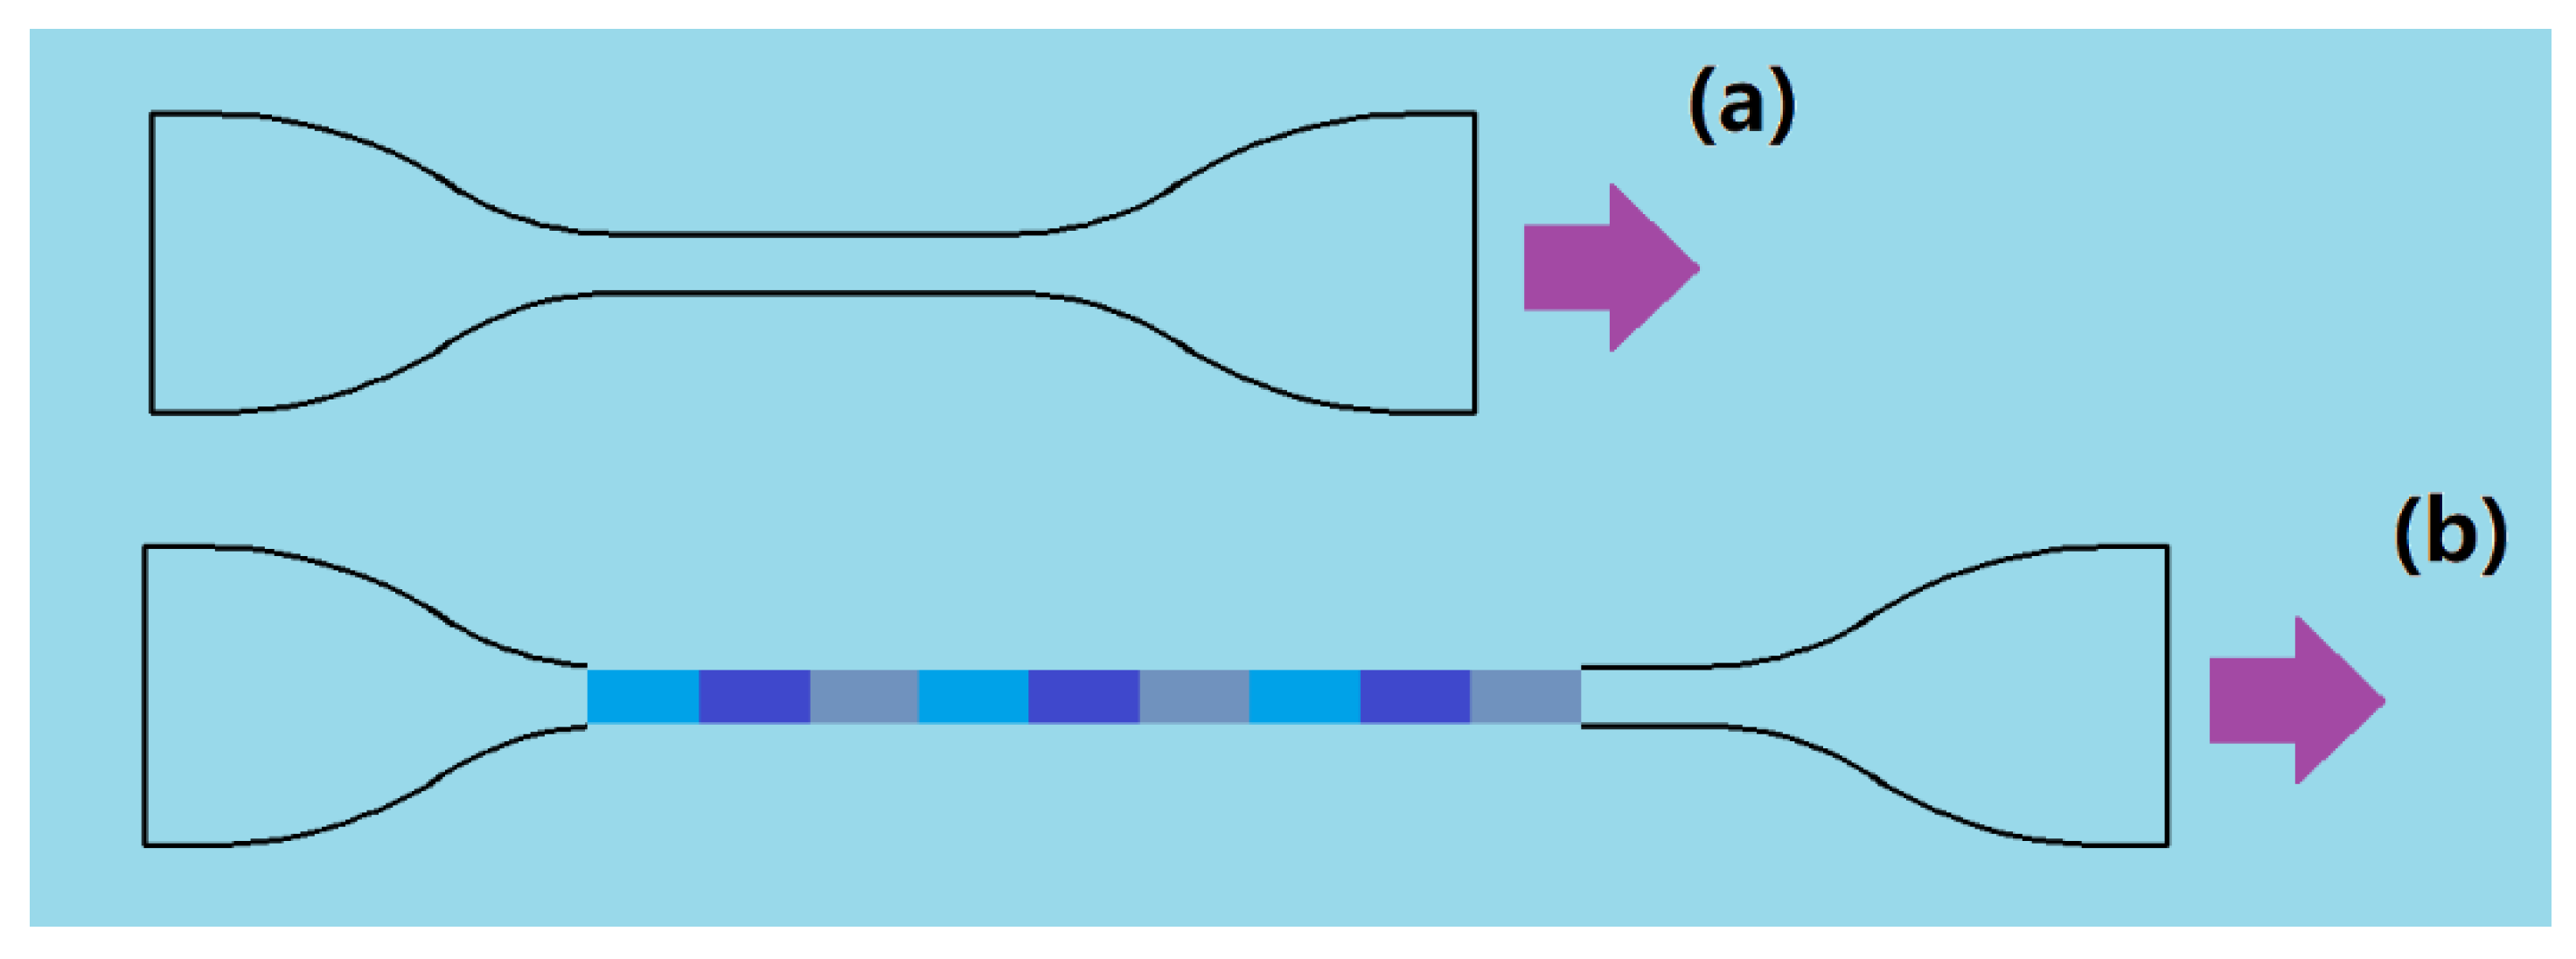
If we can control the colour patterns in a precise manner only by varying the stretching speed in a predetermined manner (as illustrated in Figure 1), this kind of colouring method could be the most environmentally friendly way and also highly reliable and stable when compared with not only the conventional colouring methods, such as coating/painting, but also the recently developed ones, such as structural colouring [5,6]. Of course, colouring via varying the speed in a single continuous stretching is also very much cost-effective, despite the fact that the number of colours that can be produced by this method is limited to, for instance, transparent, white/translucent and silver.
In this paper, a commercial transparent PET is used to demonstrate the feasibility of patterned colouring of its strips via variable-speed single stretching. Further investigation is also carried out to reveal the conditions in order to achieve precise colour patterns, which is critical in real applications.
2. Materials and Methods
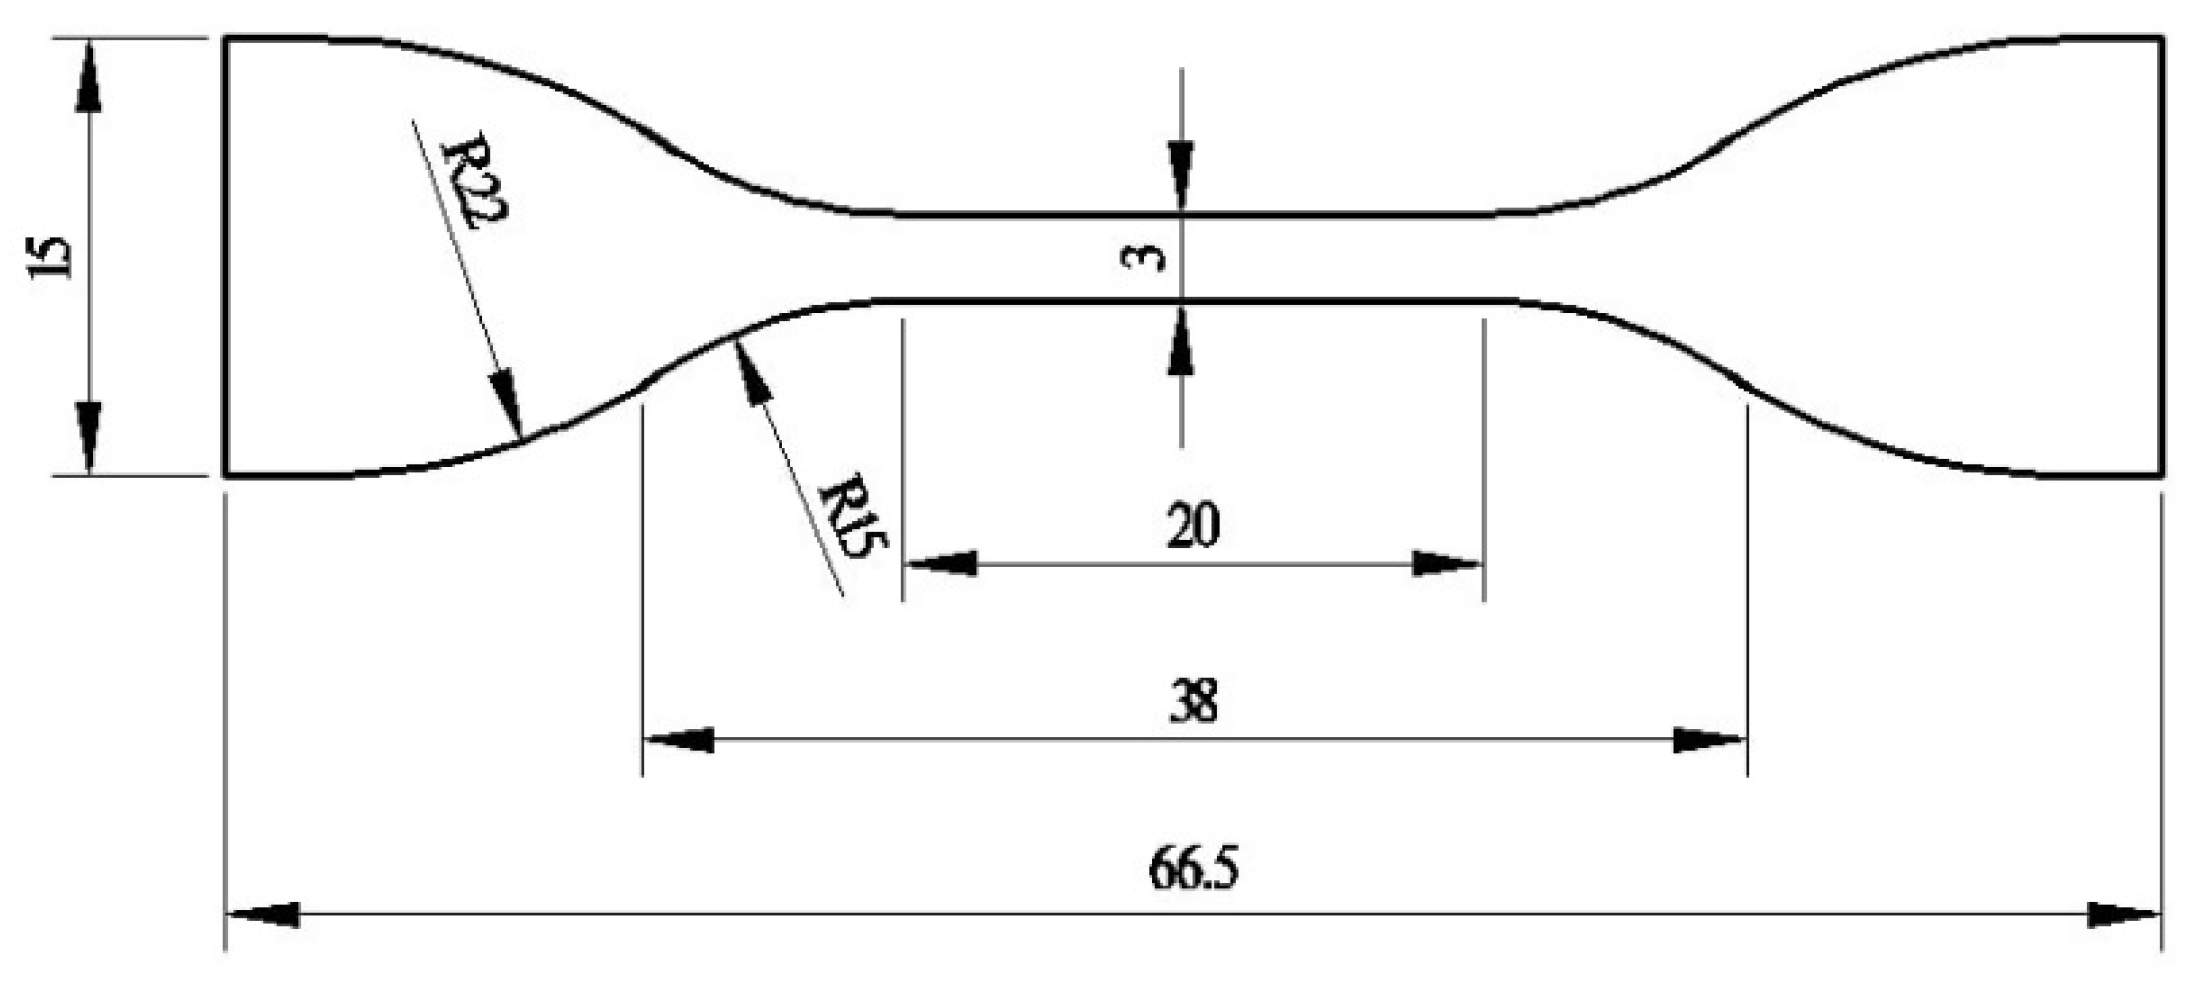
PET films (0.5 mm thick, in roll) were bought from Tiansheng Plastic Material, Ltd., China. Dog-bone-shaped samples were manually cut from the films along the rolling direction according to the ASTM D638 Standard (Type V) (Figure 2). Differential scanning calorimetry (DSC) tests (using DSC Q200, TA Instruments, New Castle, DE 19720, USA) were conducted between 25 and 300 °C at a heating/cooling rate of 10 °C/min on smaller pieces cut out of the samples.
Dog-bone shaped samples were stretched using an Instron 5565 Testing System (Norwood, MA, USA) at room temperature (about 20 °C). Three strain rates, namely 0.01/s, 0.035/s and 0.1/s, were applied individually or in combination to up to 200% total strain. Two smart phones were used to record the samples during stretching, one for optical video and the other for infrared video (using an infrared USB lens from Seek Thermal, Goleta, CA, USA). A professional infrared camera (NEC SAN-EI INSTRUMENTS, LTD. TH71-717, Osaka, Japan) was used to capture a more accurate temperature distribution. Small pieces were cut from the samples stretched at different strain rates for DSC test as well following the same method mentioned above.
Photoelasticity is a traditional technique to reveal the internal stress field in transparent polymers [7,8]. In the course of the current study, the samples to be tested were placed between a computer monitor, which served as the source of polarised light, and a polarised lens. The photoelasticity images of the samples were taken by a camera behind the polarised lens. The actual colour of the photoelasticity image depends on the angle between the polarised lens and monitor (polarised light). A colourful photoelasticity image of a sample indicates the non-uniformity of the internal stress in the sample, whereas a single colour image means a rather uniform internal stress field.
3. Results and Discussion
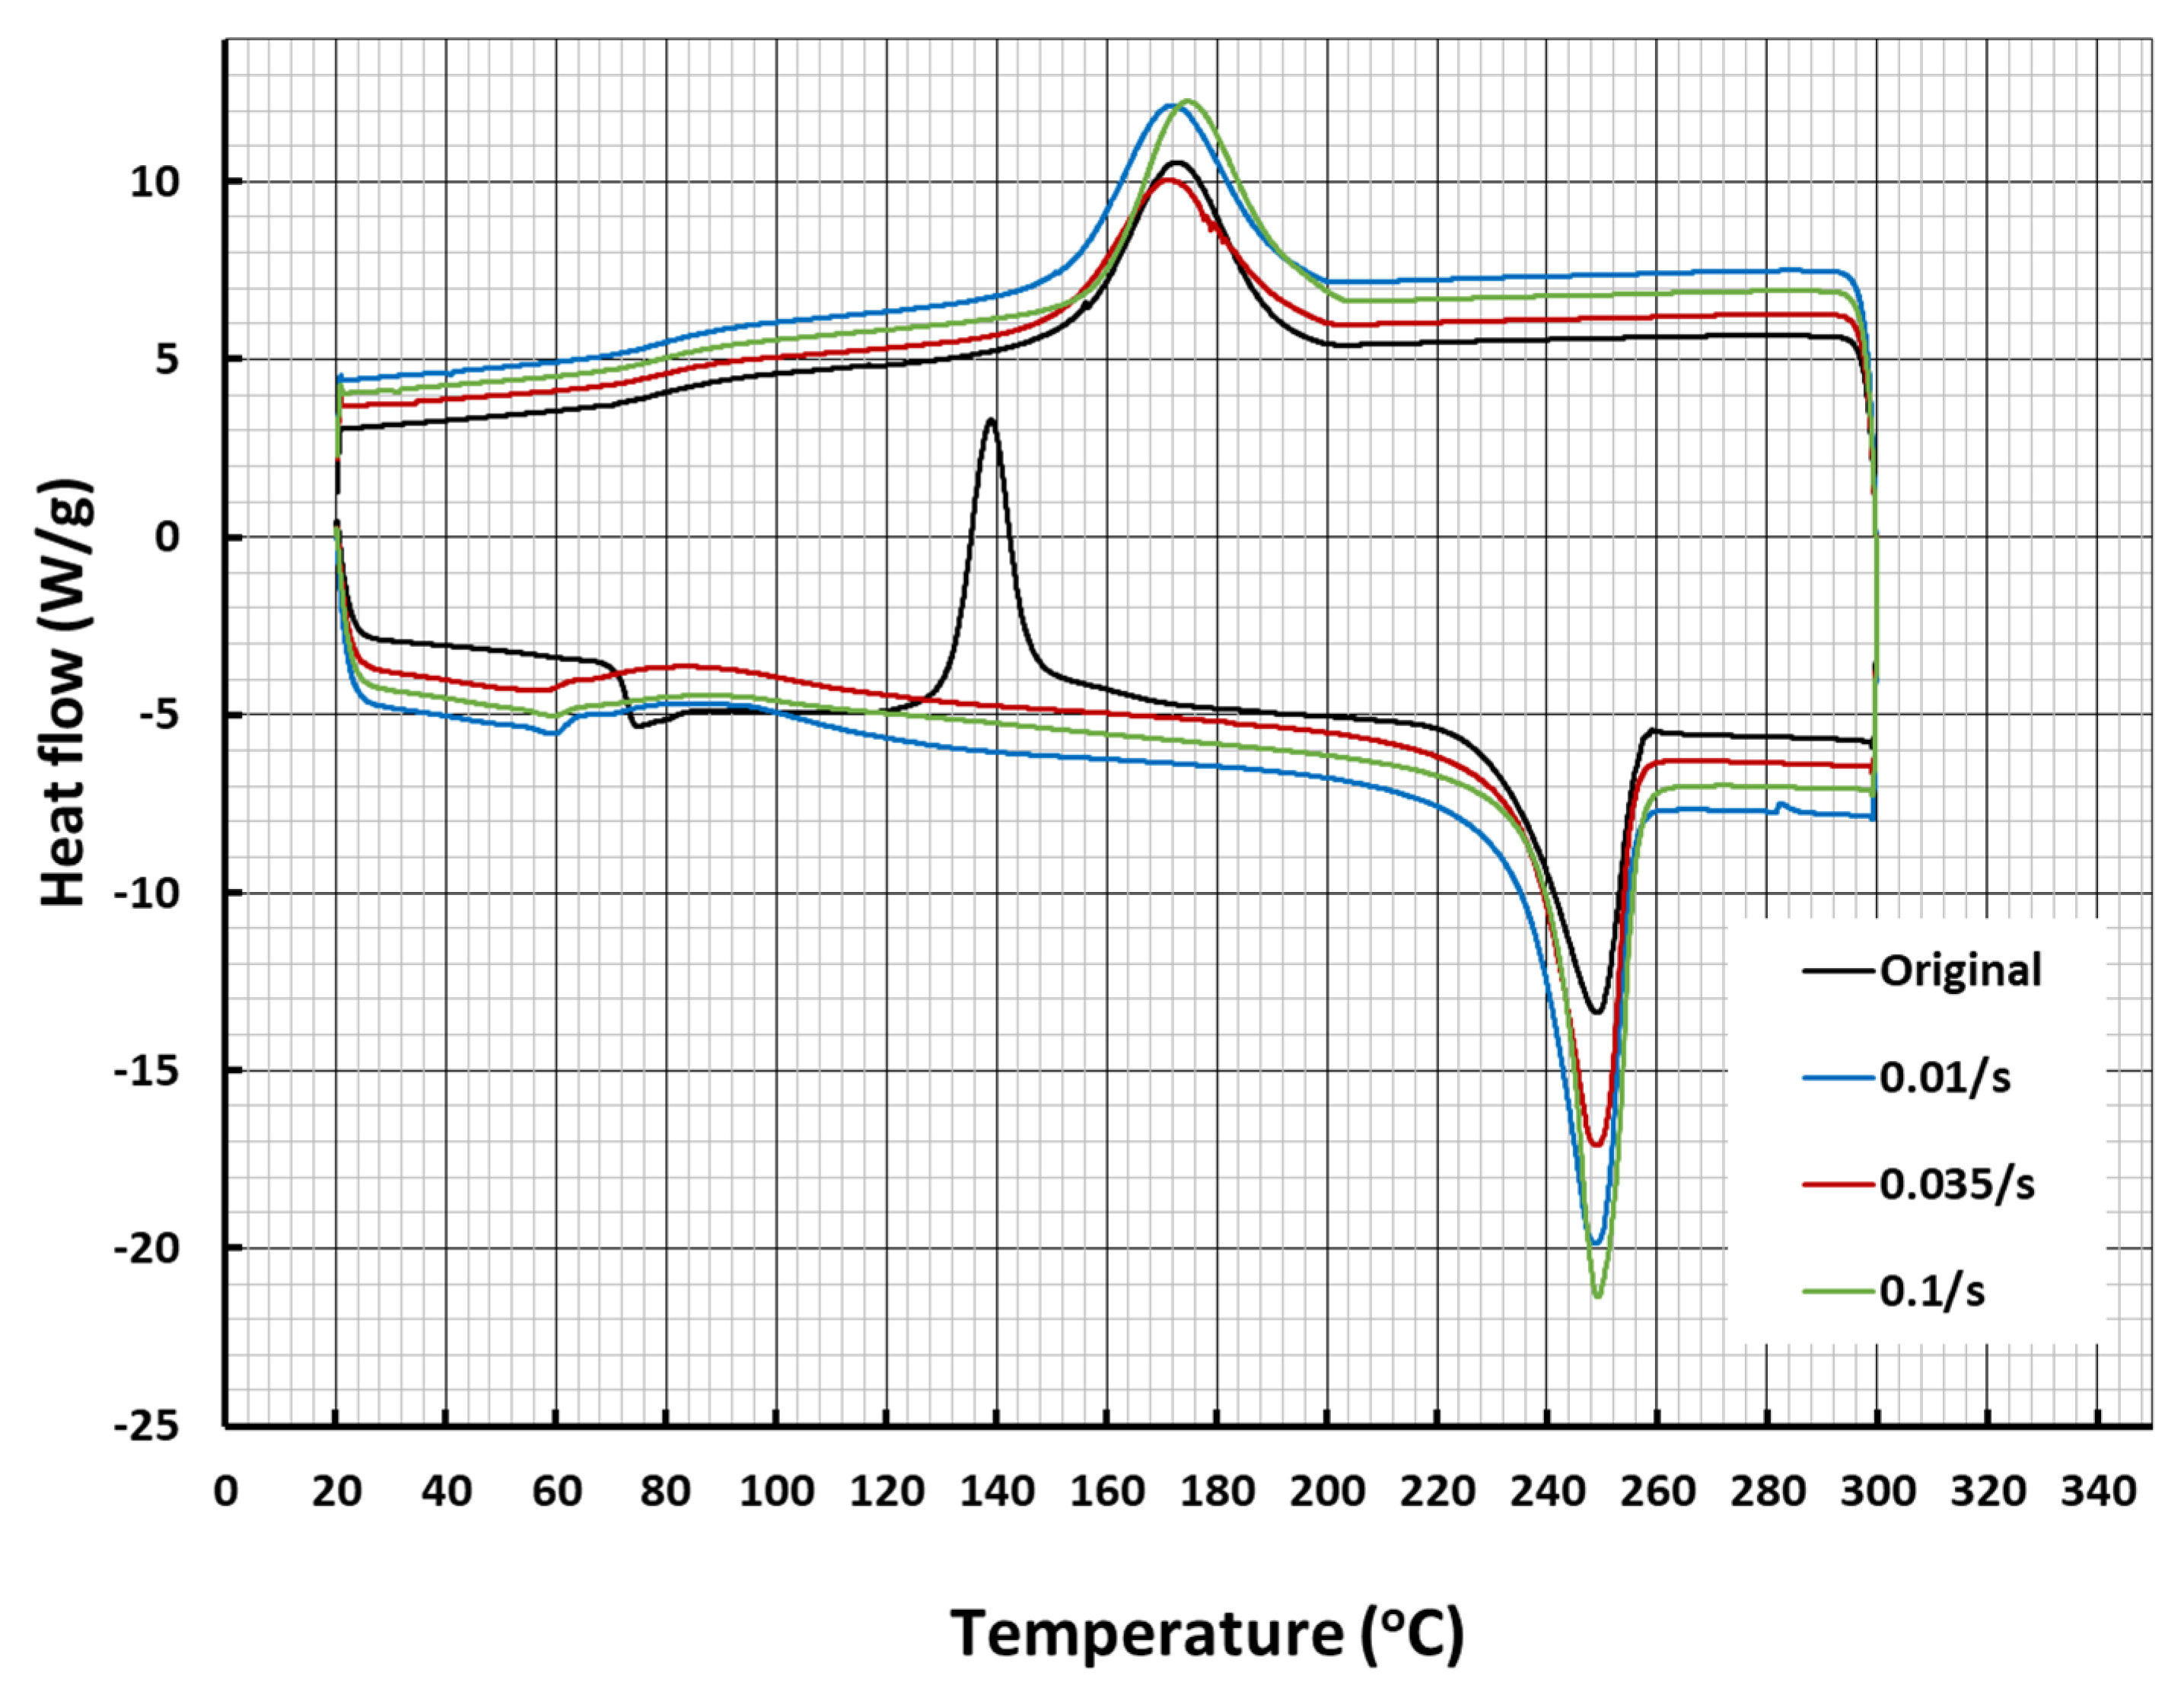
Figure 3 shows the heat flow vs. temperature relationships in a thermal cycle of the as-received material and samples after being stretched at three different strain rates (namely, 0.01/s, 0.035/s and 0.1/s, which correspond to transparent, white/translucent and fully white samples, respectively). It reveals that for the original sample, upon heating the glass, transition occurred at around 70 °C. Upon further heating, the material crystallised at around 140 °C, followed by melting at about 245 °C. In the subsequent cooling process, the material crystalised at around 175 °C, and the glass transition appeared at about 80 °C. For the three pre-stretched samples, there was no crystallisation transition upon heating, which confirms the stress-induced crystallisation in these samples [3,4]. However, the latent heat upon heating to melting in pre-stretched samples was not the same, and all much higher than the original sample, which implies that the crystalline structures produced by heating (original sample) and stressing at different speeds are different [3,4].
Unless otherwise stated, herein the stress and strain are meant for the engineering stress and engineering strain, respectively.
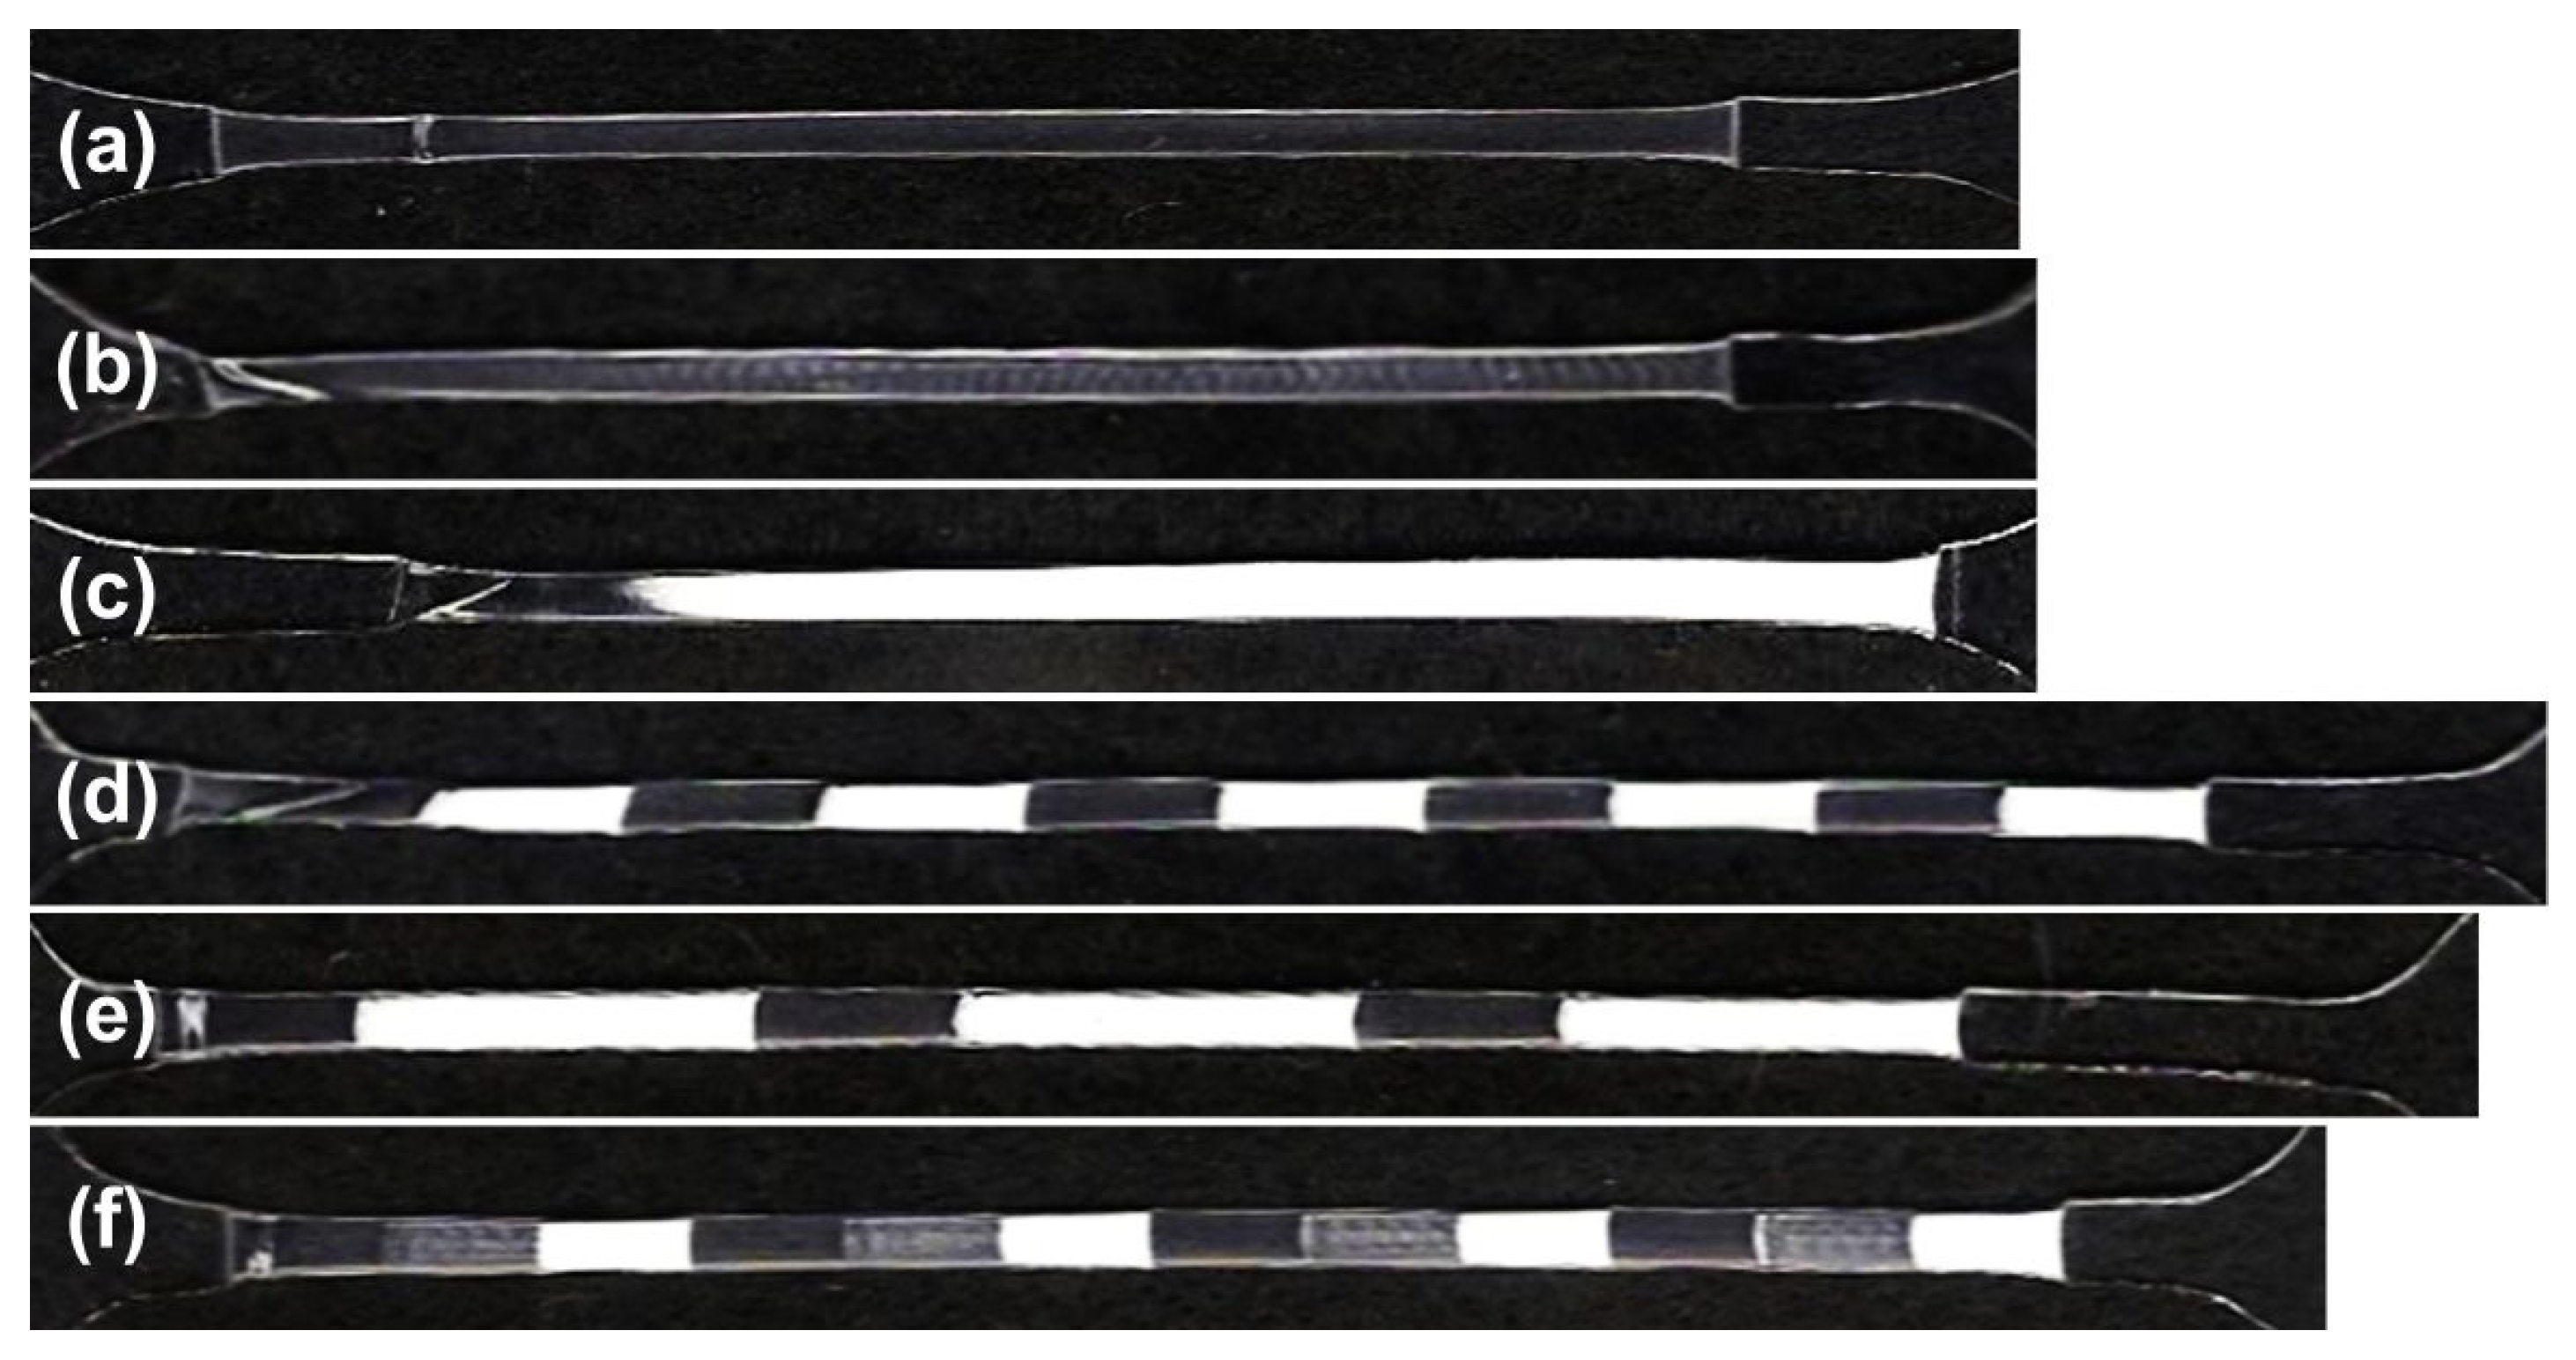
Typical samples produced with different colour patterns are presented in Figure 4. In Figure 4a–c, one single strain rate was used (0.01/s, 0.035/s and 0.1/s, respectively); in Figure 4d,e, two strain rates (0.01/s and 0.1/s) were applied periodically during stretching; and in Figure 4f, three strain rates (0.01/s, 0.035/s and 0.1/s) were applied periodically. Refer to Video S1 in the Supplementary Materials for a typical video of a three-strain rate test.
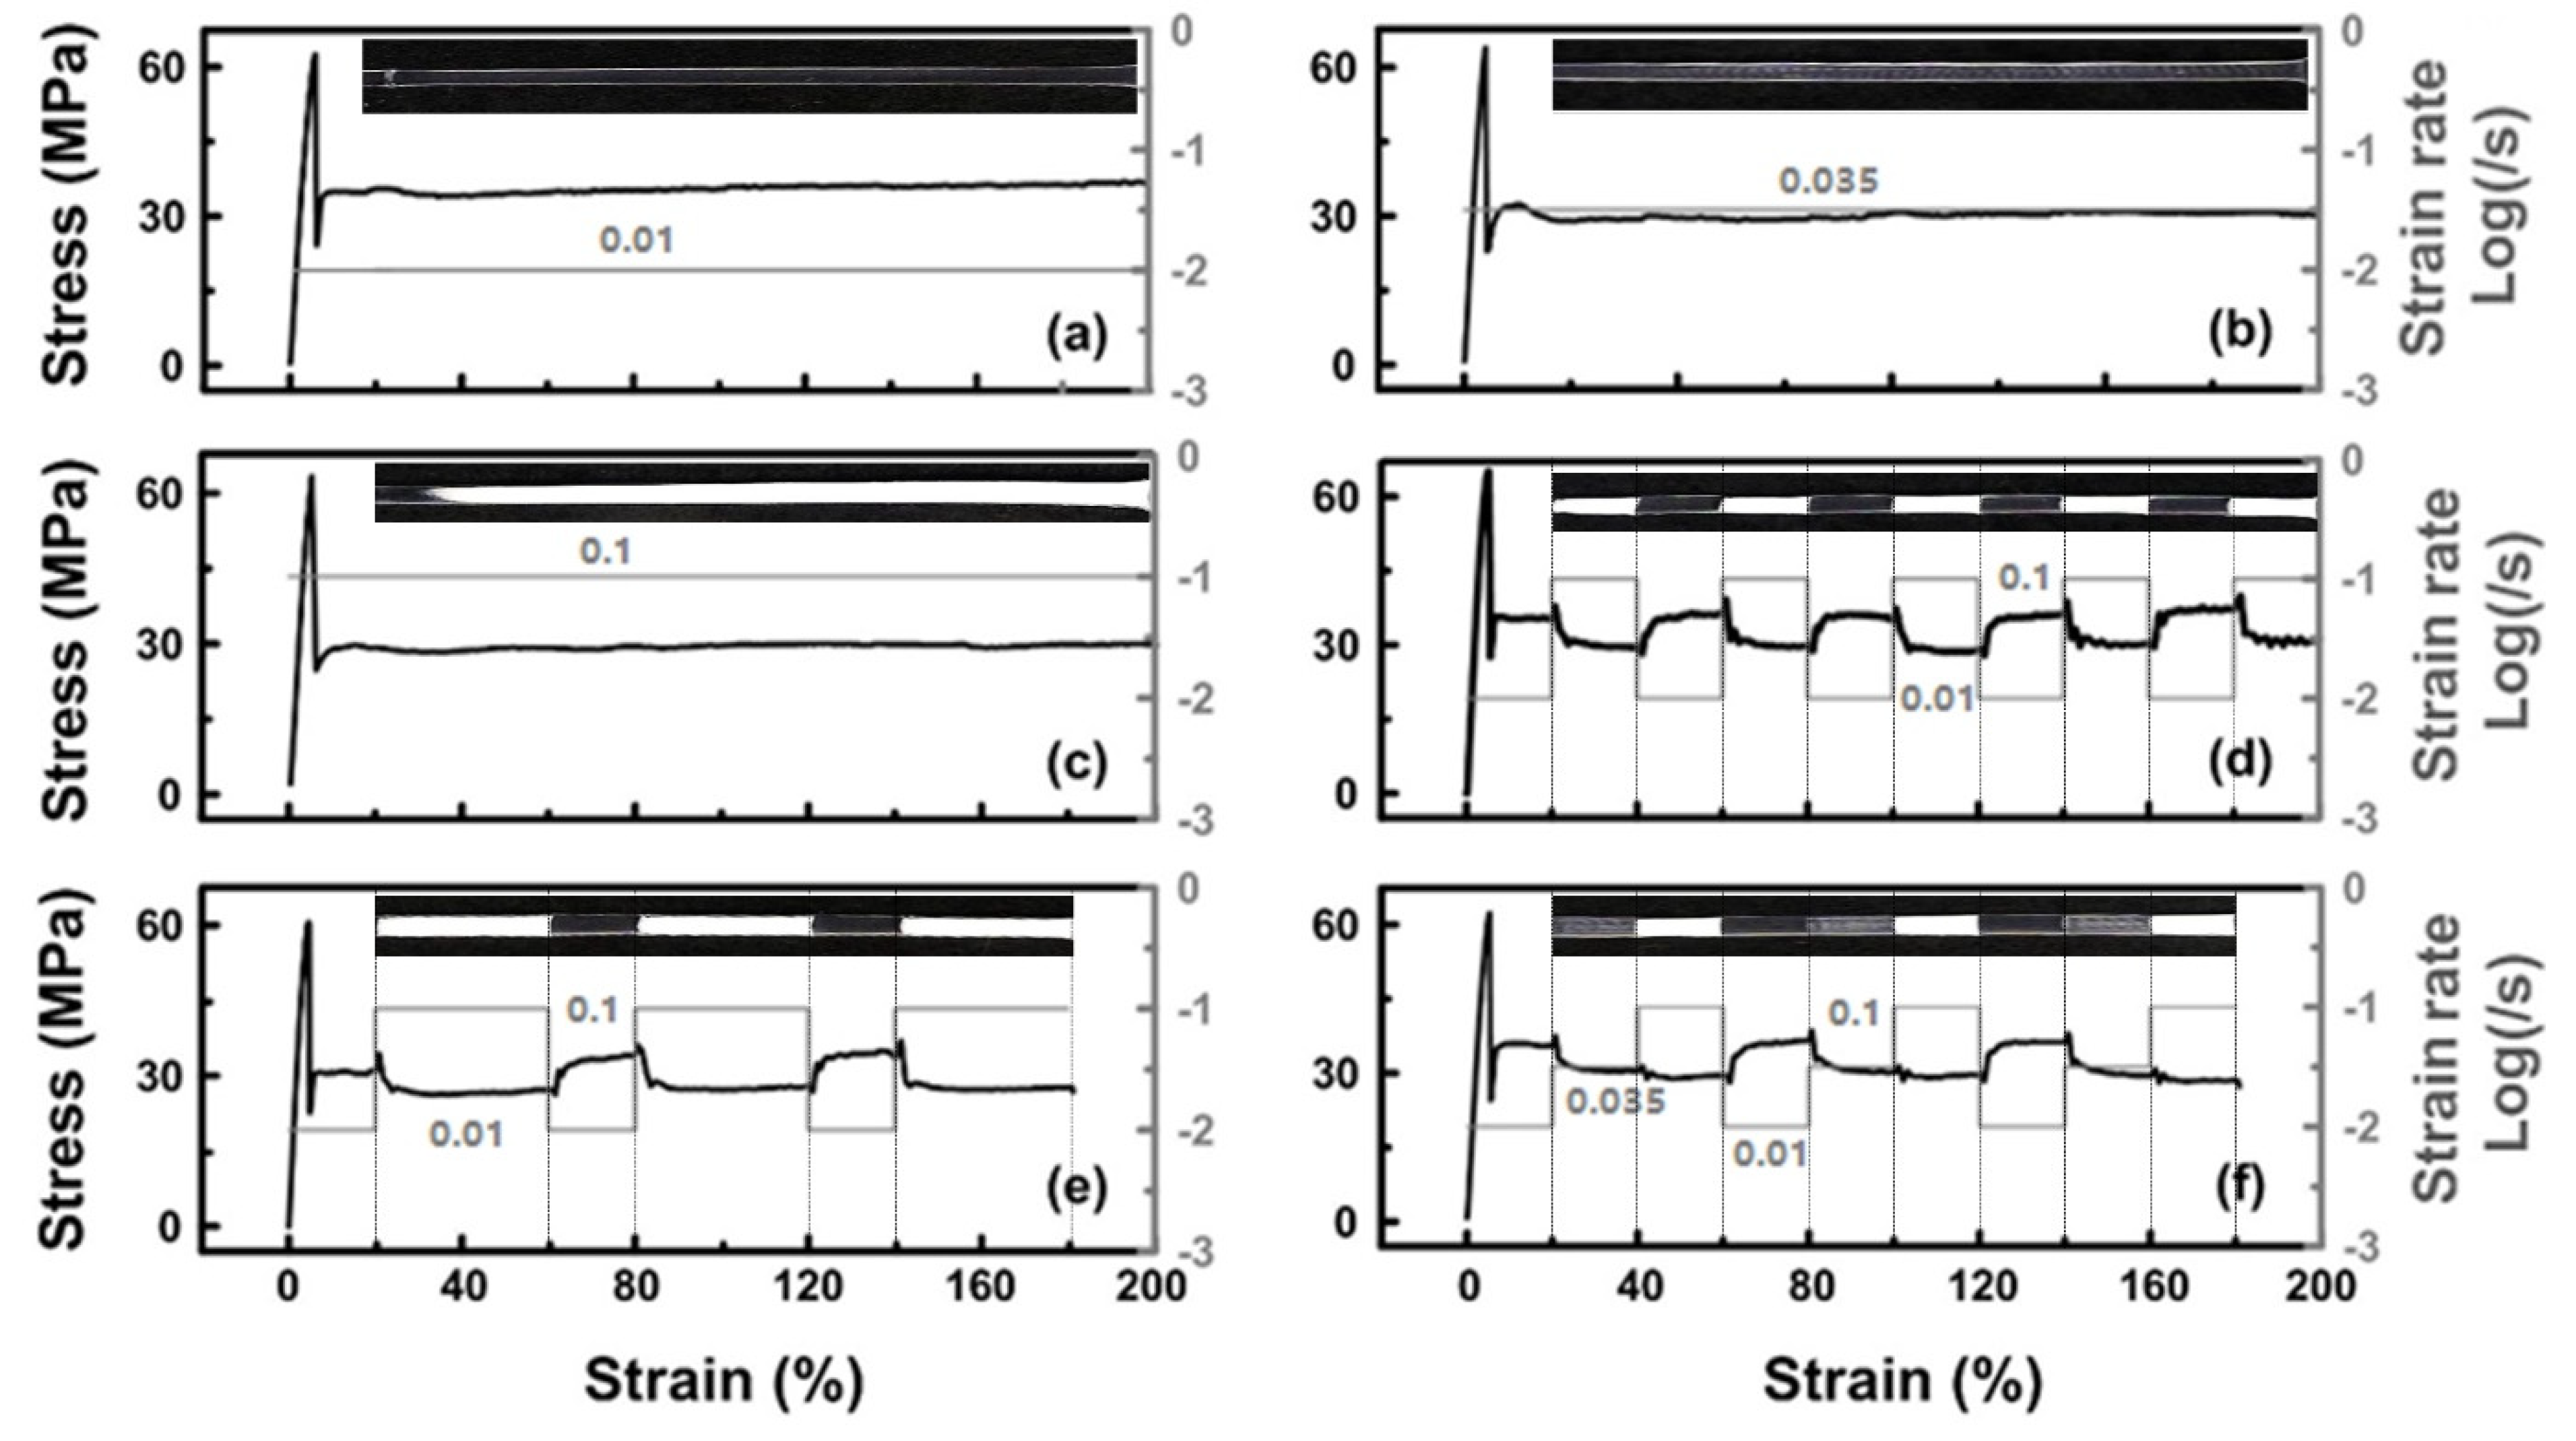
Refer to Figure 5 for the actual strain rate vs. stretching strain relationship applied in each type of test, and the corresponding stress vs. strain curve in uniaxial stretching. As we can see from Figure 4a–c, a low strain rate of 0.01/s results in an almost transparent (colourless) sample, a medium strain rate of 0.035/s results in a white/translucent colour (maybe with some quasi-parallel white lines inside), and a high strain rate of 0.1/s results in a complete white colour. Corresponding to the strain rates of 0.01/s, 0.035/s and 0.1/s, the samples actually appear to be transparent, white and silver, respectively, under naked eyes. This kind of colour vs. strain rate relationship has been previously reported in, for instance [9], but mostly limited to only one speed during stretching. Varying the speed during stretching of polymers may result in different colours, but the resulted colour patterns may be very much irregular. Video S2 and Figure S3 in the Supplementary Materials show two examples of stretching polyvinyl chloride (PVC) strips at room temperature under periodically varied speed. As we can see, no regular colour patten can be observed.
Figure 5d–f show that a combination of these strain rates (either two or three) results in well-controlled colour patterns corresponding precisely to the applied periodic strain rate.
As revealed in Figure S2a in the Supplementary Materials, stress whitening occurs upon folding of this PVC at room temperature. However, upon heating to above its glass transition temperature, which is about 70 °C (refer to Figure S1 in the Supplementary Materials for the DSC result of this PVC), it turns to be fully transparent again. Hence, we may conclude that patterned colouring via stretching is not a generic approach applicable to any polymers without certain conditions.
The stress vs. strain relationships in Figure 5 clearly show necking and propagation in all samples in uniaxial stretching (also refer to Video S1 in the Supplementary Materials for typical necking and propagation features during stretching). At a low strain rate of 0.01/s, the corresponding plateau stress is much higher than those of other two strain rates. At a medium strain rate of 0.035/s, the resultant plateau stress is only slightly higher than that of the high strain rate of 0.1/s. Hence, we can see a kind of inverse strain rate effect, i.e., a higher strain rate results in a lower plateau stress during loading.
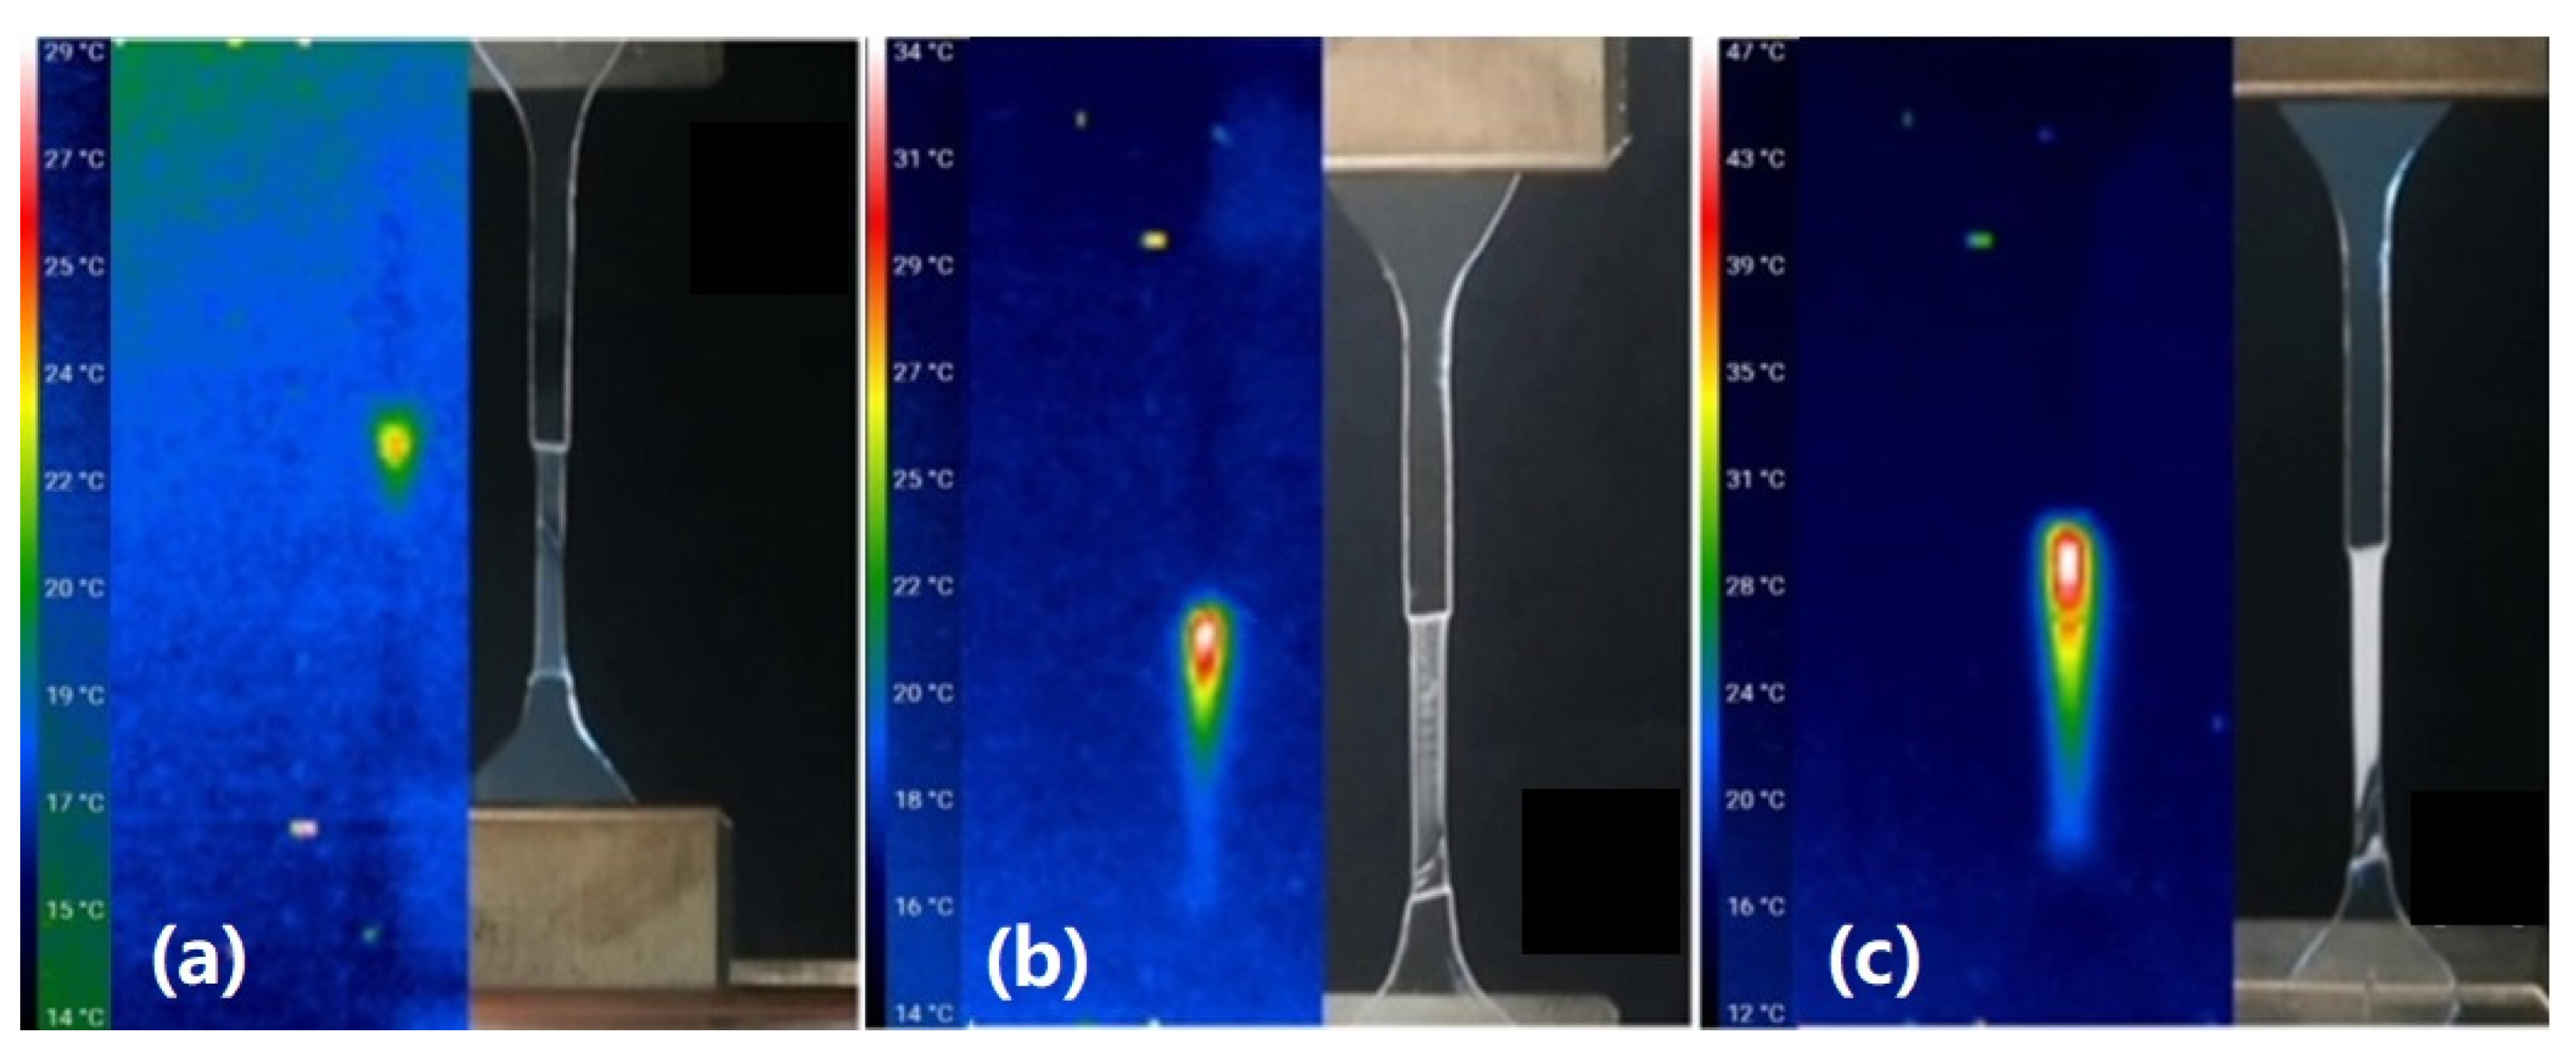
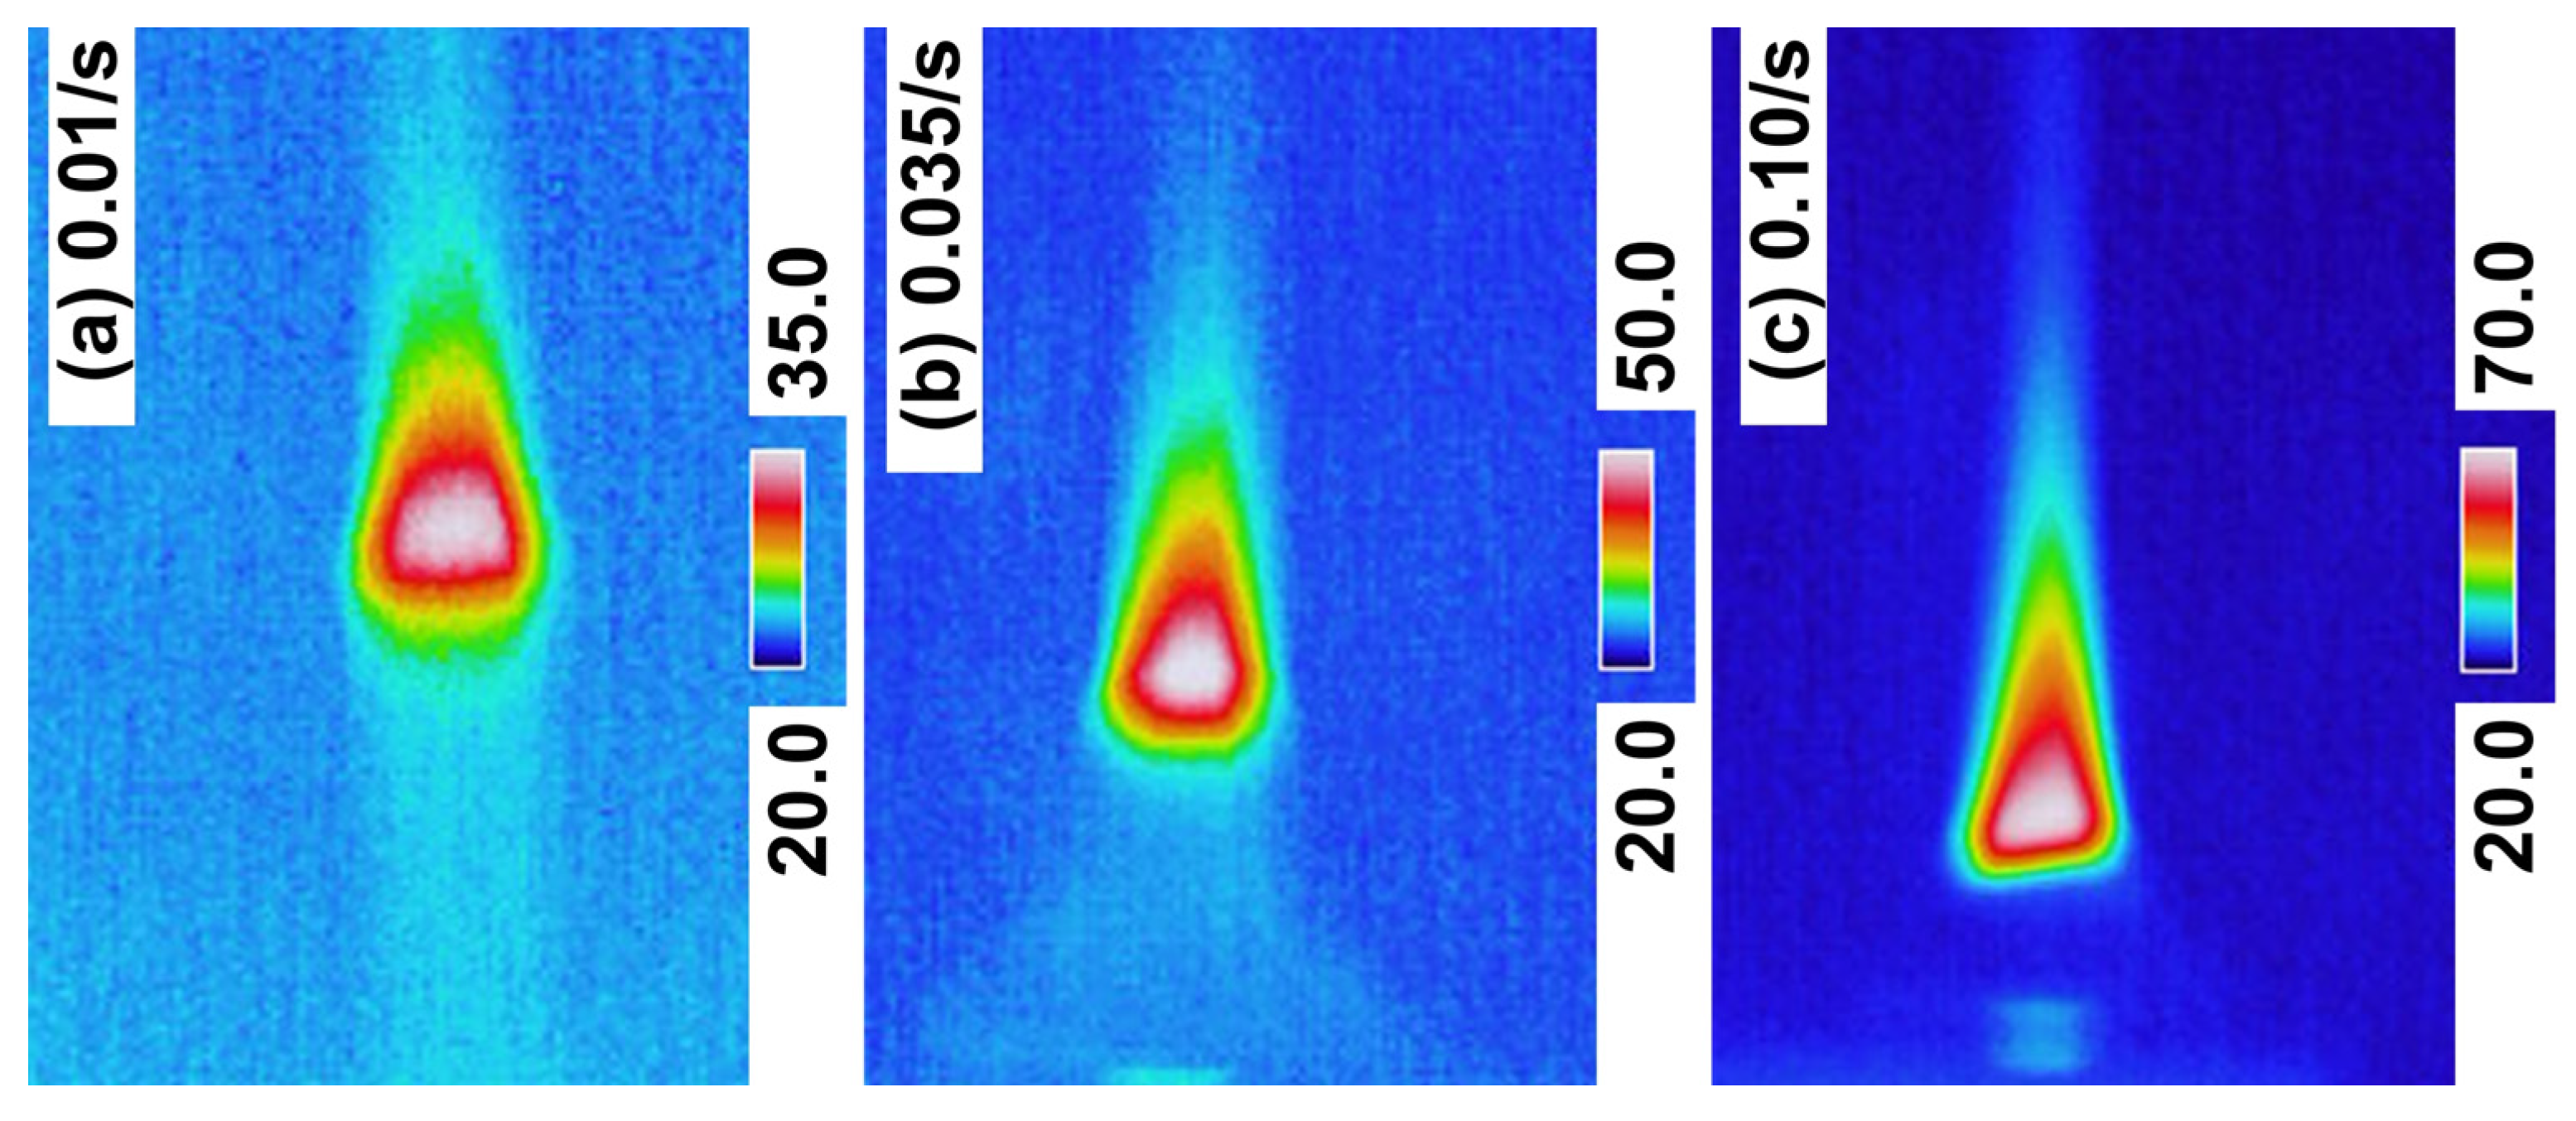
In Figure 6, infrared images (from the infrared video) taken simultaneously with the normal optical images (from normal optical video), reveal significant temperature increases around the propagation front. With the increase in the applied strain rate, the maximum temperature increases accordingly. Corresponding to the three different strain rates of 0.01/s, 0.035/s and 0.1/s, the maximum temperatures were 25 °C, 34 °C and 47 °C, respectively. More accurate infrared images of these three strain rates taken by the professional infrared camera are presented in Figure 7, where we can find that the corresponding maximum temperature increments were about 15 °C, 30 °C and 50 °C, respectively.
Upon heating to 100 °C, which is well above the glass transition temperature of this PET (refer to Figure 3), these samples did not change their colour patterns. Stress-induced crystallisation was confirmed [2,10,11] and the stability and reliability of this colouring method was verified.
It should be mentioned that the temperature revealed by the infrared method was the surface temperature of the tested samples. According to the DSC result in Figure 3, the glass transition of the original material started at about 70 °C. Apparently, depending on the temperature increment (and thus the stretching speed), the heat generated in the stress-induced crystallisation not only softens the material, but also provides assistant for the formation of different crystalline structures as previously reported [3,4].
Figure 8 is a typical sample pre-stretched at two different strain rates of 0.01/s and 0.1/s in a periodical manner. Figure 8a is the optical image, which shows an alternating white and transparent pattern. Figure 8b is the image of photoelasticity, in which there is no colour pattern within the transparent areas (stretched at 0.01/s, appearing as white here), whereas the photoelasticity did not work for the areas stretched at 0.1/s, as they were not transparent. Hence, it is concluded that there was no apparent stress variation in the sample.
However, for transparent PVC (refer to Figure S4 in the Supplementary Materials), a rainbow colour pattern (meant for high stress variation) was observed in the transparent areas. This may partially explain why regular colour pattern cannot be formed in PVC. Since there is no stress-induced crystallisation, a much lower temperature increment during stretching (refer to Video S2 in the Supplementary Materials) cannot significantly soften the material (refer to Figure S1 for its glass transition range) for the possibility of a more uniform deformation.
At this point, we may conclude that uniform deformation, stress-induced crystallisation and its resulted high temperature increment are important conditions to achieve patterned colouring via varying the speed during stretching. However, apparently these conditions are not sufficient, since at least some apparent additional conditions are required. For example, the material must be ductile and have long plateaus after yielding.
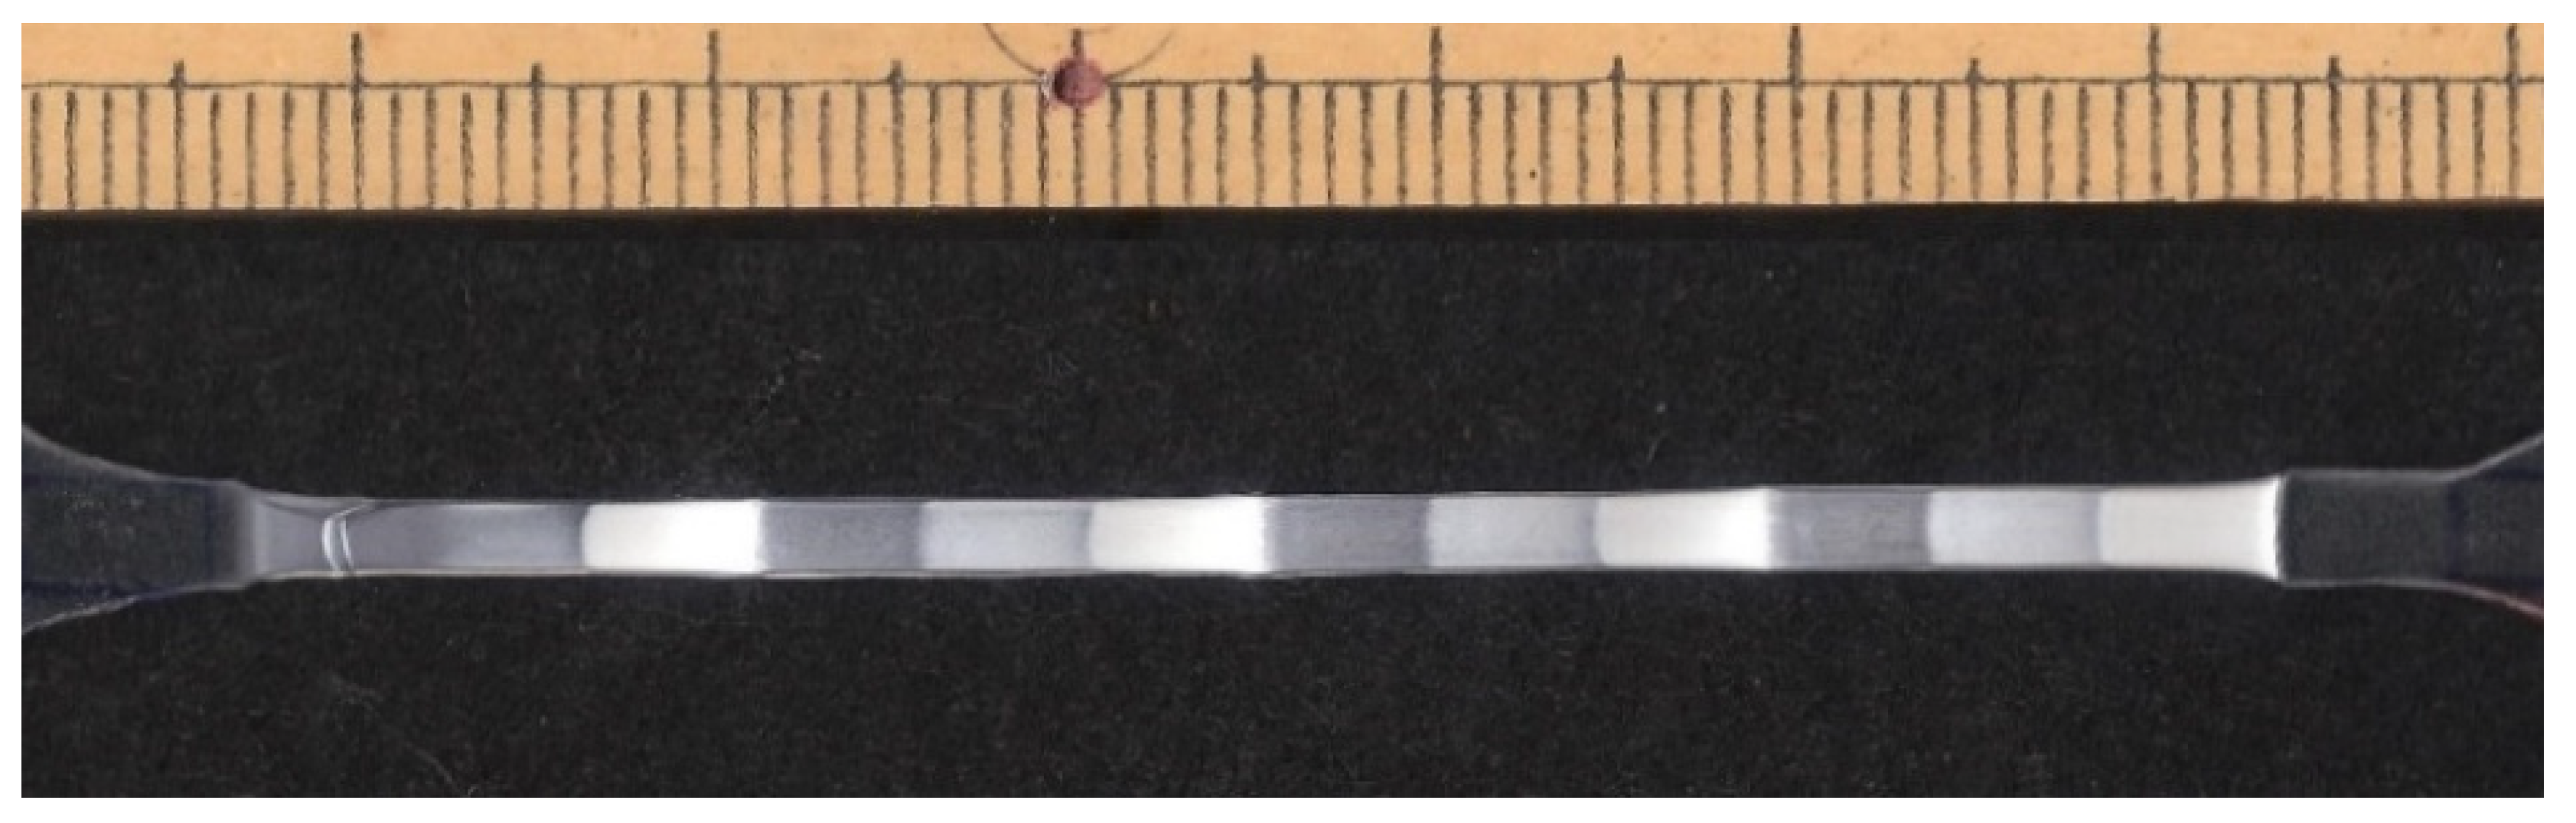
Figure 9 is the closer view of a sample pre-stretched at three different speeds varying in a periodical manner. Transition regions were observed between different coloured areas. From the real engineering application point of view, it is necessary to check the length of the transition region where the stretching speed is suddenly changed.
4. Simulations
The above propagation phenomenon upon stretching of PET strips is essentially a 1-D moving heat source problem [12]. Provided that the heat generated during crystallisation is a constant, both the moving speed (v) of the propagation front, which can be calculated based on the gauge length (L) and applied strain rate () by
and the heat transfer conditions affect the thermal field around the propagation front.
In fact, a similar kind of moving heat source phenomenon has been well-known and widely investigated in stretching shape memory alloy (SMA) wires, in which the heat is generated by the stress-induced martensitic transformation, and the propagation of the phase transformation (from austenite to martensite) front is similar to the movement of the stress-induced crystallisation front observed in PET upon stretching [13].
In [14], two types of closed-form solutions for the thermal analysis of the moving heat source problem for SMA wires under stretching at a constant speed are given. Finite element analysis is also carried out to simulate the thermomechanical response of SMA wires (included with the moving transformation front phenomenon) upon stretching at a constant speed. Since our current study is focused only on the temperature distribution around the propagation front, the closed-form solution of thermal analysis is of our interest.
Refer to Section S3 in the Supplementary Materials for both solutions, one for the case that two fronts propagate in two opposite directions along the SMA wire (Figure S5a in the Supplementary Materials), and the other for the case that one front moves along one direction only (Figure S5b in the Supplementary Materials). Since the case of two-directional propagation was seldomly observed in PET, the closed-form solution of one-directional propagation is more relevant to our current study. Hence, the closed-form solution of one-directional case is used in this study.
As in the investigation of SMA wires upon stretching in [14], we assume that the thermal and physical properties of PET before and after stress-induced crystallisation do not change, and we convert the rectangular cross-section of PET into a circular cross-section with the same cross-sectional area. Based on the DSC results reported in Figure 3, the latent heat of each type of pre-stretched sample in melting upon heating is obtained. Refer to Table 1 for other parameters used in simulations. It is assumed that the environmental temperature is 0 °C. Therefore, the result of the simulation is the actual temperature increment.
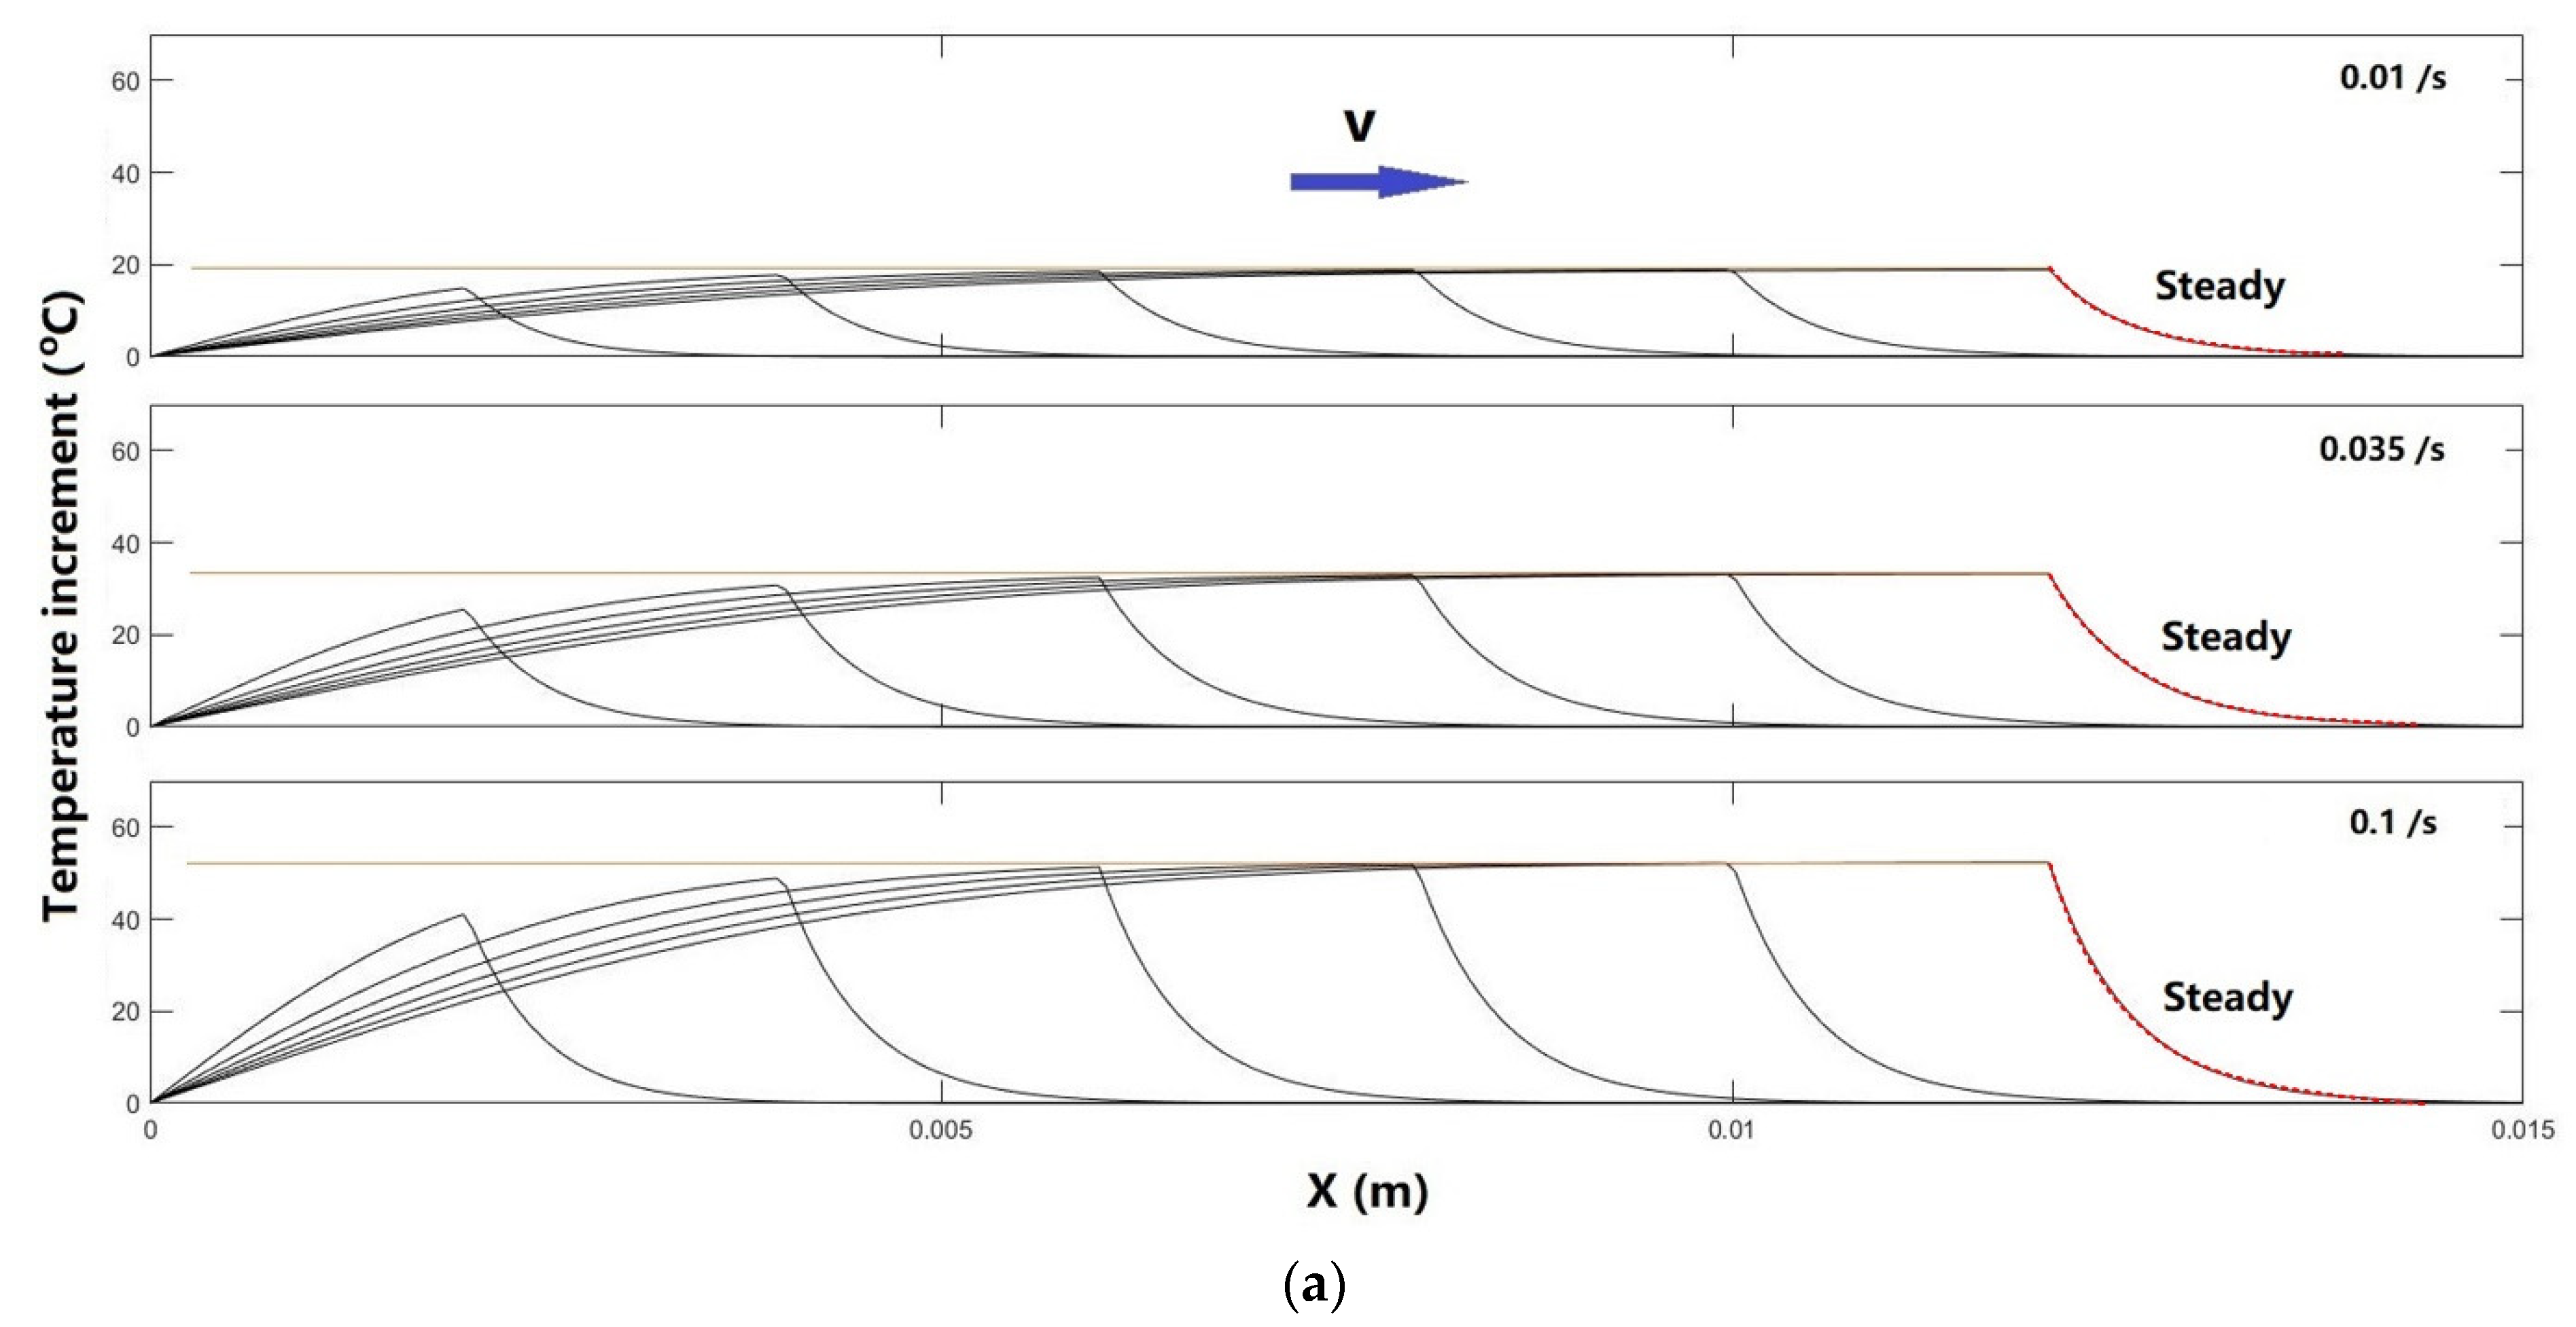
Figure 10a (from top to bottom) reveals the evolution of temperature increment along the PET samples at three strain rates of 0.01/s, 0.035/s and 0.1/s, respectively. The maximum temperature increment in all cases was close to the experimentally obtained ones presented in Figure 7. In order to estimate the temperature field around the propagation front right after sudden change in loading speed (from vi to vj, i ≠ j), for simplicity, we took the steady state temperature distribution at vi as the initial thermal condition (red dotted lines in Figure 10a), and then superimposed it with the temperature distribution of vj presented in Figure 10a.
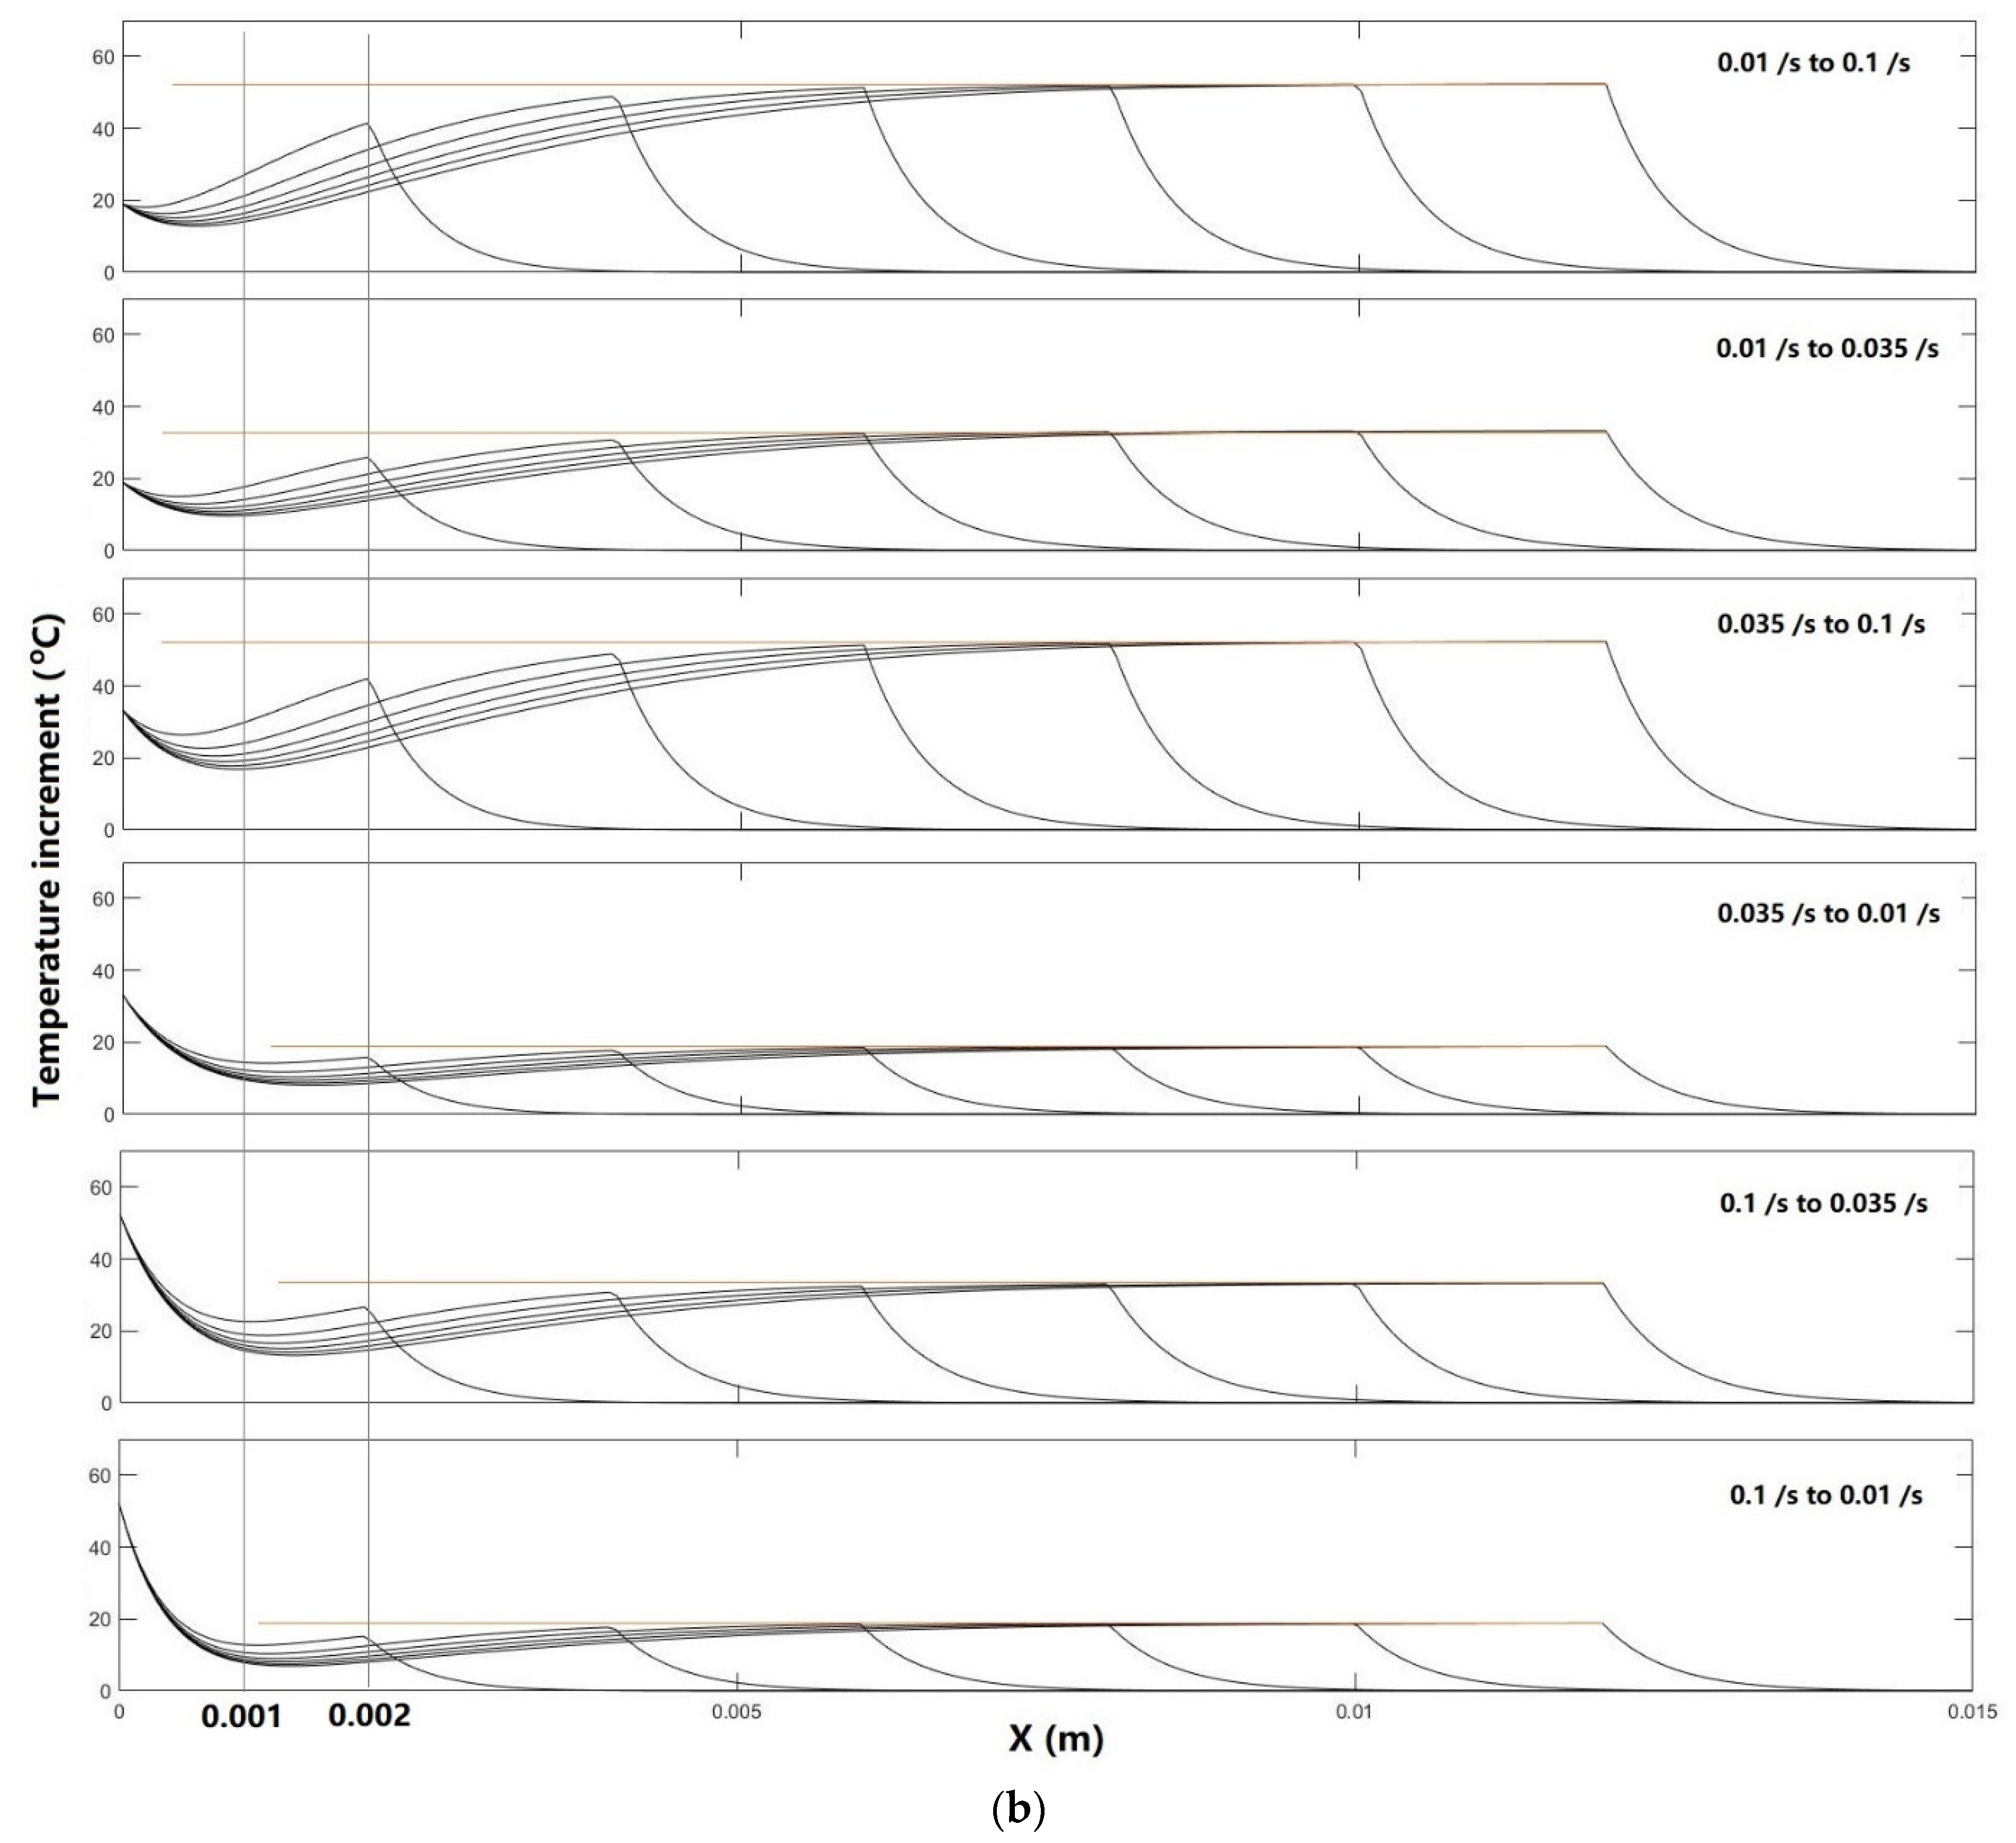
Figure 10b presents the results of six possible combinations of three strain rates (0.01/s, 0.035/s and 0.1/s). Although the simulation was only for estimation, it appeared that there was always a slight delay in thermal response to the change in speed, and the transient length was around 1 to 1.5 mm, depending on how the speed was changed.
In comparison with the typical sample with patterned colour in Figure 9, the actual transition region looked to be well less than 1 mm. There are a couple of reasons for the difference in transition length. While the simulation was only an estimation, and, practically, the change in stretching speed is always over a period of time, the actual resulted colour is affected by not only the loading speed, but also the actual temperature of the propagation front. A range of stretching speeds may result in about the same colour to naked eyes. In this study, three strain rates of 0.01/s, 0.035/s and 0.1/s were selected, because their resulted colours look more perfect and repeatable.
5. Conclusions
In this paper, we report a highly stable and cost-effective approach for patterned colouring. This approach is also environmentally friendly, since it only involves one single stretching of the material. Different colour patterns can be produced by varying the stretching speed, although the number of available colours is limited.
For the PET used in this study, the possible colours are limited to transparent, white/translucent and completely white (silver). Various regular colour patterns made out of these three colours have been achieved in PET strips.
Further study reveals that this approach is applicable under certain conditions for transparent polymers. Apart from being ductile and with a long stress plateau after yielding, uniform deformation in uniaxial stretching, stress-induced crystallisation and a high enough temperature increment during stress-induced crystallisation are important to ensure a good quality of colour patterns.
Theoretical estimations of the temperature distribution at the propagation front during changing the stretching speed are also made to investigate the length of the transient region.
Supplementary Materials
The following supporting information can be downloaded at: https://www.mdpi.com/article/10.3390/inventions7040093/s1. Video S1 Polyethylene terephthalate (PET) under uniaxial stretching at periodically varied speed. Video S2 Polyvinyl chloride (PVC) under uniaxial stretching at periodically varied speed. Figure S1: DSC result of PVC. (Heating/cooling speed: 10 °C/min). Figure S2: Stress whitening in PVC transparency after folding at room temperature (a) and after heating to 100 °C for recovery. Figure S3: Typical PVC samples after uniaxial stretching at a periodically varied speed. (Refer to Video S2 above for infrared video of stretching tests). Figure S4: Comparison of normal optical (a) and photoelasticity (b and c, polarized lens with different angles with the monitor) images. Figure S5: Illustration of propagation of the phase transformation front(s) along a long wire (a) in two directions and (b) in one direction.
Author Contributions
V.M.T., K.P.S., R.T. and Z.W.—investigation; R.X., H.L. and Y.Z.—conceptualization, review; X.W.—conceptualization, investigation, data curation and writing; W.M.H.—conceptualization, supervision, review and editing. All authors have read and agreed to the published version of the manuscript.
Funding
This work was partially supported by the National Natural Science Foundation of China (Grant No. 11828201).
Acknowledgments
Simulations were conducted by V.M.T. and K.P.S. as part of their IndiaConnect@NTU Internship Programme under the supervision of W.M.H.
Conflicts of Interest
The authors declare no conflict of interest, and the manuscript was approved by all authors for publication.
References
- Salvekar, A.V.; Zhou, Y.; Huang, W.M.; Wong, Y.S.; Venkatraman, S.S.; Shen, Z.; Zhu, G.; Cui, H.P. Shape/temperature memory phenomena in un-crosslinked poly-ɛ-caprolactone (PCL). Eur. Polym. J. 2015, 72, 282–295. [Google Scholar] [CrossRef]
- Keum, J.K.; Kim, J.; Lee, S.M.; Song, H.H.; Son, Y.-K.; Choi, J.-I.; Im, S.S. Crystallization and Transient Mesophase Structure in Cold-Drawn PET Fibers. Macromolecules 2003, 36, 9873–9878. [Google Scholar] [CrossRef]
- Asano, T.; Seto, T. Morphological Studies of Cold Drawn Poly(ethylene terephthalate). Polym. J. 1973, 5, 72–85. [Google Scholar] [CrossRef] [Green Version]
- Asano, T.; Calleja, F.J.B.; Flores, A.; Tanigaki, M.; Mina, M.F.; Sawatari, C.; Itagaki, H.; Takahashi, H.; Hatta, I. Crystallization of oriented amorphous poly(ethylene terephthalate) as revealed by X-ray diffraction and microhardness. Polymer 1999, 40, 6475–6484. [Google Scholar] [CrossRef]
- Ito, M.M.; Gibbons, A.H.; Qin, D.; Yamamoto, D.; Jiang, H.; Yamaguchi, D.; Tanaka, K.; Sivaniah, E. Structural colour using organized microfibrillation in glassy polymer films. Nature 2019, 570, 363–367. [Google Scholar] [CrossRef] [PubMed]
- Khudiyev, T.; Ozgur, E.; Yaman, M.; Bayindir, M. Structural Coloring in Large Scale Core–Shell Nanowires. Nano Lett. 2011, 11, 4661–4665. [Google Scholar] [CrossRef]
- Wang, C.; Pek, J.X.; Chen, H.M.; Huang, W.M. On-Demand Tailoring between Brittle and Ductile of Poly (methyl methacrylate)(PMMA) via High Temperature Stretching. Polymers 2022, 14, 985. [Google Scholar] [CrossRef]
- Bradley, W.B.; Kobayashi, A.S. An investigation of propagating cracks by dynamic photoelasticity. Exp. Mech. 1970, 10, 106–113. [Google Scholar] [CrossRef]
- Pakula, T.; Fischer, E.W. Instabilities of the deformation process in cold drawing of poly(ethylene terephthalate) and other polymers. J. Polym. Sci. Polym. Phys. Ed. 1981, 19, 1705–1726. [Google Scholar] [CrossRef]
- Ran, S.; Zong, X.; Fang, D.; Hsiao, A.B.S.; Chu, B.; Phillips, R.A. Structural and Morphological Studies of Isotactic Polypropylene Fibers during Heat/Draw Deformation by in-Situ Synchrotron SAXS/WAXD. Macromolecules 2001, 34, 2569–2578. [Google Scholar] [CrossRef]
- Kawakami, D.; Ran, S.; Burger, C.; Avila-Orta, C.; Sics, I.; Chu, B.; Hsiao, B.S.; Kikutani, T. Superstructure Evolution in Poly(ethylene terephthalate) during Uniaxial Deformation above Glass Transition Temperature. Macromolecules 2006, 39, 2909–2920. [Google Scholar] [CrossRef]
- Eckert, E.R.G. Heat and Mass Transfer; McGraw-Hill Book Company: London, UK, 1959. [Google Scholar]
- Huang, W.M. Transformation front in shape memory alloys. Mater. Sci. Eng. A Struct. Mater. Prop. Microstruct. Process. 2005, 392, 121–129. [Google Scholar] [CrossRef]
- Huang, W.M. Shape Memory Alloys and Their Application to Actuators for Deployable Structures. Ph.D. Thesis, Cambridge University, Cambridge, UK, 1998. [Google Scholar]
Figure 1.
Illustration of patterned colouring via variable-speed single stretching. (a) Original sample; (b) regular colour pattern formed after variable-speed single stretching.
Figure 1.
Illustration of patterned colouring via variable-speed single stretching. (a) Original sample; (b) regular colour pattern formed after variable-speed single stretching.

Figure 2.
Sample dimensions (unit: mm).

Figure 3.
DSC results of original sample and samples after being stretched at three different strain rates of 0.01/s, 0.035/s and 0.1/s, respectively (at 10 °C/min, Endo down).
Figure 3.
DSC results of original sample and samples after being stretched at three different strain rates of 0.01/s, 0.035/s and 0.1/s, respectively (at 10 °C/min, Endo down).

Figure 4.
Typical colour patterns. (a–c) are produced by single strain rate of 0.01/s, 0.035/s and 0.1/s, respectively; (d–f) are two or three different strain rates applied in a periodic manner (refer to Figure 5 for their corresponding strain rate vs. stretching strain relationships).
Figure 4.
Typical colour patterns. (a–c) are produced by single strain rate of 0.01/s, 0.035/s and 0.1/s, respectively; (d–f) are two or three different strain rates applied in a periodic manner (refer to Figure 5 for their corresponding strain rate vs. stretching strain relationships).

Figure 5.
Applied strain rate (in base 10 logarithmic scale) vs. strain relationship and typical stress vs. strain response corresponding to six types of colour patterns in Figure 4.
Figure 5.
Applied strain rate (in base 10 logarithmic scale) vs. strain relationship and typical stress vs. strain response corresponding to six types of colour patterns in Figure 4.

Figure 6.
Typical optical and corresponding infrared images of samples in stretching at (a) 0.01/s (maximum temperature about 25 °C), (b) 0.035/s (maximum temperature about 34 °C), and (c) 0.1/s (maximum temperature about 47 °C). Their corresponding temperature bars are also included.
Figure 6.
Typical optical and corresponding infrared images of samples in stretching at (a) 0.01/s (maximum temperature about 25 °C), (b) 0.035/s (maximum temperature about 34 °C), and (c) 0.1/s (maximum temperature about 47 °C). Their corresponding temperature bars are also included.

Figure 7.
Infrared images taken by infrared camera at strain rates of (a) 0.01/s, (b) 0.035/s and (c) 0.1/s (propagation fronts moving downward).
Figure 7.
Infrared images taken by infrared camera at strain rates of (a) 0.01/s, (b) 0.035/s and (c) 0.1/s (propagation fronts moving downward).

Figure 8.
Optical (a) and photoelasticity (b) images of pre-stretched PET.

Figure 9.
Typical sample after patterned colouring via single stretching at a periodically varied speed.
Figure 9.
Typical sample after patterned colouring via single stretching at a periodically varied speed.

Figure 10.
Simulations of temperature field (increment). (a) Single-speed stretching; (b) transient period after sudden change in loading speed (at x = 0).
Figure 10.
Simulations of temperature field (increment). (a) Single-speed stretching; (b) transient period after sudden change in loading speed (at x = 0).


Table 1.
Parameters used in simulations.
| Radius of Sample | 0.69 mm | Heat Capacity | 1050 J/Kg °C |
|---|---|---|---|
| Gauge length | 20 mm | Thermal conductivity | 0.14 Wm/°C |
| Density | 1290 Kg/m3 | Convection heat-transfer coefficient | 4.5 W/m2 °C |
Publisher’s Note: MDPI stays neutral with regard to jurisdictional claims in published maps and institutional affiliations. |
© 2022 by the authors. Licensee MDPI, Basel, Switzerland. This article is an open access article distributed under the terms and conditions of the Creative Commons Attribution (CC BY) license (https://creativecommons.org/licenses/by/4.0/).
Share and Cite
MDPI and ACS Style
Wu, X.; Tiwari, V.M.; Suryarao, K.P.; Tan, R.; Xiao, R.; Lv, H.; Zhang, Y.; Wang, Z.; Huang, W.M. Patterned Colouring via Variable-Speed Single Stretching. Inventions 2022, 7, 93. https://doi.org/10.3390/inventions7040093
AMA Style
Wu X, Tiwari VM, Suryarao KP, Tan R, Xiao R, Lv H, Zhang Y, Wang Z, Huang WM. Patterned Colouring via Variable-Speed Single Stretching. Inventions. 2022; 7(4):93. https://doi.org/10.3390/inventions7040093
Chicago/Turabian StyleWu, Xuelian, Vishwa Mohan Tiwari, Kimaya Prasad Suryarao, Richard Tan, Rui Xiao, Haibao Lv, Yilei Zhang, Zhifeng Wang, and Wei Min Huang. 2022. "Patterned Colouring via Variable-Speed Single Stretching" Inventions 7, no. 4: 93. https://doi.org/10.3390/inventions7040093