Article

Study on Road Friction Database for Traffic Safety: Construction of a Road Friction-Measuring Device

1
Consortium on Advanced Road-Friction Database, 1-4-31 Hachimandai, Sakura 285-0867, Japan
2
College of Industrial Technology, Nihon University, 1-2-1 Izumi-cho, Narashino 275-8575, Japan
3
Institutes of Innovation for Future Society, Nagoya University, Furocho, Chikusaku, Nagoya 464-8603, Japan
4
Department of Mechanical Engineering for Transportation, Faculty of Engineering, Osaka Sangyo University, 3-1-1 Nakagaito, Daito 574-8530, Japan
5
Absolute Co., Ltd., 839-1 Kamikasuya, Isehara 259-1141, Japan
*
Authors to whom correspondence should be addressed.
Inventions 2022, 7(4), 90; https://doi.org/10.3390/inventions7040090
Submission received: 31 July 2022 / Revised: 23 September 2022 / Accepted: 29 September 2022 / Published: 3 October 2022
(This article belongs to the Collection Feature Innovation Papers)

Abstract

:
This study focuses on the possibility of constructing a database on friction coefficients for actual roads from the viewpoint of traffic safety. A measurement algorithm is established to construct a road friction-measuring device. Next, the tires are selected for use in the measurements and their characteristics are measured using a bench tire characteristic tester. The measuring device is designed and constructed based on these characteristics. Finally, using this device, the measurement results of the road friction characteristics for two types of road surfaces are presented.

1. Introduction

The road friction coefficient on actual roads varies considerably depending on the pavement materials used, the state of the road surfaces, tire structure, and the surface material. A systematic method for measuring the braking friction coefficient on an actual road and the creation of a database can significantly contribute to improving traffic safety and developing a new driving support system based on automated driving. Road friction characteristics, which are important for road safety [1], are interpreted differently by road engineers and automotive engineers. In road-related research, the friction characteristic between the tire and the road surface is treated as a representative value of the friction characteristic at the time of locking, which is related to the dynamic friction coefficient. This value is fundamental in pavement management, as many road administrations include this value in their pavement management systems (AASHTO 2012). Many studies on road surface friction such as the aspect of sliding friction, concerning the texture of pavement materials, the relationship between dynamic friction and sliding friction, the characteristic relationship between road friction-measurement devices, the relationship between accident risk and road friction, and so on have been conducted in the past, and many useful research results have led the field of road management and so on [1,2,3,4,5,6,7,8,9,10,11,12,13,14,15,16,17].
Meanwhile, in automotive research, the peak coefficient of friction is considered important because of the maximum braking force. In particular, both the braking force and the lateral force are generated simultaneously, which is a very important characteristic of vehicle safety. The friction characteristic at this time is the region where both static and dynamic friction generates a force at the patch of the tire in contact with the road, therefore, a force larger than the friction coefficient at the time of locking is generated. However, in the past, it was difficult for drivers to maintain this area; thus, automotive engineers also used road friction at the time of locking as an index. It was found that when a system for preventing wheels from locking was introduced in railways, it not only suppressed uneven wear of wheels but also increased the braking force. Therefore, this system was introduced in landing tires in the aircraft field and then later in automobiles. By introducing Antilock Braking System (ABS), not only can the braking distance be shortened, but the directional stability of the vehicle could be ensured. Since November 2014, the ABS became mandatory for ordinary vehicles in Japan [Braking device (Related to Article 12 of the Safety Standards, Article 15, Article 16, Article 93, Article 94, Article 171, Article 172, Attachment 10, Attachment 11, Attachment 15) ”Agreement Regulations on Braking Systems (No. 13)”], and near ideal braking distances on each road surface can be achieved when braking. For this reason, it is important to measure the characteristics of the force generated in the contact patch of the tire on various road surfaces and clarify these characteristics from the viewpoint of road safety. Figure 1 shows the results of μ-s characteristics measured using various tires under various road surface conditions. The lateral axis in Figure 1 represents the coefficient of friction, while the longitudinal axis represents the slip ratio. The slip ratio is defined by Equation (1).
s = v ω r v
where s is the slip ratio; ω is the angular velocity of the tire; r is the tire radius; and v is the speed of the vehicle.
These data were obtained at 65 km/h on a paved road surface by corroborated research in a previous stage of this study and were recorded under different conditions such as different pavements, tires, road surface conditions such as dry and wet, and loads.
From Figure 1, it can be seen that the peak friction coefficient (peak μ) mainly occurs at a slip ratio of 0.2 or less. Further, the value of the slip ratio 1 becomes the value of the friction coefficient at the time of locking (similarly, the locking μ). Further, the peak μ exhibits a value that is approximately 1.2 times or more than that of the lock μ. In addition, the peak μ value fluctuates greatly depending on the road surface conditions such as dry and wet surfaces and the differences in tires. Therefore, there is a problem that the braking distance of the vehicles will differ by approximately two times even under normal road surface conditions. Furthermore, it is known that the braking distance on snowy and icy roads differs by approximately 10 times the braking distance on dry surfaces. Therefore, from the viewpoint of vehicle safety, it is extremely important to clarify these characteristics when driving. In particular, in autopilot vehicles, which are expected to become widespread in the coming years, the controller needs to perform safety management: especially in systems of level 4 or higher where the responsibility of the vehicle is important, this information is indispensable. However, no such friction database exists currently, which is a bottleneck in the construction of such a system. Therefore, to solve these problems, we constructed a road surface friction database and based on this database, we conduct research aiming to construct a road friction estimation system [18,19,20,21].
To advance this research and construct such a database, in this study, we will examine the construction of a system that can continuously measure road surface friction on ordinary roads.
Figure 1. Characteristics of the road friction coefficient [19]. The 74 lines represent 74 tire data. The 74 lines are color coded to uniquely identify the friction coefficient change of each tire with slip ratio change. Since the types of colors that can be used are limited, same colors are assigned to multiple tire data as long as it is not confusing.
Inventions 07 00090 g001

2. Method to Estimate Road Friction Coefficient

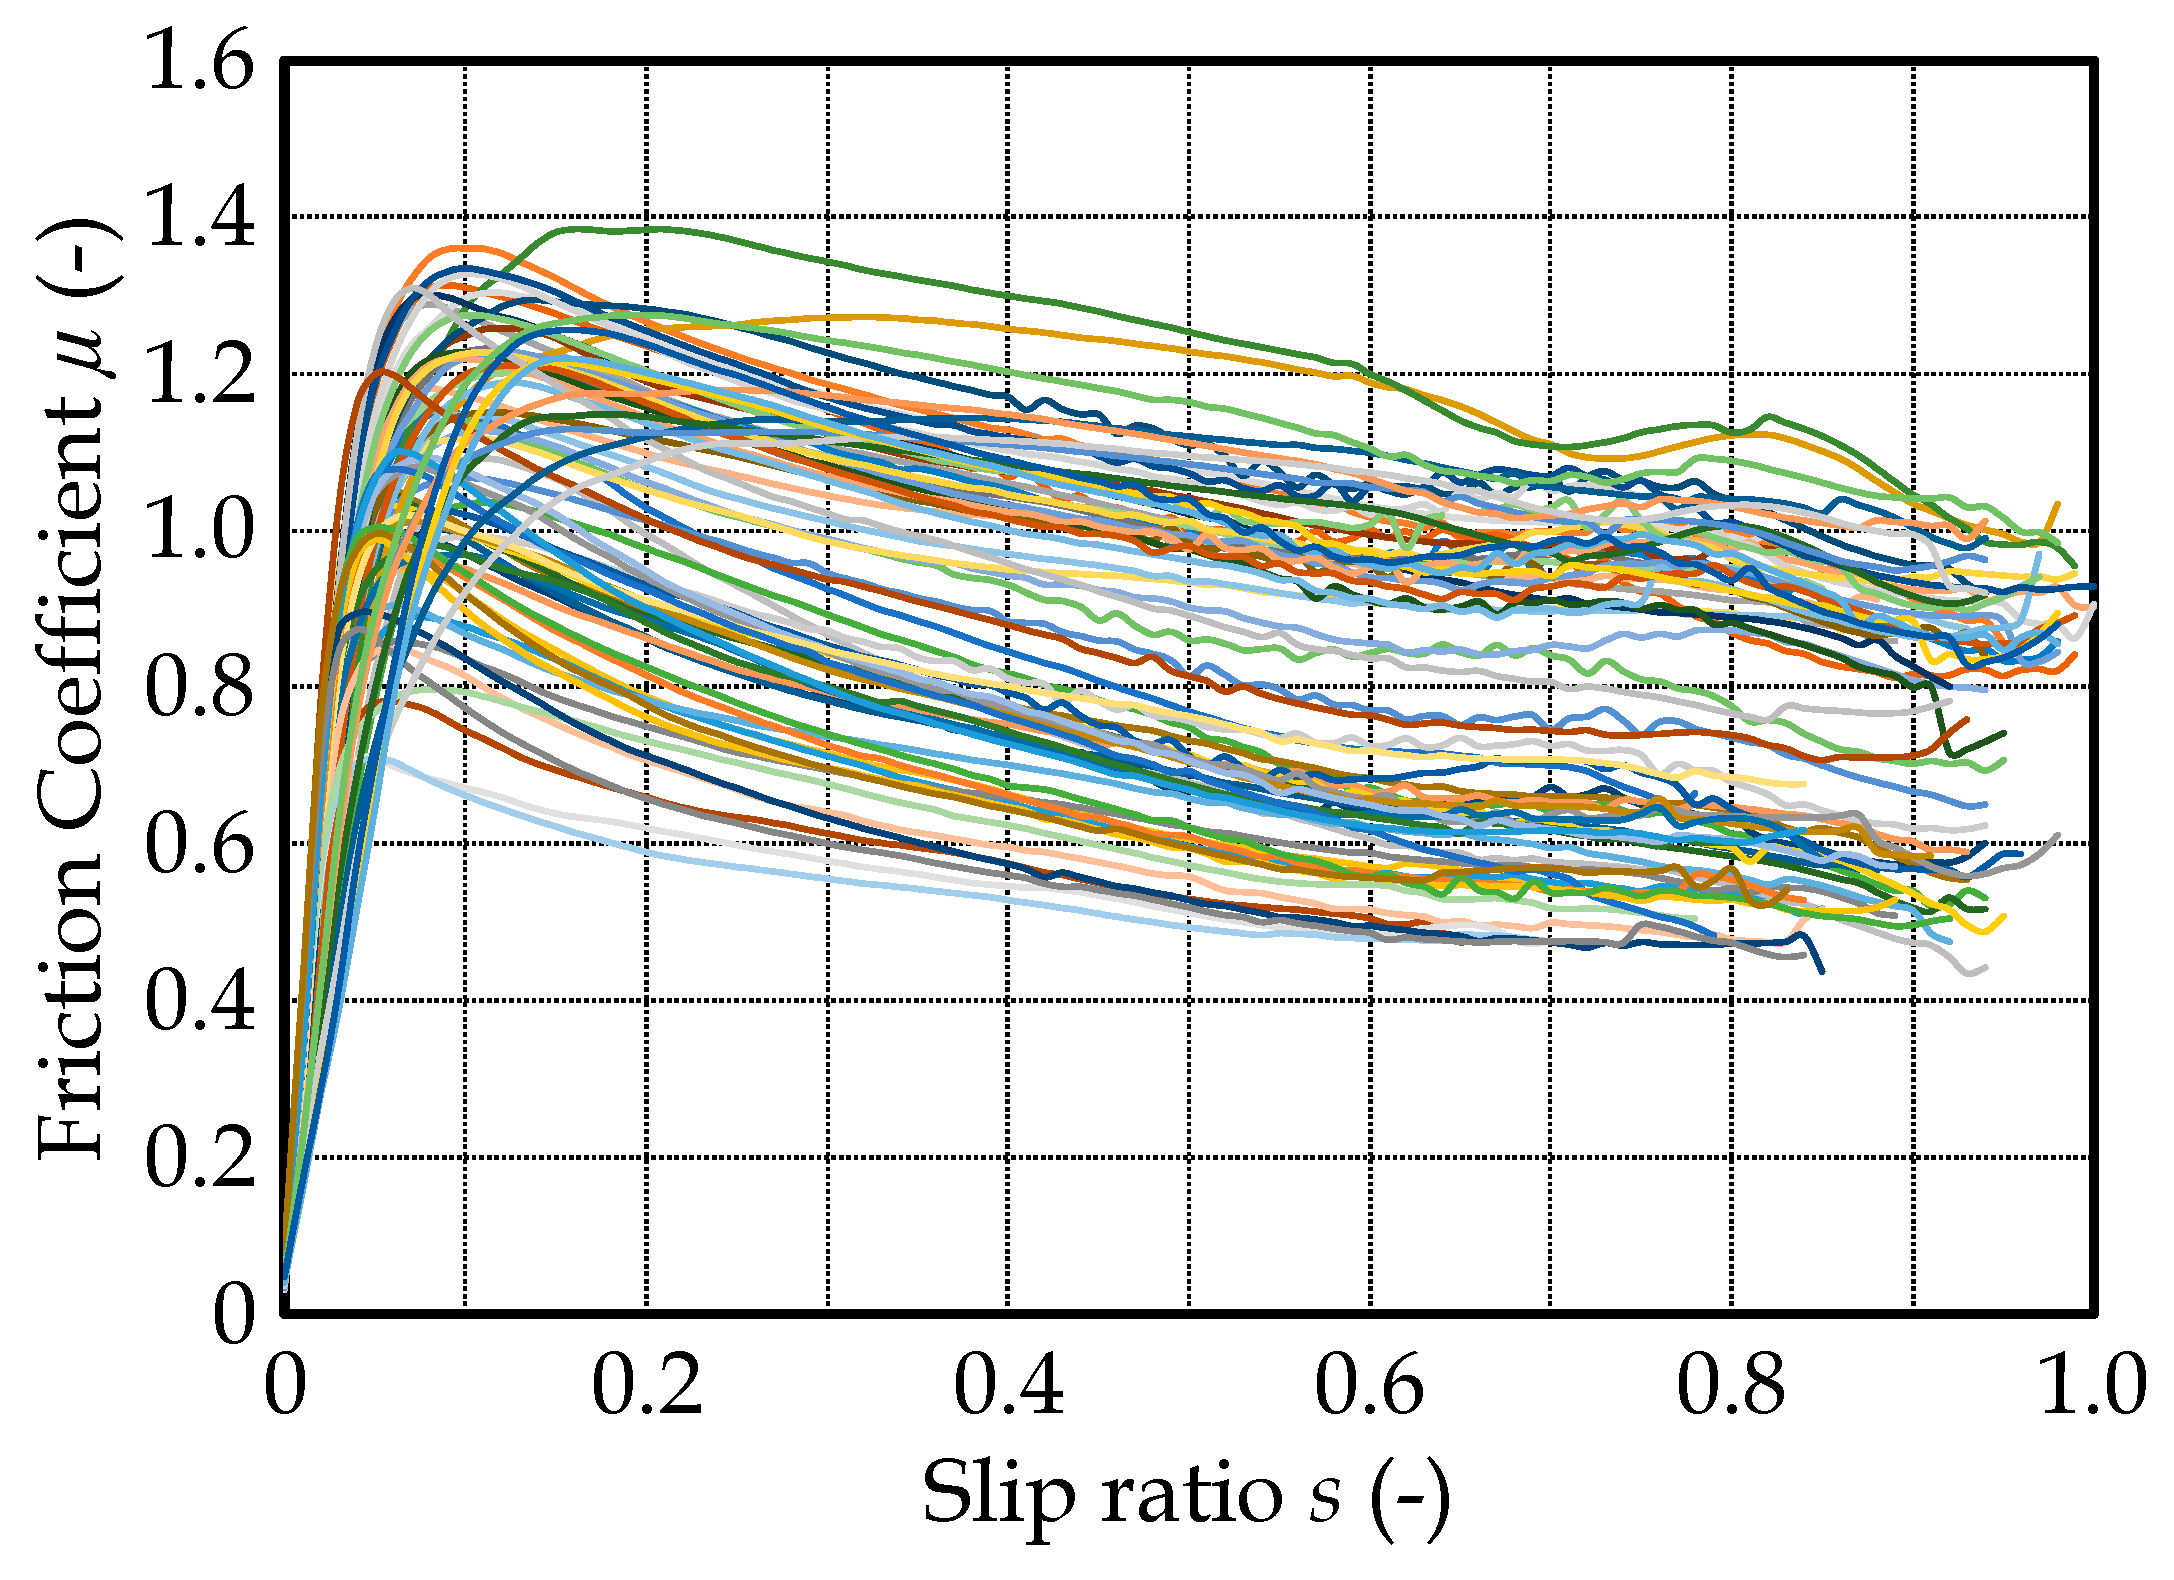
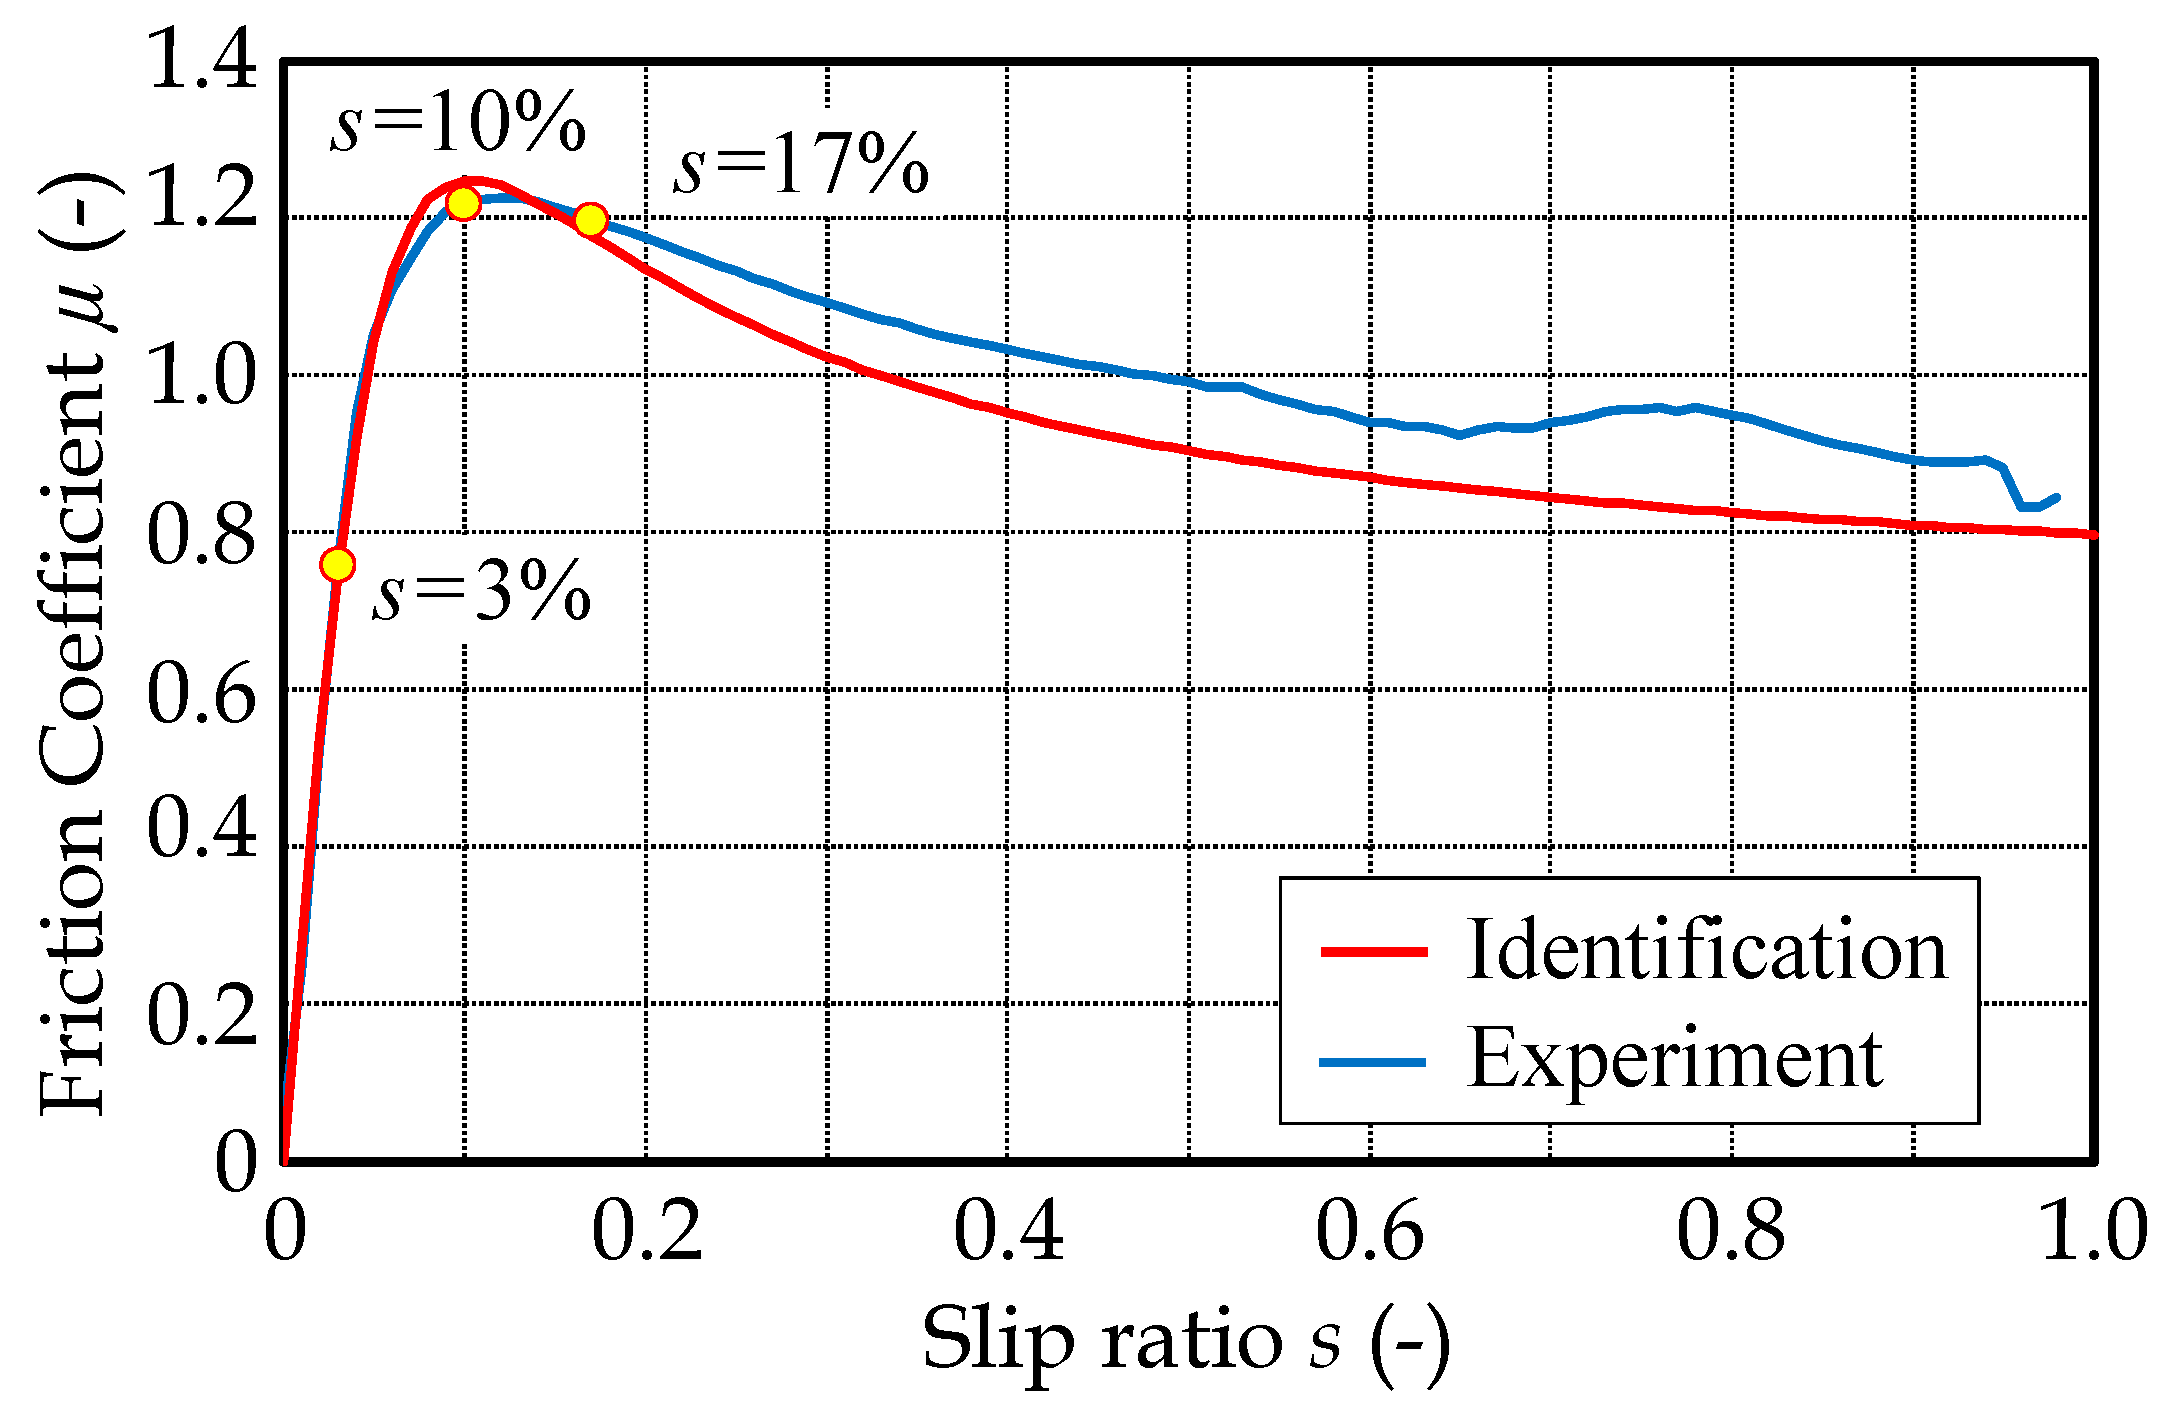
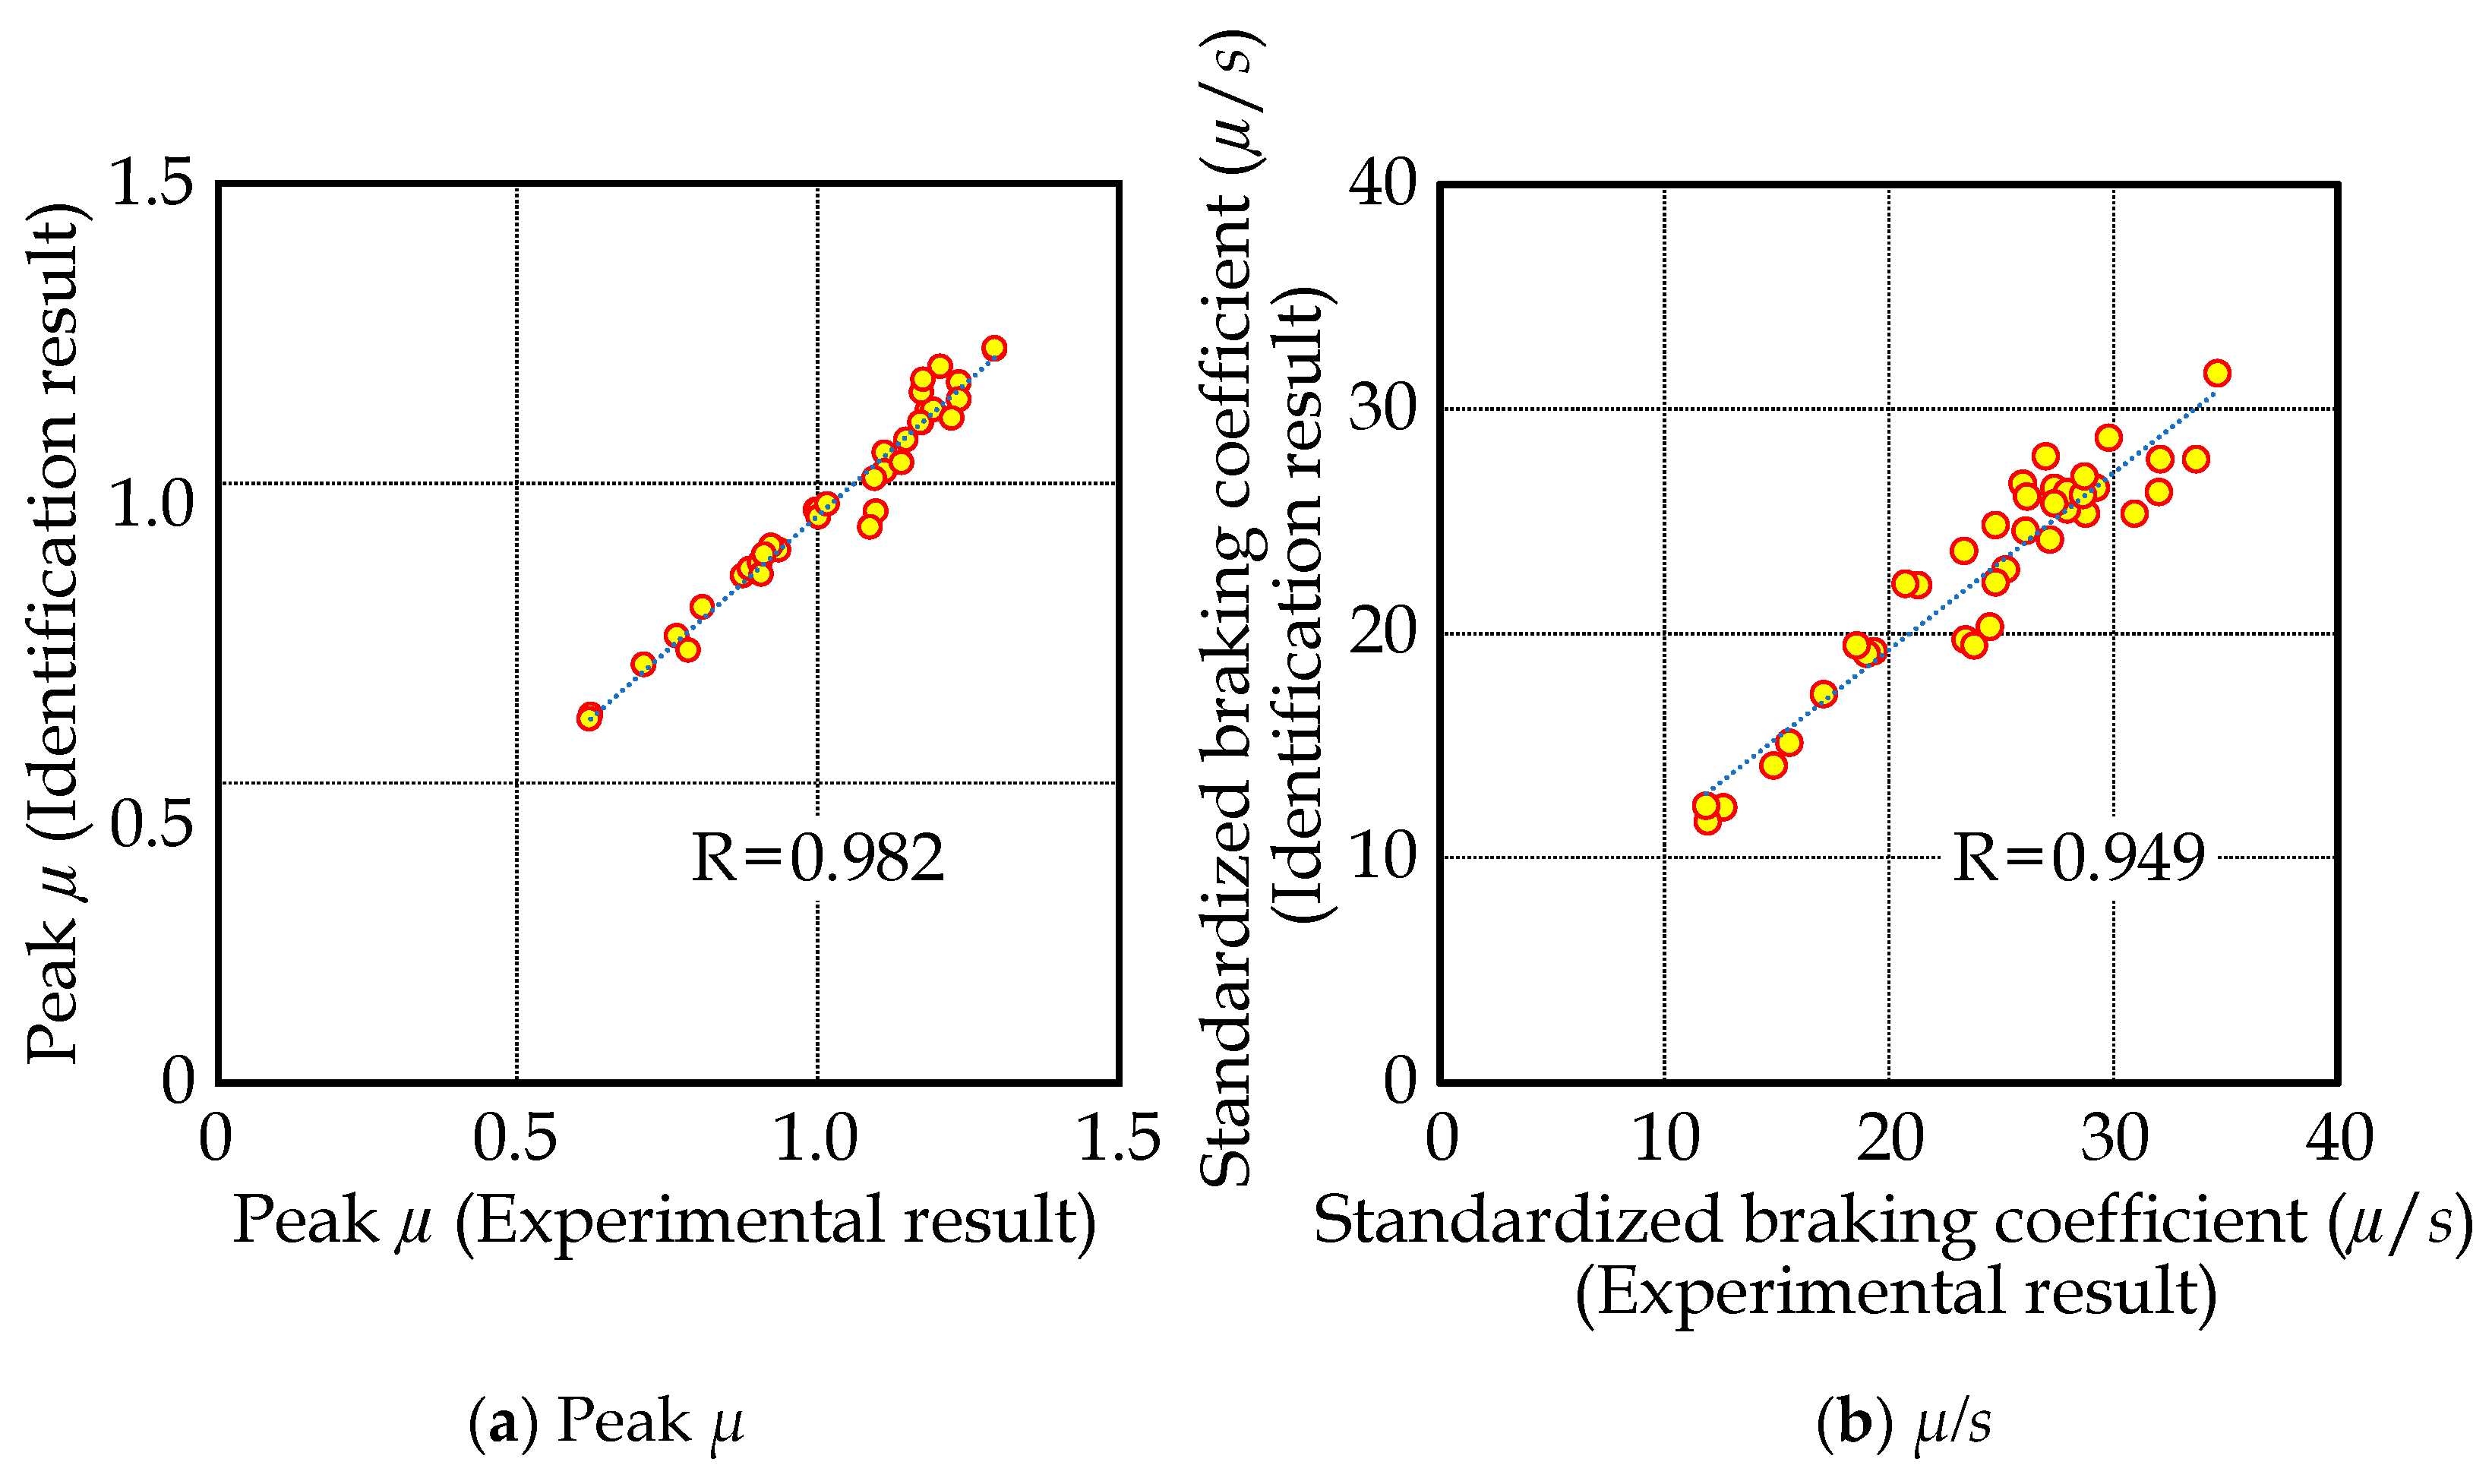
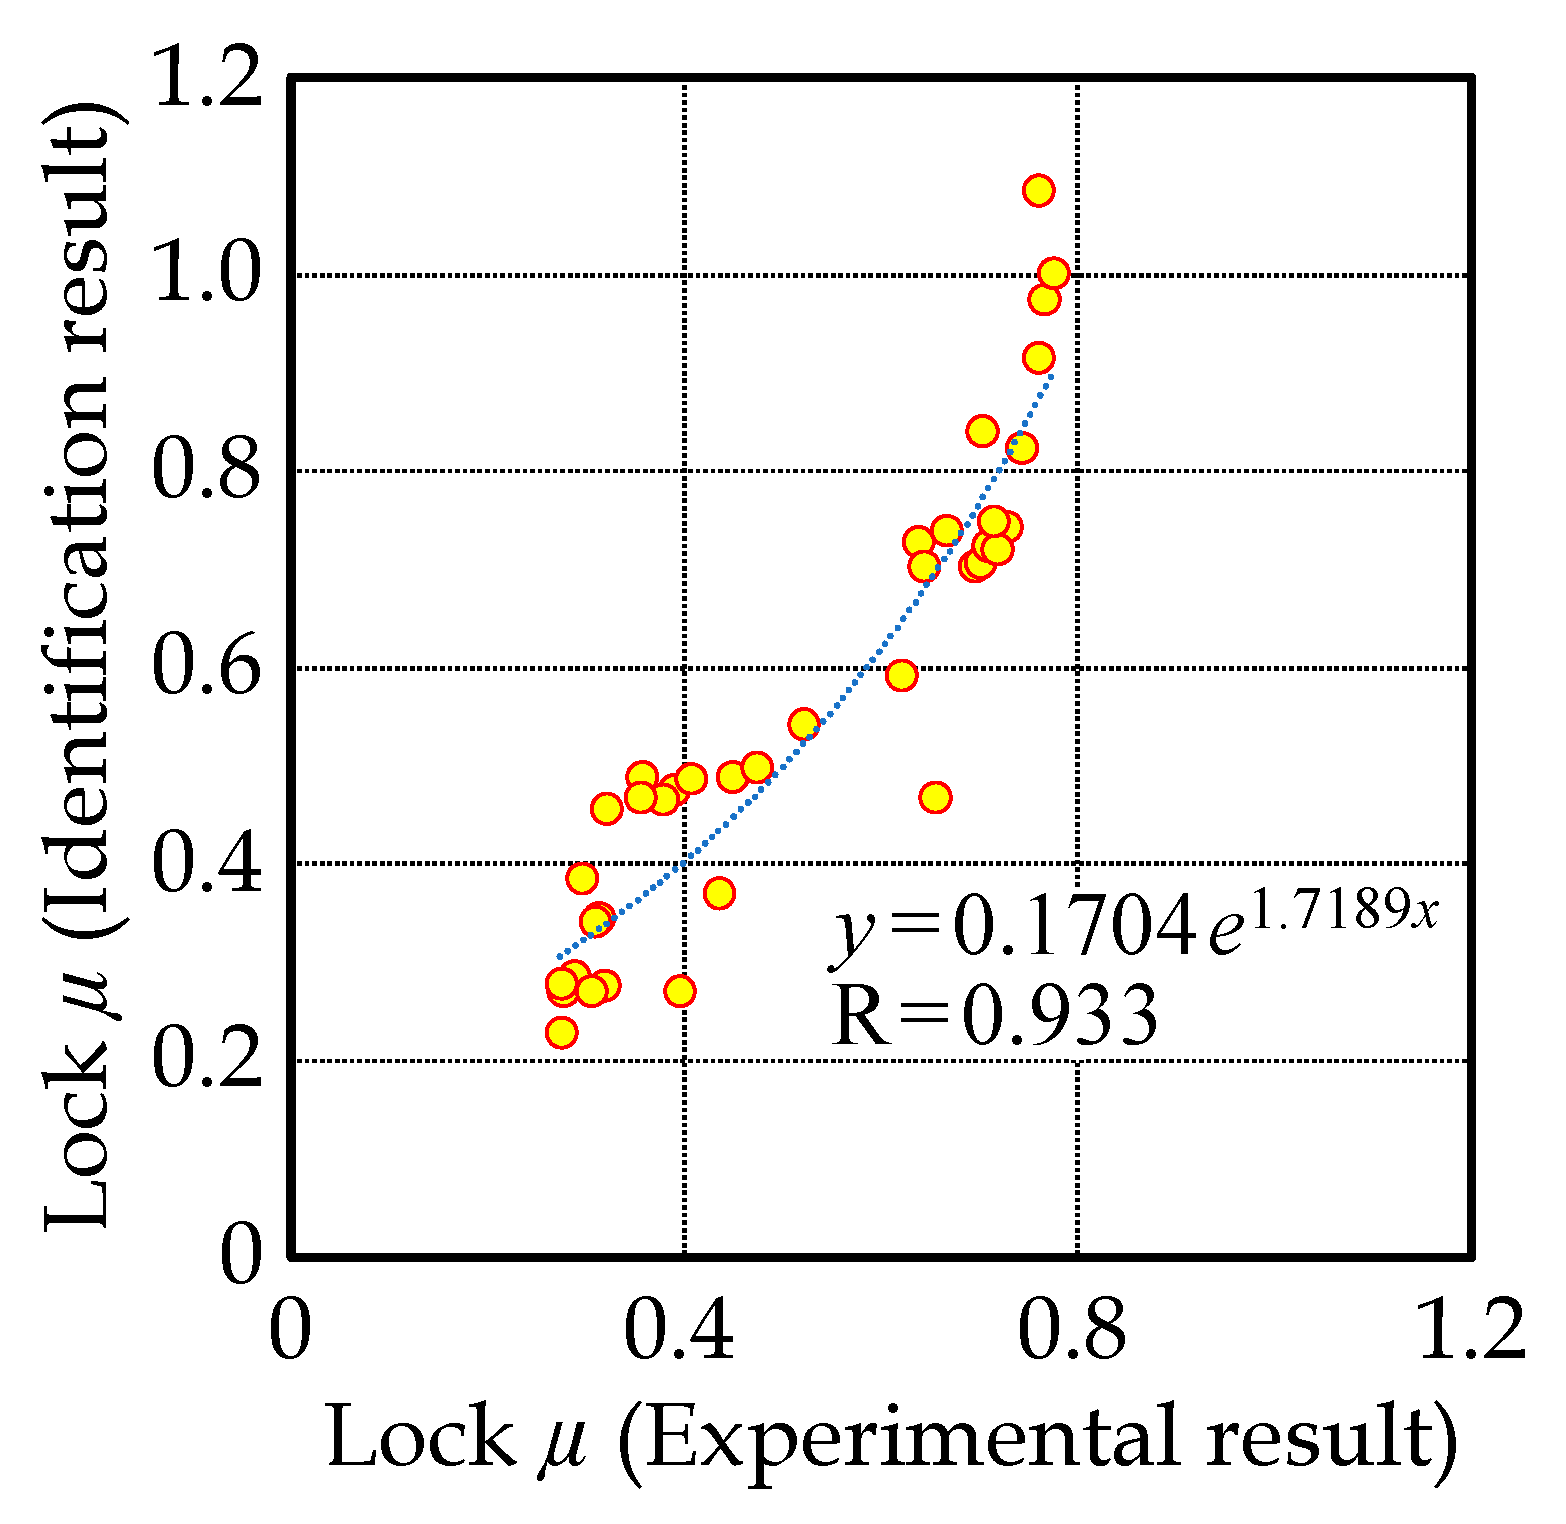
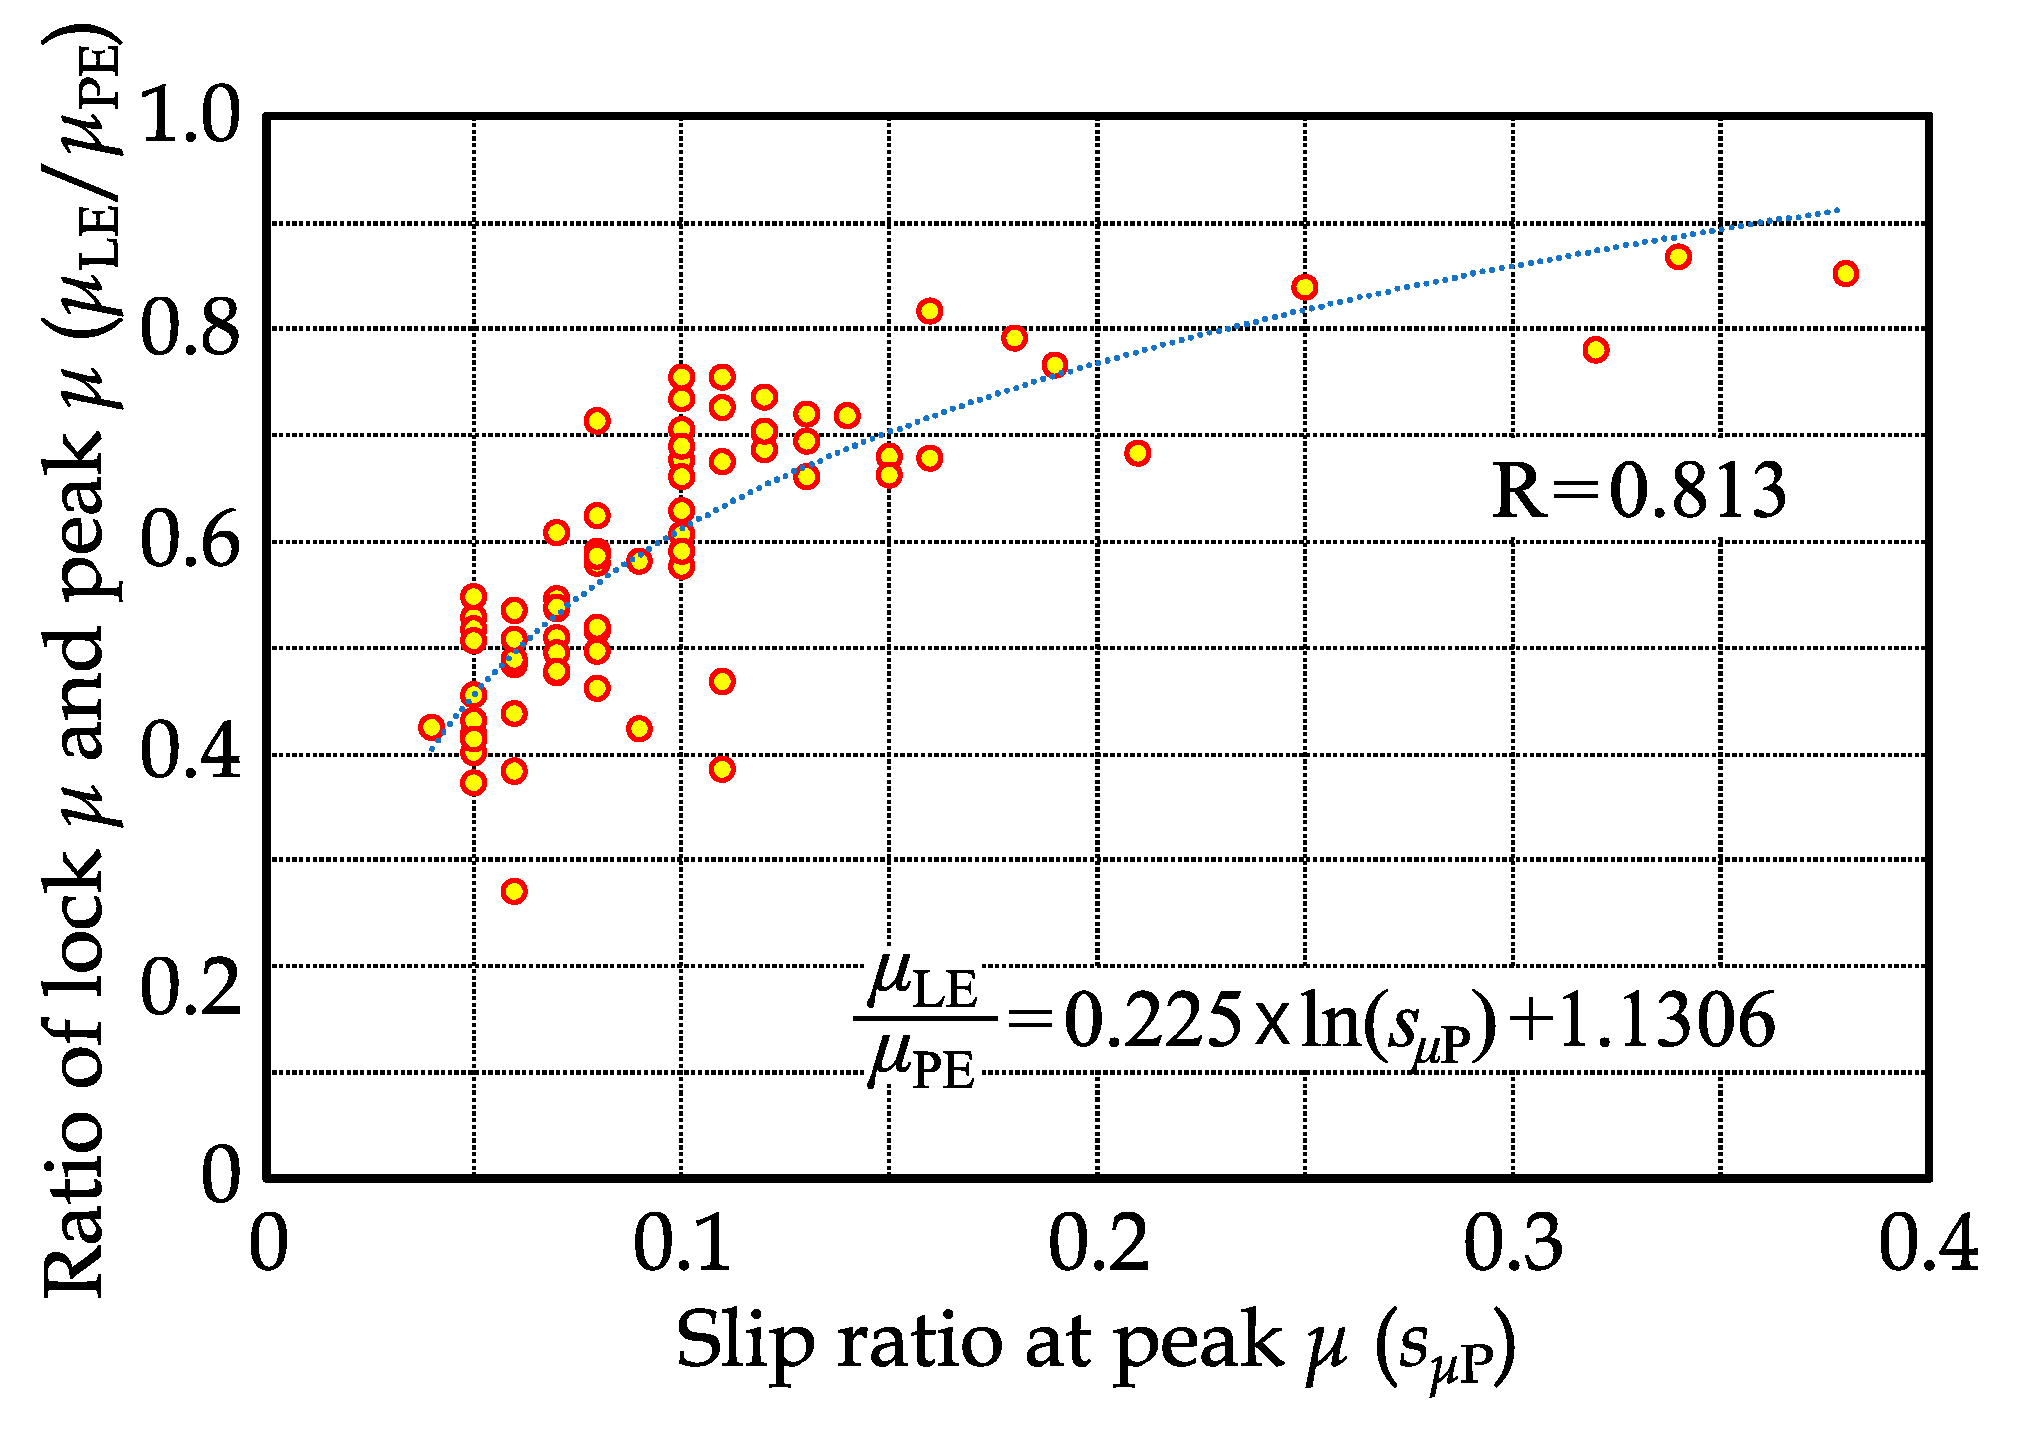
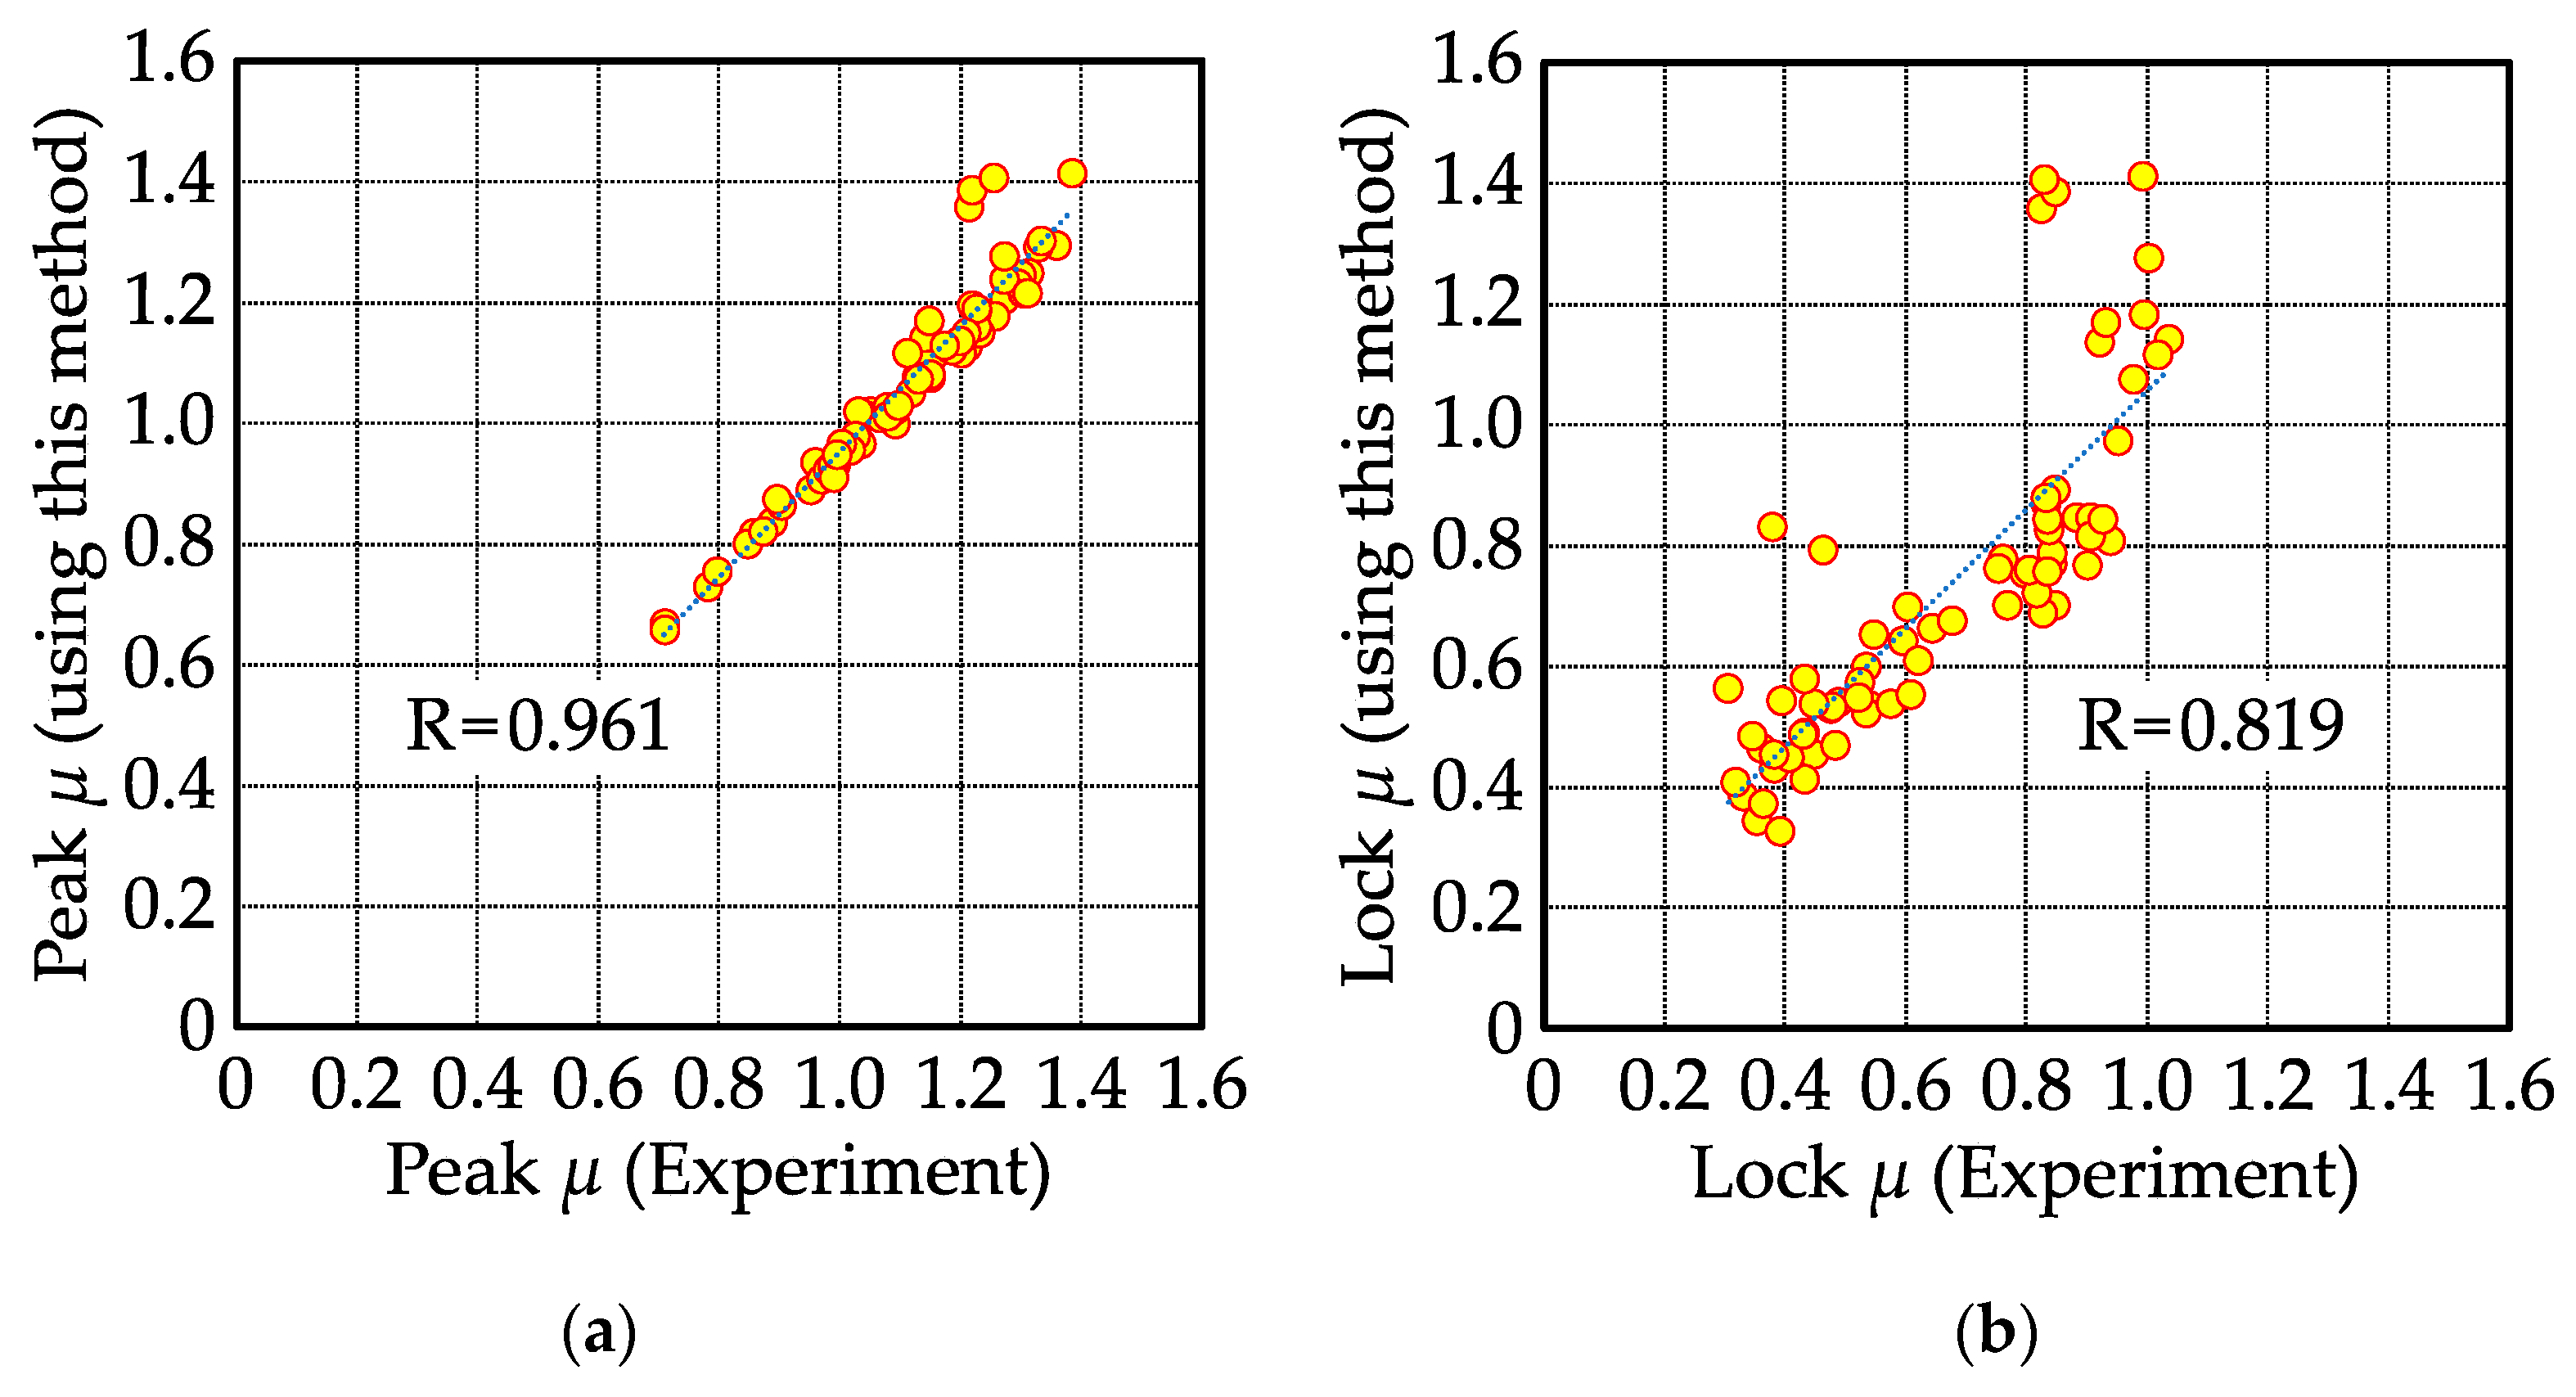
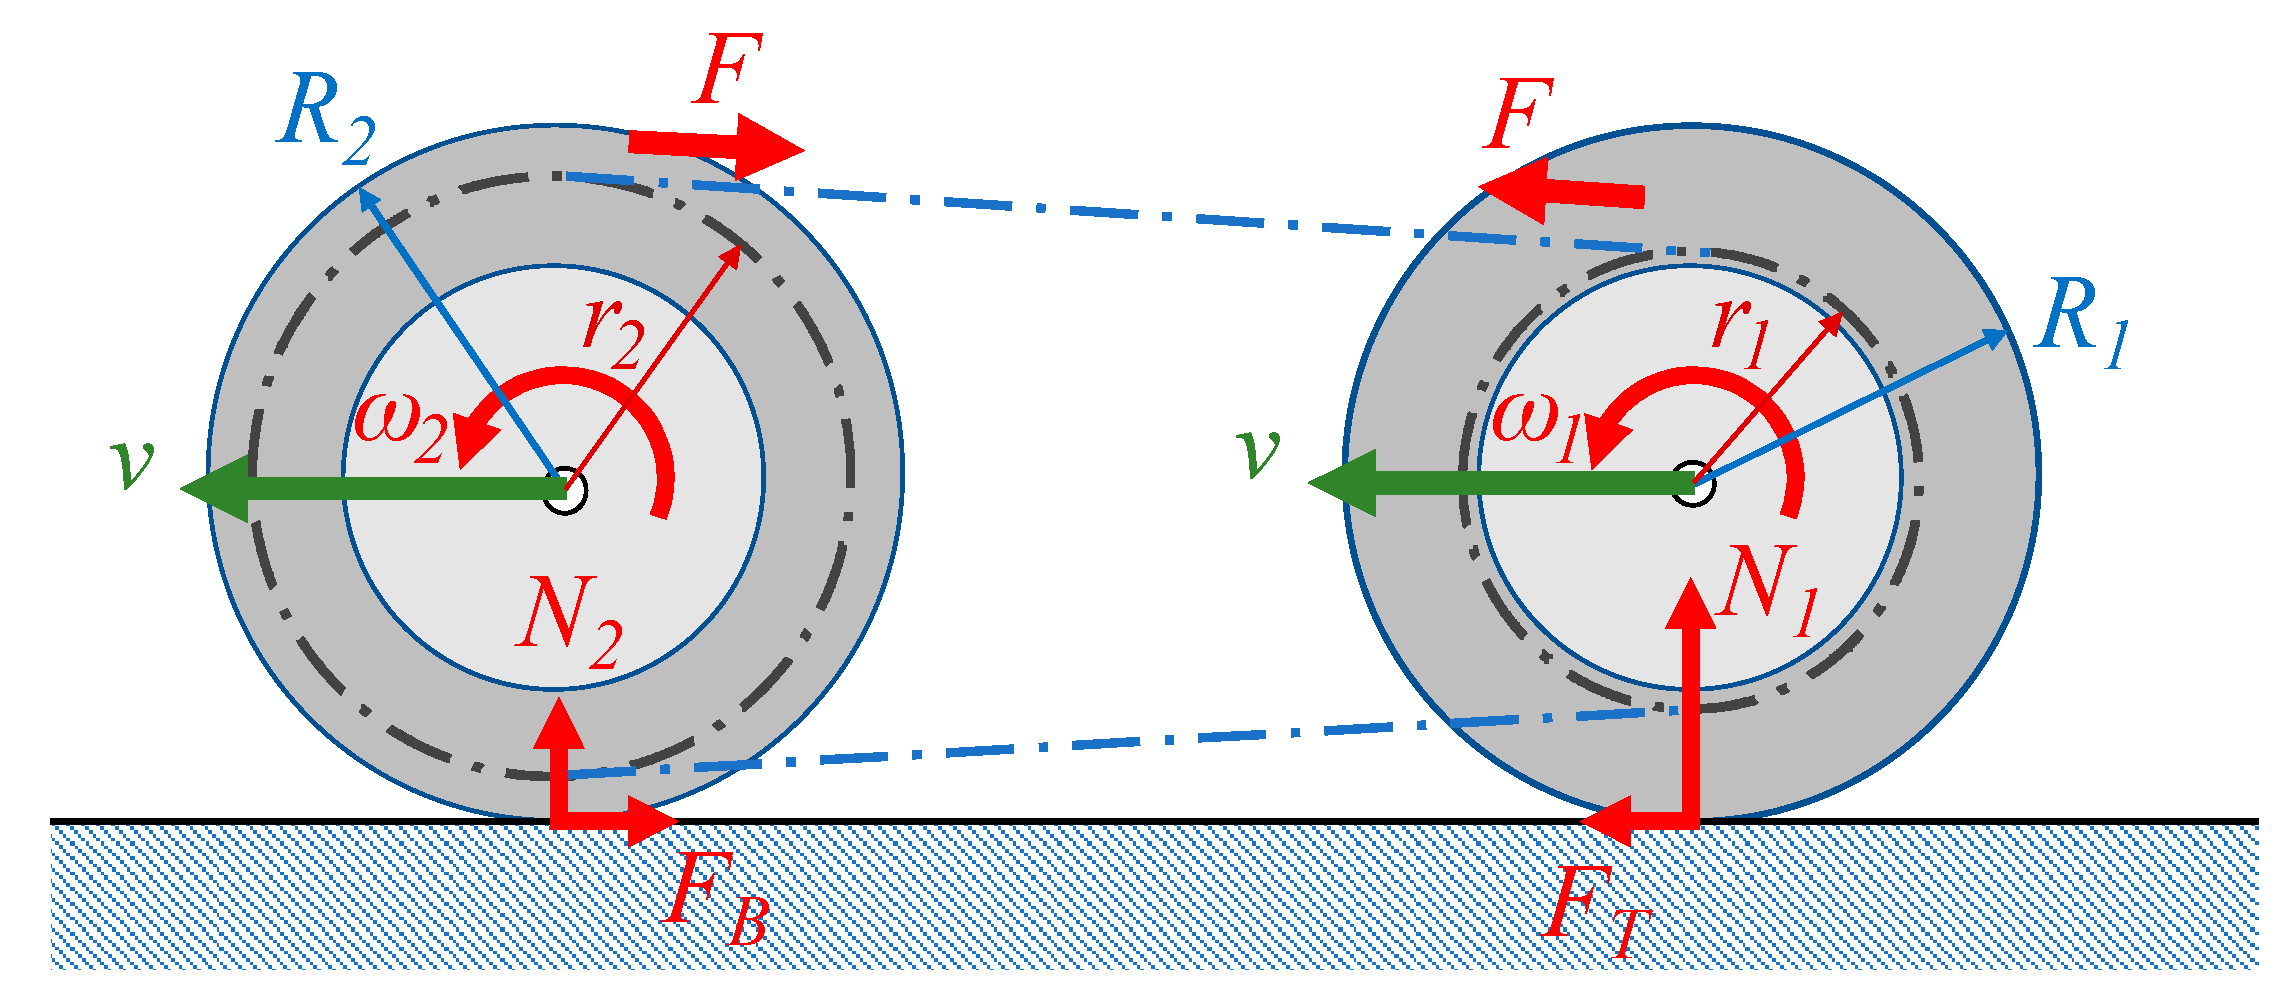
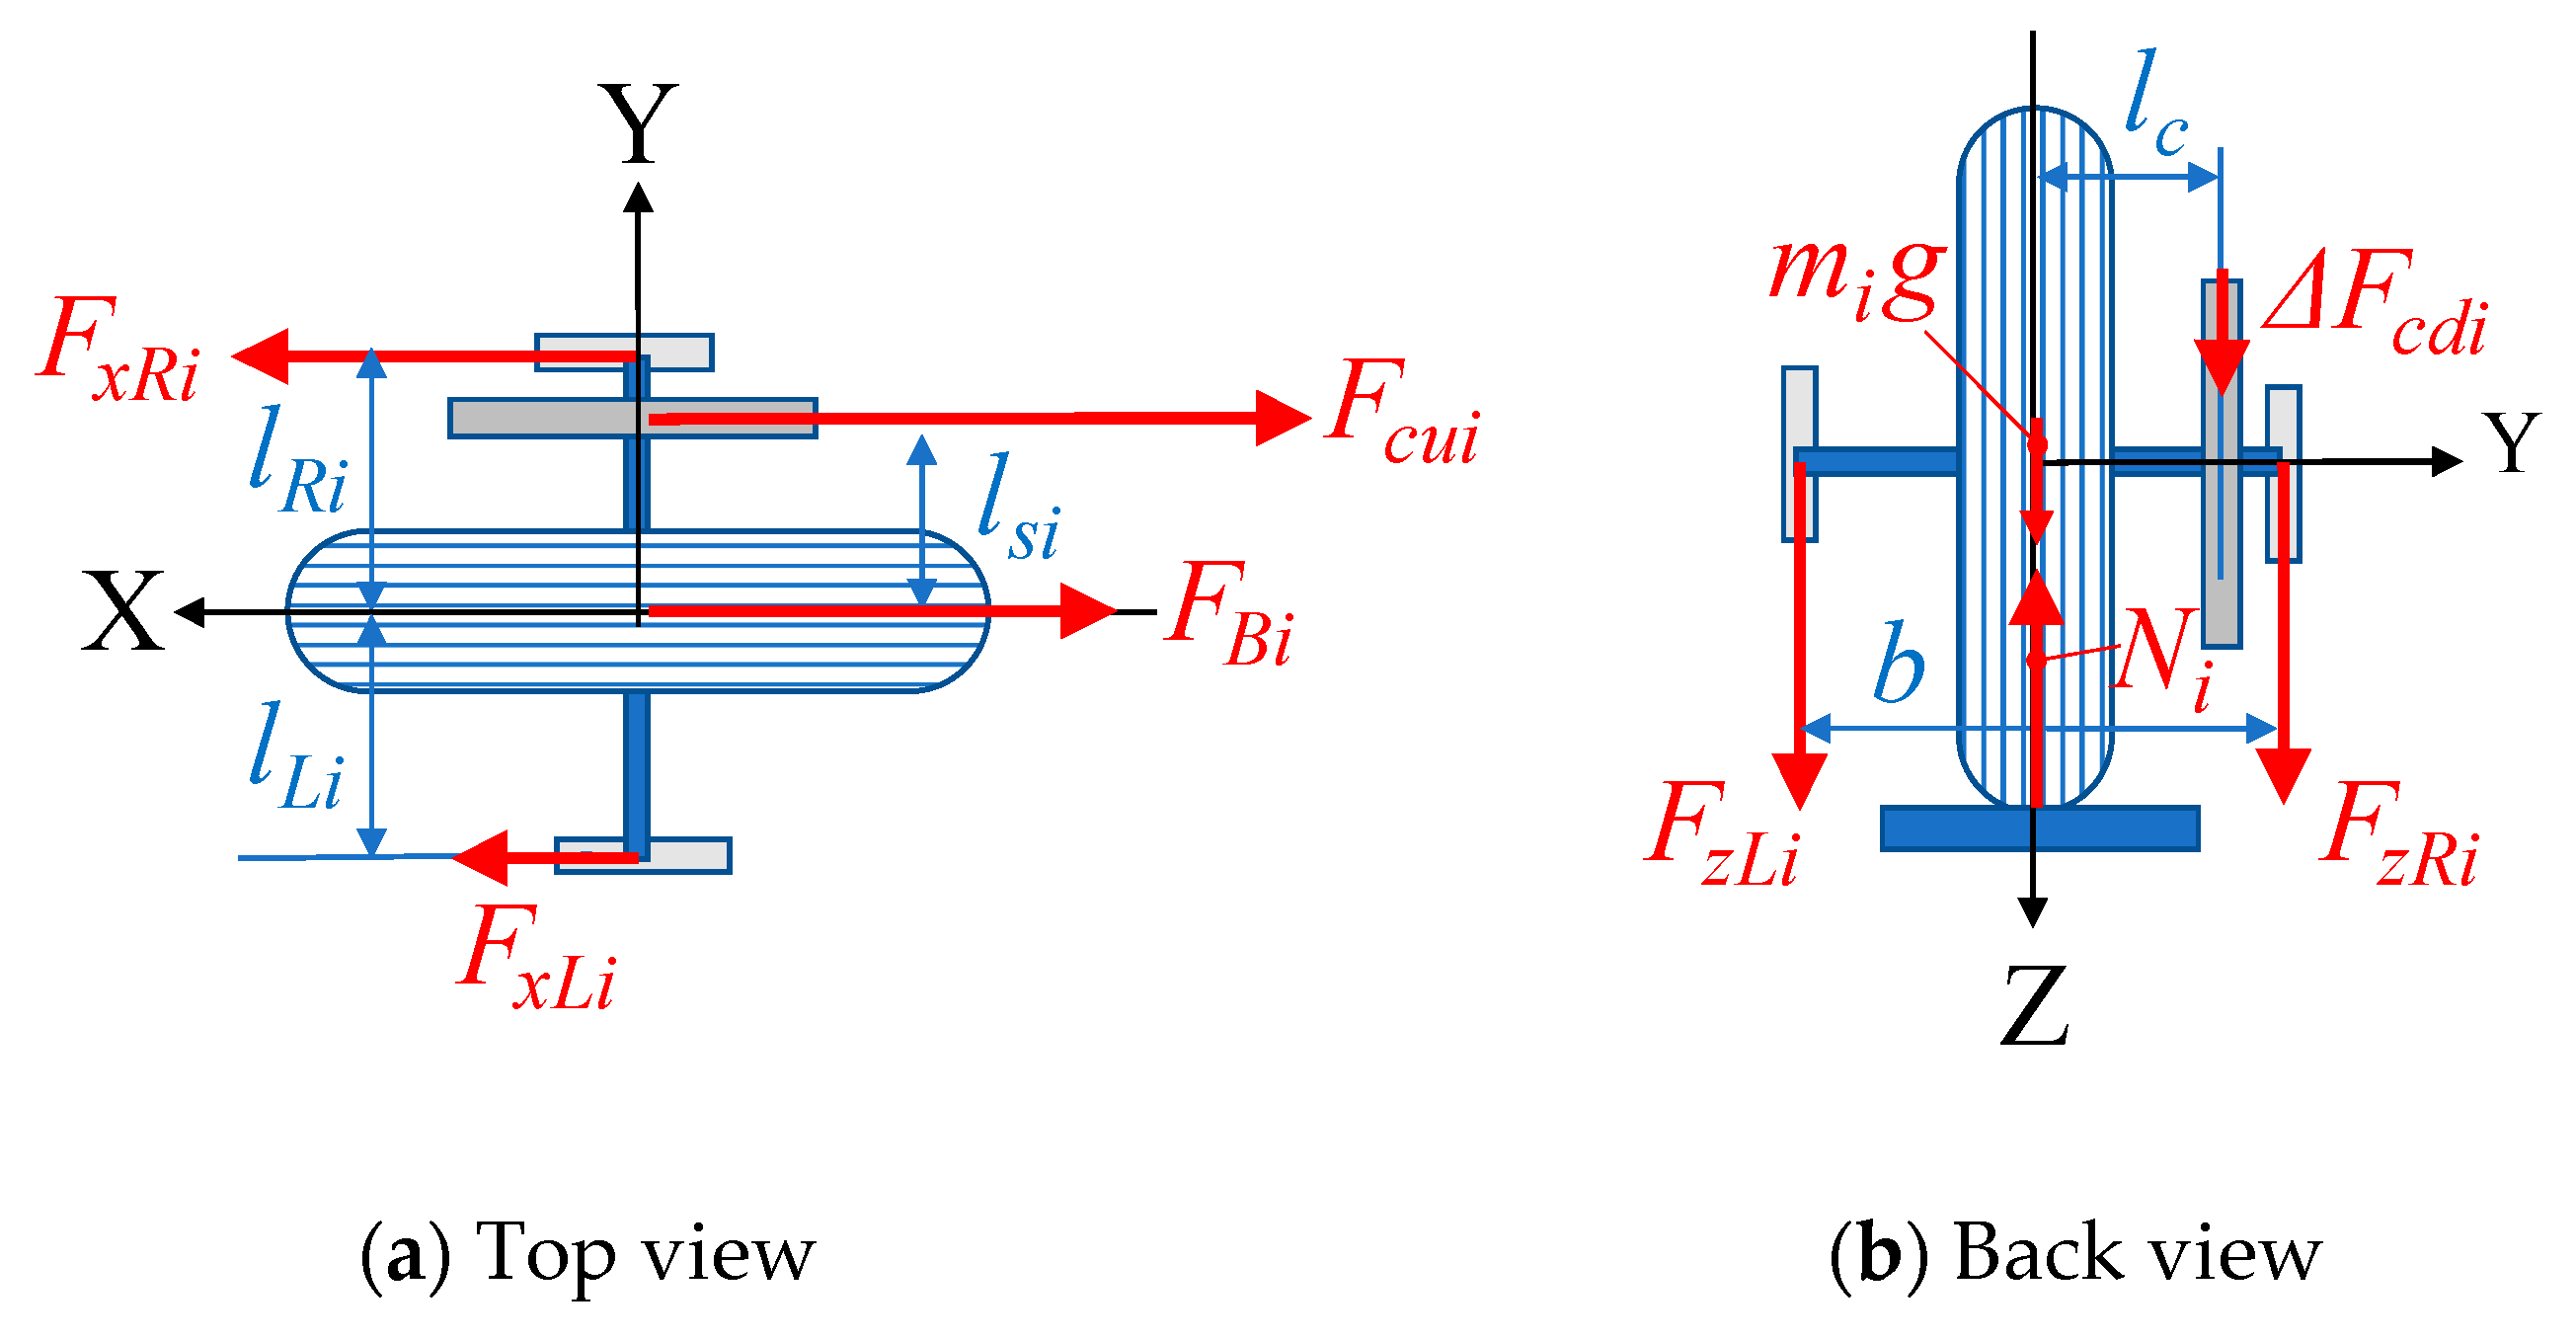
2.1. Identification Algorithm

As the road friction characteristics vary depending on the road position, developing a method for continuously measuring the friction characteristics of ordinary roads is necessary. Normally, devices that measure μ-s characteristics use tire characteristic testers mounted on trailers or buses to gradually apply braking while driving and to grasp the braking force characteristics. However, such a method assumes that the characteristics of the measured road surface are constant during sensing, but the ordinary road surface conditions can change making it necessary to continuously measure these μ-s characteristics. Therefore, in the past, our group has proposed a μ-s characteristic estimation method using the simple Magic Formula (MF) as in Equation (2), which was proposed by Prof. Pacejka of Delft University of Technology [22].
μ = a sin { b tan 1 ( c s ) }
When identification is performed using Equation (2) through limited experimental data such as three points, Equation (2) is regarded as a transcendental function with many convergence values depending on the values of coefficients a, b, and c. However, most of them have shapes that vary from the μ-s characteristics of actual tires. Therefore, in performing this convergence calculation, identification is performed using the entire μ-s characteristic data shown in Figure 1, and the range of coefficients a, b, and c that can be taken by the μ-s characteristic of the actual tire is determined. The region larger than the value to be interpolated is determined as follows, a convergence calculation is performed under this constraint, and the coefficients are determined.
Region of coefficient a: 0.1–2.0
Region of coefficient b: 0.5–3.0
Region of coefficient c: 2.0–40.0
Here, the μ-s characteristics can be identified by determining the coefficients a, b, and c in Equation (2) using the experimental data. Figure 2 shows an example of identification using this method. In Figure 2, the slip ratio is shown as a percentage and the data used are those of s = 3%, 10%, and 17% data, marked with yellow circles in Figure 2. The result of the identification method using these three points is shown by the red line. The experimental results at this time are described by blue lines and the identification results express the characteristics well.

2.2. Verification of the Algorithm

Using the experimental results shown in Figure 1, the result of this identification method is confirmed assuming that three points of data were obtained. Equation (3) is obtained by differentiating Equation (2) with respect to s.
d μ d s = a b c cos { b tan 1 ( c s ) } c 2 s 2 + 1
As the value of Equation (3) equaling 0 represents the peak μ, the slip ratio sP that generates the peak μ can be obtained as in Equation (4).
s P = tan ( π 2 b ) c
Substituting this SP into Equation (2), the peak μ is given by Equation (5).
μ m a x = a sin [ b tan 1 { tan ( π 2 b ) } ]
Another important factor that can be obtained from the μ-s characteristics is the standardized braking stiffness KB. This means a tangential value of s = 0 of the μ-s characteristics, and the value obtained by multiplying this value by the tire load is the braking stiffness. Therefore, by substituting s = 0 into Equation (3), the standardized braking stiffness can be obtained by Equation (6).
K B = μ ( s ) s | s = 0 = a b c
These identification results are confirmed using the experimental results shown in Figure 1. Therefore, Figure 3 shows a comparison between the experimental results and the identification results of the peak μ shown in Equation (5) and the KB shown in Equation (6). These results indicate that peak μ has a correlation coefficient of 0.982 and the KB has a correlation coefficient of 0.949 and is sufficiently estimated.
Next, the value of lock μ, which is emphasized by road engineers, is compared. In the analysis, the estimation result can be obtained by substituting s = 1 in Equation (2). In this study, as shown in Figure 2, because of the identification of three sets of data in the region near the peak μ, the estimation accuracy of the lock μ is expected to deteriorate. Therefore, Figure 4 shows a comparison between the experimental and identification results of lock μ.
From Figure 4, the lock μ obtained from the experiment and that from Equation (2) have strong non-linearity, and the value from Equation (2) is smaller in the low μ region. Therefore, when obtaining the μ-s characteristics widely, it is preferable to include an estimated value of lock μ for identification. Peak μ in these low μ regions occurs at relatively low slip ratios. Past studies show that the reduction in lock μ is relatively large relative to the peak μ that occurs at such low slip ratios. Therefore, we added data on wet roads where the peak μ appears in a region with a low slip ratio, focused on the relationship between the slip ratio and the ratio of lock μ by peak μ, and the obtained results are shown in Figure 5. A logarithmic approximation of this relationship is shown in Figure 5, but since these correlation coefficients are relatively high at about 0.81, the peak μ obtained from the analysis of Equation (2) using the three-set data obtained from the experiment is used to estimate lock μ [19]. Therefore, the identification method using Equation (2) with three points that has been performed so far is modified and a new identification method of Equation (2) is performed using four points including the obtained lock μ. Identification is performed using such an algorithm and Figure 6 shows the peak μ and lock μ values obtained by this modified identification method compared with the results in Figure 1. Generally, in μ-s characteristics measurement, to avoid uneven tire wear, measurement up to locking is not performed. Therefore, the μ-s characteristics in Figure 1 do not show up to a slip ratio of 1. We must use an estimate of the experimental lock μ using the trend from the peak μ to the maximum measured slip ratio. From these results, the correlation coefficients in both figures show high values (0.961 and 0.819) and the μ-s characteristics are well expressed using the modified method. Using this method, it is possible to modify the entire μ-s characteristic including the lock μ with relatively high expression while identifying the peak μ value well.

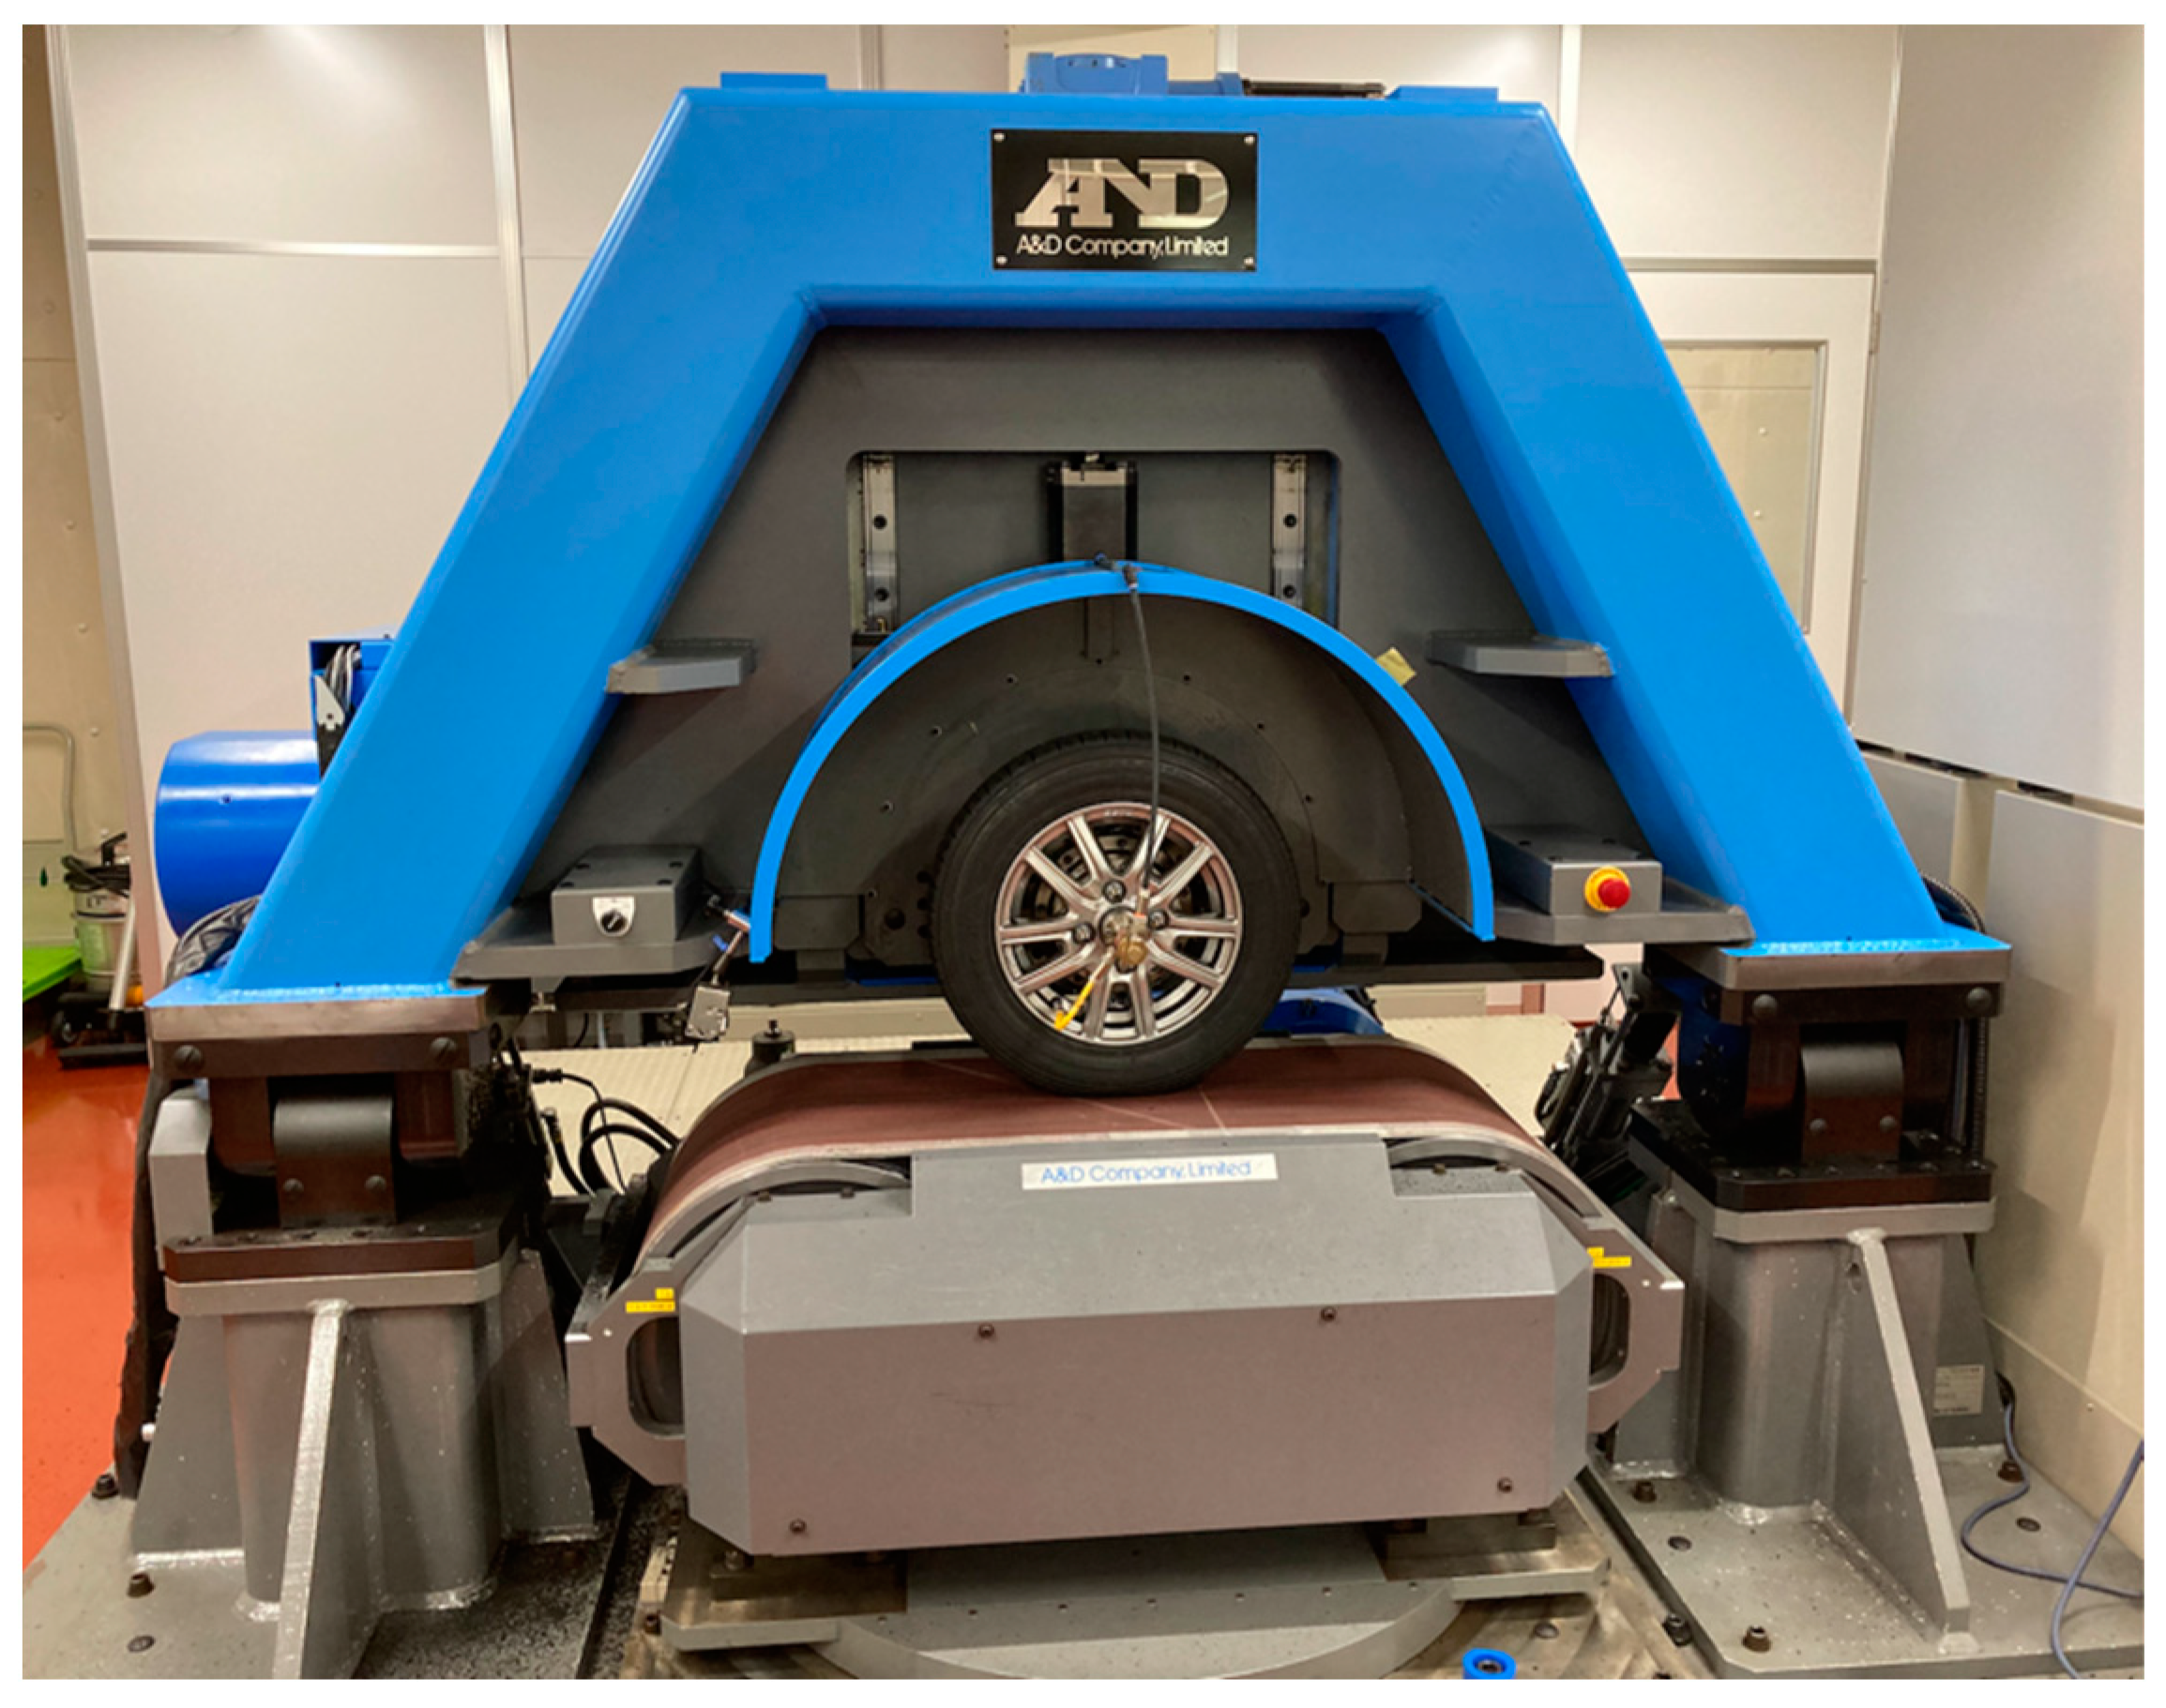
3. Fundamental Design of Measurement Trailer System

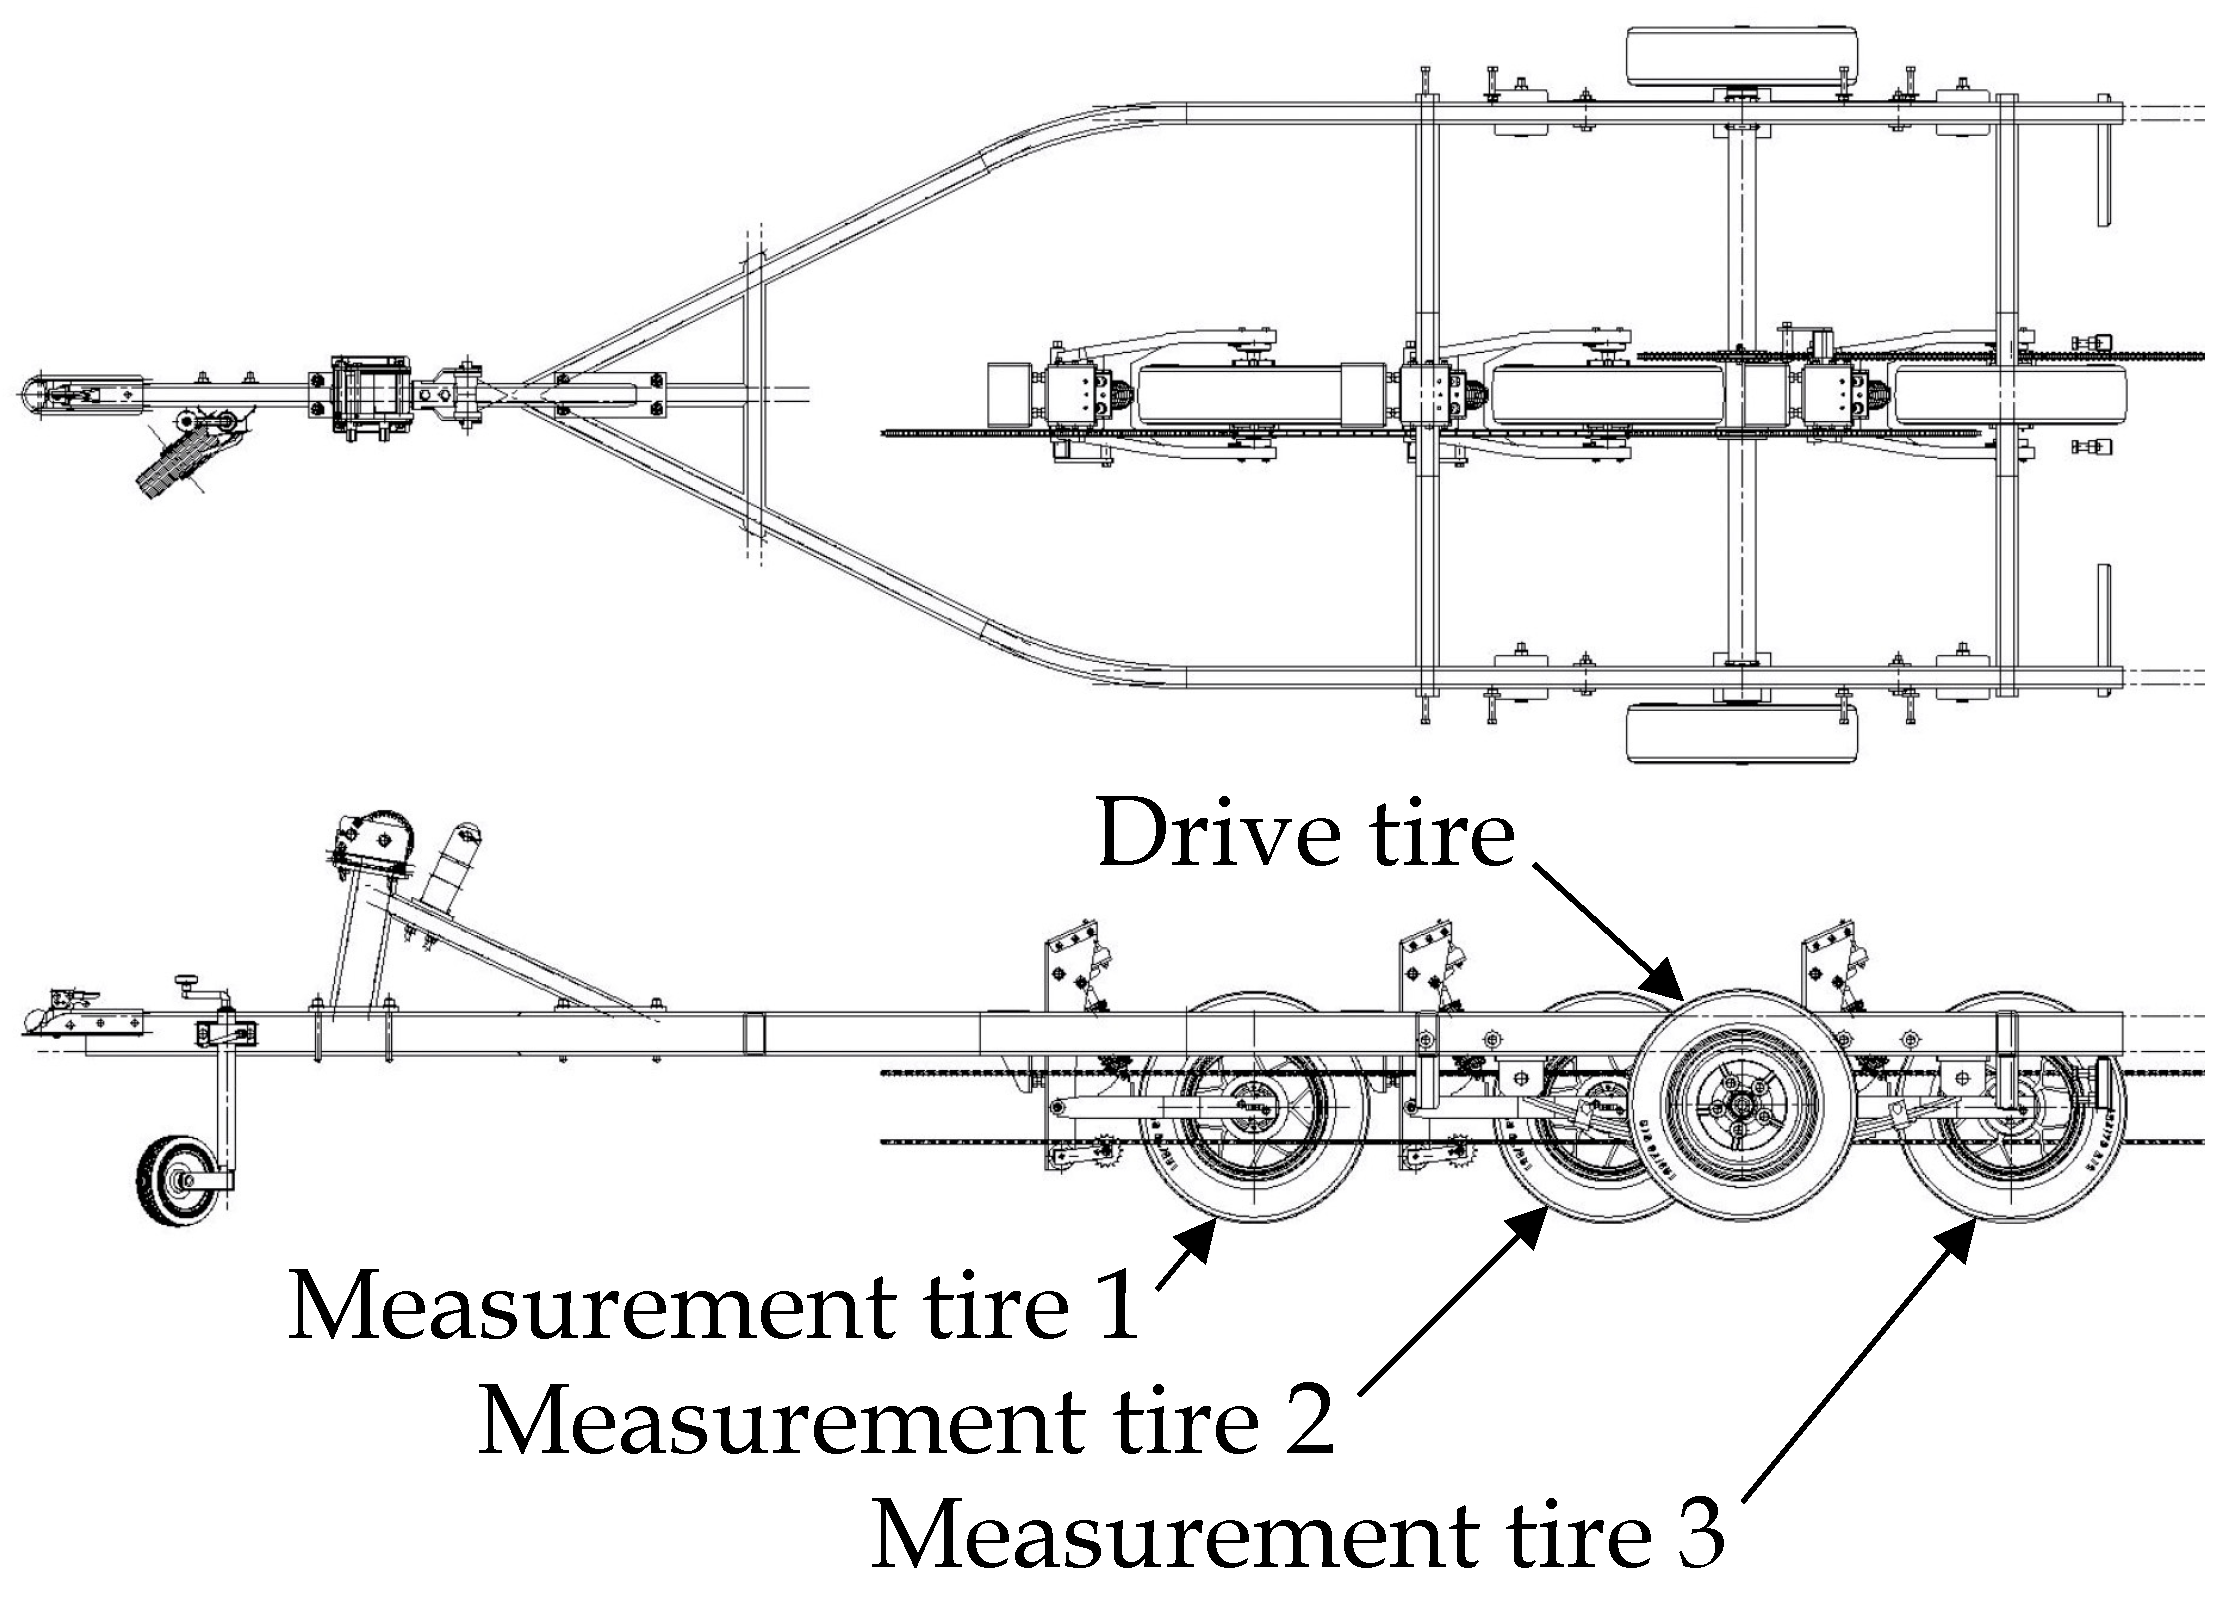
3.1. Overview of Measurement System

To measure the three sets of slip ratio and the road friction coefficient simultaneously, a measurement trailer is designed, as shown in Figure 7. Two-axis load cells are placed on each measurement tire and the angular velocity of each tire is measured by a disk that generates 24 pulses per rotation. The measurement system adopts the structure shown in Figure 7 and Figure 8. As shown in Figure 7, the basic structure uses sprockets with different numbers of teeth to continually reproduce the braking state of the measuring tire. Therefore, the measured tire can be run at a constant slip ratio, and the main tire runs on the drive side (slip ratio negative) with respect to the vehicle speed and the measured tire runs on the braking side (slip ratio positive) with a substantially constant slip ratio. Concurrently, braking force, vertical load, and wheel speed are measured by a load cell and pulse sensor mounted on the axle of the measuring wheel. By preparing three sets of the relationship between the slip ratio and road friction coefficient, the system can obtain the required reference measurement data. Considering trailer stability on highways and trailer size, two measurement tires are placed in front of the trailer tires and one tire is placed in the rear. Therefore, an approximate design is shown in Figure 8.
Here, determining the type of measurement tires as well as the setting of the load and inner pressure of the tires is important. Especially for measurement on an ordinary road in Japan, it is necessary to design according to the standard of a trailer pulled by a passenger car and keep the total weight less than 7.35 kN. Within these conditions, determining measurement tires for adopting narrow and small diameter measuring tires is necessary.

3.2. Determination of Measurement Tire

As there are a total of five tires on the trailer including measurement tires, the weight of the entire trailer is determined. It is not possible to take a large load per measurement tire. Further, in general, the friction coefficient of rubber depends on the surface pressure, and the smaller this value is, the larger the friction coefficient is. As t the μ-s characteristics measured by this system and the characteristics of tires installed on general vehicles do not differ significantly, therefore, for determining the measurement tire, it is necessary to introduce a tire with a small diameter, narrow width, and small standard set load. As the coefficient of friction of a tire depends on the contact pressure, and since we cannot manufacture a new tire, we need to select the smallest commercially available tire that fits our research in terms of dimensions. Finally, we adopt 125R12-62S, which satisfies these requirements, including the possibility of supplying measurement tires in the future.

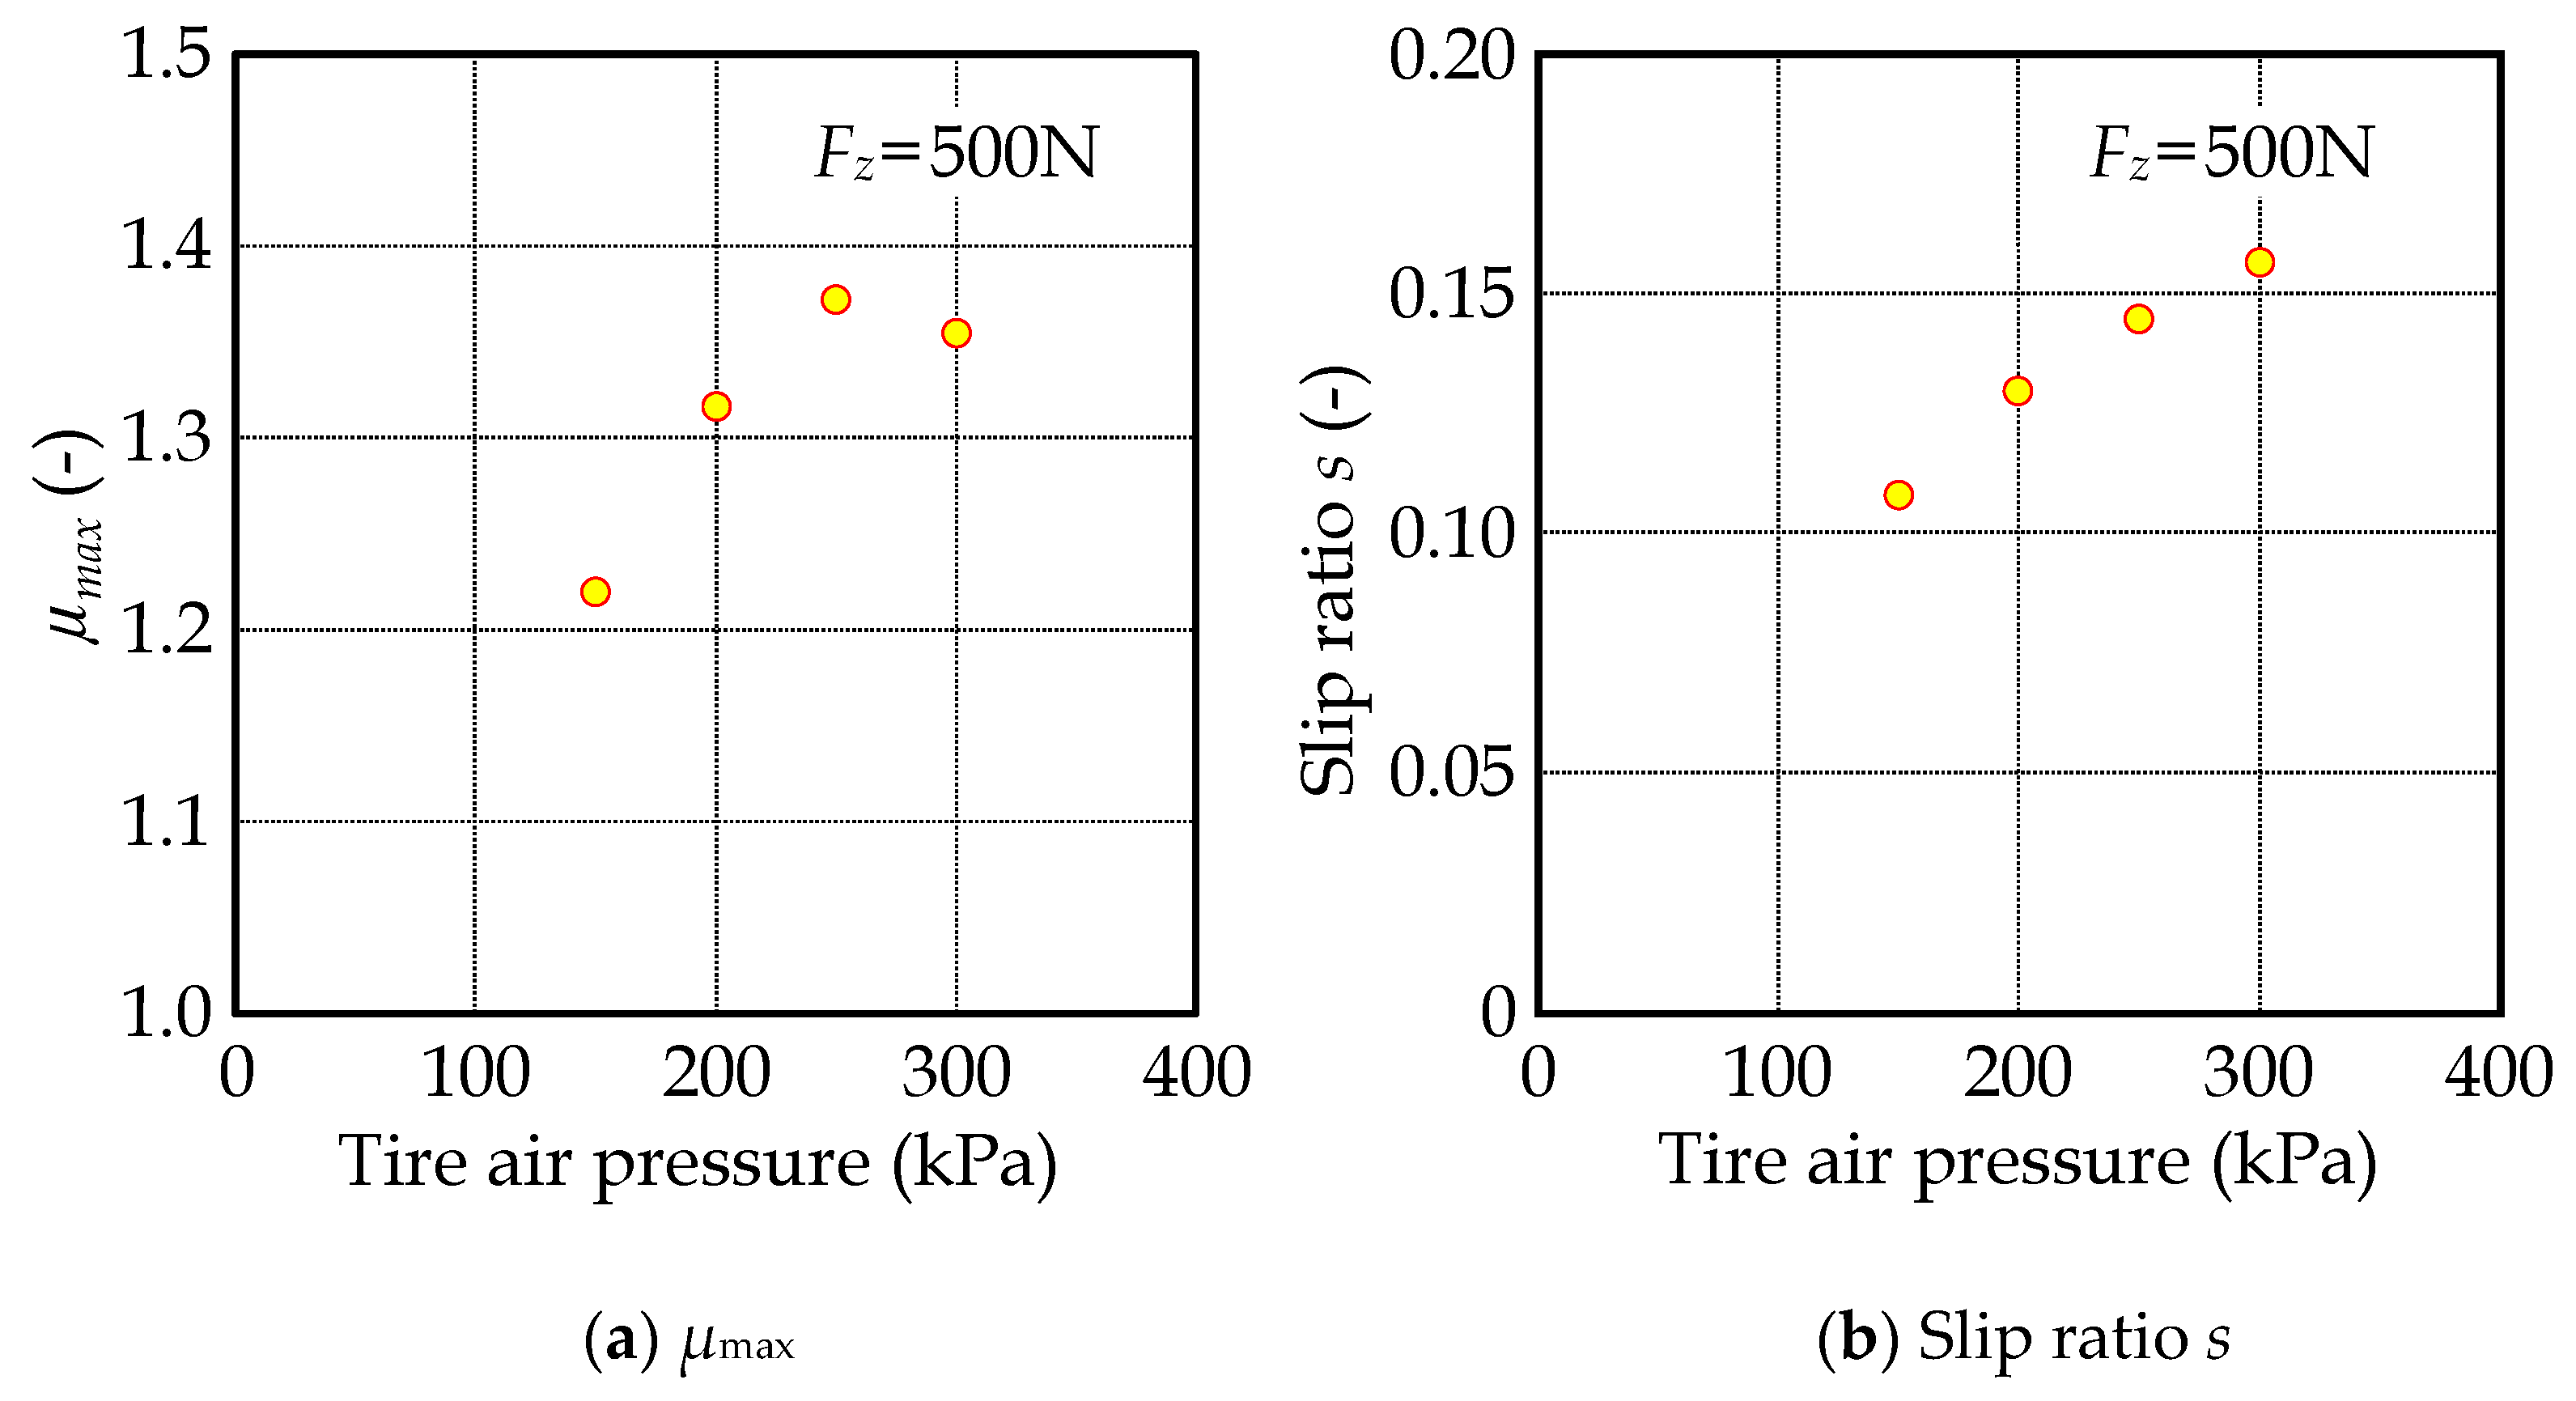
3.3. Determination of tire Setting Conditions

Now the tire has been determined, it is necessary to determine the load and internal pressure as factors that change the tire characteristics. An appropriate measurement condition is determined using the tire characteristic tester shown in Figure 9. The measured road surface uses Safety Walk ™, which is a pseudo-paved surface and has a slightly higher friction coefficient than ordinary asphalt pavements.
Considering the load that can be set on the measurement trailer, we determined to set the load condition to five levels (250, 500, 750, 1000, 2000 N). Additionally, considering the internal pressure of the tire, this is set to four levels (150, 200, 250, 300 kPa) and measured by combining these. As an example, Figure 10 shows the results of the friction coefficient when the load changes at an internal pressure of 200 kPa. From Figure 10, on reducing the load, the value of the peak μ increases and that of the slip ratio that generates the peak μ increases. To clarify these relationships, Figure 11 shows the relationship between the change in peak μ with respect to the load and the slip ratio that generates the peak μ with respect to the load. It is necessary to determine the tire load in consideration of these characteristics; however, the load is determined to be 500 N considering the total load of the trailer. Focusing on the peak μ in Figure 10, it shows a larger value than the peak μ of ordinary tires. Therefore, it is necessary to bring this value closer to that of ordinary tires owing to changes in internal pressure.
Next, Figure 12 shows the change in μ-s characteristics with respect to the change in internal pressure when the tire load is 500 N. From Figure 12, the μ-s characteristic change in the internal pressure change is not as large as that from the load change, but the peak μ value increases as the internal pressure increases. Therefore, the change in peak μ with respect to the change in internal pressure and the value of the slip ratio at that time is shown in Figure 13. From Figure 13, as the internal pressure decreases, the value of the peak μ decreases, approaching the characteristics of ordinary tires. However, if the internal pressure is too low, it will lead to uneven wear and heat generation on the tread surface, so it is necessary to suppress it to the ordinary usage conditions of the tire. As a result of these studies, it is decided that an internal pressure of 150 kPa at the load of 500 N is acceptable, and this is set as the setting condition for the experiment.

4. Road Friction-Measurement Experiment

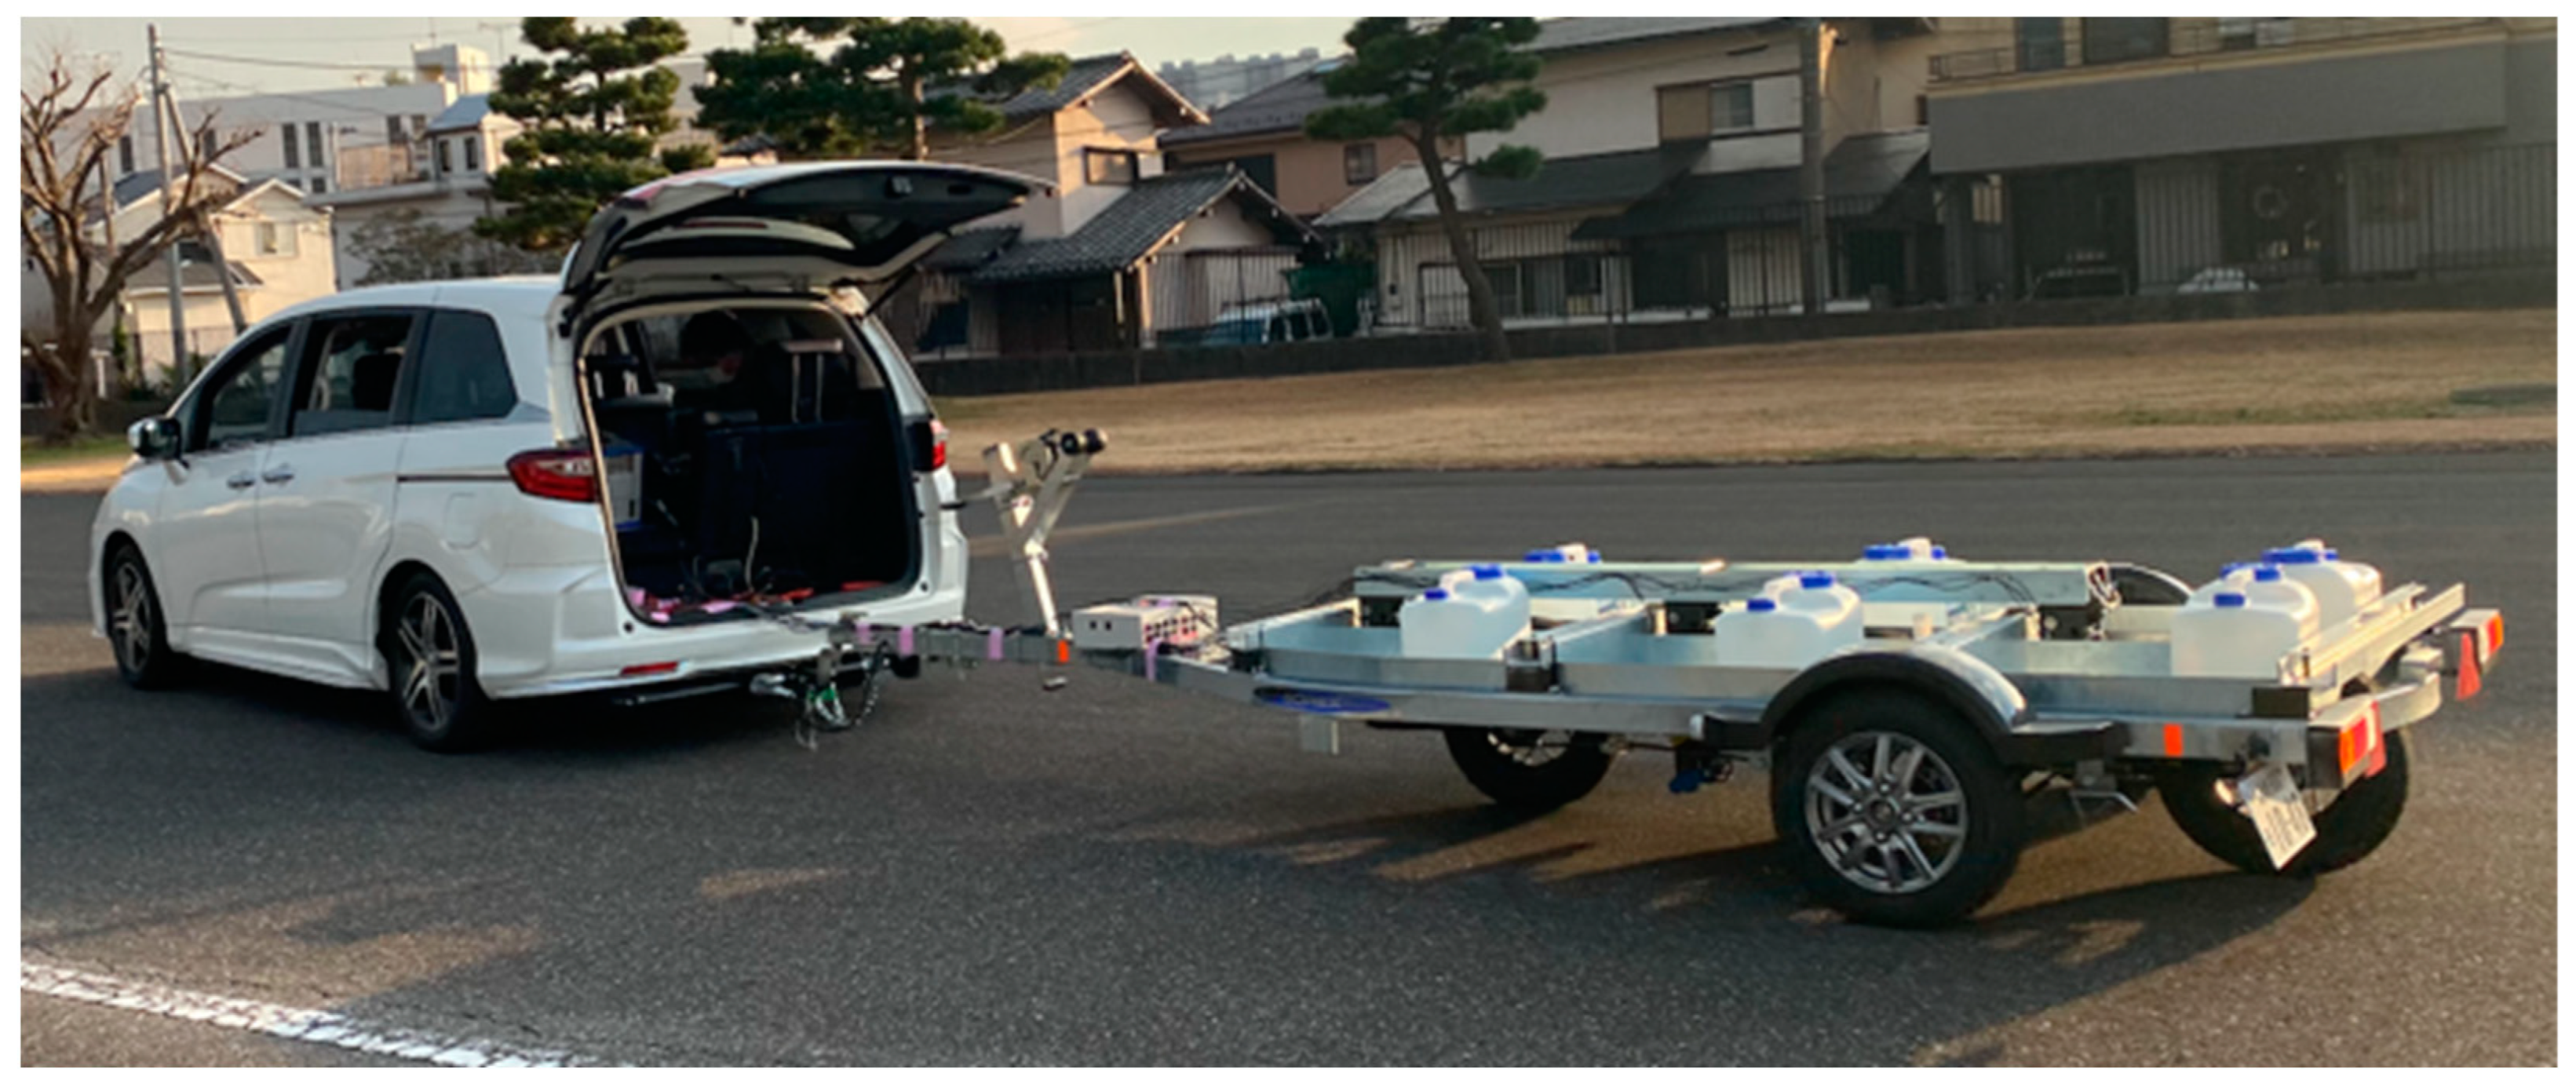
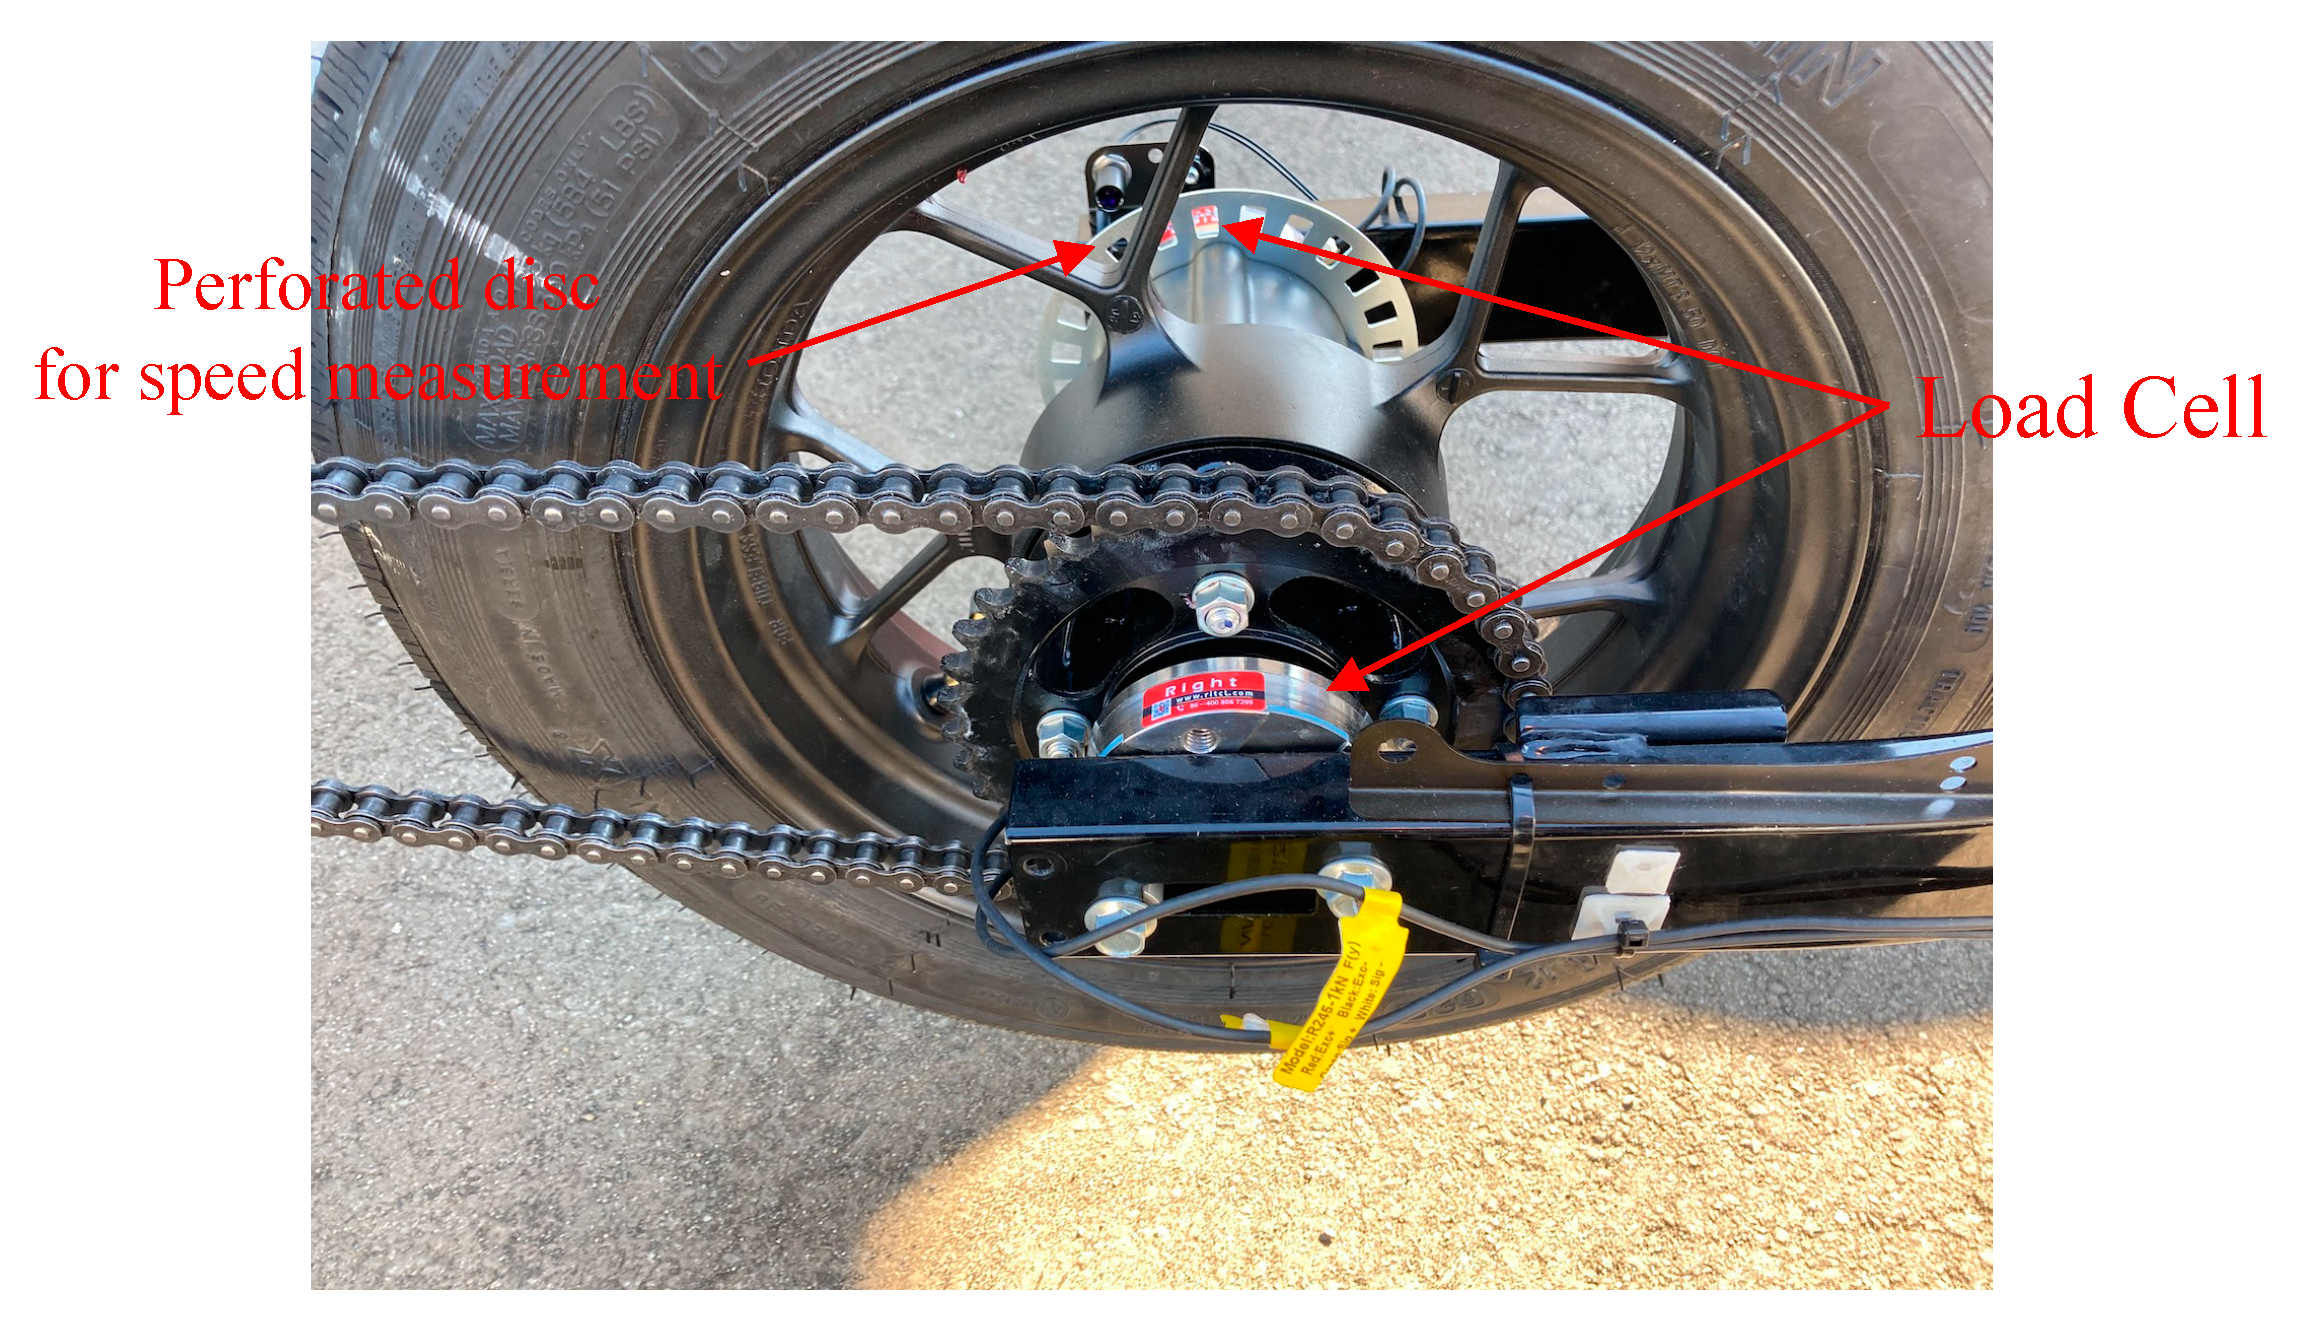
4.1. Constructed Trailer System

A trailer for measurement was constructed using the tire conditions determined in the previous section. The entire view of the constructed trailer is shown in Figure 14 and the circumference of the measurement tire is shown in Figure 15. As shown in Figure 15, the axes of each measurement tire are arranged with two load cells on the left and right sides and the braking force and the load are calculated using these output results and further considering the chain tension. Figure 16 shows the force relationship generated on the first wheel (measurement tire at the front position). In Figure 16, the balance of force and moment in each axial direction is given by Equations (7)–(10).
For the X-axis forces:
F x L i + F x R i = F B i + ( F c u i + F c d i ) cos Δ θ i
Here, Δθi indicates the angle of the chain tension from the horizontal. The symbols of each force in the formula are shown in Figure 16 and the suffix means the tire number.
For the Z-axis forces:
F z L i + F z R i + ( F c u i F c d i ) sin Δ θ i + m i g = N i
For the moment around the X-axis:
l L i F z L i + l R i F z R i + l s i ( F c u i F c d i ) sin Δ θ i = 0
For the moment around the Z-axis:
( l L i F x L i l R i F x R i ) + l c ( F c u i + F c d i ) cos Δ θ i = 0
Using Equations (7)–(10), the braking force and the reaction force are derived as Equations (11) and (12).
The braking force:
F B i = F x L i + F x R i + l L i F x L i l R i F x R i l s i = ( 1 + l L i l s i ) F x L i + ( 1 l R i l s i ) F x R i
The reaction force:
N i = ( 1 + l L i l s i ) F z L i + ( 1 l R i l s i ) F z R i + m i g
Here, mig in the equation is the weight from the load cell to the contact point. Therefore, the friction coefficient is given by Equation (13) from Equations (11) and (12).
μ i = F B i N i
Although the chain mounting position and the chain tension direction are different between the second and third tires, the coefficient of friction of each tire can be obtained in the same process.
The slip ratio of each tire is obtained from the relationship between the free-rolling distance of the tire and the rolling distance when the chain was attached, and as a result, the following relationship is obtained.
Slip ratio of measurement tire 1: 0.954%
Slip ratio of measurement tire 2: 7.057%
Slip ratio of measurement tire 3: 17.23%
Slip ratio of trailer tire: −2.62%
The trailer tire has a negative slip ratio (driving state) because it is driven by the other measurement tires.

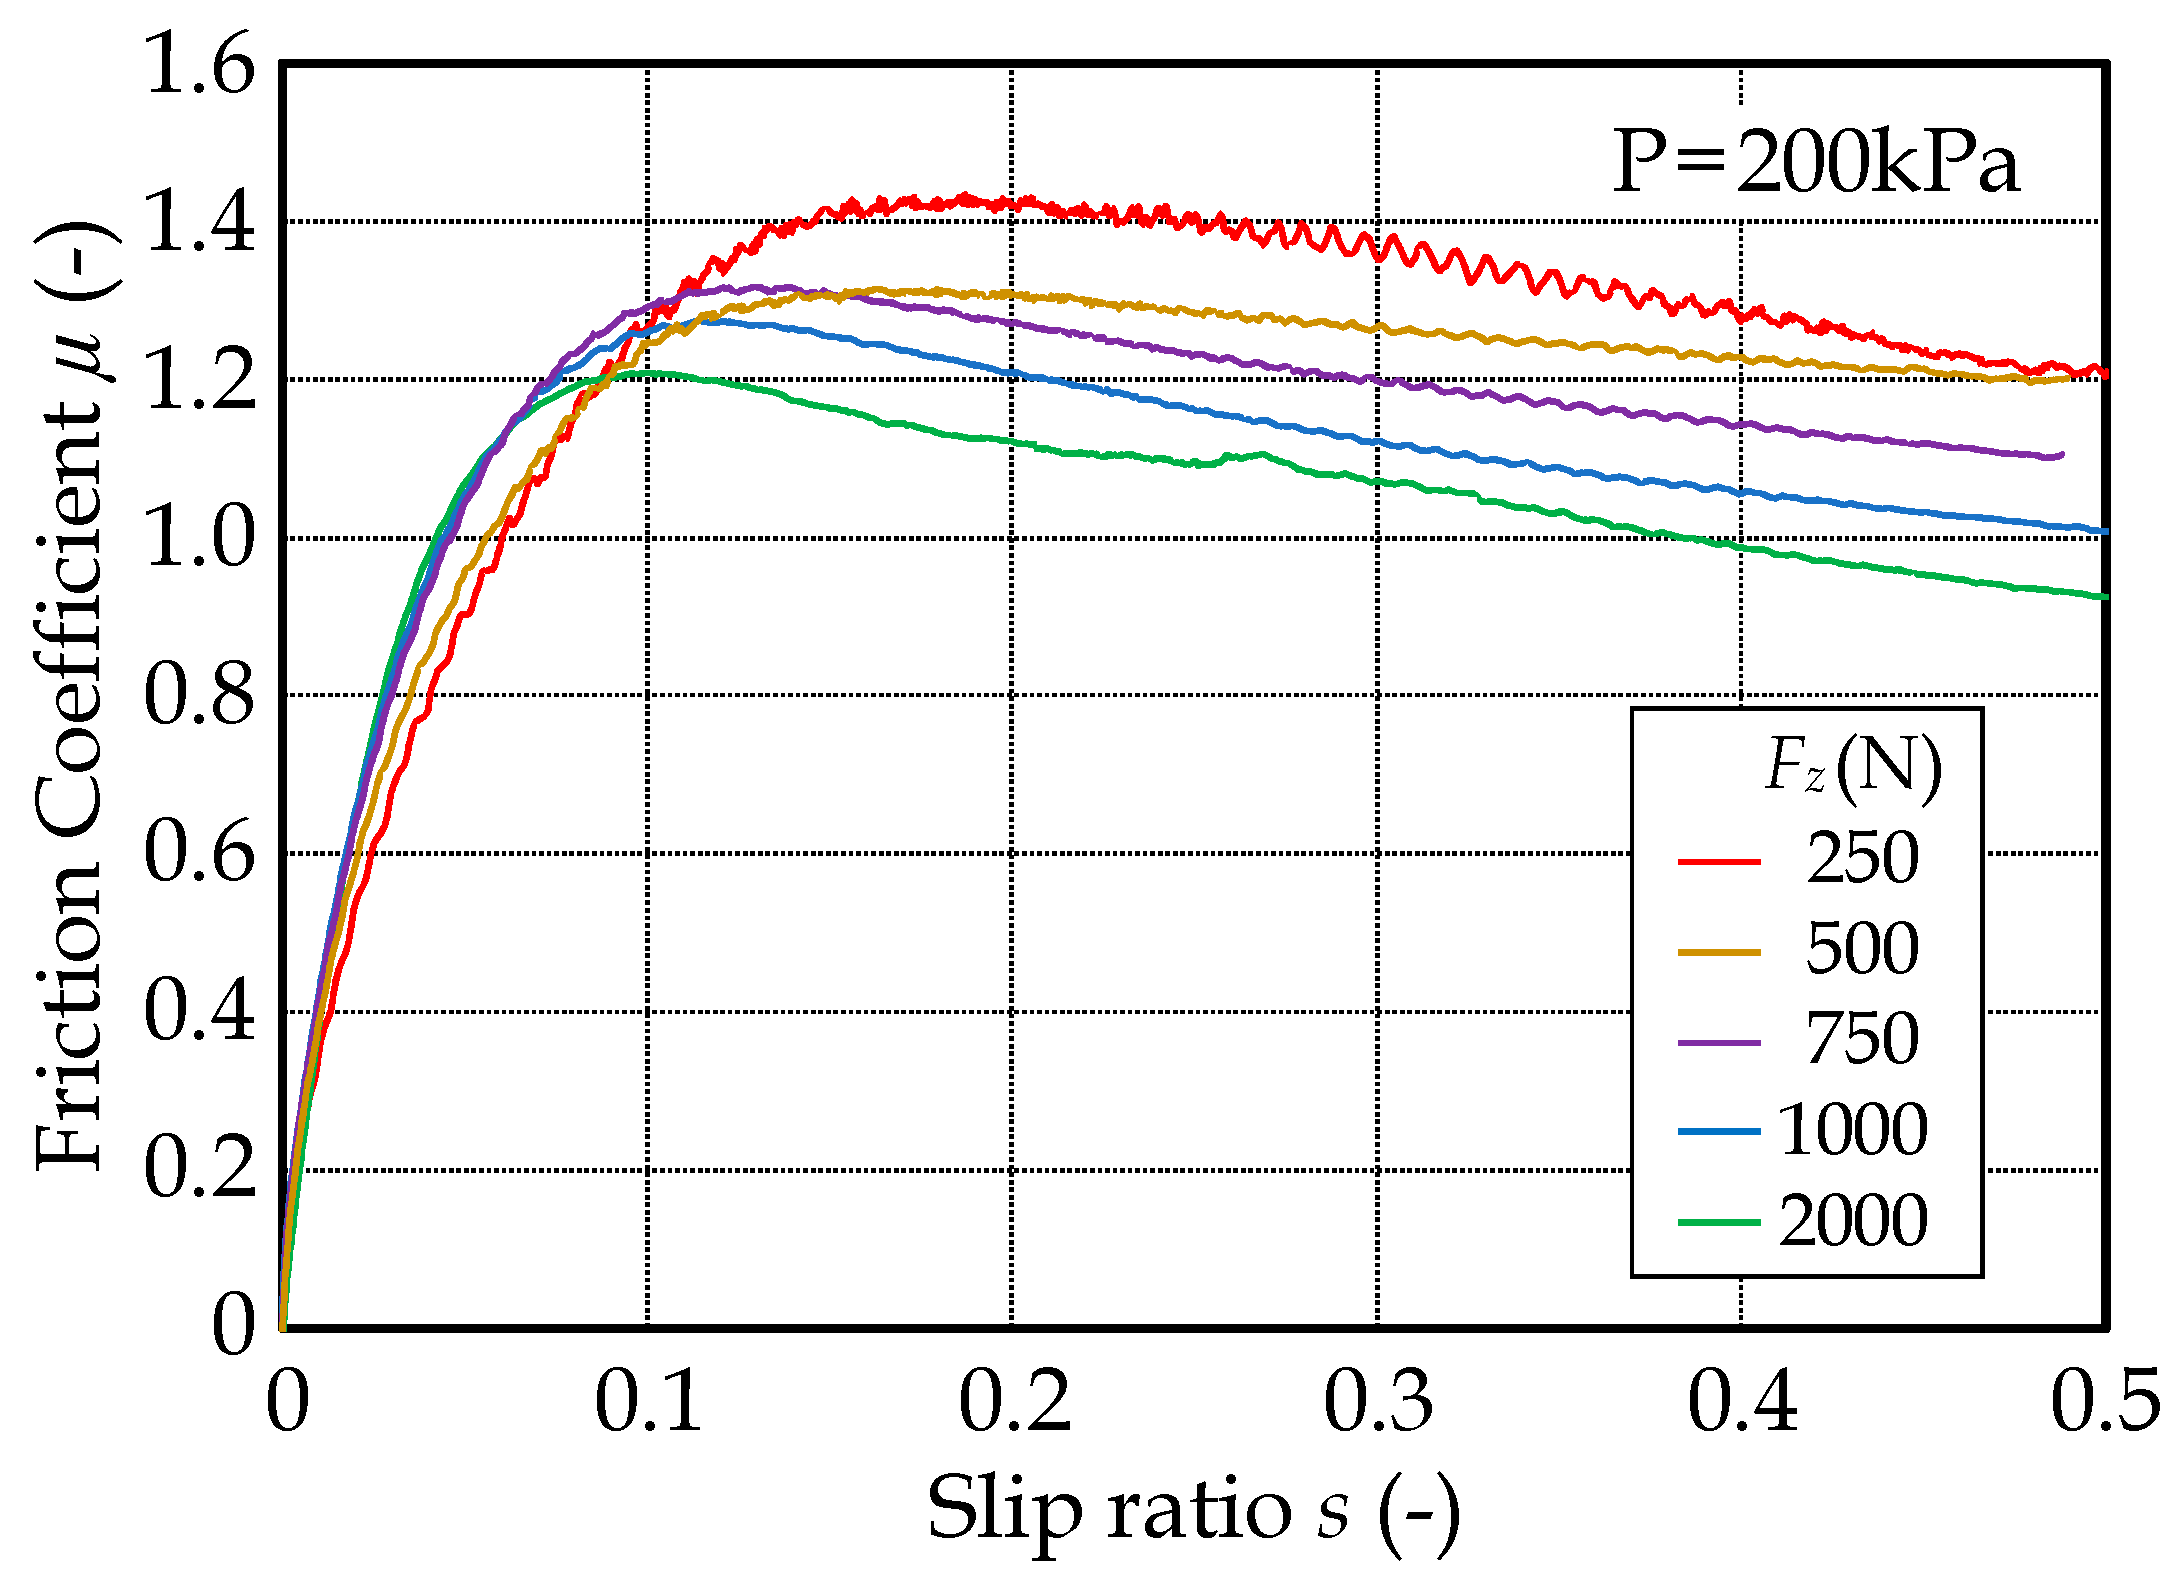
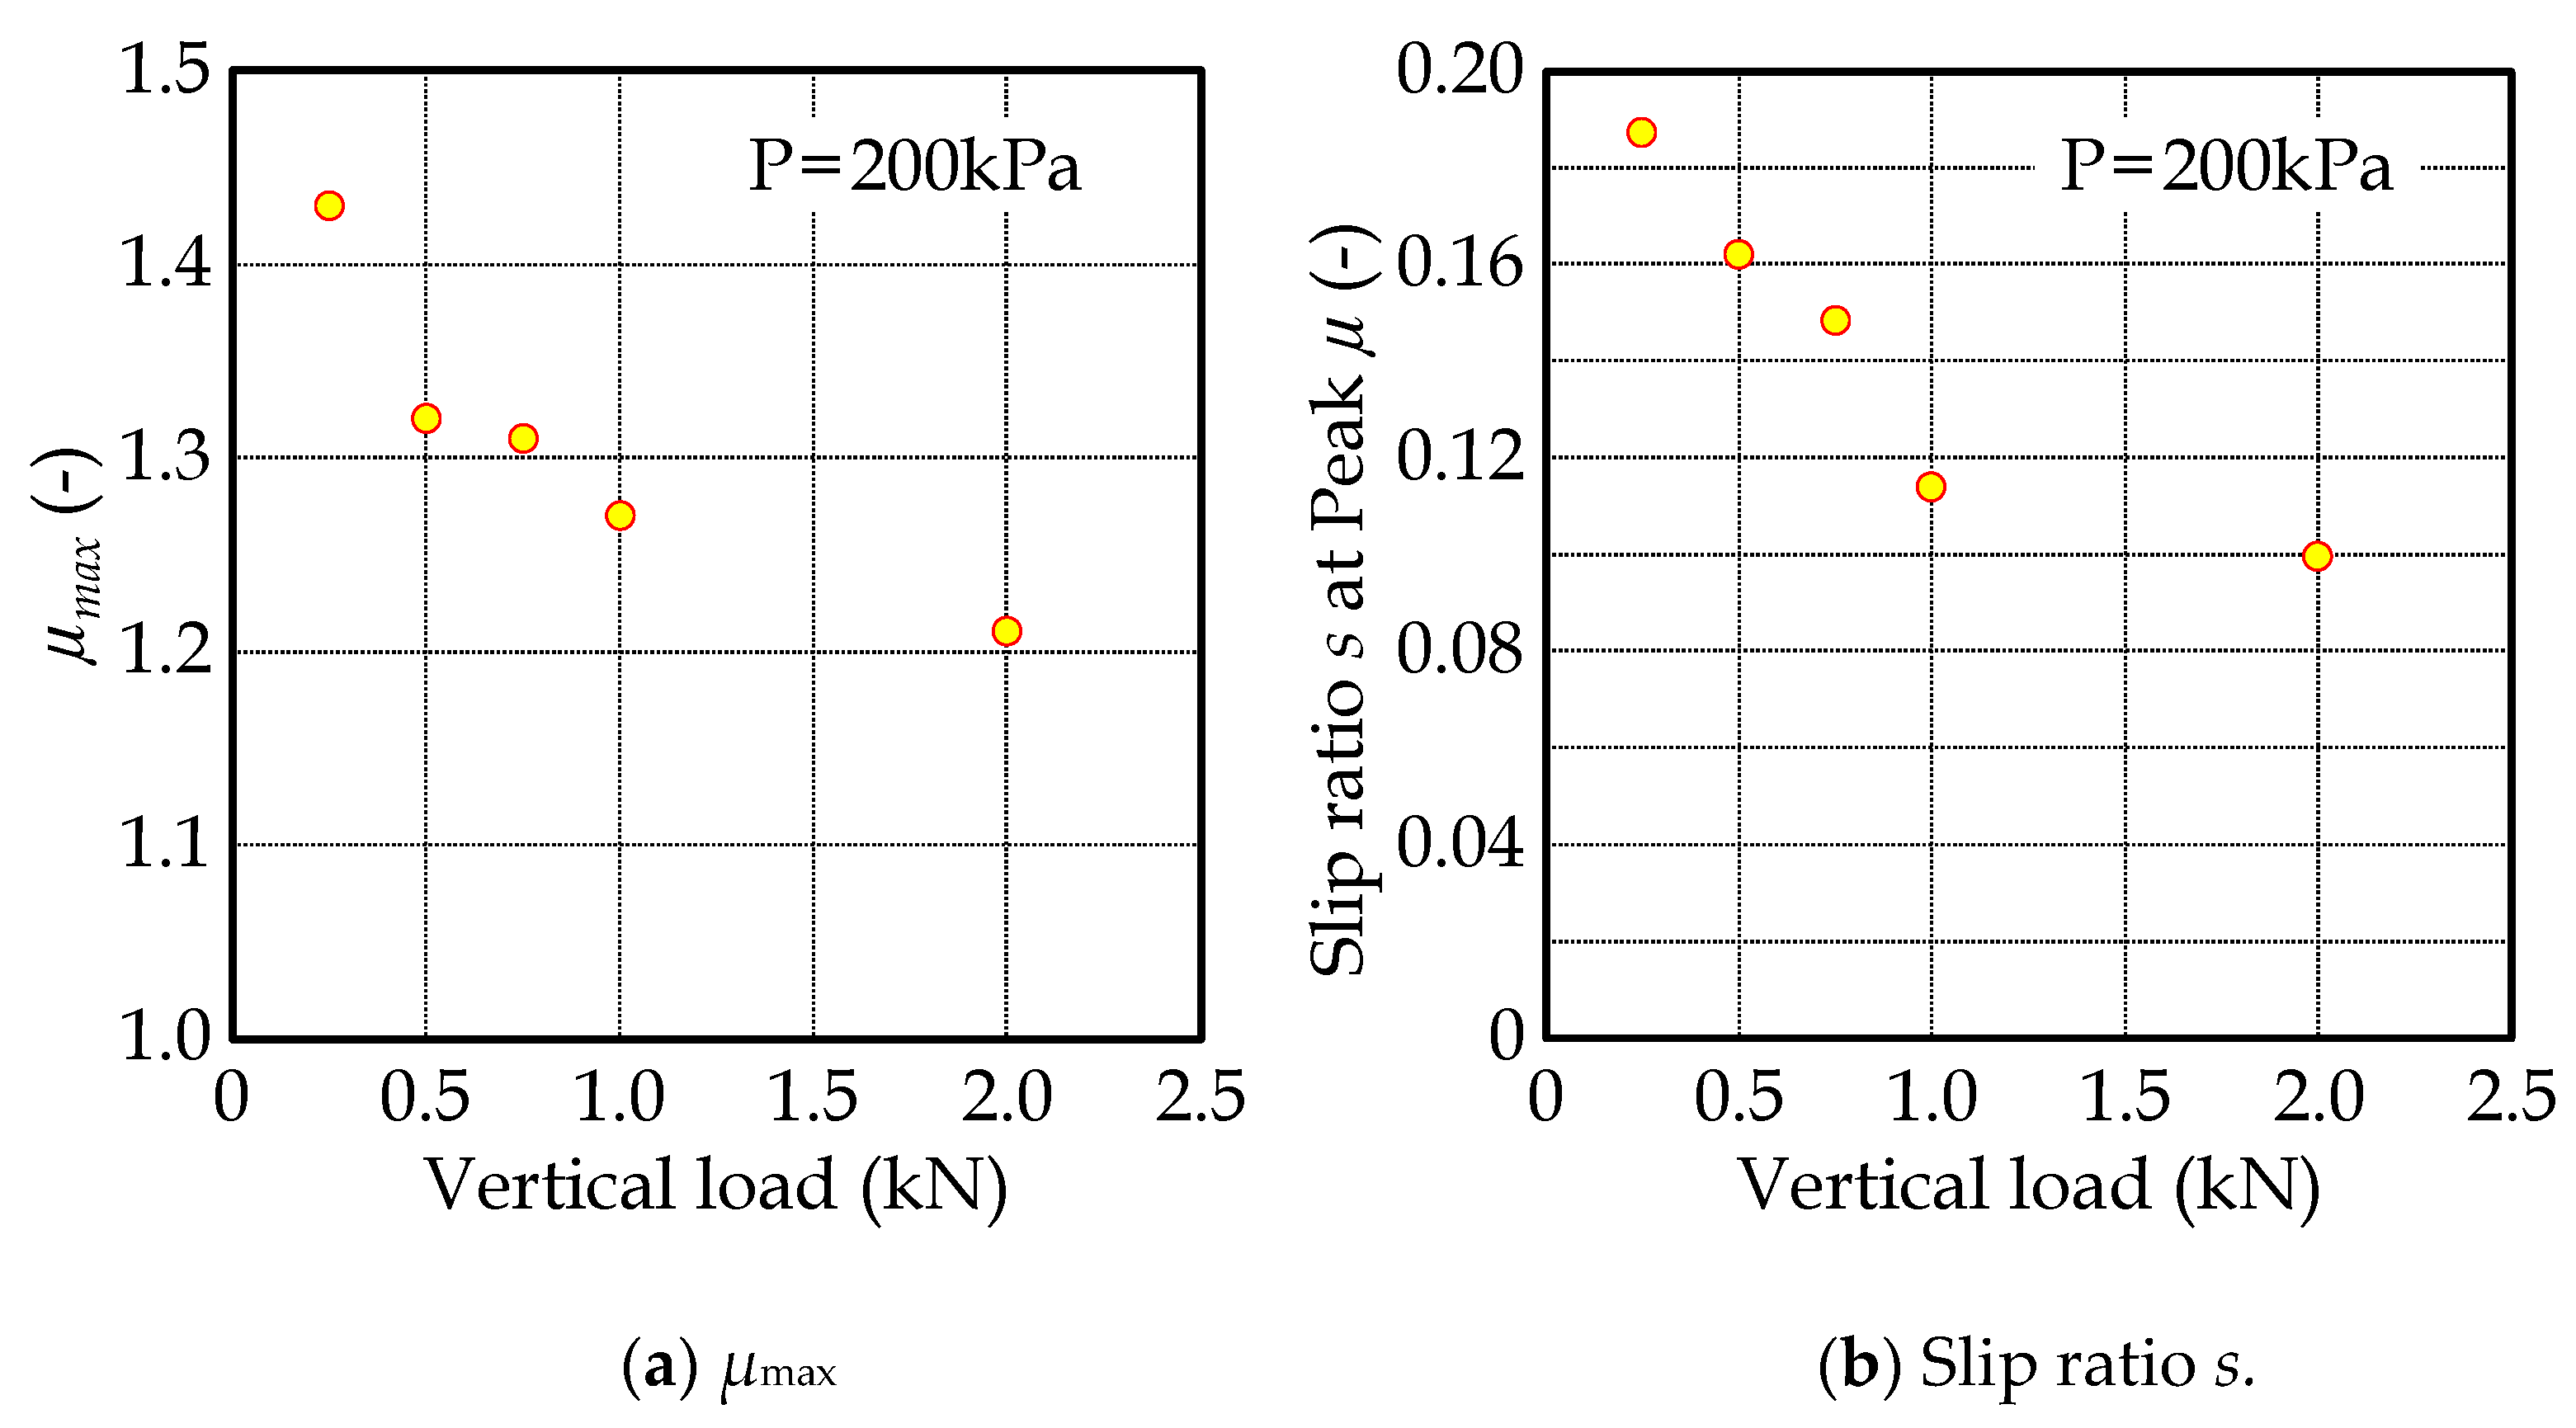
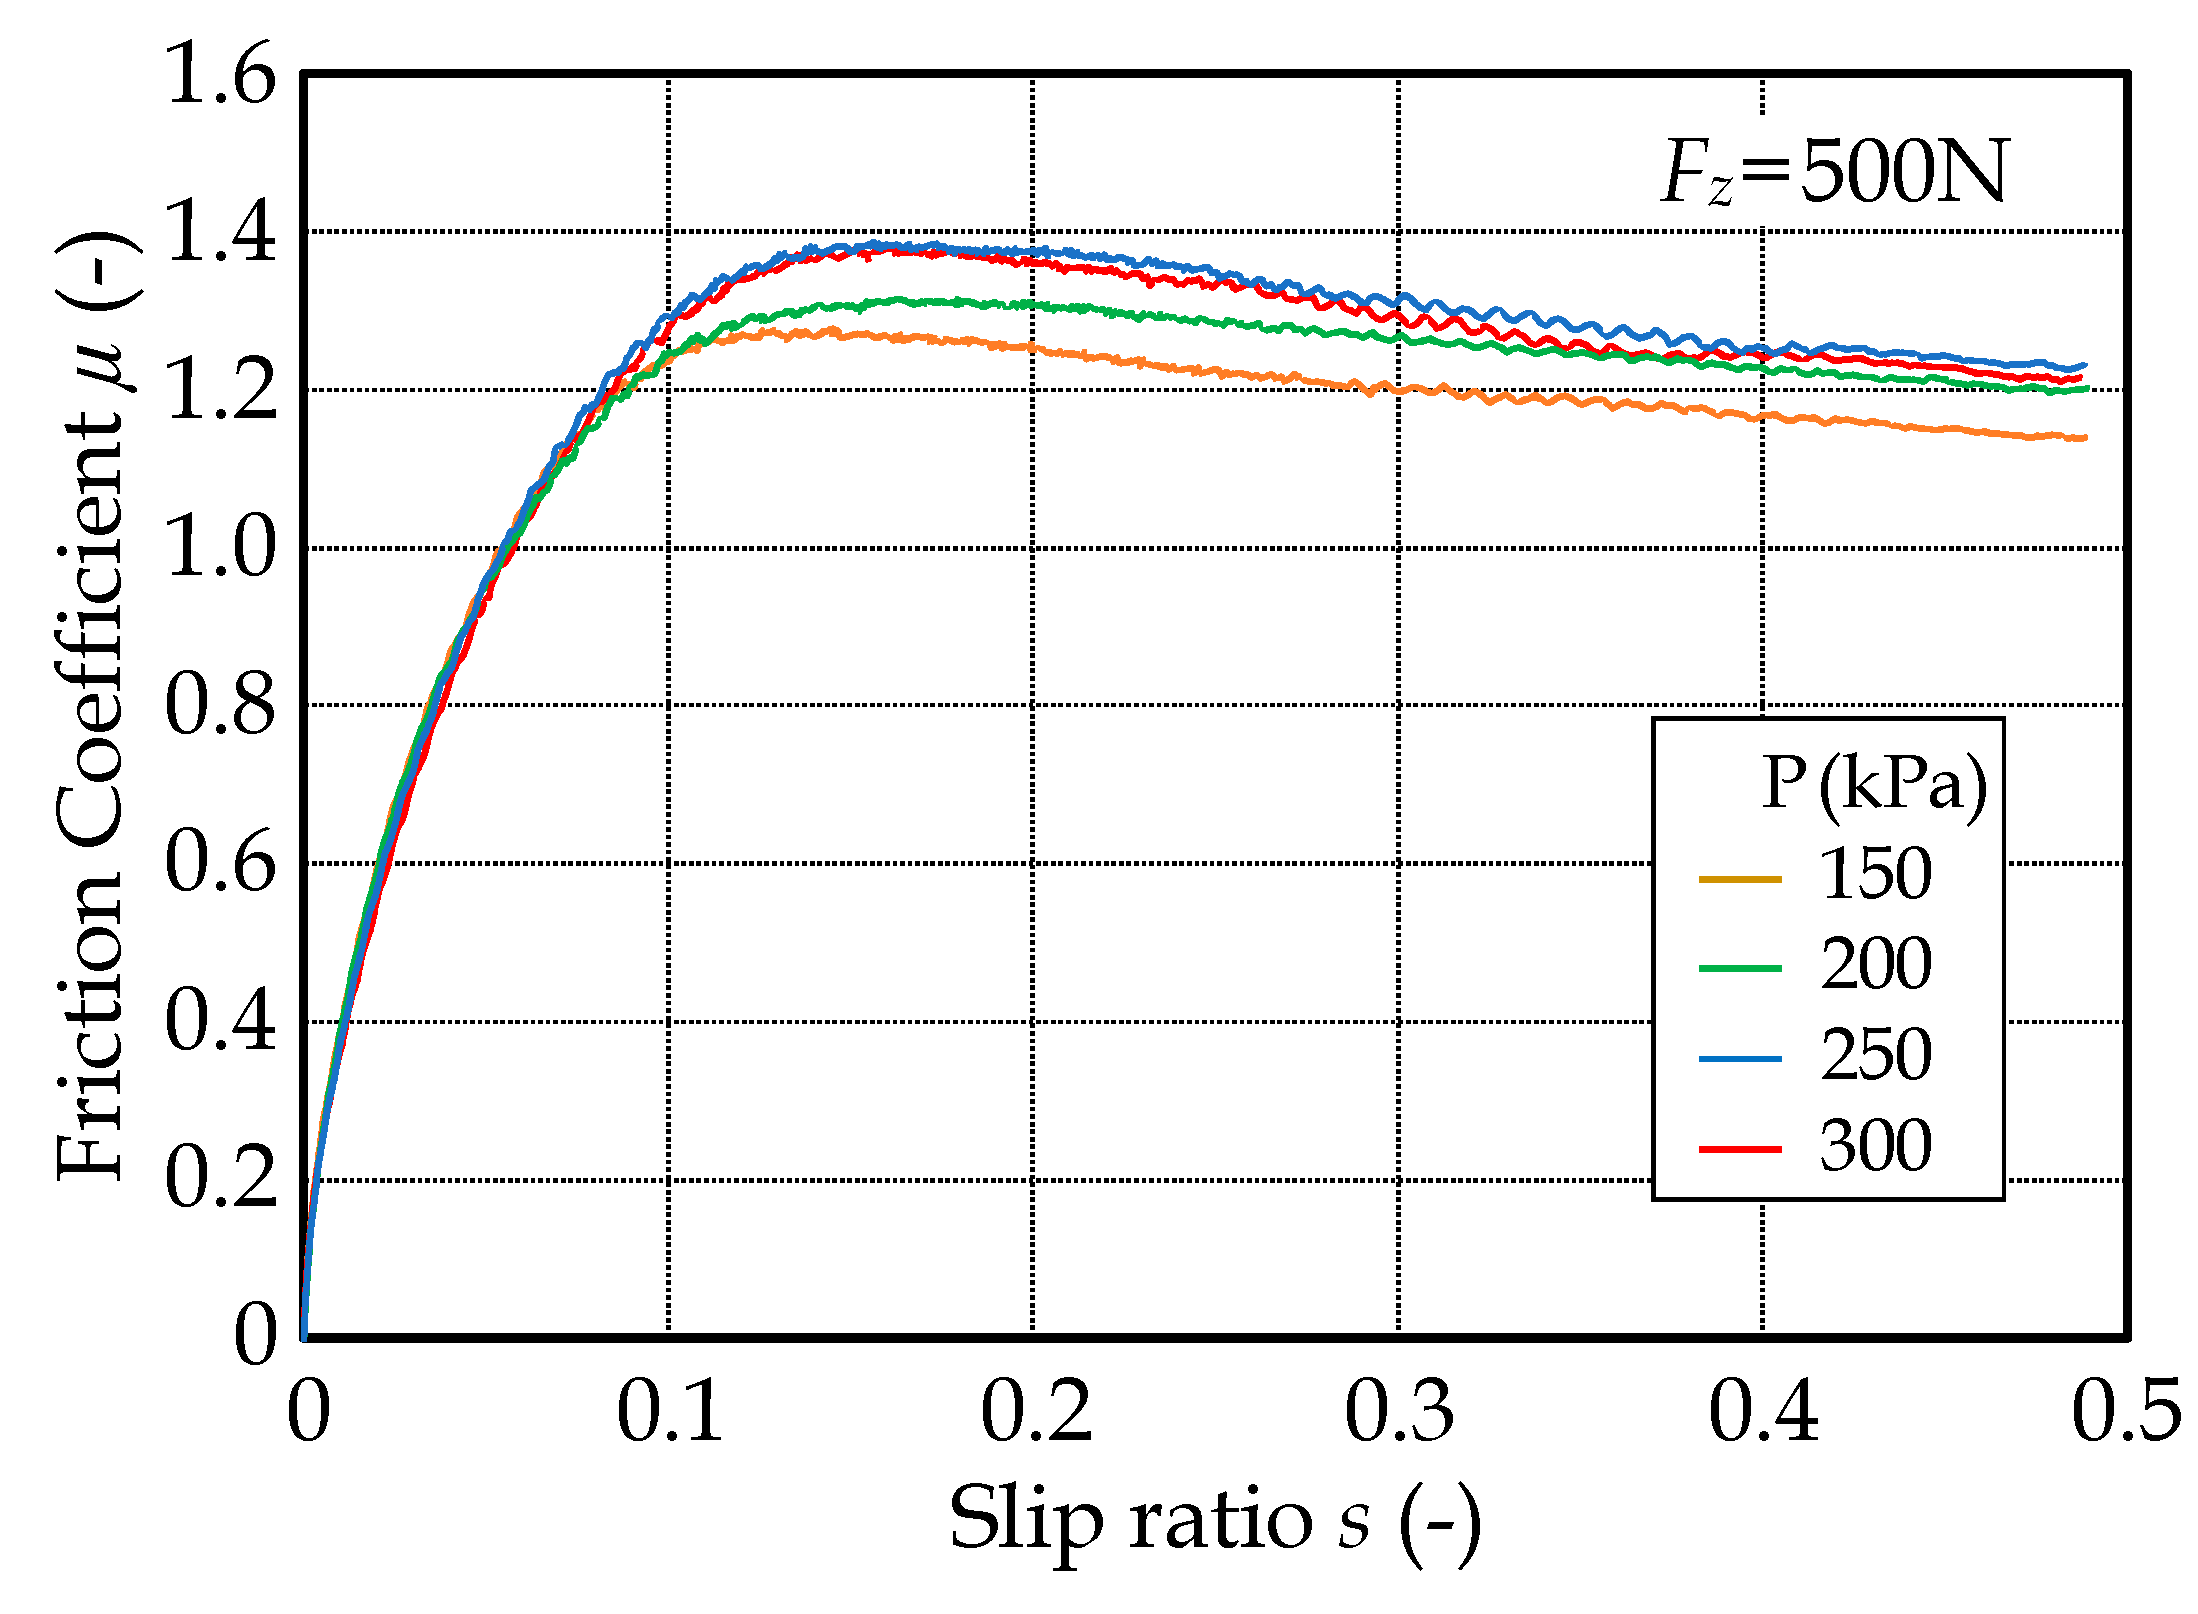
4.2. Measurement of Road Friction

In this study, we tried to measure two types of pavements (“Fine particle asphalt mixture” and “Coarse particle asphalt mixture”) as shown in Figure 17.
The measurement and identification results on each road surface are shown. First, the result of the fine particle asphalt mixture is shown in Figure 18. Three points represent the measurement results and the blue line represents the result of identification by the MF using these three points. Next, using the peak μ of this blue line and the slip ratio at that time, the lock μ is obtained by the estimation method shown in Figure 18, and the identification result including this point is shown by the red line. The coefficients a, b, and c of the MF are shown in Figure 18, the suffix ‘0’ is the identification result using the first three points, and ‘*’ indicates the final identification result.
Similarly, the results for coarse particle asphalt mixture are shown in Figure 19. In Figure 19 as well, the same analysis as in Figure 18 is performed. From Figure 18 and Figure 19, the change in μ-s characteristics owing to the difference in the surface of the road is clearly represented.
Next, it is necessary to compare these differences with the tire characteristics measured by the bench tester and confirm the validity of the results measured by this device. These results are shown in Figure 20 to confirm the characteristic difference due to the difference in the road surface for the same tires in the same setting conditions. These need to be considered separately in three regions. The first is the characteristic of rising with strong linearity, which is the region for confirming the above-mentioned KB.
The next is the region where the peak μ value and its slip ratio value appear. The last region is where the characteristic decline appears after the peak μ is passed. The first region depends on the shearing force characteristics of the tire tread rubber, and if the tire setting conditions are the same, the μ-s characteristics have relatively the same inclination. From Figure 20, this inclination has an almost constant value under three conditions such as a bench test result and difference in the pavement surfaces. The conclusions in this region are seen as reasonable results. In the second region, the peak μ value and the conditions to reach the peak value are important evaluation criteria. The transition from the relatively linear inclination region to the peak μ involves the transition from the adherence region to the sliding region in the contact patch of the tire. Therefore, when the tire setting conditions are the same, generally, the peak μ is reduced due to the decrease in the road surface friction coefficient and appears in a region where the slip ratio at which the peak μ is generated is low. From the results of this experiment, the change in the characteristics can be clearly seen, and the results in this area are termed reasonable.
Focusing on the characteristics after passing the peak μ, which is the last region, the characteristics on the actual road show relatively the same characteristics, whereas the bench test results show that the decrease in this region is relatively small. This bench tester uses a belt-type road surface and a pseudo-paved road surface is attached to the surface. This surface has relatively high shear characteristics of individual irregularities from the viewpoint of maintaining the durability of the test road surface. For this reason, the state maintenance performance of the adherence region in the ground plane is improved, and it is considered that the transition to the sliding region appears relatively late. Considering these, it can be evaluated that the characteristics of this region are reasonable.
Considering the above, the examination is divided into these three areas and it is judged that the value measured by this device is appropriate.
The results of this study obtained thus far indicate that by using this measurement method, it is possible to clearly describe changes in the μ-s characteristics owing to differences in the pavement surfaces. Finally, an example of obtaining continuous measurements of road friction characteristics using these measurement methods is shown. Details of the continuous measurement of the road surface friction characteristics will be described in the next report. Figure 21 shows the results of continuously measuring road friction characteristics by this method. The road surface is an asphalt road surface and the measurements are performed on the proving ground of the Nihon University College of Science and Technology. The measurement result after driving at a constant speed of 40 km/h is indicated by the change in the peak μ and lock μ for 10 s. From these results, it is clear that relatively stable values of peak μ and lock μ could be measured during steady-state driving on the same paved surface. Considering these results comprehensively, the road friction-measurement method presented in this paper is superior to various measurement methods related to road friction developed thus far.

5. Conclusions

In this study, to ensure the road traffic safety of advanced driver-assist systems (ADAS) and automated driving systems (AD), which are expected to become widespread in the future, we examined the possibility of constructing a road friction characteristic measurement system for the purpose of providing road friction information. As a result, the following conclusions were drawn:
(1)
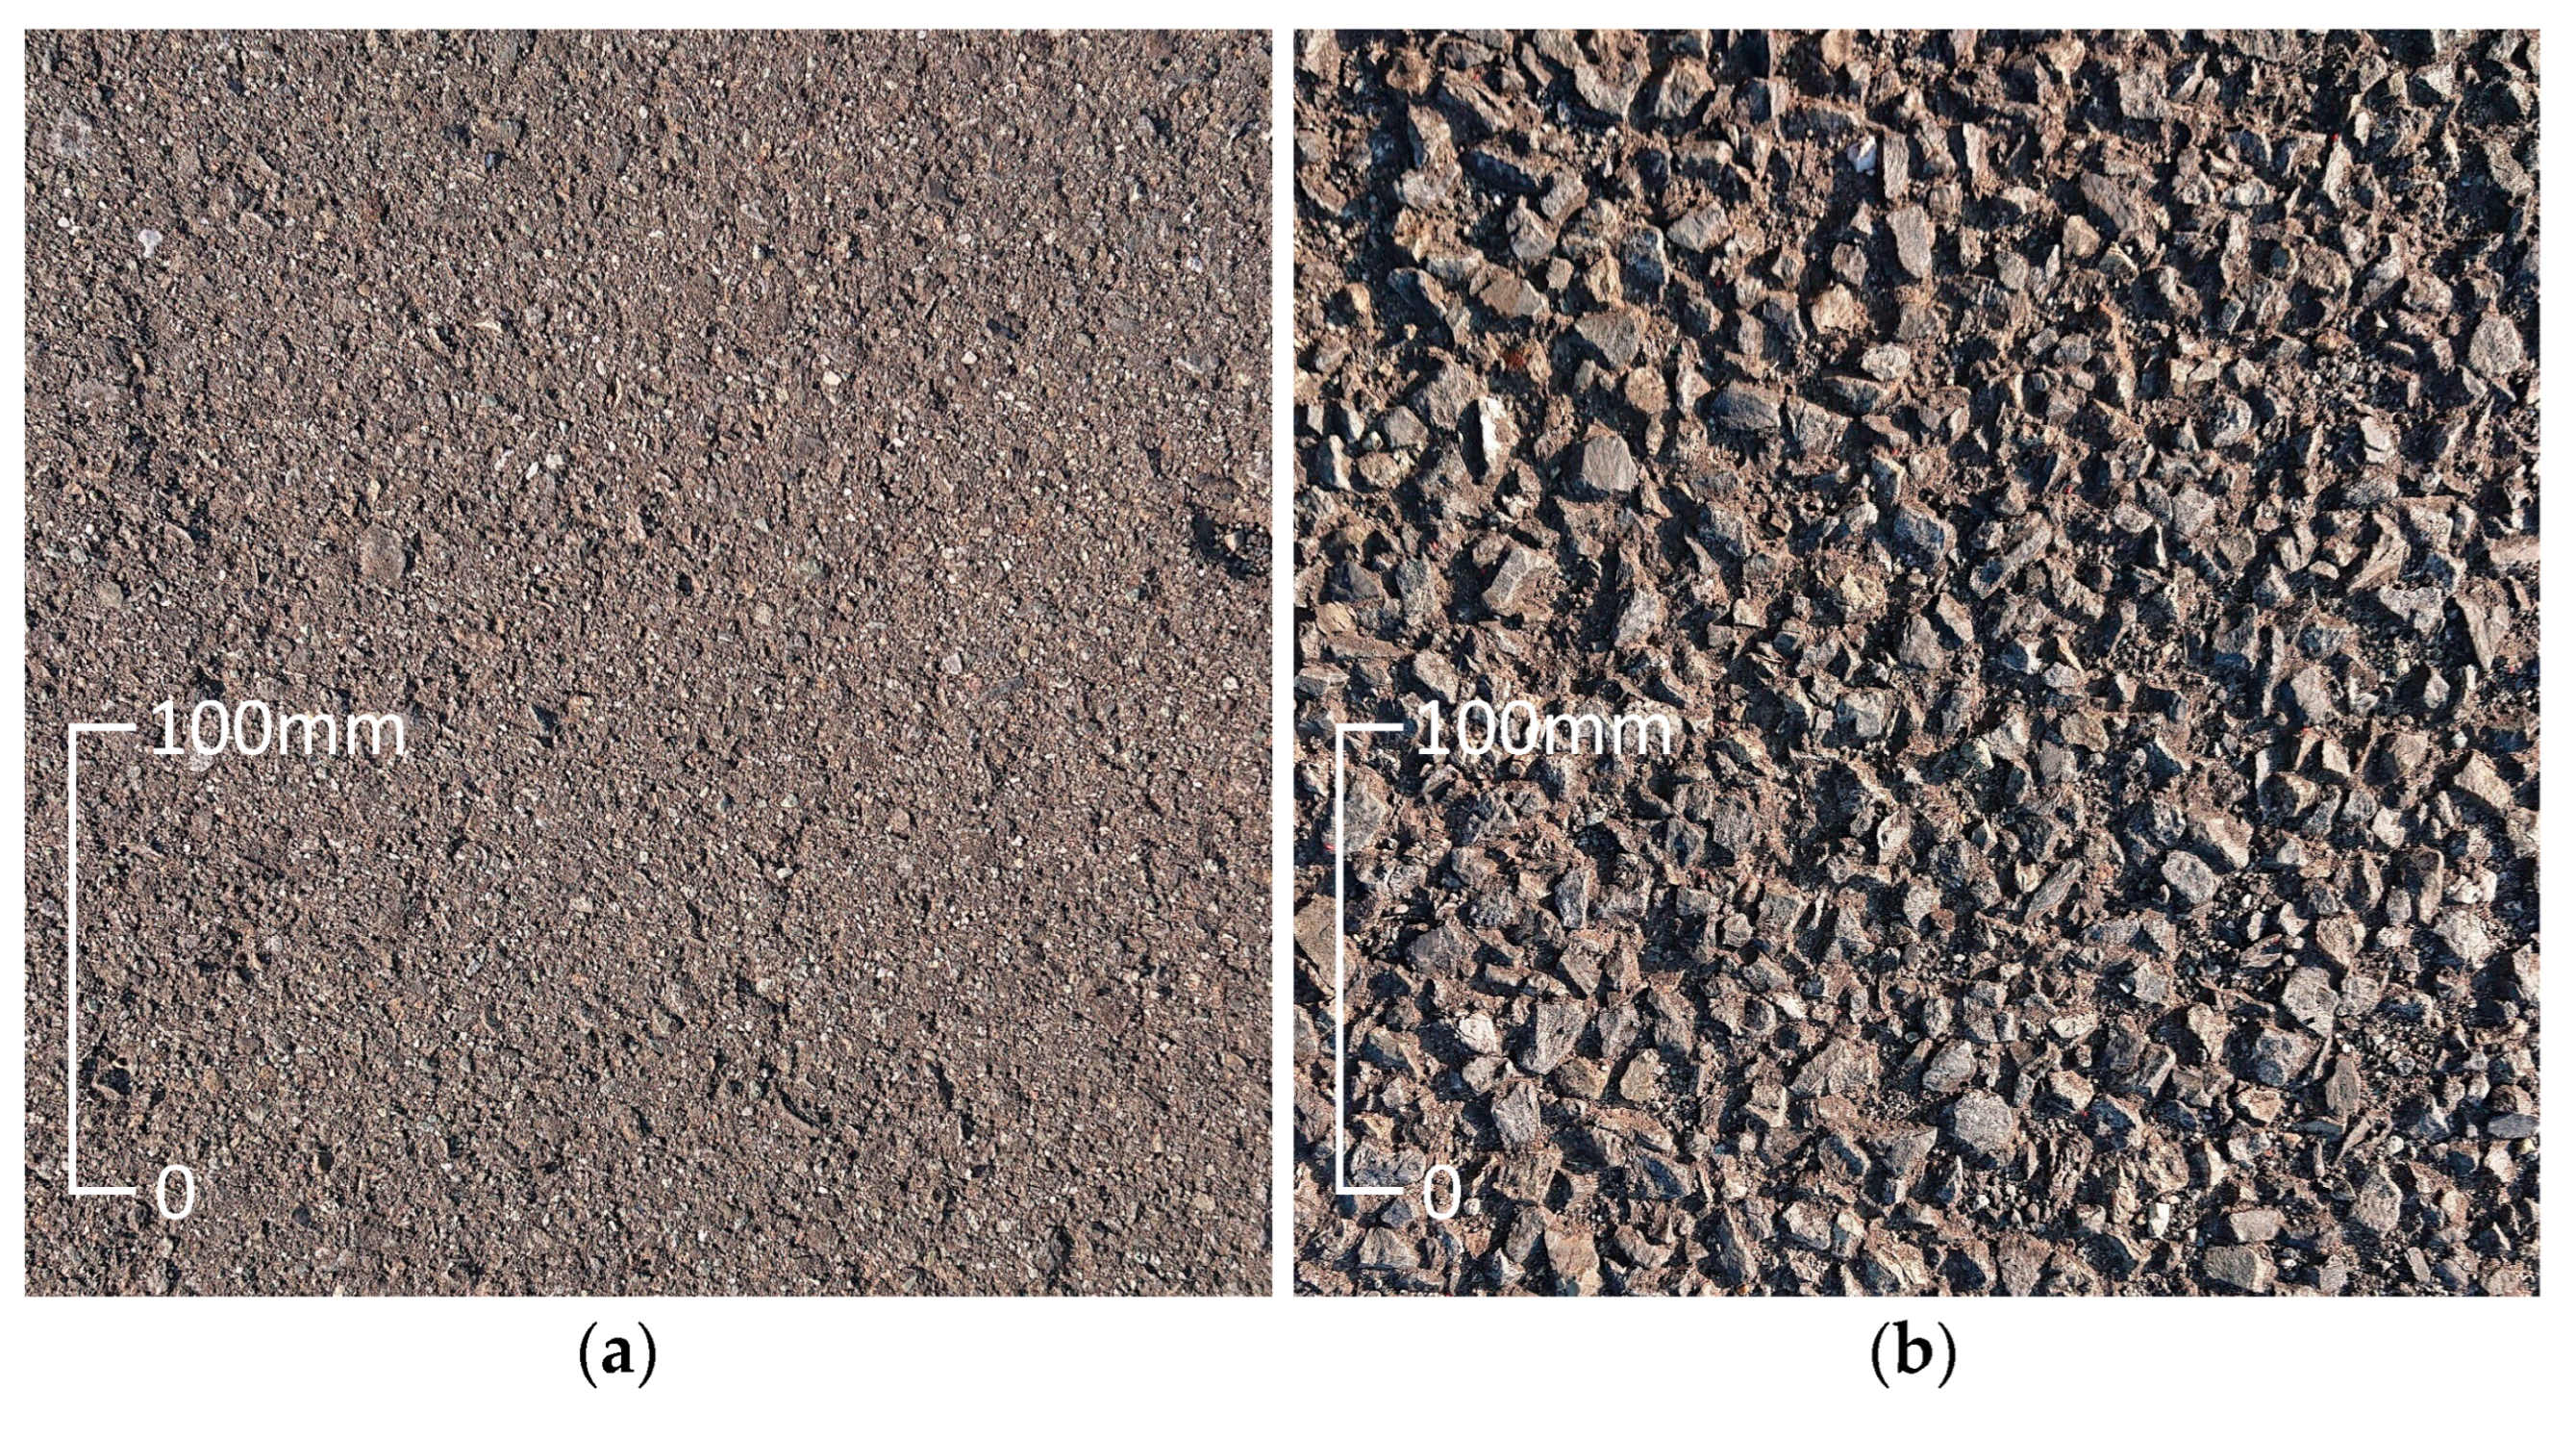
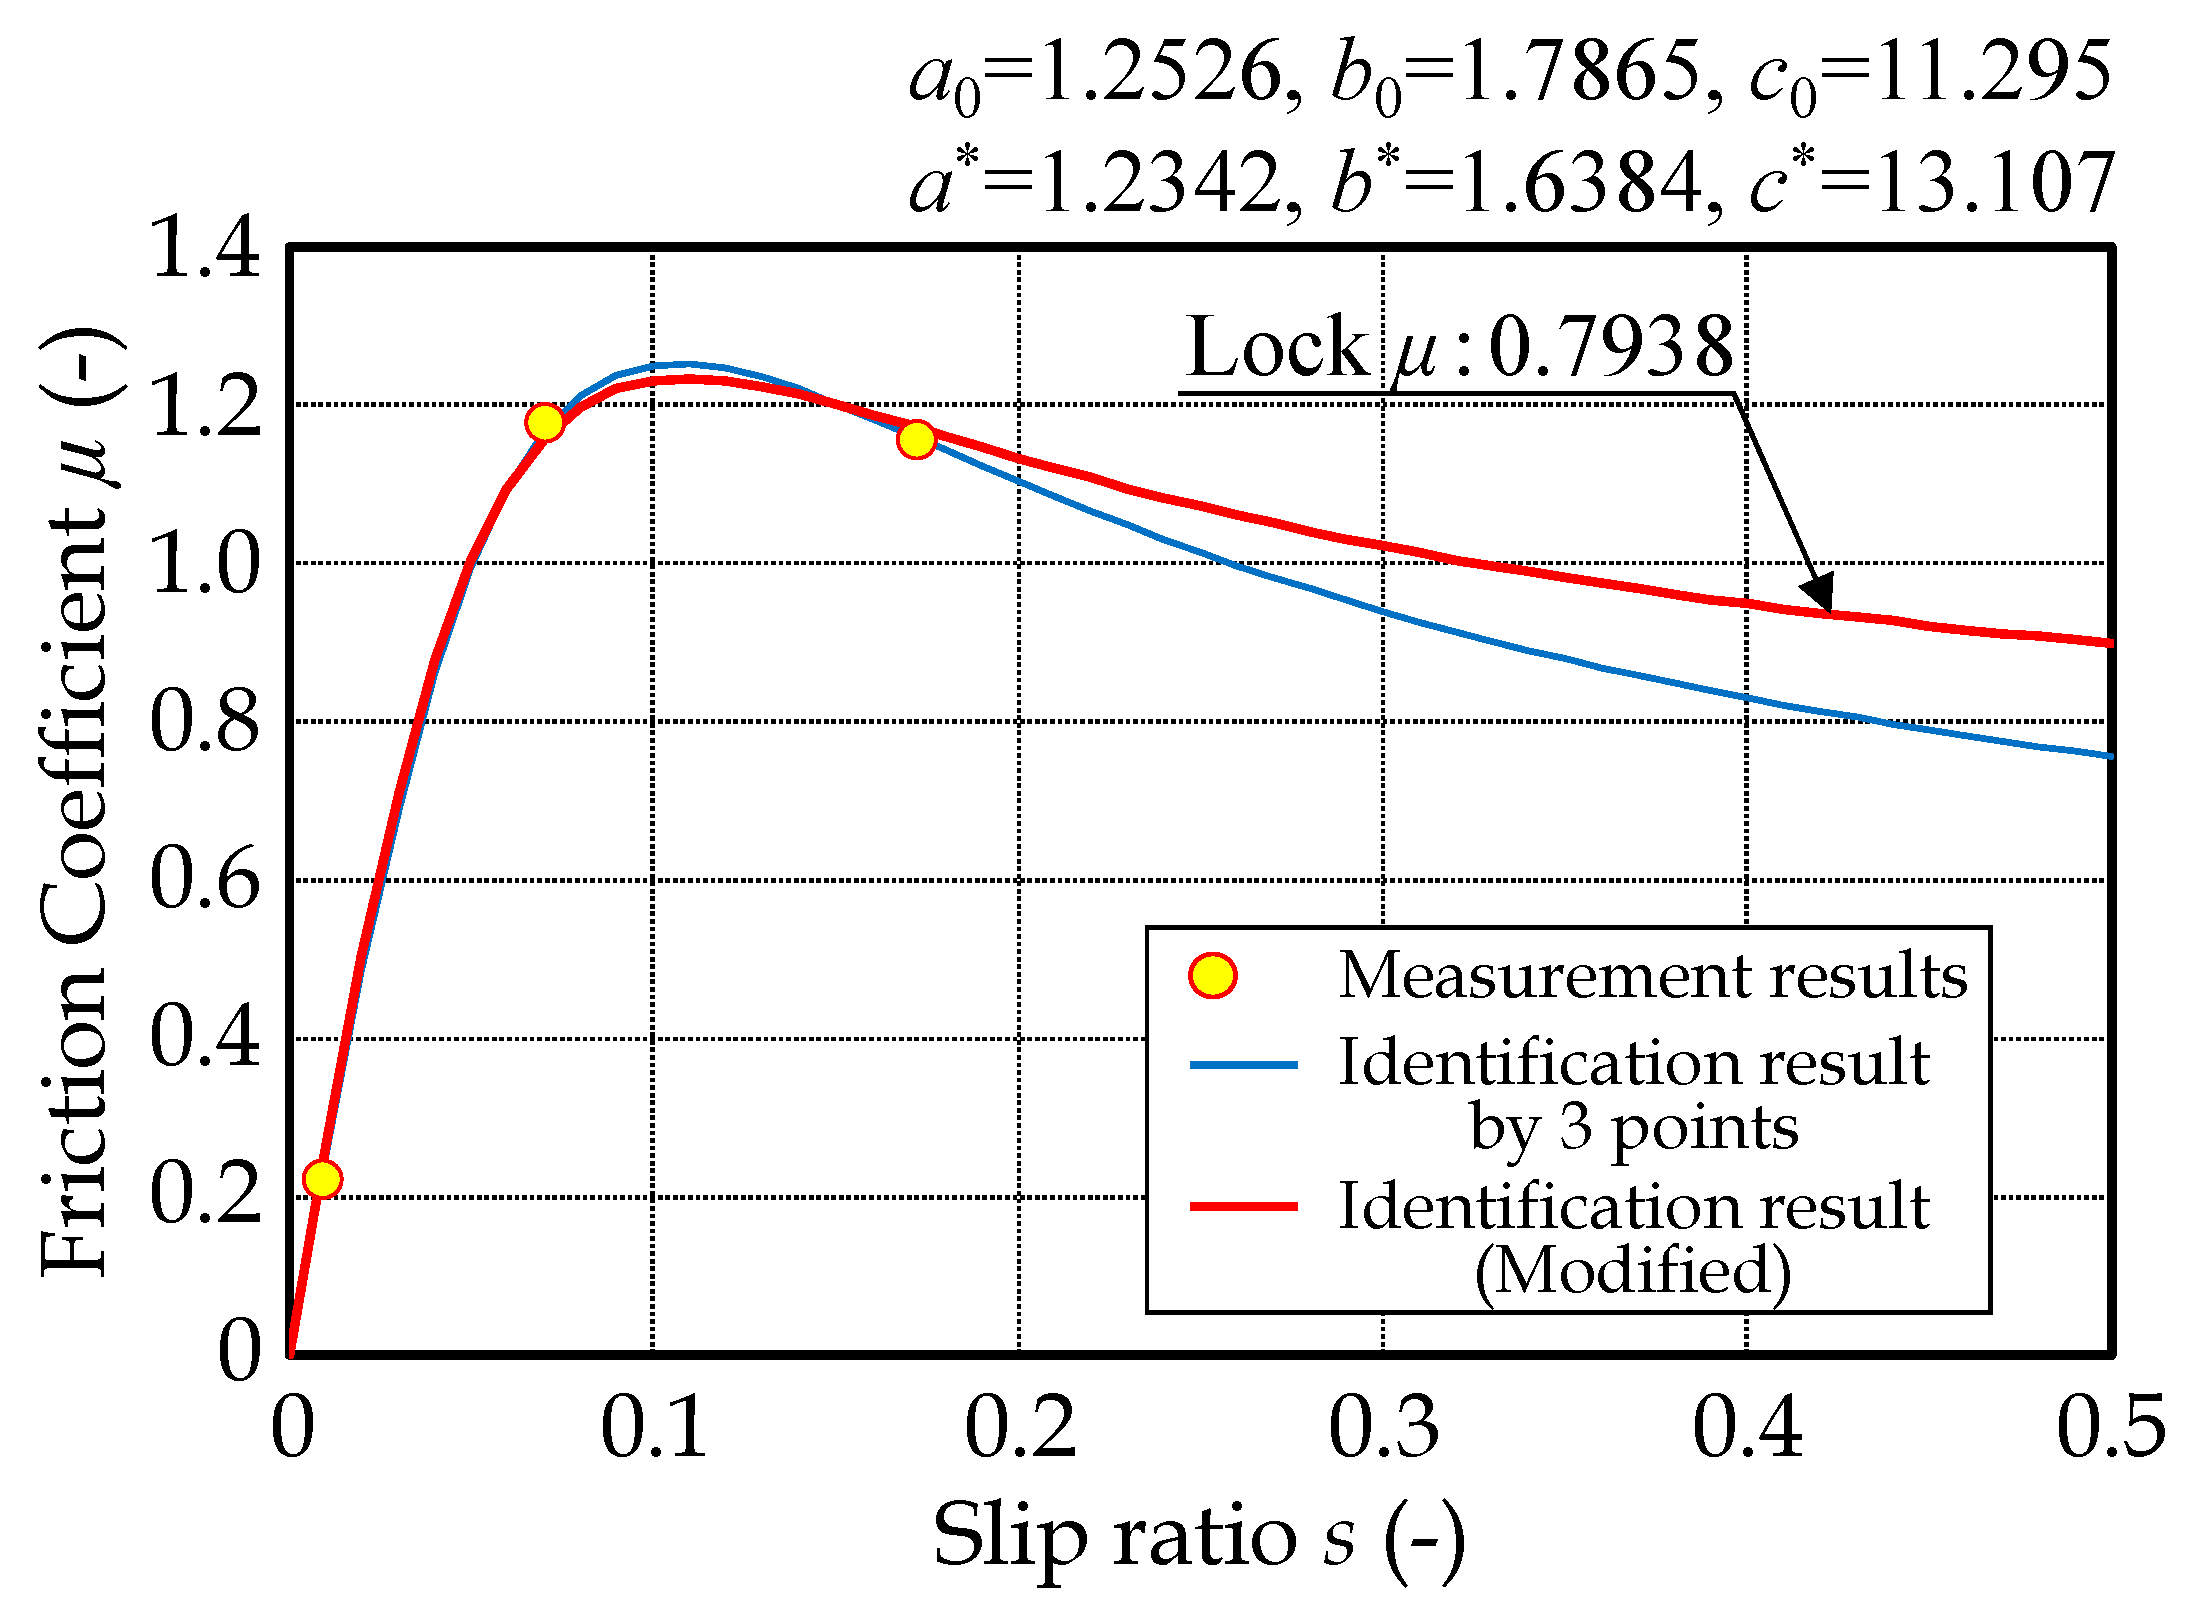
Characteristic measurements were performed on two types of road surfaces (fine and coarse particle asphalt mixture), and identification results obtained using the MF method and the characteristic modified method using lock μ estimation were shown;
(2)
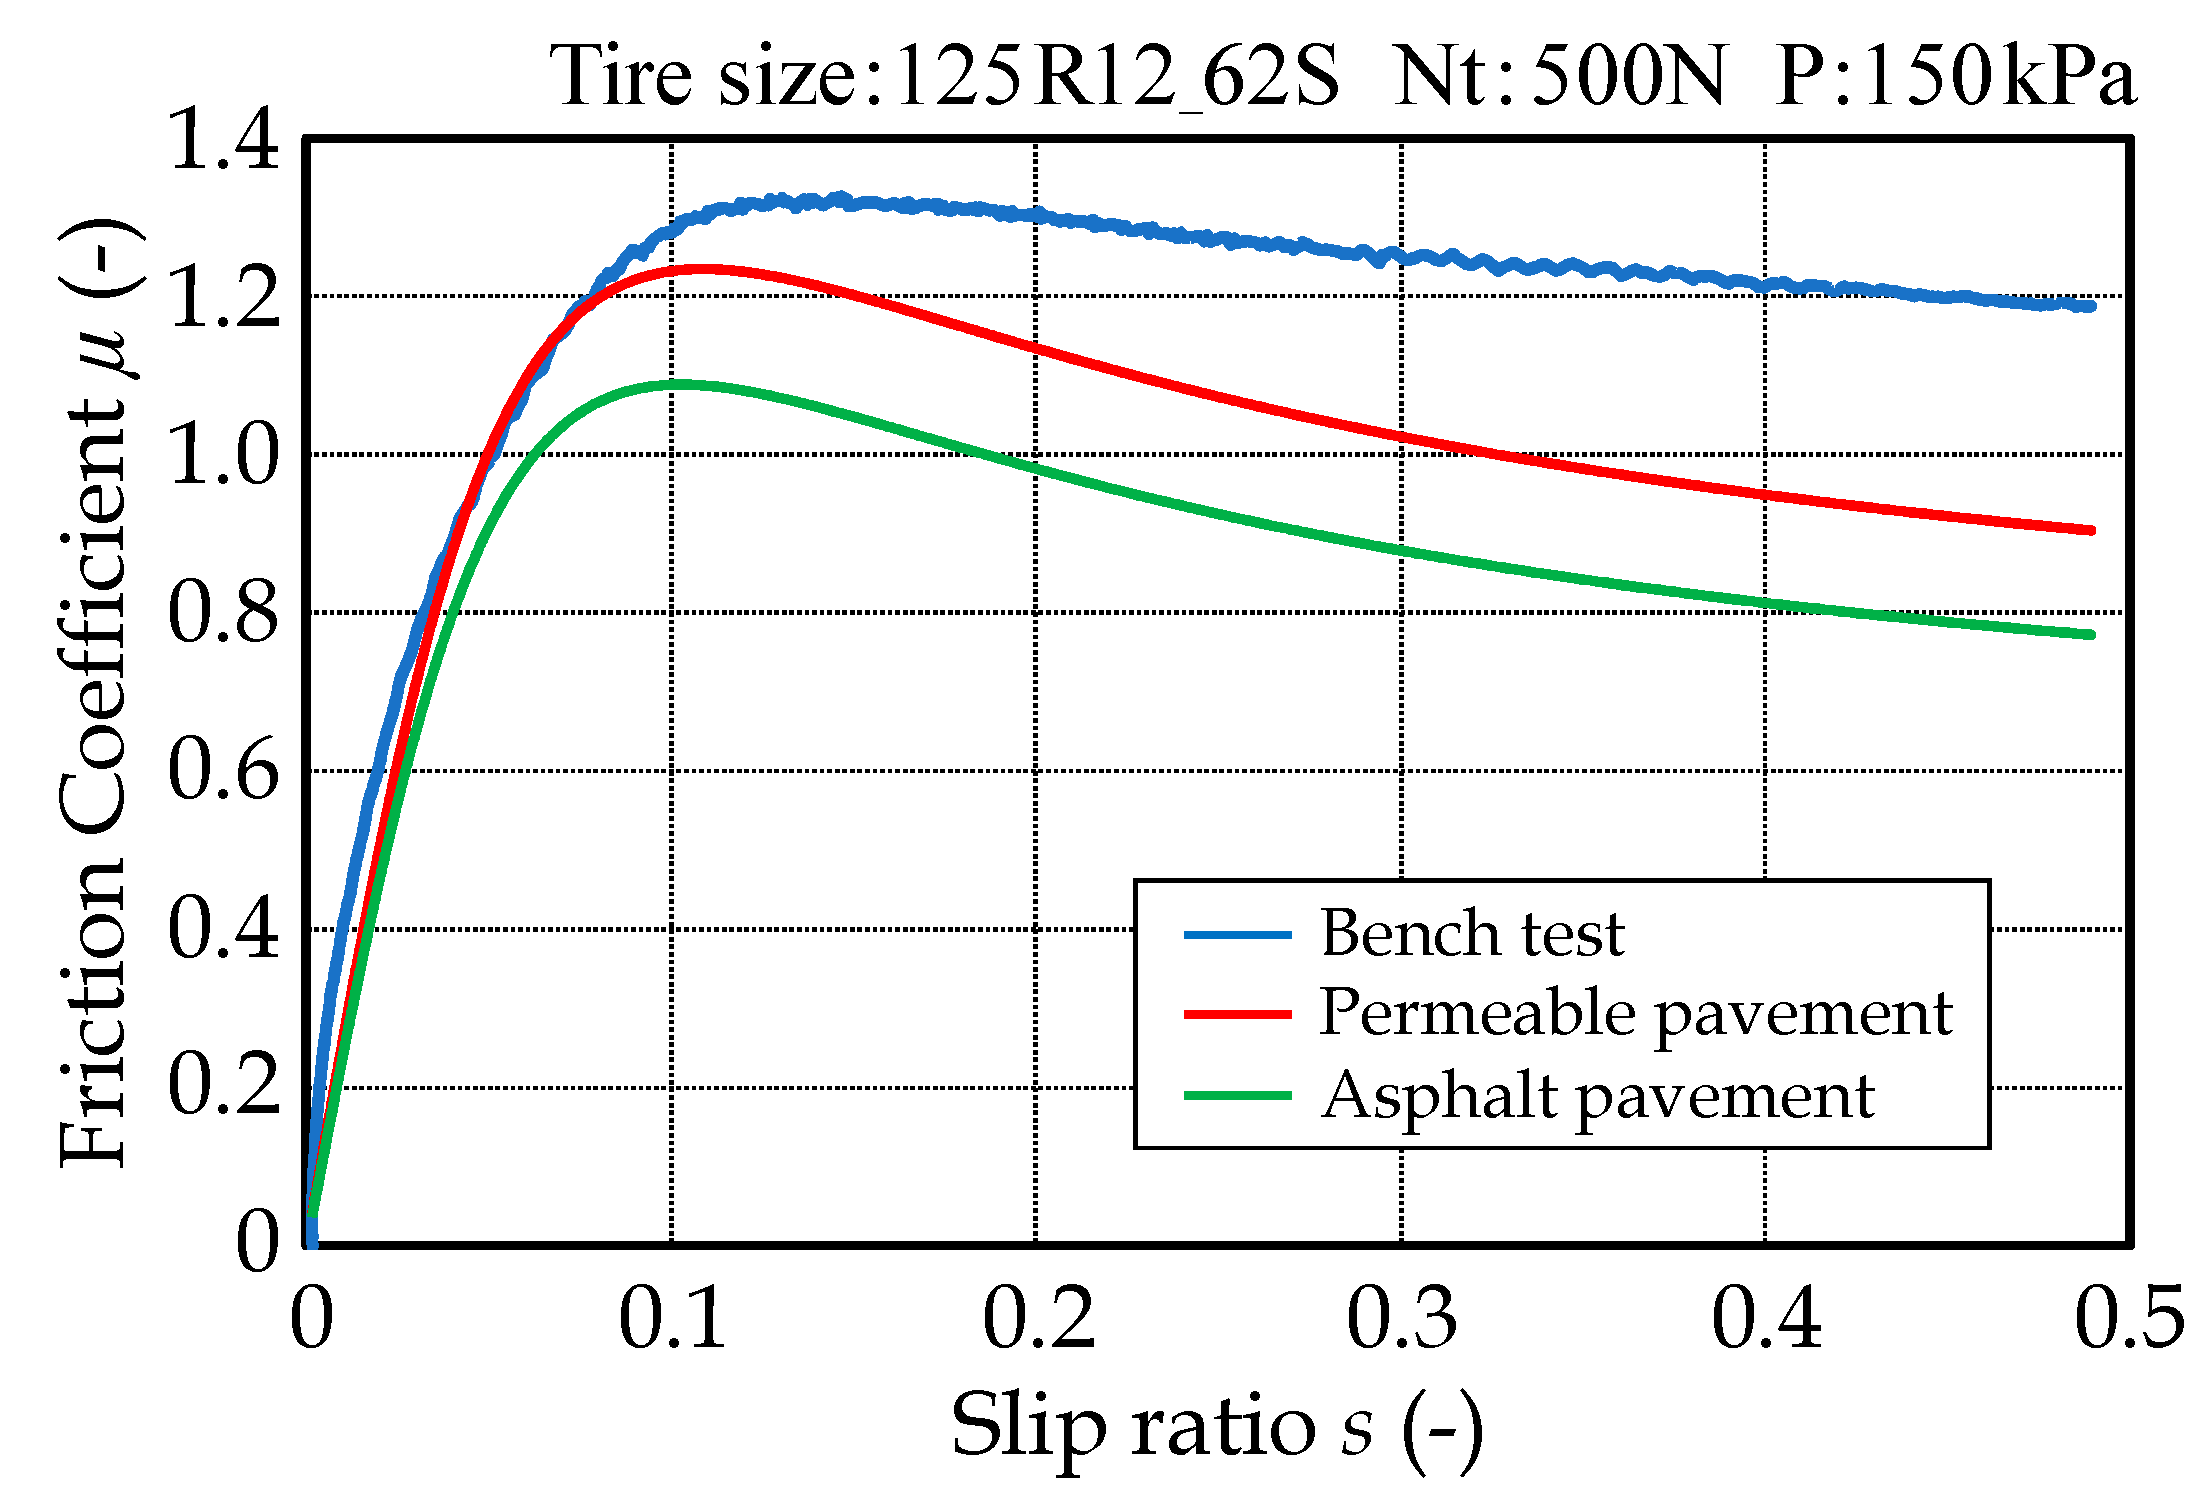
By examining and comparing the results of the friction characteristics of the two types of actual road surfaces and the results of a bench test in three areas, it was confirmed that the aim of the study could be achieved;
(3)
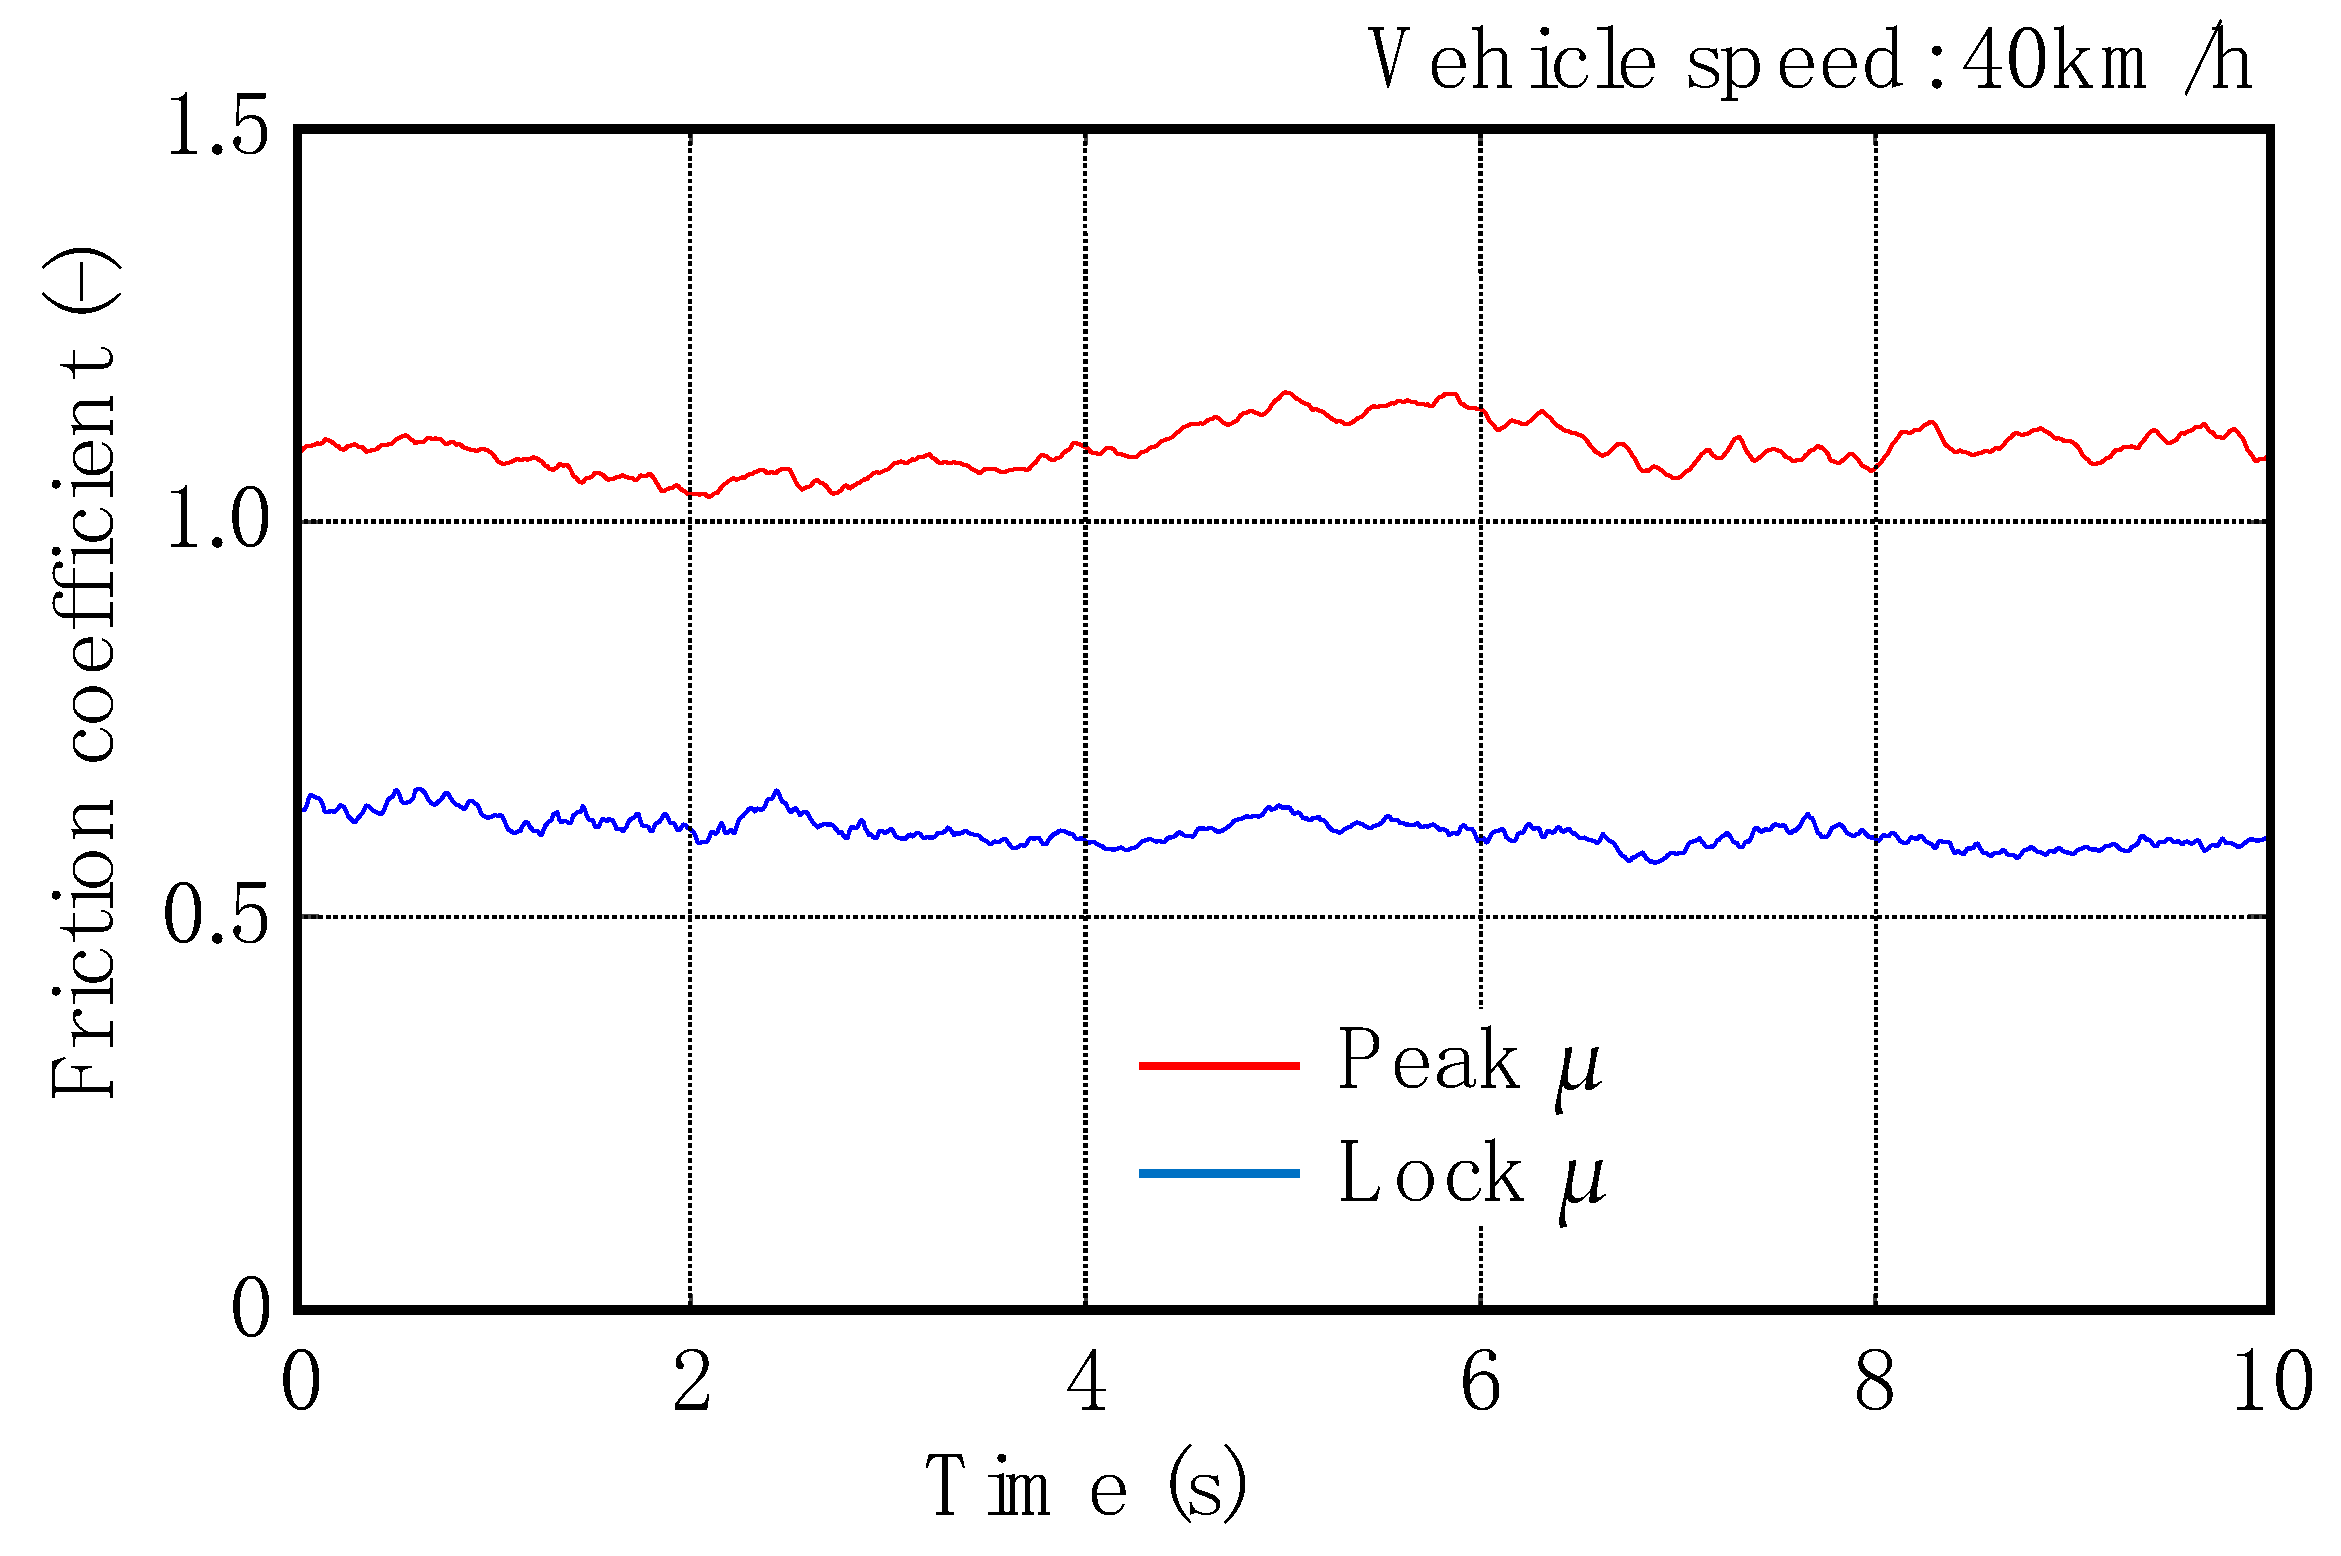
This measurement method could continuously measure μ-s characteristics and an example of the measurement result was shown;
(4)
These findings indicate that the proposed method is superior at ensuring vehicle safety compared to existing road friction-measurement methods.
In the future, it is necessary to study the measurement of characteristics of various ordinary road surfaces including dry and wet roads, and snowy and icy roads, and establish a database from the obtained measurements. Furthermore, it is necessary to select environmental information that is highly correlated with road friction characteristics and establish a method for estimating the forward road friction characteristics of vehicles using artificial intelligence.

Author Contributions

Conceptualization, T.H. and I.K.; Data curation, I.K. and A.W.; Formal analysis, I.K. and Y.K.; Funding acquisition, T.H. and I.K.; Investigation, T.H., T.K. and M.N.; Methodology, I.K. and Y.K.; Project administration, T.H.; Resources, T.K. and M.N.; Validation, Y.K. and A.W.; Writing—original draft, I.K.; Writing—review and editing, T.H. All authors have read and agreed to the published version of the manuscript.

Funding

This research received no external funding.

Institutional Review Board Statement

Not applicable.

Informed Consent Statement

Not applicable.

Data Availability Statement

The raw data collected in this study are available upon request from the corresponding author.

Acknowledgments

A part of this research was supported by a research grant from NEXCO East Japan and we would like to express our gratitude to all concerned.

Conflicts of Interest

The 5th author received compensation from Absolute Co., Ltd.

References

  1. Ando, K.; Kuramochi, T. A Consideration on Management Levels of Pavement Friction and Slip Accidents. Civ. Eng. J. 2010, 52, 56–59. (In Japanese) [Google Scholar]
  2. Wallman, C.-G.; Astrom, H. Friction measurement methods and the correlation between road friction and traffic safety: A literature review. In VTI Meddelande 911A; Swedish National Road and Transport Research Institute: Linköping, Sweden, 2001. [Google Scholar]
  3. Holzschuher, C.; Choubane, B.; Lee, H.S.; Jackson, N.M. Measuring Friction of Patterned and Textured Pavements: A Comparative Study. Transp. Res. Rec. J. Transp. Res. Board 2010, 2155, 91–98. [Google Scholar] [CrossRef]
  4. Echaveguren, T.; de Solminihac, H.; Chamorro, A. Long-term behavior model of skid resistance for asphalt roadway surfaces. Can. J. Civ. Eng. 2010, 37, 719–727. [Google Scholar] [CrossRef]
  5. Echaveguren, T.; de Solminihac, H. Seasonal variability of skid resistance in paved roadways. Proc. Inst. Civ. Eng. Transp. 2011, 164, 23–32. [Google Scholar] [CrossRef]
  6. Ahammed, M.A.; Tighe, S.L. Asphalt pavements surface texture and skid resistance: Exploring the reality. Can. J. Civ. Eng. 2012, 39, 1–9. [Google Scholar] [CrossRef]
  7. D’Apuzzo, M.; Festa, B.; Giuliana, G.; Mancini, L.; Nicolosi, V. The evaluation of runway surface properties: A new approach. Procedia-Soc. Behav. Sci. 2012, 53, 1194–1203. [Google Scholar] [CrossRef]
  8. Najafi, S.; Flintsch, G.W.; Medina, A. Linking roadway crashes and tire-pavement friction: A case study. Int. J. Pavement Eng. 2017, 18, 119–127, No.1039005. [Google Scholar] [CrossRef]
  9. Najafi, S.; Flintsch, G.W.; Khaleghian, S. Pavement friction management: Artificial neural network approach. Int. J. Pavement Eng. 2019, 20, 125–135. [Google Scholar] [CrossRef]
  10. Kane, M.; Cerezo, V. A contribution to Tire/Road Friction Modelling: From a Simplified Dynamic Frictional Contact Model to a “Dynamic Friction Tester” Model. Wear 2015, 342–343, 163–171. [Google Scholar] [CrossRef]
  11. Kane, M.; Do, M.-T.; Cerezo, V.; Rado, Z.; Khelifi, C. Contribution to pavement friction modelling: An introduction of the wetting effect. Int. J. Pavement Eng. 2019, 20, 965–976. [Google Scholar] [CrossRef]
  12. Izeppi, E.L.; Flintsch, G.; McCarthy, R. Evaluation of Methods for Pavement Surface Friction: Testing on Non-Tangent Roadways and Segments; Research & Development, NCDOT Project 2017-02 2017, FHWA/NC/2017-02; State of North Carolina, Department of Transportation: Blacksburg, VA, USA, 2017. [Google Scholar]
  13. Plati, C.; Pomoni, M.; Georgouli, K. Quantification of skid resistance seasonal variation in asphalt pavements. J. Traffic Transp. Eng. 2020, 7, 237–248. [Google Scholar] [CrossRef]
  14. Zaid, N.B.M.; Hainin, M.R.; Idham, M.K.; Warid, M.N.M.; Naqibah, S.N. Evaluation of Skid Resistance Performance Using British Pendulum and Grip Tester. Earth Environ. Sci. 2019, 220, 012016. [Google Scholar] [CrossRef]
  15. Perez-Acebo, H.; Gonzalo-Orden, H.; Rojí, E. Skid resistance prediction for new two-lane roads. Proc. Inst. Civ. Eng. Transp. 2019, 172, 264–273. [Google Scholar] [CrossRef]
  16. Perez-Acebo, H.; Gonzalo-Orden, H.; Findley, D.J.; Rojí, E. A skid resistance prediction model for an entire road network. Constr. Build. Mater. 2020, 262, 120041. [Google Scholar] [CrossRef]
  17. Perez-Acebo, H.; Montes-Redondo, M.; Appelt, A.; Findley, D.J. A simplified skid resistance predicting model for a freeway network to be used in a pavement management system. Int. J. Pavement Eng. 2022. [Google Scholar] [CrossRef]
  18. Kuriyagawa, Y.; Kageyama, I.; Haraguchi, T.; Kaneko, T.; Asai, M.; Tahira, S.; Matsumoto, G. Study on Measurement for Friction Characteristics on Actual Road Surface: Construction of estimation method for road friction characteristic indexes. Trans. JSAE 2022, 53, 379–384. (In Japanese) [Google Scholar]
  19. Kageyama, I.; Kobayashi, Y.; Haraguchi, T.; Asai, M.; Matsumoto, G. Study on Measurement for Friction Characteristics on Actual Road Surface. Trans. JSAE 2020, 51, 924–930. (In Japanese) [Google Scholar]
  20. Kageyama, I.; Kuriyagawa, Y.; Haraguchi, T.; Kaneko, T.; Asai, M.; Matsumoto, G. Study on the Road Friction Database for Automated Driving: Fundamental Consideration of the Measuring Device for the Road Friction Database. Appl. Sci. 2021, 12, 18. [Google Scholar] [CrossRef]
  21. Kageyama, I.; Kuriyagawa, Y.; Haraguchi, T.; Kaneko, T.; Nishio, M.; Matsumoto, G. Construction of Characteristic Measurement System for Ordinary Road Friction. In Proceedings of the JSAE Annual Meeting, Yokohama, Japan, 15 May 2020. (In Japanese). [Google Scholar]
  22. Pacejka, H.B.; Bakker, E. The magic formula tire model. Suppl. Veh. Syst. Dyn. 1992, 21, 1–18. [Google Scholar] [CrossRef]
Figure 2. An example of estimated result using MF.
Inventions 07 00090 g002
Figure 3. Comparison between experimental results and identification results.
Inventions 07 00090 g003
Figure 4. Comparison between experimental results and identification results at lock μ.
Inventions 07 00090 g004
Figure 5. Relationship between the slip ratio and the ratio of lock μ by peak μ.
Inventions 07 00090 g005
Figure 6. Results obtained with this method. (a) Comparison of the peak μ obtained by this analytical method and the results in Figure 1. (b) Comparison of the lock μ obtained by this analytical method and the results in Figure 1.
Inventions 07 00090 g006
Figure 7. Mechanical properties between two tires [19,20].
Inventions 07 00090 g007
Figure 8. Fundamental design for trailer [21].
Inventions 07 00090 g008
Figure 9. Tire characteristic tester with measurement tire.
Inventions 07 00090 g009
Figure 10. μ-s characteristics against load changes.
Inventions 07 00090 g010
Figure 11. Characteristics of measurement tires against load changes.
Inventions 07 00090 g011
Figure 12. μ-s characteristics against internal pressure changes.
Inventions 07 00090 g012
Figure 13. Characteristics of measurement tires against internal pressure changes.
Inventions 07 00090 g013
Figure 14. Constructed measurement trailer system.
Inventions 07 00090 g014
Figure 15. Circumference of the measurement tire.
Inventions 07 00090 g015
Figure 16. Forces relationship generated on the i-th tire (Subscript ‘i’ is the tire number).
Inventions 07 00090 g016
Figure 17. Pavement surface used for measurement. (a) Fine particle asphalt mixture (Asphalt pavement). (b) Coarse particle asphalt mixture (Permeable pavement).
Inventions 07 00090 g017
Figure 18. Results of the ‘fine particle asphalt mixture’.
Inventions 07 00090 g018
Figure 19. The result of the ‘coarse particle asphalt mixture’.
Inventions 07 00090 g019
Figure 20. Comparison between bench test results and experimental results using MF.
Inventions 07 00090 g020
Figure 21. Continuous measurement results of peak μ and lock μ.
Inventions 07 00090 g021
Publisher’s Note: MDPI stays neutral with regard to jurisdictional claims in published maps and institutional affiliations.

