Article

Optimization of the Parameters Influencing the Antioxidant Activity and Concentration of Anthocyanins Extracted from Red Onion Skins Using a Central Composite Design

by
Florina Stoica
,
Oana Emilia Constantin
,
Nicoleta Stănciuc
,
Iuliana Aprodu
,
Gabriela Elena Bahrim
and
Gabriela Râpeanu
*
Integrated Center for Research, Expertise and Technological Transfer in Food Industry, Food Science, Food Engineering, Biotechnology and Aquaculture Department, Faculty of Food Science and Engineering, Dunarea de Jos University of Galati, 111 Domnească Street, 800201 Galati, Romania
*
Author to whom correspondence should be addressed.
Inventions 2022, 7(4), 89; https://doi.org/10.3390/inventions7040089
Submission received: 6 September 2022 / Revised: 23 September 2022 / Accepted: 28 September 2022 / Published: 3 October 2022

Abstract

:
This study aimed to extract bioactives from red onion skins for use as edible colorants that are both natural and functional. The extraction of bioactive chemicals from red onion skins using a conventional solvent extraction was optimized using a Central Composite Design (CCD). The influence of extraction parameters, such as ethanol and citric acid concentrations, extraction temperature, and time, on anthocyanin content and antioxidant activity (DPPH method) was studied. A quadratic model was suggested for all of the parameters examined and employed. Citric acid concentration (0.05–2.64%), ethanol concentration (6.36–73.63%), operation temperature (16.47–58.52 °C), and extraction duration (10–234.54 min) were the variables studied in the coded form of the experimental plan. The best conditions for maximum anthocyanins and antioxidant activity recovery were: 60% ethanol, 0.87% citric acid, 179.99 min, and 25 °C. The anthocyanins concentration varied from 0.45 to 1.43 mg C3G/g DW, while the antioxidant activity varied from 24.29 to 37.20 mM TE/g DW, according to the experimental design. Overall, it should be emphasized that the extraction process can be enhanced by settling the operating factors to maximize the model responses. The current findings demonstrate that extracts from red onion skins would be useful in developing functional food products.

1. Introduction

Since ancient times, the onion (Allium cepa L.) has been one of the most important vegetable crops and it is the world’s second most developed agricultural crop after the tomato. Onions are grown in various shapes, colors, sizes, and pungency to fulfill specific culinary and nutritional needs and have become a nearly universal ingredient in food preparation worldwide [1]. Onion production has grown over the last decade and it now reaches about 98 million tons around the world. More than 550,000 tons of by-products (onion skins) are produced yearly, causing various biological and environmental problems [2]. Valorization is widely applied to managing agro-industrial by-products, in which by-products are considered valuable secondary raw materials with potential functional constituents for developing value-added products [3]. Onion by-products have been an intriguing challenge for researchers aiming to create efficient reuse strategies for its bioactive compounds due to onion increased production and a relatively substantial amount of generated by-products without acceptable disposal.
Onion by-products have generally been recognized as a source of non-structural carbohydrates, dietary fibers, polyphenols, and flavor compounds. Bioactive compounds such as phenolics, flavonoids, and anthocyanins are abundant in red onions and their dry outer layers. Their quantities in the skin of red onion are higher than in the edible portion because of their preventive properties against soil microorganisms [4]. The phenolic compounds in the red onion skin mainly consist of flavonoids. They include two main groups, namely, flavonols (such as quercetin, kaempferol, and its glucoside derivatives) and anthocyanins (especially cyanidin derivatives) [5]. Flavonols are generally found in glycosylated forms; the two most frequent quercetin forms in red onion skin are quercetin 4′-O-β-D-glucoside and quercetin 3,4′-O-β-D-diglucoside, which account for 80–85% of the total flavonoid content [1]. Cyanidin 3-glucoside is the major anthocyanin found in red onion skin. Smaller quantities of cyanidin 3-laminaribioside, peonidin, and pelargonidin glucosides are also present [6]. Red onion skins may be a source of natural colorants that can be extracted using various methods and utilized in foods as a substitute for synthetic compounds. These red onion skins can be a natural, low-cost, and widely available source of beneficial ingredients, including antioxidants [7].
Anthocyanins form an important group of water-soluble plant pigments and are used as food colorants. Additionally, anthocyanins have health-promoting effects such as anti-cancer, anti-inflammatory, antidiabetic, anti-obesity, and enzyme inhibitory effects, contribute to the prevention of cardiovascular disease, and have powerful antioxidant properties [8].
Different methods have been used to obtain phytochemicals, and extraction is the most important stage in providing bioactive compounds. Developing effective extraction procedures is crucial to improve the extraction of valuable compounds in terms of cost-effectiveness and environmental friendliness. The principal elements to consider in extraction processes include matrix properties, solvent selection, temperature, liquid-to-solid ratio, pressure, and extraction time. The most common method for the extraction of bioactive compounds is solvent extraction (such as extraction based on ethanol and methanol) [9].
Solvent extraction is used to increase the extraction efficiency, extraction time, extraction quality, and solvent consumption. Anthocyanins are more soluble in polar solvents than in non-polar solvents. In addition, because anthocyanins are unstable in alkaline solutions, highly acidic aqueous solvents are used. Due to the swelling of the tissue walls, adding acid to a solvent enhances the extraction yield [10]. Aqueous ethanol (50 to 75%) is often used to extract flavonoids from onion skin waste. Temperature, extraction duration, and the solvent-to-raw material ratio also affect the extraction of flavonoids from onion skin waste [11].
In the current study, a conventional solvent extraction method with four variable factors was developed (ethanol concentration, citric acid, temperature, and time). Furthermore, a central composite design (CCD) was employed to optimize the extraction technique and enhance the antioxidant activity. Anthocyanins extraction from red onion skin extracts under stirring was also studied for a more efficient solid/liquid extraction of bioactive compounds. This research offers new insights into the impact of conventional extraction methods on and the determination of the optimal extraction conditions for anthocyanin-rich by-products.

2. Materials and Methods

2.1. Reagents and Chemicals

HPLC-grade methanol, ethanol, Folin–Ciocalteu reagent, glacial acetic acid, 2,2-diphenyl-1-picrylhydrazyl (DPPH), 6-hydroxy2,5,7,8 tetramethylchromane-2-carboxylic acid (Trolox), gallic acid, potassium chloride, sodium nitrite, sodium hydroxide, sodium bicarbonate, sodium acetate, sodium carbonate, aluminum chloride were obtained from Sigma Aldrich Steinheim (Darmstadt, Germany). All other reagents used in the experiments were of analytical grade.

2.2. Red Onion Skins Preparation

Red onions were purchased from a local market in Galați, Romania. The outer layers of the red onions were collected, washed with ultrapure water, and dried for 2 h at 40 °C in a typical oven (Stericell 111, MMM Medcenter, München, Germany) to a moisture content of 11.0%. The red onion skins were powdered (mean particle diameter of 1 mm), stored at room temperature in an airtight glass jar in the dark, and utilized for extraction.

2.3. Conventional Solvent Extraction

The extraction was carried out using 1 g of red onion skin and 15 mL of ethanol in various concentrations, ranging from 6.36 to 73.63%. The plant material-to-solvent ratio was 1 to 15. Each extraction was acidified with a citric acid solution (ratio 14:1, v/v), using varying quantities from 0.05 to 2.64%. The extractions were carried out using an orbital shaker (SI-300R Medline Scientific, Chalgrove, UK) at 150 rpm at 16.47–58.52 °C for 10 to 234.54 min. The samples were centrifuged for 10 min at 14,000 rpm and 4 °C using a Hettich Universal 320R equipment, Germany, and the supernatant was phytochemically examined.

2.4. Determination of the Total Anthocyanins Content (TAC)

TAC was calculated using the pH differential method with two reagents, i.e., potassium chloride buffer (pH 1.0) and sodium acetate buffer (pH 4.5). The absorbances at 520 and 700 nm were measured using a UV–VIS spectrophotometer (Libra S22, Biochrom, Cambridge, UK).
The total anthocyanin content (TAC) was expressed in mg cyanidin 3-O-glucoside (C3G)/g dry weight (DW) and was calculated according to Equation (1) as described by Lee et al. [12], with slight modifications.
TAC mg / g = A × M W × D F × V t Ɛ × 1 × M
where A is the difference between (A520–A700) at pH 1.0 and (A520–A700) at pH 4.5, MW is the molecular weight (449.2 g/mol) of cyanidin-3-glucoside, DF is the dilution factor, Vt is the total volume (mL), Ɛ is the molar extinction coefficient (26,900) of cyanidin-3-glucoside, l is the path length, and M is the weight of red onion skins (g).

2.5. Determination of the Antioxidant Activity (AA)

The DPPH free radical-scavenging method was used to determine the antioxidant activity, which was expressed as mM Trolox Equivalents (TE)/g DW [13]. To measure the in vitro antioxidant activity, 100 µL of the extract was mixed with 3.9 mL of a DPPH stock solution. The mixture was then kept at room temperature for 30 min in complete darkness. The absorbance was measured at 515 nm, and the results were quantified using a Trolox calibration curve.

2.6. Experimental Design

The Central Composite Design (CCD) method was used to determine experimentally the antioxidant activity and optimize the TAC in the red onion skins extract. A central component of five factors, three central points, and the design of 21 experimental variants were used in an experimental factorial model. Table 1 shows the maximum and minimum values of the variables explored in the experimental plan in their current and coded forms. In addition, for response variables, the CCD creates a quadratic model.
A second-order polynomial model (2) can be used to represent the software used to test the experimental conditions:
R = b 0 + i n b i   · x i + i = 1 n b i i · x i i 2 + b i j · x i · x j d
where R is the predicted response, b 0 is the intercept, b i , b i i , and b i j   are the regression coefficients, x i   and x j d are the independent variables analyzed, n is the number of factors.

2.7. Statistical Analysis

In the study, we utilized the statistical software Design Expert (v. 13) from Design-Expert® to examine the experimental model (Stat-Ease, Inc., Minneapolis, MN, USA). All analyses were carried out in triplicate, and the findings are expressed as mean ± standard deviation.

3. Results

A Central Composite Design (CCD) and surface response modeling were utilized to establish the ideal parameters for optimizing the extraction process. Additionally, the content of anthocyanins and the antioxidant activity were determined. The complete CCD matrix used to optimize the principal variables evaluated and the corresponding values are shown in Table 2.

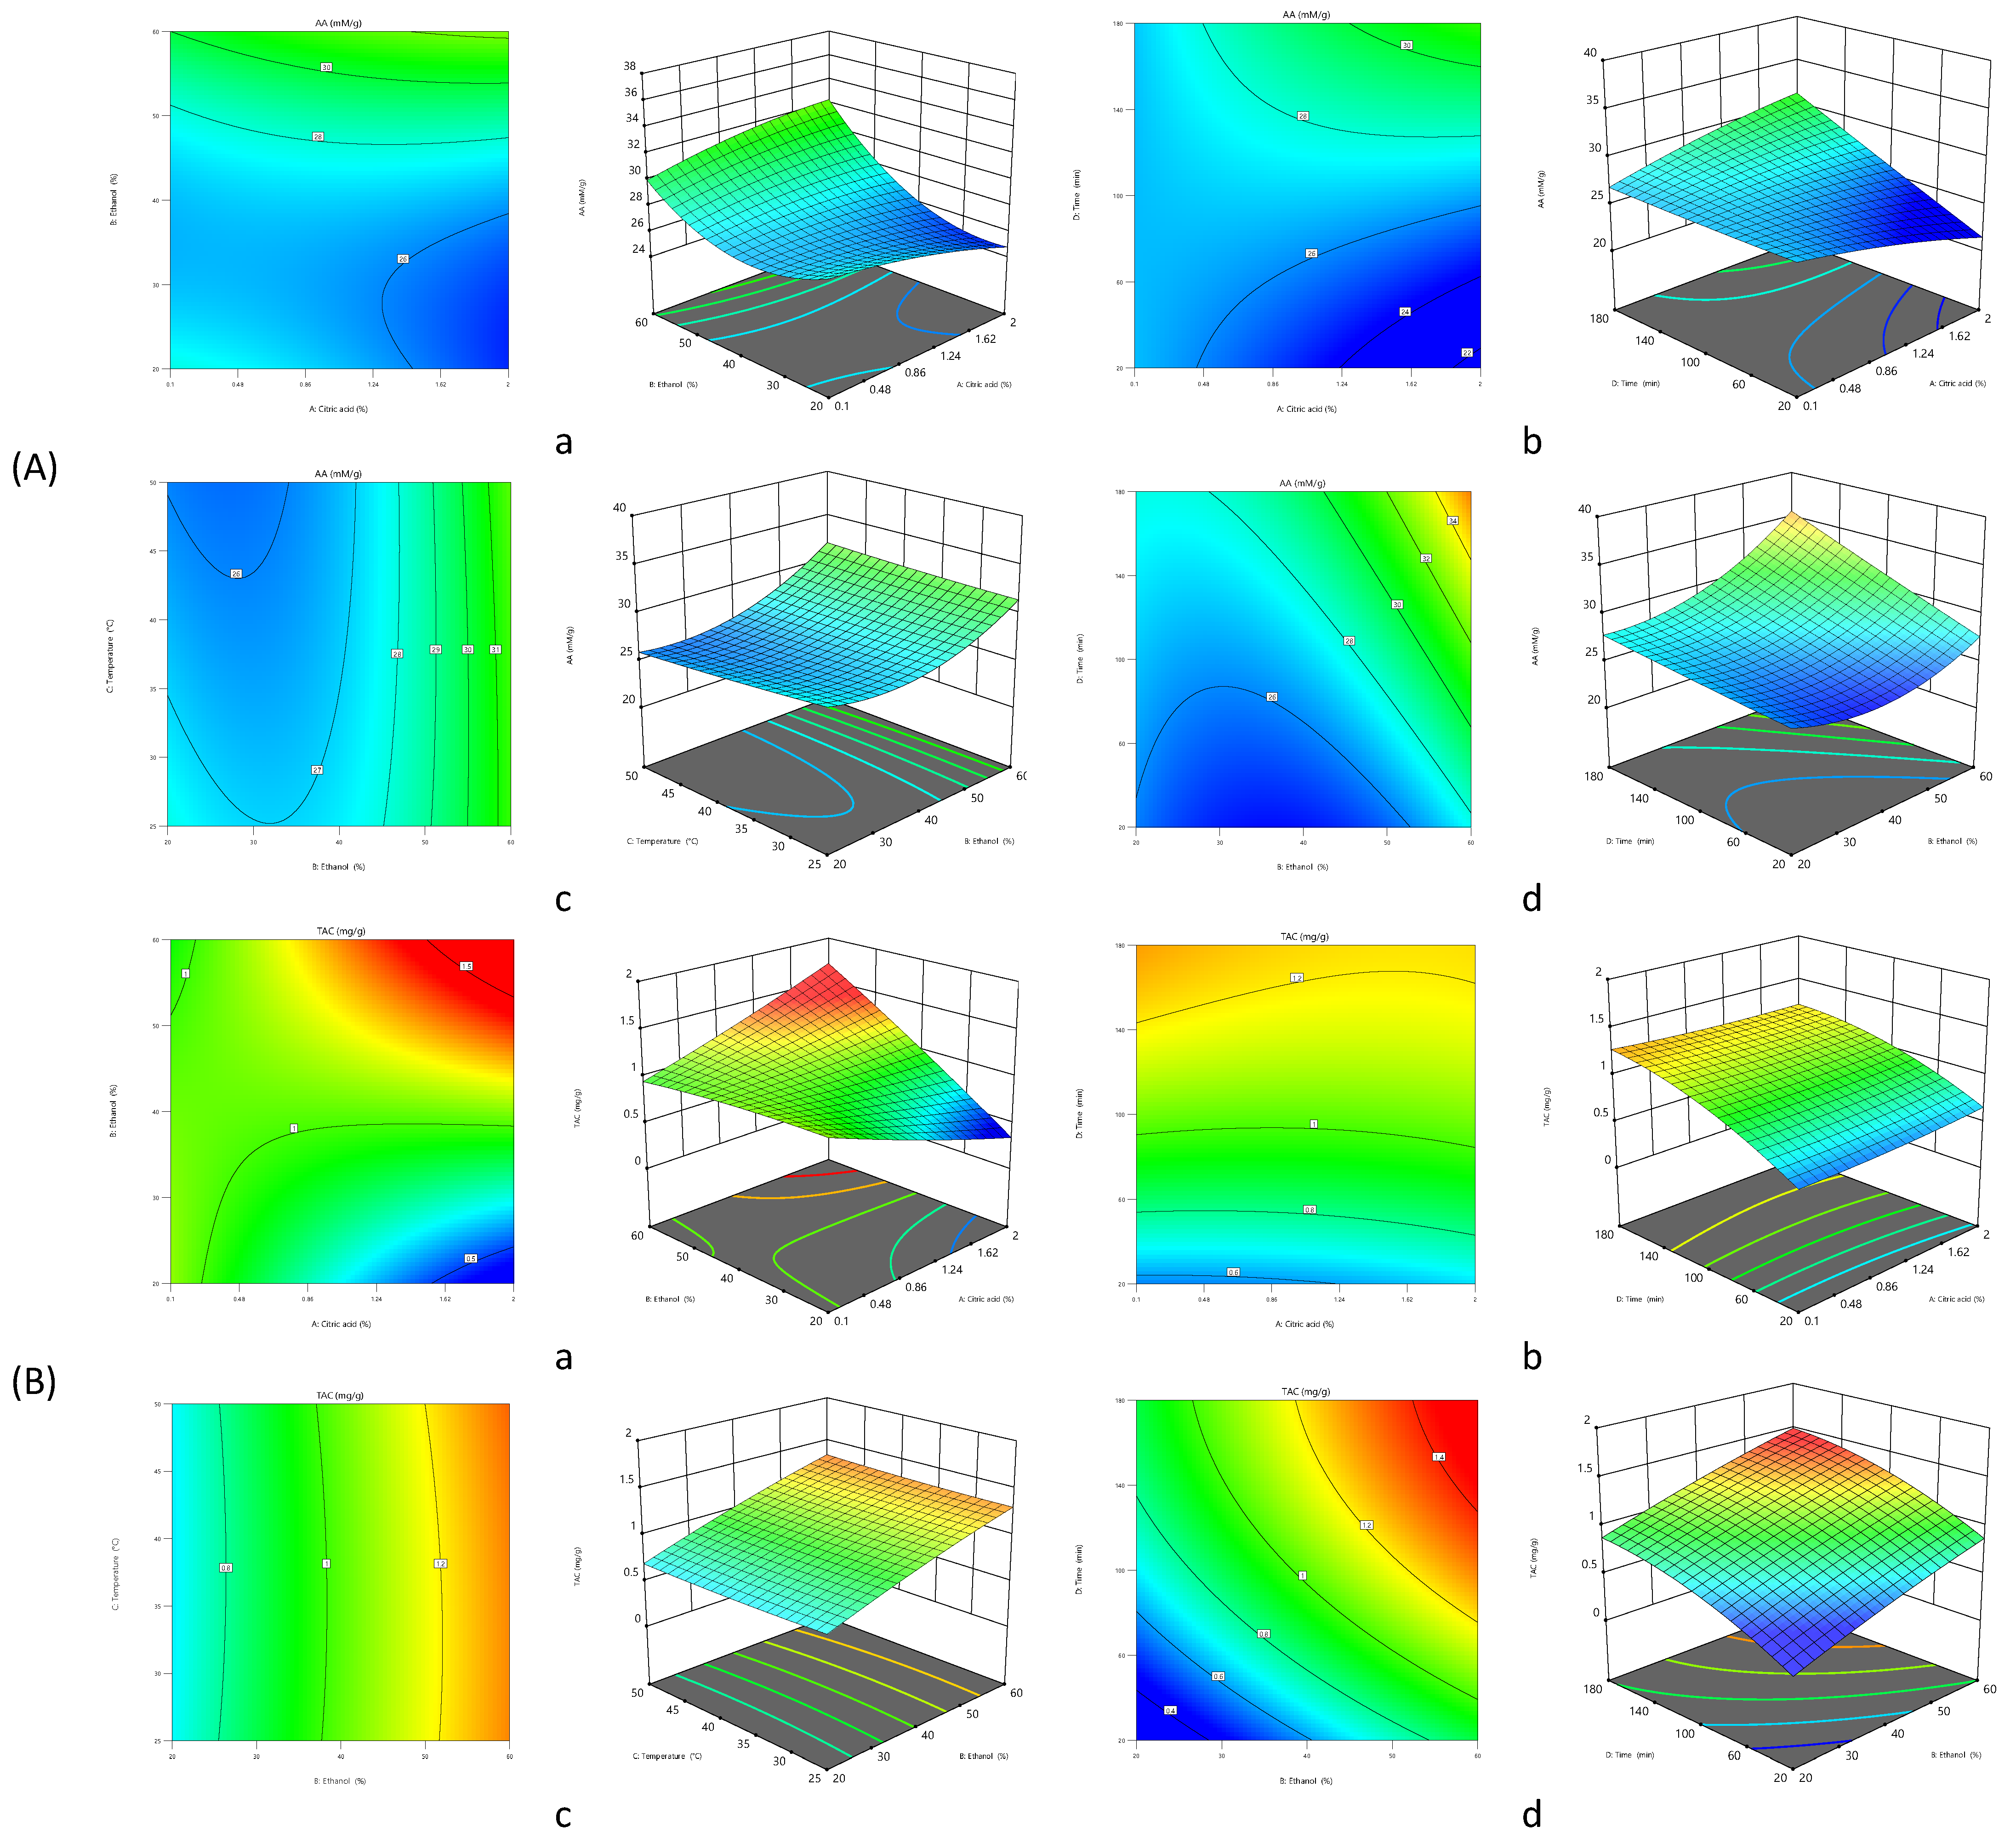
3.1. Influence of the Extraction Parameters on AA

This research aimed to determine the effect of a suitable optimal pattern of variables on the antioxidant activity of the extract from red onion skins. The antioxidant activity varied from 24.29 to 37.20 mM TE/g DW depending on the values of the various variables (Table 2). According to the variables of the extraction environment, the regression equations developed after the ANOVA explained the antioxidant activity values of the red onion skin extract obtained (Table 3). For the AA, the Model F-value of 112.73 implied the model was significant. In this case, B, C, D, AB, AC, AD, BC, BD, CD, A2, and B2 were significant model terms. According to the regression model used for the DPPH free radical-scavenging potential, the determination coefficient of R2 was 0.99, indicating that only 0.01 of the variation of the antioxidant activity could not be specified by the current model. The predicted determination coefficient R2 of 0.95 was in reasonable agreement with the adjusted determination coefficient R2 of 0.98.
After eliminating the minor model terms, a model reduction was accomplished. Equation (3) illustrates the model equation for the relationship between the antioxidant activity (R1) and the variables in coded units.
R1 (AA) = +26.92 + 2.41B − 0.3454C + 2.50D + 1.37AB + 2.41AD + 0.5912BC + 1.51BD − 0.5337CD − 0.4301A2 + 2.26B2
The regression equation’s b coefficients showed that the temperature had a minor negative effect on the antioxidant activity. Additionally, the interactions between temperature and time (CD) and temperature (C) and quadratic citric acid concentration (A2) significantly negatively affected the antioxidant activity of the red onion skins extract. Additionally, the antioxidant activity of the extract was enhanced by ethanol concentration (B) and extraction time (D). The interaction between citric acid concentration and ethanol concentration (AB), between citric acid concentration and time (AD), and between ethanol concentration and extraction time (BD) also had a favorable impact on the antioxidant activity. In contrast, citric acid concentration and temperature (AC) and ethanol concentration and temperature (BC) moderately affected the antioxidant activity.
The correlation between the independent and dependent variables was predicted using second-order contour plots (Figure 1A), which were also used to show the synergistic effects of the independent variables on the antioxidant activity of the extract obtained. The three-dimensional response area describes the correlative impact of the chosen parameters on the extract’s antioxidant activity.
Figure 1A displays the 3D surface and second-order contour plots for the AA determination. Figure 1A(a,b) show that the ethanol concentration and time influenced the antioxidant activity; AA increased as the citric acid concentration decreased. The maximum antioxidant activity could be attained at a nearly 60% ethanol concentration and about 180 min extraction time. Further, as the plots show, lower extraction times and higher percentages of citric acid led to a decreased DPPH free radical-scavenging potential. Additionally, reducing the temperature and ethanol concentration decreased the red onion skin extract’s antioxidant activity (Figure 1A(c)). As shown in Figure 1A(d), the AA increased when the ethanol concentration increased at a constant extraction temperature. Higher temperatures may improve phenolic component solubility, resulting in an AA increase. Still, as temperature and time continued to rise, the extracted phenolic compounds started to degrade and stopped showing AA after reaching equilibrium, reducing AA levels.
The perturbation plot for several parameters illustrates how each element affected the current response (Figure 2a). When analyzing the deviation from a reference point, a slope with a large or curved inclination for a specific factor shows that the response is sensitive to this factor. At the same time, a relatively flat line demonstrates insensitivity to changes in this factor. In the perturbation graph, curve B appeared to be critical in determining AA, indicating that the impact of the ethanol value was very substantial. The curves A and C, corresponding to citric acid and temperature, respectively, indicated a lesser effect of these factors on the extraction than ethanol.

3.2. Influence of the Extraction Parameters on TAC

This study aimed to find the best parameters for extracting anthocyanins from red onion skins. The TAC ranged from 0.45 to 1.43 mg C3G/g DW, based on the experimental design (Table 2). Subsequently, from Table 3, it was noticed that for TAC, a Model F-value of 868.48 implied the model was significant, and p-values less than 0.05 implied that the model terms were significant. The ANOVA revealed that the significant model terms were B, D, AB, AD, A2, B2, C2, and D2. Only a 0.01 variation in TAC could not be explained by the existing model, according to the determinant coefficient of R2 = 0.99. Moreover, the predicted R2 of 0.98 agreed with the adjusted R2 of 0.99.
R2 (TAC) = +1.03 + 0.3114B + 0.3152D + 0.3727AB − 0.0386AD + 0.0247A2 − 0.0311B2 + 0.0148C2 − 0.1208D2
A model reduction was achieved by neglecting the insignificant model terms. Equation (4) represents the model equation showing the correlation between the TAC (R2) and the variables in coded units. The regression equation’s b coefficients showed that the ethanol concentration and extraction time positively affected the anthocyanins extraction. The interaction between citric acid and ethanol concentration (AB) had an appreciably positive effect on anthocyanins extraction. In contrast, citric acid concentration (A2) and temperature (C2) had a more negligible contribution. Furthermore, moderately negative effects on the anthocyanins yield were shown by the interaction between citric acid concentration and extraction time (AD), between ethanol concentration and ethanol concentration (B2), and between time and time (D2).
The 3D surface plots of significant interaction effects display the ethanol concentration, acid, time, and temperature of extraction and the interaction among various factors influencing the conventional extraction of red onion skins anthocyanins, characterized by curved surfaces, as exhibited in Figure 1B(a–d).
In examining the effects of ethanol concentration and citric acid, it was noticed that the TAC increased as the ethanol concentration increased to 50% and the citric acid concentration was over 0.86% (Figure 1B(a)). According to the surface graphs, the concentration of anthocyanins was not influenced by temperature variation and extraction time but was influenced by ethanol concentration (Figure 1B(b,c)). The yield of anthocyanins constantly improved as the extraction time and ethanol concentration increased simultaneously, according to an analysis of the impacts of both variables (Figure 1B(d)).
The variation in the output response range concerning the reference point revealed how sensitive the response was to that variable. This plot helped to identify the factor that most influenced the TAC extraction response. The perturbations graph showing each independent variable’s impact revealed that time extraction and ethanol concentration significantly affected the TAC. To a lesser extent, the temperature also influenced it (Figure 2b).

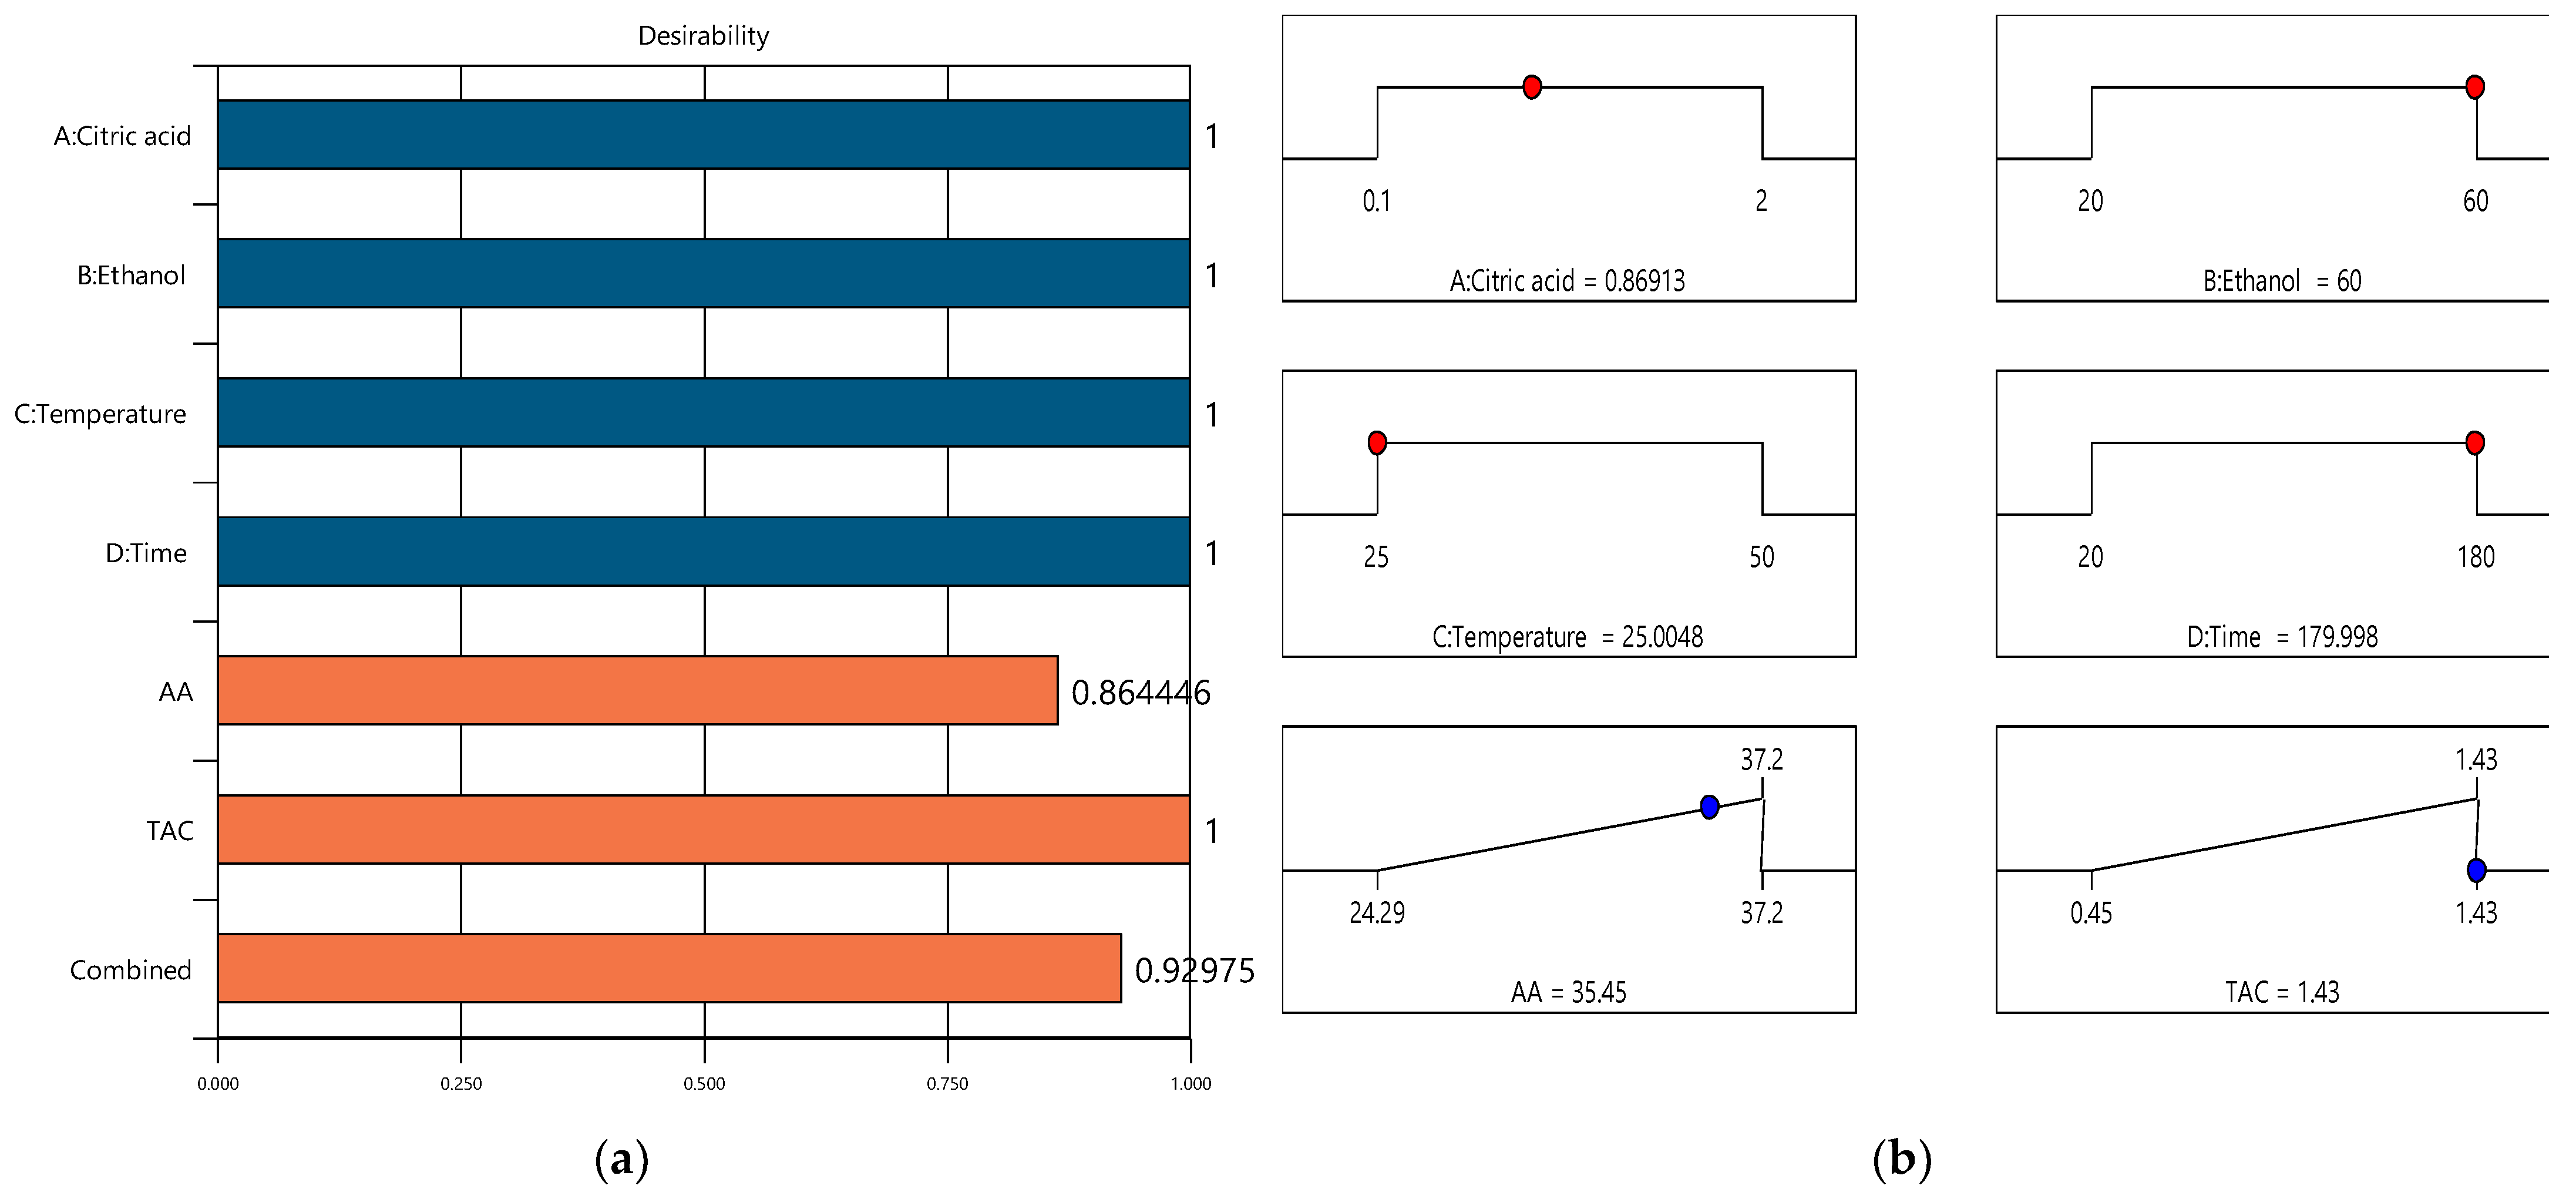
3.3. Optimization and Validation of the Extraction Parameters

The model recommended optimal factors based on maximizing the response desirability to validate the model equation. A desirability score of 1 (0.929) indicated that all selected conditions were correct (Figure 3, Table 4). The optimal conditions for generating the highest extraction of anthocyanins and the highest antioxidant activity were 0.87% citric acid, 60% ethanol, 25 °C, and an extraction time of 180 min.
The model predicted the maximum concentration of antioxidant activity and anthocyanins were 35.45 mM TE/g DW and 1.43 mg C3G/g DW, respectively. At the same time, the experimental data showed immediate responses to those predicted by the model, particularly 37.20 mM TE/g DW and 1.43 mg C3G/g DW (Table 4).

4. Discussion

This study optimized the conventional extraction process parameters to extract anthocyanins from red onion skins and enhance their antioxidant activity. Four variables (ethanol concentration, citric acid, temperature, and time) were used to optimize the extraction parameters screened by CCD. Under the optimum conditions, the antioxidant activity was at the highest level at an ethanol concentration of around 60% and a low temperature (25 °C). However, Corrales et al. [14] reported that extracting red grape skins at 70 °C with 50% ethanol concentration increased the extract’s antioxidant activity. These different results could potentially be due to variations in the principles or reaction times used to measure the antioxidant activity [15]. Our findings for red onion skin extracts’ antioxidant activity approach those of Viera et al. [16]. The most significant DPPH radical scavenging activity, measured by the authors as 116.58 ± 4.9 mol TE/g DW, was found in red onion skin extracts obtained by conventional extraction under ideal conditions of 80% ethanol and 120 min of extraction at 25 °C. In a different study, Ifesan [17] asserted that the activity to scavenge DPPH radicals was highest in an onion skin extract obtained by conventional extraction (maceration for 24 h at 25 °C with 80% ethanol), reaching a value of 27.76 ± 0.91 µg TE/mL. Prokopov et al. [18] used 70% aqueous ethanol, 15 min as the extraction time, and 45 °C to find that the extract of red onion skins exposed to ultrasound had higher antioxidant activity (490.54 ± 9.43 mM TE/g DW). Additionally, to assess the optimum antioxidant activity of onion solid waste extracts, Khiari et al. [19] utilized a conventional extraction method (40 °C, 6 h). In comparison to our findings, the 90% ethanol acidified with 0.1% HCl produced a decreased antiradical activity (0.32 ± 0.02 mM TE/g DW).
The extraction process is determined by the values of the extraction parameters employed while extracting bioactive compounds from plant matrices. Likewise, the different polarities of the compounds extracted using an experimental model may have an unpredictable effect on the extraction conditions. As a result, the extractions were conducted using solvents with varying polarities and varying the water and ethanol proportions. Adding water to ethanol may enhance the yield of anthocyanins extraction [20], and the resulting extracts are simple to introduce into biological systems. Highly glycosylated phenolics found in red onion skins cannot be extracted entirely only with pure organic solvents and require the application of mixtures containing water and acids. Water plays an important role in the swelling of plant material. In contrast, ethanol is responsible for disrupting the bonding between the solutes and the plant matrix, thus enabling a better mass transfer of the compounds. Therefore, a mixture of water and ethanol as solvent agents displays a synergistic effect that facilitates phenolics extraction. In addition, the citric acid used in a solvent mixture ruptures the cell membranes and releases phenol compounds [21]. The flavylium cation is the dominant species at pH = 3 or lower and contributes to the purple, orange, and red colors. A high solubility of anthocyanins in water is obtained by lowering the pH, increasing the structure transfer to the flavylium cation, and enhancing the stability. Hence, to optimize the extraction, citric acid is added to the extraction blend to acidify the medium [22]. When protic polar solvents such as ethanol are utilized, the acidification of the solvent improves the capacity to extract phenolics. The phenol–phenolate equilibrium moves toward the less polar phenyl form when the medium is acidified, making organic solvent extraction easier [23]. For anthocyanins, acidified ethanol is frequently used, which denatures the cell membranes while dissolving and stabilizing them [24]. Even anthocyanins that are structurally dependent on the medium’s pH could be extracted through acidification, which changes their solubility characteristics and affects their stability [23]. Therefore, the use of weak organic acids, such as citric acid, is recommended besides the addition of water to maximize the effectiveness of solvent extraction. As previously noted, acids are typically used for effective anthocyanin extraction. To avoid the degradation or change of the native forms of the phenolic compounds, weak organic acid citric acid at the concentration of 0.05–2.64% was chosen in the experiments. It is also important to mention that the ethanol and citric acid combination was preferred as a food-grade solvent component for phenolics extraction. For example, the extraction of anthocyanins in conditions such as 30% ethanol with 3% of citric acid and 24 h at room temperature has been reported to give good results for blueberry leaves extraction [25]. In the past, mixtures of ethanol and citric acid were employed to extract phenolic compounds, particularly anthocyanins [26,27,28], and ethanol and its combination with citric acid have been reported to contribute to a successful extraction.
The CCD findings revealed that ethanol concentration and extraction time positively affected anthocyanins extraction. The findings support the results of Khazaei et al. [29], who found that by increasing the ethanol percentage and time, the TAC increased, which indicated a positive effect on anthocyanins extraction. In a Box–Behnken optimization study [30], 90% aqueous glycerol extracts of red onions under optimum sonication conditions with a 90/1 solvent/solid ratio at 45 °C for 60 min generated a high concentration of total pigments (1.87 ± 0.39 mg C3G/g DW). The TAC of the red onion skin extract reported by Bordin Viera et al. [31] was greater than that obtained in the present study, ranging from 0.82 to 4.31 mg C3G/g DW. Using ultrasound extraction, the anthocyanin yield was greater as the ethanol concentration increased (60–80%).
In addition, it was observed that the extraction temperature displayed a minor effect on the extraction yield of anthocyanins. Backes et al. [32] revealed that mild temperatures and a high content of ethanol increased the yield of anthocyanins extraction. Therefore, the authors confirmed that a solvent consisting of ethanol 100% acidified with citric acid, mixed and centrifuged with a powdered sample in a solid/liquid ratio of 50 g/L for 13.74 min at 35.64 °C was the optimal analytical factor to increase the TAC in extracts from fig skin (a by-product of fruit). Higher temperatures damage anthocyanins (may cause their degradation) and result in a loss in yield, according to several earlier studies [33,34].
In our study, the TAC range was close to the one obtained by Oancea and Drághici [20], that reported 0.99 mg C3G/g fresh matter for the outer skins of the Sibiu red onion (Allium cepa L.) cultivar after extraction at 4 °C for 2 h with a mixture of ethanol/acetic acid/water (50:8:42, v/v/v), but lower than that reported by Samir et al. [35] (20 mg C3G/100 g), who used acidified ethanol with 1.5 N HCl (85:15, v/v) by maceration at 4 °C for 24 h.
The concentration of anthocyanins in the red onion skin extracts obtained through conventional extraction was examined by Viera et al. [16]. The extract obtained using 60% ethanol with an extraction time of 60 min at 25 °C yielded a concentration of anthocyanins of 470.2 ± 16.2 mg C3G/100 g DW. Additionally, with 90 min of extraction using 70% ethanol at 40 °C provided a more significant amount of anthocyanins extracted from red onion skins (847.47 ± 34.23 mg C3G/100 g DW) [36]. Makris [37] obtained a higher TAC of 183.85 mg C3G/100g DW by conventional extraction under the optimal conditions of 25 °C and 3.7 h extraction time from onion skins extract using 60% ethanol. Furthermore, the cultivar/origin of the plant material and its extraction conditions impact the amount of the extracted bioactive compounds.
According to the results of the optimization experiment, increasing ethanol concentration and time (up to 2 h) can be favorable to achieve a higher antioxidant activity. These findings are in agreement with the study conducted by Bordin Viera et al. [31], who suggested that ethanol concentration has a significant influence on the DPPH scavenging activity. Therefore, the red onion skin extracts obtained with ethanol at 20%, 40%, and 60% presented antioxidant activities of 26.12, 44.47, and 83.27 µmol TE/g DW, respectively.

5. Conclusions

A CCD and response surface methodology was used to optimize the variables of the conventional solvent extraction process (citric acid concentration—0.87%, ethanol concentration—60%, temperature—25 °C, and extraction time—179.99 min) to obtain red onion skin extracts with a high content of anthocyanins and high levels of antioxidant activity. The interaction of optimal time, temperature and acid and solvent concentrations improved the extraction of the antioxidant compounds yielding higher concentrations of anthocyanins (1.43 mg C3G/g DW) and DPPH radical scavenging activity levels (37.20 mM TE/g DW).
The optimization of the extraction process proved that the conventional solvent extraction could be an effective method for obtaining valuable extracts from natural and inexpensive sources such as food by-products with potential antioxidant and free radical scavenging activities.
These findings display an economically efficient extraction considering the low cost of by-product materials. Due to the high concentration of functional bioactive components in red onion skins, these compounds have a variety of uses in the food, pharmaceutical, and nutraceutical industries.

Author Contributions

Conceptualization, F.S., O.E.C. and G.R.; methodology, F.S. and O.E.C.; software, O.E.C. and I.A.; validation, O.E.C. and I.A.; formal analysis, F.S.; investigation, F.S.; resources, G.E.B.; data curation G.R. and N.S.; writing—original draft preparation F.S. and I.A.; writing—review and editing, G.R. and N.S.; visualization, N.S.; supervision, G.E.B. All authors have read and agreed to the published version of the manuscript.

Funding

This research received no external funding.

Institutional Review Board Statement

Not applicable.

Informed Consent Statement

Not applicable.

Data Availability Statement

The data supporting this study’s findings are available from the corresponding author (G.R.) upon reasonable request.

Acknowledgments

The results of this work have been presented to the 10th edition of the Scientific Conference organized by the Doctoral Schools of “Dunarea de Jos” University of Galati (SCDS-UDJG) http://www.cssd-udjg.ugal.ro/ (accessed on 9 April 2022) that will be held on 9th and 10th of June 2022, in Galati, Romania.

Conflicts of Interest

The authors declare no conflict of interest.

References

  1. Pérez-Gregorio, R.M.; García-Falcón, M.S.; Simal-Gándara, J.; Rodrigues, A.S.; Almeida, D.P.F. Identification and quantification of flavonoids in traditional cultivars of red and white onions at harvest. J. Food Compos. Anal. 2010, 23, 592–598. [Google Scholar] [CrossRef]
  2. Sharma, K.; Mahato, N.; Nile, S.H.; Lee, E.T.; Lee, Y.R. Economical and environmentally-friendly approaches for usage of onion (Allium cepa L.) waste. Food Funct. 2016, 7, 3354–3369. [Google Scholar] [CrossRef] [PubMed]
  3. Galanakis, C.M. Recovery of high added-value components from food wastes: Conventional, emerging technologies and commercialized applications. Trends Food Sci. Technol. 2012, 26, 68–87. [Google Scholar] [CrossRef]
  4. Benítez, V.; Mollá, E.; Martín-Cabrejas, M.A.; Aguilera, Y.; López-Andréu, F.J.; Cools, K.; Terry, L.A.; Esteban, R.M. Characterization of Industrial Onion Wastes (Allium cepa L.): Dietary Fibre and Bioactive Compounds. Plant Foods Hum. Nutr. 2011, 66, 48–57. [Google Scholar] [CrossRef] [Green Version]
  5. Zill-e-Huma; Vian, M.A.; Fabiano-Tixier, A.-S.; Elmaataoui, M.; Dangles, O.; Chemat, F. A remarkable influence of microwave extraction: Enhancement of antioxidant activity of extracted onion varieties. Food Chem. 2011, 127, 1472–1480. [Google Scholar] [CrossRef]
  6. Ali, O.-H.; Al-sayed, H.; Yasin, N.; Afifi, E. Effect of Different Extraction Methods on Stablity of Anthocyanins Extracted from Red Onion peels (Allium cepa) and Its Uses as Food Colorants. Bull. Natl. Nutr. Inst. Arab. Repub. Egypt 2016, 47, 196–219. [Google Scholar] [CrossRef] [Green Version]
  7. Nile, A.; Gansukh, E.; Park, G.-S.; Kim, D.-H.; Hariram Nile, S. Novel insights on the multi-functional properties of flavonol glucosides from red onion (Allium cepa L) solid waste—In vitro and in silico approach. Food Chem. 2021, 335, 127650. [Google Scholar] [CrossRef]
  8. Ozkan, G.; Franco, P.; De Marco, I.; Xiao, J.; Capanoglu, E. A review of microencapsulation methods for food antioxidants: Principles, advantages, drawbacks and applications. Food Chem. 2019, 272, 494–506. [Google Scholar] [CrossRef]
  9. Mourtzinos, I.; Prodromidis, P.; Grigorakis, S.; Makris, D.P.; Biliaderis, C.G.; Moschakis, T. Natural food colorants derived from onion wastes: Application in a yoghurt product. Electrophoresis 2018, 39, 1975–1983. [Google Scholar] [CrossRef]
  10. Ghareaghajlou, N.; Hallaj-Nezhadi, S.; Ghasempour, Z. Red cabbage anthocyanins: Stability, extraction, biological activities and applications in food systems. Food Chem. 2021, 365, 130482. [Google Scholar] [CrossRef]
  11. Benito-Román, Ó.; Blanco, B.; Sanz, M.T.; Beltrán, S. Freeze-dried extract from onion (Allium cepa cv. Horcal) skin wastes: Extraction intensification and flavonoids identification. Food Bioprod. Process. 2021, 130, 92–105. [Google Scholar] [CrossRef]
  12. Lee, J.; Durst, R.W.; Wrolstad, R.E. Determination of Total Monomeric Anthocyanin Pigment Content of Fruit Juices, Beverages, Natural Colorants, and Wines by the pH Differential Method: Collaborative Study. J. AOAC Int. 2005, 88, 1269–1278. [Google Scholar] [CrossRef] [Green Version]
  13. Horincar, G.; Enachi, E.; Stănciuc, N.; Râpeanu, G. Extraction and characterization of bioactive compounds from eggplant peel using ultrasound—Assisted extraction. Ann. Univ. Dunarea Jos Galati. Fascicle VI-Food Technol. 2019, 43, 40–53. [Google Scholar] [CrossRef]
  14. Corrales, M.; García, A.F.; Butz, P.; Tauscher, B. Extraction of anthocyanins from grape skins assisted by high hydrostatic pressure. J. Food Eng. 2009, 90, 415–421. [Google Scholar] [CrossRef]
  15. Etsuo, N. Antioxidant capacity: Which capacity and how to assess it? J. Berry Res. 2011, 1, 169–176. [Google Scholar] [CrossRef] [Green Version]
  16. Viera, V.B.; Piovesan, N.; Rodrigues, J.B.; Mello, R.; De, O.; Prestes, R.C.; Santos, R.C.; Vaucher, A.; Hautrive, T.P.; Kubota, E.H. Extraction of phenolic compounds and evaluation of the antioxidant and antimicrobial capacity of red onion skin (Allium cepa L.)|Request PDF. Int. Food Res. J. 2017, 24, 990–999. [Google Scholar]
  17. Ifesan, B.O.T. Chemical Composition of Onion Peel (Allium cepa) and its Ability to Serve as a Preservative in Cooked Beef. Hum. J. 2017, 7, 25–34. [Google Scholar]
  18. Prokopov, T.; Slavov, A.; Petkova, N.; Yanakieva, V.; Bozadzhiev, B.; Taneva, D. Study of onion processing waste powder for potential use in food sector. Acta Aliment. 2018, 47, 181–188. [Google Scholar] [CrossRef] [Green Version]
  19. Khiari, Z.; Makris, D.P.; Kefalas, P. An Investigation on the Recovery of Antioxidant Phenolics from Onion Solid Wastes Employing Water/Ethanol-Based Solvent Systems. Food Bioprocess Technol. 2007, 2, 337. [Google Scholar] [CrossRef]
  20. Oancea, S.; Drághici, O. pH and thermal stability of anthocyanin-based optimised extracts of Romanian red onion cultivars. Czech J. Food Sci. 2013, 31, 283–291. [Google Scholar] [CrossRef] [Green Version]
  21. Hasbay, I.; Galanakis, C.M. Recovery technologies and encapsulation techniques. In Polyphenols: Properties, Recovery, and Applications; Galanakis, C.M., Ed.; Woodhead Publishing: Cambridge, UK, 2018; pp. 233–264. ISBN 978-0-12-813573-0. [Google Scholar] [CrossRef]
  22. Jeya Krithika, S.; Sathiyasree, B.; Beniz Theodore, E.; Chithiraikannu, R.; Gurushankar, K. Optimization of extraction parameters and stabilization of anthocyanin from onion peel. Crit. Rev. Food Sci. Nutr. 2022, 62, 2560–2567. [Google Scholar] [CrossRef]
  23. Santos-Buelga, C.; Gonzalez-Manzano, S.; Dueñas, M.; Gonzalez-Paramas, A.M. Extraction and Isolation of Phenolic Compounds. Methods Mol. Biol. 2012, 864, 427–464. [Google Scholar] [CrossRef]
  24. Dai, J.; Mumper, R.J. Plant Phenolics: Extraction, Analysis and Their Antioxidant and Anticancer Properties. Molecules 2010, 15, 7313–7352. [Google Scholar] [CrossRef]
  25. Routray, W.; Orsat, V. MAE of Phenolic Compounds from Blueberry Leaves and Comparison with Other Extraction Methods. Ind. Crops Prod. 2014, 58, 36–45. [Google Scholar] [CrossRef]
  26. Gao, L.; Mazza, G. Extraction of Anthocyanin Pigments from Purple Sunflower Hulls. J. Food Sci. 1996, 61, 600–603. [Google Scholar] [CrossRef]
  27. Nicoué, E.E.; Savard, S.; Belkacemi, K. Anthocyanins in Wild Blueberries of Quebec: Extraction and Identification. J. Agric. Food Chem. 2007, 55, 5626–5635. [Google Scholar] [CrossRef]
  28. Fan, G.; Han, Y.; Gu, Z.; Chen, D. Optimizing Conditions for Anthocyanins Extraction from Purple Sweet Potato Using Response Surface Methodology (RSM). LWT Food Sci. Technol. 2008, 41, 155–160. [Google Scholar] [CrossRef]
  29. Khazaei, K.M.; Jafari, S.M.; Ghorbani, M.; Kakhki, A.H.; Sarfarazi, M. Optimization of Anthocyanin Extraction from Saffron Petals with Response Surface Methodology. Food Anal. Methods 2016, 9, 1993–2001. [Google Scholar] [CrossRef]
  30. Katsampa, P.; Valsamedou, E.; Grigorakis, S.; Makris, D.P. A green ultrasound-assisted extraction process for the recovery of antioxidant polyphenols and pigments from onion solid wastes using Box–Behnken experimental design and kinetics. Ind. Crops Prod. 2015, 77, 535–543. [Google Scholar] [CrossRef]
  31. Bordin Viera, V.; Piovesan, N.; Mello, R.D.O.; Barin, J.S.; Fogaça, A.D.O.; Bizzi, C.A.; De Moraes Flores, É.M.; Dos Santos Costa, A.C.; Pereira, D.E.; Soares, J.K.B.; et al. Ultrasonic assisted extraction of phenolic compounds with evaluation of red onion skin (Allium cepa L.) antioxidant capacity. J. Culin. Sci. Technol. 2021, 19, 475–566. [Google Scholar] [CrossRef]
  32. Backes, E.; Pereira, C.; Barros, L.; Prieto, M.A.; Genena, A.K.; Barreiro, M.F.; Ferreira, I.C.F.R. Recovery of bioactive anthocyanin pigments from Ficus carica L. peel by heat, microwave, and ultrasound based extraction techniques. Food Res. Int. 2018, 113, 197–209. [Google Scholar] [CrossRef] [PubMed]
  33. Pinelo, M.; Rubilar, M.; Jerez, M.; Sineiro, J.; Núñez, M.J. Effect of Solvent, Temperature, and Solvent-to-Solid Ratio on the Total Phenolic Content and Antiradical Activity of Extracts from Different Components of Grape Pomace. J. Agric. Food Chem. 2005, 53, 2111–2117. [Google Scholar] [CrossRef] [PubMed]
  34. Cacace, J.; Mazza, G. Optimization of Extraction of Anthocyanins from Black Currants with Aqueous Ethanol. J. Food Sci. 2003, 68, 240–248. [Google Scholar] [CrossRef]
  35. Samir, R.M.; Osman, A.; El-Sayed, A.I.; Algaby, A.M. Physicochemical properties and antimicrobial effects of Roselle corolla, onion peels and peanut skins anthocyanins. Zagazig J. Agric. Res. 2019, 46, 769–781. [Google Scholar] [CrossRef] [Green Version]
  36. Oancea, S.; Radu, M.; Olosutean, H. Development of ultrasonic extracts with strong antioxidant properties from red onion wastes. Rom. Biotechnol. Lett. 2020, 25, 1320–1327. [Google Scholar] [CrossRef]
  37. Makris, D.P. Optimisation of Anthocyanin Recovery from Onion (Allium cepa) Solid Wastes Using Response Surface Methodology. J. Food Technol. 2010, 8, 183–186. [Google Scholar] [CrossRef]
Figure 1. Second-order contour and 3D surface plots screening the variables’ effect on the antioxidant activity (A) and extraction yield of anthocyanins (B).
Inventions 07 00089 g001
Figure 2. Perturbation graphs representing the effect of each independent variable (A, B, C, and D) on AA (a) and TAC (b) of the red onion skins extract.
Inventions 07 00089 g002
Figure 3. Optimization desirability bar chart (a) and ramps (b).
Inventions 07 00089 g003
Table 1. Range of values for the factors investigated and encoded values.
CodeIndependent VariablesUnitsMinimumMaximumCoded LowCoded High
ACitric acid%0.05002.64−1 = 0.10+1 = 2.00
BEthanol%6.3673.63−1 = 20.00+1 = 60.00
CTemperature°C16.4758.52−1 = 25.00+1 = 50.00
DTimemin10.00234.54−1 = 20.00+1 = 180.00
Table 2. Actual values of the principal variables analyzed in the CCD matrix.
RunFactor 1 A: Citric Acid %Factor 2 B: Ethanol %Factor 3 C: Temperature °CFactor 4 D: Time minResponse 1 AA mM TE/g DWResponse 2 TAC mg C3G/g DW
11403710026.921.02
214016.4710027.711.05
3260502027.241.34
4173.633710037.21.43
51403710026.841.03
60.120502028.70.6
7260252025.011.32
80.1602518032.531.18
91403710026.741.02
1014058.5210026.731.09
112.64403710025.321.11
120.120252030.390.62
132202518029.510.52
1416.363710029.410.45
150.1605018031.071.21
16140371024.290.52
171403710026.731.04
180.05403710026.631.05
1914037234.5431.141.22
201403710027.641.01
212205018027.240.51
Table 3. ANOVA for the reduced quadratic model for AA and TAC.
AATAC
SourceSSdfMSF-Valuep-ValueSourceSSdfMSF-Valuep-Value
Model172.391412.31112.73<0.0001 aModel1.84140.1316868.48<0.0001 a
A-Citric acid0.112610.11261.030.3491A-Citric acid0.000110.00010.90030.3793
B-Ethanol32.49132.49297.46<0.0001B-Ethanol0.541010.54103569.82<0.0001
C-Temperature1.6311.6314.910.0083C-Temperature0.000610.00063.650.1045
D-Time19.45119.45178.09<0.0001D-Time0.309610.30962043.28<0.0001
AB4.2214.2238.590.0008AB0.311110.31112052.61<0.0001
AC1.1911.1910.920.0163AC3.422 × 10−713.422 × 10−70.00230.9636
AD19.08119.08174.65<0.0001AD0.004910.004932.310.0013
BC2.8012.8025.600.0023BC0.000810.00085.280.0613
BD4.5414.5441.590.0007BD0.000010.00000.10770.7540
CD2.2812.2820.870.0038CD0.000110.00010.32990.5866
A21.2711.2711.590.0144A20.004210.004227.540.0019
B276.35176.35698.99<0.0001B20.014410.014495.30<0.0001
C20.192610.19261.760.2325C20.003310.003321.480.0036
D20.044210.04420.40450.5483D20.117510.1175775.31<0.0001
Residual0.655460.1092 Residual0.000960.0002
Lack of Fit0.076720.03830.26490.7797 bLack of Fit0.000420.00021.500.3271 b
Pure Error0.578740.1447 Pure Error0.000540.0001
Cor Total173.0520 Cor Total1.8420
Sum of Squares—SS; Mean Square—MS; a Significant; b Not significant.
Table 4. Validation of the mathematical model.
Dependent VariablePredicted Value95% Confidence IntervalsExperimental Value
AA (mM TE/g DW)35.4524.29–37.2037.20
TAC (mg C3G/g DW)1.430.45–1.431.43
Publisher’s Note: MDPI stays neutral with regard to jurisdictional claims in published maps and institutional affiliations.

