Article

Evaluation of the Operating Modes of the Urban Electric Networks in Dushanbe City, Tajikistan

by
Saidjon Shiralievich Tavarov
1,*,
Inga Zicmane
2,
Svetlana Beryozkina
3,
Seepana Praveenkumar
4,*,
Murodbek Safaraliev
5 and
Shahnoza Shonazarova
1
1
Institute of Engineering and Technology, South Ural State University, 76, Lenin Prospekt, 454080 Chelyabinsk, Russia
2
Faculty of Power and Electrical Engineering, Riga Technical University, 1048 Riga, Latvia
3
College of Engineering and Technology, American University of the Middle East, Egaila 54200, Kuwait
4
Department of Nuclear and Renewable Energy, Ural Federal University Named After the First President of Russia Boris Yeltsin, 19 Mira Street, 620002 Ekaterinburg, Russia
5
Department of Automated Electrical Systems, Ural Federal University, 19 Mira Street, 620002 Ekaterinburg, Russia
*
Authors to whom correspondence should be addressed.
Inventions 2022, 7(4), 107; https://doi.org/10.3390/inventions7040107
Submission received: 6 November 2022 / Revised: 14 November 2022 / Accepted: 15 November 2022 / Published: 18 November 2022
(This article belongs to the Special Issue Data Analytics in the Energy Sector)

Abstract

:
Currently, energy saving has become an acute problem all over the world. Due to the rapid development of both the energy and information technology sectors, as well as an increase in the electricity demand, the electric distribution system is facing problems caused by stricter requirements for electricity quality, reliability, efficiency, and sustainability. Therefore, the use of energy-saving technologies, both the improvement of existing ones and the application of new ones, is one of the main reserves for electricity saving in power supply systems. This study is devoted to the evaluation of the operating modes of transformer substations of the 6–10 kV electric distribution network in Dushanbe city, based on the results of control winter measurements and the dependence of the low coefficient of active power in transformer substations. It has been observed that, with a low coefficient of active power in transformer substations, when transmitting electricity from substation busbars to transformer substations of a final consumer via overhead transmission lines (an average length of 5 km), the voltage loss exceeds the maximum permissible values. When transmitting electricity via cable lines, the voltage losses are within the limit of 5%. However, a low active power factor may be the reason for an increase in capacitive currents, followed by the command of single-phase earth fault currents. Due to the low active power factor, the increase in voltage losses and useful power losses leads to the inefficient operating modes of the transformer substations.

1. Introduction

In recent years, energy saving has become one of the main directions of technical policies in all industrialized countries all over the world. If in the past, the use of energy was characterized by low efficiency, significant energy losses, and lack of attention to the impact on the environment in most cases, nowadays considerable attention is being paid to the development of a new energy strategy. Its primary goal includes the consideration of all the above-mentioned factors against the background of the following two requirements, which are closely interrelated:
-
Provide energy resources to end users and maintain the stability of their supply;
-
Protection of state energy security [1,2].
In addition, the sustainable development of the economy requires an increase in the production and consumption of fuel and energy resources. In the conditions of the established trend of rising energy prices and an increase in their share in the structure of the cost of commodity products and services, their effective use is a significant internal reserve that allows for increasing the competitiveness of the gross product and the living standard of the country’s population.
The factors of energy saving can be broadly divided into external and internal ones. External factors include the growth rates of the world economy, the dynamics of prices of hydrocarbon resources on the world market, global demand, the volume of exports of hydrocarbons, and the environmental situation in the world. The internal factors of energy saving are divided into two groups: a group of providing factors and a group of effective factors, having mainly two closely interrelated and interdependent aspects—an increase in resource reserves and a reduction in their consumption [1].
Energy saving in the power supply system has always been and continues to be an urgent task for the power supply organization, and for each industry, the share of the energy component in the cost of output is different. For example, in ferrous metallurgy, it is 40%, in mechanical engineering 20%, in water production 30%, etc. The economical consumption of electricity makes it possible to produce additional products, even when the share of the energy component in the cost is insignificant, while the damage caused by the under-output of energy is many times higher than its cost [3,4].
Nowadays, the global development of the electric power system is aimed at reducing electrical losses in all elements of the supply network, as well as at the rational use and utilization of consumed electricity for their own needs (the equipment of stations and substations). Therefore, the task of reducing electricity losses is one of the most trending issues in the planning and operation of distribution systems, and it has important technical and economic consequences. For instance, since the middle of the 2000s, there has been an intensive development of technologies for optimizing electricity consumption for the needs of substations and their energy-efficient disposal. The leaders in this direction are the countries of Europe, the USA, and China [1,2,3].
Numerous studies have shown that energy losses in all distribution electric networks of the world vary in the range of 3.7–26.7% of the total electricity consumption, depending on the country. It is much easier to reduce the power losses in electric networks than increase generating capacity, and energy efficiency is the cheapest resource of all [3].
It is necessary to consider the general specifics of the construction of urban distribution electric networks of Dushanbe and Tajikistan, which differ from European, USA, and Chinese electric networks in the following ways:
  • There is no possibility of using voltage classes that differ from the established standard values both up to 1000 V and higher. Thus, due to the large branching of the considered electrical networks and the complexity of the terrain (93% of the territory of Tajikistan has mountainous terrain), the voltage losses (∆U) often exceed 10% of the permissible set values. These restrictions do not allow to increase in the voltage of transformers (as, for example, it happens in China), thereby reducing voltage losses.
  • There is no possibility of using a combined voltage—AC/DC.
There are two main groups of measures aimed at reducing losses in distribution networks such as:
  • Short-term measures:
    -
    Identifying the weakest points in the distribution network and improving them;
    -
    Reducing the length of distribution feeders by relocating the distribution substation;
    -
    Installing additional transformers, etc.
  • Long-term measures:
    -
    Replacing the old transformers with new, more efficient ones;
    -
    Replacing the voltage level of 6/10 kV with 20 kV;
    -
    Collecting data about existing loads, operating conditions, forecast of expected loads, etc. [3], from which it becomes obvious that two distribution elements, such as lines and transformers, represent the most unprofitable component of the distribution network and, as a result, require a special study.
Energy saving in the power supply system has always been and remains to be an urgent task for the energy supply industry of Tajikistan [4,5]: each kW of saved power in the conditions of increasing electricity consumption in the country leads to a reduction in the cost of electricity [6,7,8,9], as well as the use of saved power for other purposes, including commercial, for export to neighboring countries.
A significant increase in the number of electric consumers occurred in the last few years in Dushanbe, including those with non-linear load nature, which led to an increase in reactive power consumption. Consequently, this led to an increase in the active power losses associated with a reduced capacity of power grid elements and voltage losses.
According to generally accepted principles, the solution to these problems can be achieved either by installing reactive power compensation devices in consumer nodes or by accurately forecasting energy consumption. The former can be achieved by optimally distributing the required reactive power and obtaining the required active power factor (cosφreq). The required reactive power must be determined based on the voltage transformation stage at the transformer substations. This can be solved in various ways. The second method involves the development of a model for predicting the energy consumption of urban electrical distribution networks, in particular, considering the residential consumers. In both cases, the obtained results should make it possible to improve both the energy efficiency of the city power grid by reducing voltage and power losses and increasing the reliability of the elements of the power supply system by increasing its reliability indicators [10,11,12,13].
The paper is organized as follows: the next Section describes the used materials and methods presenting a theoretical part of the energy efficiency assessment model of the city power grid and the algorithm for performing the calculation sequence. Section 3 covers the obtained computation results and a discussion of the practical part of the implementation. Section 4 summarizes the conclusions.

2. Materials and Methods

According to the data received from JSC “Dushanbe city electric networks”, from 2013 to 2021, an analysis of electricity consumption was conducted and technological losses of electricity in absolute (Figure 1) and relative (Figure 2) units were determined.
The dynamics of changes in electricity losses presented in relative units for the examined period in Figure 2 have a high value that demonstrates the inefficiency of the considered urban power grid. At the same time, it should be noted that, despite the launch of the Dushanbe CHP-2 in 2014, the volume of electricity losses does not decrease. It is confirmed by the fact that, in Dushanbe, the period with minimum critical ambient temperatures (heating season) is short.
In winter, even considering the operation of the Dushanbe CHPP-2, there is still a shortage of electricity in the country during a certain period and some of the country’s settlements receive electricity for a limited time, which creates a great inconvenience for the population of these places. The energy shortage is mainly due to the insufficient inflow of water into the reservoir of the Nurek HPP in winter, for the purpose of generating electricity, not only in the Nurek HPP, but also in the entire Vakhsh cascade of power stations. This problem with the commissioning of the Rogun Hydraulic Power Plant dam may be solved. However, the equipment of some of the rather old power stations of the Vakhsh cascade is largely outdated and requires radical reconstruction. Consequently, at the first stage, the start of commissioning the Rogun HPP units into operation, the problem of electricity shortage in the country will still more or less remain. According to agreements with the Islamic Republics of Afghanistan and Pakistan, a certain part of the capacity will be transferred to these countries. Additionally, there is a certain reserve of power, which is lost in the elements of the electrical networks of the power supply system during its transportation, due to unsatisfactory compensation of the reactive power.
At the same time, due to the increase in the number of electric consumers, in particular, with low reactive power coefficients and the duration of their switching on, the power losses are increasing because of the lack of accurate forecasts of electricity consumption (in particular, for household consumers), as well as the reactive power compensation facilities at substations in Dushanbe. This leads to issues such as increased voltage losses and electricity, in general, as well as the asymmetry of currents and voltages and reduced reliability. Therefore, the energy efficiency of the country’s power supply system should be primarily related to reducing power losses, improving the scheme of power transmission and distribution systems, and decentralizing the reactive power compensation.
It is known that the operating mode of the elements of power supply systems, i.e., in this case, the load of the CL and power transformers, affects the readings of the quality of electricity and the total loss of electricity both in a separate part and in general [14,15,16,17,18,19]. In turn, the safety of electricity consumers depends on the operating modes of the elements of urban electric networks, especially from distribution networks, since electricity consumers directly receive power from 6–10 kV electric networks.
In general, the indicator of reliability and safety of the consumers can be provided only if the quality of the electricity is observed, one of which is voltage. The factor influencing this indicator is the loss of electricity in the elements of the distribution network [20,21,22,23].
The analysis of the reasons for the deviations of operating parameters in the urban electric networks of Dushanbe shows that most of the operating modes of the equipment installed in these networks are outside the established regulatory rules, which leads to violations of electricity quality indicators. Non-compliance with the electricity quality affects the reliability of both electricity consumers and the entire electrical network. The resulting voltage deviations, both at the electrical installations of urban consumers and in the electrical network as a whole, give out significant electricity losses. The following should be noted:
-
Most of the 34 high-voltage substations with a voltage of 35 kV and higher installed for the power supply of Dushanbe city do not have compensation for the reactive power that affects the reliability of the electric networks.
-
The high-voltage power transformers and consumer power transformers must be equipped with automatic and manual voltage regulators to maintain the voltage in the load nodes. The so-called RUL-regulation under load changes the transformation coefficient of the transformer automatically when the load changes and SE-switching without excitation, changing the transformation coefficient of the transformer manually (maintenance personnel) for the summer and winter seasons. Most of these regulators are not performing their actions. The first is in high-voltage power transformers, due to incorrect settings, and secondly, the 3rd position is always set to +2.5%, regardless of the load changes.
To assess the operating mode of the substations of urban electric networks, depending on the nature of the loads, the control winter measurements were taken as initial data, since in winter, electricity consumption concerning summer measurements is relatively higher, due to connection reason of additional electrical loads to the city electrical network.
However, it should be noted that, during the control measurements at substations during the day, the load currents at the input and outgoing busbars, voltage, and temperature of transformers and outgoing feeders are measured by the on-duty substation of Dushanbe. Thus, there is no information on reactive power consumption, since it depends on the active power factor, as well as on the actual load of the transformers.
When conducting a study on the operating mode of the urban electric network of the city of Dushanbe to assess its condition by such factors as voltage losses and active power factor, it is necessary to have information about the actual electrical load and the amount of power consumption. When these parameters are known based on the results of the analysis of the state of the elements of the considered urban distribution electric network, using the next given Equations (1)–(6), it is possible to propose solutions aimed at optimizing its operation mode. Let us look at them in more detail:
W * = W * · ω * · ( t c o n s . T y e a r ) ,
where W * is power consumption in relative units (relative power consumption); ω * —is a flow of failure in relative units (relative flow of failure); t c o n s . s u b s c r i p t i o n s is a time of electric power consumption by consumers in hours.
In Equation (1), the parameter W * is the ratio of actual electricity consumption to the amount of electricity reception by the city power grid, taking into account the following indicators, which characterize the operating mode of the power grid: the voltage losses and active power factor, and they can be represented as follows:
W * = W a c t u a l W r e c e p t . ,
where W a c t u a l is the value of the actual power consumption on the plots, kWh; W r e c e p t . = n · P a c c e p t . · t m . is the accepted (recommended) value of electricity consumption during the month, kWh; P p e r m . is the permissible capacity issued by the power supply company (4–5 kW) per customer.
The relative flow of failure has the following functional dependence on power consumption:
ω * = f   ( W * + α t e r .   c o n d . * ) ,
where α t e r .   c o n d . * is a temperature coefficient characterizing the terrain conditions, which was derived from authors’ earlier works and is given in [24,25].
The algorithm of performing the sequence of calculation steps to establish the degree of energy efficiency of the urban power grid of Dushanbe is shown in Figure 3, where the completion of the sequence of actions allows us to assess the degree of energy efficiency of the considered electric network, the indicator of which is the under-discharge of electricity W .
The algorithm presented in Figure 3 is used to assess the energy efficiency of the urban distribution electric networks for the under-discharge of electricity, where the following actions must be performed:
  • After receiving the measurements’ results of the electrical load and actual power consumption W c o n s u m from the readings of electricity metering and the wattmeter measuring device, we analyzed the comparison between the actual power consumption and the received power consumption W r e c e p t . We obtained these values from the reference substations, according to the daily readings of electricity. The comparison is based on Equation (2), where the obtained results are expressed in relative units for a convenient and simplified way to evaluate the energy efficiency.
  • In cases of W r e c e p t = W c o n s u m equality, the data are stored in a single database, which is located at the national integrated power company “Barki Tojik”. If the condition W r e c e p t > W c o n s u m is not met, it is necessary to evaluate the energy efficiency of the considered urban electric network by the voltage loss U . The need to evaluate the energy efficiency through this parameter is more informative.
  • Since the considered urban distribution electric network at the moment physically does not have the ability to reduce voltage losses ( U ) below 10%, it takes the value of 10% as the base value. Thus, in the cases of Wrecept > Wconsum, using Equation (6), we calculated the voltage loss ( U ) . If the value U 10 % , then the network was efficient, and this completed the calculation. The calculation results were sent to the database. In cases of U > 10 % , it is necessary to analyze the considered electrical network by the indicator of undersupply of electricity, since this indicator is an important component for electric power systems with renewable energy sources. In this case, the main source of electricity in the Republic of Tajikistan is the hydraulic power plants, the production of which depends on the inflow and flow of water. Since the inflow of water depends on the melting of glaciers, in winter, it decreases sharply, and as a result, each inefficient consumption of electricity leads to a decrease in the reliability and efficiency of both the urban distribution network of Dushanbe and the entire Republic of Tajikistan.
To determine the factors of energy efficiency indicators of the urban distribution electric network, the following expressions will be used:
c o s φ a v .   v . = P   a v . v S n . t r . · K l o a d . ,
where P   a v . v is the total average value of the active power for 24 h, kW; S n . t r —the rated power of the transformer, kVA (MVA); K l o a d . —the load сoefficient of the transformer, following the state standards in force in Tajikistan and other CIS countries.
Q   a v .   v . = P   a v .   v . · t a n φ ;  
U t r = P   a v .   v . · R t r + Q   a v .   v . · X t r U 2 · 100 % ,  
where R t r , X t r are calculated as active and reactive resistances of the transformer at the higher voltage stage, Ohms.
Evaluations of the transformer operating modes, depending on the nature of loads, were carried out for several substations of urban electric networks. As an example, two substations of the urban electric networks of the city of Dushanbe with relatively characteristic nodes were considered.
Similarly, active power coefficients were calculated for other substations, depending on reactive power consumption at a nominal load of transformers. The calculation results are shown in Table 1.
From the obtained results in Table 1, it can be seen that, for a significant part of the substations, the active power factor during the day was at an unacceptably low limit, which did not correspond to the transformation stage. This is because most of the transformers at the substations operate in the underloading mode for active power, from the point of view of payload, although, based on the values of the effective full power, their loading is in the maximum permissible values. This is achieved by adding a large reactive power to the active power. With this mode of operation, considering the increase in the number of electrical conductors with a non-linear load for consumers having an inductive nature, when transmitting electricity from a power source—transformer substations to electricity consumers—the entire city with 6–10 kV distribution network will be loaded with reactive power flowing through the elements of this network. This will lead to inefficient electricity consumption, associated with an increase in losses, a violation of the quality of electricity by voltage in consumer nodes, and the appearance of high harmonics. Additionally, almost all considered transformer substations of the urban electric network, except the substation “Industrial”, do not have the reactive power compensation.
Table 1 shows that the voltage losses in transformers with a low active power factor vary from 1 to 16%, and there is also an excess of the permissible voltage deviation value. Moreover, there is an excess of reactive power consumption in most of the examined substations. As a result, it leads to an increase in electricity losses and a decrease in the capacity of the elements of the electrical network. As a consequence, transformer losses with a low power factor may lead to the inability to maintain voltage limits in the nodes of 6–10/0.4 kV consumer transformer substations when transmitting electricity through a 6–10 kV distribution network.
According to the data of JSC “Dushanbe city electric networks”, the average length of 6–10 kV overhead power transmission lines, when transmitting electricity from transformer substation busbars to the transformer substations of the end user, is 5 km. The transmission of electricity is carried out by wires of the A-50 and A-70 types, with the consideration of the load capacity. When using cable lines (CLs), the cross-section areas with intervals from 120 to 240 mm2 are used. Therefore, with a known maximum transmitted power, according to the data of control measurements and the values of the active power coefficients obtained based on control measurements by calculation, it is possible to determine the maximum voltage losses during the transmission of electricity.
Consequently, with a known magnitude of the electrical load and the resulting power consumption, it is possible to determine the factor indicators characterizing the operating parameters of the elements of the urban distribution grid. In this regard, the next chapter will be devoted to the practical confirmation of compliance with the considered urban electric network, according to such indicators as the voltage loss and the load factor of the transformer. Their optimality allows us to characterize the degree of efficiency of the electric network by the active power consumed. This requires such initial parameters as the actual load that depends on the actual power consumption, as well as external climatic and meteorological factors. For example, one section feeding several transformers via CL and receiving power from one busbar will be considered in detail. For the remaining sections, the results will be presented in tabular form.

3. Results and Discussion

With known values of current power consumption, as well as the climatic and meteorological factors of the city of Dushanbe (also, other cities and regions of Tajikistan), using a coefficient characterizing the terrain conditions during the hours of maximum loads α max l o a d [24,25], it is possible to forecast power consumption by the following equations:
W f o r e c a s t = W c o n s . · α max l o a d · ( 1 α max l o a d ) ,
P a v . max d a y .   = W f o r e c a s t t max l o a d   d a y   · α max l o a d ,
where W c o n s . —electricity consumption during the examined period, kWh; tmax⁡load day—the maximum load time during the day, hours; α max l o a d —time coefficient of maximum load.
According to the monthly readings of electricity records, the amount of electricity consumption and the average power during the hours of maximum loads for one of the feeders of the substation “Vostochnaya—110/35/6 kV” were determined, and the model is given in Figure 4.
Let us to consider a section of the city electrical network supplying from a transformer substation TS-65 with a consumer transformer T-630/6 with monthly power consumption   W c o n s .   m o n t h . = 91418.19 k W h a per   month , for which:
-
Power consumption during peak load hours, as follows:
W f o r e c a s t = 91 , 418.19 · 0.145 · ( 1 0.145 ) = 11 , 333.57   kWh ;
-
Average power during peak load hours, such as:
P a v . p e a k   l o a d   h o u r s   = 11 , 333.57   2.5   · 0.145 = 657   kW .
The computation results for the remaining 6/0.4 kV consumer transformer substations are summarized in Table 2.
According to the obtained data given in Table 2, we determined the load factors of consumer transformer substations (CTS), as well as the voltage losses in the 6 and 0.4 kV CLs feeding CTS-6/0.4 kV and internal switchgear (IS) and voltage losses in nodes 0.4 kV of CTS-6/0.4 kV, during the hours of maximum loads.
The performed calculations for TS-65 with a T-630/6 consumer transformer, the type, and cross-section, as well as the lengths of the 6 and 0.4 kV supply cables, are shown in Figure 4. The load coefficients of a single-transformer substation and voltage losses in the considered sections of the CL and transformer nodes are determined by the following expressions.
-
The load factor of a 6/0.4 kV single transformer substation:
К l o a d = S e s t S n o m . ,
where S e s t . —estimated total power, determined by the following formula:
S e s t = P e s t 2 + Q e s t 2 ,   kVA ;
S n o m . is a rated total power of the power transformer, kVA.
-
Voltage losses in the supply of the 6 and 0.4 kV CLs, as follows:
U = P e s t · R · L + Q e s t · X · L U l 2 · 100 % ,
where P e s t , Q e s t are estimated active and reactive power, MW, MVar; R , X —active and reactive resistance of the CL, Ohms; L —plot length, km; U l —line voltage, kV.
-
Voltage losses in transformer substation nodes:
U = P e s t · R + Q e s t · X U l 2 · 100 % ,
where R , X   are active and reactive resistances of the power transformer, Ohms.
Based on the calculation that the active power factor is 0.9 for household consumers, the total power is defined as follows:
t h e   S e s t = 657 2 + 302 2 = 723   kVA ;
-
Load factor, as follows:
К l o a d = 723 630 = 1.15 .
Considering the section busbar No. 8 (TS-65) that feeds other 6/0.4 kV CTP (Figure 4) through the main line, when determining voltage losses in the 6 kV supply cable, the total load is taken. Thus, the following is defined:
-
CL-6 kV, feeding a group of consumers:
U = 1523 · 0.057 + 0.700 · 0.025 6 2 · 100 % = 0.29 % ;
-
CL-0.4 kV, feeding the input switchgear (IS) of household consumers:
U C L = 0.657 · 0.057 + 0.302 · 0.025 0.4 2 · 100 % = 28 % ;
-
Voltage losses in the 0.4 kV CTS-6/0.4 node:
U t r . = 0.657 · 0.0031 + 0.302 · 0.0136 0.4 2 · 100 % 4 % ;
Similar calculations have been performed for the rest of the power supply scheme feeding busbar No. 8. The computation results are shown in Table 3.
The obtained results are performed based on the proposed method of forecasting power consumption, considering the factor conditions to establish the influence of electricity consumption by household consumers during the hours of maximum loads on the operating modes of the urban electric grid, especially in the 0.4 kV networks (Table 3). This is manifested in both the voltage losses and load of transformers.
Similarly, depending on the average maximum current load of the substation busbars of the examined sections of the overhead and cable lines, with a known average value of the active power factor, we determined the voltage losses along the sections of the 6–10 kV distribution network. The results are shown in Table 4, and their continuation is shown in Table 5
The obtained results show that, with a low active power factor, the voltage losses in the end nodes of the 6–10 kV distribution network for more loaded busbars, on average, exceed the established 10% during a power transmission over overhead lines. Thus, transformer substations are not able to maintain the maximum permissible voltage deviations in these nodes. Moreover, the operating modes of the consumer 6–10/0.4 kV transformer substations themselves, considering the nonlinear loads, which are connected directly to them, will also additionally create the voltage losses that sum up with the voltage losses of the distribution network itself.
When using the CLs made of XLPE and lead sheath for the electricity transmission through the 6–10 kV distribution networks, the voltage losses have a low active power factor average of 5%. However, it should be noted that the CLs are laid underground, and with these load factors, the capacitive currents relative to the ground increase, which, in turn, can lead to insulation breakdown and the appearance of single-phase earth fault currents. Thus, according to the data of OJSC “Dushanbe city electric networks”, in recent years, the cause of frequent failures of the CLs is precisely the appearance of these currents, and due to the lack of compensation for capacitive earth fault currents at the transformer substations, there is a decrease in reliability and an increase in electricity losses in 6–10 kV distribution networks. Therefore, based on the conducted research and identification of the state of the elements of the urban distribution electric network of Dushanbe, it was found that, in general, the electric network does not meet the energy efficiency criteria for the following indicators: active power coefficient, voltage losses, load factor, and transmission capacity of overhead power lines.
One of the ways to solve this problem is to optimize the power consumption (in particular, by household consumers), since these consumers create the main uncertainty and, thereby, lead to a decrease in the energy efficiency of the urban distribution network. This is possible using Equations (7) and (8), the implementation of which is proposed based on the algorithm shown in Figure 3 by considering the most significant factors affecting the forecast in the conditions of Dushanbe, thereby allowing us to increase the energy efficiency of the considered electric network.
Figure 5 shows the algorithm for monitoring the energy consumption using smart electricity meters that have been developed based on the proposed approach, and its operating principle is described as follows:
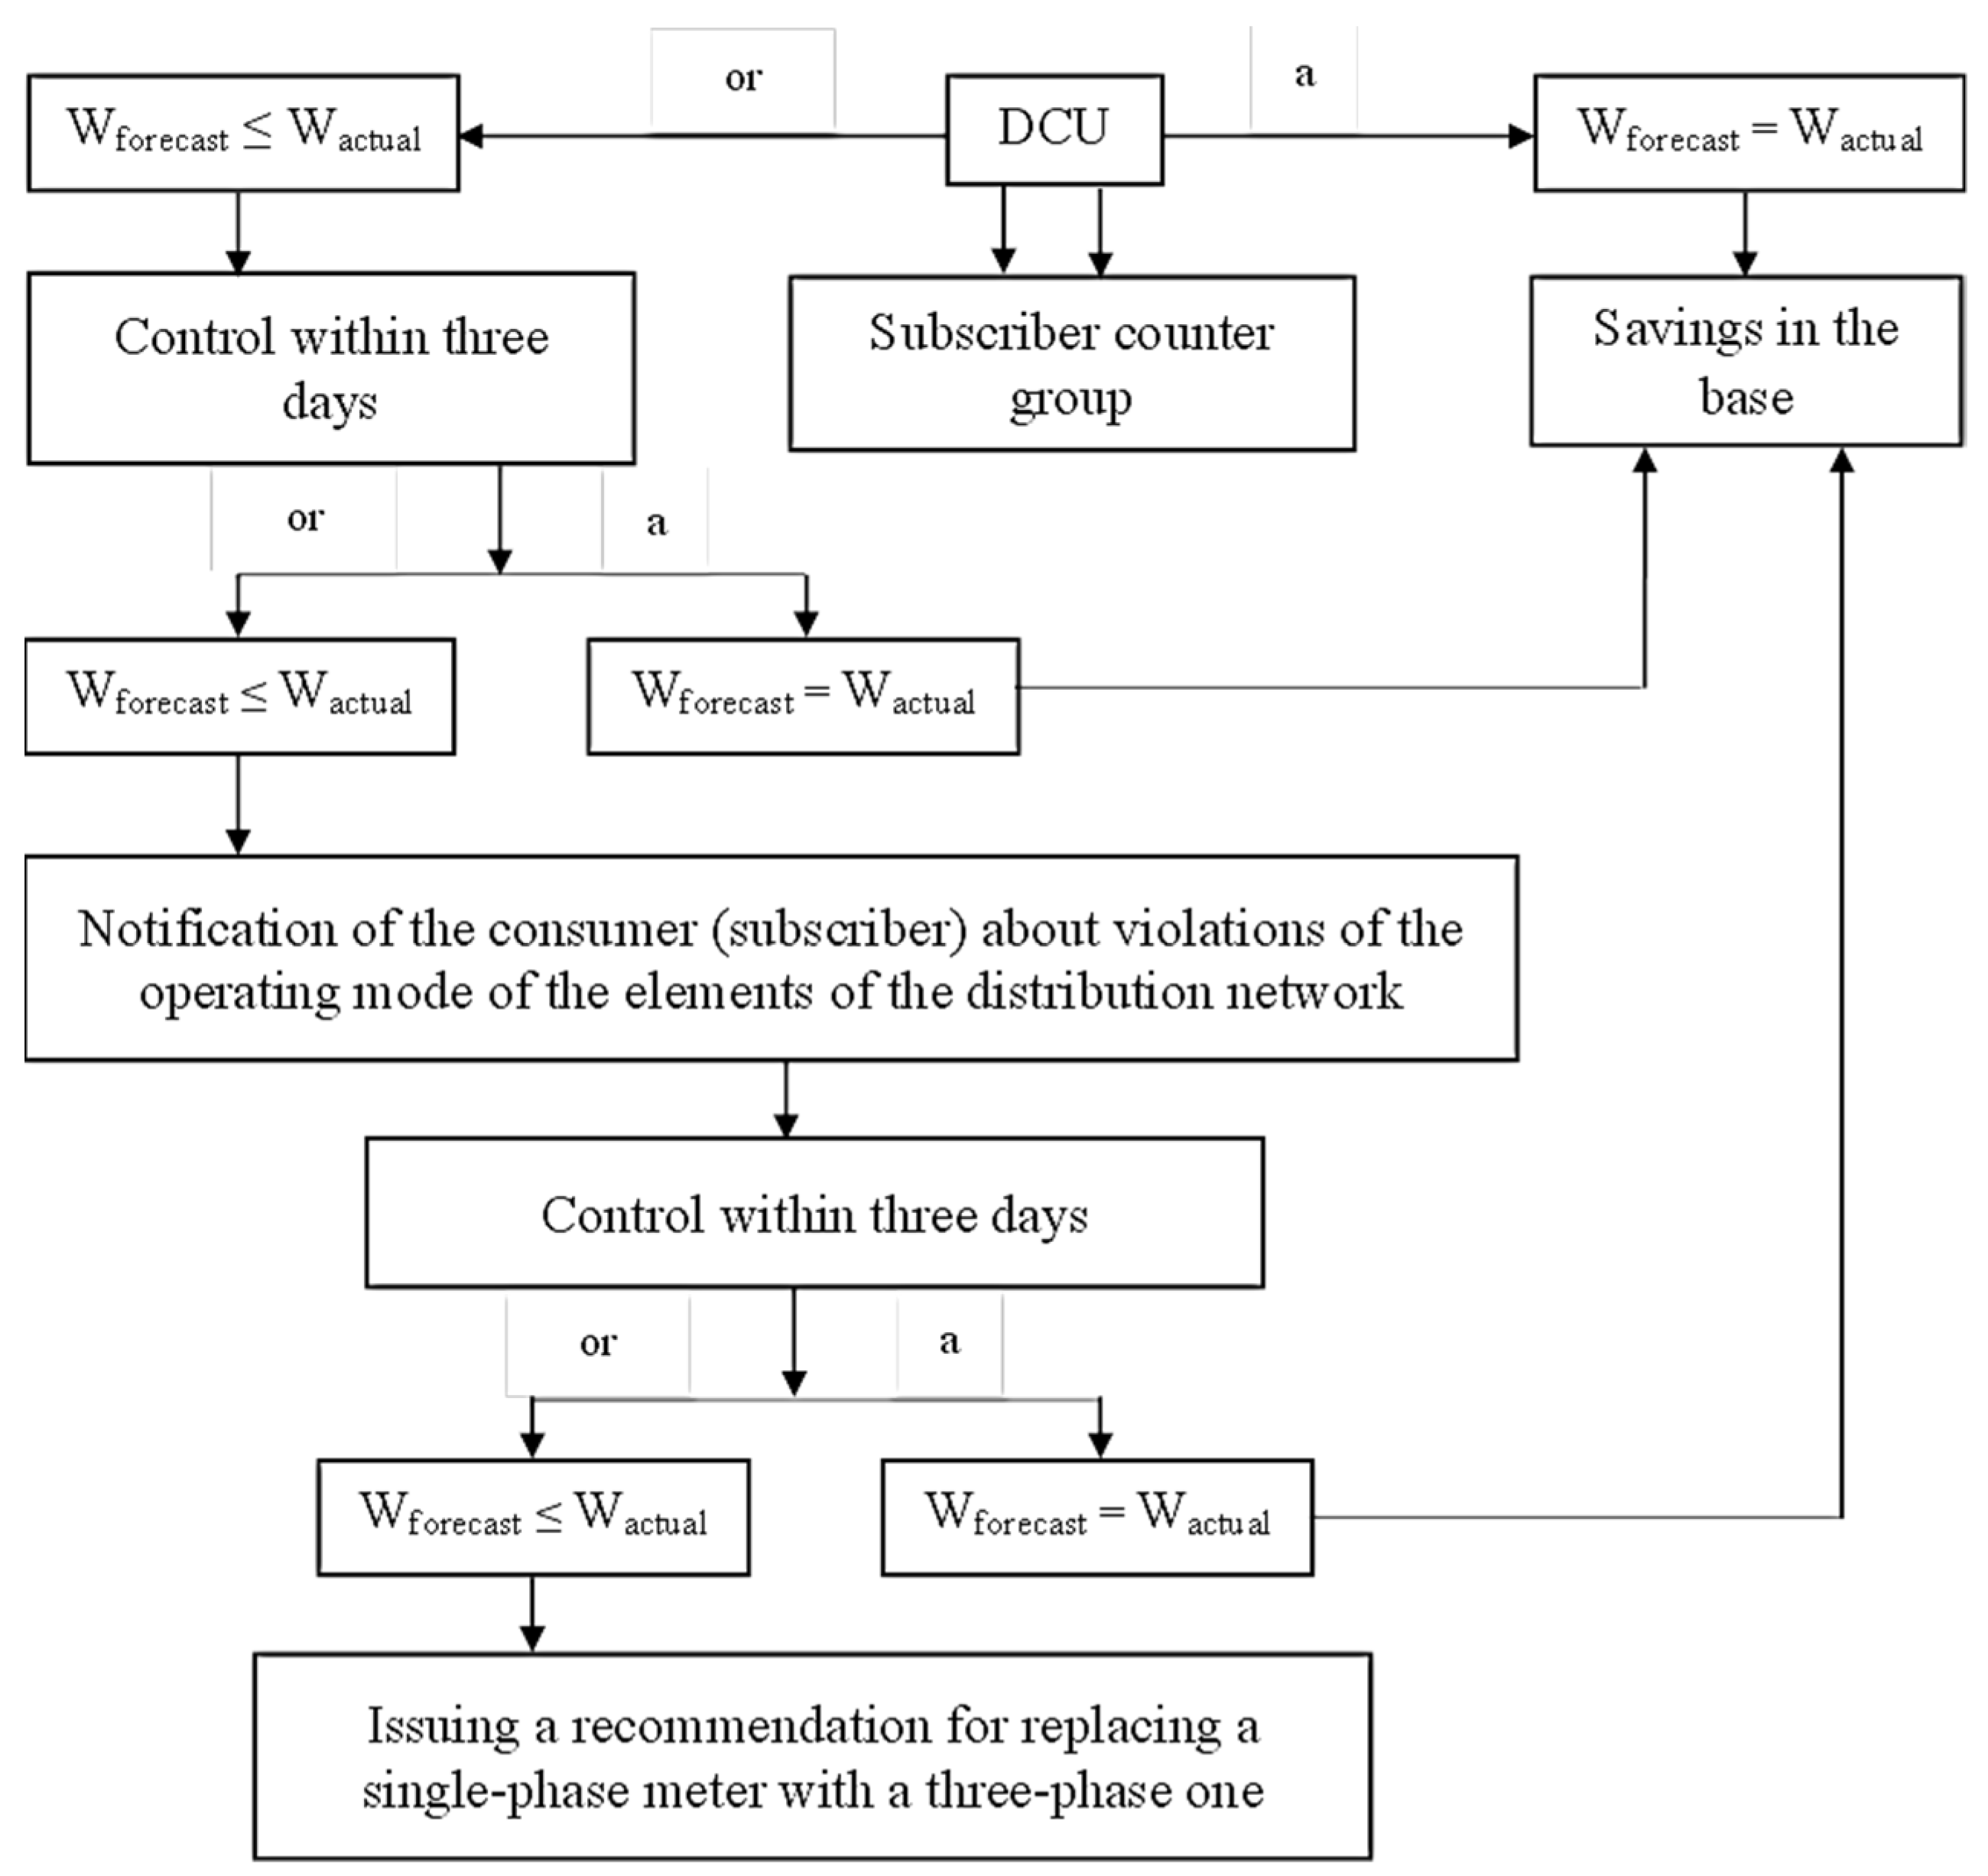
  • Information about the recorded electricity is transmitted via RS-485 communication channels to the data center union (DCU). In turn, to transfer information from the DCU to the information collection center (ICC), a SIM card with an Internet connection is installed in the DCU, and information is transmitted wirelessly over the WAN. In addition, the ICC proposed to place the above information in the central dispatching service of the national integrated power company “Barki Tojik” to monitor the load in the electrical system and in the database of the operational dispatching service of the city of Dushanbe (the latter is for monitoring specific loads and the power consumption of individual subscribers).
  • When the conditions for consumption are met, the specific consumption of electricity during the maximum hours is equal to the normalized specific consumption (Wactual = Wnormal), and the received information is automatically transferred for saving. Then, if Wfactual > Wnormal, information about the data of such consumers is taken under control, and for 3 days during the hours of maximum load, consumption data are recorded, which are stored in the ICC. If the inequality Wfactual > Wnormal persists for 3 days, without passing to the required condition Wfactual ≤ Wnormal, the subscriber is notified about the overspending of electricity consumption, which should encourage consumers to reduce the cost of electricity consumption. However, in case of further non-compliance with electricity consumption standards, the subscriber is recommended to replace the single-phase electricity meter with a three-phase one. This recommendation is extremely important from the point of view of the need to solve the problem of maintaining the symmetry of current loads between phases and reducing the asymmetry in the network, also to maintain the voltage at the maximum permissible values. Moreover, more than 95% of all electricity is generated at hydroelectric power stations, and in winter, due to a decrease in water inflow, maintaining voltage in consumer nodes seems to be an extremely difficult, and sometimes practically impossible, task.

4. Conclusions

When considering a strategy to increase the energy efficiency of any process, it should be noted that energy efficiency has a multiplicative effect as one of the key categories of any economic system, namely the higher the energy efficiency in the initial sectors of the technological chain, the more efficient the entire chain as a whole. The most important characteristics of energy efficiency are in the fuel and energy sectors, for instance, in the electric grid industry. Ultimately, the lost electricity is lost products, unproven services, etc. Therefore, one of the links of the electric grid sector—a transformer substation, together with installed power transformers—should be the subject of close analysis when developing and implementing a strategy to increase energy efficiency in the transportation and distribution of electric energy.
This could be achieved by precisely forecasting the power consumption, considering the most accurate factors affecting it. This is possible by performing an algorithm for calculating and evaluating the energy efficiency of the urban distribution grid, according to the indicator of power underutilization. Equations (7) and (8) should be applied in this case, which considers the most significant factors affecting the forecast in the conditions of the city of Dushanbe, thereby allowing us to increase the energy efficiency of the considered electric network.
To ensure the constant monitoring of energy consumption and timely recommendations and prescriptions to network subscribers, in the case of the over-expenditure of electricity, the proposed method of the implementation must be utilized, which is based on the relationship between the above algorithm and the algorithm for monitoring energy consumption using smart electricity meters. This approach is used in case of non-compliance with the equality condition in the calculation and assessment algorithm of energy efficiency of the urban distribution power grid by the indicator of power underutilization.
The solution of identifying problems in the distribution network through constant monitoring of electricity consumption should improve their energy efficiency. The proposed algorithm is recommended to be implemented, together with use of the smart electricity meters, as a part of an interstate project between Tajikistan and China, called “Smart Grids of Dushanbe”.

Author Contributions

All authors contributed extensively to the work presented in this paper. Conceptualization, S.S.T., I.Z., S.B., S.P., M.S. and S.S.; methodology, S.S.T., I.Z., S.B., S.P., M.S. and S.S.; software, S.S.T. and S.S.; validation, S.S.T., I.Z., S.B. and M.S.; formal analysis, S.S.T., I.Z., S.B., S.P., M.S. and S.S.; investigation, S.S.T., I.Z. and S.P.; writing—original draft preparation, S.S.T., I.Z., S.B., S.P. and M.S.; writing—review and editing, I.Z., S.B. and M.S.; visualization, S.S.T., S.P. and S.S.; supervision, S.S.T.; project administration, S.P. All authors have read and agreed to the published version of the manuscript.

Funding

The research funding from the Ministry of Science and Higher Education of the Russian Federation (Ural Federal University Program of Development within the Priority-2030 Program) is gratefully acknowledged: Grant number FEUZ-2022-0031.

Data Availability Statement

The data presented in this study are available on request from the corresponding author. The data are not publicly available, due to confidential reasons.

Conflicts of Interest

The authors declare no conflict of interest.

References

  1. Kirgizov, A.K.; Dmitriev, S.A.; Safaraliev, M.K.; Pavlyuchenko, D.A.; Ghulomzoda, A.H.; Ahyoev, J.S. Expert system application for reactive power compensation in isolated electric power systems. Int. J. Electr. Comput. Eng. (IJECE) 2021, 5, 3682–3691. [Google Scholar] [CrossRef]
  2. Asanova, S.; Safaraliev, M.; Askarbek, N.; Semenenko, S.; Aktaev, E.; Kovaleva, A.; Lyukhanov, E.; Staymova, E. Calculation of power losses at given loads and source voltage in radial networks of 35 kV and above by hierarchical-multilevel structured topology representation. Prz. Elektrotechniczny 2021, 7, 13–18. [Google Scholar] [CrossRef]
  3. Asanov, M.; Kokin, S.; Asanova, S.; Satarkulov, K.; Dmitriev, S.; Safaraliev, M. The use of Petri computing networks for optimization of the structure of distribution networks to minimize power losses. Energy Rep. 2020, 6, 1383–1390. [Google Scholar] [CrossRef]
  4. Sidorov, A.I.; Tavarov, S. Enhancing reliability of electricity supply of city electric networks cities of Dushanbe. Bull. Electr. Eng. Inform. 2021, 10, 46–54. [Google Scholar] [CrossRef]
  5. Naumov, I.V.; Podyachikh, S.V. On the choosing the installation location the balancing devices in low-voltage distribution electric networks. J. Phys. Conf. Ser. 2021, 2094, 052012. [Google Scholar] [CrossRef]
  6. Sun, K.; Xiao, H.; Pan, J.; Liu, Y. VSC-HVDC Interties for Urban Power Grid Enhancement. IEEE Trans. Power Syst. 2021, 36, 4745–4753. [Google Scholar] [CrossRef]
  7. Xiao, J.; Cai, Z.; Liang, Z.; She, B. Mathematical model and mechanism of TSC curve for distribution networks. Int. J. Electr. Power Energy Syst. 2022, 137, 107812. [Google Scholar] [CrossRef]
  8. Liu, J.; Tang, Z.; Zeng, P.P.; Li, Y.; Wu, Q. Co-optimization of distribution system operation and transmission system planning: A decentralized stochastic solution. Energy Rep. 2022, 8, 501–509. [Google Scholar] [CrossRef]
  9. Hovorov, P.; Kindinova, A.; Hovorov, V. Mode Control of Urban Electrical Networks Based on the Smart Grid Concept. In Proceedings of the 2021 IEEE 2nd KhPI Week on Advanced Technology (KhPIWeek), Kharkiv, Ukraine, 13–17 September 2021; pp. 88–93. [Google Scholar] [CrossRef]
  10. Oscullo, J.; Gallardo, C. Small signal stability enhancement of a multimachine power system using probabilistic tuning PSS based in wide area monitoring data. Eur. J. Electr. Eng. 2020, 22, 1–12. [Google Scholar] [CrossRef]
  11. Xue, G.; Yongdong, H.; Jiang, X.; Lei, T.; Xingli, L. Study on Voltage and Reactive Power Control of 10kV Direct Load Supply of 220kV Transformer Substation; IEEE Innovative Smart Grid Technologies-Asia (ISGT Asia): Chengdu, China, 2019; pp. 1096–1101. [Google Scholar] [CrossRef]
  12. Sreekumar, S.; Kumar, D.S.; Savier, S.J. A Case Study on Self Healing of Smart Grid with Islanding and Inverter Volt–VAR Function. IEEE Trans. Ind. Appl. 2020, 56, 5408–5416. [Google Scholar] [CrossRef]
  13. Moghbel, M.; Masoum, M.A.S.; Fereidouni, A.; Deilami, S. Optimal Sizing, Siting and Operation of Custom Power Devices with STATCOM and APLC Functions for Real-Time Reactive Power and Network Voltage Quality Control of Smart Grid. IEEE Trans. Smart Grid 2018, 9, 5564–5575. [Google Scholar] [CrossRef]
  14. Ren-Chuan, T.; Cheng-Gong, Z.; Zhi-Jun, L.; Yong, C.; Wei, X.; De-Sheng, Z. Research of reactive power control strategy to reduce the reactive power exchange of AC and DC power grid. J. Eng. 2017, 2017, 751–755. [Google Scholar] [CrossRef]
  15. Luo, M.; Lai, D. Distribution transformer monitoring and reactive power compensation. Eur. J. Electr. Eng. 2018, 20, 309–324. [Google Scholar] [CrossRef]
  16. Okhrimenko, V.; Glebova, M. Methodology calculation for reactive power compensation in industrial enterprises. Int. J. Des. Nat. Ecodyn. 2020, 15, 465–471. [Google Scholar] [CrossRef]
  17. Hu, L.; Tang, L.; Pan, Q.; Song, H.; Wen, P. Research and analysis of PI control strategy based on neural network in power grid. Math. Model. Eng. Probl. 2016, 3, 25–28. [Google Scholar] [CrossRef]
  18. Janamala, V.; Pandraju, T.K.S. Static voltage stability of reconfigurable radial distribution system considering voltage dependent load models. Math. Model. Eng. Probl. 2020, 7, 450–458. [Google Scholar] [CrossRef]
  19. Mostefa, T.; Tarak, B.; Hachemi, G. An automatic diagnosis method for an open switch fault in unified power quality conditioner based on artificial neural network. Traitement Du Signal 2018, 35, 7–21. [Google Scholar] [CrossRef]
  20. Somayajula, D.; Crow, M.L. An Integrated Active Power Filter–Ultracapacitor Design to Provide Intermittency Smoothing and Reactive Power Support to the Distribution Grid. IEEE Trans. Sustain. Energy 2014, 5, 1116–1125. [Google Scholar] [CrossRef]
  21. Serban, E.; Ordonez, M.; Pondiche, C. Voltage and Frequency Grid Support Strategies Beyond Standards. IEEE Trans. Power Electron. 2017, 32, 298–309. [Google Scholar] [CrossRef]
  22. Sterpu, S.; Besanger, Y.; HadjSaid, N. Reactive power reserve performance control with respect to the transmission grid security. In Proceedings of the 2006 IEEE Power Engineering Society General Meeting, Montreal, QC, Canada, 18–22 June 2006; pp. 6–11. [Google Scholar] [CrossRef]
  23. Cardenas, R.; Pena, R.; Clare, J.; Wheeler, P. Control of the Reactive Power Supplied by a Matrix Converter. IEEE Trans. Energy Convers. 2009, 24, 301–303. [Google Scholar] [CrossRef]
  24. Sidorov, A.I.; Tavarov, S.S. Method for forecasting electric consumption for household users in the conditions of the Republic of Tajikistan. Int. J. Sustain. Dev. Plan. 2020, 15, 569–574. [Google Scholar] [CrossRef]
  25. Tavarov, S.S.; Sidorov, A.I.; Sultonov, O.O. Modelling the operating mode of the urban electrical network and developing a method for managing these modes. Math. Model. Eng. Probl. 2021, 8, 813–818. [Google Scholar] [CrossRef]
Figure 1. Diagram of changes in the reception of electricity from the system and technological losses during the transmission of electricity for the period of 2013–2021.
Inventions 07 00107 g001
Figure 2. Dynamics of the relative electricity losses for the period of 2013–2021.
Inventions 07 00107 g002
Figure 3. Calculation and assessment algorithm of energy efficiency of the urban distribution power grid by the indicator of power underutilization.
Inventions 07 00107 g003
Figure 4. Model of the section of the city electrical network.
Inventions 07 00107 g004
Figure 5. Algorithm for monitoring energy consumption using smart electricity meters.
Inventions 07 00107 g005
Table 1. Dependence of active power coefficients on reactive power consumption at the rated load of transformers.
Substation NumberName of
Substation
Type and Power of Transformers P   a v . v . ,
MW
S n . t . ,
MVA
K l o a d . , Q   a v . v . ,
MVar
COS φ a v . v . U t r ,   %
1BahorТ1, 16,000/11013.55160.79.10.87.44
Т2, 16,000/1107.7160.76.70.695.1
2BustonT, 16,000/1108.23160.76.60.735
3BotanicheskayaТ-1, 10,000/1106.6100.730.944
Т-2, 6300/1106.66.30.78.10.516
4VinzavodskayaТ-1, 10,000/353.5100.78.570.56
Т-2, 10,000/352.38100.73.830.343.3
5VostochnayaТ-1, 25,000/11012.74250.710.30.725
Т-2, 25,000/11011.6250.710.80.665.2
6VodonasosnayaT, 10,000/355.14100.73.20.743.3
7ZavodskayaТ-1, 25,000/11010.3250.711.30.585.4
Т-2, 25,000/11012.0250.710.60.685
8IstiklolТ-1, 10,000/357.65100,7011
Т-2, 10,000/355100,74.20.714.2
9Kofarn. VodozaborТ-1, 16,000/1107.32160.76.440.654.9
Т-2, 16,000/1106.65160.770.65.3
10KaramovaТ-1, 25,000/1107.34250.710.30.425
Т-2, 16,000/11012.03160.74.660.932
11CominternТ-1, 2500/351.872.50.7011
Т-2, 2500/351.12.50.71.070.633.2
12LuchobТ-1, 40,000/11011.3400.716.40.45
Т-2, 40,000/11013.76400.716.960.55
13IndustrialТ-1, 25,000/11016.6250.75.40.952.7
Т-2, 25,000/11019.2250.712.870.85
14SovietskayaТ-3, 16,000/1103.81160.76.10.344.5
Т-1, 25,000/11013.2250.710.20.755
15SportivnayaТ-2, 40,000/11025.8400.710.40.923.22
Т-2, 10,000/3515.3100.714.50.6515
16FirdavsiТ-1, 25,000/11013.24250.79.960.765
Т-1, 16,000/11011.2160.7010.89
Table 2. Computation results of power consumption and average power during the hours of maximum loads.
NumberNameType and Power of CTS, kVA W c o n s .   m o n t h . ,
kWh/Month
W f o r e c a s t ,
kWh/Month
P a v . p e a k   l o a d   h o u r s   ,
kW
1TS-54/2, Т-1Т-1000/644,177.225476.87318
2TS-54/2, Т-2Т-400/641,075.775092.37295
3TS-264/2Т-400/622,215.42754.15159
4TS-2427Т-400/613,0301615.3994
Table 3. Computation results of voltage losses and load coefficients of a 6/0.4 kV consumer transformer substation.
Feeding CL-6 kVFeeding CL-0.4 kVConsumer Transformer
Substations CTS-6/0.4 kV
К load
Plots U C L . ,   % Plots U C L . ,   % Nodes U t r . ,   %
1–20.12′–2″122′1.180.35
2–50.0135′–5″3.55′0.790.26
2–30.143′–3″11.253′2.70.81
3–40.034′–4″8.14′1.40.44
Table 4. Voltage losses in nodes with a maximum average current load at a known active power factor at substations.
Substation Number12345678
Cell Number163219921932431417
I   a v .   v . , kА0.130.130.180.180.110.10.2830.2610.30.110.32
cos φ a v . v . 0.690.80.730.50.50.340.720.660.740.710.6
Q   a v .   v . ,
Мvar
1.971.52.5641.51.42.532.62.51.13.5
U l , %
OL
10.39.4114.216.856.35513.7713.0414516.56
U l , %
CL with XLPE
3.13.75.56.262.311.85.455.411.76
U l , %
CL with LSH
3.73.525.135.732.151.7554.645.131.655.7
Table 5. Voltage losses in nodes with a maximum average current load at a known active power factor at substations.
Substation Number910111213141516
Cell Number357302618918420
I   a v .   v . , kА0.230.110.1250.1300.1810.110.210.110.220.150.2
cos φ a v . v . 0.420.630.40.50.750.650.760.820.180.680.5
Q   a v .   v . ,
Мvar
5.451.23.262.872.51.892.831.338.822.334.32
U l , %
OL
21.27512.710.11410169.52712.418.4
U l , %
CL with XLPE
83.56.54.85.454.76.353.89.65.88.5
U l , %
CL with LSH
7.7364.65.24.46.13.69.45.48.3
Publisher’s Note: MDPI stays neutral with regard to jurisdictional claims in published maps and institutional affiliations.

