1. Introduction
Fossil fuel thermal power plants (TPP) produce almost 60% of the Russian electricity and heat [
1]. Almost 80% of the installed capacity of TPPs is accounted for by steam turbine power units [
2]. This type of electric generating equipment has a high thermal capacity [
3] and is based on burning fossil fuels in a boiler and using the resulting heat for heating, evaporation, and overheating of water and steam. Then, the steam expands in a turbine and rotates the rotor connected to the generator that transforms its mechanical energy into electricity.
The main method for the steam turbine unit efficiency improvement is the increase in the steam initial parameters at the turbine entrance. Kindra et al. [
4] showed the high efficiency of cycles using water vapor at initial temperatures of 323 K to 623 K. This is due to the high heat of evaporation and the relatively low heat removal temperature. This method reduces fossil fuel consumption and harmful emissions but requires the application of heat-resistant steel. The high initial steam parameters need more expensive metals for steam superheaters, steam pipes, and high-pressure turbines (HPT), as well as in intermediate-pressure turbines (IPT) when reheat is applied. Such metals were developed under the European Unity program AD700 and the European Cooperation in Science and Technology (COST), which resulted in the development of steel grades 91, 911, and 92 and COST 501 types F, E, B, and COST 522 [
5]. These alloys may be used for superheaters and reheaters at temperatures of up to 580 °C and steam pipelines for steam temperatures of up to 600–620 °C. The mentioned projects are continued in the new programs COMTES +, NextGenPower, and MACPLUS. However, an increase in the heat resistance of alloys leads to a rise in costs. This effect is non-linear, and the further temperature increase requires a remarkable increase in steel price [
6]. An increase in the metal operation temperature from 500 to 600 °C at 49 MPa requires the use of twice as expensive metals, and a further increase from 600 to 700 °C leads to a threefold increase [
7]. Thus, increasing efficiency through the use of new alloys is difficult due to a significant increase in the cost of both the superheaters of the boiler unit and the hottest elements of high- and intermediate-pressure steam turbines. Therefore, the transition to higher parameters under these conditions can only be economically justified with a significant increase in the cost of fossil fuels. It is also possible to increase the efficiency of individual elements of the installation, but this method does not have significant potential [
8].
However, there are ways to increase the initial parameters of steam turbine cycles without a significant increase in the cost of the equipment. One of these methods is superheating the steam outside the boiler in external combustion chambers. The most promising are hydrogen–oxygen combustion chambers (HCCs), as they allow the production of steam of high parameters and purity. The main advantage of an HCC is the possibility to install them upstream from the turbine and eliminate the necessity of heat-resistant alloys in the boiler superheaters and the pipelines from the boiler to the turbine. To reduce the cost of steam turbines, designed for super- and ultra-supercritical steam parameters (SC and USC), cooling systems may be used. In these systems, a coolant (cooler heat carrier) is supplied to the most heat-stressed elements of the steam turbine. This reduces the metal operating temperature and allows the use of cheaper alloys.
This study is concerned with the influence of cooling on the thermal efficiency of a USC steam turbine unit with external hydrogen–oxygen combustion chambers.
1.1. Ultra-Supercritical Steam Turbine Units
Research on the development of supercritical steam power units was successfully completed in the USSR. The power unit SKR-100-300 [
5] was a topping unit in the existing Kashira TPP turbine. Steam from the PK-37 boiler, with a flow rate of 710 t/h and parameters of 31.5 MPa and 655 °C, was supplied to a cooled, ultra-high-pressure turbine (UHPT). The steam then expanded to 162 bar and entered the high-pressure turbine from which the steam was extracted to the high-pressure heater (HPH). A part of the HPT exhaust steam was supplied to the feed pump (FP) drive turbine, and the remaining steam entered three intermediate-pressure turbines of 50 MW each.
Shanghai Turbine Works Co developed a USC power unit with the initial parameters of 31 MPa and 600 °C [
6]. The unit has two reheats up to 610 °C at 10.58 MPa and 3.22 MPa. The unit has four HPHs, and the steam coolers of HPHs 2 and 4 are installed sequentially upstream from the feeding water entrance into the boiler. The heat flow scheme has five low-pressure heaters (LPHs) with the cascade drainage of the first LPH moving into the second and further into the third where the drain is carried out through the mixing point. The last two LPHs have cascade drainage into the condenser. The FP drive turbine is supplied from the deaerator pipeline and exhausts into the condenser.
The ENGSOFT Lab company has developed a USC unit heat flow scheme [
7]. This scheme involves four HPHs, four LPHs with cascade drainage, and a feed pump with a turbine drive (FPTD). At the main steam parameters of 700 °C and 30 MPa, the steam mass flow and the power output are 2150 t/h and 850 MW. The scheme has one reheat, with the LPT inlet steam parameters of 730 °C and 7.6 MPa. At the feed water temperature of 344 °C, the unit net efficiency was 51.03%.
The Ph.D. thesis by A.N. Rogalev [
8] is also devoted to USC unit development. At the initial steam parameters of 710 °C and 35 MPa, the heat flow scheme has one reheat up to 720 °C at 7 MPa pressure. The regeneration system has four HPHs with cascade drainage, an FPTD, and five LPHs with drainage through the mixing point in four of them. At the feed water temperature of 330 °C, the unit net efficiency was 48.5%.
The Ph.D. thesis by I.I. Komarov is devoted to the optimization of the SC and USC unit parameters [
9]. It includes the dependency of the power unit efficiency on its various parameters, and the initial temperature increase from 580 to 700 °C results in an increase in efficiency from 43% to 45.5%.
Reference [
10] describes a heat flow chart of a USC unit with the initial temperature of 710 °C and pressure of 35 MPa. The reheat up to 720 °C is carried out at a pressure of 7 MPa. The regeneration system consists of four HPHs, five LPHs, and an FP with a turbine drive. At the feed water temperature of 330 °C, the power unit’s net efficiency was 48.74%.
Another approach to the parameter increase is the application of external combustion chambers installed outside the boiler and steam turbine.
Reference [
6] describes a power unit with a methane–oxygen external combustion chamber. Methane and oxygen in a stoichiometric ratio are supplied to the external combustion chamber where it burns in the steam environment. This increases the steam’s initial parameters at the turbine inlet. The regeneration system consists of three HPHs and four LPHs. All HPHs have cascade drainages into the deaerator. The first two LPHs have cascade drainage into the mixing point of the third.
One last method of the initial parameter increase is hydrogen–oxygen combustion [
11]. The paper discloses a heat flow chart for hydrogen–oxygen external combustion chamber integration with the heat recovery of hydrogen and oxygen compression by heating the condensate. The influence of the main and reheat steam streams superheating in an HCC on the efficiency of the coal-fired power unit was investigated.
Table 1 summarizes the results of a review of the data on SC and USC characteristics. The existing heat flow scheme characteristics may be summarized by the following points:
The highest temperatures of main and reheat steam in the units are 700–720 °C.
Most of the schemes include uncooled steam turbines.
The initial cycle pressure is 30–35 MPa with a reheat pressure of 7–10 MPa.
Based on the results of the review, the flow scheme [
11] is taken for further analysis, since it allows us to significantly increase the initial parameters of the power unit and use the existing supercritical boiler without significant modernization as a basis. An initial cycle temperature of 720 °C is assumed, which corresponds to the most promising development, since the «hot» part of the steam turbine will be cooled.
1.2. Hydrogen and Oxygen Production for Energy Application
In the considered power unit, the operation of HCC requires hydrogen and oxygen. Both components can be produced by the electrolysis method. Hydrogen production involves demineralized water decomposition with a direct electric current. The decomposition products are oxygen and 99.98% pure hydrogen.
The water electric conductivity may be increased by the use of electrolytic water solutions, the most usual being alkalis. Electrolyzers based on alkaline solutions are called alkaline electrolysis cells (AECs) [
13]. The electrolysis cells with non-porous solid polymeric membranes (PEMEC—proton exchange membrane electrolysis cell) have remarkably lower heat losses than AECs. In this case, electrode oxidation is prevented by precious metal coatings, which makes them significantly more expensive [
14]. The solid oxide electrolysis cells (SOECs) are still an experimental option for hydrogen production. They usually work at high temperatures of approximately 800 °C, which allows high-temperature electrolysis. In the SOEC case, part of the electrolysis energy is supplied as heat. The main shortages of this technology are the long startup to the operating temperature time, the low chemical stability, and the short operation life of 10 years [
15].
In this study, the electrolyzer operating pressure is especially important. This is because the hydrogen and oxygen produced are supplied to the main and reheat steam HCC at 24 MPa and 4 MPa pressures, respectively. Thus, the hydrogen must be compressed before it is supplied for combustion, which may require significant electrical power.
Most of the currently available electrolyzers operate at 2–3 MPa pressures [
16,
17,
18]. However, already now, there are industrial samples operating at elevated pressures of 15–20 MPa [
19,
20], for example, «Proton energy systems» produce electrolyzers with an operating pressure of 16.5 MPa and a capacity of up to 2.2 kg H
2/day [
21]. Besides this, some installations operate at super-high pressures. The electrolyzer developed by «Mitsubishi» operates at 35 MPa [
22]. The most successful is the cell developed by “Honda” that operates at 70 MPa [
23].
According to [
24], high-pressure hydrogen production in a low-pressure electrolyzer with a hydrogen compressor is energetically more efficient than production in a high-pressure electrolyzer. This effect is due to the remarkable cell efficiency reduction at high pressure that is not balanced by the lower power consumption for compression in a hydrogen compressor. Besides this, the power production industry requires large amounts of hydrogen that correspond to the electrolyzer’s power of several megawatts.
Table 2 summarizes the parameters of the existing megawatt-class electrolyzer facilities.
Most of the high-power electrolysis plants operate at 3 MPa pressure. The «Sunfire» company offers a hydrogen exit pressure increase of up to 4 MPa through the use of a compressor. Based on the results of the review, for further analysis, the hydrogen and oxygen pressure at the heat flow scheme inlet is assumed to be 4 MPa, which is somewhat higher than the current level of the megawatt-class facilities but is within the limits of the industry today. The use of this hydrogen and oxygen pressure allows for the supply of the reheat HCC without compressors.
1.3. Cooled Steam Turbine Research
Another method for the reduction of the power production unit capital cost is the use of a cooled-steam turbine. This allows a lower metal temperature and the use of cheaper steel for the «hot» elements.
The turbine cooling with steam was introduced in the Kashira district power station R-100-300 turbine [
9]. The UHPT cooling steam was obtained via the main steam supply with the control valves into a steam cooler where its temperature dropped to 515–520 °C by feed water injection. The cooling system consumed 8% of the turbine inlet flow, where 0.5% of this flow was the feed water and 2.5% of the coolant steam was removed as a leak through the front-end seal. The coolant temperature for the rotor and casing cooling was 515 °C and 520 °C, respectively, which kept the rotor and casing temperature below 530 °C. The blades were of an active design so as to provide the cooling system with reliable operation, and the uncooled blades were made of austenitic steel.
Reference [
25] describes the turbine cooling developed by NPO CKTI and OJSC «Power Machines». The cooling led to the initial turbine steam parameters of 600 °C and 29.4 MPa and reheat steam of 600 °C and 7.7 MPa. The turbine is manufactured from the widely used steel 21CrMoV5-7, which allows the main steam temperature of up to 540–550 °C. The HPT and IPT cooling steam were obtained from a steam-to-steam heat exchanger (SSHE). The main steam was taken downstream from the control valve and cooled from the reheat cold line before entering the HPT cooling system. The majority of the steam after HPT entered the reheat. The smaller part entered the SSHE, and another part mixed with the steam flow, heated in the SSHE. Furthermore, part of the mixed flow was supplied to IPT cooling, and the other part was directed to the regeneration system. The cooling steam was supplied between the casing and blades and between the rotor and blades of the steam turbine.
Reference [
12] also describes the influence of steam cooling on the power facility parameters and efficiency. The coolant flow was calculated by the Wilcock and Young method, developed for the coolant flow analysis in gas turbines [
26,
27,
28]. At the initial temperature of 700–720 °C, the power unit efficiency reduction due to turbine cooling was 0.5%. At higher initial parameters, this reduction was larger due to the larger coolant flow.
The development of reactive steam turbines [
29,
30], with a power of 1000 MW, steam parameters at the inlet of 30 MPa and 600 °C, and the ability to overload due to additional overload valves, is difficult due to the complexity of designing a dummy piston that can withstand heavy loads at high temperatures. One company has solved this problem by means of a casing cooling and the cooling steam supply to the dummy piston. After the fourth stage, steam leaves the flow path and passes along channels in the casing to the dummy piston, where some steam exits through the turbine front-end seal. The other part of the steam passes the seal towards the first stage along the rotor and mixes with the steam that has passed the seal after the first-stage vane. After mixing, this «hot» steam passes to the overload steam inlet where it mixes and enters the chamber downstream from the fifth stage. This organization of such a movement of steam inside the turbine remarkably reduces the inner casing metal temperature and provides dummy piston operation at moderate temperatures.
Reference [
31] describes the cooling influence upon USC turbine operation. The investigation included the development of a test facility and a computer simulator with hot air as the working fluid. The coolant was supplied after the first vane row along the rotor. Therefore, the rotor and vane grid metal was cooled. The simulation results show good similarity with the test results.
Reference [
32], by the same author, discloses a similar cooling system. A thermal shield was used for the rotor temperature reduction, and the shield’s interaction with cooling was investigated. The use of a thermal shield reduced the rotor temperature by approximately 6 °C. The combined use of a shield and cooling at the coolant temperature of 383 °C reduced the rotor temperature by approximately 20 °C.
Reference [
33] describes the coolant flow influence upon a USC turbine’s IPT cooling efficiency. The cooling steam was supplied to the channels between the membrane and root seals. The simulation was carried out at the coolant flow values of 0 kg/s, 2.41 kg/s, and 4.8 kg/s, while the main steam flow was 2334 kg/s at 598 °C and 4.86 MPa.
Reference [
34] describes a similar cooling system influence upon a USC turbine IPT. The primary steam parameters were 599.6 °C and 4.4 MPa. AAs in the study above, steam cooling provided lower metal temperatures, which allow manufacturing with cheaper steel.
Steam blade cooling is especially discussed in the literature, and this problem in a USC turbine is described in reference [
35]. The study considers the possibility of blade cooling in an HPT at steam inlet parameters of 650 °C and 30 MPa and in am IPT at 670 °C and 5.695 MPa. The temperature distribution was calculated with the ANSYS CFX code, and the model consisted of a few flows. According to the results of the analysis, an acceptable metal temperature was achieved, and the most heat-stressed areas were the leading and trailing edges. The result showed that IPT cooling may be achieved more easily than HPT. The coolant temperature may be higher and its flow may be smaller due to the smaller heat transfer from the steam to the blade in IPT. The investigated blade shape is not typical for steam turbines [
8].
Reference [
36] also describes the turbine blade steam cooling for a 30 MPa steam pressure at the inlet steam temperatures of 650 °C (case A) and 750 °C (case B). With the coolant temperature of 450 °C, a pressure of 7 MPa, Reynolds criteria of 3.55 × 10
4, and the specific dimension of 1.5 m, the blade’s maximal temperature was obtained in the leading and trailing edges. The metal’s maximal temperature is lower than the primary steam temperature by 23 °C and 43 °C in cases A and B, respectively. The authors note the need to improve the cooling of the leading edge of the blade.
Steam-cooling systems may be classified by the method of steam supply into the casing, rotor, or blades. It is possible to assume that the published papers mainly consider rotor and casing cooling because these are the most metal-intensive elements. Their temperature reduction allows for manufacturing from less heat-resistant steels that are cheaper, and thus significantly reduces the turbine’s capital cost. Another specific feature is the coolant source for the HPT cooling: Main steam and feed water mixture, primary steam cooling in a steam–steam heat exchanger with the steam taken from the intermediate superheater cold line, or steam extraction from the high-pressure turbine flow path.
Table 3 summarizes the main characteristics of the considered papers. The main specific features of the considered cooling systems may be specified as the following:
In most cases, the initial temperature is 600–650 °C.
Most of the papers deal primarily with the cooling of the rotor and casing.
The blade cooling investigations usually do not evaluate the influence of cooling on the turbine flow path efficiency.
Usually, there are no estimates of the power unit efficiency.
Usually, the stage design is reactive.
Cooling effect investigation does not include the application of external combustion chambers.
2. Research Object and Methods
2.1. A Hybrid Steam Turbine Power unit with a Cooled High-Temperature Turbine
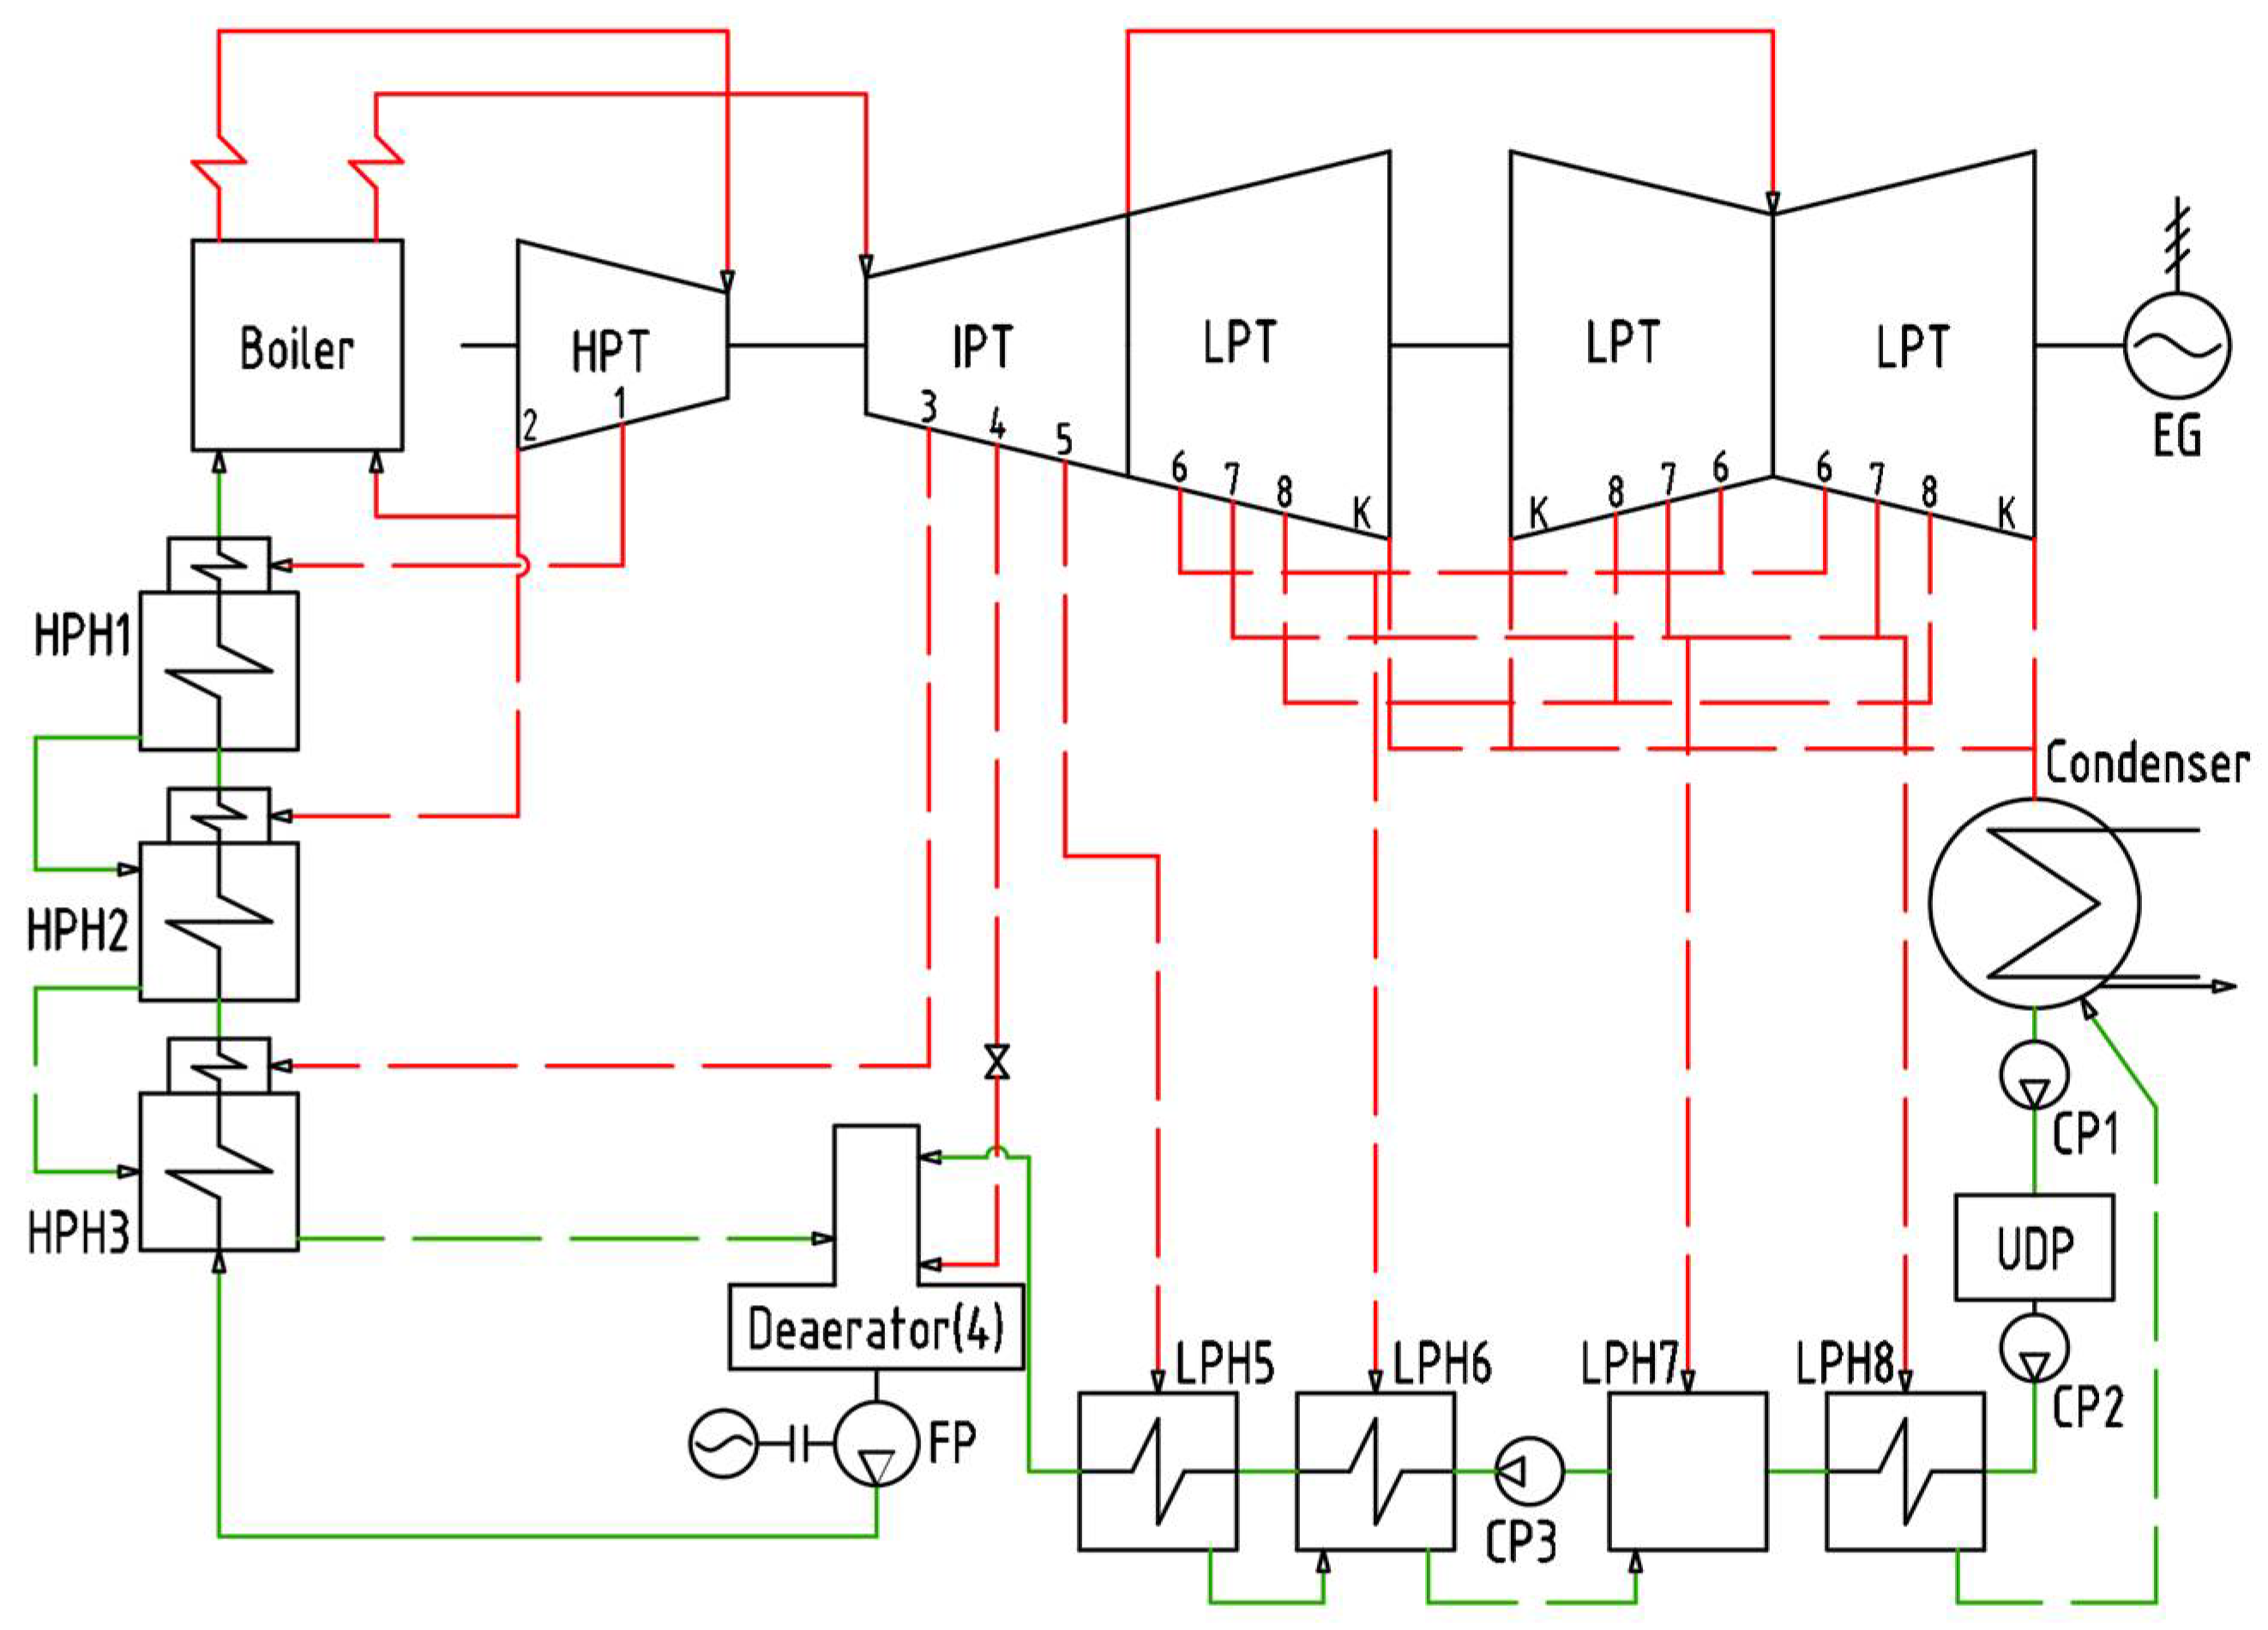
The influence of superheating by hydrogen–oxygen combustion combined with turbine cooling on the facility’s performance is evaluated in a 300 MW coal-fired power unit. The heat flow diagram of the power unit taken as the basis is shown in
Figure 1. Since the USC power unit performance is widely reviewed in the scientific literature, the interest lies in the investigation of its increase in parameters to the USC level or higher.
The boiler-exit main steam is supplied to the HPT inlet where it produces work before the first extraction. From the first extraction, some steam is supplied to HPH 1 to heat the feed water. The remaining steam expands down to the HPT exhaust pressure. After this, some steam enters HPH2, and the main flow enters the reheat cold steam pipe. Then, this steam is re-heated and enters the IPT where it expands down to the exhaust pressure and produces work. Furthermore, some of the IPT steam is taken for feed water heating in HPH3, the deaerator, and LPH5.
Then steam enters LPT where some steam is taken for condensate heating in LPH 6, LPH 7, and LPH 8. The remaining steam produces power in the turbine and enters the condenser where the heat is removed from the cycle. The first-stage condensate pump supplies the produced condensate into the unit’s demineralizing plant. Then the second-stage pump supplies the condensate to LPC 8, and the heating steam condensate is drained into the condenser. Further, the condensate is heated in the mixing LPH7 and supplied into LPH 5 and LPH 6, while their cascade drainage is supplied to the mixing LPH 7. Then the condensate enters the deaerator where it is heated to the saturation point and the feed water enters the booster pump and the feeding pump. Both pumps have electric drives. Then the high-pressure feed water is supplied to HPH 3, HPH 2, and HPH 1, which are equipped with steam coolers and cascade drainage into the deaerator.
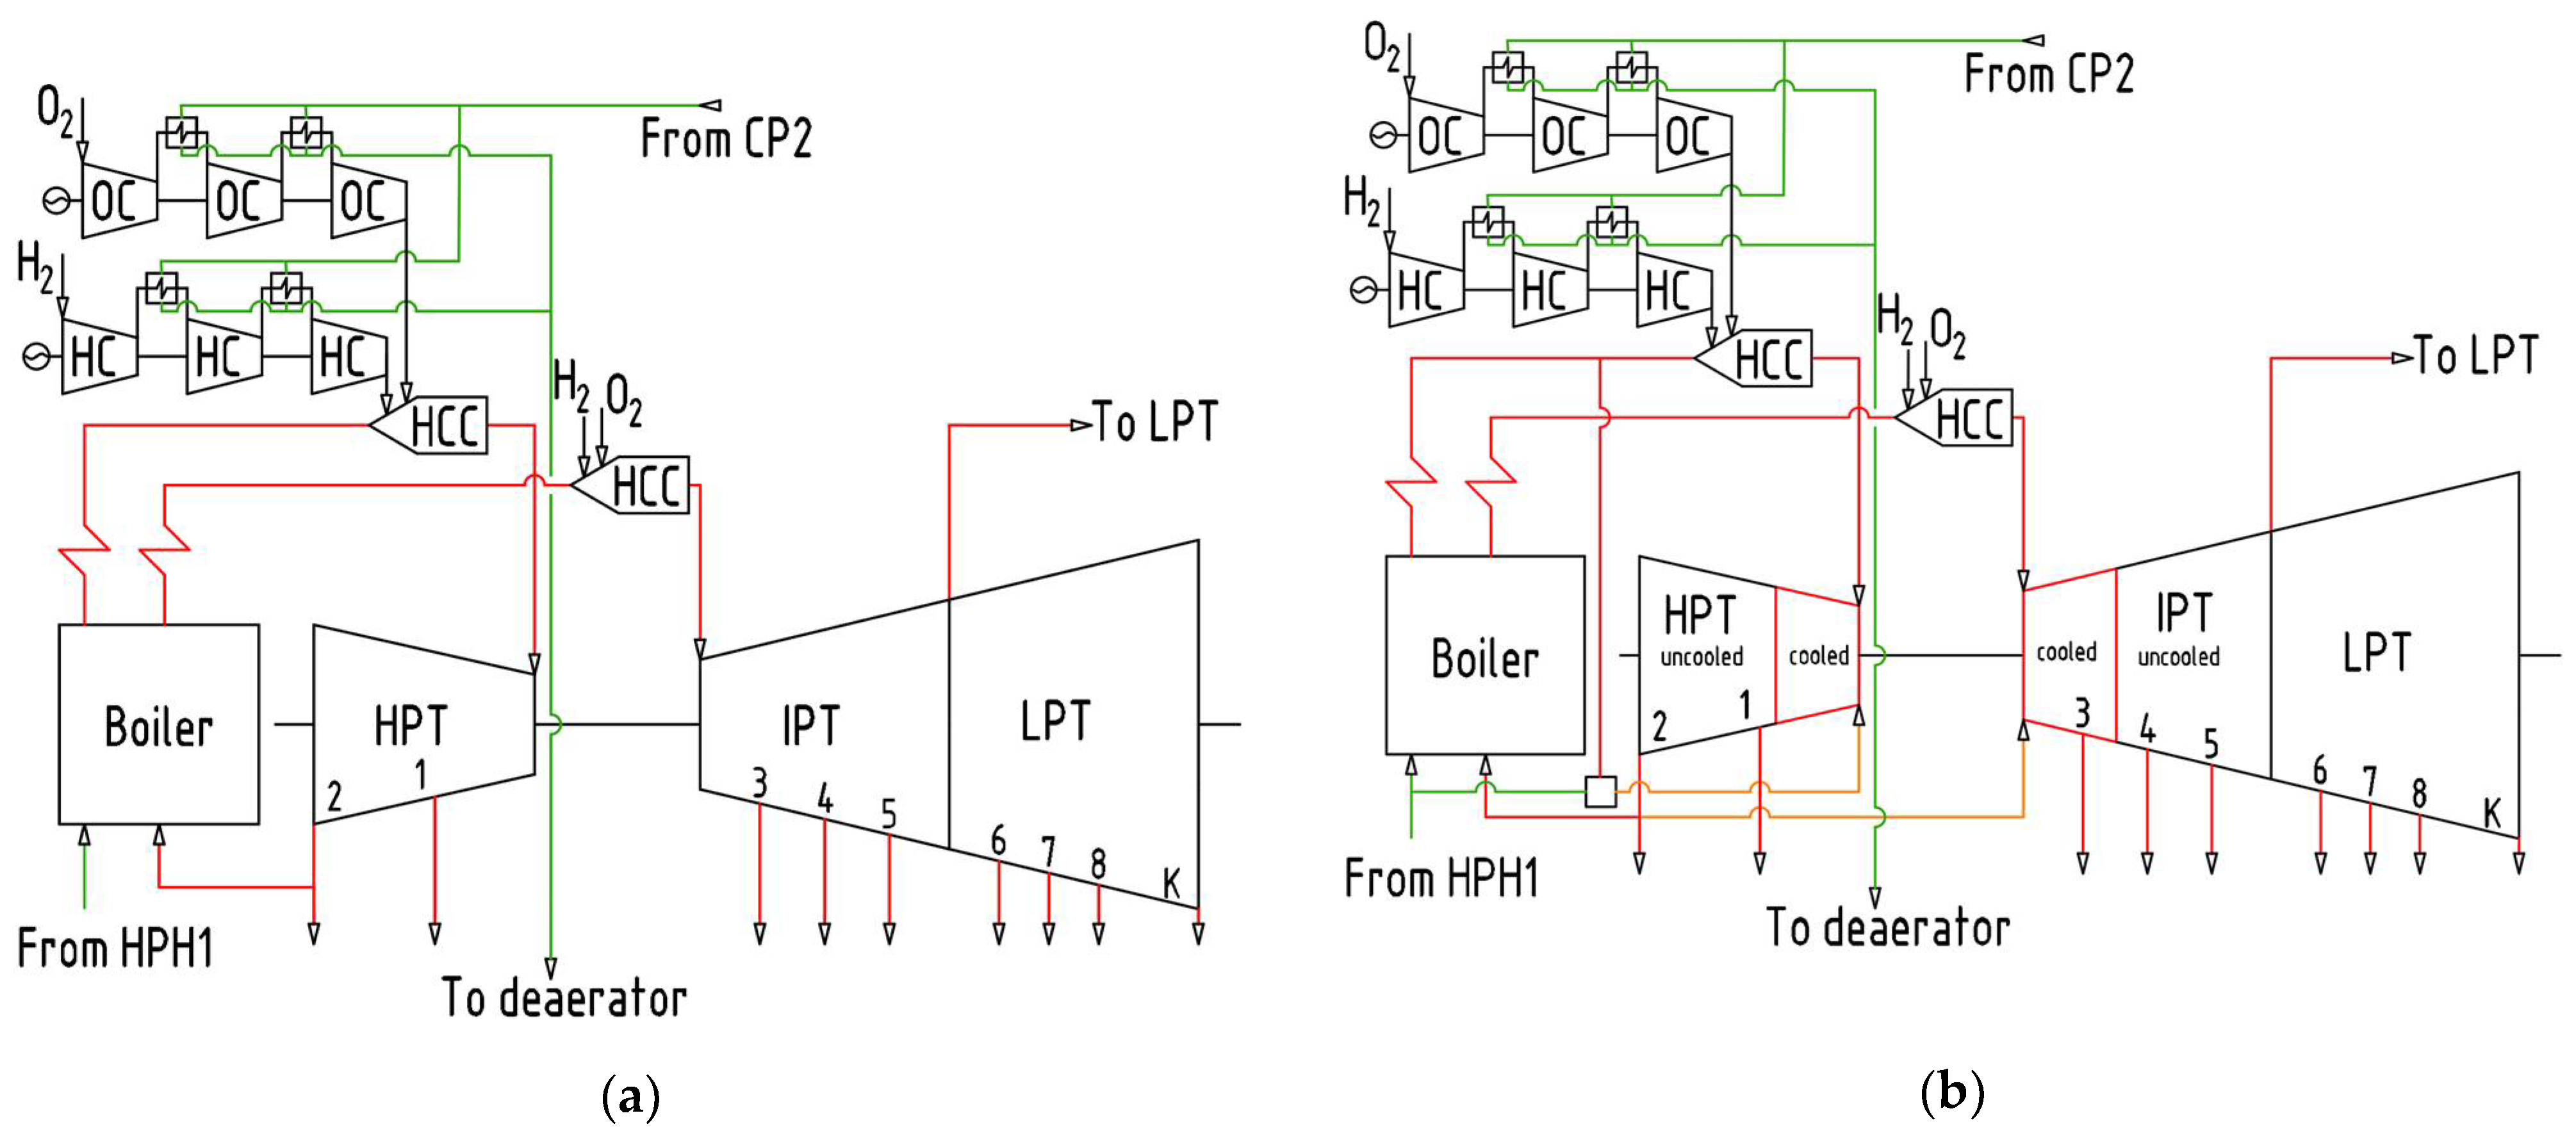
Figure 2a shows additions of external hydrogen–oxygen combustion chambers and compressors. The compressors’ intercooling heat was recovered in a low-pressure regeneration system that is similar to that described in [
6]. The difference is that there are no hydrogen and oxygen compressors for the reheat HCC supply because the 4 MPa electrolysis cell pressure is sufficient for the fuel supply without any additional compression.
Figure 2b displays a power unit heat flow diagram with a hydrogen–oxygen combustion chamber and a cooled steam turbine. The main steam enters the high-pressure turbine, expands in the cooled compartment, and mixes with the cooling steam from the turbine blades. Then the steam expands in the non-cooled compartment, and some steam is taken for feed water heating in HPH 1 and the remaining steam expands further and enters the HPT exhaust. Then, a part of the exhaust steam heats the feed water in HPH 2 and the other part enters the IPT cooling channels. The larger proportion of the steam is supplied to the boiler reheat where its temperature is increased. Downstream from the boiler, reheated steam enters the HCC where hydrogen combustion increases the steam temperature.
Then the steam enters the cooled IPT where the flow is mixed with the cooling steam. Part of the steam is taken from the expansion process for feed water heating in LPH3, and then the steam passes from the cooled compartment into the non-cooled one. Part of the steam expands in the non-cooled IPT compartment and enters the deaerator and LPH5. The rest of the heat flow diagram is similar to the base one. The difference is the condensate extraction downstream from the condenser that is sent to the hydrogen and oxygen compressors’ cooling system for the main steam HCC. The deaerator is supplied with the LPH5 exit condensate, the extracted steam, and the heated water from compressors’ coolers. Then the feed water path is similar to the base scheme. The HPT is cooled by the steam taken upstream from the HCC and the injection of the feed water after HPH 1.
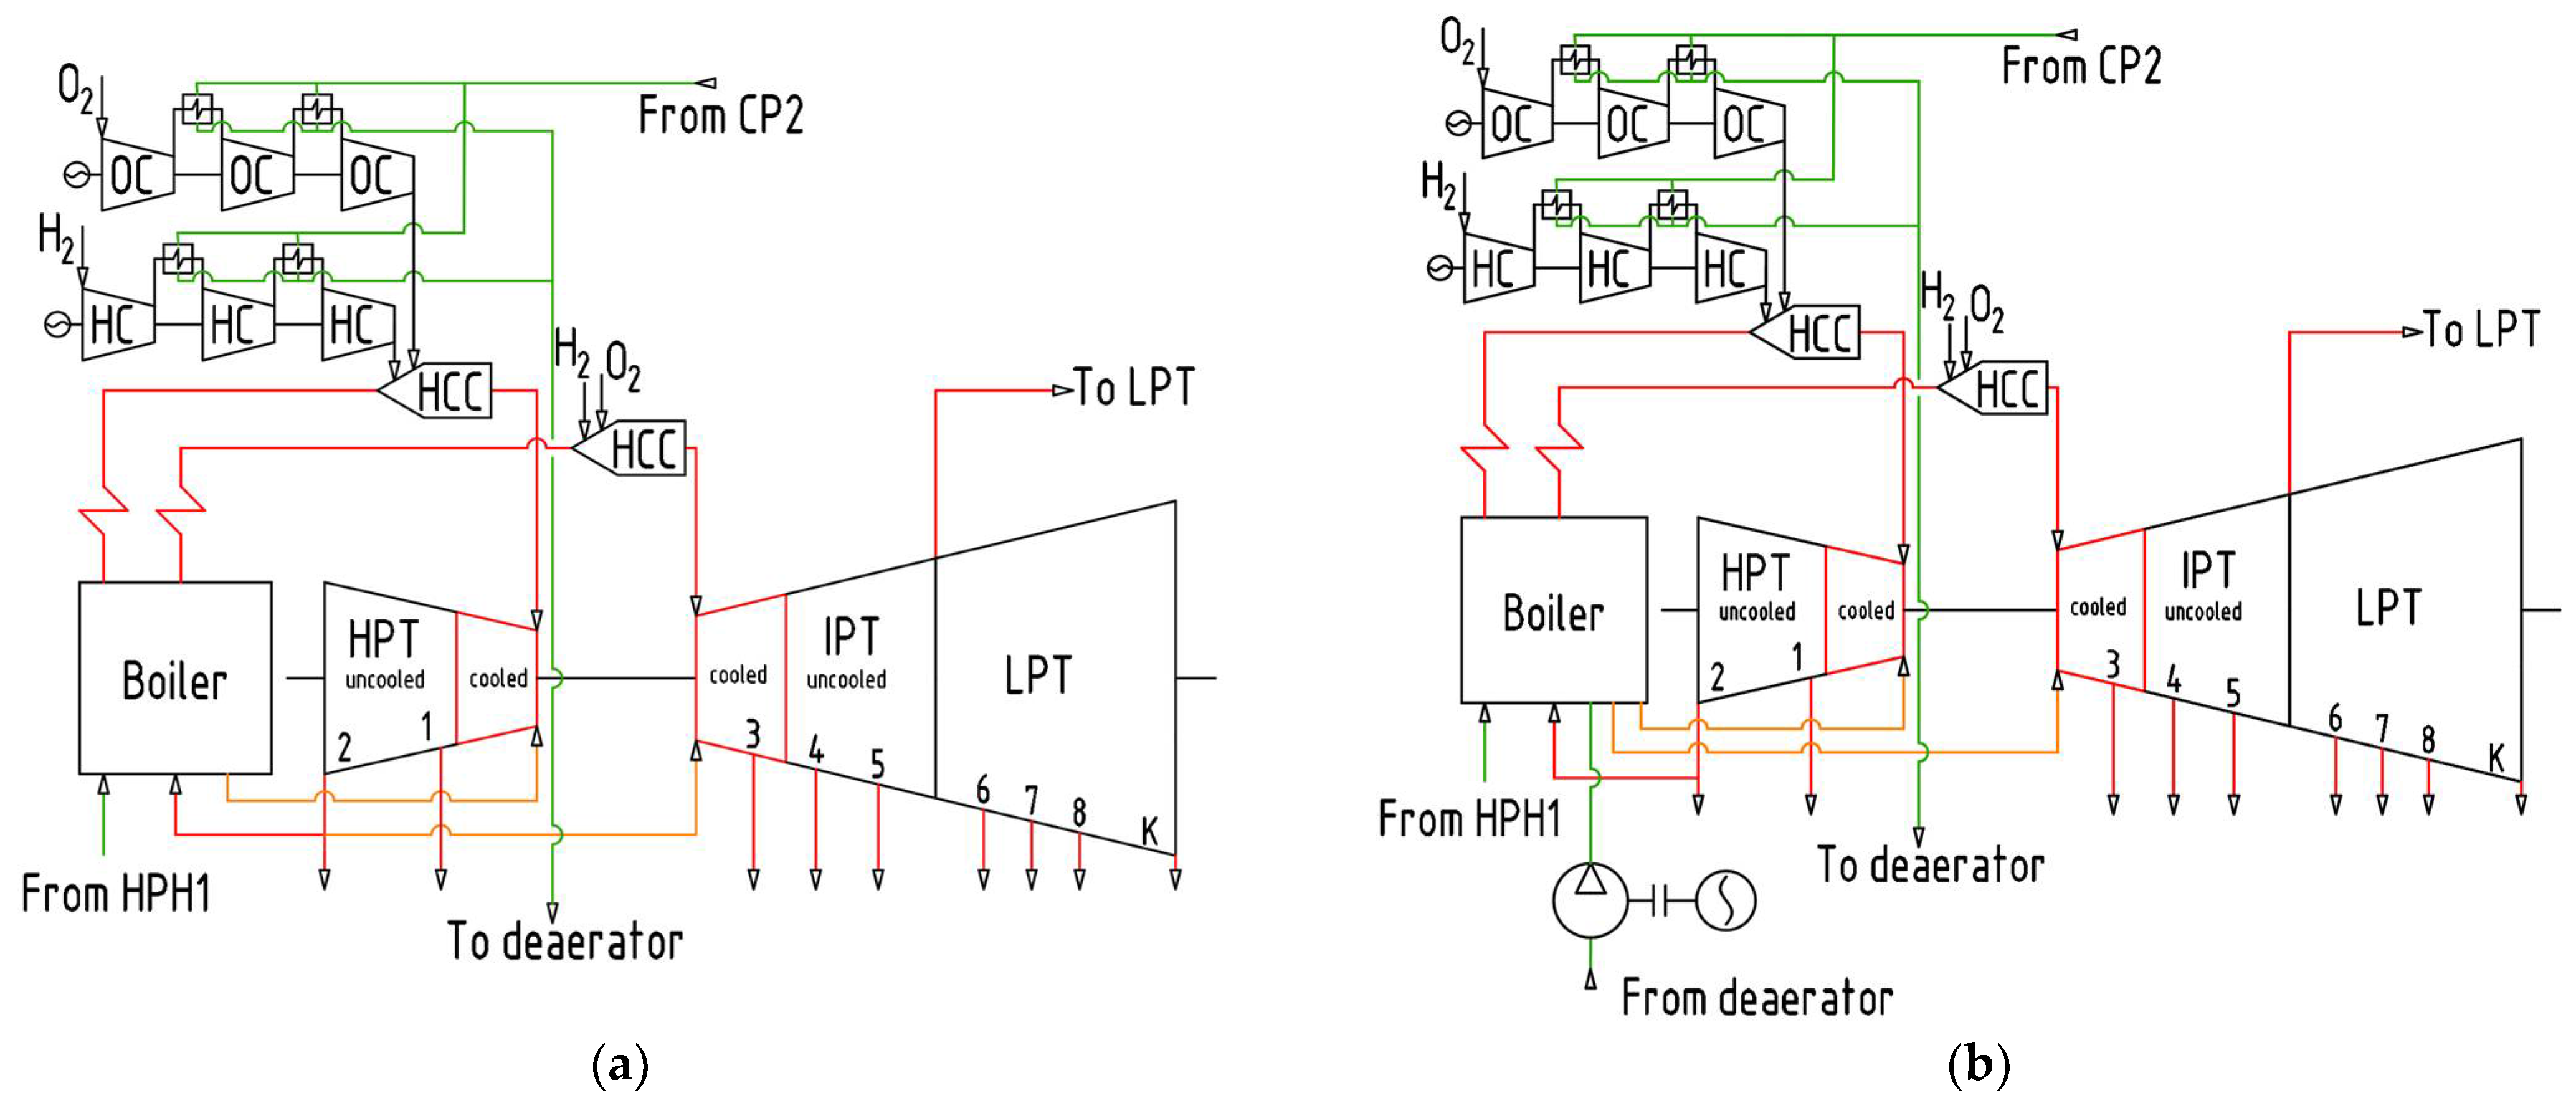
Figure 3a shows the second version of HPT cooling. Steam is taken from the boiler header pipe after the heating surface and supplied to the HPT cooling system inlet.
Figure 3b shows the third version of the coolant supply. This version assumes the feed water supply via a special steam pump into the special boiler surfaces after which this steam entered the IPT cooling system. As in the previous version, the HPT was cooled by the steam from the boiler header pipe. This scheme was used because, at a high inlet temperature, the HPT exit steam reached the metal operating temperature.
2.2. Analysis Method for the Hybrid Steam Power Unit with a Cooled High-Temperature Turbine
The computer simulation of the power unit heat flow diagram was carried out with the water and steam thermodynamic parameters obtained from WaterSteamPro [
41]. The hydrogen and oxygen compressor analysis and the HCC components’ mass flow calculations were carried out in Aspen Plus (
Figure 4) [
42], while thermodynamic parameters were obtained from the NIST REFPROP database [
43].
Figure 4 shows the simulation model scheme. The hydrogen oxidation was simulated with a stoichiometric reactor model “RStoic”. The combustion reaction is the following (1):
The HCC hydrogen and oxygen mass flow values were calculated to obtain the given exit steam temperature.
Power consumption for the hydrogen and oxygen compression was calculated with the MCompr model in Aspen Plus.
Table 4 summarizes the calculation input data.
The regeneration system steam massflow values were determined by the heat and mass balance conditions. The steam expansion in the turbine assumed internal specific flow path efficiency until the steam reached the humidity area. In the humidity area, the internal efficiency was iteratively corrected with consideration of the expansion process’ initial and final humidity. The influence of coolant injection into the turbine flow path was involved via the coolant mixing with steam in the compartment exit. The coolant mas flow was calculated by equation [
12]. The end of the cooled compartment was determined based on the metal temperature condition. The temperature after the mixing of the main and cooling steam flows is assumed to be equal to the acceptable metal temperature. The metal limit temperature is assumed to be 540 °C (except in the cases when it is different), which corresponds to the existing SC turbine.
The pressure of the coolant taken from the boiler collector is assumed to be a constant 27 MPa unless otherwise stated. When the cooling steam is produced via mixing, its pressure is 23 MPa. The condensate flow for the compressors’ cooling is determined by condensate heating. The condensate outlet temperature must be determined by the deaerator subcooling.
Table 5 shows the heat flow analysis input data.
The base coal-fired 300 MW power unit is based on the TGMP-312A boiler. The main steam parameters in the boiler header pipes are given in
Table 6. Taldinsky coal was chosen as fuel, and its parameters are described in
Table 7 [
44].
The power unit electric net efficiency was calculated with the standard method, including corrections for the internal power consumption in compressors and the HCC according to Equation (2):
where
NT is the turbine power output, MW;
eaux is the auxiliary power consumption, MW;
NFP is the feed pump power, MW;
NCP is the condensate pumps power, MW;
NHC is the hydrogen compressor power, MW;
NOC is the oxygen compressor power, MW;
Qb is the boiler facility heat power (LHV), MW; and
QHCC is the hydrogen combustion chambers heat power (LHV), MW.
3. Results and Discussion
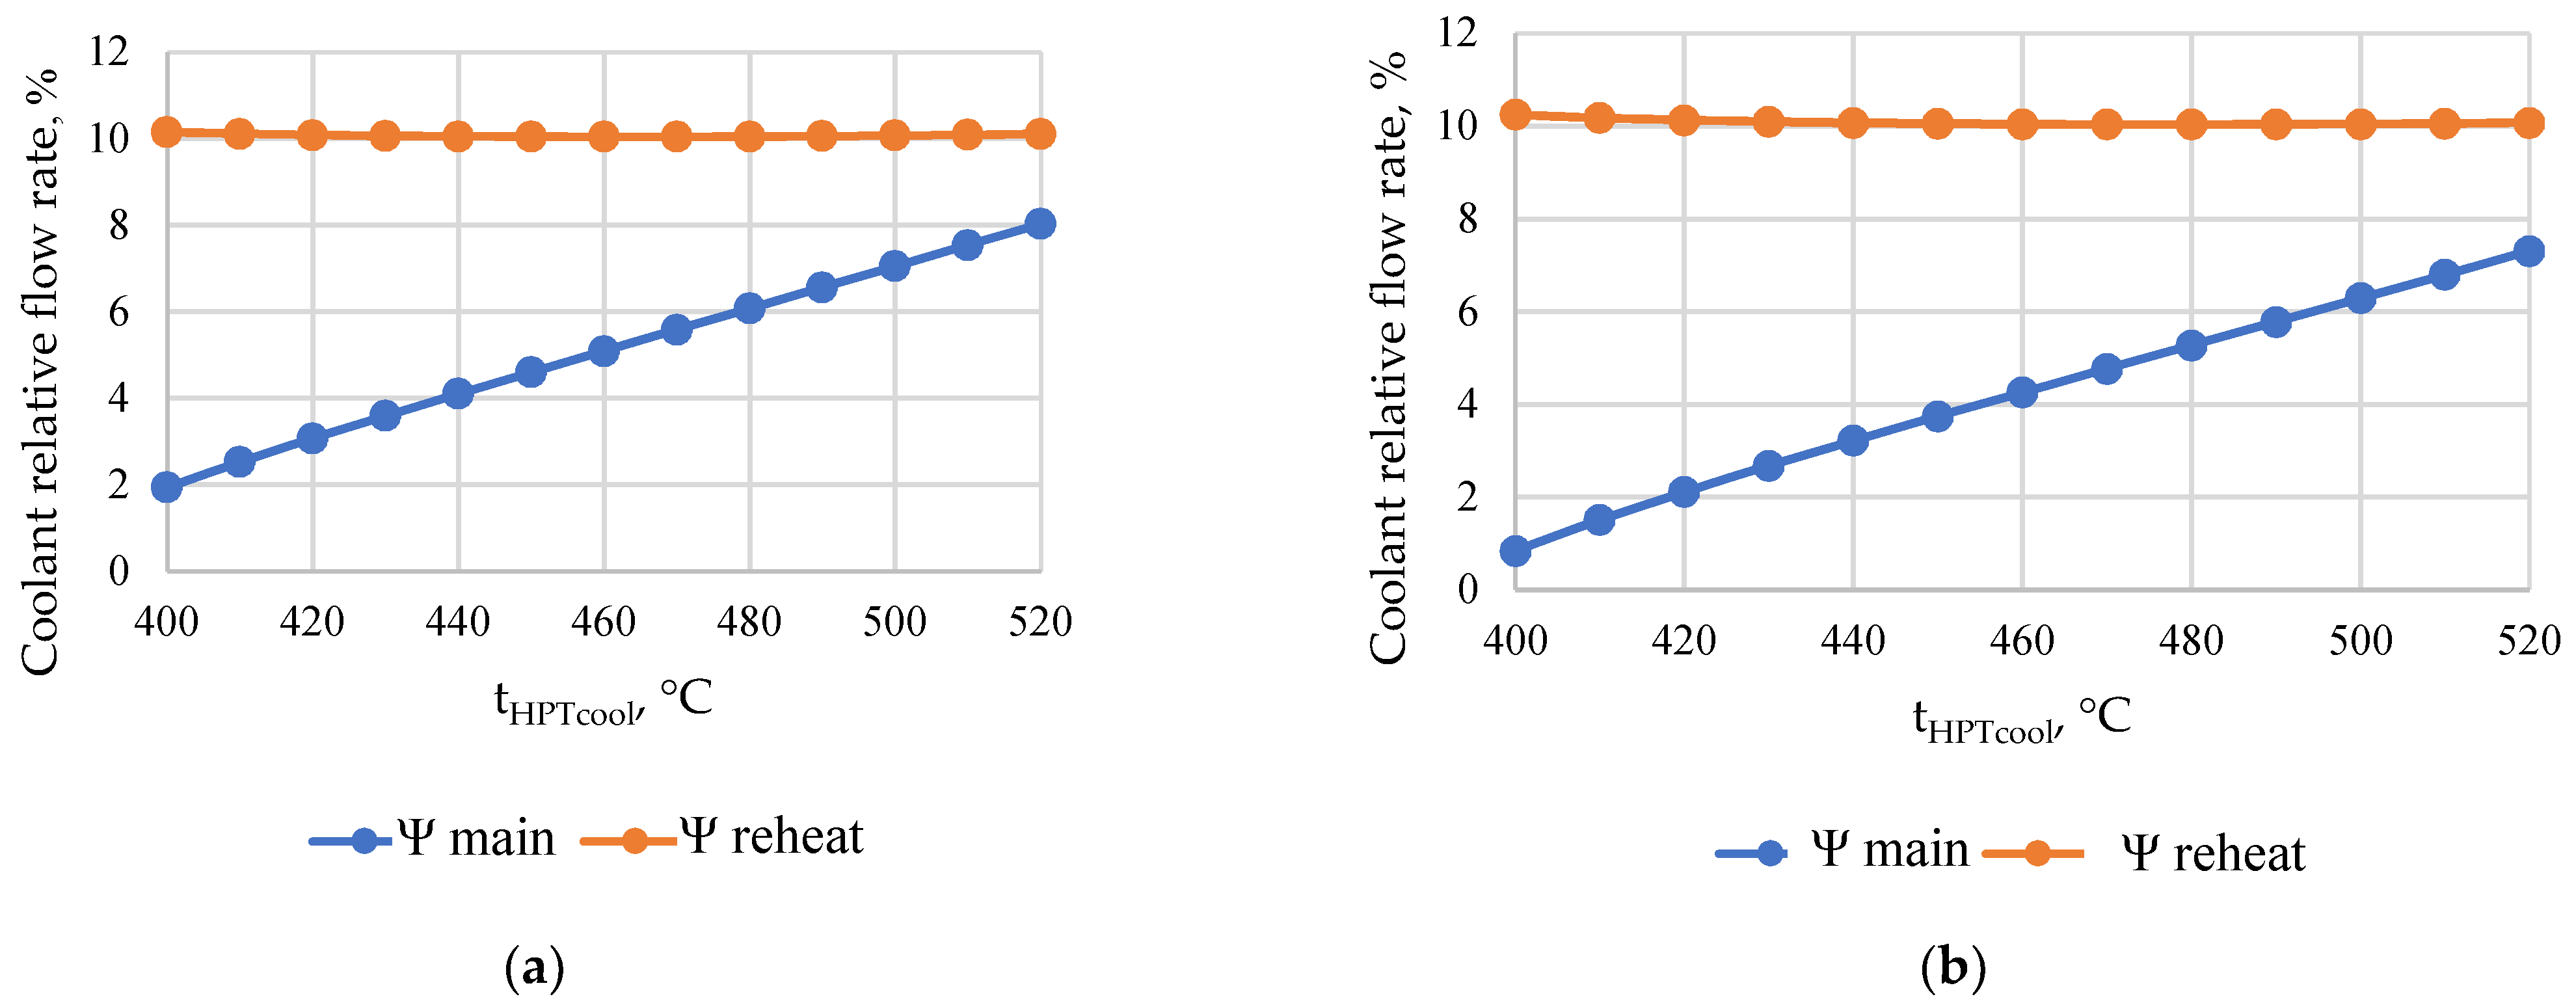
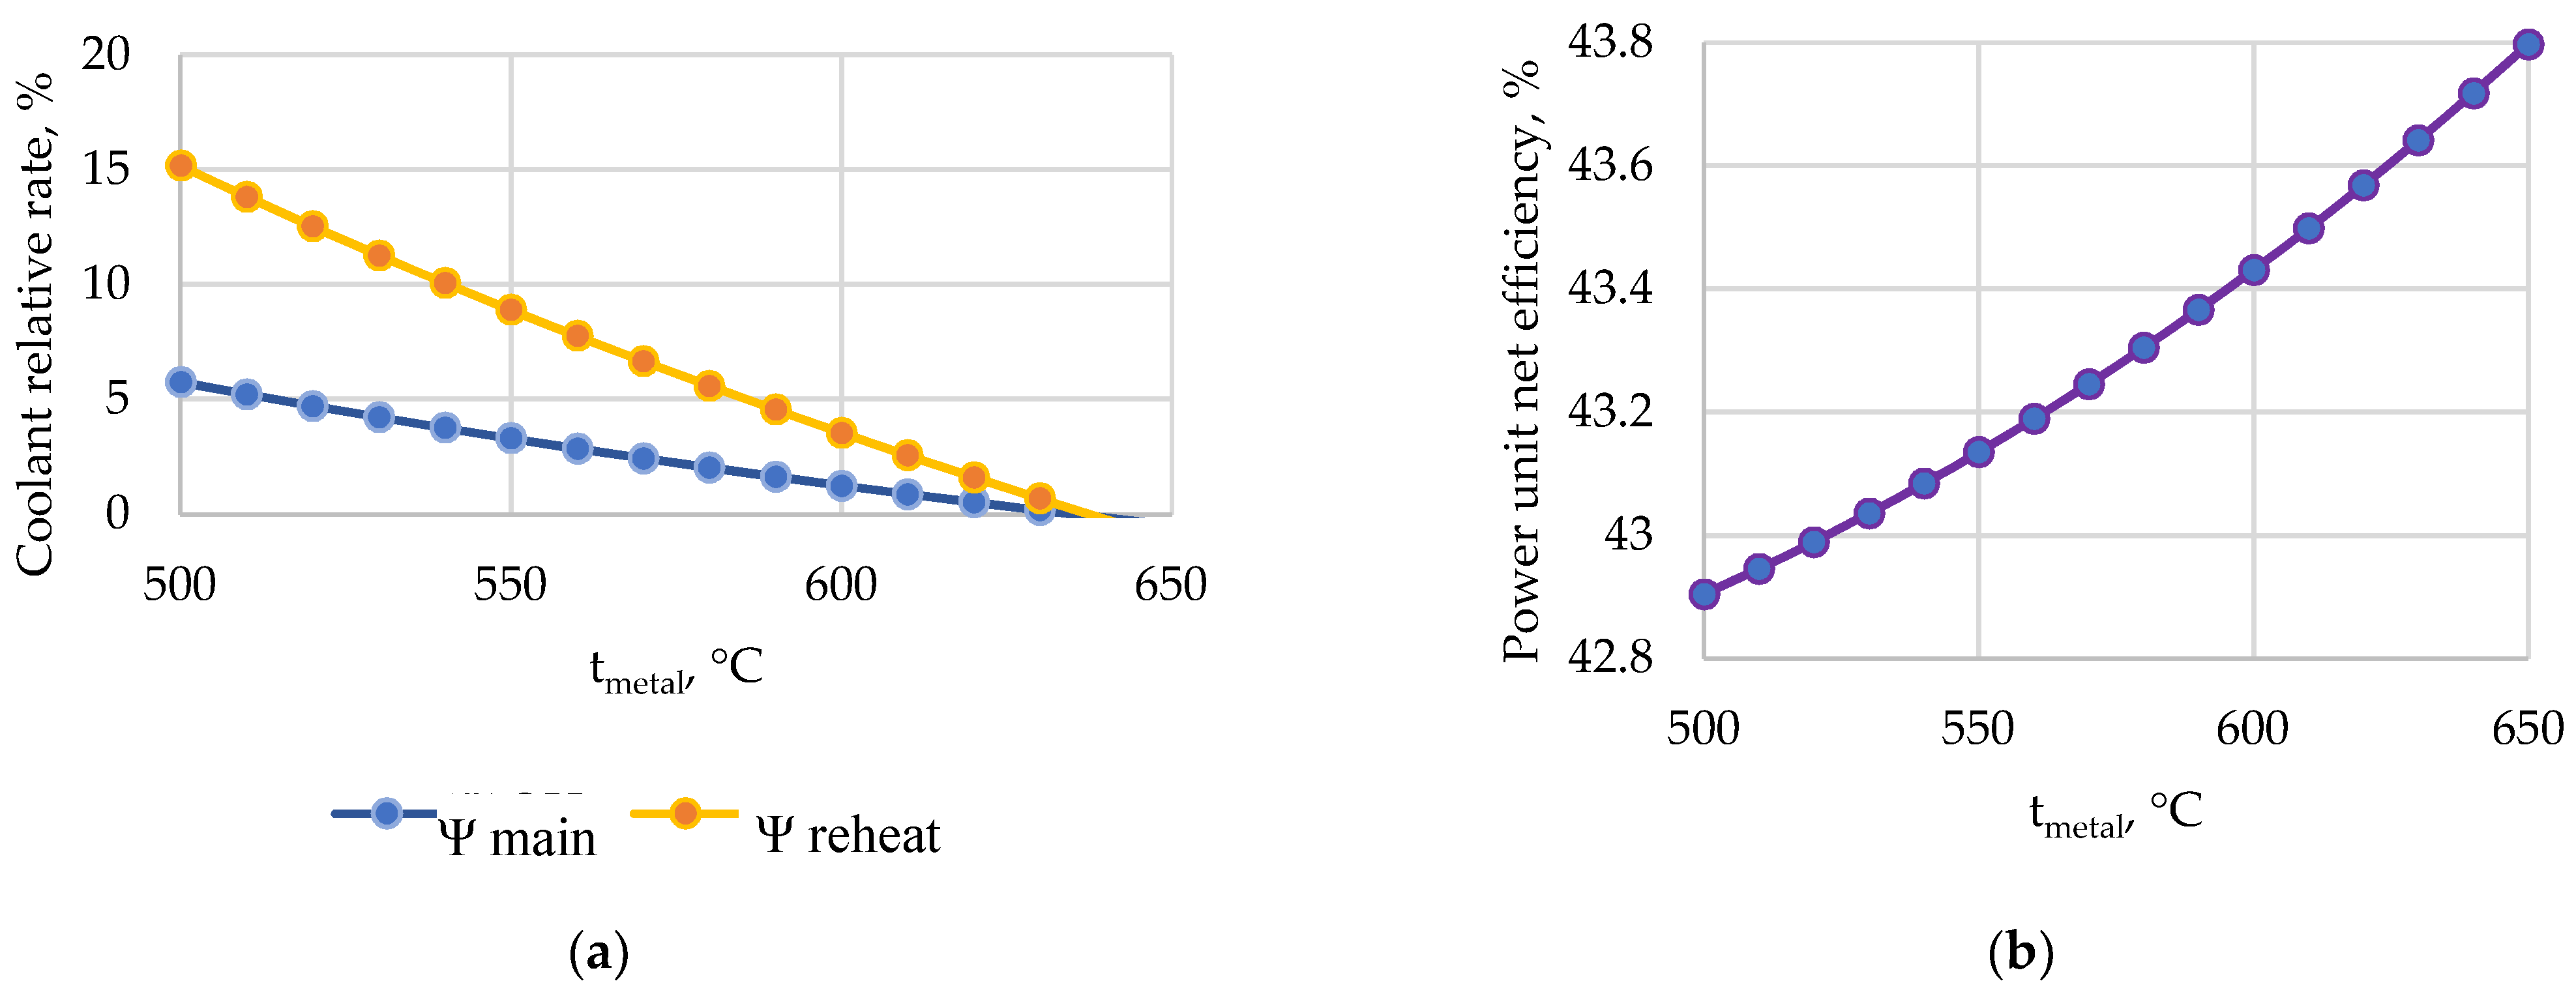
The HPT and IPT relative coolant flow values were calculated for the power unit with HCC, HPT cooled by mixed main steam with feed water, and IPT cooled with steam from the HPT exhaust (
Figure 2b) and the power unit with HCC, HPT cooled with steam from the boiler header, and IPT cooled with steam from the HPT exhaust (
Figure 3a) at the initial temperature of 720 °C (
Figure 5a,b, respectively). The relative coolant flow for the HPT and main steam (Ψ
main) is lower than in the case of IPT and reheat steam (Ψ
reheat) due to the higher pressure of HPT coolant. The difference in HPT relative coolant flows between different production methods is due to the different coolant pressures. In the cases of mixing and extraction from the boiler headers, the pressure values are assumed to be 23 MPa and 27 MPa, respectively. The IPT coolant flow depends on the HPT exhaust temperature, which, in turn, depends on the coolant flow and temperature in the high-pressure turbine.
This characteristic of the IPT cooling steam’s relative flow dependence is caused by the coolant temperature, and specifically by the temperature of the steam from the reheat «cold» line. The temperature decrease at the HPT exhaust during the increase in the coolant temperature is due to the larger flow of the low-entropy coolant. Upon further increase in the coolant temperature, its entropy becomes closer to the working fluid, and the expansion start point in the TS diagram moves to the right. These changes in the HPT exhaust temperature are minor, so the IPT coolant-specific flow stays almost constant.
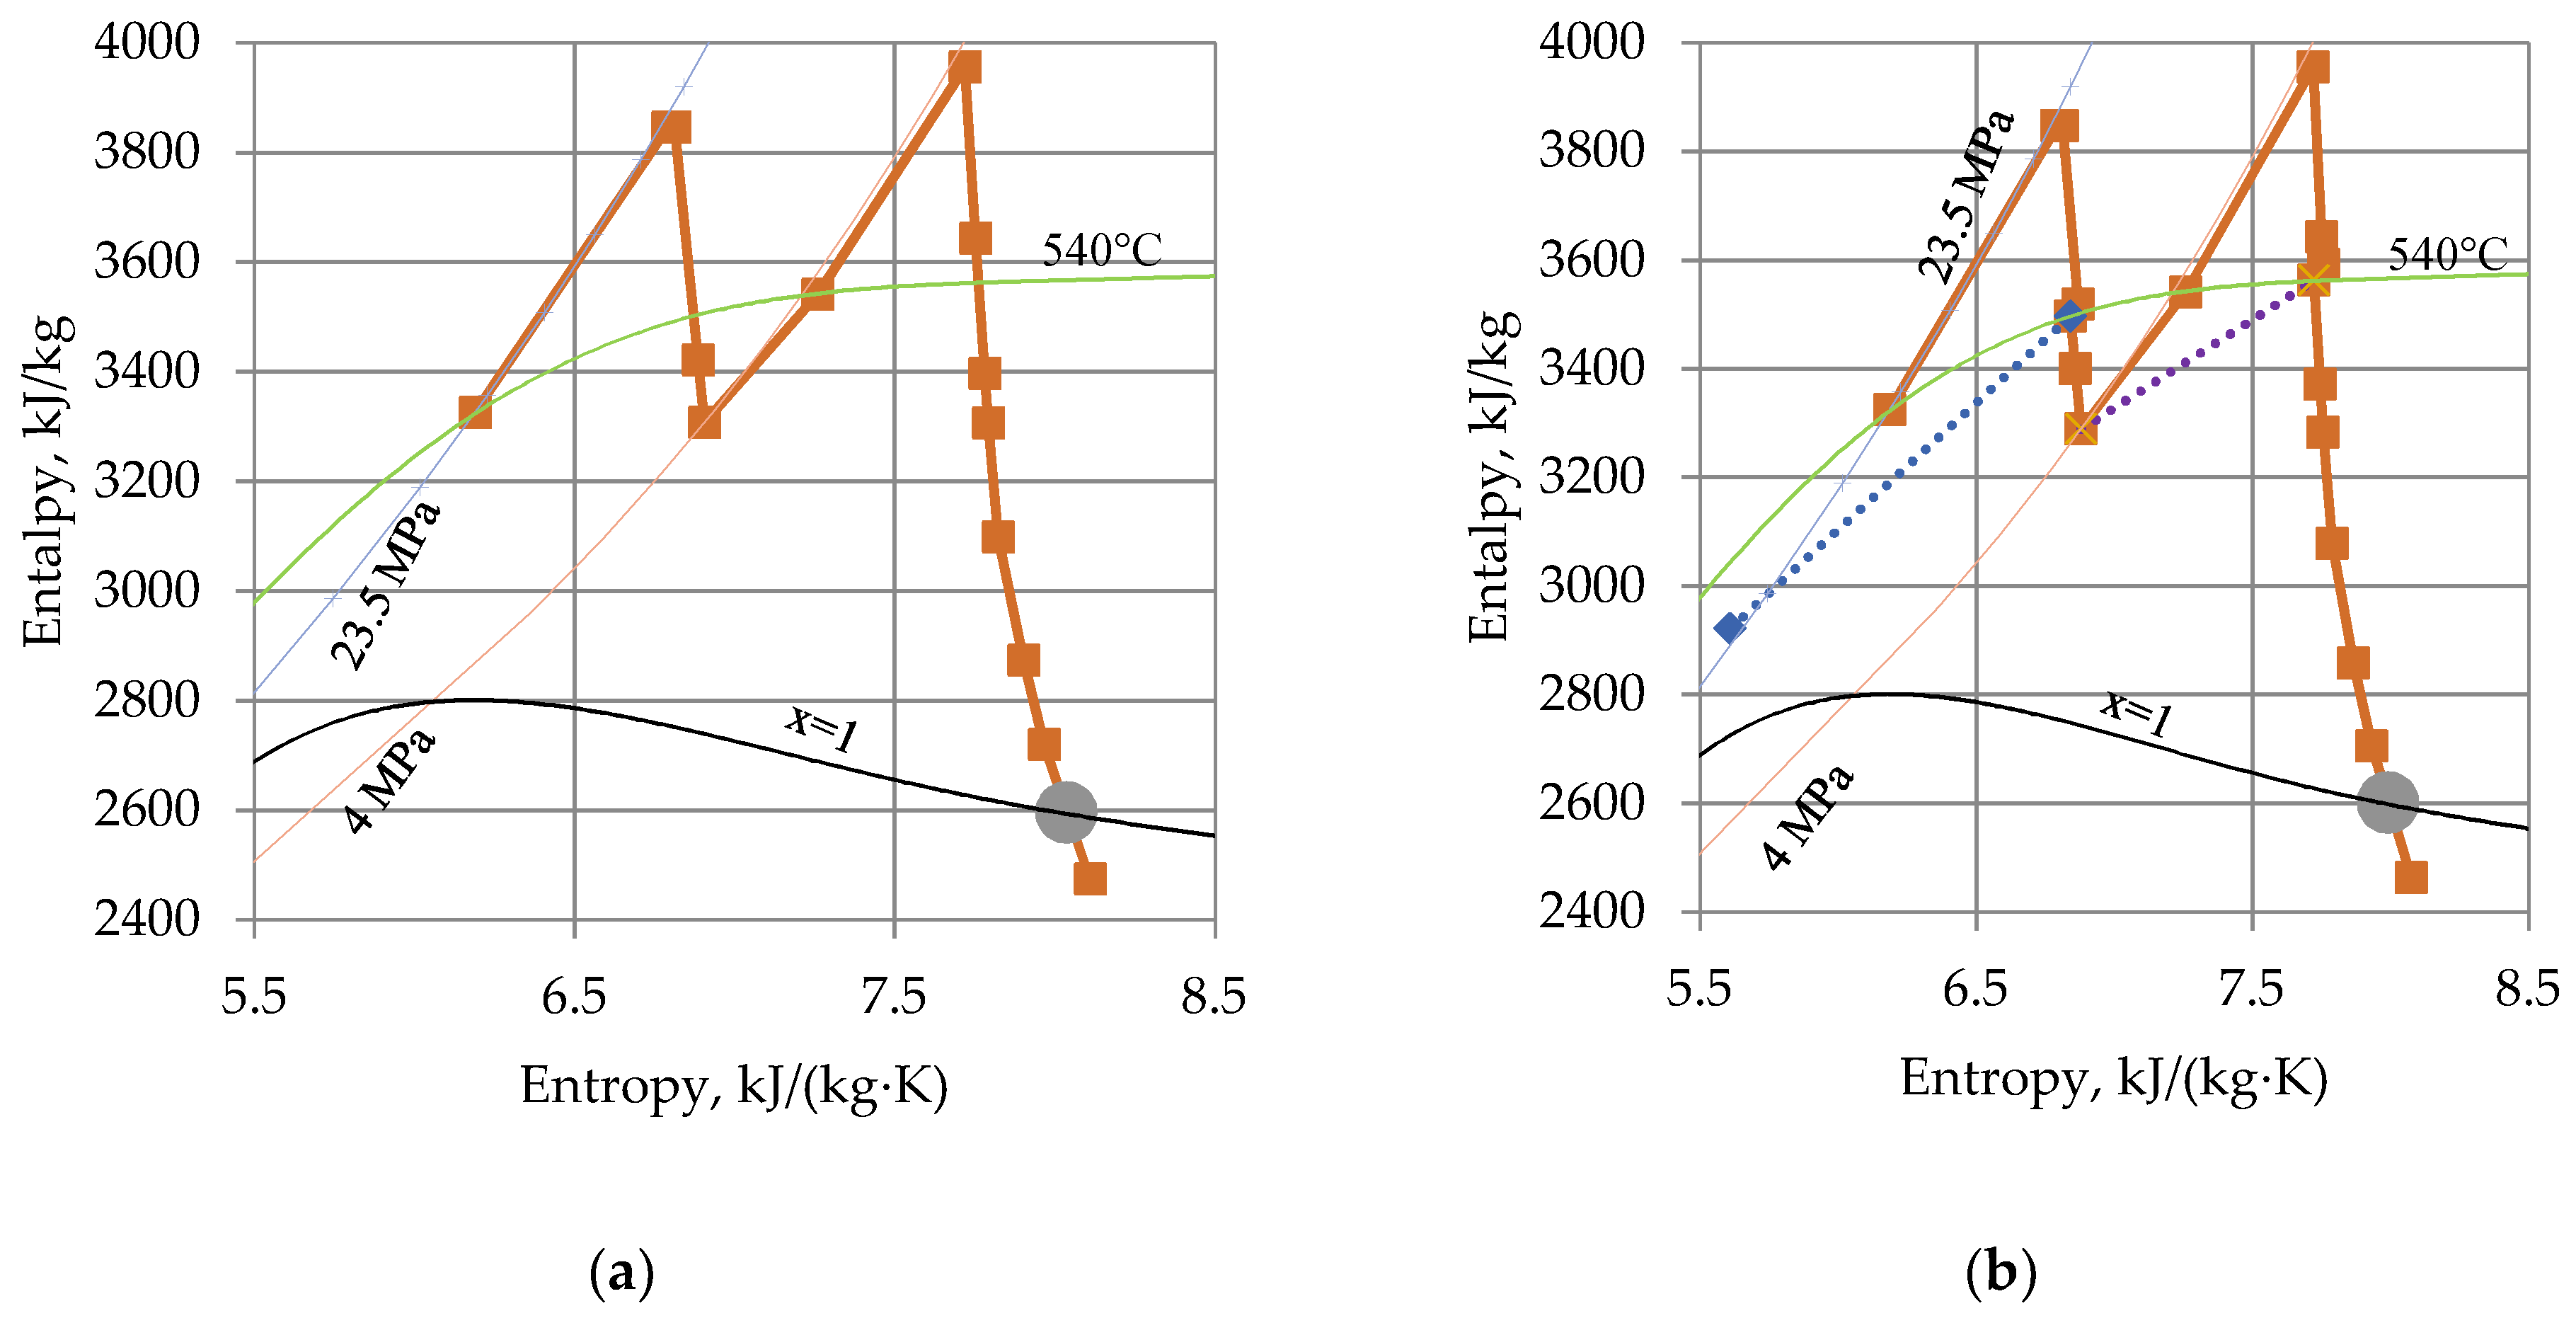
Figure 6 presents the steam heating process in HCC and expansion in the turbine without cooling and with a 450 °C coolant temperature. In this figure, the dotted lines show the coolant from the coolant source being mixed with the main steam stream in HPT and from the HPT exhaust in IPT.
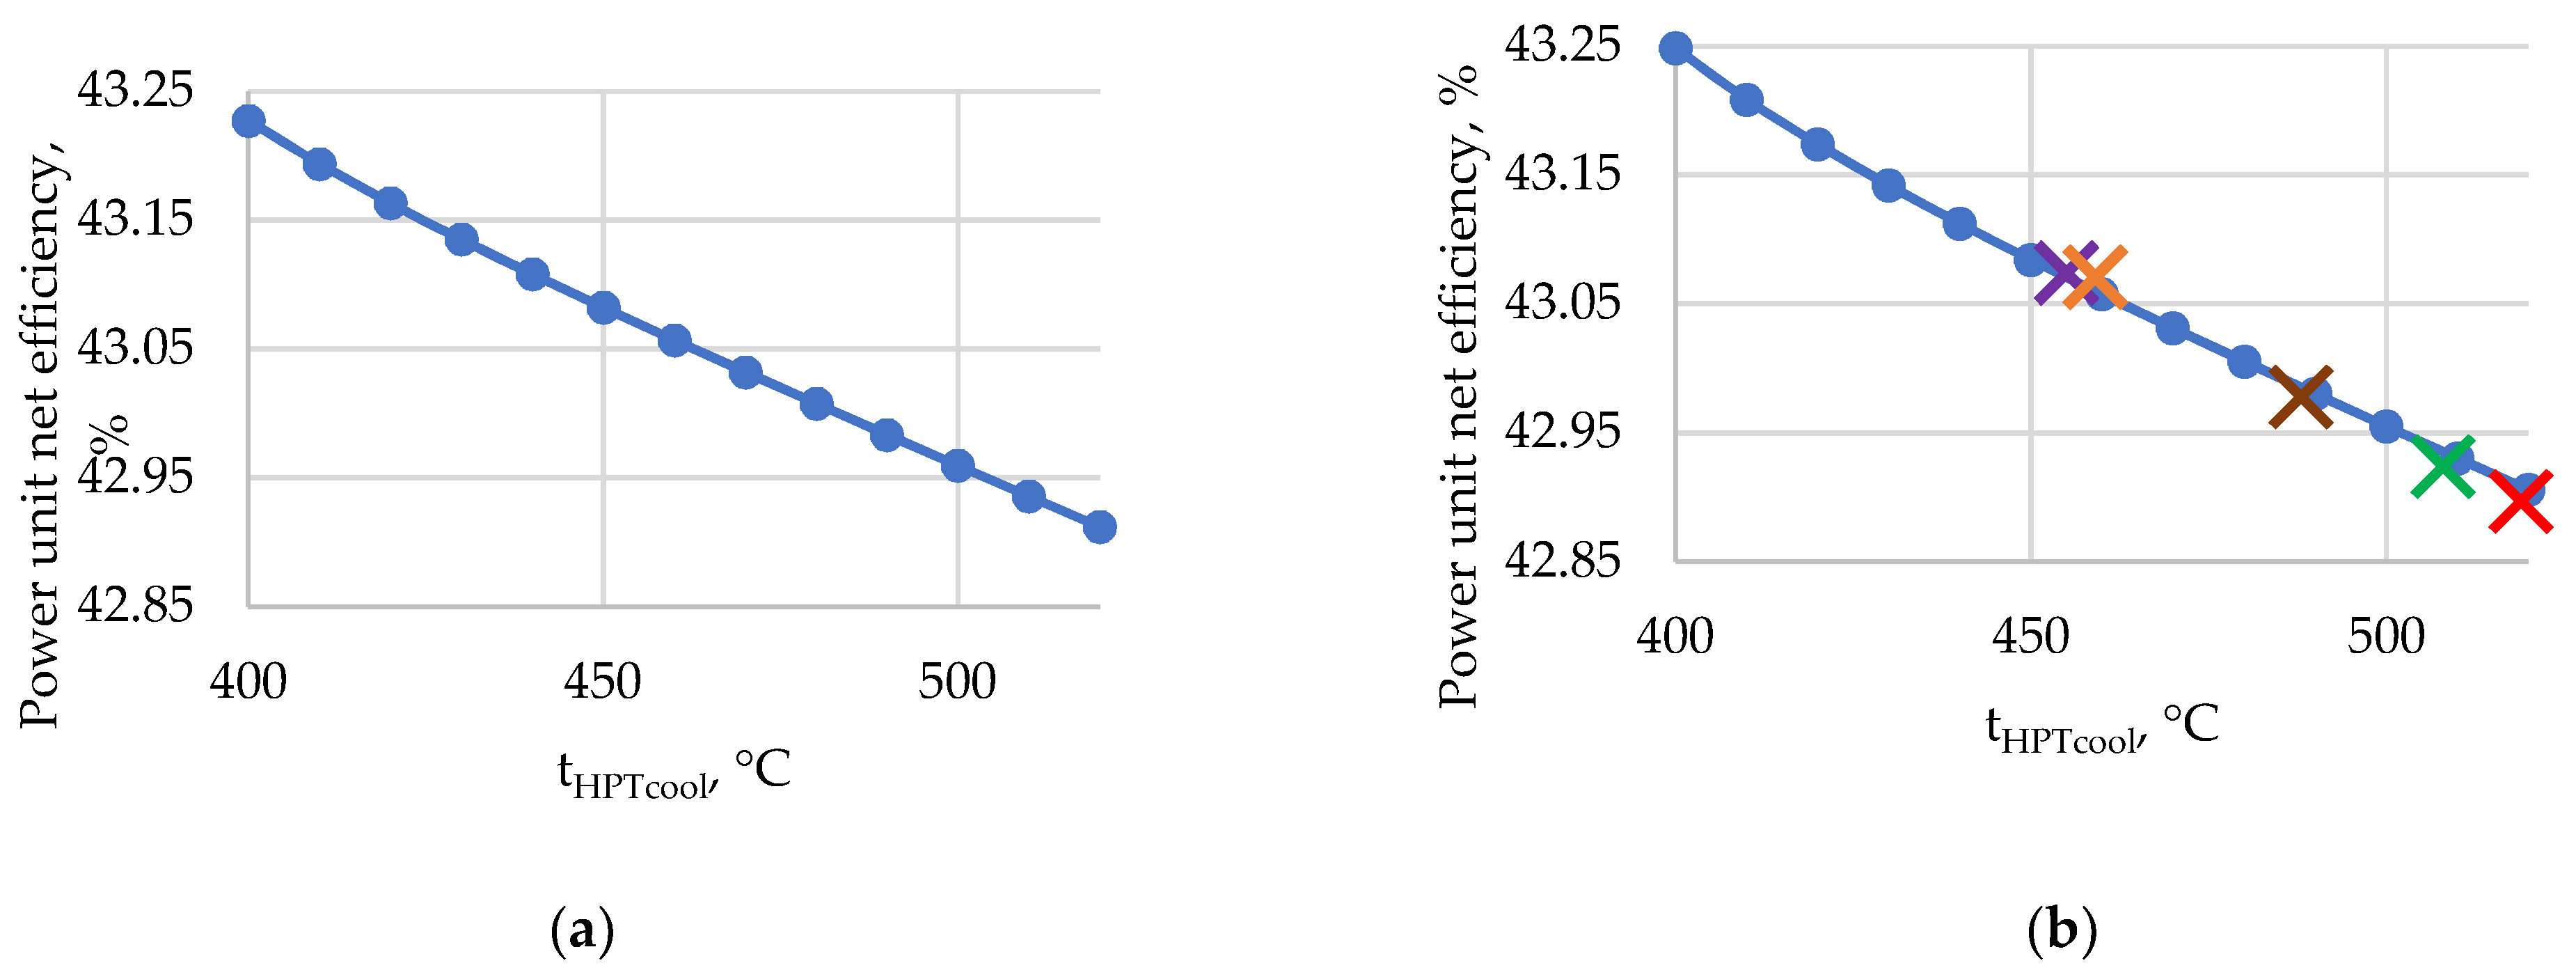
Figure 7 reveals the influence of the HPT coolant temperature on the power unit net efficiency for the different schemes of coolant production. When the coolant is produced by mixing, the net efficiency is lower because of the larger flow in the cooling system. The decrease in the coolant temperature and increase in its pressure lead to the improved heat exchange and lower amount of coolant needed, which, in turn, makes it possible to use steam more efficiently in the plant.
Figure 7b also shows the points that correspond to the unit efficiency with the cooling steam taken from the boiler TGMP-312A header pipes. The parameters of the cooling steam from the header pipes and the accurate efficiency values are given in
Table 8. Based on the exact pressure and temperature, the efficiency varies in a wide range, therefore it is beneficial to choose the header pipe with the lowest temperature and highest pressure.
Figure 8 shows the relation of the acceptable metal temperature with the HPT and IPT coolant flow and the power unit net efficiency with coolant at 450 °C and 27 MPa. The increase in the acceptable metal temperature by 60 °C reduces the HPT and IPT relative coolant flow by half. At approximately 640 °C, the relative coolant flow becomes negligibly small. The increase in the acceptable metal temperature by 50 °C leads to the increase in the power unit net efficiency by approximately 0.3%
Further analysis was carried out for the HPT coolant taken from the boiler header pipes at the furnace wall exit after the first water injection. This scheme provides a power unit electric net efficiency of 43.07% at the initial temperature of 720 °C. When the initial steam temperature increases, the HPT exhaust temperature reaches the metal’s acceptable temperature, so further analysis includes the IPT coolant production in the boiler’s special surfaces (
Figure 3b).
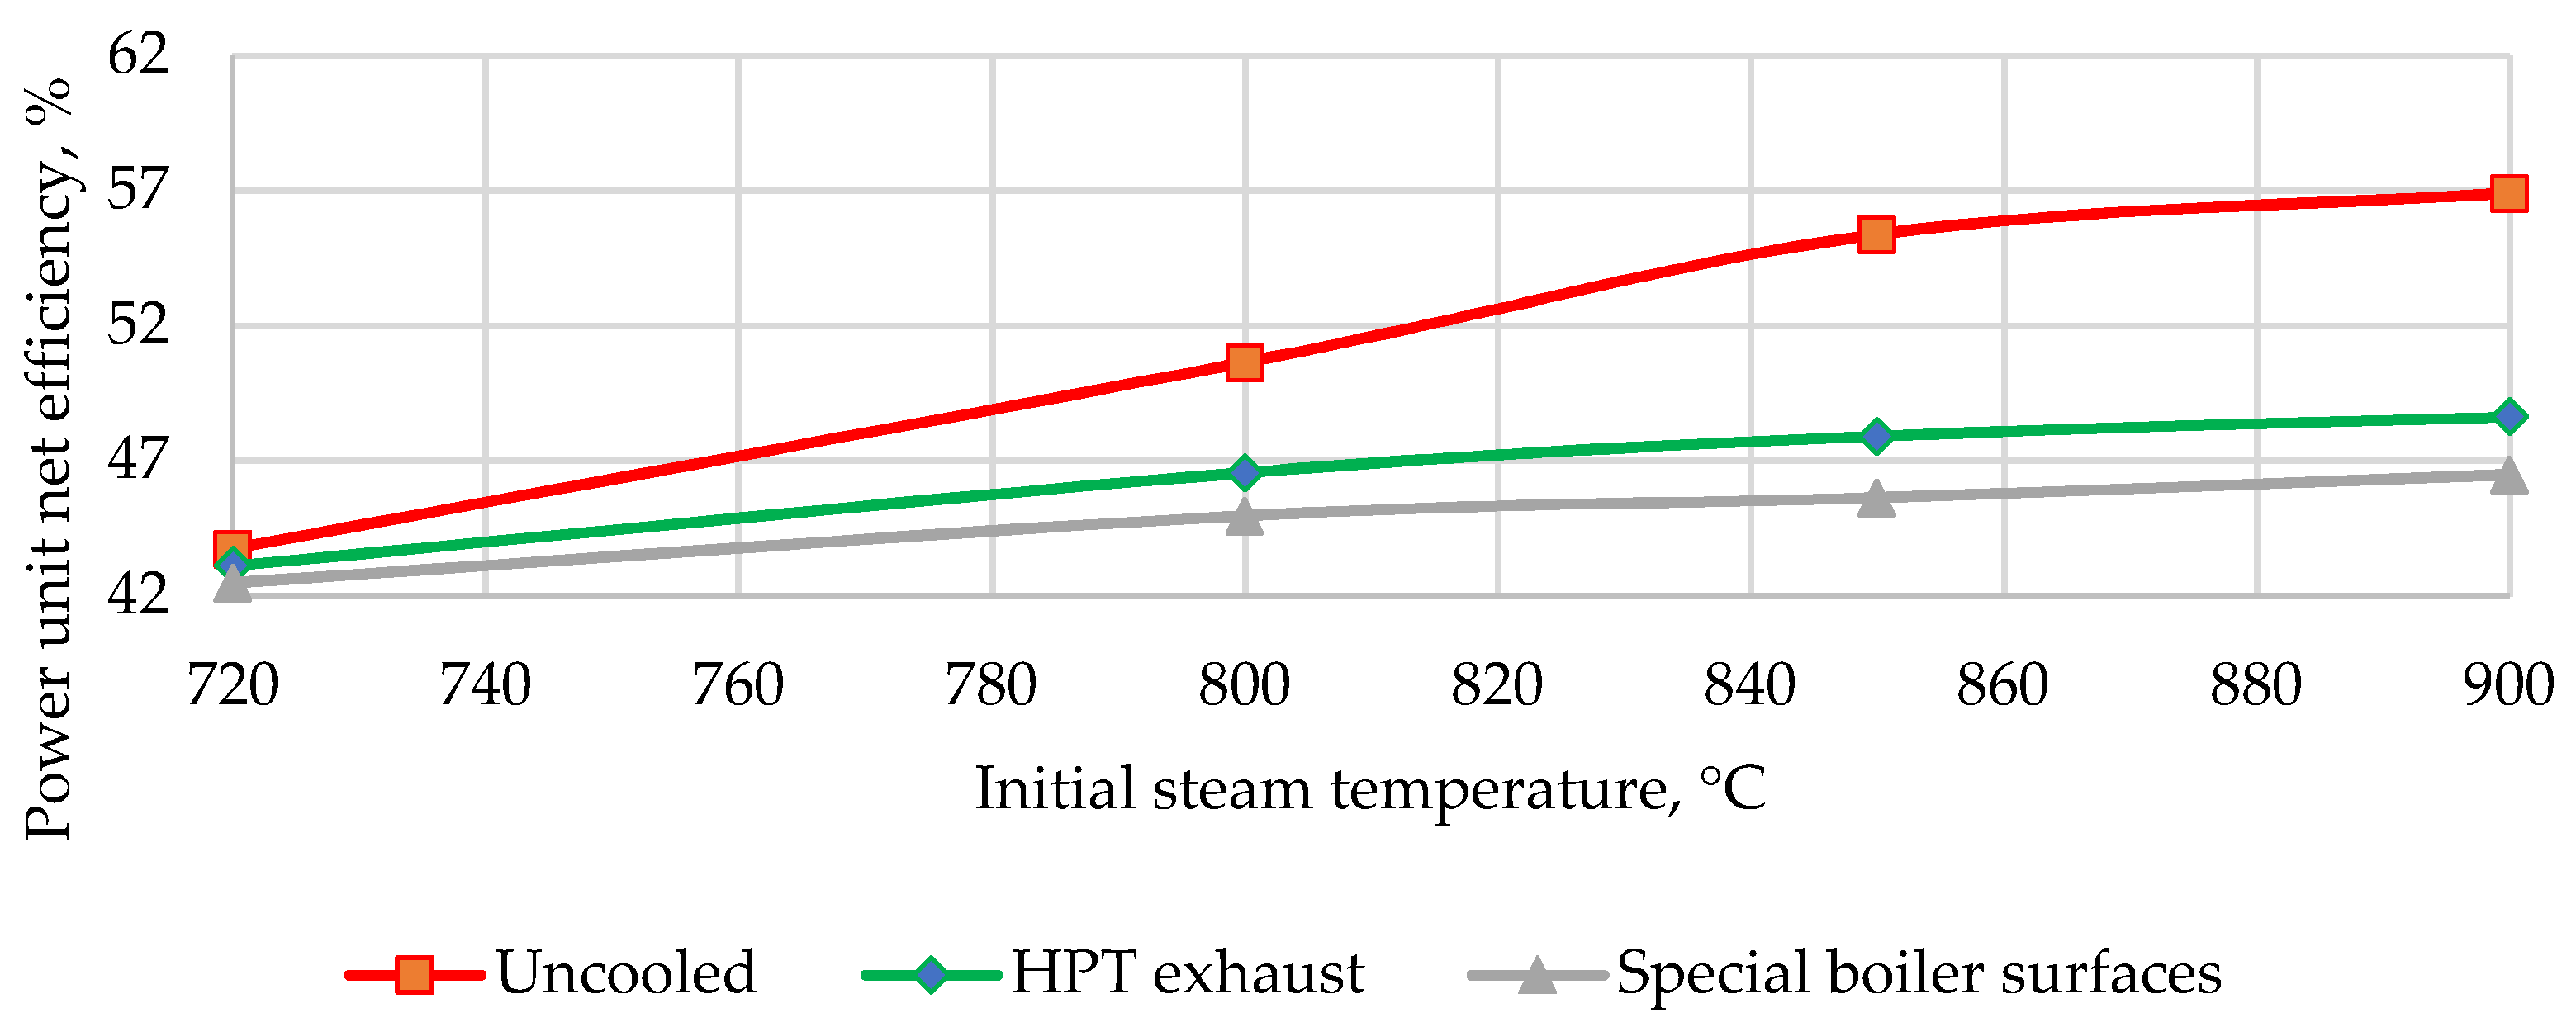
Table 9 compares the main power unit parameters for different versions of the unit configuration. Analysis results for the unit with HCC and different cooling versions are presented in
Figure 9. The most efficient is the uncooled steam turbine power unit, followed by the power unit with IPT cooled by steam from the HPT exhaust and HPT cooled by steam, generated in special boiler surfaces. Such a distribution is due to the inefficient use of heat to generate steam for cooling IPT on special surfaces with low initial parameters, compared to the use of coolant from HPT exhaust, which has expanded and has much higher initial parameters.
When the HCC superheating replaced the boiler, the power unit net efficiency was 0.24% higher. In HCC, the combustion products directly enter the cycle together with the heated fluid. The high HCC efficiency of 98–99% is determined by the under-burning degree and the heat losses through the casing. The heat produced by the gas compression before HCC is used in the cycle. When the heat is supplied in the boiler, the efficiency is 90–92%, which is lower, and the working fluid flow does not increase. Due to a significant difference in efficiencies and a small share of the compression power compared to the thermal power of the HCC, the use of hydrogen–oxygen combustion chambers in this work is more efficient than steam superheating in a boiler unit.
The efficiency loss due to the turbine cooling is 0.6–1.27%, which corresponds to the evaluation made in paper [
12] for a power unit with an initial temperature of 700–720 °C and a metal temperature of 600 °C. A further increase in the initial temperature improves the unit net efficiency, but the influence of cooling also become larger. At the initial temperatures of 800 °C, 850 °C, and 900 °C, the efficiency losses due to cooling are 4.09–5.68%, 7.47–9.73%, and 8.28–10.04%, respectively.
The initial temperature and cooling system scheme may finally be decided on the basis of a techno-economic study. The temperature increase improves efficiency and thus reduces fuel expenses. On the other hand, a higher initial temperature requires more complicated cooling systems, which increases the capital investment.
4. Conclusions
1. The use of external hydrogen–oxygen combustion chambers with a steam diluent allows for higher initial parameters and improved efficiency without a significant increase in capital investment due to the lower metal consumption for the high-temperature part of the steam flow path. The use of a cooled steam turbine allows for a reduction in the power facility’s capital investment via the use of cheaper metals in the «hot» parts of the high- and intermediate-pressure turbines but also reduces the efficiency.
2. The use of external hydrogen–oxygen combustion chambers instead of a boiler for superheating from 540 up to 720 °C increased the power unit’s net electric efficiency by 0.27%. The power production facility’s net electric efficiency with hydrogen superheating and without the cooled steam turbine at inlet temperatures of 720 °C, 800 °C, 850 °C, and 900 °C was 43.76%, 50.65%, 55.38%, and 56.91%, respectively.
3. The analyzed HPT cooling steam sources are the steam from the boiler headers and the mixture of the main steam and feed water. The IPT cooling steam may be taken from the HPT exhaust or additional heating surfaces in the boiler with a special feed pump. The most efficient method is steam extraction from the boiler header after the first injection at 455 °C and 27.3 MPa for HPT cooling and the use of the HPT exhaust for IPT cooling. In this case, with the external hydrogen–oxygen combustion chambers and the initial temperature of 720 °C, the net electric efficiency reached 43.07%. At high initial steam temperatures, the HPT exhaust temperature comes close to the metal-limiting operating temperature, which requires the use of the boiler’s special surfaces for IPT cooling.
4. At the initial temperatures of 720 °C, 800 °C, 850 °C, and 900 °C, the power unit’s net electric efficiency losses due to cooling are 1.27%, 4.09–5.68%, 7.47–9.73%, and 8.28–10.94%, respectively, and are dependent on the source and parameters of the coolant for IPT. HPT was cooled by steam from the boiler header pipe after the first injection, and the lower loss is specific to IPT cooling by the HPT exhaust while the higher loss is observed for the coolant obtained from special boiler surfaces.


